
FY19 Report for Instrumentation Development for the ...
69
The INL is a U.S. Department of Energy National Laboratory operated by Battelle Energy Alliance FY19 Report for Instrumentation Development for the Transient Testing Program C. Jensen, K. Davis, A. Fleming, A. Lambson, K. McCary, K. Tsai, M. Wilding Idaho National Laboratory September 2019
Transcript of FY19 Report for Instrumentation Development for the ...

The INL is a U.S. Department of Energy National Laboratory operated by Battelle Energy Alliance
FY19 Report for Instrumentation Development for the Transient Testing Program
C. Jensen, K. Davis, A. Fleming, A. Lambson,K. McCary, K. Tsai, M. WildingIdaho National Laboratory
September 2019
CROMKR
Cross-Out

DISCLAIMER
This information was prepared as an account of work sponsored by an
agency of the U.S. Government. Neither the U.S. Government nor any
agency thereof, nor any of their employees, makes any warranty, expressed
or implied, or assumes any legal liability or responsibility for the accuracy,
completeness, or usefulness, of any information, apparatus, product, or
process disclosed, or represents that its use would not infringe privately
owned rights. References herein to any specific commercial product,
process, or service by trade name, trade mark, manufacturer, or otherwise,
does not necessarily constitute or imply its endorsement, recommendation,
or favoring by the U.S. Government or any agency thereof. The views and
opinions of authors expressed herein do not necessarily state or reflect
those of the U.S. Government or any agency thereof.
I
FY19 Report for Instrumentation Development for the Transient Testing Program
C. Jensen, K. Davis, A. Fleming, A. Lambson,K. McCary, K. Tsai, M. Wilding
Idaho National Laboratory
September 2019Idaho National Laboratory Idaho Falls, Idaho 83415
http://www.inl.gov
Prepared for the U.S. Department of Energy
Office of NA Under DOE Idaho Operations Office
Contract DE-AC07-05ID14517

iii
FOREWORD
This report details the technical activities and accomplishment carried out
under funding from the Department of Energy (DOE) Nuclear Technology
Research and Development (NTRD) program for in-pile instrumentation
supporting the transient testing program in FY19. These activities were
performed in support of cross-cutting transient testing experiment objectives.
The purpose of this report is to provide a summary of key technical work, of
particular interest to nuclear irradiation test experimenters and in-pile
instrumentation engineers. During FY19, development activities are focused
on deployment of devices to perform online measurement of neutron flux,
temperature, and mechanical behaviors in nuclear fuels experiments.
Specifically, these R&D activities include in-pile investigations at the
Transient Reactor Test (TREAT) facility throughout the year. Other in-pile
instrumentation R&D activities are being carried out under other DOE
programs, which may be recognized but not the focus of this document. A brief
summary of activities and accomplishments is first provided for each major
activity. More detailed summaries are presented in appendices.

iv

v
CONTENTS
FOREWORD ............................................................................................................................................... iii
1. Technical Summary of FY19 Activities ............................................................................................. 1
1.1 Temperature ............................................................................................................................. 2 1.1.1 Infrared Pyrometry ...................................................................................................... 2 1.1.2 Optical Fiber for Distributed Temperature Sensing .................................................... 3
1.2 Mechanical Behavior ............................................................................................................... 4 1.2.1 Optical Fiber Displacement Sensor ............................................................................. 4 1.2.2 Linear Variable Differential Transducer ..................................................................... 5
1.3 Neutron Flux/Energy Deposition ............................................................................................. 6 1.3.1 Self-Powered Neutron Detector .................................................................................. 6
Appendix A – Infrared Pyrometry Development for TREAT Experiments ................................................ A
Appendix B – Distributed Temperature Sensing Optical Fiber Testing in TREAT .....................................B
Appendix C – Development of a Fiber-based Displacement Sensor for TREAT Experiments ...................C
Appendix D – Linear Variable Differential Transducer (LVDT) ................................................................ D
Appendix E – Deployment and Evaluations of Fast-Response Self-Powered Neutron Detectors
for TREAT Experiments .................................................................................................................... E

vi

1
FY19 Report for Instrumentation Development for the Transient Testing Program
1. Technical Summary of FY19 Activities
The recent restart of the Transient Reactor Test (TREAT) facility at Idaho National Laboratory (INL)
represents the beginning of a new generation of transient irradiation testing of nuclear fuels and materials
supporting a variety of Department of Energy (DOE) Office of Nuclear Energy (NE) and nuclear energy
industry programs and needs. A successful transient testing program hinges on a well-coordinated and
innovative instrumentation development and qualification program to support future objectivesa. With this
goal, the fuel safety research program is actively pursuing the Research, Development, and Demonstration
(RD&D) of several cross-cutting, advanced instrument technologies to meet near-term experiment
programmatic goals while establishing the base measurement capabilities (state-of-the-art) for next-
generation experimentation.
This report document the technical outcomes of ongoing RD&D programs for multiple key
instrumentation technologies supporting near-term experimental objectives. The activities fall into three
categories: temperature, mechanical behaviors, and flux and energy deposition. Building on success from
last year, notable activities have focused on in-pile deployment of several advanced instrumentation
capabilities that are important to near-term experimental goals. Previous instrumentation reports are found
in b,c.
FY19 instrumentation R&D areas included:
Infrared pyrometer development,
Distributed temperature sensing optical fiber,
Cladding thermocouple attachment methods (not discussed in this report in detail),
Fiber optic sensor for linear displacement,
Linear voltage differential transducer,
Self-powered neutron detector.
Two major supporting activities for all of the previous R&D areas include:
In-pile deployment activities including fabrication and documentation supporting insertion of
several instruments into the TREAT facility reactor core,
Data acquisition support for instrumentation and experiments.
Brief summaries of FY19 accomplishments follow for each primary activity area. Detailed reports for
each activity are provided in the appendices.
a Jensen, C., “Strategic Plan for Instrumentation Development and Qualification for the Transient Testing Program,” INL/LTD-
17-43144 Rev. 2, August 2019.
b Jensen, C., et al., “FY18 Report for Instrumentation Development for the Transient Testing Program,” INL/EXT-18-515613,
September 2018.
c Jensen, C., et al., “FY17 Report for Instrumentation Development for the Transient Testing Program,” INL/EXT-18-43444,
September 2017.

2
1.1 Temperature
1.1.1 Infrared Pyrometry
Infrared (IR) pyrometry offers non-contact, high-temperature, and fast time response capability for
temperature measurement on cladding surfaces, representing a leap beyond current state-of-the-art
approaches using thermocouples to reduce measurement uncertainties. The non-contact nature of pyrometer
eliminates many of the difficulties associates with standard thermocouples such as: obtaining good thermal
contact between the sensor and sample, fin-effects of the thermocouples impacting sample temperature
measurement, and the limited time response of a thermocouples due to the time for them to respond
thermally. These advantages combined with its fast time response and high temperature measurement
capability (able to measure UO2 melt temperatures ~3100 K) makes it appealing for temperature
measurements in TREAT experiments. Highlights for associated FY19 activities are given below with a
detailed report provided in Appendix A.

3
1.1.2 Optical Fiber for Distributed Temperature Sensing
Optical-fiber Distributed Temperature Sensing (DTS) can perform high resolution temperature
measurements of the fiber optic length. DTS operates on the principle of injecting light into an optical fiber
and measuring the backscattered light (Rayleigh scatter) off of the local density fluctuations along the length
of the fiber. Time of flight measurements can be made for the backscattered signal and used to create a
defect profile of the fiber. As the temperature increases the optical fiber expands and the time of flight
measurements for the backscatter profile changes. This change can then be correlated to a change in
temperature. DTS technology has been incorporated into upcoming TREAT experiments to monitor the
temperature history of many locations simultaneously. Highlights for associated FY19 activities are given
below with a detailed report provided in Appendix B.

4
1.2 Mechanical Behavior
1.2.1 Optical Fiber Displacement Sensor
Displacement measurements are commonly used to transduce a variety of important fuel performance
phenomena during in-pile experiments. Linear displacement sensors have been commonly used for fuel-
stack/cladding elongation and creep measurements for decades. Linear Variable Differential Transformers
(LVDTs) are the standard sensor for in-pile displacement measurements and have been shown to perform
well under a variety of in-pile conditions. However, a fiber-optic based Fabry-Perot displacement sensor
has the potential to provide a smaller footprint, less leads, multiple parameter sensing capability, and good
in-pile performance. Highlights for associated FY19 activities are given below with a detailed report
provided in Appendix C.

5
1.2.2 Linear Variable Differential Transducer
Deformation and displacement are vital in-pile measurement capabilities. Linear Variable Differential
Transducers (LVDTs) are a standard technique to perform in-pile displacement measurements, which are
used to transduce other phenomena such as pressure, and are widely used internationally for in-pile
measurements. LVDT technology for in-pile use has been refined over many decades at the Halden
Research Project (HRP) in Norway. Utilizing Halden technology is currently the fundamental strategy for
establishing capability at INL. Thus close collaboration has been established with procurement of Halden
sensors for use in TREAT experiments. Developing a rudimentary understanding of LVDT performance
and developing capabilities to assess these is the goal of this activity area. Highlights for associated FY19
activities are given below with a detailed report provided in Appendix D.

6
1.3 Neutron Flux/Energy Deposition
1.3.1 Self-Powered Neutron Detector
The simplicity of operation, small foot-print, fast-response, and demonstrated performance (common
in commercial applications and historically at TREAT) of Self-Powered Neutron Detectors (SPNDs) make
them attractive for neutron flux measurements in TREAT. Their form factor, basically a mineral insulated
wire, allows for simple integration and into experiments where many geometric limitation exist. Due to
their self-powered nature, the only electronics required are for the measurement of the current generated by
the devices (no pre-amplifiers). Their simple operation allows for them to measure neutron flux over
several decades of reactor power with the same device and electronics. This activity has focused on
establishing prompt-response SPND technology for baseline neutron flux measurement in the TREAT
facility. Highlights for associated FY19 activities are given below with a detailed report provided in
Appendix E.

Ai
Appendix A
Infrared Pyrometry Development for TREAT Experiments
2019 Annual Report
A. Fleming, C. Jensen
Idaho National Laboratory

Aii
Table of Contents
1. Introduction ........................................................................................................................................ 1
2. Radiation Induced Emission Compensation ....................................................................................... 1
3. Deployment ........................................................................................................................................ 5
4. Laboratory Based Testing ................................................................................................................... 6
5. Summary and Conclusions ................................................................................................................. 7
6. References .......................................................................................................................................... 8

A1
1. Introduction
Accurate in-pile temperature measurement capability is required for nuclear fuel testing. Of particular
interest is the cladding surface temperature measurement during off-design conditions. Welding
thermocouples to the cladding surface is the most common technique for measuring cladding surface
temperature. This generally leads to non-prototypic heat transfer conditions at the cladding surface because
of the added thermal mass and fin effect of the thermocouple. This can result in significant error in
temperature measurements. This provides the motivation for the development and deployment of in-pile
pyrometry. Pyrometry provides a method to perform non-contact high-temperature measurements via the
emitted blackbody radiation from a sample. A high-speed fiber-based pyrometry capability for in-pile
applications has been under development at Idaho National Laboratory [1, 2]. This report covers some of
the results and conclusions from those efforts during FY19.
2. Radiation Induced Emission Compensation
As discussed previously [1, 2], testing instrumentation in the TREAT coolant channels has enabled
preliminary testing of instrumentation prior to deployment in a fueled experiment. This testing has resulted
in collecting spectra throughout many TREAT transients. Many of the spectra have recorded the radiation
induced emission (RIE) as shown in Figure 1. The continuous portion of the spectra results from Cherenkov
radiation governed by the Frank-Tamm formula given by
𝑑2𝑁
𝑑𝑥𝑑𝜆=4𝜋2𝑒2
ℎ𝑐𝜆2(1 −
𝑐2
𝑣2𝑛𝜆2) Equation 1
where 𝑒 is the charge of an electron, ℎ is Planck’s constant, 𝑐 is the speed of light in a vacuum, 𝜆 is the
wavelength, 𝑣 is the velocity of the electron, and 𝑛𝜆 is the wavelength dependent index of refraction. The
wavelength dependent index of refraction for SiO2 used in these calculation is given by
𝑛𝜆2 − 1 =
0.6961663𝜆2
𝜆2 − 0.06840432+
0.4079426𝜆2
𝜆2 − 0.11624142+
0.8974794𝜆2
𝜆2 − 9.8961612Equation 2
where 𝜆 is in microns [3].
In Figure 1 the blue and red curves are given by Equation 1 with two different electron energies
(velocities). In this plot the curves are scaled to be similar in magnitude as the measured spectra, this is
analogous to the summation which would occur with many particles. The two curves show how the
measured Cherenkov distribution arises from a distribution of electron energies. This also provides
evidence that the continuous portion of the radiation induced emission is Cherenkov radiation.

A2
Figure 1. Black dots are the radiation induced emission collected during a TREAT transient. The red and
blue curves are plots of the Frank-Tamm equation for two different energies of electrons (Red
Energy=0.199 MeV, Blue Energy=0.241 MeV). The curves from the Frank-Tamm equation are scaled to
be relatively the same magnitude as the measured spectra.
The noticeable peak, at 1272 nm, is due to the radio-luminescence of interstitial O2 in the optical fiber.
This peak has been observed by other researchers performing in-pile fiber optic based measurements with
some preliminary testing to exploit it for dosimetry applications [4-6]. This excited O2 state can also be
achieved through photoluminescence and has been used for a variety of applications. The decay time of this
state varies from ~0.69 to ~0.83 seconds depending on the doping of the surrounding SiO2 [7]. Interestingly,
the decay time was not found to be sensitive to temperature.
The decay time of this peak can also be observed in the RIE spectra shown in Figure 2 where the black
dots are the measured spectra, and the red curve is the fitted line for RIE from a previous irradiation. The
previously measured RIE was taken during a constant reactor power where the emission achieved a steady
state condition. The first plot (a) is recorded in the initial stage of the transient where the reactor has quickly
ramped up to a high power. The second plot (b) is recorded in the same transient, but as the reactor power
is rapidly decreasing. The difference between them is subtle, but noticeable. Specifically, in (a) the
Cherenkov radiation is under represented and the radioluminescent peak is over represented. In (b) it is the
opposite, where the Cherenkov radiation is over represented and the radioluminescent peak is
underrepresented. This difference is due to the decay time of the peak. This distinction is important for
applications compensating for the effects of the RIE.
0
1000
2000
3000
4000
5000
6000
7000
8000
9000
10000
950 1050 1150 1250 1350 1450 1550 1650
Inte
nsi
ty
Wavelength, nm

A3
a) b)
Figure 2. Radiation induced emission spectra from the same transient in. a) Reactor is at high power b)
Reactor is decreasing power
Pyrometry is generally used in high temperature measurement applications, and the emitted thermal
radiation from the target dominates over the radiation induced emission. In fact, the thermal emission is
often 2-3 orders of magnitude larger than that of the radiation induced emission. However, the radiation
induced emission and thermal emission are comparable when the target is at a relatively low temperature
and the optical fiber experiences high radiation levels. Under these circumstances it is advantageous to
account for the radiation induced emission in the data reduction process.
When using a multi-wavelength or spectral pyrometry techniques, this addition light spectra can be
accounted for in the data analysis. In the work presented here the spectral shape of the radiation induced
emission is considered to be a constant in which the intensity scales linearly. Therefore the total measured
light intensity can be written as
𝐼(𝜆) = 𝑆1𝐿(𝜆, 𝑇) + 𝑆2𝑅𝐼𝐸(𝜆) Equation 3
where S1 is a scaling factor (view-factors, emissivity, etc;) L is Planck’s law, S2 is a scaling factor for the
radiation induced emission, and RIE is the spectrum for the radiation induced emission. In Equation 3 the
sample is assumed to be a gray body (emissivity is independent of wavelength) and the spectral transmission
of the optical line is also assumed to be independent of wavelength. The spectral sensitivity of the detector
is assumed to be accounted for in the calibration process of the measurement system.
The coefficients S1, S2, and target temperature are determined by fitting Equation 3 to measured spectral
data. In most cases the radiation induced emission is negligible compared to the thermal emission, but a
few particular spectra where the temperatures are relatively low at high reactor power are shown in Figure
3. By visual inspection of these curves it is clear both radiation induced emission and thermal emission are
present. Specifically, the ~1/𝜆2 intensity trend at the short wavelengths is indicative of Cherenkov
radiation in addition to the strong peak at 1272 nm provides strong evidence of the radiation induced
emission. The rapidly increasing intensity at the longer wavelengths is indicative of the thermal emission
spectrum. In Figure 3a the measured spectra is fitted using only Planck’s law (S2=0 in Equation 3) with
clearly poor results. The resulting fit is poor across the spectrum yielding a temperature of 546 C. In Figure
4b the radiation induced emission compensation is used resulting in a much better fit. In this fit the radiation
induced emission profile shown in Figure 1 is used in Equation 3. Standard numerical fitting/optimization

A4
routine can be used in this procedure. The decay time of the peak at 1272 nm does present some challenges
in the fitting process because the relative magnitude of the Cherenkov radiation to this radioluminescent
peak will change.
Several methods have been explored to account for this relative magnitude change between the
Cherenkov and radioluminescent peak. The simplest is to ignore the spectra in the region of the
radioluminescent peak (1225-1325 nm) by only fitting the measurement values outside of this range.
Another technique that was explored was to separate the Cherenkov distribution from the distribution of
radioluminescent peak. In terms of Equation 3, this results in a second RIE term with its unique scaling
factor. From a mathematics standpoint, this is a more correct representation because the source and temporal
dependence of the Cherenkov and radioluminescent emission is fundamentally different. The third
technique investigated in this work used a weighted residuals approach, which is somewhat of a
compromise between the two previously discussed techniques. The residuals were weighted such that the
spectra < 1225 nm and >1325 nm were weighted 3 times those within those wavelengths. This helps
minimize the impact the decay time of the radioluminescent peak has on the fitting process. The fitted
values for temperature using this process were shown to be comparable to those obtained through treating
the Cherenkov and radioluminescence independently. However, using the weighted residuals eliminates
one of the fit variables which significantly reduces the computational time. The stability and speed of the
fitting algorithm was enhanced by weighting the residuals over ignoring the region of the radioluminescent
peak. For these reasons the weighted residuals method was used in the data reduction process to account
for the radiation induced emission. There are cases were this would not be appropriate and separating the
radiation induced emission into two components will yield better results. An example case would be fast
large pulses where the sample temperature remains relatively low. This case is more problematic because
the Cherenkov radiation will be very strong initially which will then be followed by a strong
radioluminescent peak.
a) b)
Figure 3. Measured spectra containing both thermal emission and radiation induced emission a) spectrum
is analyzed without compensating for the radiation induced emission b) spectrum is analyzed with the
radiation induced emission compensation
A5
3. Deployment
The pyrometry research shown here and in previous reports [1, 2] has led to the successful measurement
of cladding surface temperatures in fueled experiments. The Accident Tolerant Fuels Separate Effect Test
Holder (ATF-SETH) test series is the first to incorporate the fiber optic based pyrometer. The test specimens
in these experiments were zirconium (Zircaloy-4) clad UO2 fuel which was suspended inside a capsule
filled with helium. The design of the optical line, assembly, and other preparations for the experiment were
previously covered in detail [2].
This experiment series consisted of five capsules (A-E), four of which contained two optical fibers for
pyrometry (B-E). Capsule B underwent two different transient profiles. The pyrometry data measured in
this experiment series is presented in Figure 4, which includes B1, B2, C, D, and E. These transients are in
ascending order, meaning B1 results in the lowest temperature and E the highest. Figure 4 shows good
agreement by both pyrometers in each transient (data from both pyrometers are plotted with the same color
and are nearly indistinguishable in the plot). Temperatures measured by the pyrometer ranged from 500°C
to 2100°C in the experiment series.
Figure 4. Temperature measurements from both pyrometers in ATF-SETH transients B1 (red), B2 (purple),
C (orange), D (green), E (blue).
The measured temperatures in capsules D & E exceed that of the melting point of Zircaloy-4, which at
first seem suspicious since typical cladding temperature measurement techniques (thermocouples) would
stop reading at or before cladding failure. However, neutron radiography from capsules C, D, and E, shown
in Figure 5, help explain the results. In capsule D the rodlet separated just below the top pellet indicating a
partial melt of the cladding. The top pellet was then suspended from the capsule and the rest of the fuel
rodlet fell to the bottom of the capsule. As indicated in Figure 5 the pyrometers were viewing what would
have been viewing the portion of the fuel rodlet near the region of separation. Therefore, a temperature
measurement slightly above the melting point of Zr-4 is to be expected in capsule D which strongly
corroborates the temperature measured by the pyrometer (Zr-4 melting point 1850°C, peak measured
~1937°C). The pyrometers in capsule E measured peak temperatures around 2100°C, well above the
cladding melt temperature. From the neutron radiography of capsule E, significant piece of cladding appears
to have sloughed off of the rodlet, thereby leaving partially exposed fuel. This is also consistent with the
temperatures measured by the pyrometers.

A6
Figure 5. Diagram of neutron radiography results from capsules C, D, and E.
4. Laboratory Based Testing
Laboratory based development and testing has been an important contributor to the successful in-pile
deployment of the fiber-optic based pyrometry. These development efforts previously focused on
overcoming challenges associated with in-pile deployment such as: pyrometer misalignment, pressure
boundary feed throughs, target geometry & surface roughness, calibration, and characterizing system time
response. The current laboratory testing is working on developing capabilities of measuring cladding
surface temperature through a water and/or steam environment. This presents a significant challenge
because of the light absorption from water & steam. Water is rather transparent in the visible and in
particular in the UV near the visible spectrum. However, the absorption increases rapidly as the wavelength
increases. Water has many absorption bands, but of particular interest are those located at 970 nm, 1200
nm, 1450 nm and 1950 nm [8, 9].
Laboratory based experiments have commenced exploring methods to accommodate for these strong
absorption bands. Experimental results of measured spectra with water absorption are shown in Figure 6.
The transmission spectrum was measured using a blackbody source at 900°C coupled to an optical fiber.
That optical fiber transmitted the light into a bath of water with a transmission distance of approximately 1
cm before it was coupled into another optical fiber, which guided the light to a spectrometer. The
transmission across the wavelength range was then calculated knowing the source was a blackbody at
900°C. This transmission spectra was then applied to blackbody distributions at different temperatures. In
this spectra the strongest absorption band centered on ~1450 nm presents a particularly challenging
problem. The normal “low temperature” (300°C-400°C) operation of this pyrometer relies on the emission
of light with wavelengths >1400 nm because there is insufficient light emitted at the shorter wavelengths.
Therefore this attenuation will be detrimental for the lower temperature operation.
A7
Figure 6. Measured spectra through approximately 1 cm of water with light sourced from different
blackbody temperatures. Each spectra is normalized to its peak value.
5. Summary and Conclusions
The work presented here developed a novel technique to account for the radiation induced emission in
in measured spectra in the data reduction process of spectral pyrometry. The developed technique accounts
for both the Cherenkov the radioluminescent emission. This technique was demonstrated on a measured
spectra from a transient in the TREAT facility at INL. The work presented in this report and previous reports
has led up to the successful measurement of cladding surface temperature in the ATF-SETH test series. The
temperatures measured ranged from ~500°C to ~2100°C demonstrating high temperature capability and
dynamic range of pyrometry techniques. Capability is available to measure up to 3000°C (and has recently
been demonstrated to ~2400°C for other experiments at the TREAT facility). The measured temperatures
are corroborated by post-transient neutron radiography of the capsules. The neutron radiography revealed
partial cladding melt in capsule D and significant melting in capsule E. This is in good agreement with the
pyrometer measured temperatures. Laboratory based testing has been initiated to develop techniques to
enable pyrometry measurements through water/steam environments. This is challenging do to the
significant absorption bands located in the spectral region of interest, specifically, the strong absorption
bands at ~1450 nm and ~1200 nm. Ongoing work will focus predominately on enabling pyrometry
measurements through water/steam environments.

A8
6. References
[1] C. B. Jensen et al., "FY17 Report for Instrumentation Development for the Transient Testing
Program," Idaho National Laboratory2017, vol. INL/EXT-17-43444.
[2] C. B. Jensen et al., "FY18 Report for Instrumentation Development for the Transient Testing
Program," Idaho National Laboratory2018, vol. INL/EXT-18-51613.
[3] I. H. Malitson, "Interspecimen comparison of the Refractive Index of Fused Silica," Journal of the
optical Society of America, vol. 55, no. 10, pp. 1205-1209, 1965.
[4] D. Di Francesca et al., "Near infrared radio-luminescence of O2 loaded radiation hardened silica
optical fibers: A candidate dosimeter for harsh environments," Applied Physics Letters, vol. 105,
no. 18, p. 183508, 2014.
[5] T. Kakuta, M. Nakazawa, T. Shikama, and M. Narui, "Development of in-core monitoring system
using radiation resistant optical fibers," in IEEE Nuclear Science Symposium, Norfolk, VA, 1995:
IEEE.
[6] T. Shikama, T. Kakuta, M. Narui, T. Sagawa, and H. Kayano, "Optical properties in fibers during
irradiation in a fission reactor," Journal of Nuclear Materials, vol. 225, pp. 324-327, 1995.
[7] K. Kajihara, H. Kamioka, M. Hirano, T. Miura, L. Skuja, and H. Hosono, "Interstitial oxygen
molecules in amorphous SiO2. II. The influence of common dopants (SiOH, SiF, and SiCl groups)
and fictive temperature on the decay of singlet photoluminescence," Journal of Applied Physics,
vol. 98, no. 1, p. 013528, 2005.
[8] J. A. Curcio and C. C. Petty, "The Near Infrared Absorption Spectrum of Liquid Water," Journal
of the optical Society of America, vol. 41, no. 5, pp. 302-304, 1951.
[9] "Temperature-dependent absorption of water in the red and near-infrared portions of the spectrum,"
Limnology and Oceanography, vol. 38, no. 1, pp. 188-192, 1993.

Bi
Appendix B
Distributed Temperature Sensing Optical Fiber Testing in TREAT
2019 Annual Report
K. McCary, K. Tsai, A. Fleming, C. Jensen
Idaho National Laboratory

Bii
Table of Contents
1. Introduction ........................................................................................................................................ 1
2. Approach ............................................................................................................................................ 1
3. Results ................................................................................................................................................ 2
3.1 TL-1 (1.8%) ............................................................................................................................. 3
3.2 TL-2 (3.0%) ............................................................................................................................. 5
3.3 TL-3 (4.0%) ............................................................................................................................. 8
3.4 M-SERTTA Trial (1.8% clipped) .......................................................................................... 10
4. Summary and Conclusions ............................................................................................................... 12
5. Future Work...................................................................................................................................... 12
6. References ........................................................................................................................................ 12

B1
1. Introduction
Optical fibers can be used in a variety of ways to measure different physical phenomena such as
temperature, strain, pressure, and fluid level. There are many benefits to using optical fibers such as the
ability to make distributed temperature and/or strain measurements with high accuracy and sub-cm spatial
resolution, a small footprint (~100 µm diameter), fast response, and immunity to electromagnetic
interference. These advantages make the fiber an ideal candidate for an upcoming TREAT experiment
where the data objective is to measure the temperature gradient throughout a heat sink during irradiation.
Silica optical fiber distributed temperature sensing (DTS) can be performed through Optical Time
Domain Reflectometry (OTDR) or Optical Frequency Domain Reflectometry (OFDR) sensing techniques.
OTDR and OFDR are very similar sensing techniques. Both techniques operate on the principle of injecting
light into an optical fiber and measuring the backscattered light (Rayleigh scatter) off of the local density
fluctuations along the length of the fiber. Time of flight measurements can be made for the backscattered
signal and used to create a defect profile of the fiber. As the temperature increases the optical fiber expands
and the time of flight measurements for the backscatter profile changes. This change can then be correlated
to a change in temperature. OFDR is very similar to OTDR, the main difference is that the backscatter light
is recombined with the original light wave to create an interference pattern. The inference pattern allows
for a much higher resolution of measurements along the length of the fiber than the OTDR method. The
resolution for OFDR is on the order of a millimeter while the resolution for OTDR is on the order of a meter
[1].
Silica optical fibers have been shown to have radiation induced attenuation (RIA), particularly in the
UV and visible wavelengths. Under gamma ray dose silica optical fibers with fluorine doped (F-doped)
cores and pure silica cores (PSC) have been shown to have the least amount of radiation induced attenuation
(RIA) for doses up to 1 MGy and temperatures up to 300ºC [2]. The OFDR sensing technique was evaluated
in silica optical fibers, with F-doped and PSCs, up to 300ºC and 1 MGy γ-ray dose [3]. The optical fibers
tested had various coatings and were thermally pre-treated up to 300ºC. The tests showed a maximum ΔT
of 5ºC between the pre-irradiated fibers and irradiated fibers, indicating that the OFDR sensing technique
can withstand a dose of up to 1 MGy without significantly affecting sensing ability up to 300ºC. For
temperatures up to 50ºC, PSC optical fibers and F-doped silica optical fibers have been shown to have less
than 5% change in sensing up to a 10 MGy dose [4].
Transient testing DTS of in optical fibers is limited. Out-of-pile transient thermal testing of DTS optical
fibers was conducted for temperatures up to 1000ºC with good response [5]. DTS optical fibers had not
previously been tested in-pile under transient reactor conditions. The testing detailed here was conducted
to ensure that the instrumentation would respond appropriately in future planned transient experiments.
2. Approach
A distributed temperature sensing fiber optic assembly was inserted into a cooling channel in TREAT
as part of the concurrent testing campaign. The optical fiber sensors were fabricated and placed in a titanium
holder shown in Figure 1, along with a type K thermocouple.
Figure 1: Titanium holder optical fiber sensor assembly.
B2
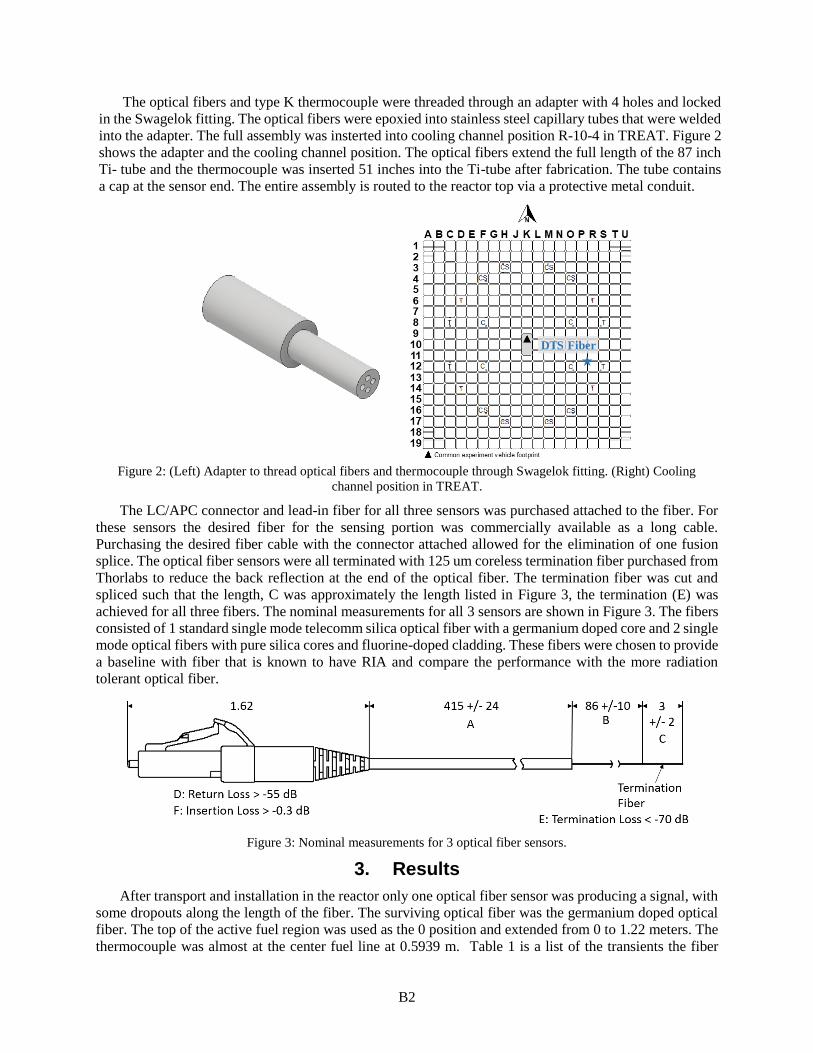
The optical fibers and type K thermocouple were threaded through an adapter with 4 holes and locked
in the Swagelok fitting. The optical fibers were epoxied into stainless steel capillary tubes that were welded
into the adapter. The full assembly was insterted into cooling channel position R-10-4 in TREAT. Figure 2
shows the adapter and the cooling channel position. The optical fibers extend the full length of the 87 inch
Ti- tube and the thermocouple was inserted 51 inches into the Ti-tube after fabrication. The tube contains
a cap at the sensor end. The entire assembly is routed to the reactor top via a protective metal conduit.
Figure 2: (Left) Adapter to thread optical fibers and thermocouple through Swagelok fitting. (Right) Cooling
channel position in TREAT.
The LC/APC connector and lead-in fiber for all three sensors was purchased attached to the fiber. For
these sensors the desired fiber for the sensing portion was commercially available as a long cable.
Purchasing the desired fiber cable with the connector attached allowed for the elimination of one fusion
splice. The optical fiber sensors were all terminated with 125 um coreless termination fiber purchased from
Thorlabs to reduce the back reflection at the end of the optical fiber. The termination fiber was cut and
spliced such that the length, C was approximately the length listed in Figure 3, the termination (E) was
achieved for all three fibers. The nominal measurements for all 3 sensors are shown in Figure 3. The fibers
consisted of 1 standard single mode telecomm silica optical fiber with a germanium doped core and 2 single
mode optical fibers with pure silica cores and fluorine-doped cladding. These fibers were chosen to provide
a baseline with fiber that is known to have RIA and compare the performance with the more radiation
tolerant optical fiber.
Figure 3: Nominal measurements for 3 optical fiber sensors.
3. Results
After transport and installation in the reactor only one optical fiber sensor was producing a signal, with
some dropouts along the length of the fiber. The surviving optical fiber was the germanium doped optical
fiber. The top of the active fuel region was used as the 0 position and extended from 0 to 1.22 meters. The
thermocouple was almost at the center fuel line at 0.5939 m. Table 1 is a list of the transients the fiber
DTS Fiber

B3
assembly has been inserted into the cooling channel for. Data from TL-1, TL-2, TL-3, and M-SERTTA
Trial is detailed in this report. There was an approximately 2 second delay in the k-type thermocouple that
is larger than the expected lag in the thermocouple reading, at this time the issue has not yet been resolved.
The delay is potentially due to a delay in the data acquisition system. Despite the initial 2 second delay in
the thermocouple, the optical fiber performs as expected with a faster response than that of the
thermocouple. The optical fiber was interrogated with a Luna ODiSI 6000 at a rate of 6.5 Hz. The sensing
technique used was optical frequency domain reflectometry (OFDR) and allowed for temperature
measurements every 1.6 mm along the length of the optical fiber.
Table 1: TREAT Transient the fiber assembly has experienced.
Date Transient names Estimated Core Peak
Temp (°C)
7/1/2019 MIMIC-N SS core characterization N/A
7/16/2019 TL-1 (1.8%) 245
7/17/2019 TL-2 (3.0%) 391
7/22/2019 TL-3 (4.0%) 514
7/29/2019 M-SERTTA Trial (1.8% clipped) 223
7/31/2019 SIRIUS CAL Trial (0.8% clipped) 63
8/6/2019 SIRIUS 50% Trial 122
8/8/2019 SIRIUS 100% Trial No Data
8/19/2019 SETH-F0 No Data
8/21/2019 SETH-F1 186
8/22/2019 SETH-F2 206
8/28/2019 SETH-G 344
9/4/2019 SIRIUS-CAL (0.8% clipped) 68
9/9/2019 SIRIUS 50% 128
9/10/2019 SIRIUS-100% 317
3.1 TL-1 (1.8%)
TL-1 (1.8%) is a temperature limited pulse transient with a step insertion reactivity of 1.8% Δk/k. Figure
4 and Figure 5 show the response of the thermocouple, and the optical fiber, at various locations, over time
along with the reactor power for the TL-1 transient. Figure 4 shows only the first 10 seconds and the delay
in the thermocouple is apparent. The optical fiber reaches the peak temperature in the cooling channel
before the thermocouple, which is expected from the faster response of the fiber. The fiber, at the location
of the thermocouple, and the thermocouple track together as the reactor cools.

B4
Figure 4: TL1 transient optical fiber and thermocouple initial response.
Figure 5: TL-1 transient optical fiber and thermocouple response over time.
The temperature profile along the length of the cooling channel is shown in Figure 6. The highest
temperature is just past the center line of the fuel. The air flows from the top of the fuel to the bottom in a
once through cooling flow. Location 0 m is the top of the active fuel region and extends to 1.219 m (4 feet).
The full temperature profile over time measured by the optical fiber is in Figure 7 as a surface plot.

B5
Figure 6: TL-1 transient distributed temperature profile at various times.
Figure 7: Temperature profile of cooling channel R-10-4 over time following the TL-1 transient.
3.2 TL-2 (3.0%)
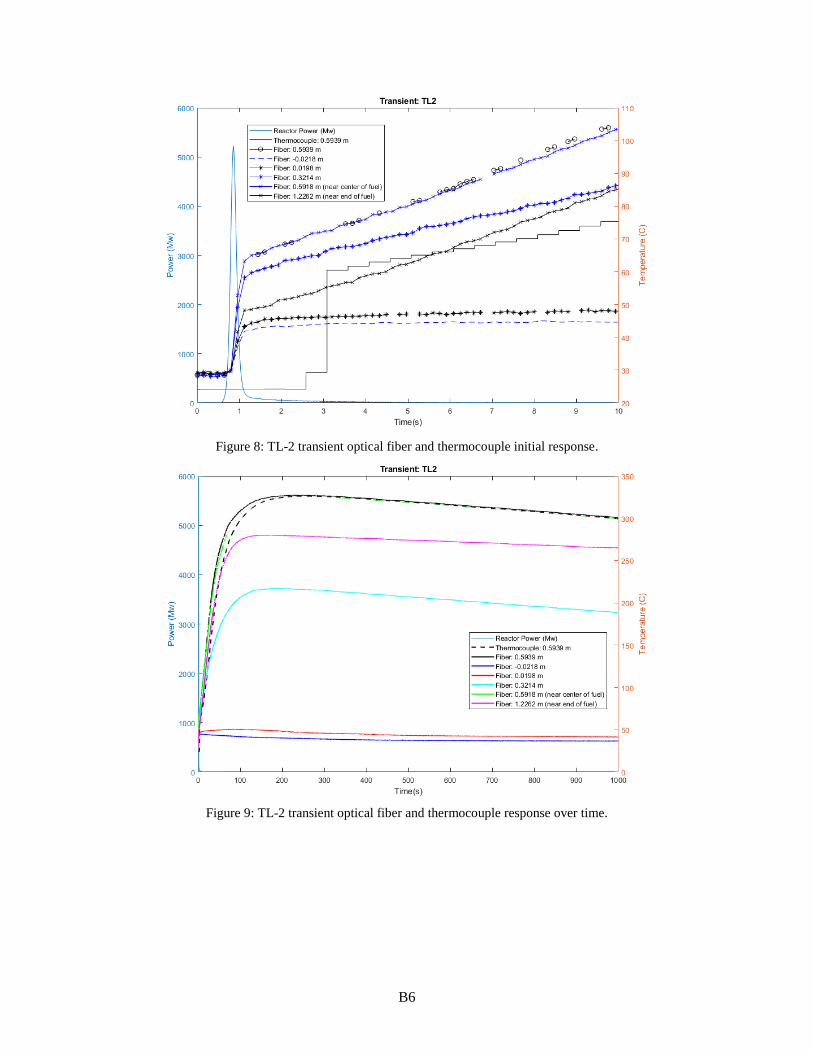
The TL-2 transient was slightly larger than the TL-1 transient and the response of the optical fiber and
the thermocouple are very similar with a higher peak temperature. Figure 8 and Figure 9 show the response
of the fiber in various locations and the thermocouple response over time.
B6
Figure 8: TL-2 transient optical fiber and thermocouple initial response.
Figure 9: TL-2 transient optical fiber and thermocouple response over time.
B7
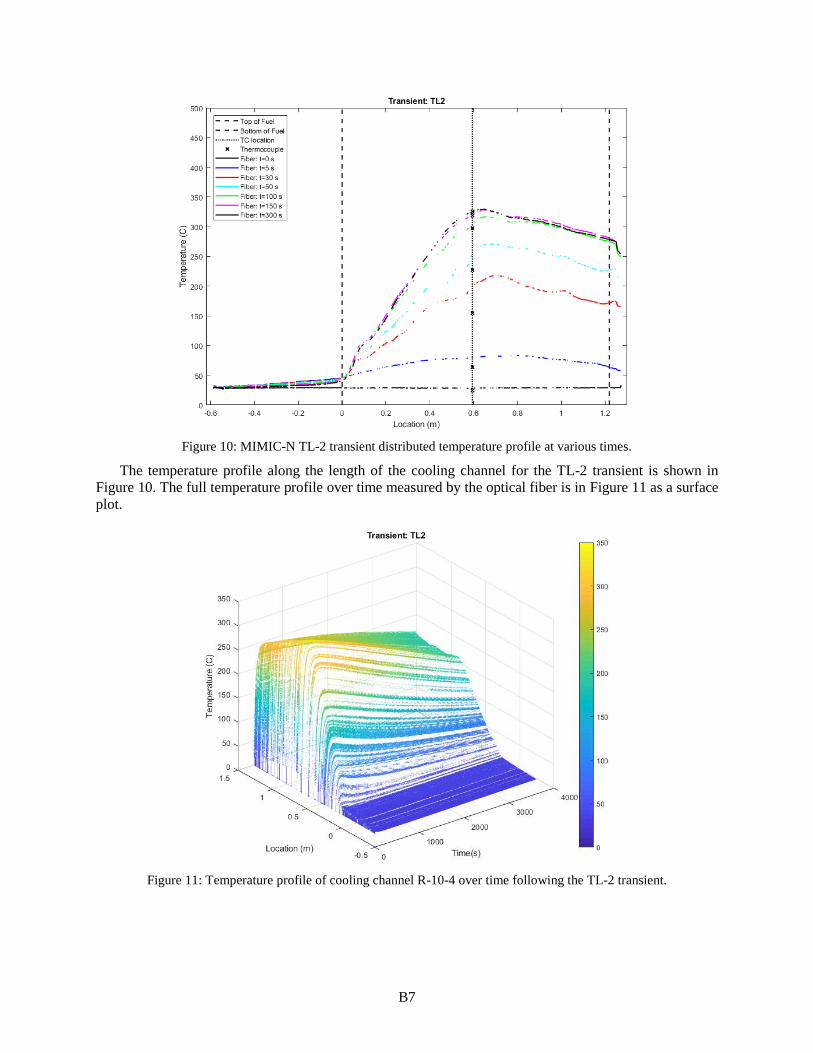
Figure 10: MIMIC-N TL-2 transient distributed temperature profile at various times.
The temperature profile along the length of the cooling channel for the TL-2 transient is shown in
Figure 10. The full temperature profile over time measured by the optical fiber is in Figure 11 as a surface
plot.
Figure 11: Temperature profile of cooling channel R-10-4 over time following the TL-2 transient.

B8
3.3 TL-3 (4.0%)
The TL-3 transient was the largest transient in the series presented here. A peak temperature of
approximately 473°C was observed by both the fiber and the thermocouple. Error! Reference source not
found. and Error! Reference source not found. show the response of the fiber in various locations and
the thermocouple response over time. An increase in signal dropouts is observed from the previous
transients.
Figure 12: TL3 transient optical fiber and thermocouple initial response.
Figure 13: TL-3 transient optical fiber and thermocouple response over time.

B9
Figure 14: TL-3 transient distributed temperature profile at various times.
Signal dropout is more apparent in Figure 14, signal failures can be seen at various locations along the
whole length of the optical fiber sensor. This could be due to several factors. First, the optical fiber was
only heat treated to 400°C so some higher energy defects could be migrating or annealing causing a failure
to reference the signal to the initial background measurement. Second, the increased flux above the previous
transients could be causing signal failure. Figure 15 shows the profile of the cooling channel as measured
by the fiber over time. It can be seen that the initial spike in temperature (during the reactor power pulse)
is not captured by the fiber, however, the signal returns after the pulse is over and for the duration of the
delayed heating. This indicates gamma effects in the optical fiber at this level of power pulse.
Figure 15: Temperature profile of cooling channel R-10-4 over time following the TL-3 transient.

B10
3.4 M-SERTTA Trial (1.8% clipped)
The transient following the TL-3 transient was the M-SERTTA trial transient. This transient was a
clipped version of the TL-1 transient where the transient rods are reinserted to reduce the total energy
deposited in the core. The peak temperature of this transient is around 180°C. Figure 16 and Figure 17 show
the response of the fiber in various locations and the thermocouple response over time.
Figure 16: M-SERTTA Trial (1.8%) transient optical fiber and thermocouple initial response.
Figure 17: M-SERTTA Trial (1.8%) transient optical fiber and thermocouple response over time.
B11
Figure 18: M-SERTTA Trial (1.8%) transient distributed temperature profile at various times.
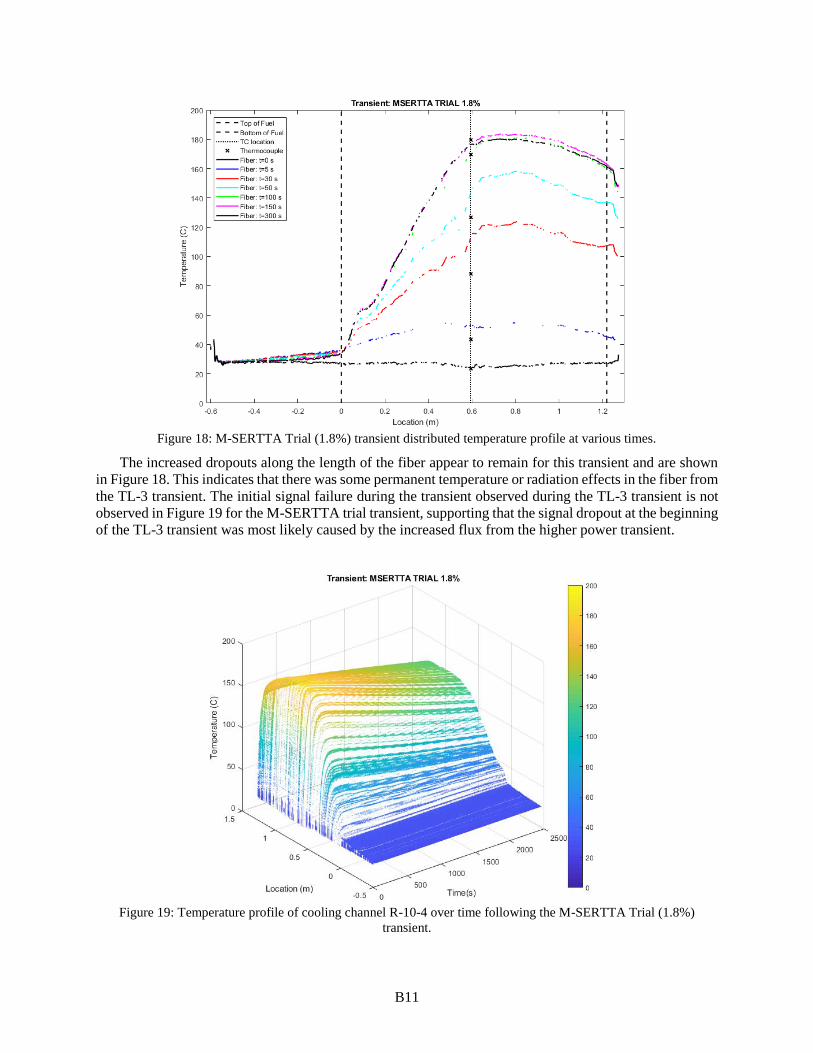
The increased dropouts along the length of the fiber appear to remain for this transient and are shown
in Figure 18. This indicates that there was some permanent temperature or radiation effects in the fiber from
the TL-3 transient. The initial signal failure during the transient observed during the TL-3 transient is not
observed in Figure 19 for the M-SERTTA trial transient, supporting that the signal dropout at the beginning
of the TL-3 transient was most likely caused by the increased flux from the higher power transient.
Figure 19: Temperature profile of cooling channel R-10-4 over time following the M-SERTTA Trial (1.8%)
transient.

B12
4. Summary and Conclusions
The research presented in this report documents the work performed towards in-pile testing of DTS
optical fibers in preparation for deployment in upcoming TREAT experiment. Three candidate optical
fibers were installed into titanium holders and inserted into the TREAT cooling channel to test instrument
response. Of the three fibers, only one fiber survived the installation. The surviving germanium doped
optical fiber successfully performed distributed temperature measurements along the length of the 1.22 m
from the top of the active fuel region into the core. Trace comparison with a type K thermocouple and
temperature profile were performed for pulse type transients with temperatures peaking at 473°C with
indications of faster response performance from the fibers than the thermocouples during the initial heating
and good trace comparison during the cooling phase. Gamma effects on fibers were observed only during
the largest TREAT pulse (TL-3). Signal dropouts were also observed from TL-3 and continued to exist in
the following transient.
5. Future Work
An additional in-pile testing is planned for FY20. The fiber adapter used has been modified in an effort
to increase the protection of the optical fiber at the joint between the metal tubing and the titanium holder.
In addition to the adapter modification a different epoxy will be used to secure the fibers in place through
the adapter and into the titanium holder. The epoxy used for this deployment was cured using a heat gun,
the new epoxy will have a room temperature cure. The optical fibers will also be heat treated to a higher
temperature to eliminate any potential temperature effects for large power pulse transients. These changes
should allow for a more complete signal along the length of the optical fibers initially and throughout the
transients.
6. References
[1]. D. K. Gifford, B. J. Soller, M. S. Wolfe and M. E. Froggatt, "Distributed fiber-optic temperature
sensing using Rayleigh backscatter," 2005 31st European Conference on Optical Communication,
ECOC 2005, Glasgow, 2005, pp. 511-512 vol.3.
[2]. S. Girard et al., "Combined High Dose and Temperature Radiation Effects on Multimode Silica-
Based Optical Fibers," in IEEE Transactions on Nuclear Science, vol. 60, no. 6, pp. 4305-4313,
Dec. 2013. doi: 10.1109/TNS.2013.2281832
[3]. S. Rizzolo et al., "Radiation Hardened Optical Frequency Domain Reflectometry Distributed
Temperature Fiber-Based Sensors," in IEEE Transactions on Nuclear Science, vol. 62, no. 6, pp.
2988-2994, Dec. 2015. doi: 10.1109/TNS.2015.2482942
[4]. Rizzolo, S., Dipartimento di Fisica e Chimica, Universita di Palermo, Viale delle Scienze Parco
d'Orleans II, Ed. 17, 90128 Palermo, Areva Centre Technique, Boulevard de l'Industrie, 71200, Le
Creusot, Boukenter, A., Marin, E., Ouerdane, Y., Girard, S., Cannas, M., Perisse, J., Bauer, S., and
Mace, J.R., “Vulnerability of OFDR-based distributed sensors to radiations”, United States: N. p.,
2015. Web.
[5]. K. M. McCary, B. A. Wilson, A. Birri and T. E. Blue, "Response of Distributed Fiber Optic
Temperature Sensors to High-Temperature Step Transients," in IEEE Sensors Journal, vol. 18, no.
21, pp. 8755-8761, 1 Nov.1, 2018.
doi: 10.1109/JSEN.2018.2868429

Ci
Appendix C
Development of a Fiber-based Displacement Sensor for TREAT Experiments
2019 Annual Report
A. Fleming, A. Lambson, C. Jensen
Idaho National Laboratory

Cii
Table of Contents
1. Introduction ........................................................................................................................................ 1
2. Theory & Design ................................................................................................................................ 1
3. Results ................................................................................................................................................ 2
4. Summary & Conclusions .................................................................................................................... 4
5. References .......................................................................................................................................... 4

C1
1. Introduction
In the testing of nuclear fuels elongation/displacement measurements are commonly required for fuel-
stack/cladding elongation and creep measurement. Linear Variable Differential Transformers (LVDTs) are
the standard sensor for in-pile displacement measurements and have been shown to perform well under a
variety of conditions. The Halden Reactor Project has used LVDTs to measure a wide variety of in-pile
parameters including pressure, temperature, displacement, and creep [1]. Recently the development of
fiber-optic based sensors for in-pile applications has increased because of their inherent benefits of
electromagnetic interference immunity, small footprint, high-speed, and high accuracy capability. The
irradiation of optical fibers can cause spurious impacts to fiber optics including radiation induced
attenuation, radiation induced emission, and fiber compaction. These impacts are widely studied and remain
an active area of research, however, strategies have been developed to help account for these effects [2-4].
A common technique is to use interference based measurement strategies in the design of the sensor [5, 6].
Thereby limiting the impact of radiation induced attenuation on sensor performance. The development of
a fiber-optic based elongation sensor is motivated by the potential of a sensor with
A smaller footprint with a comparable measurement range,
Requiring only 1 lead (LVDTs generally require 2 mineral insulated cables),
Multiple parameter sensing capability (temperature in addition to elongation in the same fiber).
2. Theory & Design
The fiber-optic elongation sensor presented here is based on Fabry-Perot interferometry. The
interference pattern in a Fabry Perot cavity is caused by multiple reflections in the cavity. Constructive
interference occurs when the round trip of light is in phase. Specifically this is given by
𝜙 =4𝜋𝑛𝐿
𝜆Equation 1
where L is the cavity length, n is the index of refraction, 𝜆 is the wavelength of light, and 𝜙 is the phase
delay[7]. When the phase is equal to integers of 2𝜋𝑚 there will be constructive interference, and destructive
interference at 𝜋(2𝑚 − 1) where m is all positive integers.
(a) (b)
Figure 1. Photograph (a) and rendering of displacement sensor

C2
A prototype sensor has been designed and constructed based on this phenomena and is shown Figure
1. The sensor prototype has an overall length of 55 mm, diameter of 4 mm, and a measurement range of ~10.5 mm. the prototype sensor consists mainly of off-the-shelf parts for ease of fabrication. Potential optimization could result in a smaller footprint with comparable sensor range and accuracy. The sensor functions by measuring the cavity length between the optical fiber ferrule and the polished reflector. The ferrule is welded to the sensor body where the reflector is free to move. The reflector is attached to a push-
rod (orange in the rendering) which is what drives the displacement. The spring is under compression which makes the reflector naturally return to the longest cavity location. This prototype sensor was attached to a micrometer driven stage for testing the sensor measurement capability. A photograph of this experimental setup can be seen in Figure 2. In this photograph, the sensor is near its fully compressed state in contrast to its fully elongated (natural) state in Figure 1.
Figure 2. Experimental setup for testing the optical-fiber-based displacement sensor
3. Results
Using this experimental setup, the micrometer was adjusted over a range of 10 mm in 0.5 mm
increments. At each step an interference spectrum was measured using a Micron Optics si155 interrogator.
One of the recorded interference spectrums is provided in Figure 3a. The easily identifiable peaks and
valleys in the interference spectrum and overall low noise should be noted. The length of the cavity can be
determined by measuring the wavelengths of adjacent constructive interference peaks, 𝜆1 and 𝜆2. Using
these measurements the cavity length is then determined by
𝐿 =𝜆1𝜆2
2𝑛(𝜆2 − 𝜆1). Equation 2
In this work a Fast Fourier Transform (FFT) was used to determine the term 𝜆2 − 𝜆1. The periodic
nature of the interference spectrum does not have a constant frequency. At longer wavelengths the
interference spectrum will have a lower frequency than those of shorter wavelengths. However, the
frequency appears constant when the cavity length is long compared to the wavelength, and a small
wavelength range is observed. This is the case in this study and is evidenced by the FFT results provided
in Figure 3b. The sharp peak can be considered a figure-of-merit for this assumption. Likewise, when this
assumption is made the product 𝜆1𝜆2 is estimated to be the average of the wavelengths used in the FFT

C3
squared. By making this simplifying assumptions, an FFT of the interference spectrum allows for a quick
analysis to determine the cavity length.
(a) (b)
Figure 3. a) Measured interference spectrum from the experimental setup (b) Fourier transform of the
interference spectrum
The interference spectrum at each displacement location has been analyzed and the cavity length has
been calculated through Equation 2, these results can be seen in Figure 4. The reference displacement
(micrometer reading) at each location is subtracted from the measured cavity length and is plotted as the
red squares in Figure 4. The average value of the reference subtracted from the measured values is
calculated to be 1.168 mm and is plotted as a black line in Figure 4 as a reference. The standard deviation
of these values is 0.027 mm, indicating a 95% confidence interval uncertainty of approximately 50 µm.
However, the deviations do not appear to be random and increase with the cavity length. At shorter cavity
lengths the error is significantly less. In future work this variable uncertainty with cavity length with be
explored.
Figure 4. Measured cavity length vs the reference displacement (micrometer) is provided in

C4
4. Summary & Conclusions
This research has resulted in a simple sensor design requiring only one feedthrough, a small footprint
(4 mm diameter, 55 mm long), and a measurement range of 10 mm. It has a demonstrated uncertainty of
<50 µm (0.5 % full range) of error. Future work will include fabricating the sensor with high temperature
rated fiber optics to enable testing at elevated temperatures. The cavity-length dependent uncertainty will
be explored along with the high temperature performance of the sensor. This prototype sensor has shown
significant promise for providing accurate in-pile elongation measurements.
5. References
[1] S. Solstad and R. Van Nieuwenhove, "Instrument Capabilities and Developments at the Halden
Reactor Project," Nuclear Technology, vol. 173, no. 1, pp. 78-85, 2017.
[2] E. J. Friebele, "Optical fiber waveguides in radiation environments," Optical Engineering, vol. 18,
no. 10, pp. 552-561, 1979.
[3] E. J. Friebele, C. G. Askins, M. E. Gingerich, and K. J. Long, "Optical fiber waveguides in radiation
environments, II," Nuclear Instruments and Methods in Physics Research B, pp. 355-369, 1984.
[4] S. Girard et al., "Radiation Effects on Silica-Based Optical Fibers: Recent Advances and Future
Challenges," IEEE Transactions on Nuclear Science, vol. 60, no. 3, pp. 2015-2036, 2013.
[5] G. Cheymol, A. Gusarov, S. Gaillot, C. Destouches, and N. Caron, "Dimensional Measurements
under High Radiation with Optical Fibre Sensors based on White Light Interferometry - Report on
Irradiation Tests," in Advancements in Nuclear Instrumentation Measurement Methods and their
Applications (ANIMMA), 2013.
[6] G. Cheymol, J. F. Villard, A. Gusarov, and B. Brichard, "Fibre Optic Extensometer for High
Radiation and High Temperature Nuclear Applications," IEEE Transactions on Nuclear Science,
vol. 60, no. 5, pp. 3781-3784, 2013.
[7] M. Born and E. Wolf, Principles of optics: electromagnetic theory of propagation, interference
and diffraction of light. Elsevier, 2013.

Di
Appendix D
Linear Variable Differential Transducer (LVDT):
Pressure Sensor, LVDT Irradiation Test for TREAT, and Autoclave Performance
2019 Annual Report
K. Davis, M. Wilding, K. Tsai
Idaho National Laboratory

Dii
Table of Contents
1. Introduction ........................................................................................................................................ 1
2. Background LVDT Information ......................................................................................................... 1
3. LVDT Based Pressure Sensor ............................................................................................................ 2
4. Creep Test Rig .................................................................................................................................... 4
5. LVDT Static Test Assembly for TREAT ........................................................................................... 6
6. Conclusions ........................................................................................................................................ 9
7. References ........................................................................................................................................ 10

D1
1. Introduction
Real-time pressure and dimensional changes in fuel and/or fuel cladding during irradiations can be used
to understand phenomena such as fuel and cladding elongation, the buildup of “crud,” pressurization from
fission gas release, and pellet-clad mechanical interactions. These phenomena can adversely affect fuel
performance and/or heat transfer away from the fuel. Therefore, in-situ measurements are critical to
advancing the knowledge base related to irradiation effects on fuels and cladding.
Measurements of these phenomena require micron-scale accuracy to provide meaningful data to
provide data needed to describe fuel performance. Linear Variable Differential Transformers (LVDT)
sensors are well-established to provide such resolution and are known for superior in-pile performance
under irradiation. The Halden test reactor is best known for applying LVDT sensors for in-pile fuel
measurements. With the closure of the Halden reactor last year, establishing mature LVDT technology and
experience has become a major priority for DOE programs. Even with a mature sensor technology,
requirements for such high resolution measurement means careful understanding of not only sensor
performance, but also the complete implementation strategy including thermal conditions, hardware
selection and design, and data processing. To develop optimized design configurations and define sensor
performance for them, detailed laboratory studies should be performed to quantify performance. In addition,
transient irradiation testing requires fast response performance (~1ms) from LVDT measurement devices
requiring development of data acquisition approaches, distinct from traditional systems used at steady state
test reactors.
During FY19, the Idaho National Laboratory (INL) High Temperature Test Laboratory (HTTL) has
developed and tested a new pressure sensor, a static test rig for LVDT evaluation in the Transient Reactor
Test (TREAT) facility, and a creep test rig. FY18 activities had focused on establishing laboratory testing
and qualification facilities and data acquisition solutions to support LVDT deployment [1]. The closure of
the Halden reactor last year has prioritized LVDT related progress such that the new Nuclear Energy
Enabling Technologies (NEET) Advanced Sensors & Instrumentation (ASI) program has begun supporting
foundational LVDT development activities. The creep test rig work was supported under ASI program
support but resulted in meaningful contributions to TREAT needs. Primary development activities have
been transferred to the ASI program during FY19 while deployment specific needs have been covered under
the AFC program. The recent developments under AFC and ASI programs will provide cross-cutting
benefits to other in-pile testing needs and provide a strong foundation to enabling Halden technology in
DOE facilities including TREAT, Advanced Test Reactor (ATR), and potentially the High Flux Isotope
Reactor (HFIR).
2. Background LVDT Information
LVDTs are simple, reliable, sensors that convert the mechanical movement of a specimen into an
electrical output. A cross-section of a basic LVDT design is shown in Figure 1. As indicated, a
magnetically-permeable core is attached to a specimen. The core then moves inside a tube in response to
any change in specimen length or position. Three coils are wrapped around the tube: a single primary coil
and two secondary coils.
D2
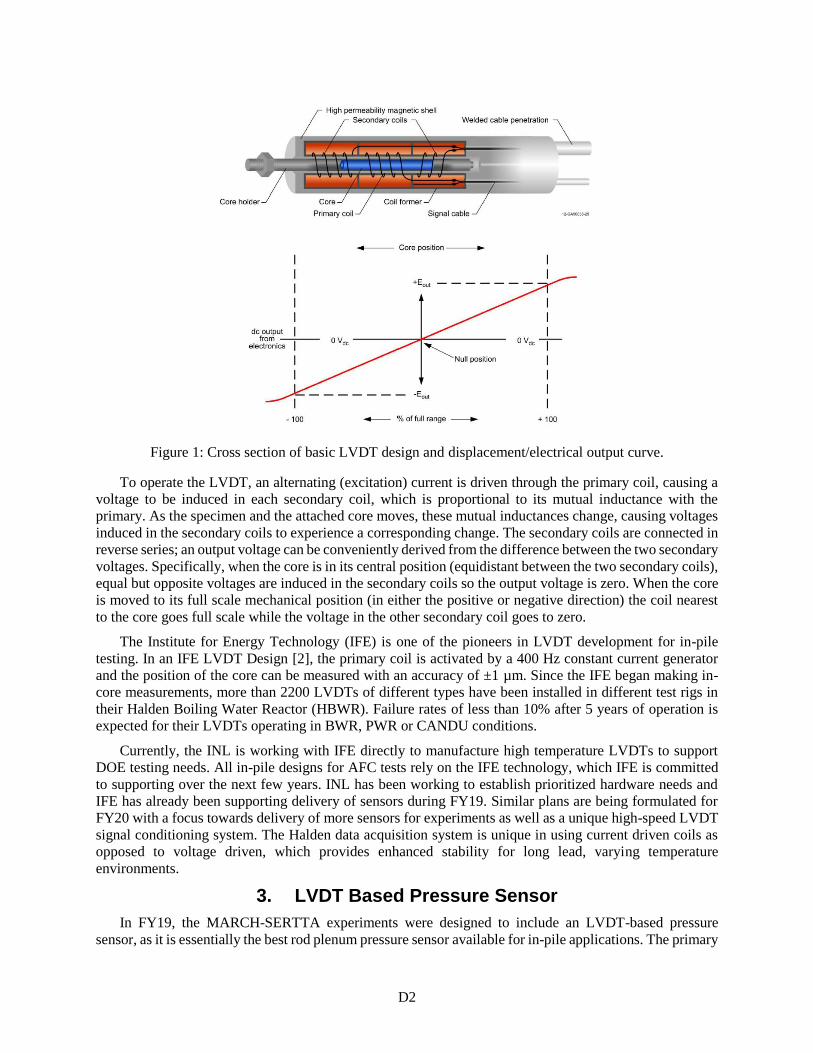
Figure 1: Cross section of basic LVDT design and displacement/electrical output curve.
To operate the LVDT, an alternating (excitation) current is driven through the primary coil, causing a
voltage to be induced in each secondary coil, which is proportional to its mutual inductance with the
primary. As the specimen and the attached core moves, these mutual inductances change, causing voltages
induced in the secondary coils to experience a corresponding change. The secondary coils are connected in
reverse series; an output voltage can be conveniently derived from the difference between the two secondary
voltages. Specifically, when the core is in its central position (equidistant between the two secondary coils),
equal but opposite voltages are induced in the secondary coils so the output voltage is zero. When the core
is moved to its full scale mechanical position (in either the positive or negative direction) the coil nearest
to the core goes full scale while the voltage in the other secondary coil goes to zero.
The Institute for Energy Technology (IFE) is one of the pioneers in LVDT development for in-pile
testing. In an IFE LVDT Design [2], the primary coil is activated by a 400 Hz constant current generator
and the position of the core can be measured with an accuracy of ±1 µm. Since the IFE began making in-
core measurements, more than 2200 LVDTs of different types have been installed in different test rigs in
their Halden Boiling Water Reactor (HBWR). Failure rates of less than 10% after 5 years of operation is
expected for their LVDTs operating in BWR, PWR or CANDU conditions.
Currently, the INL is working with IFE directly to manufacture high temperature LVDTs to support
DOE testing needs. All in-pile designs for AFC tests rely on the IFE technology, which IFE is committed
to supporting over the next few years. INL has been working to establish prioritized hardware needs and
IFE has already been supporting delivery of sensors during FY19. Similar plans are being formulated for
FY20 with a focus towards delivery of more sensors for experiments as well as a unique high-speed LVDT
signal conditioning system. The Halden data acquisition system is unique in using current driven coils as
opposed to voltage driven, which provides enhanced stability for long lead, varying temperature
environments.
3. LVDT Based Pressure Sensor
In FY19, the MARCH-SERTTA experiments were designed to include an LVDT-based pressure
sensor, as it is essentially the best rod plenum pressure sensor available for in-pile applications. The primary

D3
design activities for this work were planned under the ASI program. The specific deployment activities
related to final testing and capsule integration were funded under AFC. This sensor was designed by
welding a bellows assembly to the ferritic core of an LVDT. The bellows assembly is anchored to the
housing which contains the pressure, see Figure 1. Changes in pressure result in the expansion or contraction
of the bellows which then translates to core movement. The sensor housing is design to be welded directly
to fuel cladding. This design is documented in INL Drawing 818427 as part of the MARCH-SERTTA
testing to be conducted at the TREAT facility. The system was designed to operate from atmosphere to
1500 psia at temperatures ranging from 20 – 300°C and be able to resolve pressure changes less than 1 psi.
Figure 2. Pressure sensor components.
Testing of the pressure sensor was conducted over the temperature range of 20 – 300°C with pressure
ranging from 1 atm to 1500 psia. Figure 3 shows the fixture setup of the test at HTTL. Initially, drift was
observed during the testing. Discussion with the bellows manufacture resulted in a recommendation to
condition each bellows before use. The conditioning consisted of heating the bellows assembly to 280°C
@ 1600 psig and cycling the pressure 3 times. The conditioning alleviated the drift problem. The bellows
material was made from SS 321.
Figure 3 Testing of the pressure sensor in furnace at HTTL.

D4
Figure 4 shows the calibration data taken for the pressure sensor based on LVDT 1449. This data was
collected at 20°C. Statistical evaluation revealed standard deviation from the fitted pressure vs. LVDT
output,σ= 24 psi.
Figure 4 Calibration data for sensor based on LVDT 1449.
These pressure sensors are now under construction to support multiple MARCH-SERTTA experiment
during the next year. In-pile performance of the complete sensor assembly will be evaluated during the first
experiments. Separate in-pile performance evaluations for the Halden LVDTs are currently under way as
described in a following section.
4. Creep Test Rig
This work is primarily supported under ASI funding with applications focused on ATR. Creep testing
is not a priority application in TREAT. However, the following development testing is important to show
qualification of LVDT sensors and data acquisition under environments representative of TREAT
experiment vehicle applications as well. The creep test rig is based on a design developed for irradiation
test at the Halden Boiling Water Reactor (HBWR) in Norway [3]. INL HTTL researchers have completed
efforts to develop two types of in-pile creep test rigs for deployment in an ATR PWR loop; a static-load
creep test rig and variable-load creep test rig.
Both designs are comprised of several elements including a standard tensile specimen, a LVDT to
measure dimensional change, two different types of bellow assemblies, thermocouple (TC) holder, and a
support structure to maintain the experiment in an in-pile environment. The first bellow assembly is
designed to create static load that corresponds to the external pressure of the coolant in the reactor shown
in Figure 5 (a). The second bellow design allows variable strain rate during reactor testing shown in Figure
5 (b). Lastly, the fixture is designed to constrain the LVDT bellow assembly and one end of the specimen
so that bellows contraction will place the specimen in tension. Cables extending from the LVDT and TC
allow specimen temperature and elongation to be monitored during irradiation.

D5
Figure 5 – Two types of bellow assemblies: (a) static load creep test rig, (b) variable-load creep test rig.
Each LVDT requires a calibration that provides the means to relate any measured LVDT output
voltage to a corresponding displacement. Benchtop testing of the LVDT and bellow assemblies were
evaluated at room temperature, 100 C, 200 C, and 300 C shown in Figure 6 (a). Autoclave calibration
testing is much more complex than benchtop testing due to difficulties measuring the displacement inside
the autoclave. These difficulties were addressed through the design of a fixture (Figure 6 (b) item numbers
4 and 7) with positive mechanical stops to define the displacement accurately. Both calibrations are shown
in Figure 6.
Figure 6 – Calibration for creep test rig using (a) benchtop rig in a furnace and (b) autoclave.
The autoclave calibration fixture was assembled with the retaining nut tightened just enough to stretch
the bellows very slightly and pull the top of the travel limiting in the upper block connector into the contact
6
7 8 10
32
4 5
9
1
11
1. LVDT Leads; 2. LVDT; 3. Bellow; 4. Upper Block Connector; 5. Connecting Rod; 6. Frame;
7. Blocks (x2); 8. Upper Plate; 9. Spring; 10. Lower Plate; 11. SS Hex Nut + Washer
(a) (b)

D6
with the travel blocks. That provides the initial position of the LVDT for the autoclave testing, and as the
pressure increases the bellow compresses changing the LVDT output voltage. At some autoclave
pressure, the bellow will stop compressing due to the limiting travel blocks stopping the upper connector
movement that defines the final LVDT output voltage. The maximum movement of the bellow is 2.29
mm, which will relate to the final LVDT output voltage. Also, the maximum workable pressure range for
the autoclave is 2500 psia in DI water environment. Results from calibration tests at room temperature
and at 100 °C, 200 °C, 300 °C are summarized in Figure 7 for both furnace benchtop and autoclave
testing. The benchtop results had very little temperature effect; however, the sensitivity between the
benchtop and autoclave differ due to using two different ferritic cores with the same LVDT. Autoclave
testing only showed sensitivity variation at 300 °C, so further testing at elevated temperatures is required
to verify the DAS output. As seen in Figure 7, the Halden data acquisition system shows superior
performance with minimal effects from temperature. These water testing conditions are representative of
both ATR and TREAT testing needs.
Figure 7 – Calibration results from (a) benchtop and (b) autoclave
5. LVDT Static Test Assembly for TREAT
LVDTs have a long history of great in-pile performance in material test reactors around the world. In
particular, the Halden LVDTs are well known for great long term stability in irradiation testing
environments. Evaluation of performance in transient test reactor environments is less common with Halden
LVDTs only tested in the CABRI facility in France. Other facilities such as the Power Burst Facility in
Idaho and the Nuclear Safety Research Reactor (NSRR) have used LVDTs from other sources. Therefore,
the evaluation of LVDT performance under the unique high energy TREAT irradiation is an important
consideration in preparation and qualification. During FY19, a simple test article was designed, built and
irradiated in the TREAT facility to evaluate irradiation and specific facility effects on the sensor output [4].
A Halden LVDT obtained under a previous AFC project, serial number 1364, was fitted with a static
core and thermocouple. Figure 8 shows the hardware used in the TREAT testing. Figure 9 shows the Inconel
holder used to position the core in the LVDT coils (+/- 1 mm from the null position). The approximate
length of the holder was 70 mm. The LVDT core was dropped in the holder and then cemented at the top
using a high temperature ceramic cement to hold it in place. The thermocouple was welded to the holder
and the holder was welded to the LVDT coil body to make thermal contact with the LVDT body.
y = 1805.9x - 5608.6R² = 0.9999
-6000
-5000
-4000
-3000
-2000
-1000
0
0 0.5 1 1.5 2 2.5
LVD
T O
utp
ut
(mV
)
Position (mm)
y = -1788.6x - 5588R² = 1
-6000
-5000
-4000
-3000
-2000
-1000
0
-2.5 -2 -1.5 -1 -0.5 0
LVD
T O
utp
ut
(mV
)
Position (mm)
(a) (b)
Halden Box NI Crio 2010 System
20 1805.9 2118.2 1687
100 1810.2 2147.8
200 1808.2 2171.6
300 1811.6 2220.9
Temperature
[ºC]
Sensitivity [mV/mm]
Autoclave 2010 System
20 1788.6 1717.42
100 1783 1736.9
200 1790.8 1761.25
300 1821.4 1785.6
Temperature
[ºC]
Sensitivity [mV/mm]

D7
The assembly was placed in a coolant channel at TREAT and allowed for the collection of data during
ongoing transient irradiations of other experiments at TREAT [2].
Figure 8. Static LVDT assembly used in TREAT irradiation testing.
Figure 9. LVDT core and thermocouple holder.
Testing at TREAT has begun with preliminary data collected during transient irradiations presented in
Figure 10 – Figure 12. Given the preliminary nature of this data, an in-depth discussion will not be
presented in this document but will be subject of continued study and reporting along with data received
from sensors that will be part of the MARCH-SERTTA irradiations happening in TREAT later this year.

D8
Figure 10 LVDT and temperature response during TREAT test MIMIC-N TL-1.
Figure 11 LVDT and temperature response during TREAT test MIMIC-N TL-2.
0
5
10
15
20
25
30
35
40
3.06
3.08
3.1
3.12
3.14
3.16
3.18
3.2
0 10000 20000 30000 40000 50000 60000 70000
Tem
per
atu
re (
°C)
LVD
T (V
)
Time (ms)
MIMIC-N TL-1 (1.8%)
Dewetron LVDT Dewetron Temperature
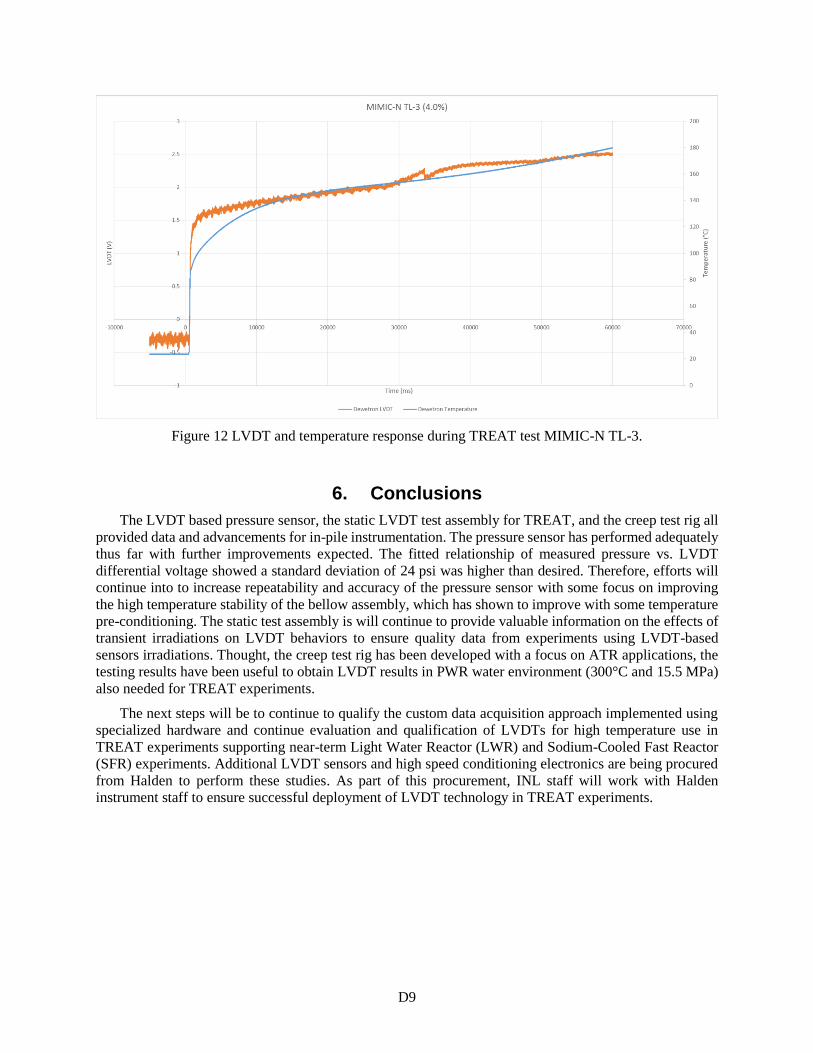
D9
Figure 12 LVDT and temperature response during TREAT test MIMIC-N TL-3.
6. Conclusions
The LVDT based pressure sensor, the static LVDT test assembly for TREAT, and the creep test rig all
provided data and advancements for in-pile instrumentation. The pressure sensor has performed adequately
thus far with further improvements expected. The fitted relationship of measured pressure vs. LVDT
differential voltage showed a standard deviation of 24 psi was higher than desired. Therefore, efforts will
continue into to increase repeatability and accuracy of the pressure sensor with some focus on improving
the high temperature stability of the bellow assembly, which has shown to improve with some temperature
pre-conditioning. The static test assembly is will continue to provide valuable information on the effects of
transient irradiations on LVDT behaviors to ensure quality data from experiments using LVDT-based
sensors irradiations. Thought, the creep test rig has been developed with a focus on ATR applications, the
testing results have been useful to obtain LVDT results in PWR water environment (300°C and 15.5 MPa)
also needed for TREAT experiments.
The next steps will be to continue to qualify the custom data acquisition approach implemented using
specialized hardware and continue evaluation and qualification of LVDTs for high temperature use in
TREAT experiments supporting near-term Light Water Reactor (LWR) and Sodium-Cooled Fast Reactor
(SFR) experiments. Additional LVDT sensors and high speed conditioning electronics are being procured
from Halden to perform these studies. As part of this procurement, INL staff will work with Halden
instrument staff to ensure successful deployment of LVDT technology in TREAT experiments.

D10
7. References
[1] Jensen, C., et al., “FY18 Report for Instrumentation Development for the Transient Testing
Program,” INL/EXT-18-515613, September 2018.
[2] Solstad, S., and R. V. Nieuwenhove, “Instrument Capabilities and Developments at the Halden
Reactor Project,” Proceedings of the ANS NPIC HMIT 2009 Topical Meeting on Nuclear Plant
Instrumentation, Controls, and Human Machine Interface Technology, Knoxville, TN, April
2009.
[3] Davis, K. L., et al. “Design and Laboratory Evaluation of Future Elongation and Diameter
Measurements at the Advanced Test Reactor.” Taylor & Francis,
www.tandfonline.com/doi/abs/10.13182/NT14-60.
[4] INL Document, “FY19-FY20 TREAT Advanced Instrumentation Deployment,” INL document
DP-148, August 2019.

Ei
Appendix E
Deployment of Fast-Response Self-Powered Neutron Detectors in TREAT
2019 Annual Report
K. Tsai, C. Jensen
Idaho National Laboratory

Eii
Table of Contents
1. Introduction ........................................................................................................................................ 1
2. Approach ............................................................................................................................................ 1
3. Results ................................................................................................................................................ 2
3.1 ATF-SETH (Phase 1) Transients ............................................................................................. 3
3.2 Transient Prescription Tests ..................................................................................................... 4
3.3 MIMIC-N Transients ............................................................................................................... 5
3.4 ATF-SETH (Phase 2) ............................................................................................................... 6
3.5 SIRIUS Tests............................................................................................................................ 7
3.6 M-SERTTA .............................................................................................................................. 8
4. Uncertainties in Electronics ................................................................................................................ 9
5. Gd-SPND Burnup and Sensitivity .................................................................................................... 10
6. Summary and Conclusions ............................................................................................................... 11
7. References ........................................................................................................................................ 11

E1
1. Introduction
Specialized fast-response Self-Powered Neutron Detectors (SPNDs)—utilizing Gadolinium and
Hafnium emitters—have a long history of R&D as an in-core flux measurements sensor and were
historically tested at TREAT to directly measure transient neutron flux in-core [1]. Fast-response SPNDs
generates its electrical current signal with prompt response proportional to the neutron flux and are only
limited to the rise-time of the ex-core electronics [1, 2]. Therefore, the fast-response SPNDs are capable of
providing real-time, in-core neutron flux measurements during transient operations under the target of < 1
ms time resolution.
The same SPNDs used in the historical TREAT study were refurbished and reinserted into TREAT in
2018 to establish this measurement capability. The 2018 deployment showed that the same SPNDs
continued to demonstrate excellent performance in its present deployment [3]. These successful
deployments of the legacy SPNDs played a key role in its adoption within another program in early FY19—
the Advanced Sensors & Instrumentation (ASI) program—whose recently established goals are to establish
procurement routes, calibration procedures, and characterization analysis for SPNDs. With much of the
sensor developmental and qualification work being adopted under ASI in FY19, the remaining SPND work
within this program is to continue taking supplementary data of the deployed legacy SPND alongside other
TREAT in-pile sensors. This document focuses on the flux measurements provided by the legacy SPNDs
in FY19.
2. Approach
Since its initial deployment in FY18, the same SPNDs have continued to remain in TREAT cooling
channels with only a few changes. Table 1 details the SPND used in the cooling channel. The timeline of
each SPND continuing from FY18 in deployment in TREAT are given in Figure 1. TREAT core location
naming convention is shown in Figure 2. While each SPND deployed may not be measured for all
experiments due to malfunction or lack of readout equipment, all SPNDs are still tracked for total fluence
experienced.
All three SPNDs were inserted to a depth of 51 inches below the top of the fuel assembly—the
approximate mid-axial height of the core. SPND electrical current measurements were taken using a Data
Acquisition System (DAS) in the Experimenter’s Room via electrometers (a Keysight B2985A, a Keithley
6517B, and a two Keithley 6482).
Table 1. List of reinserted SPNDs with associated identification number and location in the TREAT core.
SPND (Emitter) ID* Location
Hafnium (Hf) SP2 L-10-3
Hafnium (Hf) SP3 (07/03/18) R-10-4 → (06/27/19) L-10-3
Gadolinium (Gd) SP6 R-10-1
* The SPND and Identification number is the same as reported in [1].

E2
Figure 2. (Left) TREAT core assembly map. (Right) Cooling channel numbering system around fuel
assembly location R-10.
3. Results
The deployed SPNDs were used to perform neutron flux measurements in TREAT transients during
operations for experiments. Due to malfunction and/or limited availability of electrometers, not all SPNDs
were measured simultaneously. Table 2 provides the lists of transients/operations and the SPNDs used. The
transients are separated by experimental groups and will be presented in the following sub-sections.
`
123456789
10111213141516171819
A B C D E F G H J K L M N O P R S T U
T C
C
C
C
T T
T
T
T T
T
CS
CSCS
CS
CS
CS CS
CS
Fuel assemblies with surrounding coolant channels of interest
M8-CAL vehicle hole
N
SPNDExperiment
R-10P-10
S-9P-9
P-11 R-11 S-11
S-10
R-9
R-10-1 R-10-2
R-10-3 R-10-4
Figure 1. SPND deployment timeline in FY19.

E3
3.1 ATF-SETH (Phase 1) Transients
The first set of transients measured by SPNDs were during the Accident Tolerant Fuels-Separate Effect
Test Holder (ATF-SETH) experiment. The experiment aims to establish a baseline specimen behavior of
the irradiated specimen for future tests (see section 3.4 ATF-SETH Phase 2). These transients are based on
stepped reactivity insertion (pulse type) transients and clipped to a predetermined energy. The flux
measured by SPNDs during these transients are given in Figure 3.
Table 2. List of FY19 transients in chronological order and SPNDs used. Experiment Series Transient Name Description SP2 SP31 SP6
ATF-SETH
(Phase 1)
SETH-A 0.6% k/k insertion (clipped) X X
SETH-B-1 0.6% k/k insertion (clipped) X X
SETH-B-1-R2 0.6% k/k insertion (clipped) X X
SETH-B-21 1.15% k/k insertion (clipped) X X
SETH-C1 1.15% k/k insertion (clipped) X
SETH-D 1.15% k/k insertion (clipped) X
SETH-E 1.15% k/k insertion (clipped) X
Transient
Prescription Tests
Extended LOCA 25MW flattop, reduce to 2.5 MW X
Extended LOCA 25MW flattop, reduce to 2.5 MW X
UTOP-Long linear ramp 0 to 15 to 25 to 0 MW X
MIMIC-N
TL-1 1.8% k/k insertion X3
TL-2 3.0% k/k insertion X3
TL-3 4.0% k/k insertion X3
M-SERTTA trial 1.8% k/k insertion (clipped) X3
SIRIUS-Cal trial 0.6% k/k insertion (clipped) X3
SIRIUS 50% trial Shaped transient X3
SIRIUS 100% trial Shaped transient
ATF-SETH
(Phase 2)
SETH-F0 1.7% k/k insertion (clipped)
SETH-F1 4.0% k/k insertion (clipped) X
SETH-F2 4.0% k/k insertion (clipped) X X
SETH-G 4.0% k/k insertion (clipped) X X
SIRIUS
SIRIUS Cal 0.6% k/k insertion (clipped) X X
SIRIUS 50% Shaped transient X X
SIRIUS 100% Shaped transient X X
MARCH-SERTTA M-SERTTA Cal 1.8% k/k insertion (clipped) X X 1 The transient was performed twice: 1 as a trial with a nuclear equivalent device (2) with the experiment. 2 no calibration was available. SP2’s calibration was used instead. 3 only the emitter cable was recorded
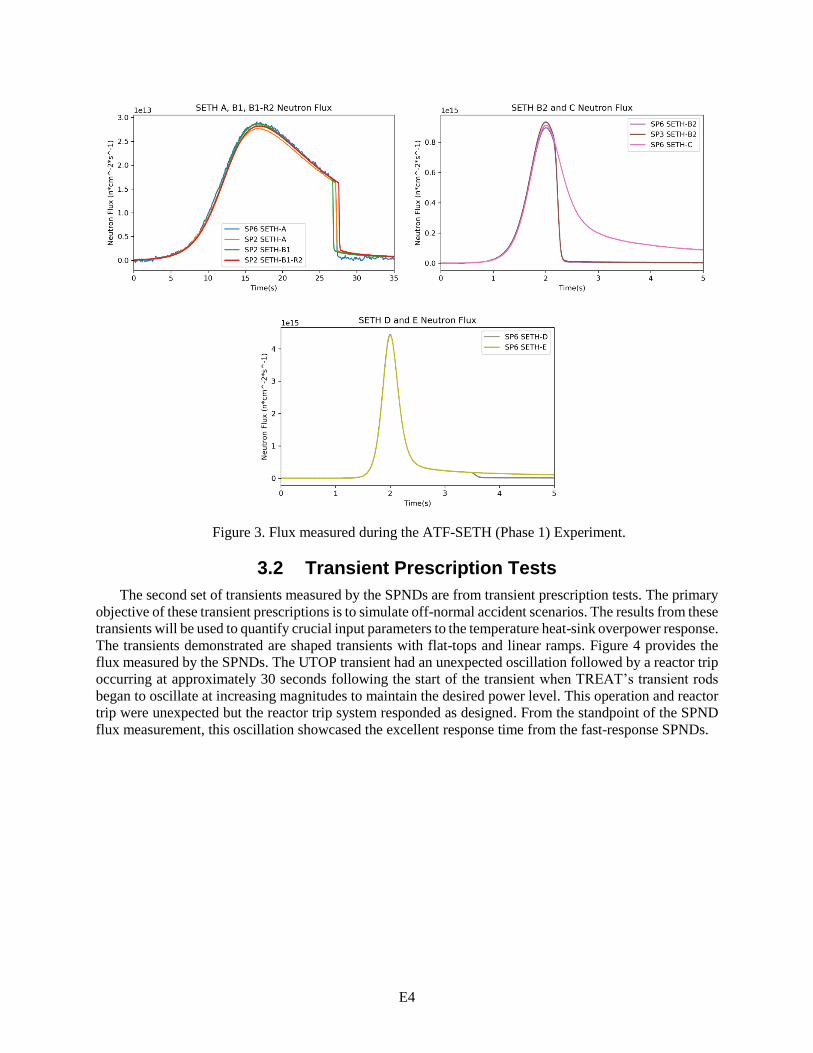
E4
3.2 Transient Prescription Tests
The second set of transients measured by the SPNDs are from transient prescription tests. The primary
objective of these transient prescriptions is to simulate off-normal accident scenarios. The results from these
transients will be used to quantify crucial input parameters to the temperature heat-sink overpower response.
The transients demonstrated are shaped transients with flat-tops and linear ramps. Figure 4 provides the
flux measured by the SPNDs. The UTOP transient had an unexpected oscillation followed by a reactor trip
occurring at approximately 30 seconds following the start of the transient when TREAT’s transient rods
began to oscillate at increasing magnitudes to maintain the desired power level. This operation and reactor
trip were unexpected but the reactor trip system responded as designed. From the standpoint of the SPND
flux measurement, this oscillation showcased the excellent response time from the fast-response SPNDs.
Figure 3. Flux measured during the ATF-SETH (Phase 1) Experiment.

E5
3.3 MIMIC-N Transients
The third set of transients measured by the SPNDs are from the Materials and Instruments Modular
Irradiation Capability—for Neutron sensors (MIMIC-N). The objective of this test is to benchmark several
neutron sensors in the TREAT core center position. Additionally, core reconfiguration/characterization
transients (TL-1, -2, -3) performed included here. The transients prescribed in this test also doubles as trial
transients for future experiments; as such, the transients demonstrated here are a combination of pulse
transients clipped to a predetermined energy (except for temperature limited, non-clipped, transients for
core characterization transients) and shaped transients. Figure 5 provides the flux measurements made
during the MIMIC-N tests. Flux measurements from the TL-3 transient was clipped due to an incorrect
calibration range.
Figure 4. Flux measured during the Transient Prescription Tests.
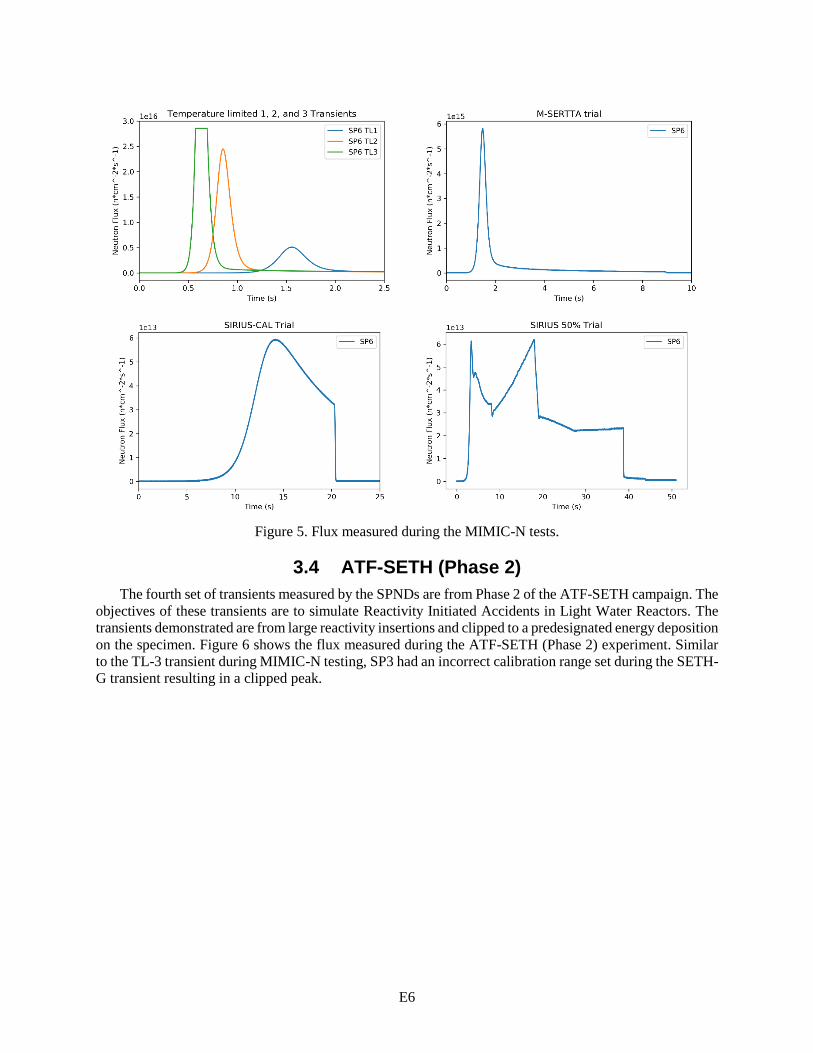
E6
3.4 ATF-SETH (Phase 2)
The fourth set of transients measured by the SPNDs are from Phase 2 of the ATF-SETH campaign. The
objectives of these transients are to simulate Reactivity Initiated Accidents in Light Water Reactors. The
transients demonstrated are from large reactivity insertions and clipped to a predesignated energy deposition
on the specimen. Figure 6 shows the flux measured during the ATF-SETH (Phase 2) experiment. Similar
to the TL-3 transient during MIMIC-N testing, SP3 had an incorrect calibration range set during the SETH-
G transient resulting in a clipped peak.
Figure 5. Flux measured during the MIMIC-N tests.

E7
3.5 SIRIUS Tests
The fifth set of transients measured by the SPNDs are from the SIRIUS experiment aiming to test the
performance of nuclear thermal propulsion (NTP) fuels when subjected to temperature ramp rates that are
prototypical of NTP system startup. These transients consist of a calibration transient—small pulse transient
clipped to a predetermined energy, followed by two types of shaped transients, one at half-power (50%)
and one at full power (100%). Figure 7 provides the flux measured during the SIRIUS experiment. Once
more, the clipped peak from SP3 during the SIRIUS-CAL transient was due to an incorrect calibration
range. The difference in flux measured by SP6 and SP3 in the SIRIUS-100% transient was due to delayed
response from SP6 previously explored in FY18 [3].
Figure 6. Flux measured during the ATF-SETH (Phase 2) experiment.

E8
3.6 M-SERTTA
The final set of transients measured by the SPNDs are from the MARCH-SERTTA campaign.
Presently, only the calorimetry transient has been performed. The flux measurement performed is given in
Figure 8.
Figure 7. Flux measured during the SIRIUS experiment.
Figure 8. Flux measured during the M-SERTTA experiment.

E9
4. Uncertainties in Electronics
A major contribution to SPND measurement uncertainties are from the electronics. To account for the
measurement uncertainties, the noise floor of two range settings were measured prior to transient start at
~zero power—20µA range, and 200nA range. The 20µA range setting reflects the typical higher operation
with pulses with reactor power up to ~5.5 GW. The 200 nA electrometer range settings reflect a typical low
power shaped transient operation with reactor power up to ~55 MW.
A histogram plot of the noise floor measured is given in Figure 9. The noise measurements indicate a
normal distribution, as expected of random noise. The plots of the average and 1 standard deviation is given
in Figure 10. These measurements indicate an offset and variation of +0.023 ± 0.006 % of the maximum
range in the 20µA range and +0.012 ± 0.015% of the maximum range in the 200nA range.
Figure 9. Histogram plot of noise floor for various TREAT transient irradiations.

E10
5. Gd-SPND Burnup and Sensitivity
Fast-response SPNDs generate its signal current from neutron capture gamma-particle Compton
scattering (n, γ, ece) and photoelectric effects (n, γ, epe) in the emitter. Since the signal is generated through
a two-part interaction, the efficiency of interaction to signal generation is very low. One method to
compensate for the decreased efficiency is to have an emitter material with a large neutron capture cross-
section (hence gadolinium). However, as a tradeoff for increased sensitivity, the Gd-SPND will experience
faster burnup. To study the effects of burnup, the Gd-SPND sensitivity plot (signal vs reactor power) is
generated for four transients of similar magnitude—TL1 (09/10/18), TL1 (07/16/19), M-SERTTA trial, and
MSERTTA CAL. Sensitivity plots are given in Figure 11.
Figure 10. Noise floor average plots with 1 standard deviation.
0
0.001
0.002
0.003
0.004
0.005
0.006
0.007
TL1 TL2 TL3
Cu
rren
t (µ
A)
20 µA Range Noise Floor
-0.02
-0.01
0
0.01
0.02
0.03
0.04
0.05
0.06
0.07
SIRIUS CAL SIRIUS 50% SIRIUS 100%
Cu
rren
t (n
A)
200 nA Range Noise Floor

E11
Given by the linear regression line of the sensitivity plot, there does not seem to be a significant
difference in sensitivity between each separate transient. This holds true even for the TL1 transient
performed on 09/10/18 when compared to the TL1 transient performed on 07/16/19 despite having 14
different transients totaling ~15GJ of energy or 7.8e16 of neutron fluence.
6. Summary and Conclusions
The fast-response SPNDs deployed during 2018 have continued to remain at TREAT providing
supplementary flux measurements alongside other in-pile sensors being simultaneously tested. This report
presents the flux measurements made from the legacy SPNDs throughout FY19. These SPNDs continues
to demonstrate excellent performance through several experimental campaigns boasting extremely low
signal noise without reduction in sensitivity allowing high precision measurements of neutron flux. The
final steps of the SPND developmental and qualification work (including calibration) has been adopted by
i2 in FY19-FY20—this will include calibration methods to enable accurate flux measurements of newly
fabricated SPNDs. These legacy SPNDs will continue to remain deployed in TREAT in support of future
experiments and testing as a neutron flux reference to other measurements made in TREAT.
7. References
[1] G. R. IMEL, P.R. HART, “The performance of hafnium and gadolinium self-powered neutron detectors
in the TREAT reactor,” Nuclear Instruments and Methods in Physics Research B, 111, pp. 325-336
(1996).
[2] H. D. WARREN, N.H. SHAH, “Neutron and Gamma-Ray Effects on Self-Powered In-Core Radiation
Detectors,” Nuclear Science and Engineering, 54:4, pp. 395-415 (1974).
[3] C. JENSEN, et al., “FY18 Report for Instrumentation Development for the Transient Testing Program,”
INL/EXT-18-51613 (2018).
Figure 11. Sensitivity plot of Gd-SPND in transients: TL1 (09/10/18), TL1 (07/16/19), M-SERTTA Trial,
and M-SERTTA CAL.
y = 0.0029x + 0.0163R² = 0.9999
0
0.5
1
1.5
2
2.5
3
3.5
0 200 400 600 800 1000 1200
Cu
rren
t (µ
A)
Reactor Power (MW)
TL1 (09/10/18)
y = 0.0031x + 0.0052R² = 0.9999
0
0.5
1
1.5
2
2.5
3
3.5
4
0 200 400 600 800 1000 1200
Cu
rren
t (µ
A)
Reactor Power (MW)
TL1 (07/16/19)
y = 0.0032x + 0.0012R² = 0.9995
0
0.5
1
1.5
2
2.5
3
3.5
4
4.5
0 200 400 600 800 1000 1200 1400
Cu
rren
t (µ
A)
Reactor Power (MW)
M-SERTTA Trial
y = 0.0032x - 0.0017R² = 0.9998
-0.5
0
0.5
1
1.5
2
2.5
3
3.5
4
0 200 400 600 800 1000 1200 1400
Cu
rren
t (µ
A)
Reactor Power (MW)
M-SERTTA CAL