FY18 1H Results Presentation v18 - s3.amazonaws.com · 1H FY18 Highlights: ... Financial Summary:...
39
Financial Results Half year ended 31 December 2017 16 February 2018 ASX:SGM USOTC:SMSMY
Transcript of FY18 1H Results Presentation v18 - s3.amazonaws.com · 1H FY18 Highlights: ... Financial Summary:...
Financial ResultsHalf year ended 31 December 2017
16 February 2018
ASX:SGMUSOTC:SMSMY
Agenda
2
Results OverviewAlistair Field, Group CEO
Financial ResultsStephen Mikkelsen, Group CFO
Strategic Priorities & OutlookAlistair Field, Group CEO
Torch cutting former Tappan Zee Bridge - Albany, New York
1H FY18 Highlights:Increased earnings, net cash and return on capital
3
Continued growth in earnings and return on capital Underlying EBIT of $124 million, up 60% over prior half year Underlying NPAT of $81 million, up 36% over prior half year Underlying Return on Capital1 of 10.5%, on track to exceed full year target set in FY13
Lifting returns through internal initiatives $85 million in capex spent in 1H FY18, on budget with full year target 45% to 55% of total capex allocated to value-adding and high-return growth projects Internal initiatives expected to add $60 to $80 million to underlying EBIT by FY192
Strong balance sheet and improved dividend $390 million in net cash as at 31 December 2017 Interim dividend of 23 cents, 100% franked, up 15% over prior half year
1. Annualised Return on Capital = (Underling EBIT – Tax at effective tax rate of 30%) / (Net Assets + Net Debt)2. Increase over FY17 underlying EBIT
Financial Summary:Material improvement across all key metrics
4
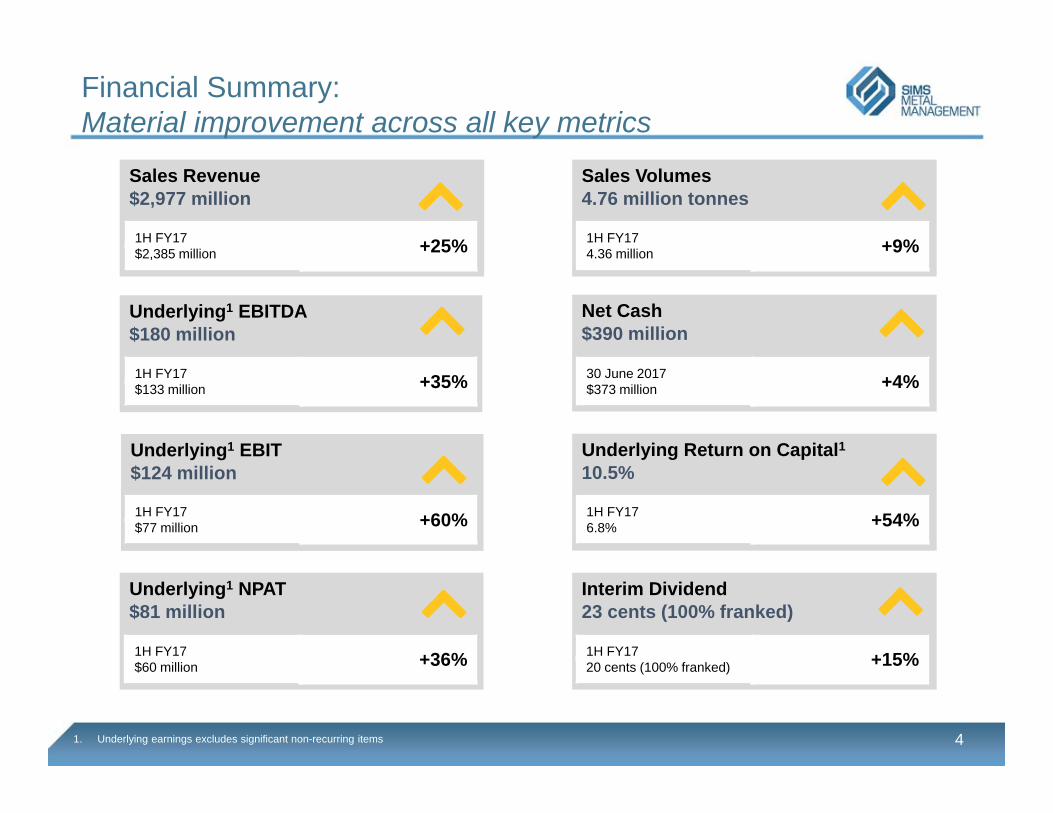
Sales Revenue$2,977 million
Underlying1 EBITDA$180 million
Underlying1 EBIT$124 million
Underlying Return on Capital110.5%
Underlying1 NPAT$81 million
Sales Volumes4.76 million tonnes
Net Cash$390 million
Interim Dividend23 cents (100% franked)
1. Underlying earnings excludes significant non-recurring items
1H FY17 +25%$2,385 million
1H FY17 +35%$133 million
1H FY17 +60%$77 million
1H FY17 +36%$60 million
1H FY17 +9%4.36 million
30 June 2017 +4%$373 million
1H FY17 +54%6.8%
1H FY17 +15%20 cents (100% franked)
3.3
2.8
2.2
1.51.3 1.2
0.0
0.5
1.0
1.5
2.0
2.5
3.0
3.5
Tota
l Rec
orda
ble
Inju
ry F
requ
ency
Rat
e (T
RIF
R)1
Safety performance
Employee Health & Safety:Safety remains our first priority
5
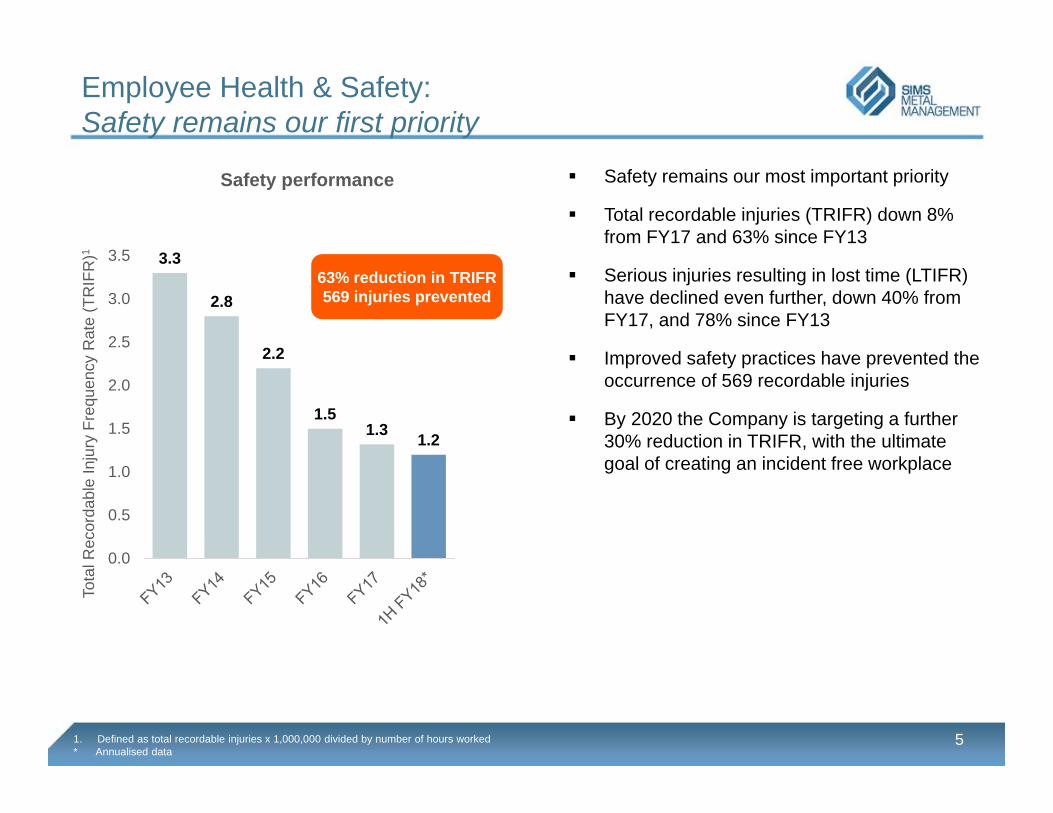
Safety remains our most important priority
Total recordable injuries (TRIFR) down 8% from FY17 and 63% since FY13
Serious injuries resulting in lost time (LTIFR) have declined even further, down 40% from FY17, and 78% since FY13
Improved safety practices have prevented the occurrence of 569 recordable injuries
By 2020 the Company is targeting a further 30% reduction in TRIFR, with the ultimate goal of creating an incident free workplace
63% reduction in TRIFR569 injuries prevented
1. Defined as total recordable injuries x 1,000,000 divided by number of hours worked* Annualised data
0.0
0.5
1.0
1.5
2.0
2.5
3.0
0
10
20
30
40
50
60
70
80
90
milli
on to
nnes
Und
erly
ing
EB
IT
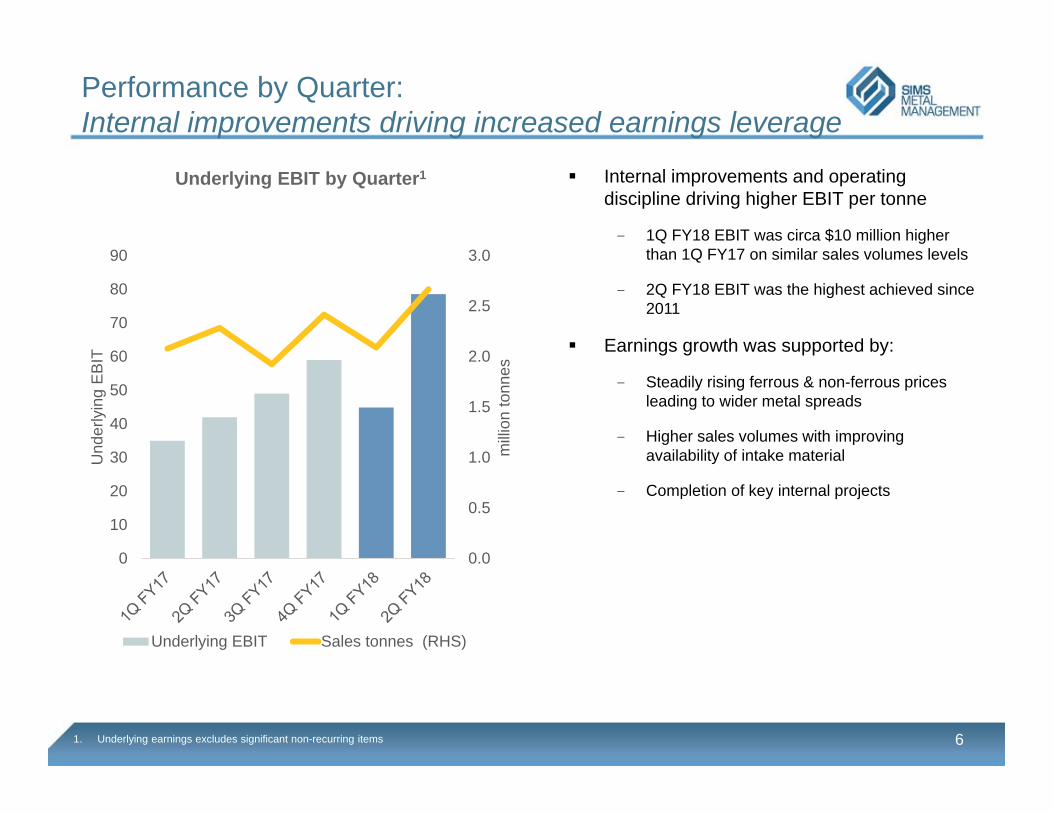
Underlying EBIT by Quarter1
Underlying EBIT Sales tonnes (RHS)
Performance by Quarter:Internal improvements driving increased earnings leverage
61. Underlying earnings excludes significant non-recurring items
Internal improvements and operating discipline driving higher EBIT per tonne
- 1Q FY18 EBIT was circa $10 million higher than 1Q FY17 on similar sales volumes levels
- 2Q FY18 EBIT was the highest achieved since 2011
Earnings growth was supported by:
- Steadily rising ferrous & non-ferrous prices leading to wider metal spreads
- Higher sales volumes with improving availability of intake material
- Completion of key internal projects
Performance by Business:North America and ANZ Metals leading earnings growth
7
Australia & New Zealand Metals Underlying EBIT of $44 million, up 71%
Sales volume growth of 3%, despite high prior half-year base
Intake volumes rose a more meaningful 13%, due to continued robust economic activity and improved collection economics from rising metal prices
Improved metal margins assisted by a positive sales mix towards non-ferrous volumes
North America Metals Underlying EBIT of $65 million, up 112%
Sales volume growth of 12% over the prior half-year, driven by strong export sales up 31%
Intake volumes rising supported by higher prices and broader based economic activity in the US
Rising volumes and higher metal prices supported wider metal margins across the supply chain
Meaningfully improved contribution from JV partners with underlying EBIT of $27 million, up 137%
Global E-Recycling Underlying EBIT of $7 million, down 41%
Better performance in the US, boosted by cost reductions and benefits from recent operational restructure
More than offset by negative margin pressure in Continental Europe
Europe Metals Underlying EBIT of $13 million, down 20%
Sales volume growth of 6%, supported by new deep-sea port facility in Southeast UK, opened in 1H FY18
Stronger sales volumes were more than offset by lower metal margins
1H FY18 also included a small adverse impact from two ferrous cargo sales pushed into 2H FY18
Joint Venture Performance:Leveraging the strengths of our joint venture partnerships
8
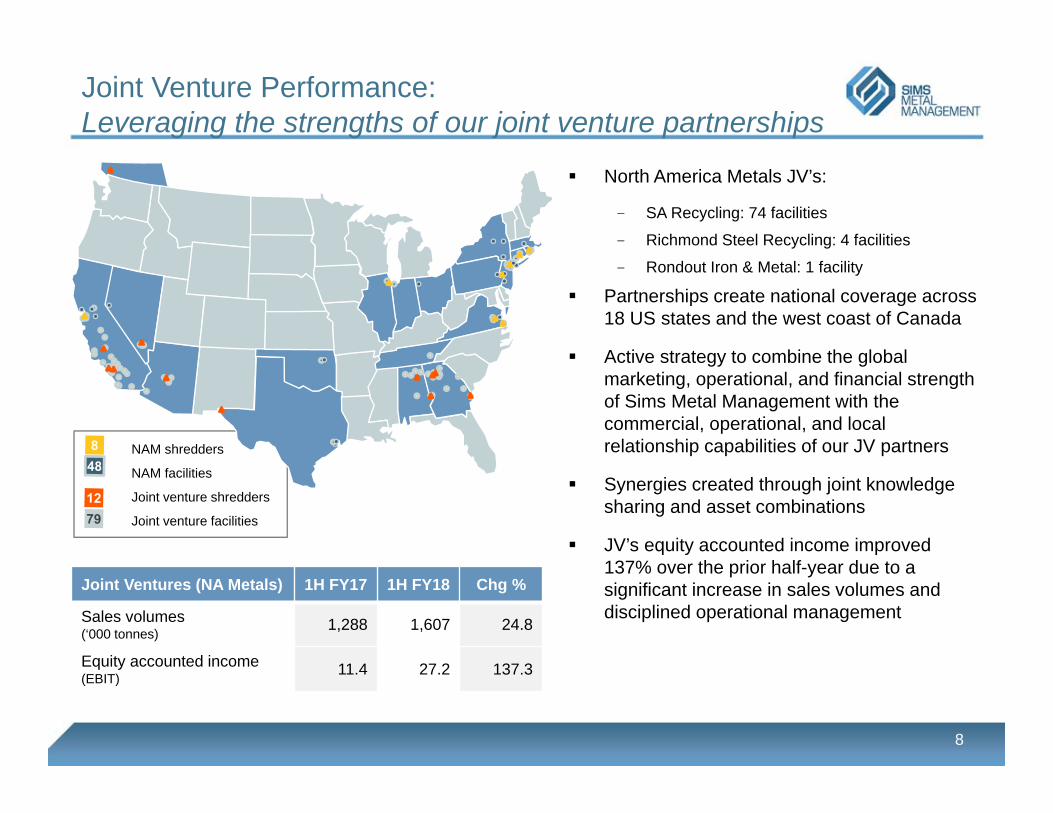
NAM shredders
NAM facilities
Joint venture shredders
Joint venture facilities
North America Metals JV’s:
- SA Recycling: 74 facilities
- Richmond Steel Recycling: 4 facilities
- Rondout Iron & Metal: 1 facility
Partnerships create national coverage across 18 US states and the west coast of Canada
Active strategy to combine the global marketing, operational, and financial strength of Sims Metal Management with the commercial, operational, and local relationship capabilities of our JV partners
Synergies created through joint knowledge sharing and asset combinations
JV’s equity accounted income improved 137% over the prior half-year due to a significant increase in sales volumes and disciplined operational management
Joint Ventures (NA Metals) 1H FY17 1H FY18 Chg %
Sales volumes(‘000 tonnes) 1,288 1,607 24.8
Equity accounted income (EBIT) 11.4 27.2 137.3
Financial ResultsStephen Mikkelsen, Group CFO
9
Positioned for Tomorrow
10
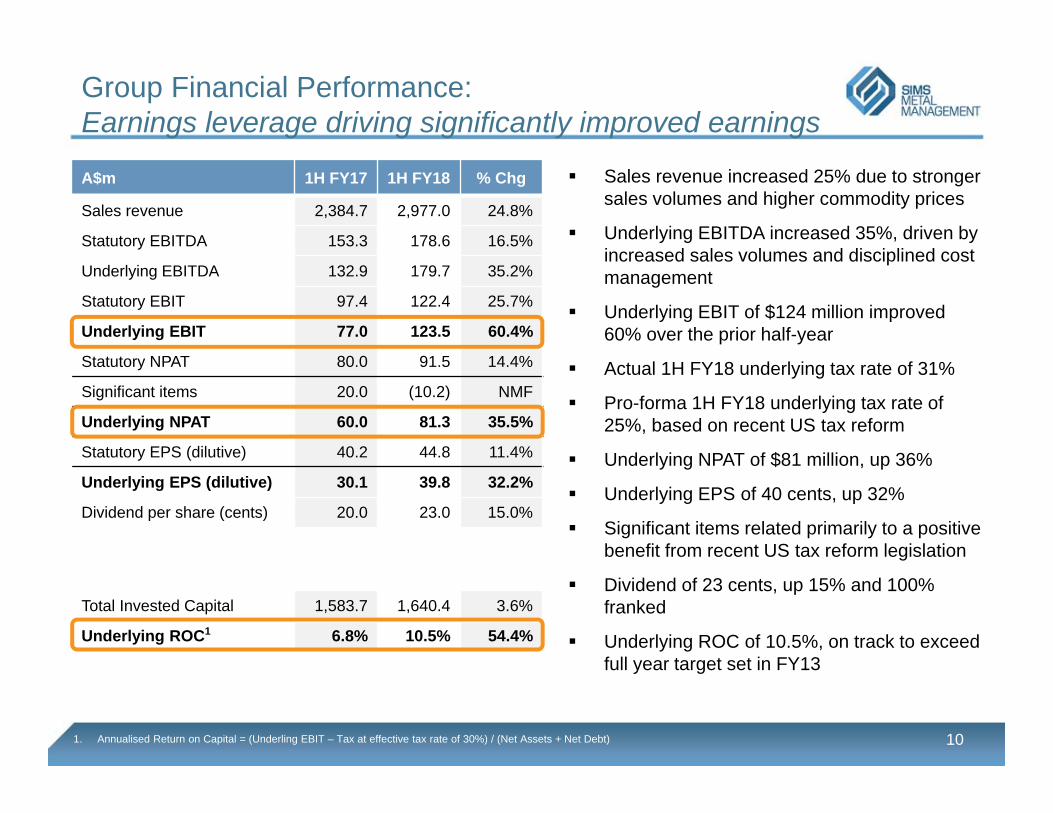
Sales revenue increased 25% due to stronger sales volumes and higher commodity prices
Underlying EBITDA increased 35%, driven by increased sales volumes and disciplined cost management
Underlying EBIT of $124 million improved 60% over the prior half-year
Actual 1H FY18 underlying tax rate of 31%
Pro-forma 1H FY18 underlying tax rate of 25%, based on recent US tax reform
Underlying NPAT of $81 million, up 36%
Underlying EPS of 40 cents, up 32%
Significant items related primarily to a positive benefit from recent US tax reform legislation
Dividend of 23 cents, up 15% and 100% franked
Underlying ROC of 10.5%, on track to exceed full year target set in FY13
Group Financial Performance:Earnings leverage driving significantly improved earnings
1. Annualised Return on Capital = (Underling EBIT – Tax at effective tax rate of 30%) / (Net Assets + Net Debt)
A$m 1H FY17 1H FY18 % Chg
Sales revenue 2,384.7 2,977.0 24.8%
Statutory EBITDA 153.3 178.6 16.5%
Underlying EBITDA 132.9 179.7 35.2%
Statutory EBIT 97.4 122.4 25.7%
Underlying EBIT 77.0 123.5 60.4%
Statutory NPAT 80.0 91.5 14.4%
Significant items 20.0 (10.2) NMF
Underlying NPAT 60.0 81.3 35.5%
Statutory EPS (dilutive) 40.2 44.8 11.4%
Underlying EPS (dilutive) 30.1 39.8 32.2%
Dividend per share (cents) 20.0 23.0 15.0%
Total Invested Capital 1,583.7 1,640.4 3.6%
Underlying ROC1 6.8% 10.5% 54.4%
Business Segment EBIT and Volumes:Improvement across both sales and intake volumes
11
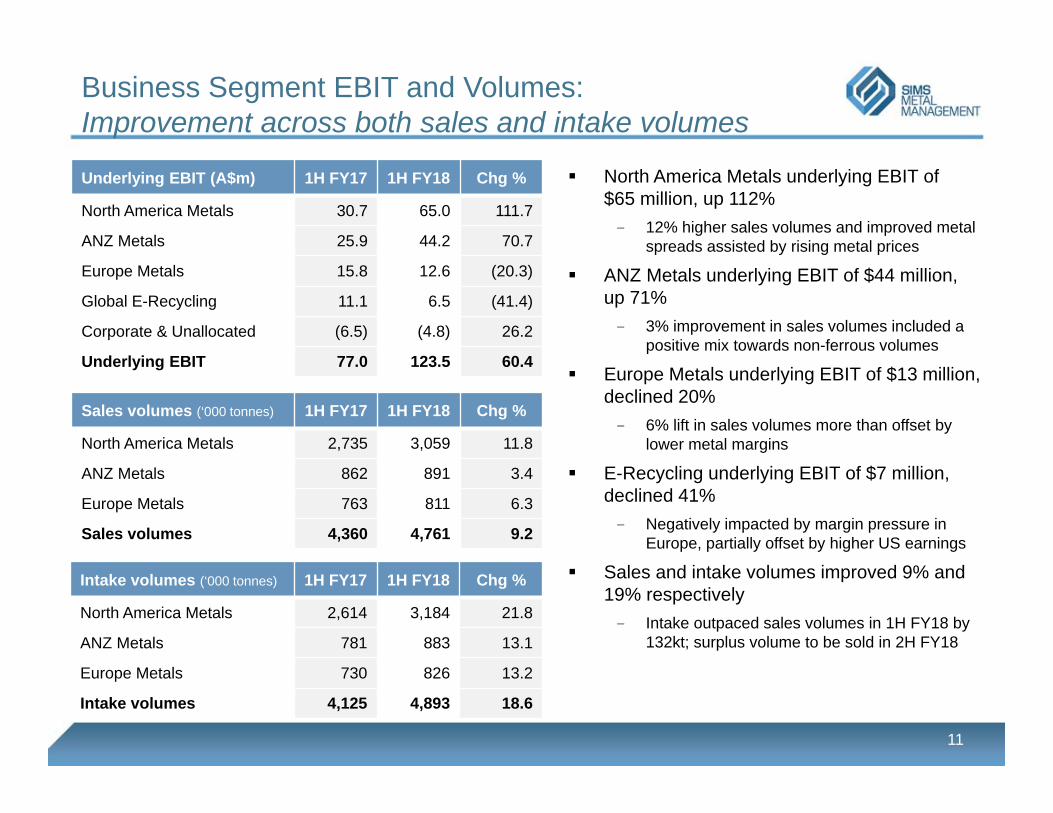
North America Metals underlying EBIT of $65 million, up 112%
- 12% higher sales volumes and improved metal spreads assisted by rising metal prices
ANZ Metals underlying EBIT of $44 million, up 71%
- 3% improvement in sales volumes included a positive mix towards non-ferrous volumes
Europe Metals underlying EBIT of $13 million, declined 20%
- 6% lift in sales volumes more than offset by lower metal margins
E-Recycling underlying EBIT of $7 million, declined 41%
- Negatively impacted by margin pressure in Europe, partially offset by higher US earnings
Sales and intake volumes improved 9% and 19% respectively
- Intake outpaced sales volumes in 1H FY18 by 132kt; surplus volume to be sold in 2H FY18
Underlying EBIT (A$m) 1H FY17 1H FY18 Chg %
North America Metals 30.7 65.0 111.7
ANZ Metals 25.9 44.2 70.7
Europe Metals 15.8 12.6 (20.3)
Global E-Recycling 11.1 6.5 (41.4)
Corporate & Unallocated (6.5) (4.8) 26.2
Underlying EBIT 77.0 123.5 60.4
Sales volumes (‘000 tonnes) 1H FY17 1H FY18 Chg %
North America Metals 2,735 3,059 11.8
ANZ Metals 862 891 3.4
Europe Metals 763 811 6.3
Sales volumes 4,360 4,761 9.2
Intake volumes (‘000 tonnes) 1H FY17 1H FY18 Chg %
North America Metals 2,614 3,184 21.8
ANZ Metals 781 883 13.1
Europe Metals 730 826 13.2
Intake volumes 4,125 4,893 18.6
Product Segment Sales Volumes & Revenue:Strong growth in ferrous metals
12
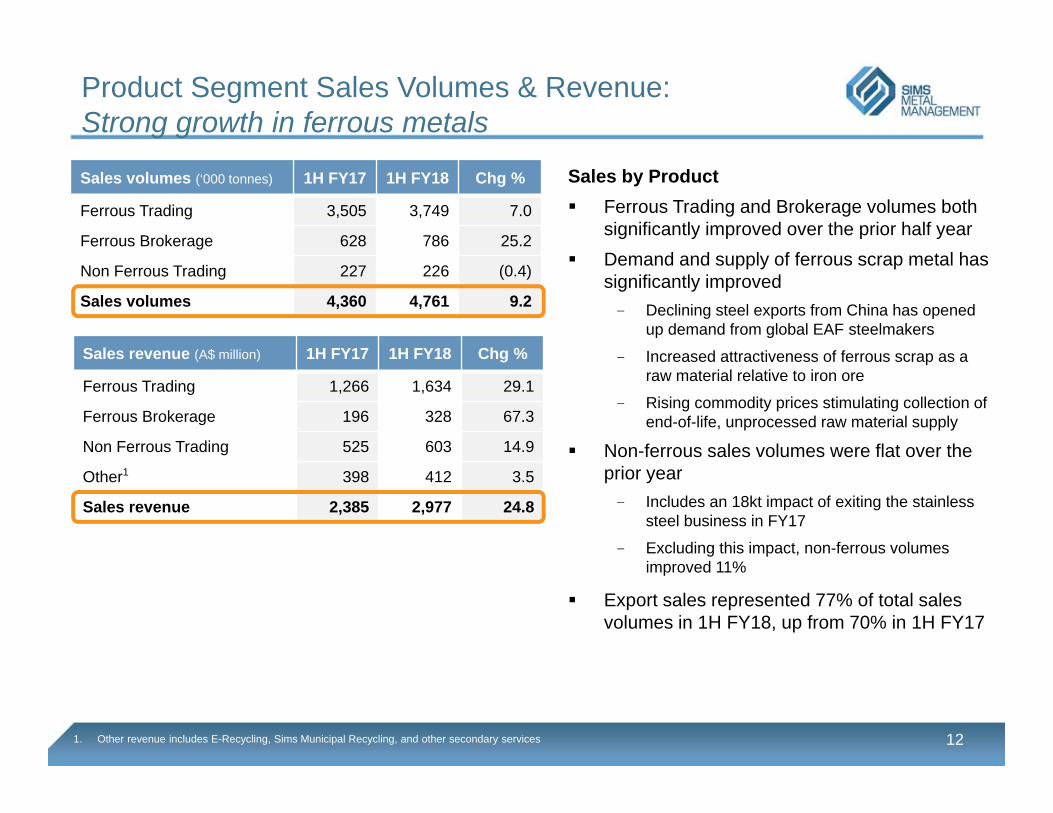
Sales by Product Ferrous Trading and Brokerage volumes both
significantly improved over the prior half year Demand and supply of ferrous scrap metal has
significantly improved- Declining steel exports from China has opened
up demand from global EAF steelmakers
- Increased attractiveness of ferrous scrap as a raw material relative to iron ore
- Rising commodity prices stimulating collection of end-of-life, unprocessed raw material supply
Non-ferrous sales volumes were flat over the prior year
- Includes an 18kt impact of exiting the stainless steel business in FY17
- Excluding this impact, non-ferrous volumes improved 11%
Export sales represented 77% of total sales volumes in 1H FY18, up from 70% in 1H FY17
Sales volumes (‘000 tonnes) 1H FY17 1H FY18 Chg %
Ferrous Trading 3,505 3,749 7.0
Ferrous Brokerage 628 786 25.2
Non Ferrous Trading 227 226 (0.4)
Sales volumes 4,360 4,761 9.2
Sales revenue (A$ million) 1H FY17 1H FY18 Chg %
Ferrous Trading 1,266 1,634 29.1
Ferrous Brokerage 196 328 67.3
Non Ferrous Trading 525 603 14.9
Other1 398 412 3.5
Sales revenue 2,385 2,977 24.8
1. Other revenue includes E-Recycling, Sims Municipal Recycling, and other secondary services
13
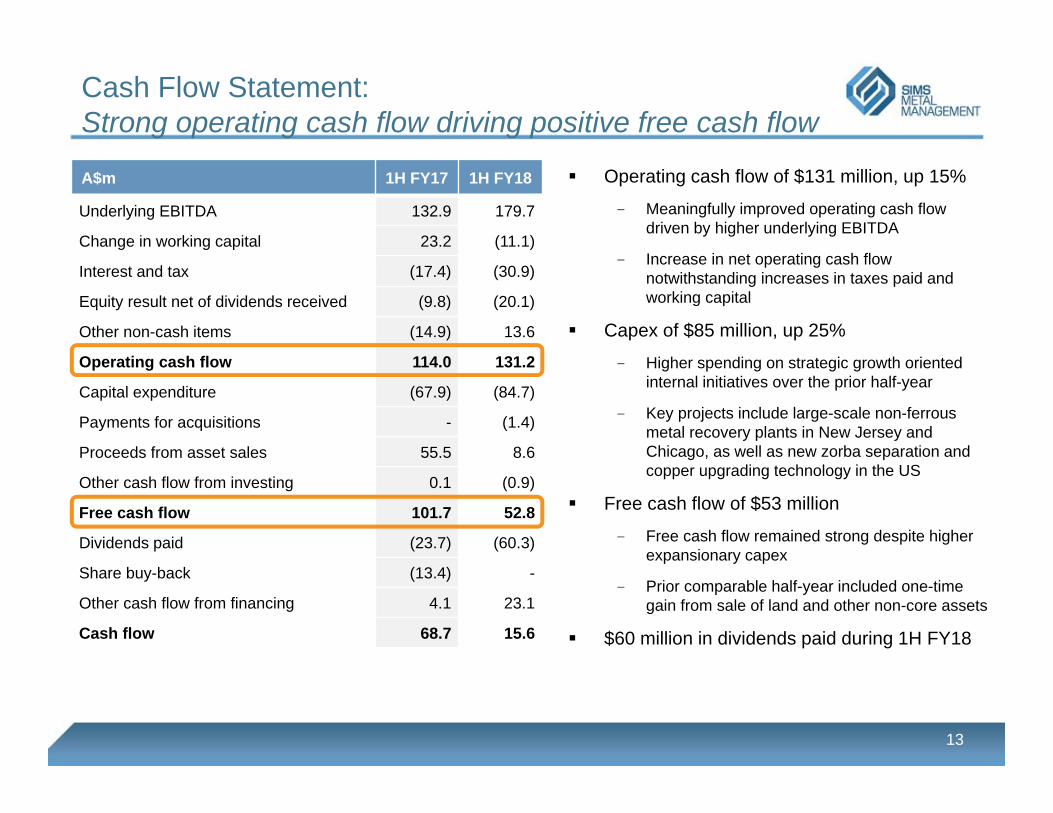
Operating cash flow of $131 million, up 15%
- Meaningfully improved operating cash flow driven by higher underlying EBITDA
- Increase in net operating cash flow notwithstanding increases in taxes paid and working capital
Capex of $85 million, up 25%
- Higher spending on strategic growth oriented internal initiatives over the prior half-year
- Key projects include large-scale non-ferrous metal recovery plants in New Jersey and Chicago, as well as new zorba separation and copper upgrading technology in the US
Free cash flow of $53 million
- Free cash flow remained strong despite higher expansionary capex
- Prior comparable half-year included one-time gain from sale of land and other non-core assets
$60 million in dividends paid during 1H FY18
Cash Flow Statement:Strong operating cash flow driving positive free cash flow
A$m 1H FY17 1H FY18
Underlying EBITDA 132.9 179.7
Change in working capital 23.2 (11.1)
Interest and tax (17.4) (30.9)
Equity result net of dividends received (9.8) (20.1)
Other non-cash items (14.9) 13.6
Operating cash flow 114.0 131.2
Capital expenditure (67.9) (84.7)
Payments for acquisitions - (1.4)
Proceeds from asset sales 55.5 8.6
Other cash flow from investing 0.1 (0.9)
Free cash flow 101.7 52.8
Dividends paid (23.7) (60.3)
Share buy-back (13.4) -
Other cash flow from financing 4.1 23.1
Cash flow 68.7 15.6
Capital Expenditure:Directing capital spending to internal growth initiatives
14
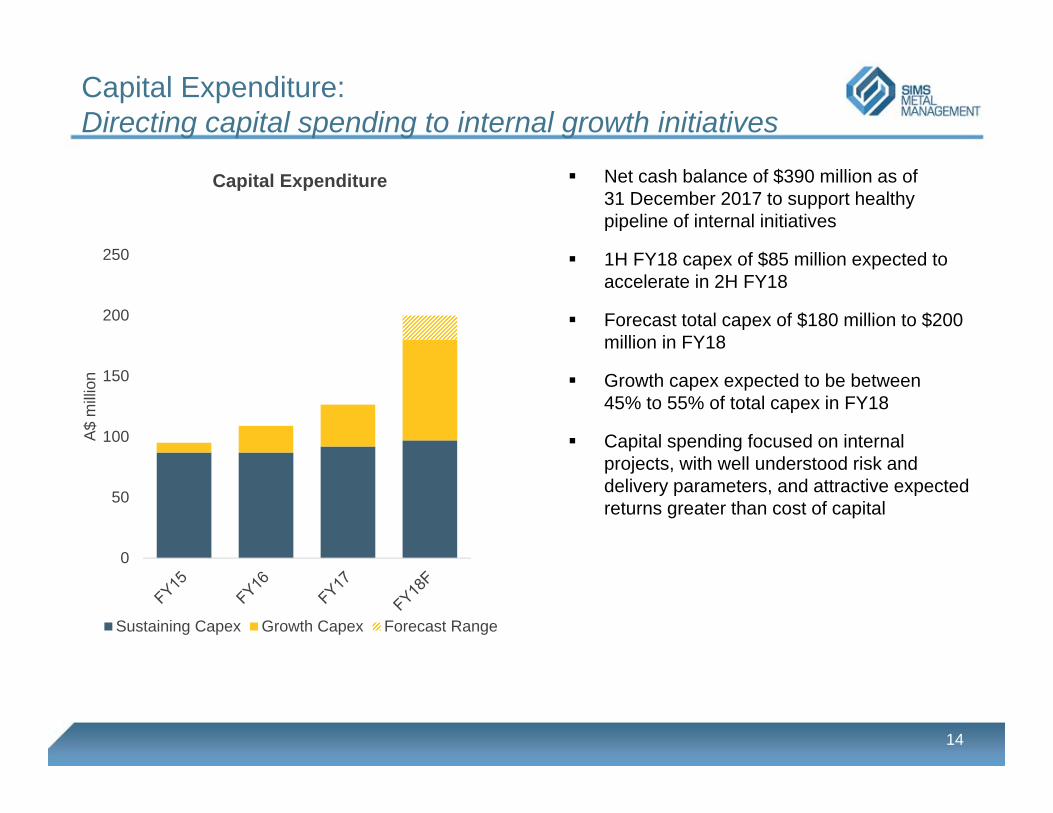
Net cash balance of $390 million as of 31 December 2017 to support healthy pipeline of internal initiatives
1H FY18 capex of $85 million expected to accelerate in 2H FY18
Forecast total capex of $180 million to $200 million in FY18
Growth capex expected to be between 45% to 55% of total capex in FY18
Capital spending focused on internal projects, with well understood risk and delivery parameters, and attractive expected returns greater than cost of capital
0
50
100
150
200
250
A$
milli
on
Capital Expenditure
Sustaining Capex Growth Capex Forecast Range
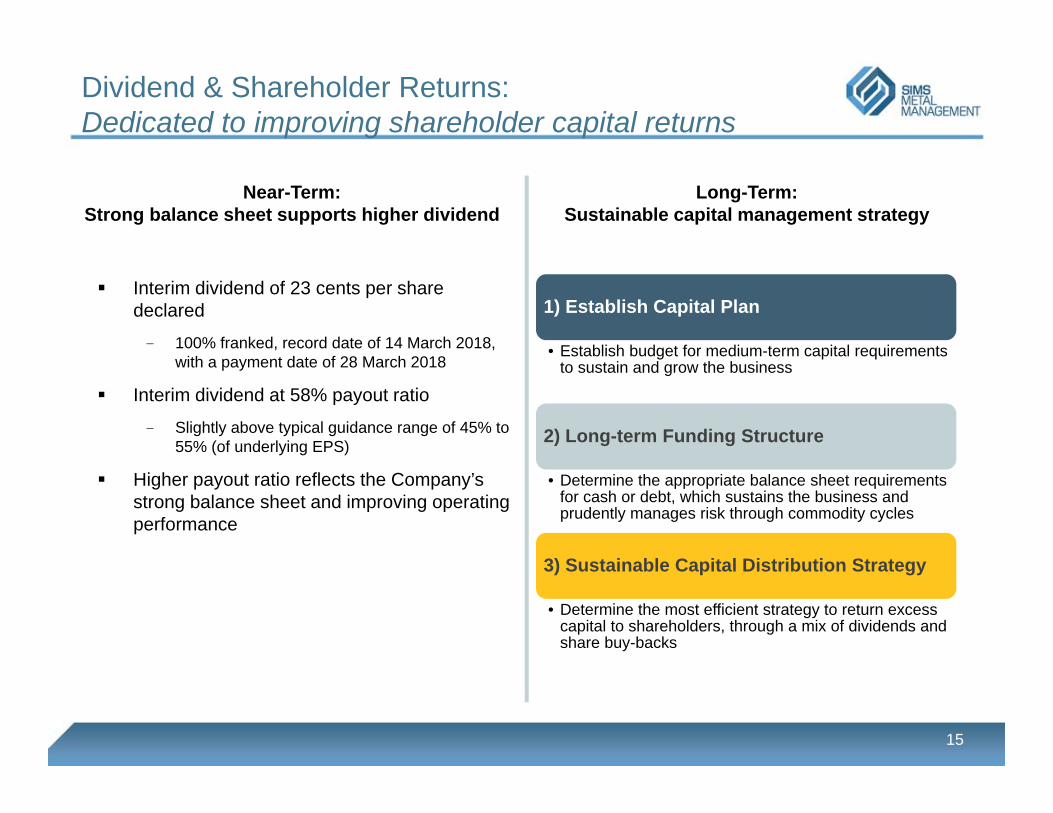
1) Establish Capital Plan
• Establish budget for medium-term capital requirements to sustain and grow the business
2) Long-term Funding Structure
• Determine the appropriate balance sheet requirements for cash or debt, which sustains the business and prudently manages risk through commodity cycles
3) Sustainable Capital Distribution Strategy
• Determine the most efficient strategy to return excess capital to shareholders, through a mix of dividends and share buy-backs
15
Dividend & Shareholder Returns:Dedicated to improving shareholder capital returns
Long-Term:Sustainable capital management strategy
Interim dividend of 23 cents per share declared
- 100% franked, record date of 14 March 2018, with a payment date of 28 March 2018
Interim dividend at 58% payout ratio
- Slightly above typical guidance range of 45% to 55% (of underlying EPS)
Higher payout ratio reflects the Company’s strong balance sheet and improving operating performance
Near-Term:Strong balance sheet supports higher dividend

Strategic Priorities & OutlookAlistair Field, Group CEO
16
Positioned for Tomorrow
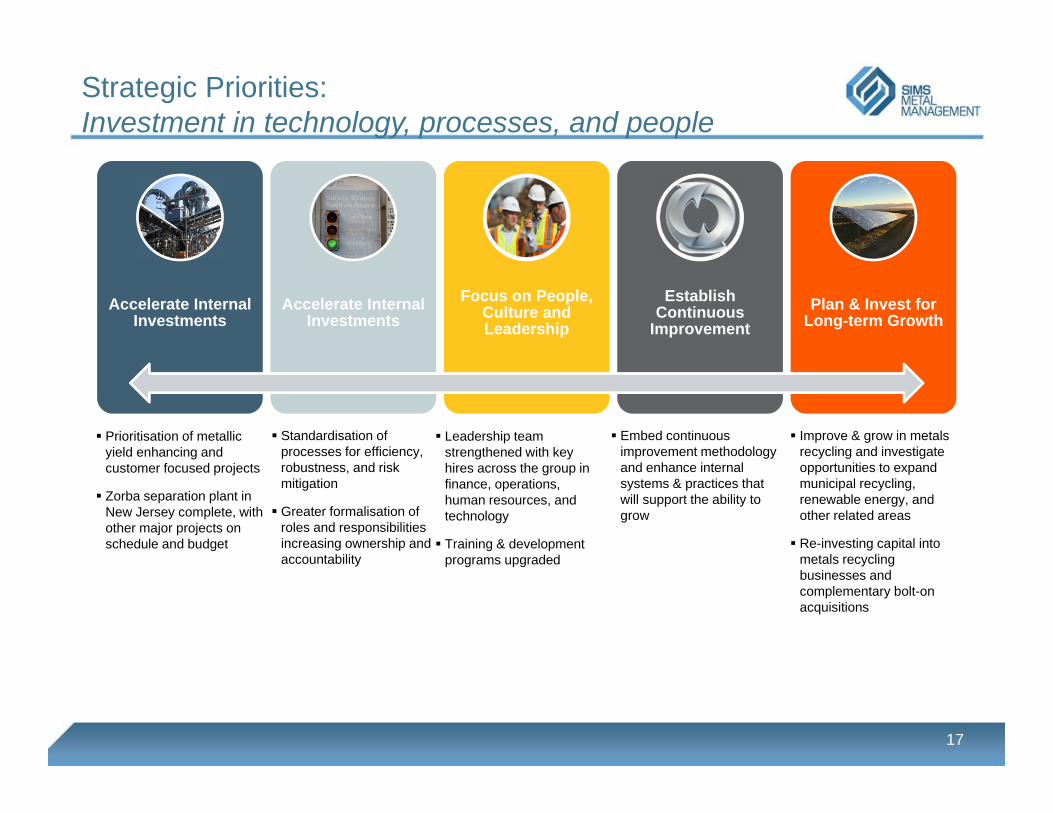
Strategic Priorities:Investment in technology, processes, and people
17
Accelerate Internal Investments
Accelerate Internal Investments
Focus on People, Culture and Leadership
Establish Continuous
ImprovementPlan & Invest for
Long-term Growth
Prioritisation of metallic yield enhancing and customer focused projects
Zorba separation plant in New Jersey complete, with other major projects on schedule and budget
Standardisation of processes for efficiency, robustness, and risk mitigation
Greater formalisation of roles and responsibilities increasing ownership and accountability
Leadership team strengthened with key hires across the group in finance, operations, human resources, and technology
Training & development programs upgraded
Embed continuous improvement methodology and enhance internal systems & practices that will support the ability to grow
Improve & grow in metals recycling and investigate opportunities to expand municipal recycling, renewable energy, and other related areas
Re-investing capital into metals recycling businesses and complementary bolt-on acquisitions
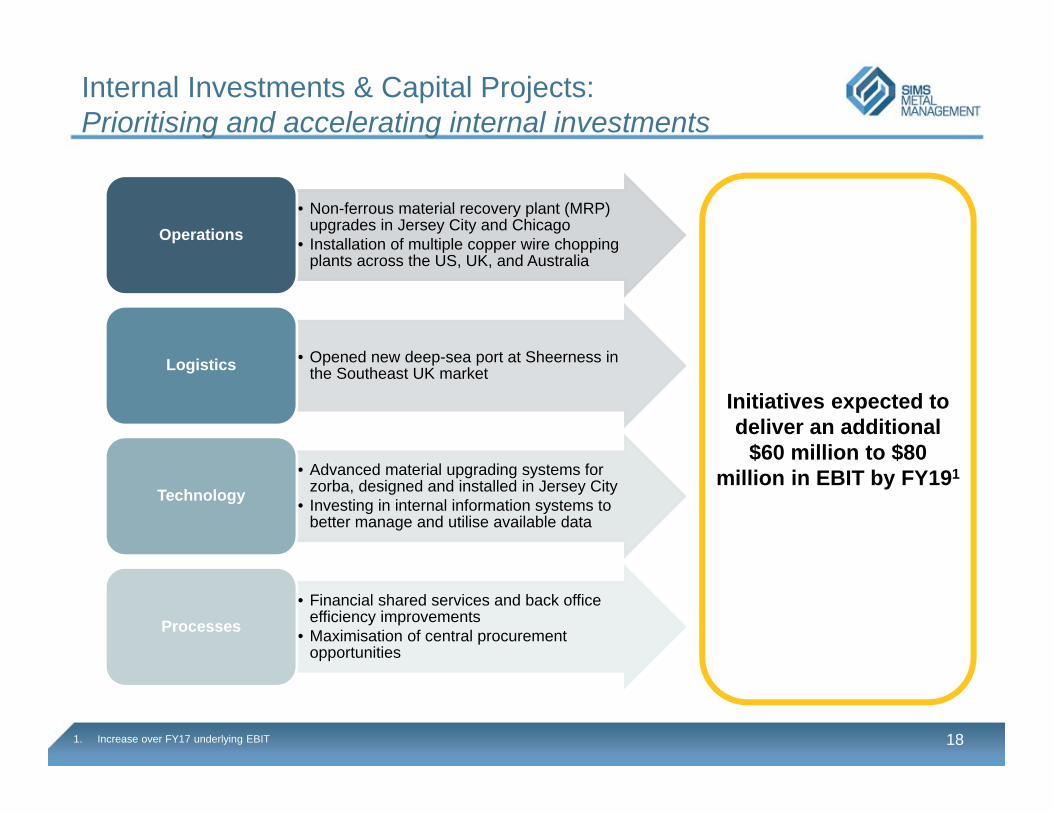
Internal Investments & Capital Projects: Prioritising and accelerating internal investments
• Non-ferrous material recovery plant (MRP) upgrades in Jersey City and Chicago
• Installation of multiple copper wire chopping plants across the US, UK, and Australia
Operations
• Opened new deep-sea port at Sheerness in the Southeast UK marketLogistics
• Advanced material upgrading systems for zorba, designed and installed in Jersey City
• Investing in internal information systems to better manage and utilise available data
Technology
• Financial shared services and back office efficiency improvements
• Maximisation of central procurement opportunities
Processes
18
Initiatives expected to deliver an additional
$60 million to $80 million in EBIT by FY191
1. Increase over FY17 underlying EBIT
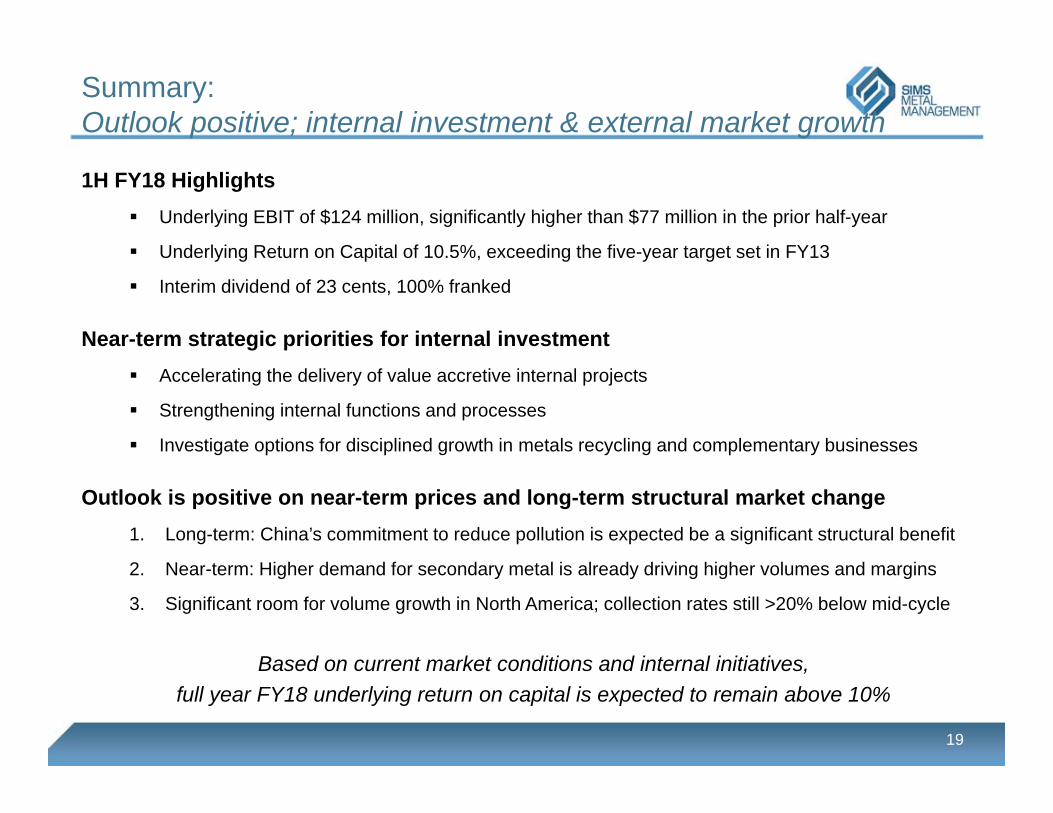
Summary:Outlook positive; internal investment & external market growth
1H FY18 Highlights Underlying EBIT of $124 million, significantly higher than $77 million in the prior half-year
Underlying Return on Capital of 10.5%, exceeding the five-year target set in FY13
Interim dividend of 23 cents, 100% franked
Near-term strategic priorities for internal investment Accelerating the delivery of value accretive internal projects
Strengthening internal functions and processes
Investigate options for disciplined growth in metals recycling and complementary businesses
Outlook is positive on near-term prices and long-term structural market change1. Long-term: China’s commitment to reduce pollution is expected be a significant structural benefit
2. Near-term: Higher demand for secondary metal is already driving higher volumes and margins
3. Significant room for volume growth in North America; collection rates still >20% below mid-cycle
Based on current market conditions and internal initiatives, full year FY18 underlying return on capital is expected to remain above 10%
19
Appendix
20
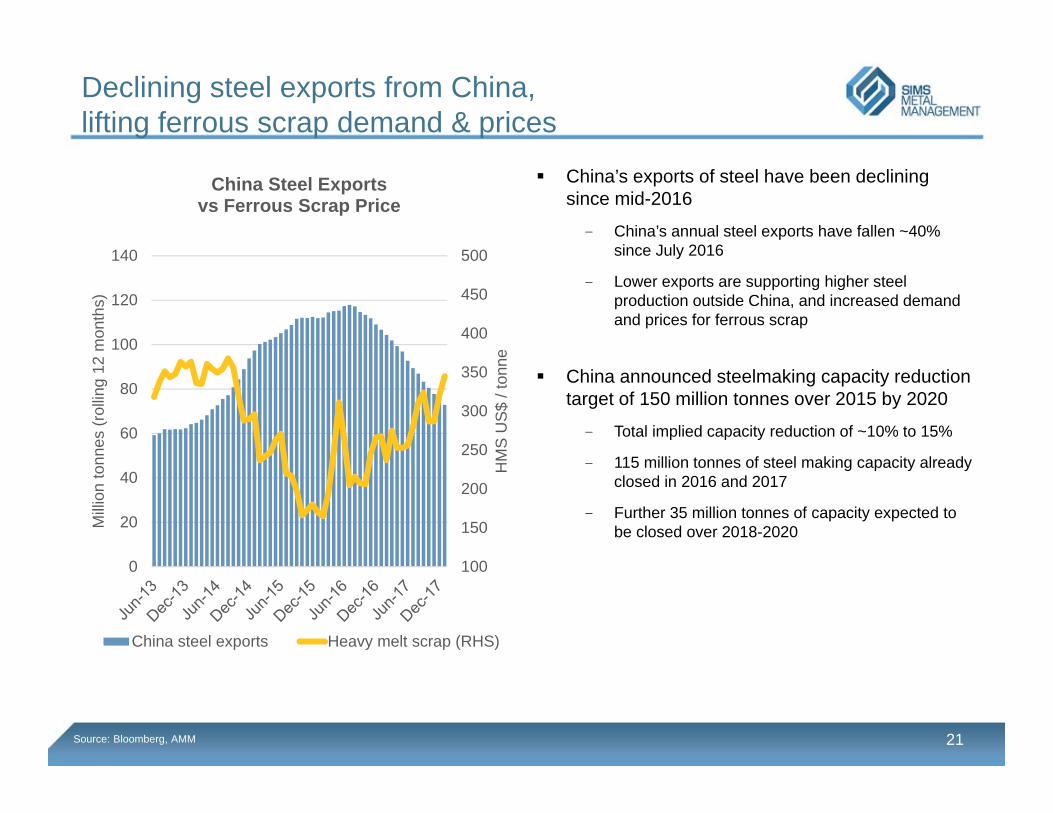
Declining steel exports from China, lifting ferrous scrap demand & prices
21
China’s exports of steel have been declining since mid-2016
- China’s annual steel exports have fallen ~40% since July 2016
- Lower exports are supporting higher steel production outside China, and increased demand and prices for ferrous scrap
China announced steelmaking capacity reduction target of 150 million tonnes over 2015 by 2020
- Total implied capacity reduction of ~10% to 15%
- 115 million tonnes of steel making capacity already closed in 2016 and 2017
- Further 35 million tonnes of capacity expected to be closed over 2018-2020
Source: Bloomberg, AMM
100
150
200
250
300
350
400
450
500
0
20
40
60
80
100
120
140
HM
S U
S$
/ ton
ne
Milli
on to
nnes
(rol
ling
12 m
onth
s)
China Steel Exportsvs Ferrous Scrap Price
China steel exports Heavy melt scrap (RHS)
22
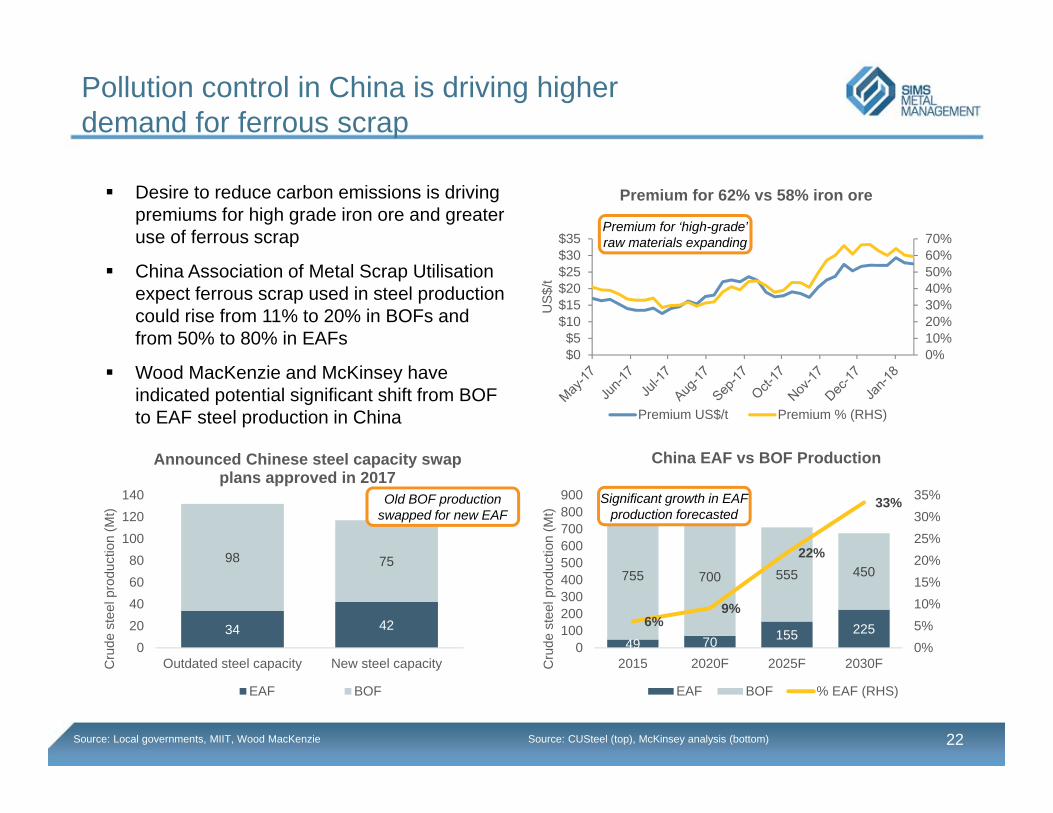
Pollution control in China is driving higherdemand for ferrous scrap
0%10%20%30%40%50%60%70%
$0$5
$10$15$20$25$30$35
US
$/t
Premium for 62% vs 58% iron ore
Premium US$/t Premium % (RHS)
Desire to reduce carbon emissions is driving premiums for high grade iron ore and greater use of ferrous scrap
China Association of Metal Scrap Utilisation expect ferrous scrap used in steel production could rise from 11% to 20% in BOFs and from 50% to 80% in EAFs
Wood MacKenzie and McKinsey have indicated potential significant shift from BOF to EAF steel production in China
Premium for ‘high-grade’ raw materials expanding
Source: CUSteel (top), McKinsey analysis (bottom)
49 70 155 225
755 700 555 450
6%9%
22%
33%
0%5%10%15%20%25%30%35%
0100200300400500600700800900
2015 2020F 2025F 2030FCru
de s
teel
pro
duct
ion
(Mt)
China EAF vs BOF Production
EAF BOF % EAF (RHS)
Significant growth in EAF production forecasted
Source: Local governments, MIIT, Wood MacKenzie
34 42
98 75
020406080
100120140
Outdated steel capacity New steel capacityCru
de s
teel
pro
duct
ion
(Mt)
Announced Chinese steel capacity swap plans approved in 2017
EAF BOF
Old BOF production swapped for new EAF
23
Significant room for higher scrap collection in the US
201
50
100
150
200
250
1975
1978
1981
1984
1987
1990
1993
1996
1999
2002
2005
2008
2011
2014
2017
Col
lect
ion
(kg
per c
apita
)
United States Ferrous Scrap Collection (per capita)
155
50
100
150
200
250
1975
1978
1981
1984
1987
1990
1993
1996
1999
2002
2005
2008
2011
2014
2017
Col
lect
ion
(kg
per c
apita
)
United Kingdom Ferrous Scrap Collection (per capita)
131
50
100
150
200
250
1975
1978
1981
1984
1987
1990
1993
1996
1999
2002
2005
2008
2011
2014
2017
Col
lect
ion
(kg
per c
apita
)
Australia Ferrous Scrap Collection (per capita)
US collection >20% below long-term avg
Collection rates below developed country peers
Current collection in line with long-term avg
Source: WSA Source: USGS (top), WSA (bottom)
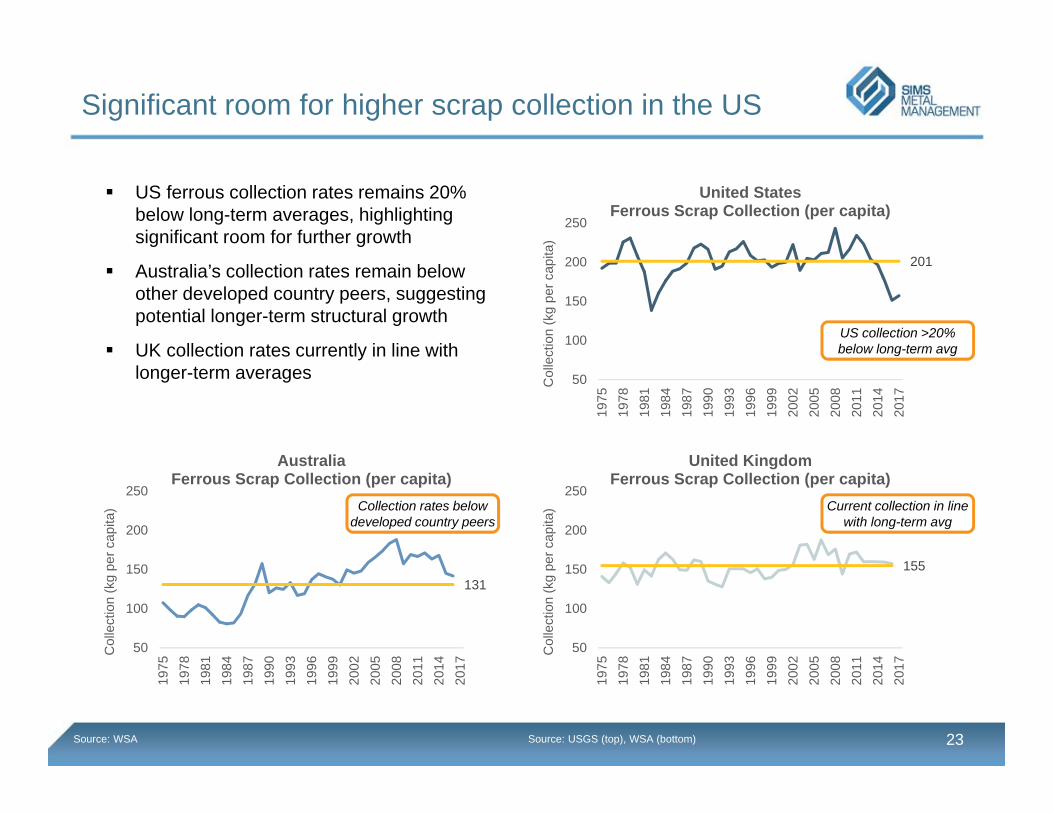
US ferrous collection rates remains 20% below long-term averages, highlighting significant room for further growth
Australia’s collection rates remain below other developed country peers, suggesting potential longer-term structural growth
UK collection rates currently in line with longer-term averages
Group Profit & Loss
24
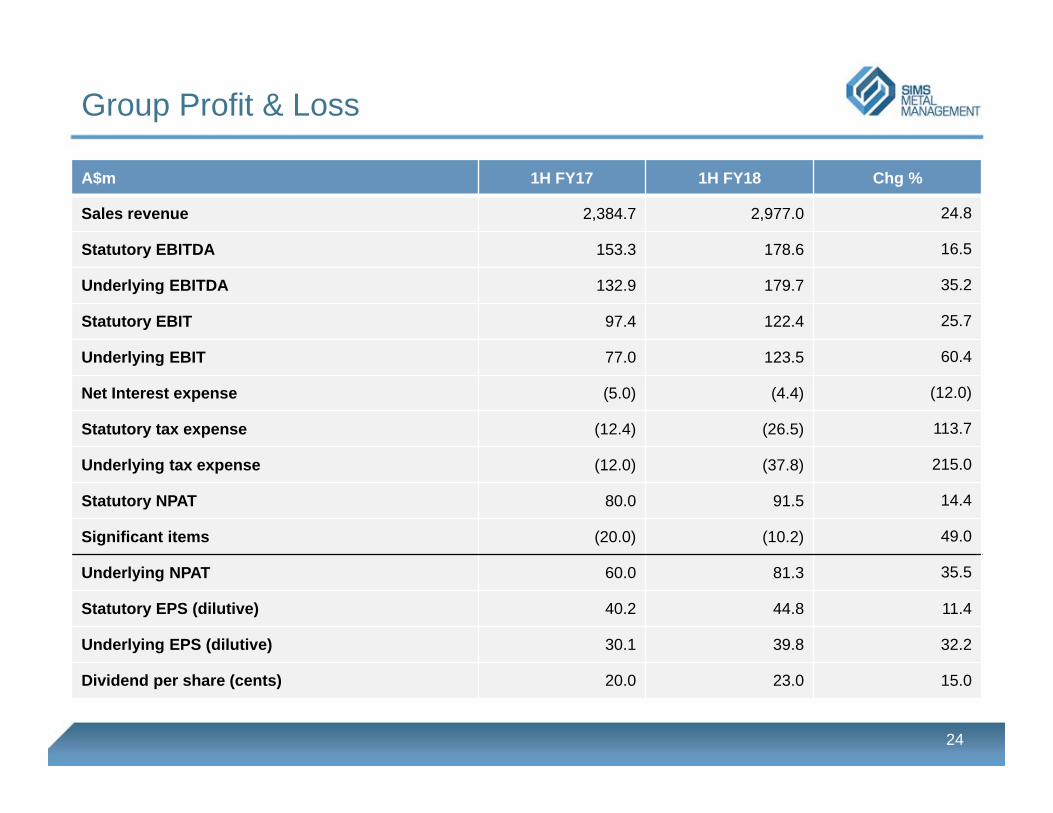
A$m 1H FY17 1H FY18 Chg %
Sales revenue 2,384.7 2,977.0 24.8
Statutory EBITDA 153.3 178.6 16.5
Underlying EBITDA 132.9 179.7 35.2
Statutory EBIT 97.4 122.4 25.7
Underlying EBIT 77.0 123.5 60.4
Net Interest expense (5.0) (4.4) (12.0)
Statutory tax expense (12.4) (26.5) 113.7
Underlying tax expense (12.0) (37.8) 215.0
Statutory NPAT 80.0 91.5 14.4
Significant items (20.0) (10.2) 49.0
Underlying NPAT 60.0 81.3 35.5
Statutory EPS (dilutive) 40.2 44.8 11.4
Underlying EPS (dilutive) 30.1 39.8 32.2
Dividend per share (cents) 20.0 23.0 15.0
North America Metals
25
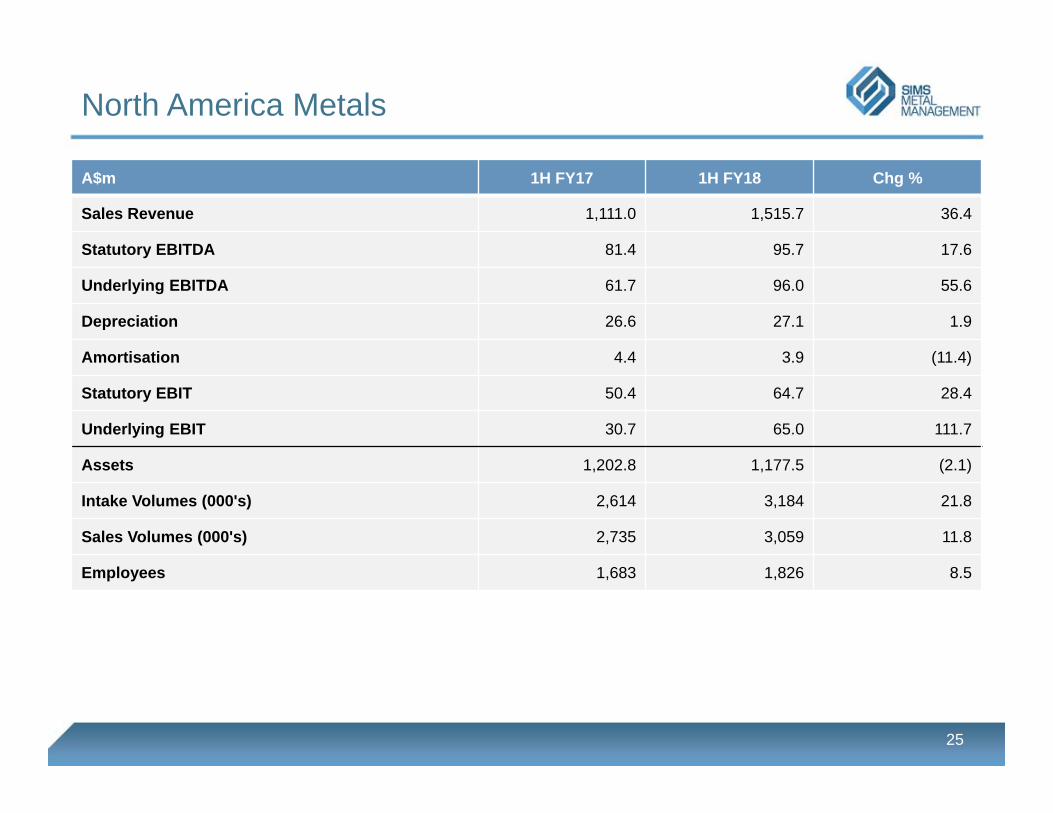
A$m 1H FY17 1H FY18 Chg %
Sales Revenue 1,111.0 1,515.7 36.4
Statutory EBITDA 81.4 95.7 17.6
Underlying EBITDA 61.7 96.0 55.6
Depreciation 26.6 27.1 1.9
Amortisation 4.4 3.9 (11.4)
Statutory EBIT 50.4 64.7 28.4
Underlying EBIT 30.7 65.0 111.7
Assets 1,202.8 1,177.5 (2.1)
Intake Volumes (000's) 2,614 3,184 21.8
Sales Volumes (000's) 2,735 3,059 11.8
Employees 1,683 1,826 8.5
Australia & New Zealand Metals
26
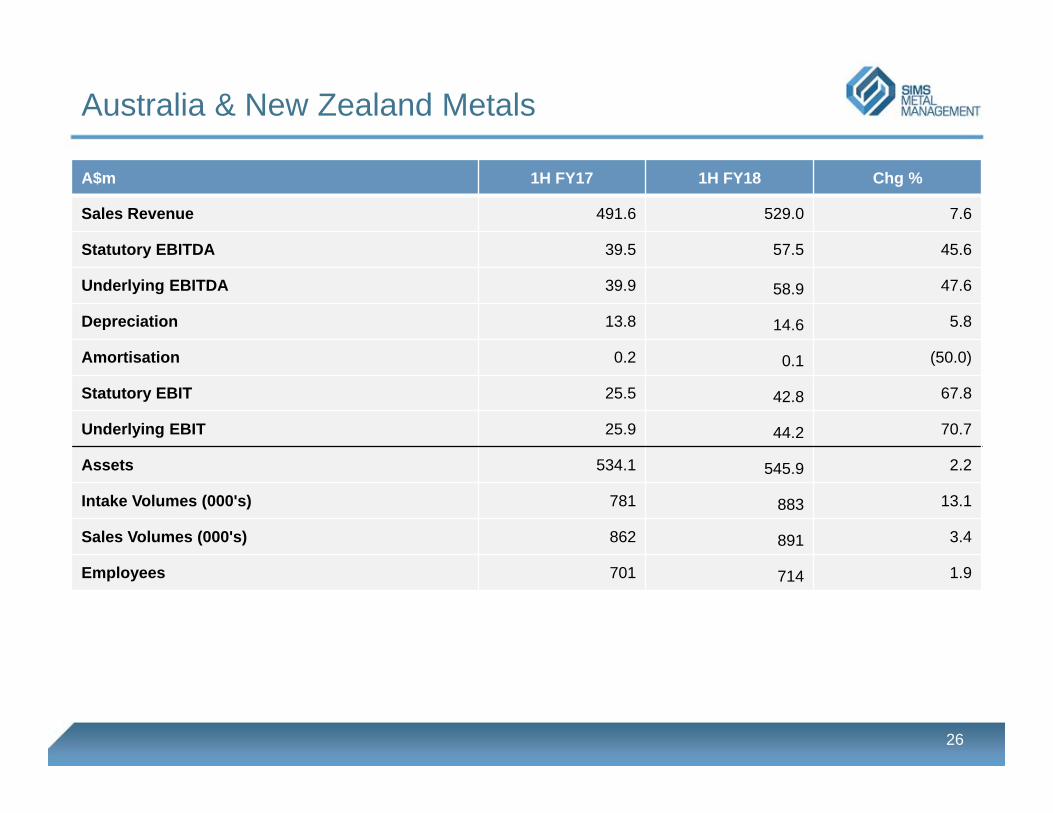
A$m 1H FY17 1H FY18 Chg %
Sales Revenue 491.6 529.0 7.6
Statutory EBITDA 39.5 57.5 45.6
Underlying EBITDA 39.9 58.9 47.6
Depreciation 13.8 14.6 5.8
Amortisation 0.2 0.1 (50.0)
Statutory EBIT 25.5 42.8 67.8
Underlying EBIT 25.9 44.2 70.7
Assets 534.1 545.9 2.2
Intake Volumes (000's) 781 883 13.1
Sales Volumes (000's) 862 891 3.4
Employees 701 714 1.9
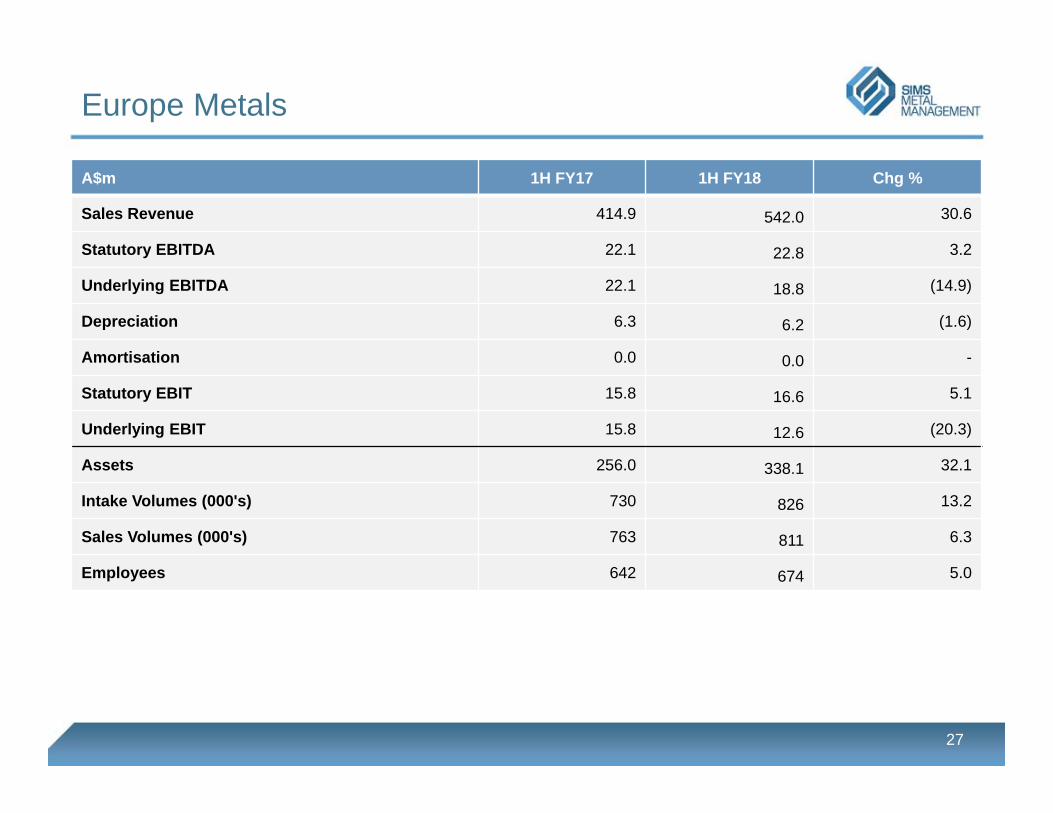
Europe Metals
27
A$m 1H FY17 1H FY18 Chg %
Sales Revenue 414.9 542.0 30.6
Statutory EBITDA 22.1 22.8 3.2
Underlying EBITDA 22.1 18.8 (14.9)
Depreciation 6.3 6.2 (1.6)
Amortisation 0.0 0.0 -
Statutory EBIT 15.8 16.6 5.1
Underlying EBIT 15.8 12.6 (20.3)
Assets 256.0 338.1 32.1
Intake Volumes (000's) 730 826 13.2
Sales Volumes (000's) 763 811 6.3
Employees 642 674 5.0
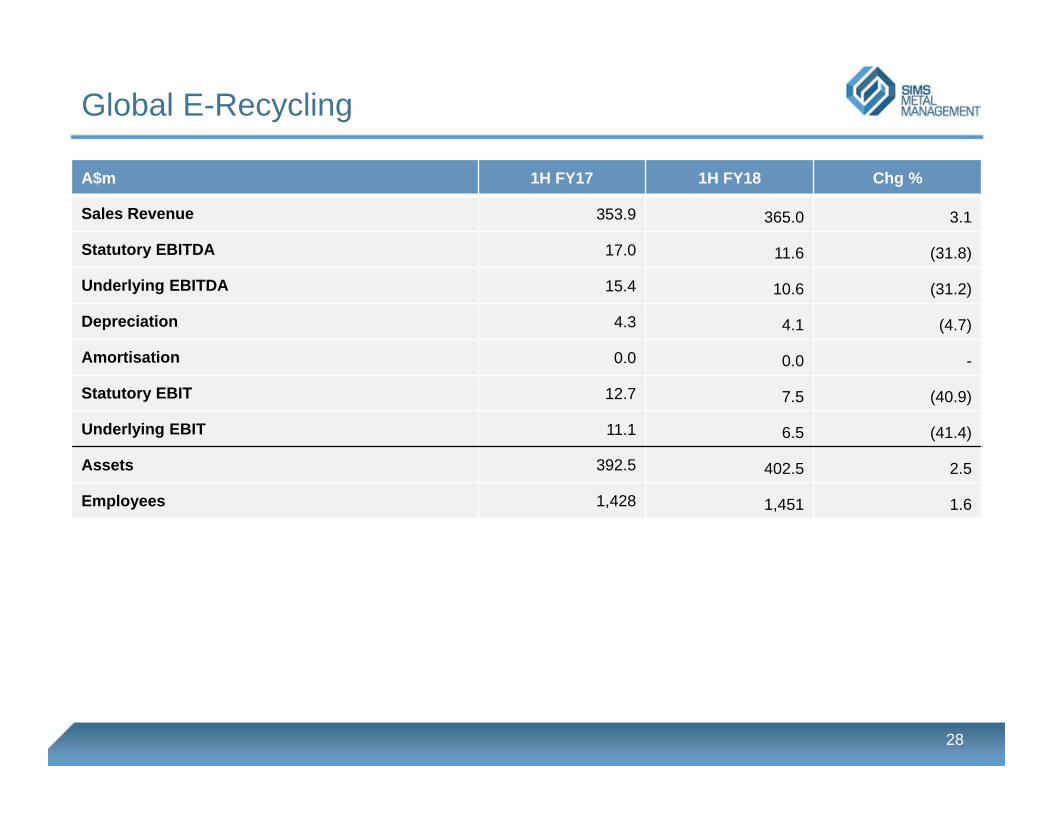
Global E-Recycling
28
A$m 1H FY17 1H FY18 Chg %
Sales Revenue 353.9 365.0 3.1
Statutory EBITDA 17.0 11.6 (31.8)
Underlying EBITDA 15.4 10.6 (31.2)
Depreciation 4.3 4.1 (4.7)
Amortisation 0.0 0.0 -
Statutory EBIT 12.7 7.5 (40.9)
Underlying EBIT 11.1 6.5 (41.4)
Assets 392.5 402.5 2.5
Employees 1,428 1,451 1.6
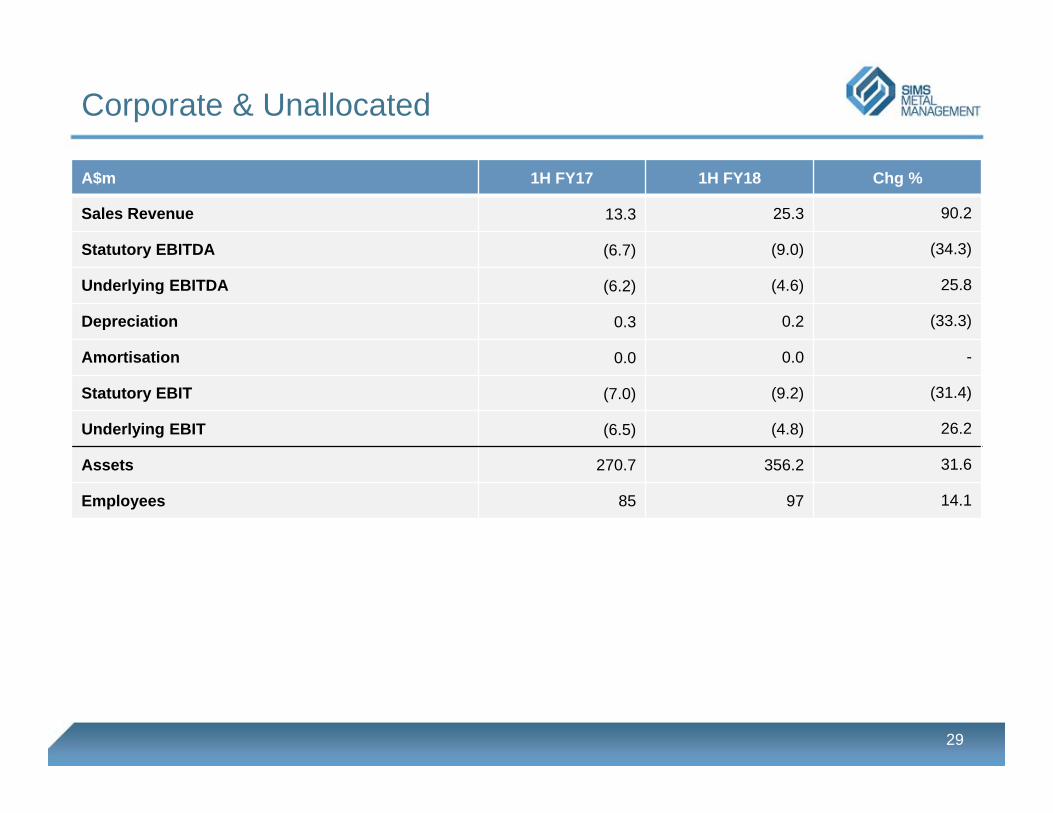
Corporate & Unallocated
29
A$m 1H FY17 1H FY18 Chg %
Sales Revenue 13.3 25.3 90.2
Statutory EBITDA (6.7) (9.0) (34.3)
Underlying EBITDA (6.2) (4.6) 25.8
Depreciation 0.3 0.2 (33.3)
Amortisation 0.0 0.0 -
Statutory EBIT (7.0) (9.2) (31.4)
Underlying EBIT (6.5) (4.8) 26.2
Assets 270.7 356.2 31.6
Employees 85 97 14.1
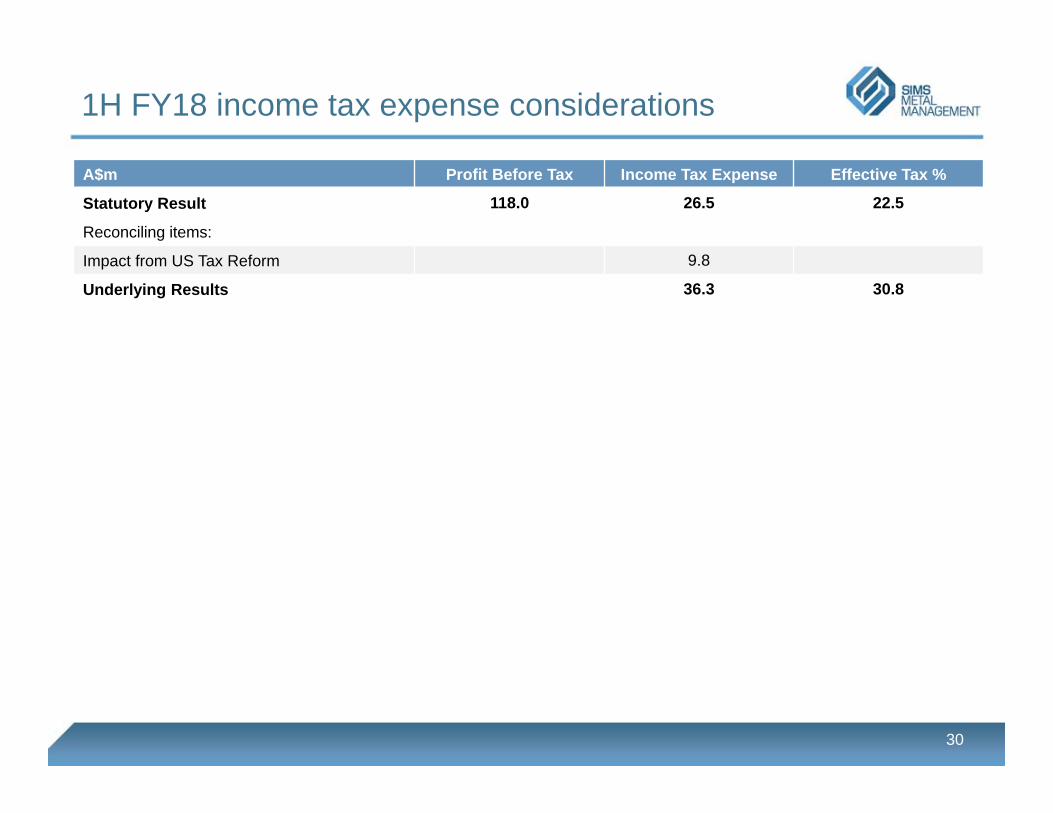
1H FY18 income tax expense considerations
30
A$m Profit Before Tax Income Tax Expense Effective Tax %
Statutory Result 118.0 26.5 22.5
Reconciling items:
Impact from US Tax Reform 9.8
Underlying Results 36.3 30.8
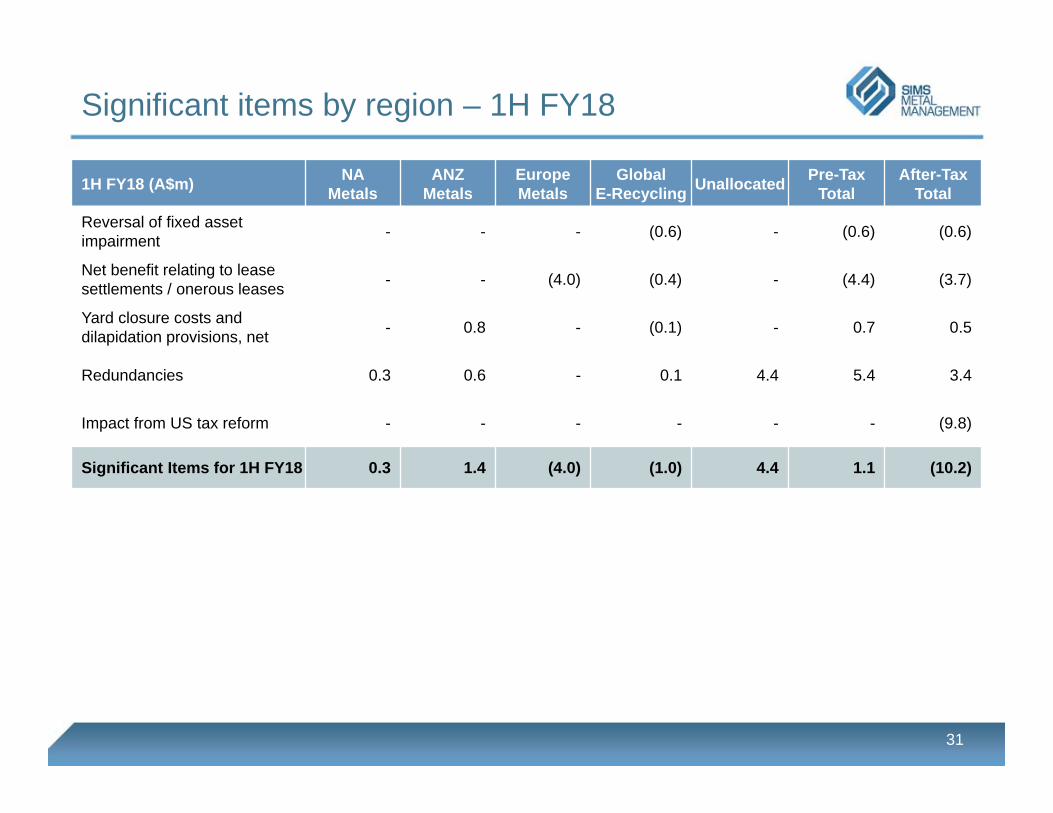
Significant items by region – 1H FY18
31
1H FY18 (A$m) NAMetals
ANZMetals
Europe Metals
Global E-Recycling Unallocated Pre-Tax
TotalAfter-Tax
Total
Reversal of fixed asset impairment - - - (0.6) - (0.6) (0.6)
Net benefit relating to lease settlements / onerous leases - - (4.0) (0.4) - (4.4) (3.7)
Yard closure costs and dilapidation provisions, net - 0.8 - (0.1) - 0.7 0.5
Redundancies 0.3 0.6 - 0.1 4.4 5.4 3.4
Impact from US tax reform - - - - - - (9.8)
Significant Items for 1H FY18 0.3 1.4 (4.0) (1.0) 4.4 1.1 (10.2)
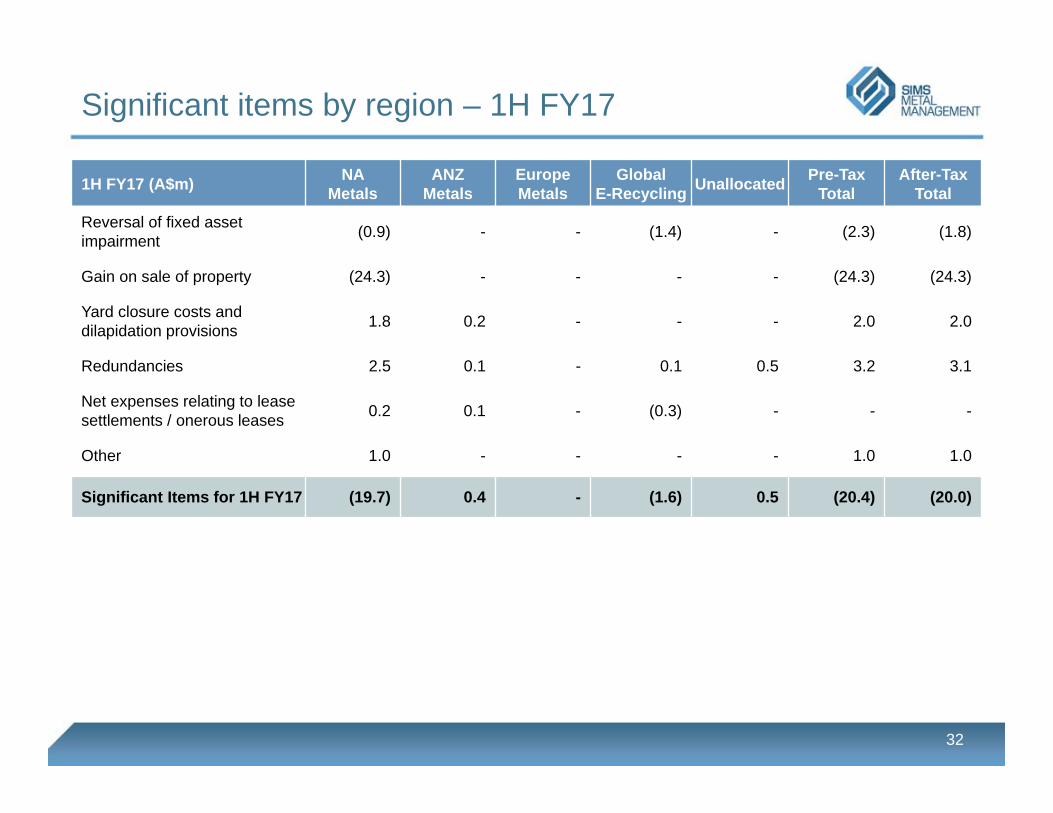
Significant items by region – 1H FY17
32
1H FY17 (A$m) NAMetals
ANZMetals
Europe Metals
Global E-Recycling Unallocated Pre-Tax
TotalAfter-Tax
Total
Reversal of fixed asset impairment (0.9) - - (1.4) - (2.3) (1.8)
Gain on sale of property (24.3) - - - - (24.3) (24.3)
Yard closure costs and dilapidation provisions 1.8 0.2 - - - 2.0 2.0
Redundancies 2.5 0.1 - 0.1 0.5 3.2 3.1
Net expenses relating to lease settlements / onerous leases 0.2 0.1 - (0.3) - - -
Other 1.0 - - - - 1.0 1.0
Significant Items for 1H FY17 (19.7) 0.4 - (1.6) 0.5 (20.4) (20.0)
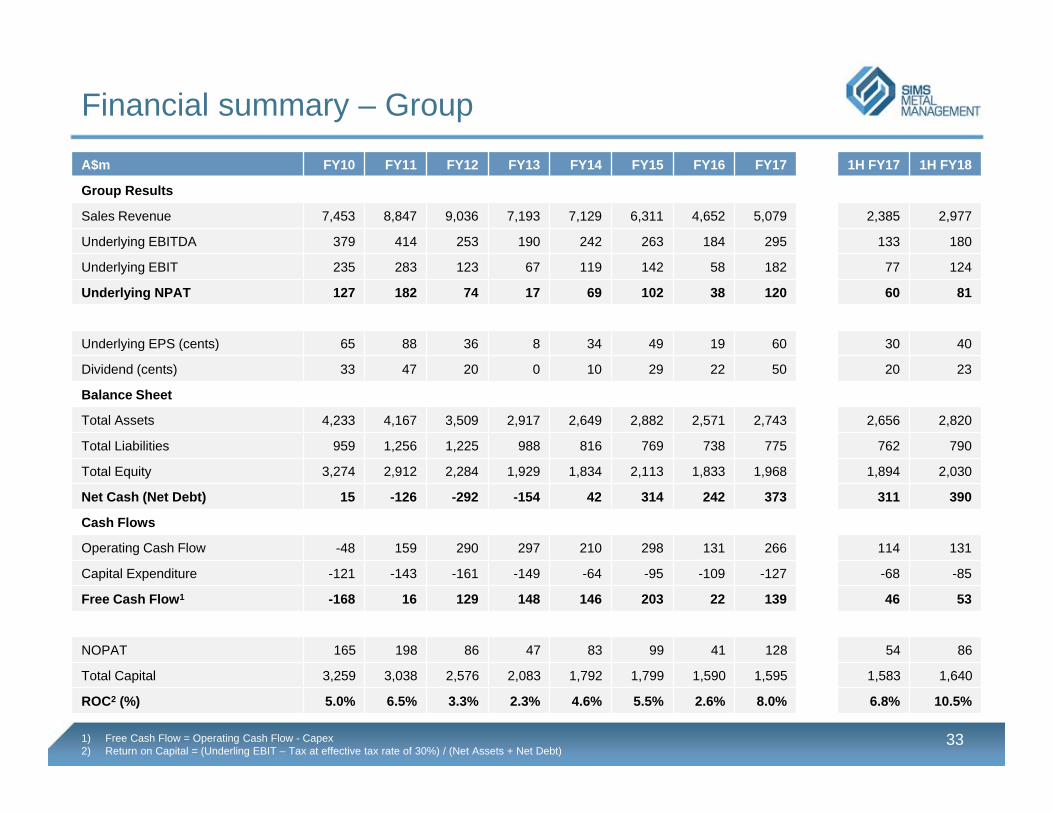
Financial summary – Group
33
A$m FY10 FY11 FY12 FY13 FY14 FY15 FY16 FY17 1H FY17 1H FY18
Group Results
Sales Revenue 7,453 8,847 9,036 7,193 7,129 6,311 4,652 5,079 2,385 2,977
Underlying EBITDA 379 414 253 190 242 263 184 295 133 180
Underlying EBIT 235 283 123 67 119 142 58 182 77 124
Underlying NPAT 127 182 74 17 69 102 38 120 60 81
Underlying EPS (cents) 65 88 36 8 34 49 19 60 30 40
Dividend (cents) 33 47 20 0 10 29 22 50 20 23
Balance Sheet
Total Assets 4,233 4,167 3,509 2,917 2,649 2,882 2,571 2,743 2,656 2,820
Total Liabilities 959 1,256 1,225 988 816 769 738 775 762 790
Total Equity 3,274 2,912 2,284 1,929 1,834 2,113 1,833 1,968 1,894 2,030
Net Cash (Net Debt) 15 -126 -292 -154 42 314 242 373 311 390
Cash Flows
Operating Cash Flow -48 159 290 297 210 298 131 266 114 131
Capital Expenditure -121 -143 -161 -149 -64 -95 -109 -127 -68 -85
Free Cash Flow1 -168 16 129 148 146 203 22 139 46 53
NOPAT 165 198 86 47 83 99 41 128 54 86
Total Capital 3,259 3,038 2,576 2,083 1,792 1,799 1,590 1,595 1,583 1,640
ROC2 (%) 5.0% 6.5% 3.3% 2.3% 4.6% 5.5% 2.6% 8.0% 6.8% 10.5%
1) Free Cash Flow = Operating Cash Flow - Capex 2) Return on Capital = (Underling EBIT – Tax at effective tax rate of 30%) / (Net Assets + Net Debt)
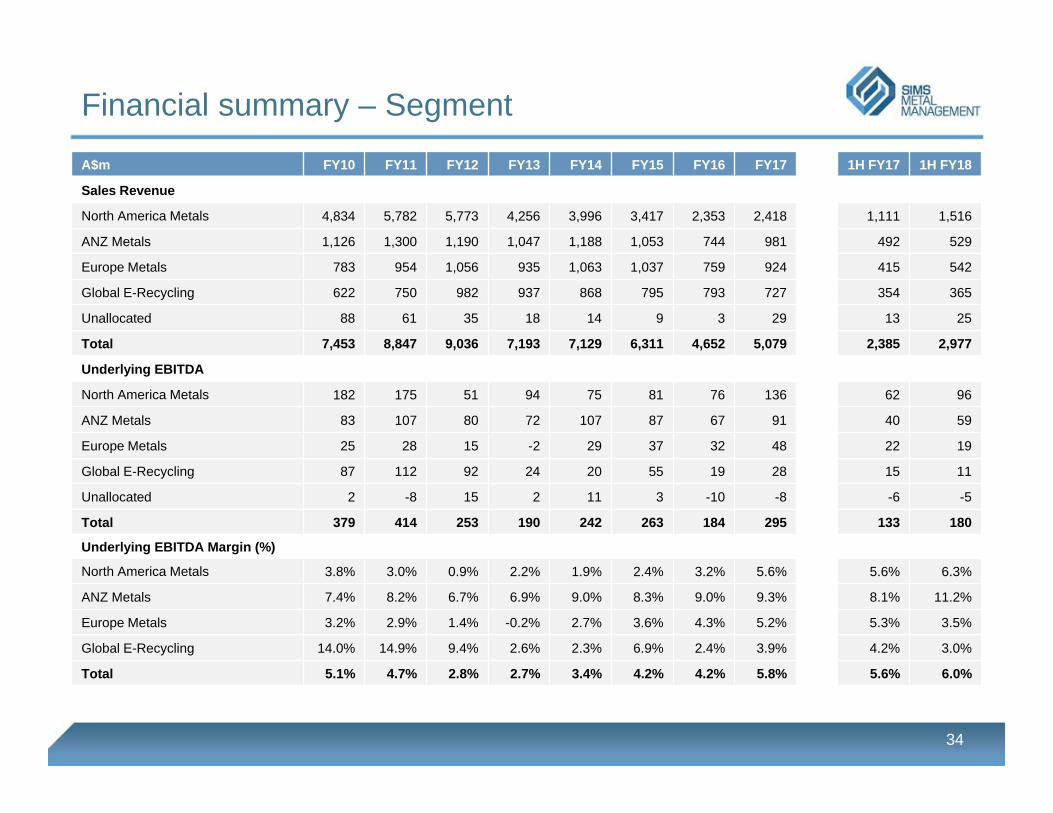
Financial summary – Segment
34
A$m FY10 FY11 FY12 FY13 FY14 FY15 FY16 FY17 1H FY17 1H FY18
Sales Revenue
North America Metals 4,834 5,782 5,773 4,256 3,996 3,417 2,353 2,418 1,111 1,516
ANZ Metals 1,126 1,300 1,190 1,047 1,188 1,053 744 981 492 529
Europe Metals 783 954 1,056 935 1,063 1,037 759 924 415 542
Global E-Recycling 622 750 982 937 868 795 793 727 354 365
Unallocated 88 61 35 18 14 9 3 29 13 25
Total 7,453 8,847 9,036 7,193 7,129 6,311 4,652 5,079 2,385 2,977
Underlying EBITDA
North America Metals 182 175 51 94 75 81 76 136 62 96
ANZ Metals 83 107 80 72 107 87 67 91 40 59
Europe Metals 25 28 15 -2 29 37 32 48 22 19
Global E-Recycling 87 112 92 24 20 55 19 28 15 11
Unallocated 2 -8 15 2 11 3 -10 -8 -6 -5
Total 379 414 253 190 242 263 184 295 133 180
Underlying EBITDA Margin (%)
North America Metals 3.8% 3.0% 0.9% 2.2% 1.9% 2.4% 3.2% 5.6% 5.6% 6.3%
ANZ Metals 7.4% 8.2% 6.7% 6.9% 9.0% 8.3% 9.0% 9.3% 8.1% 11.2%
Europe Metals 3.2% 2.9% 1.4% -0.2% 2.7% 3.6% 4.3% 5.2% 5.3% 3.5%
Global E-Recycling 14.0% 14.9% 9.4% 2.6% 2.3% 6.9% 2.4% 3.9% 4.2% 3.0%
Total 5.1% 4.7% 2.8% 2.7% 3.4% 4.2% 4.2% 5.8% 5.6% 6.0%
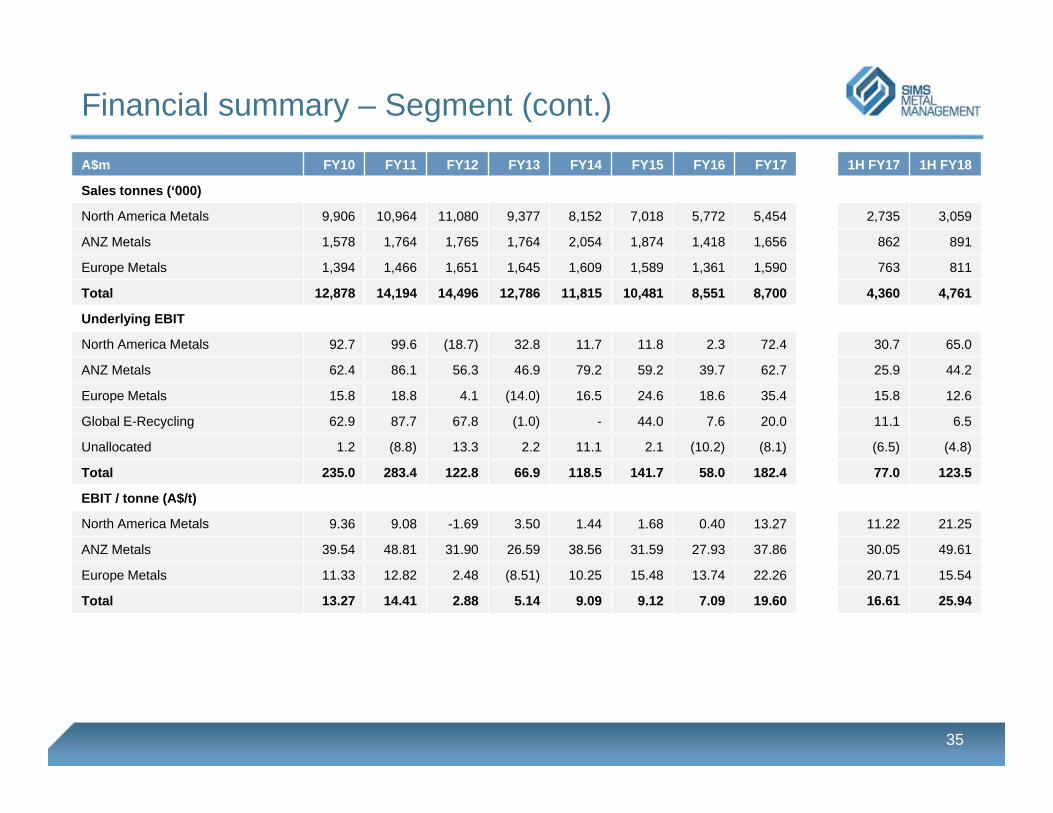
Financial summary – Segment (cont.)
35
A$m FY10 FY11 FY12 FY13 FY14 FY15 FY16 FY17 1H FY17 1H FY18
Sales tonnes (‘000)
North America Metals 9,906 10,964 11,080 9,377 8,152 7,018 5,772 5,454 2,735 3,059
ANZ Metals 1,578 1,764 1,765 1,764 2,054 1,874 1,418 1,656 862 891
Europe Metals 1,394 1,466 1,651 1,645 1,609 1,589 1,361 1,590 763 811
Total 12,878 14,194 14,496 12,786 11,815 10,481 8,551 8,700 4,360 4,761
Underlying EBIT
North America Metals 92.7 99.6 (18.7) 32.8 11.7 11.8 2.3 72.4 30.7 65.0
ANZ Metals 62.4 86.1 56.3 46.9 79.2 59.2 39.7 62.7 25.9 44.2
Europe Metals 15.8 18.8 4.1 (14.0) 16.5 24.6 18.6 35.4 15.8 12.6
Global E-Recycling 62.9 87.7 67.8 (1.0) - 44.0 7.6 20.0 11.1 6.5
Unallocated 1.2 (8.8) 13.3 2.2 11.1 2.1 (10.2) (8.1) (6.5) (4.8)
Total 235.0 283.4 122.8 66.9 118.5 141.7 58.0 182.4 77.0 123.5
EBIT / tonne (A$/t)
North America Metals 9.36 9.08 -1.69 3.50 1.44 1.68 0.40 13.27 11.22 21.25
ANZ Metals 39.54 48.81 31.90 26.59 38.56 31.59 27.93 37.86 30.05 49.61
Europe Metals 11.33 12.82 2.48 (8.51) 10.25 15.48 13.74 22.26 20.71 15.54
Total 13.27 14.41 2.88 5.14 9.09 9.12 7.09 19.60 16.61 25.94
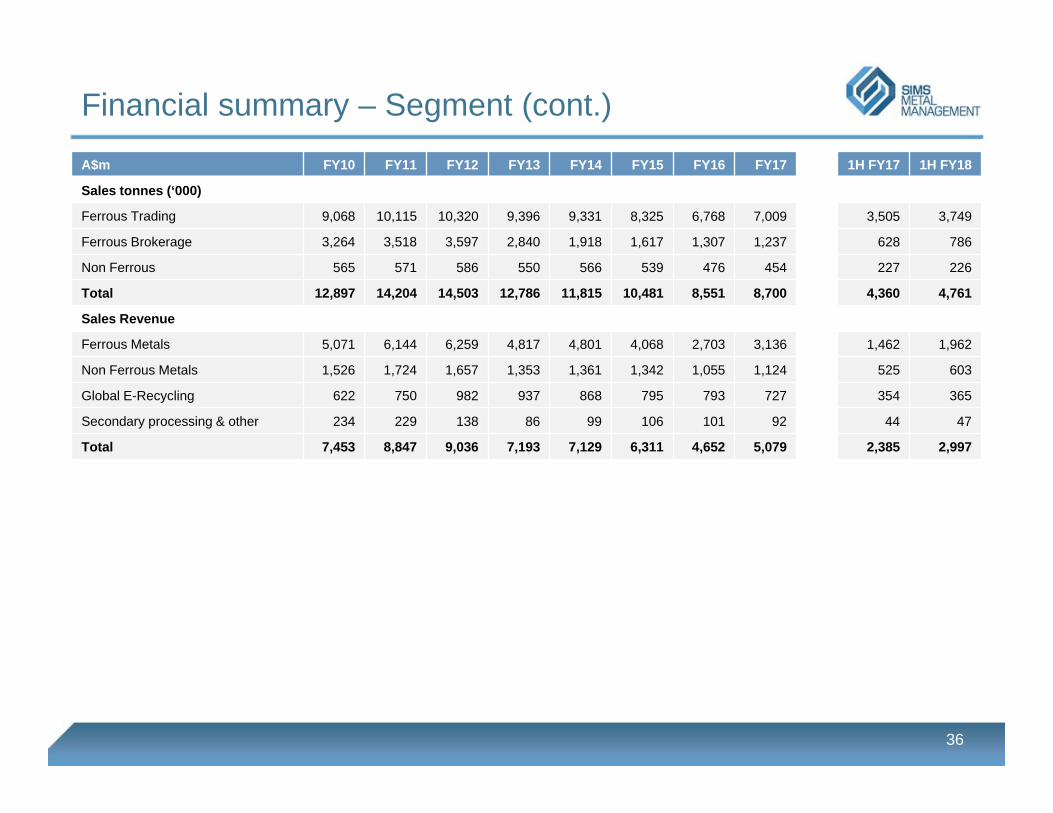
Financial summary – Segment (cont.)
36
A$m FY10 FY11 FY12 FY13 FY14 FY15 FY16 FY17 1H FY17 1H FY18
Sales tonnes (‘000)
Ferrous Trading 9,068 10,115 10,320 9,396 9,331 8,325 6,768 7,009 3,505 3,749
Ferrous Brokerage 3,264 3,518 3,597 2,840 1,918 1,617 1,307 1,237 628 786
Non Ferrous 565 571 586 550 566 539 476 454 227 226
Total 12,897 14,204 14,503 12,786 11,815 10,481 8,551 8,700 4,360 4,761
Sales Revenue
Ferrous Metals 5,071 6,144 6,259 4,817 4,801 4,068 2,703 3,136 1,462 1,962
Non Ferrous Metals 1,526 1,724 1,657 1,353 1,361 1,342 1,055 1,124 525 603
Global E-Recycling 622 750 982 937 868 795 793 727 354 365
Secondary processing & other 234 229 138 86 99 106 101 92 44 47
Total 7,453 8,847 9,036 7,193 7,129 6,311 4,652 5,079 2,385 2,997
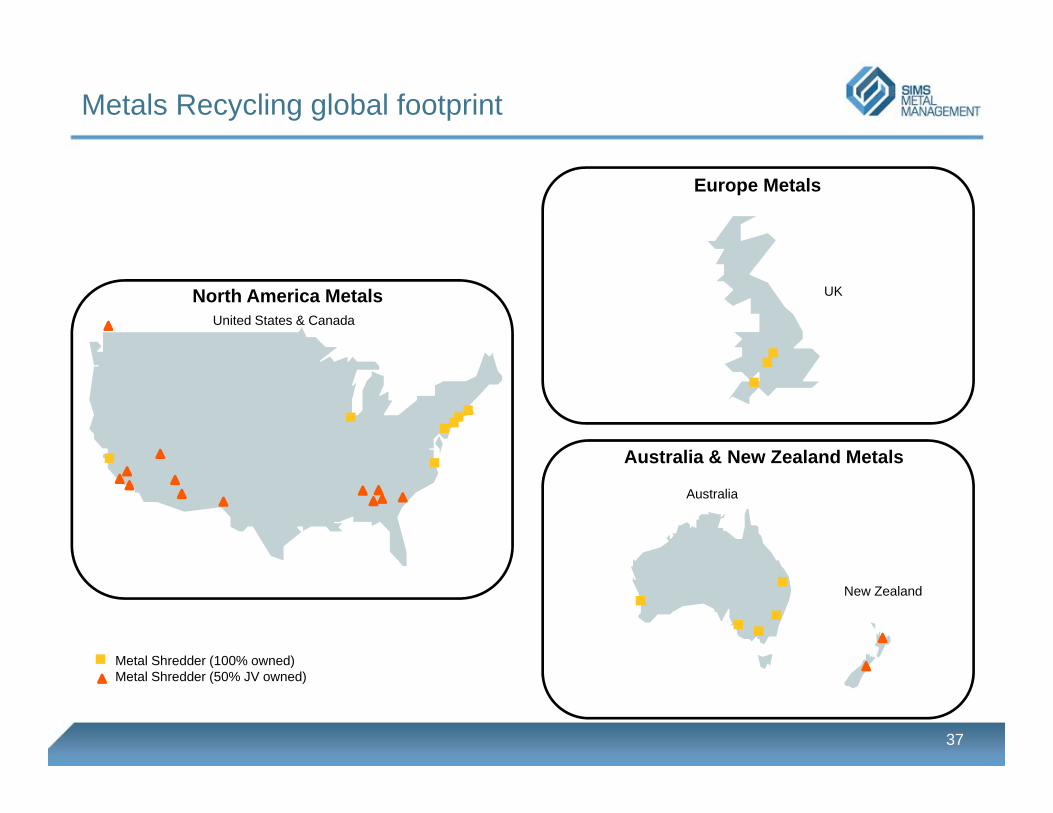
Metals Recycling global footprint
37
North America Metals
Europe Metals
Australia & New Zealand Metals
New Zealand
Australia
Metal Shredder (100% owned)Metal Shredder (50% JV owned)
UK
United States & Canada
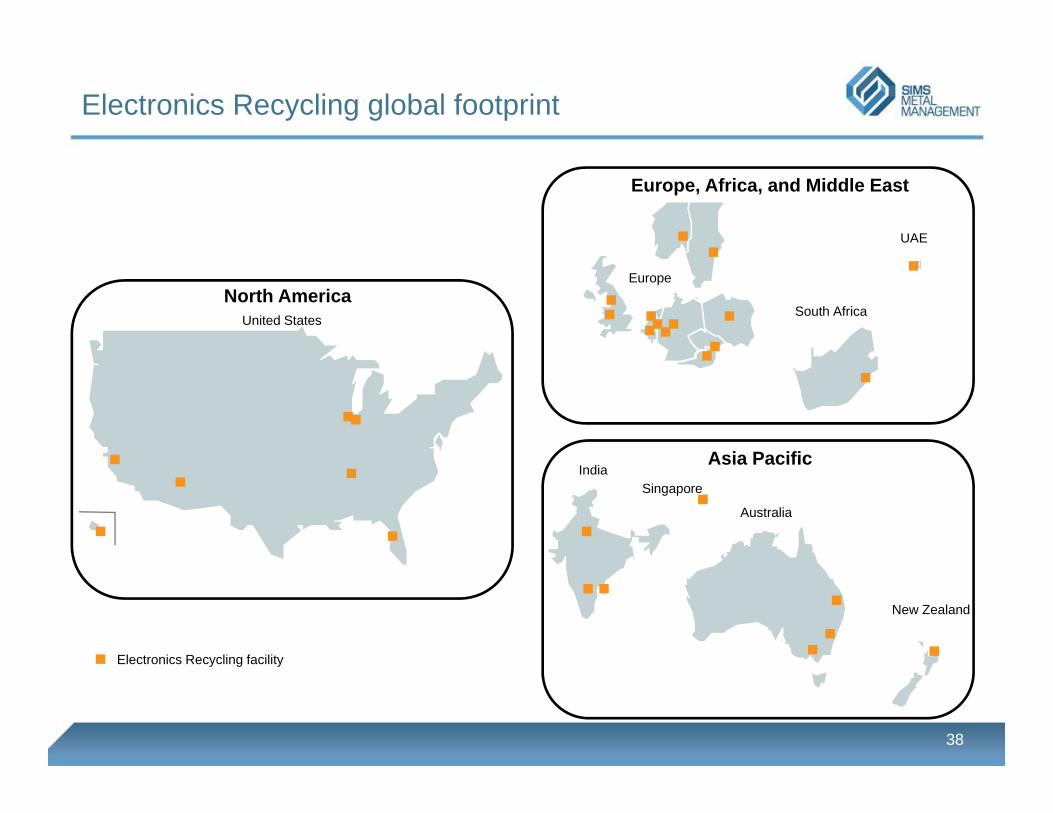
Electronics Recycling global footprint
38
Europe, Africa, and Middle East
Asia Pacific
UAE
South Africa
New Zealand
SingaporeIndia
Australia
Europe
United States
North America
Electronics Recycling facility
Disclaimer
39
The material contained in this document is a presentation of information about the Group’s activities current at the date of the presentation, 16 February 2018. It is provided in summary form and does not purport to be complete. It should be read in conjunction with the Group’s periodic reporting and other announcements lodged with the Australian Securities Exchange (ASX).
To the extent that this document may contain forward-looking statements, such statements are not guarantees or predictions of future performance, and involve known and unknown risks, uncertainties and other factors, many of which are beyond our control, and which may cause actual results to differ materially from those expressed in the statements contained in this release.
This document is not intended to be relied upon as advice to investors or potential investors and does not take into account the investment objectives, financial situation or needs of any particular investor.