FY17
55
-
Upload
pranav-rao -
Category
Investor Relations
-
view
243 -
download
1
Transcript of FY17
IMPORTANT NOTICE AND DISCLAIMER
Important notice and disclaimer
This document is a presentation of general background information about the activities of Mantra Group Limited (Mantra Group) current at the date of the presentation, 29 August
2017. The information contained in this presentation is of general background and does not purport to be complete. It is not intended to be relied upon as advice to investors or
potential investors and does not take into account the investment objectives, financial situation or needs of any particular investor. These should be considered, with or without
professional advice, when deciding if an investment is appropriate.
Mantra Group, its related bodies corporate and any of their respective officers, directors and employees (Mantra Group Parties), do not warrant the accuracy or reliability of this
information, and disclaim any responsibility and liability flowing from the use of this information by any party. To the maximum extent permitted by law, the Mantra Group Parties
do not accept any liability to any person, organisation or entity for any loss or damage suffered as a result of reliance on this document.
Forward looking statements
This document contains certain forward looking statements and comments about future events, including Mantra Group’s expectations about the performance of its businesses.
Forward looking statements can generally be identified by the use of forward looking words such as, ‘expect’, ‘anticipate’, ‘likely’, ‘intend’, ‘should’, ‘could’, ‘may’, ‘predict’, ‘plan’,
‘propose’, ‘will’, ‘believe’, ‘forecast’, ‘estimate’, ‘target’ and other similar expressions within the meaning of securities laws of applicable jurisdictions. Indications of, and guidance
on, future earnings or financial position or performance are also forward looking statements.
Forward looking statements involve inherent risks and uncertainties, both general and specific, and there is a risk that such predictions, forecasts, projections and other forward
looking statements will not be achieved. Forward looking statements are provided as a general guide only, and should not be relied on as an indication or guarantee of future
performance. Forward looking statements involve known and unknown risks, uncertainty and other factors which can cause Mantra Group’s actual results to differ materially from
the plans, objectives, expectations, estimates and intentions expressed in such forward looking statements and many of these factors are outside the control of Mantra Group. As
such, undue reliance should not be placed on any forward looking statement. Past performance is not necessarily a guide to future performance and no representation or
warranty is made by any person as to the likelihood of achievement or reasonableness of any forward looking statements, forecast financial information or other forecast. Nothing
contained in this presentation nor any information made available to you is, or shall be, relied upon as a promise, representation, warranty or guarantee as to the past, present or
the future performance of Mantra Group.
Non-IFRS financial information
Mantra Group uses certain measures to manage and report on its business that are not recognised under Australian Accounting Standards. These measures are referred to as
non-IFRS financial information. Mantra Group considers that this non-IFRS financial information is important to assist in evaluating Mantra Group’s performance. The information
is presented to assist in making appropriate comparisons with current periods and to assess the operating performance of the business. All non-IFRS financial information is
reconciled to IFRS financial information.
All dollar values are in Australian dollars (A$) unless otherwise stated. 2

CONTENTS HIGHLIGHTS 4
MANTRA GROUP’S BUSINESS 9
FINANCIAL PERFORMANCE 18
STRATEGY AND OUTLOOK 27
PROPERTIES SCHEDULED TO ENTER PORTFOLIO 31
APPENDIX 34
3

HIGHLIGHTS
4
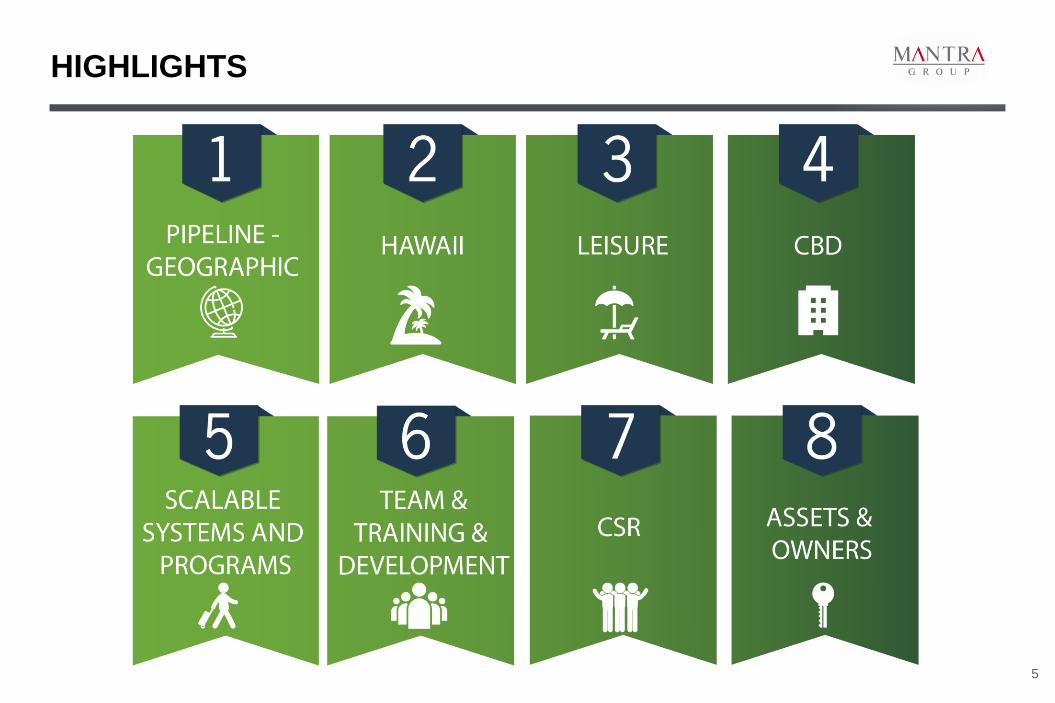
HIGHLIGHTS
5
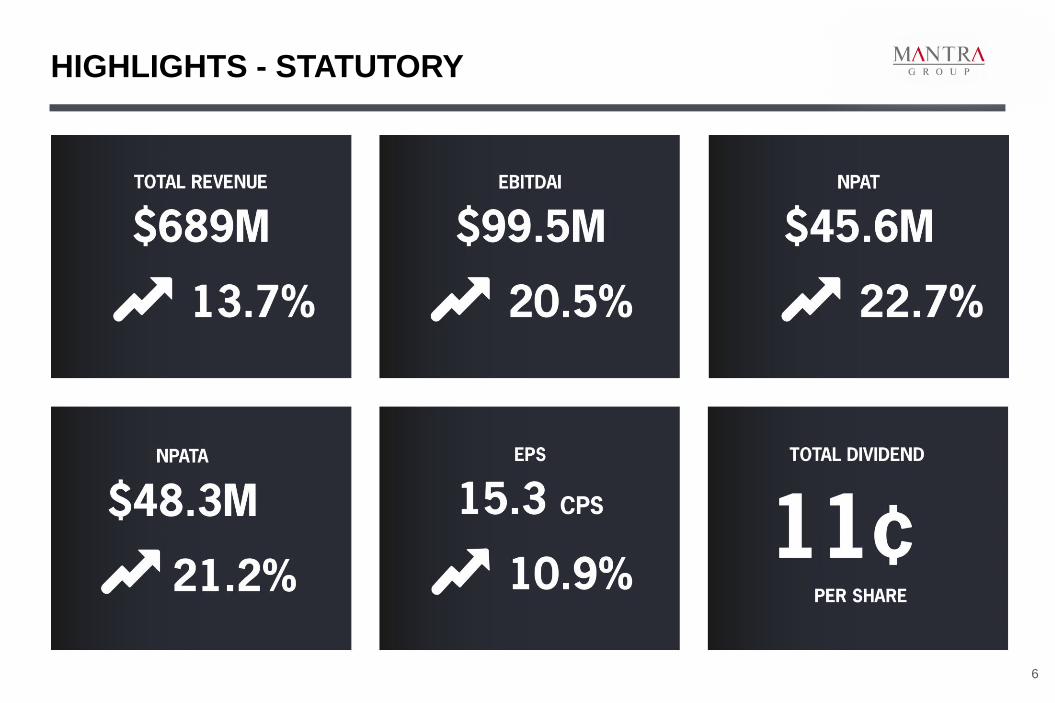
HIGHLIGHTS - STATUTORY
6
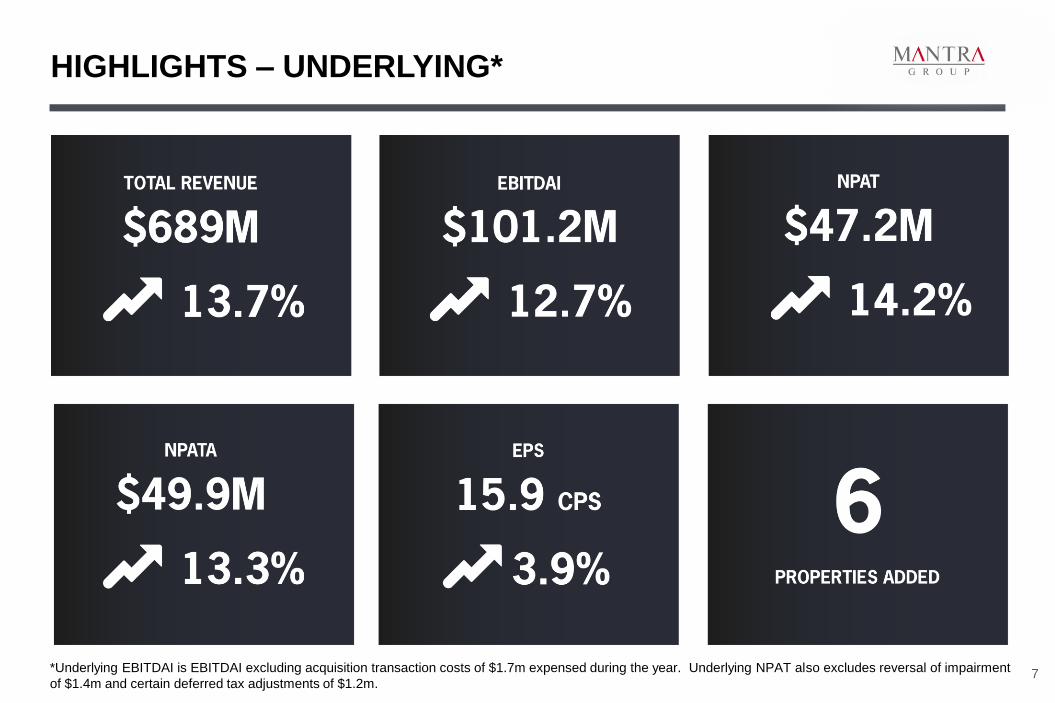
HIGHLIGHTS – UNDERLYING*
7 *Underlying EBITDAI is EBITDAI excluding acquisition transaction costs of $1.7m expensed during the year. Underlying NPAT also excludes reversal of impairment
of $1.4m and certain deferred tax adjustments of $1.2m.

HIGHLIGHTS – STRONG TRACK RECORD
8
*N/C – not calculated
** Underlying NPAT excludes transaction costs of $1.7m (FY2016: $7.3m) incurred in respect of business combinations, the reversal of impairment of $1.4m
(FY2016: $2.1m) and an impairment related deferred tax expense of $1.2m (FY2016: benefit of $1.0m).
Strong growth on all key metrics since listing in June 2014
Year ended Keys under
management Room nights
Underlying
EBITDAI $m
Underlying NPAT
$m
Underlying EPS
Cents per share
June 2014 11,500+ 2,400,000+ 61.3 (0.3) (0.3)
June 2015 13,000+ 2,700,000+ 73.1 36.2 14.2
June 2016 15,000+ 3,300,000+ 89.8 41.3 15.3
June 2017 16,500+ 3,675,000+ 101.2 47.2 15.9
Three year CAGR 13.1% 14.1% 18.2% N/C* N/C*

MANTRA GROUP’S BUSINESS
9

MANTRA GROUP LOCATIONS
Mantra Group benefits from diversified geographic presence in the Australian accommodation market and has a
growing presence in selected overseas markets
10
128 properties
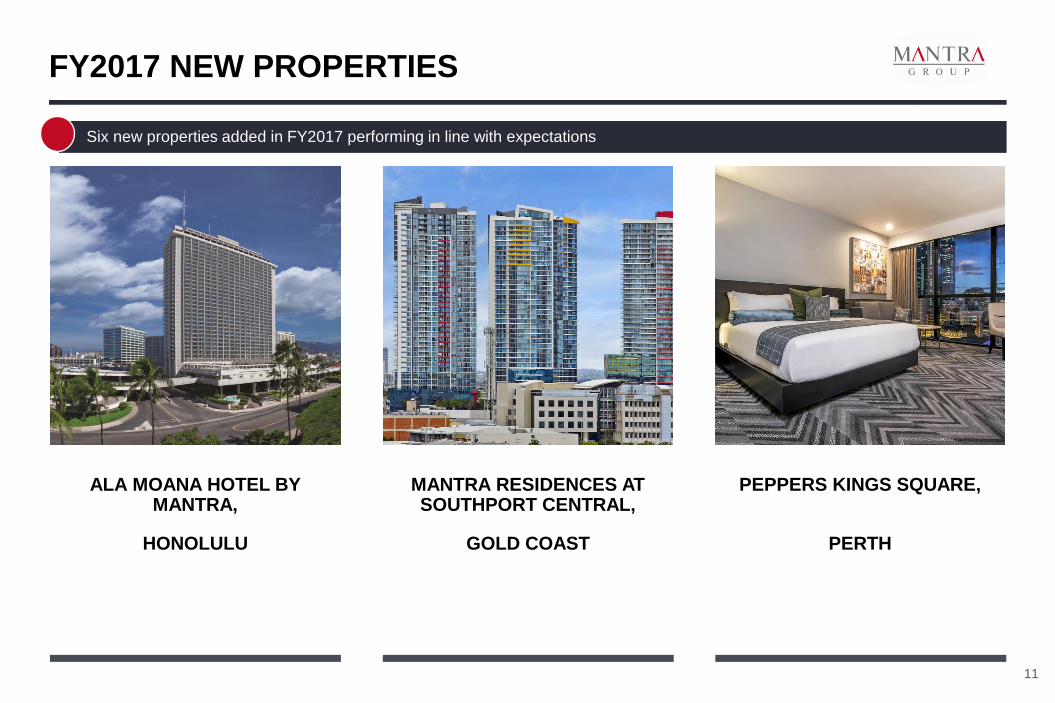
ALA MOANA HOTEL BY MANTRA,
HONOLULU
MANTRA RESIDENCES AT SOUTHPORT CENTRAL,
GOLD COAST
PEPPERS KINGS SQUARE,
PERTH
FY2017 NEW PROPERTIES
Six new properties added in FY2017 performing in line with expectations
11

MANTRA THE OBSERVATORY,
PORT MACQUARIE
MANTRA CLUB CROC,
AIRLIE BEACH
TRIBE PERTH,
WEST PERTH
FY2017 NEW PROPERTIES
12
Six new properties added in FY2017 performing in line with expectations

Internationally scalable & best in class
Sihot & Revenue Management
Mantrahotels.com – global booking channel
brand launch
Mantra+ loyalty launched - 100k+ members
SYSTEMS & PROGRAMS
13
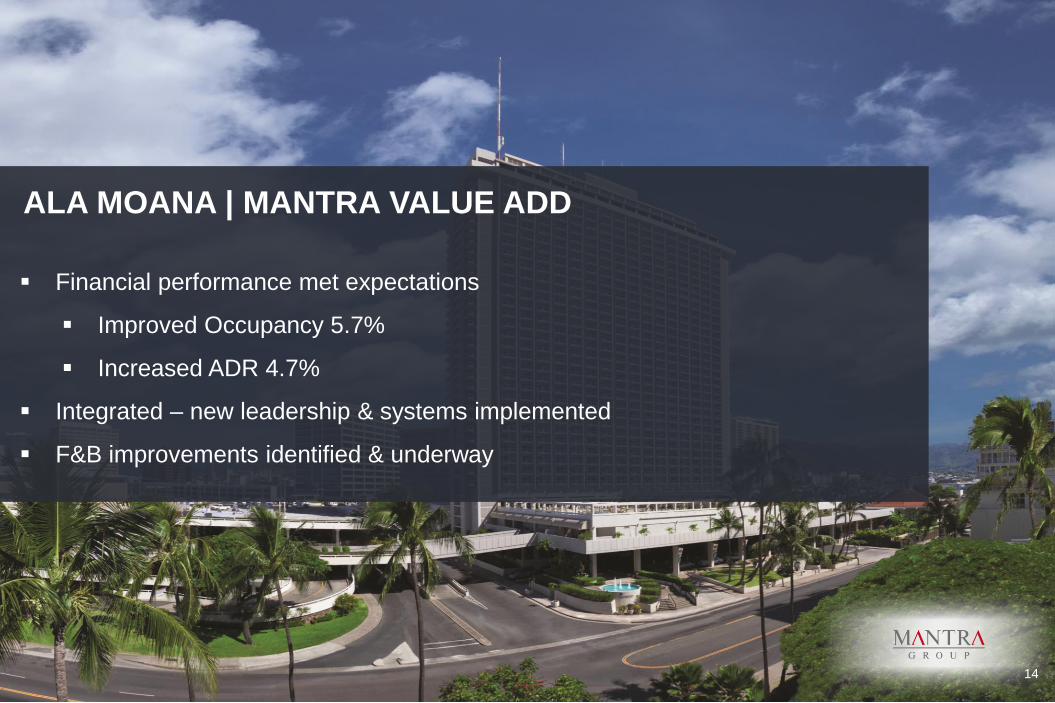
ALA MOANA | MANTRA VALUE ADD
Financial performance met expectations
Improved Occupancy 5.7%
Increased ADR 4.7%
Integrated – new leadership & systems implemented
F&B improvements identified & underway
14

• 5,500+ Team Members
• 21 Rising Stars
• 122 Emerging Leaders
• 86.3% Team Member satisfaction
• Women in Mantra & diversity initiatives
• 700+ Team Members next 12 months
• Employer of Choice 2017
• Mantra Awards for Excellence
TEAM & TRAINING & DEVELOPMENT
15
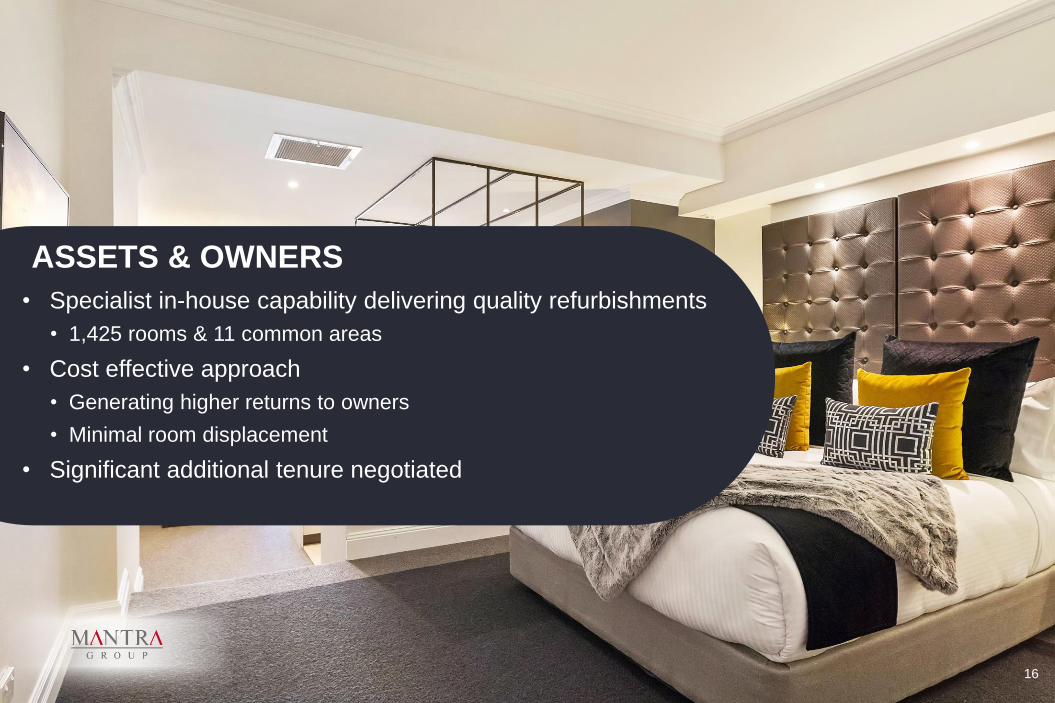
• Specialist in-house capability delivering quality refurbishments
• 1,425 rooms & 11 common areas
• Cost effective approach
• Generating higher returns to owners
• Minimal room displacement
• Significant additional tenure negotiated
16
ASSETS & OWNERS
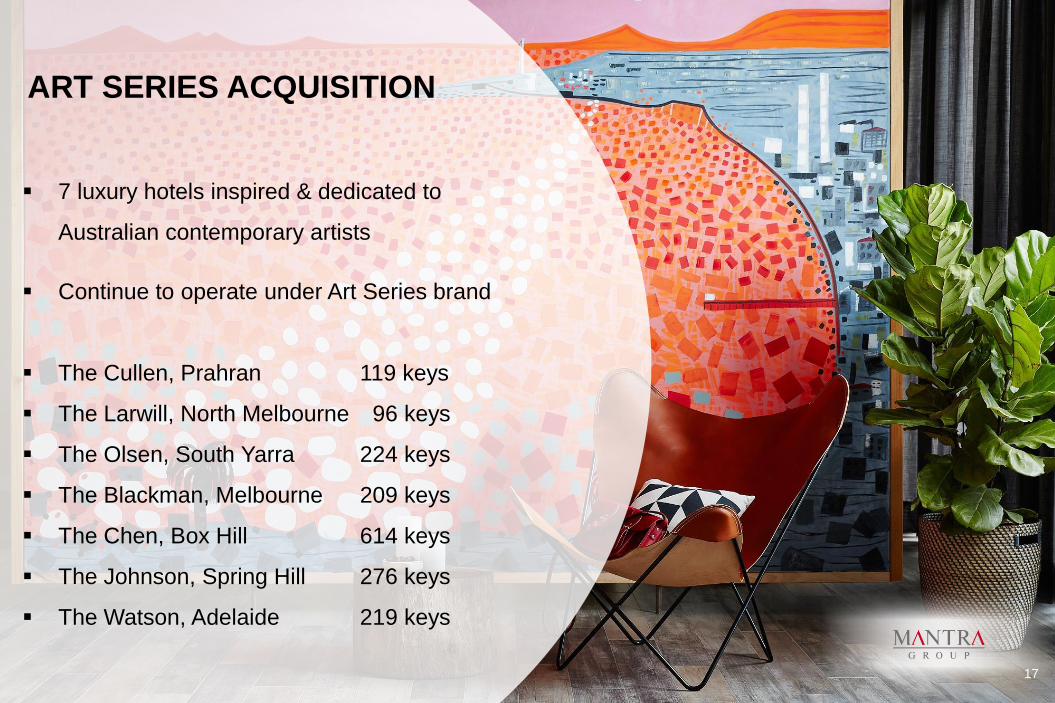
7 luxury hotels inspired & dedicated to
Australian contemporary artists
Continue to operate under Art Series brand
The Cullen, Prahran 119 keys
The Larwill, North Melbourne 96 keys
The Olsen, South Yarra 224 keys
The Blackman, Melbourne 209 keys
The Chen, Box Hill 614 keys
The Johnson, Spring Hill 276 keys
The Watson, Adelaide 219 keys
ART SERIES ACQUISITION
17

FINANCIAL PERFORMANCE
18

YEAR ON YEAR RESULTS OVERVIEW
• Strong FY2017 performance with occupancy,
ARR and RevPAR increasing 1.8%, 3.6% and
5.5% respectively
• Total revenue increased by 13.7% to $689m from
$606.1m
• Statutory EBITDAI increased by $16.9m (20.5%)
to $99.5m
• Strong revenue growth driven by:
• Six property acquisitions completed in the
period contributed $59.5m
• Organic growth of $23.4m
FY2017
($m)
FY2016
($m)
Change
($m)
Change
(%)
Total revenue 689.0 606.1 82.9 13.7
Statutory results
EBITDAI1 99.5 82.6 16.9 20.5
NPAT 45.6 37.2 8.4 22.7
NPATA 48.3 39.9 8.4 21.2
Underlying Results
EBITDAI1,2 101.2 89.8 11.4 12.7
NPAT2 47.2 41.3 5.9 14.2
NPATA2 49.9 44.0 5.9 13.3
Other key statistics
Rooms available (‘000) 4,650 4,234 416 9.8
Occupancy (%) 79.5 78.1 1.4 1.8
Average room rate ($) 175.24 169.14 6.1 3.6
RevPAR ($) 139.38 132.14 7.24 5.5
COMMENTS
1 EBITDAI – Earnings Before Interest, Taxation, Depreciation, Amortisation and Impairment
2 Underlying EBITDA is EBITDAI excluding transaction costs of $1.7m (FY2016: $7.3m) incurred in respect of business combinations. Underlying NPAT & NPATA also excludes the reversal of
impairment of $1.4m (FY2016: $2.1m) and an impairment related deferred tax expense of $1.2m (FY2016: benefit of $1.0m). 3 Organic excludes properties added in FY2017
19
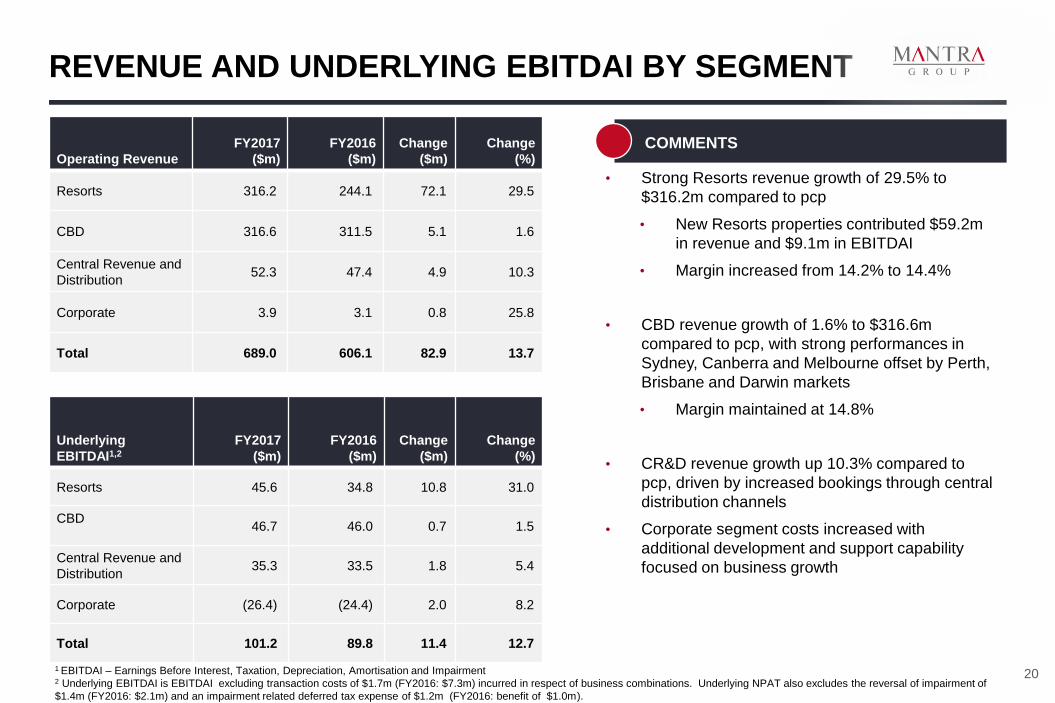
1 EBITDAI – Earnings Before Interest, Taxation, Depreciation, Amortisation and Impairment 2 Underlying EBITDAI is EBITDAI excluding transaction costs of $1.7m (FY2016: $7.3m) incurred in respect of business combinations. Underlying NPAT also excludes the reversal of impairment of
$1.4m (FY2016: $2.1m) and an impairment related deferred tax expense of $1.2m (FY2016: benefit of $1.0m).
REVENUE AND UNDERLYING EBITDAI BY SEGMENT
• Strong Resorts revenue growth of 29.5% to
$316.2m compared to pcp
• New Resorts properties contributed $59.2m
in revenue and $9.1m in EBITDAI
• Margin increased from 14.2% to 14.4%
• CBD revenue growth of 1.6% to $316.6m
compared to pcp, with strong performances in
Sydney, Canberra and Melbourne offset by Perth,
Brisbane and Darwin markets
• Margin maintained at 14.8%
• CR&D revenue growth up 10.3% compared to
pcp, driven by increased bookings through central
distribution channels
• Corporate segment costs increased with
additional development and support capability
focused on business growth
Operating Revenue
FY2017
($m)
FY2016
($m)
Change
($m)
Change
(%)
Resorts 316.2 244.1 72.1 29.5
CBD 316.6 311.5 5.1 1.6
Central Revenue and
Distribution 52.3 47.4 4.9 10.3
Corporate 3.9 3.1 0.8 25.8
Total 689.0 606.1 82.9 13.7
Underlying
EBITDAI1,2
FY2017
($m)
FY2016
($m)
Change
($m)
Change
(%)
Resorts 45.6 34.8 10.8 31.0
CBD
46.7 46.0 0.7 1.5
Central Revenue and
Distribution 35.3 33.5 1.8 5.4
Corporate (26.4) (24.4) 2.0 8.2
Total 101.2 89.8 11.4 12.7
COMMENTS
20

FY2017
Actual
FY2016
Actual Change
Change
(%)
Total rooms available (‘000) 2,748 2,364 384 16.2
Paid rooms sold (‘000) 2,084 1,732 351 20.3
Occupancy (%) 75.8 73.3 2.5 3.4
Average room rate ($) 177.91 165.30 12.62 7.6
RevPAR ($) 134.88 121.12 13.76 11.4
RESORTS SEGMENT - HIGHLIGHTS
Outstanding growth in Resorts segment across all key metrics
RevPAR movements in key regions
Gold Coast 2.1% Dreamworld impacted record bookings
Sunshine Coast 11.7% Noosa key driver due to strong leisure demand
TNQ 5.2% Strong domestic and Asian inbound
New Zealand 15.2% Strong leisure and Asian inbound
Hawaii N/A Delivered improvements in first year
Pipeline FY2018-FY2020 Keys
Scheduled* 0
Targeted** 2,612
21
* Scheduled – agreements are signed and properties will join the portfolio, subject to customary completion terms
** Targeted – contracts are under negotiation
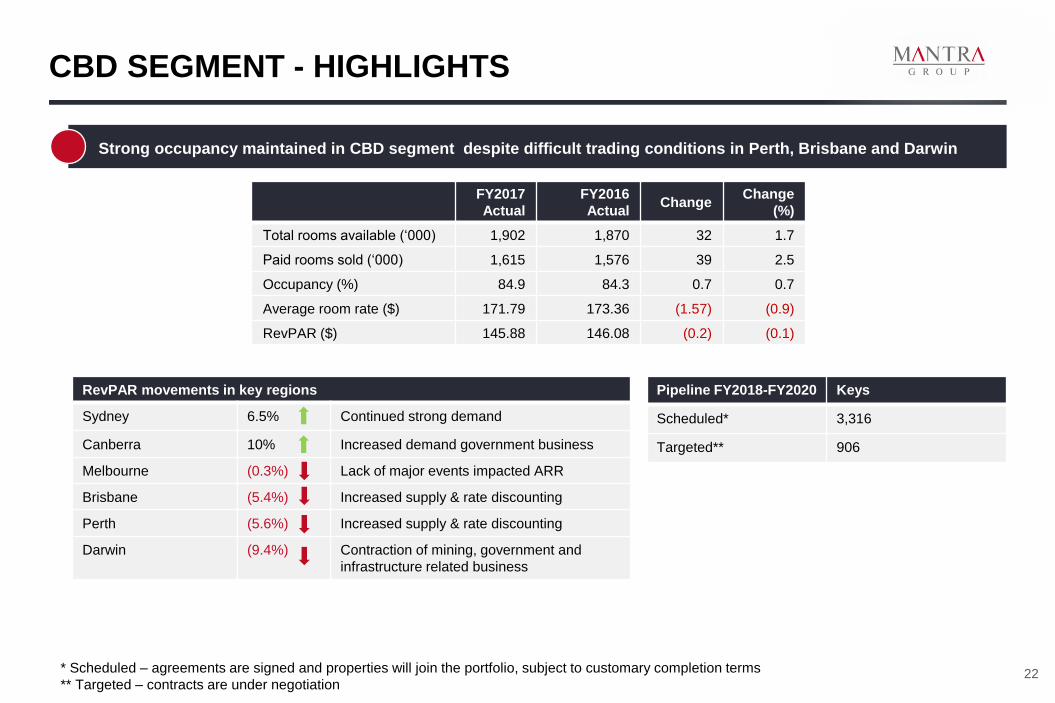
CBD SEGMENT - HIGHLIGHTS
Strong occupancy maintained in CBD segment despite difficult trading conditions in Perth, Brisbane and Darwin
FY2017
Actual
FY2016
Actual Change
Change
(%)
Total rooms available (‘000) 1,902 1,870 32 1.7
Paid rooms sold (‘000) 1,615 1,576 39 2.5
Occupancy (%) 84.9 84.3 0.7 0.7
Average room rate ($) 171.79 173.36 (1.57) (0.9)
RevPAR ($) 145.88 146.08 (0.2) (0.1)
RevPAR movements in key regions
Sydney 6.5% Continued strong demand
Canberra 10% Increased demand government business
Melbourne (0.3%) Lack of major events impacted ARR
Brisbane (5.4%) Increased supply & rate discounting
Perth (5.6%) Increased supply & rate discounting
Darwin (9.4%) Contraction of mining, government and
infrastructure related business
Pipeline FY2018-FY2020 Keys
Scheduled* 3,316
Targeted** 906
22 * Scheduled – agreements are signed and properties will join the portfolio, subject to customary completion terms
** Targeted – contracts are under negotiation
CR&D SEGMENT - HIGHLIGHTS
Growth experienced in CR&D segment
• CR&D revenue growth of 10.3% to $52.3m
• EBITDAI growth of 5.4% to $35.3m
• Growth resulted from the increased central reservations commissions
driven by on-line booking volume as a result of the increased number of
rooms in the portfolio
23

STATUTORY PROFIT AND LOSS FOR THE PERIOD
FY2017
($m)
FY2016
($m)
Change
($m)
Change
%
Operating revenue 689.0 606.1 82.9 13.7
Other income 0 0.1 (0.1) (100)
Total operating expenses (589.5) (523.6) 65.9 12.6
EBITDAI1 99.5 82.6 16.9 20.5
Net reversal of impairment 1.4 2.1 (0.7) (32.1)
Depreciation and amortisation (excluding
amortisation of lease rights) (23.9) (19.5) (4.4) 22.4
Amortisation of lease rights (3.8) (3.8) 0 0
Net finance costs (4.7) (5.2) (0.5) (10.0)
Profit before tax 68.6 56.2 12.4 22.0
Tax expense (23.0) (19.1) 3.9 20.5
NPAT 45.6 37.1 8.4 22.7
NPATA 48.3 39.8 8.4 21.2
EPS 15.3 13.8 1.5 10.9
COMMENTS
1 EBITDAI – Earnings Before Interest, Taxation, Depreciation, Amortisation and Impairment 2 Organic excludes properties added in FY2017
• Business has performed strongly in FY2017
• Revenue, EBITDAI, NPAT and NPATA all
performed ahead of the pcp
• Operating revenue increased by $82.9m
(13.7%)
• EBITDAI increased by $16.9m (20.5%)
• Growth in NPAT impacted by transaction
costs arising from business combinations
(FY2017: $1.7m, FY2016:$7.3m)
• Strong revenue growth driven by
• Six property acquisitions completed in the
period (increase of $59.5m)
• Remaining increase driven by organic2
growth (increase of $23.4m)
• Net reversal of impairment of $1.4m in FY2017.
All intangible assets are tested for impairment at
least annually.
24
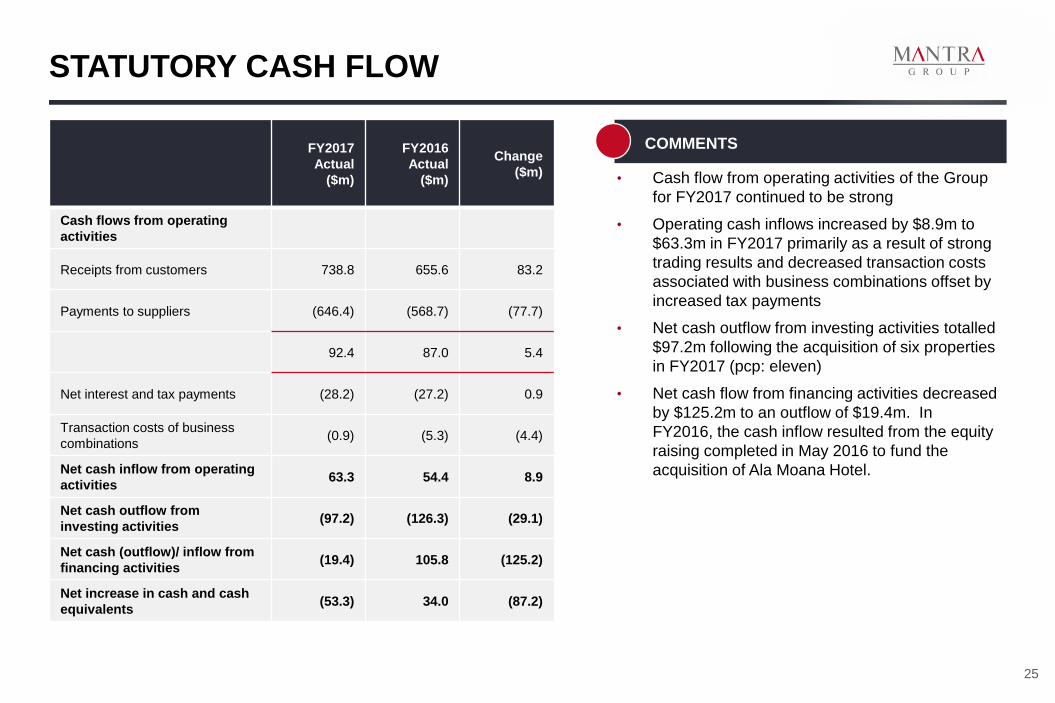
STATUTORY CASH FLOW
• Cash flow from operating activities of the Group
for FY2017 continued to be strong
• Operating cash inflows increased by $8.9m to
$63.3m in FY2017 primarily as a result of strong
trading results and decreased transaction costs
associated with business combinations offset by
increased tax payments
• Net cash outflow from investing activities totalled
$97.2m following the acquisition of six properties
in FY2017 (pcp: eleven)
• Net cash flow from financing activities decreased
by $125.2m to an outflow of $19.4m. In
FY2016, the cash inflow resulted from the equity
raising completed in May 2016 to fund the
acquisition of Ala Moana Hotel.
FY2017
Actual
($m)
FY2016
Actual
($m)
Change
($m)
Cash flows from operating
activities
Receipts from customers 738.8 655.6 83.2
Payments to suppliers (646.4) (568.7) (77.7)
92.4 87.0 5.4
Net interest and tax payments (28.2) (27.2) 0.9
Transaction costs of business
combinations (0.9) (5.3) (4.4)
Net cash inflow from operating
activities 63.3 54.4 8.9
Net cash outflow from
investing activities (97.2) (126.3) (29.1)
Net cash (outflow)/ inflow from
financing activities (19.4) 105.8 (125.2)
Net increase in cash and cash
equivalents (53.3) 34.0 (87.2)
COMMENTS
25

BALANCE SHEET AND CREDIT METRICS
Statutory balance sheet
30 Jun 17
Actual
$m
30 Jun 16
Actual
$m
Cash and cash equivalents 62.9 117.1
Other current assets 67.2 60.0
Current assets 130.2 177.1
PPE 157.7 121.9
Intangible assets 513.4 469.4
Other non-current assets 5.1 0.7
Total non-current assets 676.1 591.9
Total assets 806.3 769.0
Trade and other payables 52.6 44.8
Other liabilities 45.0 44.6
Total current liabilities 97.6 89.3
Borrowings 135.3 125.1
Other non-current liabilities 95.4 91.5
Total non-current liabilities 230.7 216.6
Total liabilities 328.3 306.0
Net assets 477.9 463.1
Credit metrics 30 Jun 17
Actual
$m
30 Jun 16
adjusted*
$m
Borrowings ($m) 135.3 125.1
Cash and cash equivalents ($m) 62.9 62.3
Net total indebtedness ($m) 72.4 62.8
Net debt /LTM Underlying
EBITDAI 0.7x 0.7x
FY2017 LTM Underlying
EBITDAI/LTM Net finance cost 21.7x 17.4x
• Strong balance sheet and cash position leaves
the Group sufficient facilities to fund the Art
Series Hotel Group acquisition out of current
available funds
• Intangible assets have increased by $44.0m
(9.4%) since 30 June 2016 following the
acquisition of six properties. Useful life of
intangible assets is reassessed each year.
• The Group is well within debt covenants under
banking facilities
COMMENTS
*Cash balance adjusted to remove cash used to purchase Ala Moana in July 2016 26
STRATEGY AND OUTLOOK
27

Mantra Group expects FY2018 Underlying
EBITDAI to be between $107m - $115m in
constant currency terms
• In our commitment to drive ongoing growth and
deliver shareholder value in FY2018, Mantra Group
will continue to deliver on its key strategies
supporting these objectives
• Art Series start date subject to conditions precedent
• Peppers FV subject to conditions precedent
• FY2018 growth expected across the Resorts, CBD
and CR&D segments
28
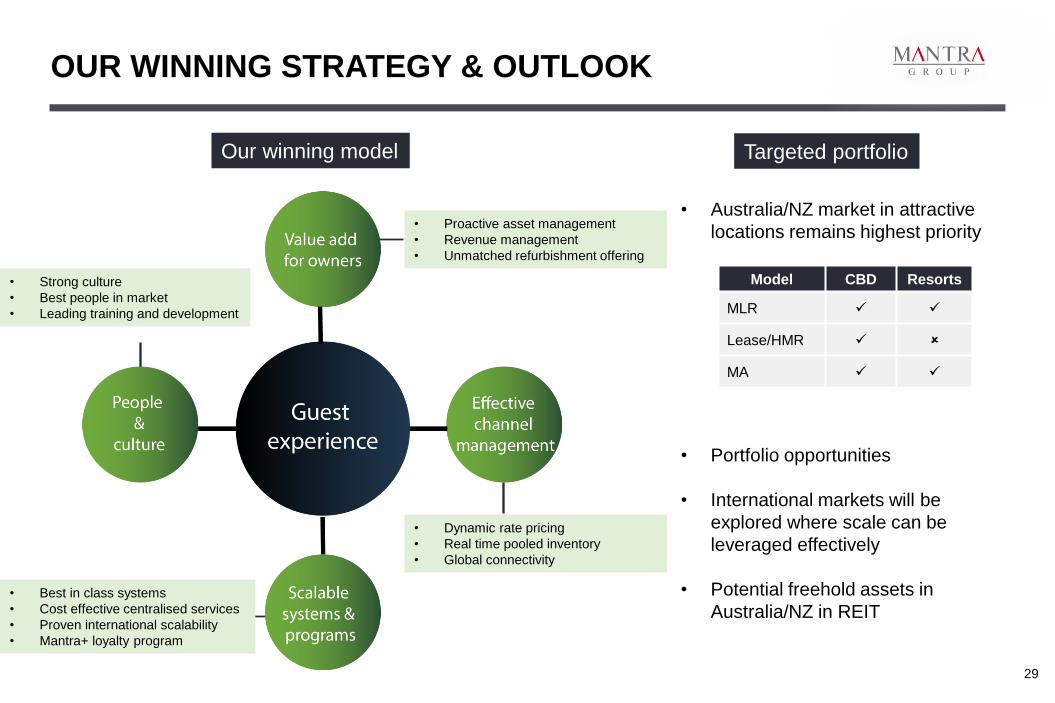
OUR WINNING STRATEGY & OUTLOOK
29
Our winning model Targeted portfolio
• Australia/NZ market in attractive
locations remains highest priority
• Portfolio opportunities
• International markets will be
explored where scale can be
leveraged effectively
• Potential freehold assets in
Australia/NZ in REIT
Model CBD Resorts
MLR
Lease/HMR
MA
• Proactive asset management
• Revenue management
• Unmatched refurbishment offering
• Dynamic rate pricing
• Real time pooled inventory
• Global connectivity
• Best in class systems
• Cost effective centralised services
• Proven international scalability
• Mantra+ loyalty program
• Strong culture
• Best people in market
• Leading training and development

PROPERTIES SCHEDULED TO ENTER PORTFOLIO
30
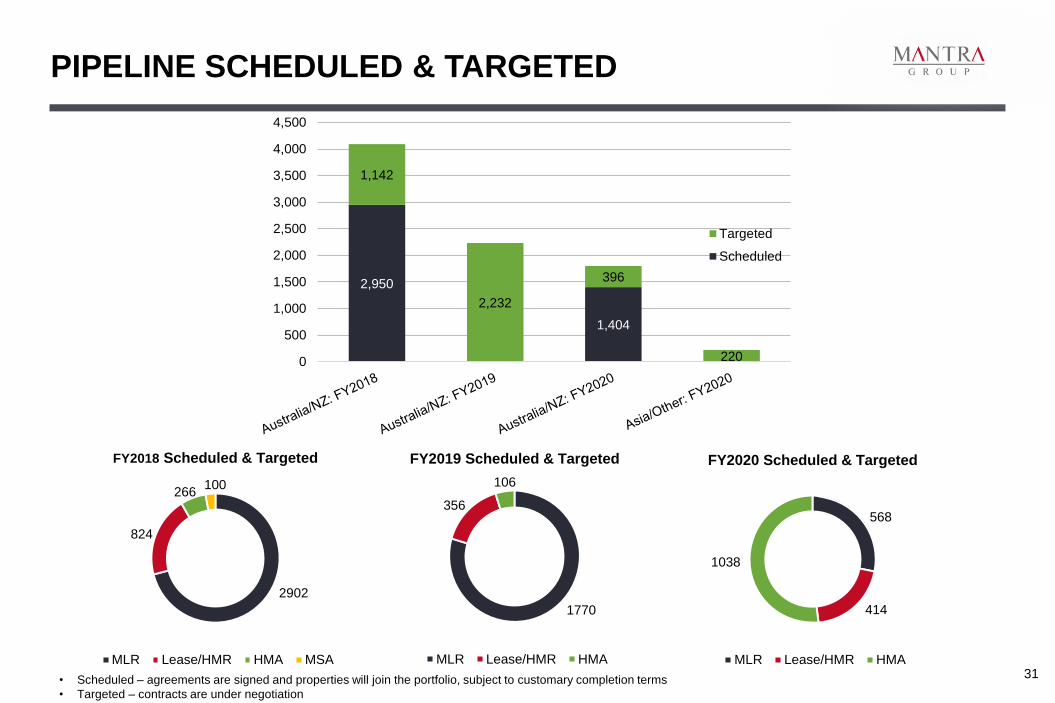
568
414
1038
FY2020 Scheduled & Targeted
MLR Lease/HMR HMA
2902
824
266 100
FY2018 Scheduled & Targeted
MLR Lease/HMR HMA MSA
2,950
1,404
1,142
2,232
396
220 0
500
1,000
1,500
2,000
2,500
3,000
3,500
4,000
4,500
Targeted
Scheduled
1770
356
106
FY2019 Scheduled & Targeted
MLR Lease/HMR HMA
PIPELINE SCHEDULED & TARGETED
31 • Scheduled – agreements are signed and properties will join the portfolio, subject to customary completion terms
• Targeted – contracts are under negotiation

Strong performance for FY2017 maintaining market leading position
Highly cash generative business
Australian tourism sector continues to strengthen with strong gains in domestic and international tourism
Continue to leverage our proven core capabilities to deliver our growth strategy
The business is in prime position to capitalise on opportunities
CONCLUSION
32

APPENDIX
33

PROPERTIES SCHEDULED TO ENTER PORTFOLIO
34
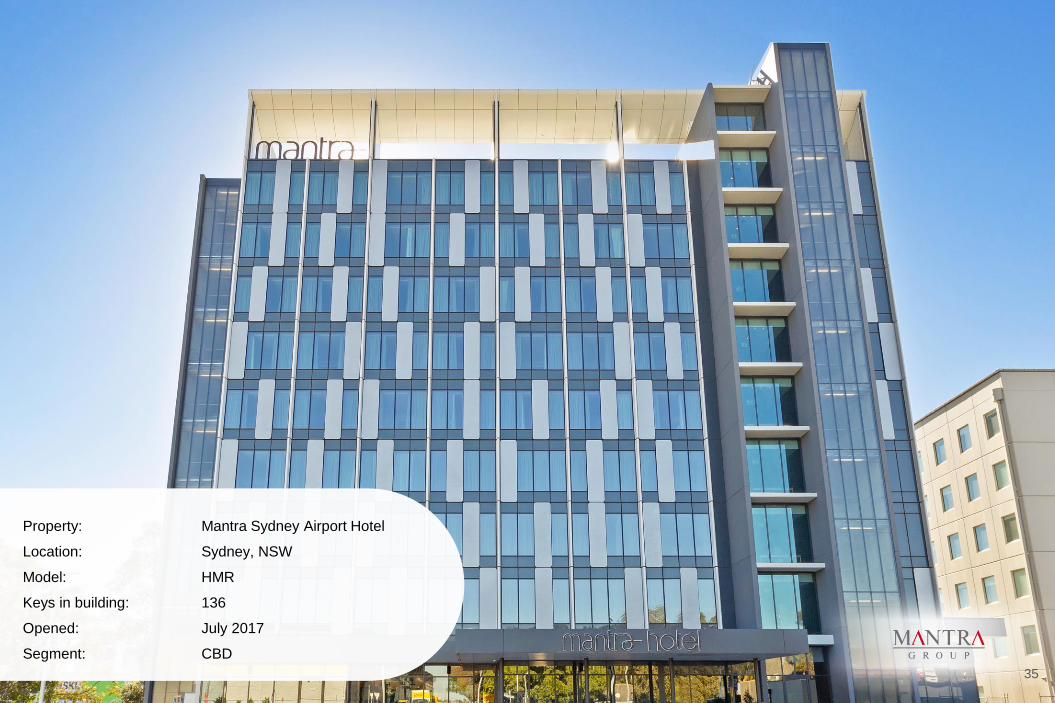
Property: Mantra Sydney Airport Hotel
Location: Sydney, NSW
Model: HMR
Keys in building: 136
Opened: July 2017
Segment: CBD
35
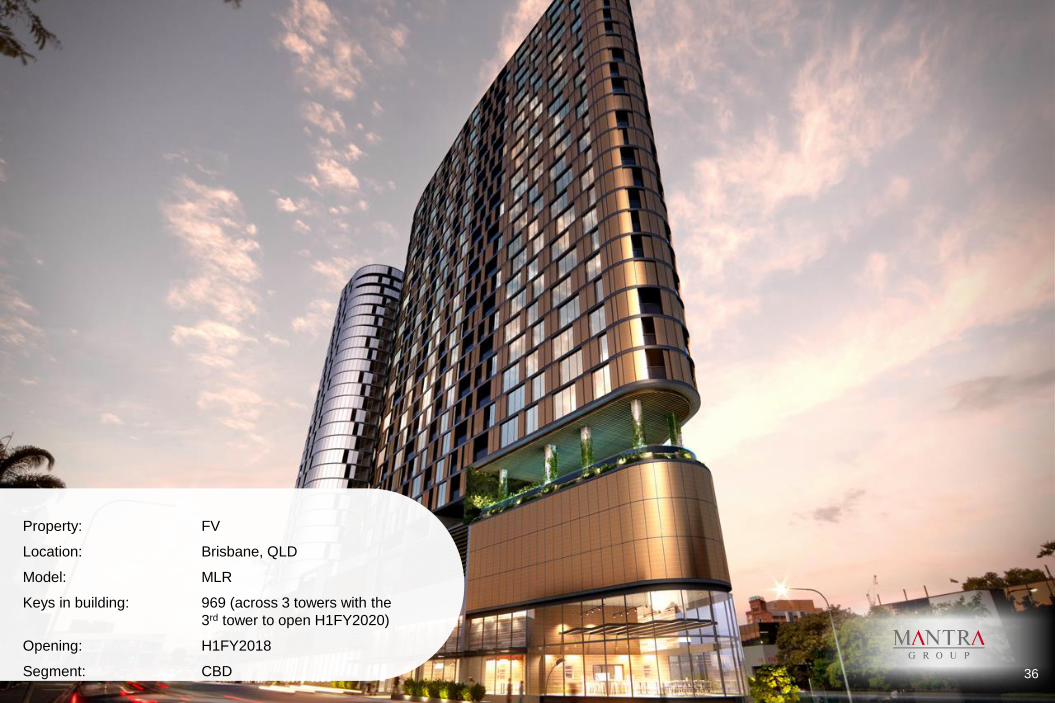
Property: FV
Location: Brisbane, QLD
Model: MLR
Keys in building: 969 (across 3 towers with the
3rd tower to open H1FY2020)
Opening: H1FY2018
Segment: CBD
36
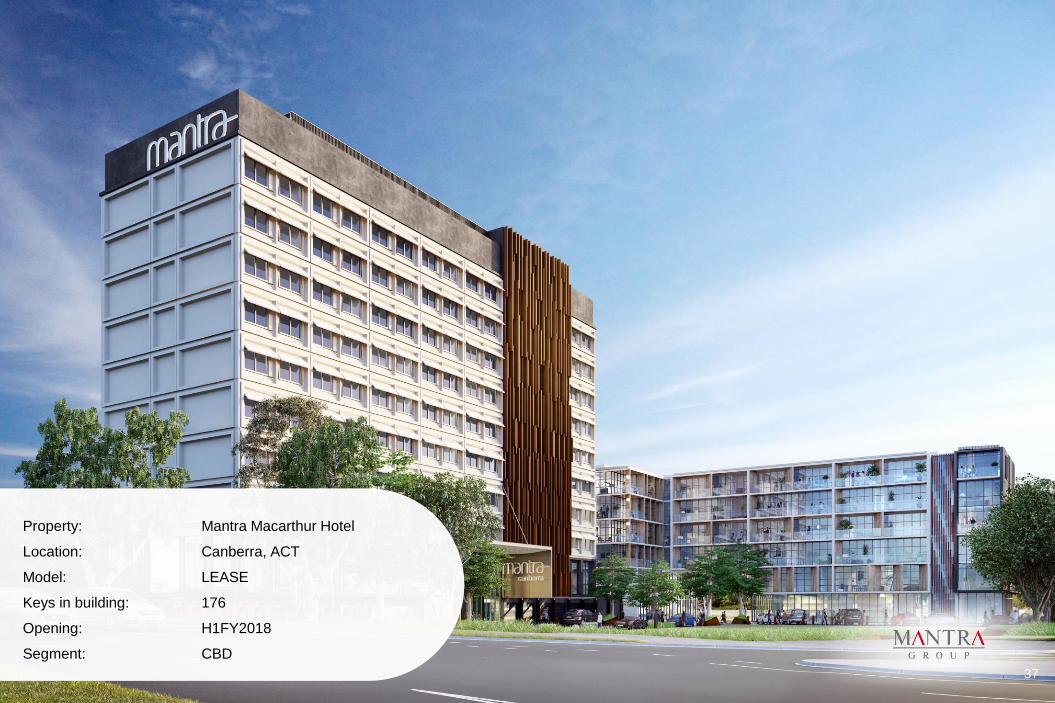
Property: Mantra Macarthur Hotel
Location: Canberra, ACT
Model: LEASE
Keys in building: 176
Opening: H1FY2018
Segment: CBD
37
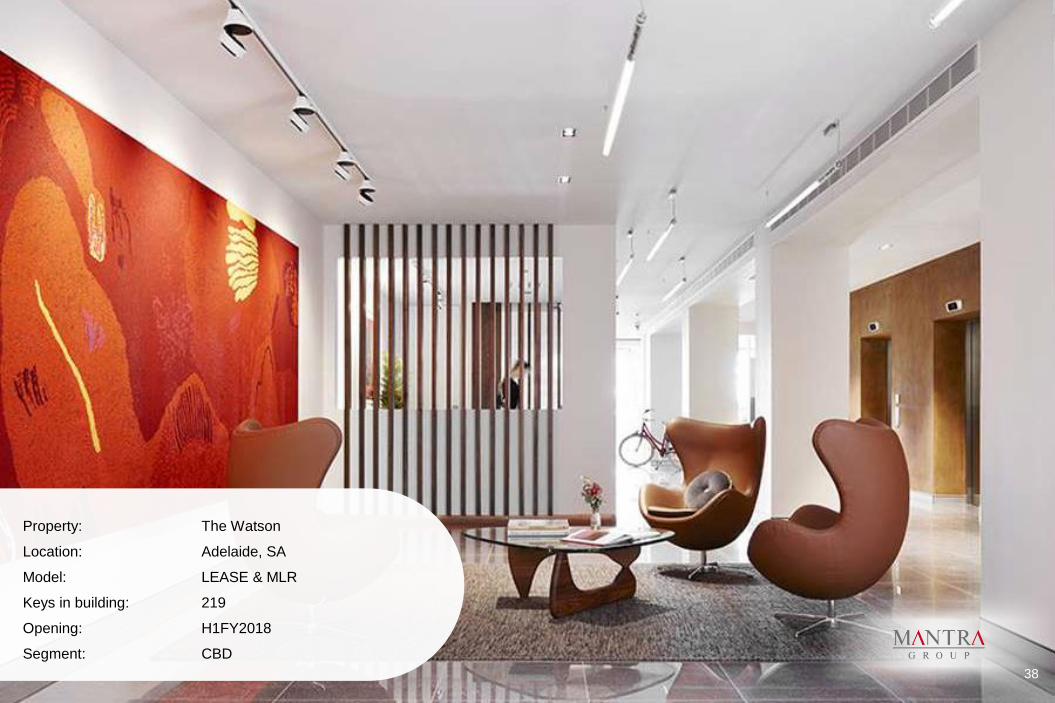
Property: The Watson
Location: Adelaide, SA
Model: LEASE & MLR
Keys in building: 219
Opening: H1FY2018
Segment: CBD
38
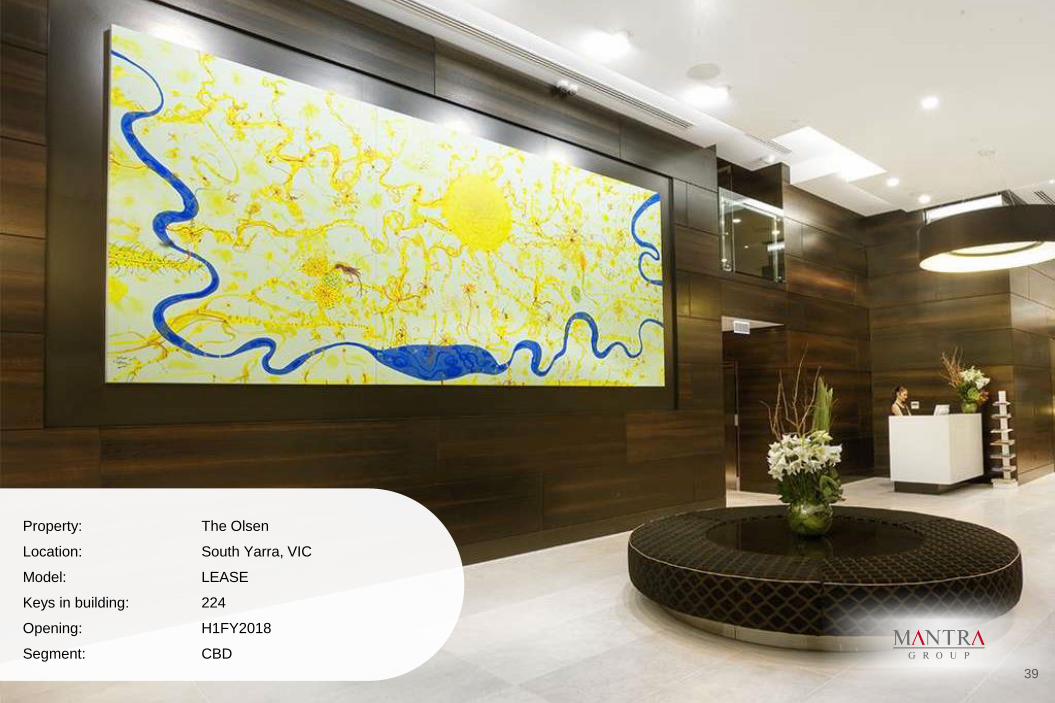
Property: The Olsen
Location: South Yarra, VIC
Model: LEASE
Keys in building: 224
Opening: H1FY2018
Segment: CBD
39

Property: The Blackman
Location: Melbourne, VIC
Model: LEASE
Keys in building: 209
Opening: H1FY2018
Segment: CBD
40

Property: The Cullen
Location: Prahran, VIC
Model: LEASE
Keys in building: 119
Opening: H1FY2018
Segment: CBD
41

Property: The Larwill
Location: Melbourne, VIC
Model: LEASE
Keys in building: 96
Opening: H1FY2018
Segment: CBD
42
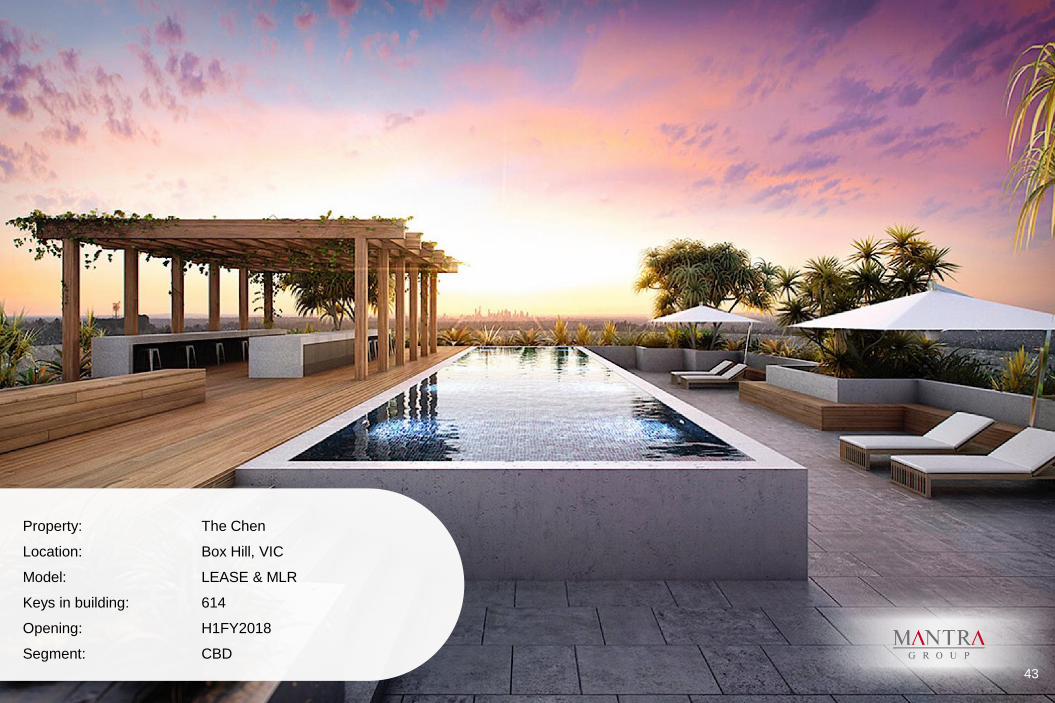
Property: The Chen
Location: Box Hill, VIC
Model: LEASE & MLR
Keys in building: 614
Opening: H1FY2018
Segment: CBD
43

Property: The Johnson
Location: Spring Hill, QLD
Model: LEASE & MLR
Keys in building: 276
Opening: H1FY2018
Segment: CBD
44
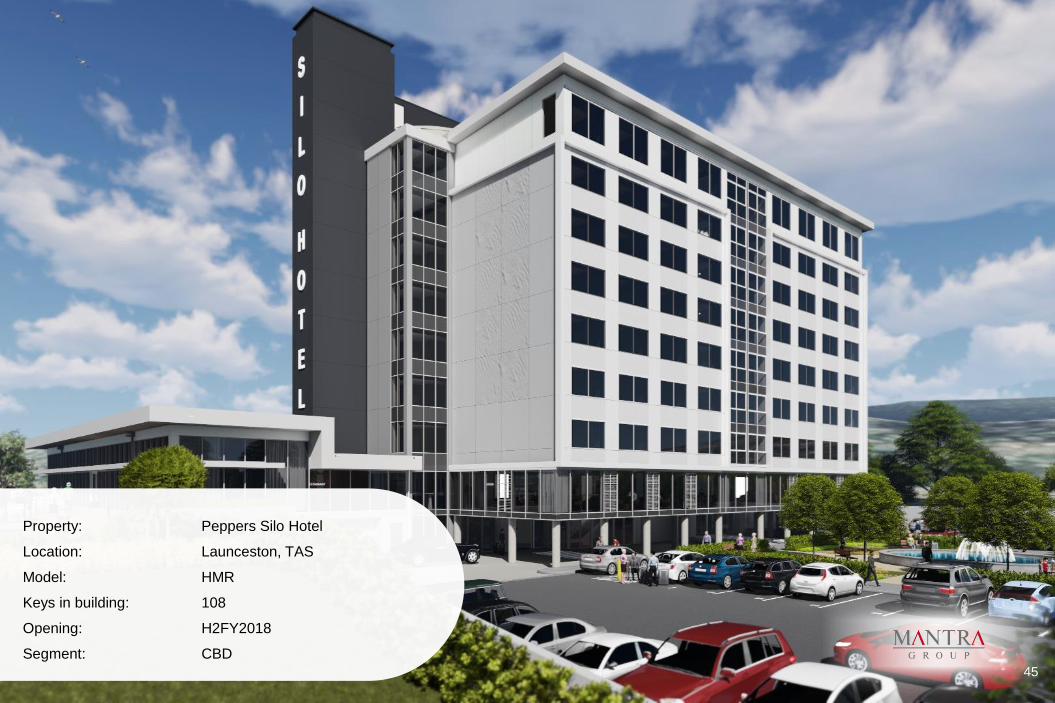
Property: Peppers Silo Hotel
Location: Launceston, TAS
Model: HMR
Keys in building: 108
Opening: H2FY2018
Segment: CBD
45 45
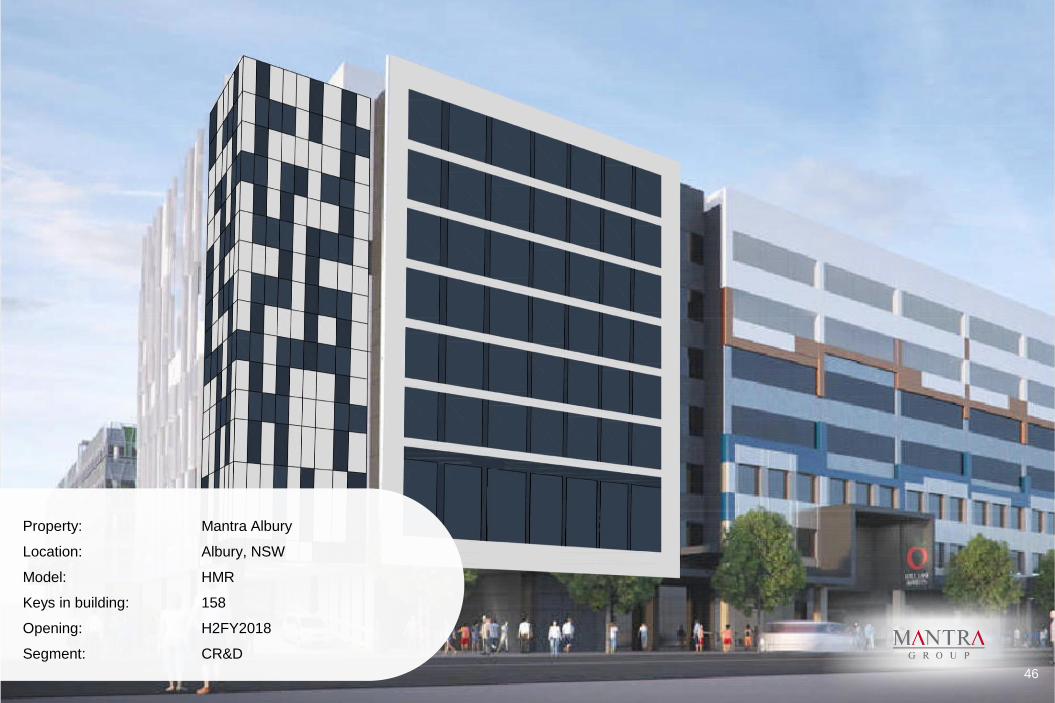
Property: Mantra Albury
Location: Albury, NSW
Model: HMR
Keys in building: 158
Opening: H2FY2018
Segment: CR&D
46

Property: Mantra Southport Sharks
Location: Gold Coast, QLD
Model: MSA
Keys in building: 100
Opening: H2FY2018
Segment: CORPORATE
47

Property: Mantra 900 Hay Street
Location: Perth, WA
Model: LEASE
Keys in building: 250
Opening: H1FY2020
Segment: CBD
48

Property: Peppers Southbank Melbourne
Location: Melbourne, VIC
Model: LEASE
Keys in building: 164
Opening: H1FY2020
Segment: CBD
49
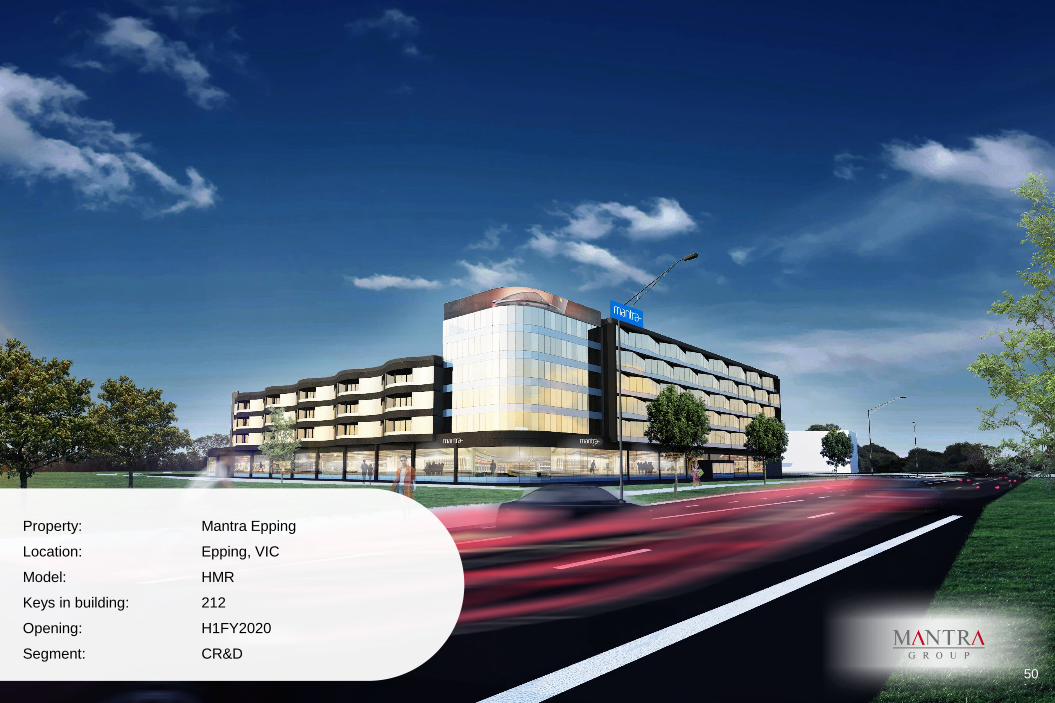
Property: Mantra Epping
Location: Epping, VIC
Model: HMR
Keys in building: 212
Opening: H1FY2020
Segment: CR&D
50 50

Property: Peppers Queenstown
Location: Queenstown, New Zealand
Model: HMR
Keys in building: 260
Opening: H2FY2020
Segment: CR&D
51
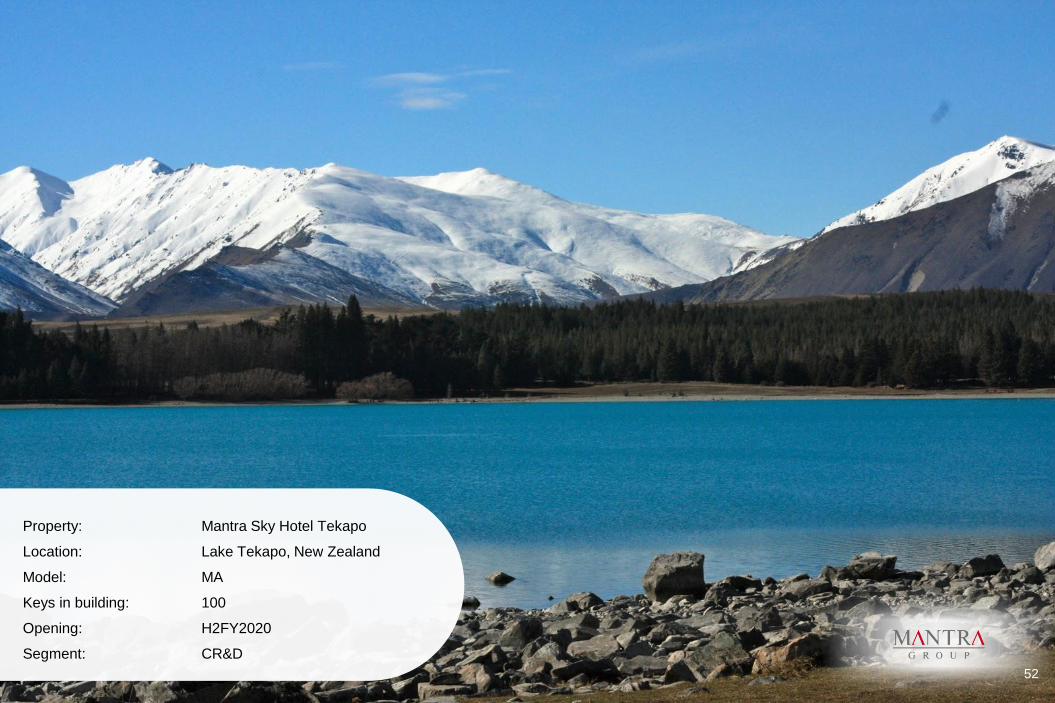
Property: Mantra Sky Hotel Tekapo
Location: Lake Tekapo, New Zealand
Model: MA
Keys in building: 100
Opening: H2FY2020
Segment: CR&D
52
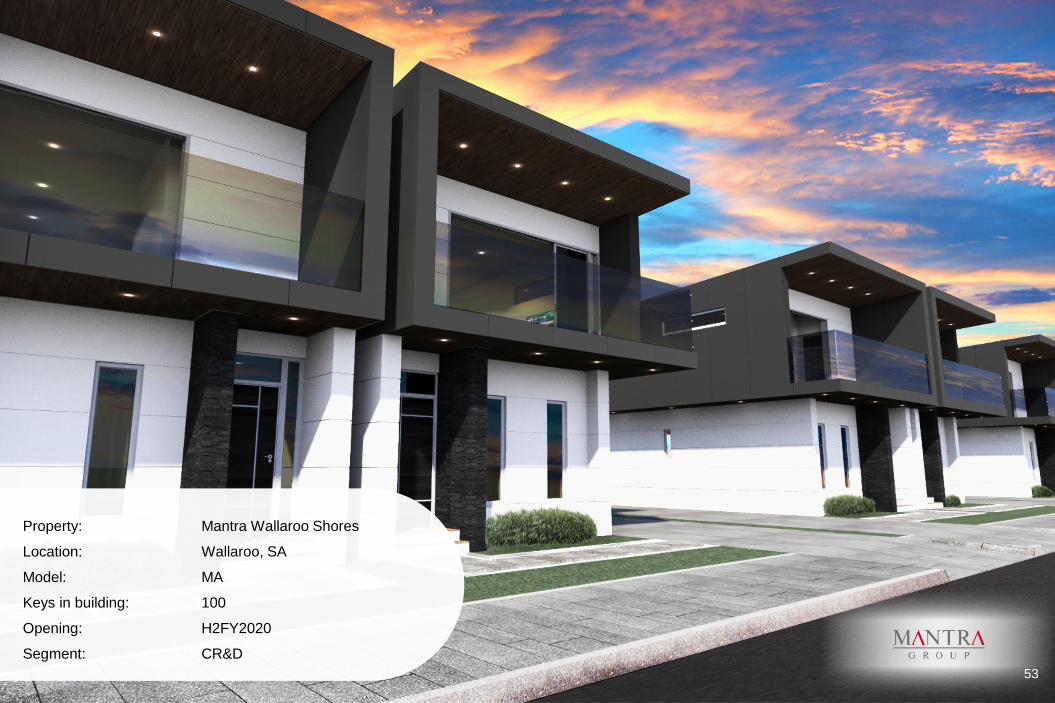
Property: Mantra Wallaroo Shores
Location: Wallaroo, SA
Model: MA
Keys in building: 100
Opening: H2FY2020
Segment: CR&D
53
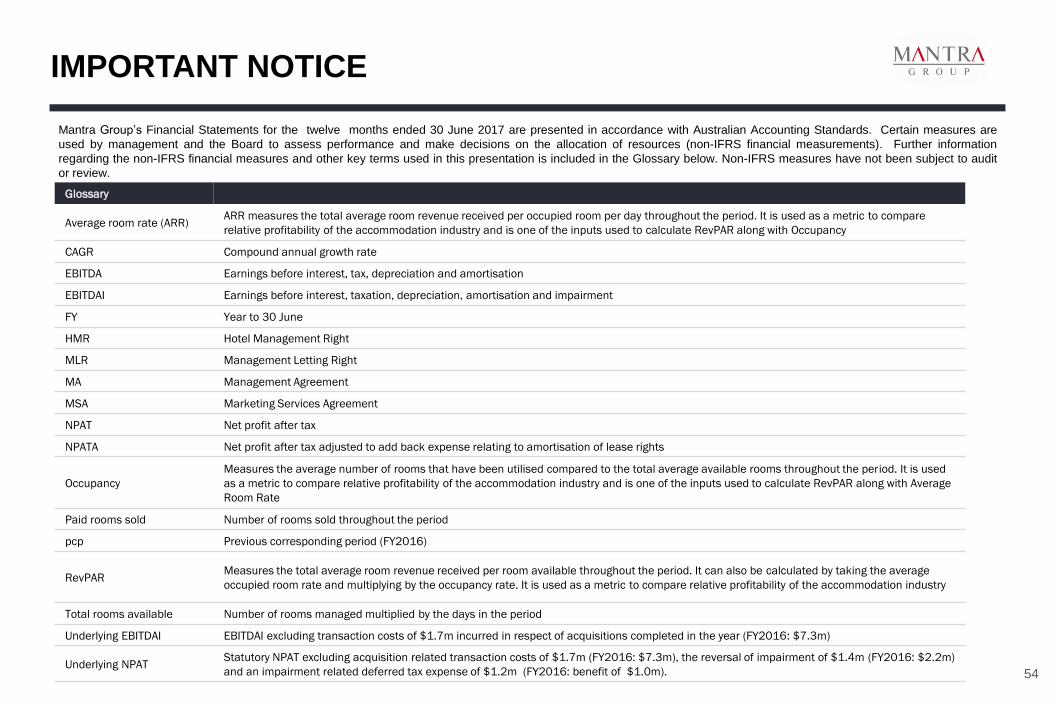
IMPORTANT NOTICE
Mantra Group’s Financial Statements for the twelve months ended 30 June 2017 are presented in accordance with Australian Accounting Standards. Certain measures are
used by management and the Board to assess performance and make decisions on the allocation of resources (non-IFRS financial measurements). Further information
regarding the non-IFRS financial measures and other key terms used in this presentation is included in the Glossary below. Non-IFRS measures have not been subject to audit
or review.
Glossary
Average room rate (ARR) ARR measures the total average room revenue received per occupied room per day throughout the period. It is used as a metric to compare
relative profitability of the accommodation industry and is one of the inputs used to calculate RevPAR along with Occupancy
CAGR Compound annual growth rate
EBITDA Earnings before interest, tax, depreciation and amortisation
EBITDAI Earnings before interest, taxation, depreciation, amortisation and impairment
FY Year to 30 June
HMR Hotel Management Right
MLR Management Letting Right
MA Management Agreement
MSA Marketing Services Agreement
NPAT Net profit after tax
NPATA Net profit after tax adjusted to add back expense relating to amortisation of lease rights
Occupancy
Measures the average number of rooms that have been utilised compared to the total average available rooms throughout the period. It is used
as a metric to compare relative profitability of the accommodation industry and is one of the inputs used to calculate RevPAR along with Average
Room Rate
Paid rooms sold Number of rooms sold throughout the period
pcp Previous corresponding period (FY2016)
RevPAR Measures the total average room revenue received per room available throughout the period. It can also be calculated by taking the average
occupied room rate and multiplying by the occupancy rate. It is used as a metric to compare relative profitability of the accommodation industry
Total rooms available Number of rooms managed multiplied by the days in the period
Underlying EBITDAI EBITDAI excluding transaction costs of $1.7m incurred in respect of acquisitions completed in the year (FY2016: $7.3m)
Underlying NPAT Statutory NPAT excluding acquisition related transaction costs of $1.7m (FY2016: $7.3m), the reversal of impairment of $1.4m (FY2016: $2.2m)
and an impairment related deferred tax expense of $1.2m (FY2016: benefit of $1.0m). 54