FY17 highlights - Ingenia Communities · FY17 statutory profit includes $12.7 million fair value...
43
Transcript of FY17 highlights - Ingenia Communities · FY17 statutory profit includes $12.7 million fair value...


2

FY17 highlightsGuidance exceeded, supported by strong sales result
3
STRATEGY
Portfolio refined in line with strategy – non core assets divested, lifestyle now largest contributor to earnings
33 lifestyle and holiday communities – a further four under contract or option
Over 2,470 development sites secured (90% in metro and coastal locations)
FINANCIAL
EBIT $32.1 million – above guidance and up 32.6% on FY16
Strong operating cashflows of $30.3 million – up 44.3% on FY16
Revenue of $149.9 million – up 40.0% on FY16
Strong balance sheet - LVR of 28%
OPERATIONSLifestyle and holidays rental revenue up 35.1% on FY16
Record occupancy across Ingenia Gardens portfolio – 92.8%
DEVELOPMENT Record 211 new home settlements – up 97.2% on FY16
Development now underway in 12 communities - two more to follow FY18

A five year storyDelivering growth with significant embedded value
4
EBIT (Continuing Operations) Income Generating Sites
New Home Settlements Ingenia Gardens Occupancy (%)
1,750
3,9324,435
5,337
6,843
0
1,000
2,000
3,000
4,000
5,000
6,000
7,000
8,000
FY13 FY14 FY15 FY16 FY17
85.1 84.6
90.7 90.792.8
80.0
82.0
84.0
86.0
88.0
90.0
92.0
94.0
FY13 FY14 FY15 FY16 FY170 1252
107
211
0
50
100
150
200
250
FY13 FY14 FY15 FY16 FY17
0
5
10
15
20
25
30
35
FY13 FY14 FY15 FY16 FY17
$m
8.912.1
18.1
24.2
32.1
52
107
211
5
790,000+ ‘room nights’ p.a Villas and sites
35 LIFESTYLE AND HOLIDAY COMMUNITIES 31 RENTAL VILLAGES
Ingenia has
Australiancommunities & growing66
Portfolio now
million$689
Over 4,600 rental and lifestyle residents
4,000Occupied permanent homes
2,470 Potential development sites
Annualised revenue >$175 million
Stable rent base >$1.5 million/pw$
Note: Includes announced acquisitions yet to settle. Excludes assets under option. Excludes three Settlers villages.
Business overviewCreating Australia’s best lifestyle communities
NSW36
QLD9
TAS5
NT
SA
WA6
VIC10
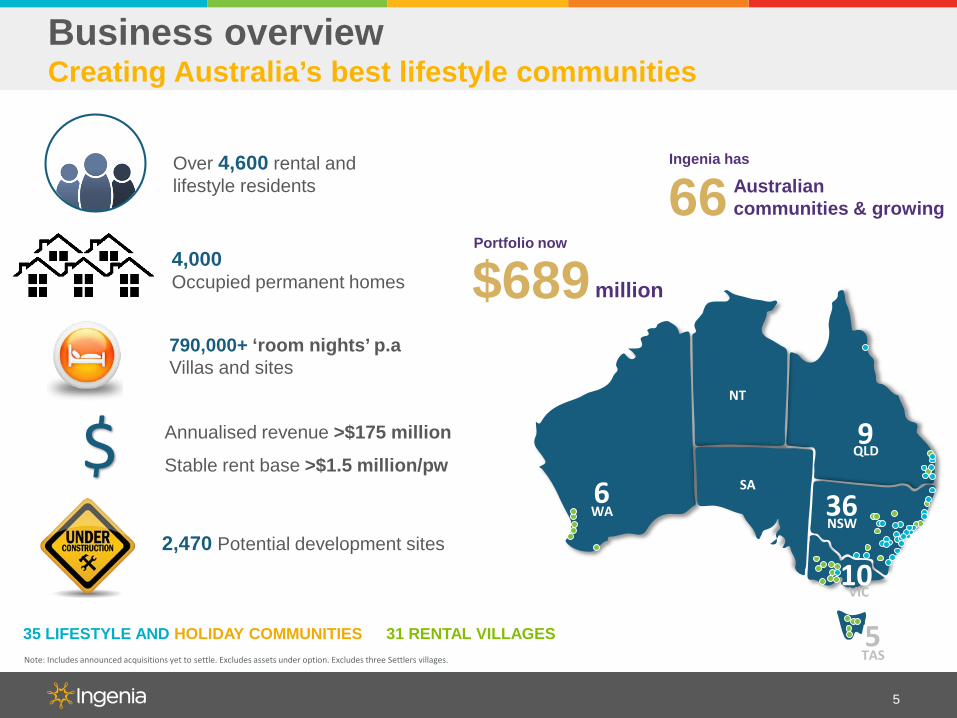
Performance and capital management
6
Ingenia Lifestyle Lake Macquarie NSW
New Homes
(Completed)
TourismConversion
(Completed)
Future Stage

7
Key financialsStrong operating earnings and cash flow
KEY FINANCIAL METRICS FY17 FY16 CHANGE
Revenue $149.9m $107.1m 40.0%
EBIT $32.1m $24.2m 32.6%
Statutory profit1 $26.4m $24.3m 8.6%
Underlying profit –continuing operations2 $23.5m $20.2m 16.3%
Underlying profit EPS –continuing operations 13.0c 13.4c (3.0%)
Operating cashflow $30.3m $21.0m 44.3%
Distribution per security 10.2c 9.3c 9.7%
Effective tax rate 7% - NM
EBIT up 32.6% - above guidance - result driven by significant sales momentum
1. FY17 statutory profit includes $12.7 million fair value write-off of acquisition transaction costs (FY16: $5.5 million), loss on sale of Settlers $7.6 million.
2. Underlying profit is a non-IFRS measure designed to present, in the opinion of the Directors, the results from the ongoing operating activities of INA in a way that reflects underlying performance. Underlying profit excludes items such as unrealised fair gains/(losses), and adjustments arising from the effect of revaluing assets/liabilities (such as derivatives and investment properties). These items are required to be included in Statutory Profit in accordance with Australian Accounting Standards. Underlying profit has not been audited or reviewed by EY.
Revenue up 40%, reflecting strong performance from the core business and contribution from acquisitions
Underlying EPS impacted by May 17 capital raising – funds not fully deployed until August 17
Distribution of 10.2c – up 9.7% on FY16
Increase in tax rate driven by increased contribution from development
Strong operating cashflow driven by rental and tourism earnings and new home sales

8
Strong growth in EBITJun 17
($m)Jun 16
($m) Change
EBIT• Lifestyle and Holidays
operations 17.4 11.0 58.2%
• Lifestyle development 10.9 5.5 98.2%
• Ingenia Gardens 11.6 11.0 5.5%
• Settlers 1.2 3.8 (68.4%)
Portfolio EBIT 41.1 31.3 31.3%
Corporate costs (9.0) (7.1) (26.8%)
EBIT 32.1 24.2 32.6%
Strong EBIT growth from core business
Ingenia Lifestyle and Holidays• Rental base expanding – driven by acquisitions
and additional new home sales
• Above the ground gross development profit up 105% on prior year
Ingenia Gardens• Increased occupancy and rent growth driving
improved returns
Corporate costs• Includes $0.5 million of unsuccessful
transaction costs
• Costs reduced 2H17 ($4.3 million) compared to 1H17 ($4.7 million)
EBIT (Continuing Operations)
0
5
10
15
20
25
30
35
40
45
50
FY15 FY16 FY17 FY18 (Guidance)
$18.1
$42-46
$m Guidance $30m
Up 34%
Up 33%
$24.2$32.1

Capital management
9
Australian debt 30 Jun 17($m)
30 Jun 16($m)
Total facility 300.0 200.0
Total debt drawn 166.5 99.1
Bank guarantees1 10.8 26.2
Available debt 122.7 74.7
Australian interest rates 30 Jun 172 30 Jun 16
Current all in cost of funds (weighted)
4.2% 4.0%
1. Includes $10 million AFSL statutory guarantee.2. Higher cost of funds driven by increase in unused facility as a result of equity
raisings. Will reduce as funds are deployed.
Key Metrics Jun 17 Jun 16
Loan to value ratio (LVR) 27.7% 24.9%
Core interest cover ratio (ICR) 3.5x 3.7x
Net asset value (NAV) per security $2.50 $2.45
• Core ICR of 3.5x
• Weighted average term to maturity 3.8 years
• Debt 38% hedged at 30 June 2017
Drawn debt of $177.3 million at 30 June 2017
• Pro forma LVR 33.3%1
• Significant headroom against covenant of 50%
Strong balance sheet – LVR of 27.7%
• Successful $74 million equity raise to fund recent acquisitions and investment in key developments
• Growing cash inflows - operations and home sales
• DRP remains in place
• Progressing non core asset sales
• In discussion with aligned parties to explore potential capital partnering
Funding growth
Debt facility increased to $300 million
1. Post completion of Sheldon and Glenwood acquisitions.

10
Growth in values as capitalisation rates sharpen
PORTFOLIOAV. CAP
RATE JUN20171
AV. CAP RATE JUN
20161
JUN 17BOOK
VALUE ($m)
Ingenia Gardens 9.92% 9.95% 141.3
Lifestyle and Holidays 8.40% 8.91% 514.9
1. Excludes new acquisitions and leasehold assets.
7.00%
7.50%
8.00%
8.50%
9.00%
9.50%
10.00%
Lifestyle Metro Lifestyle Coastal Mixed Metro Mixed Coastal Mixed Regional
Continued cap rate sharpening across Lifestyle and Holidays portfolio¹ over last 12 months
Jun-16 Jun-17
63 bp 55 bp
80 bp
33 bp
35 bp
• Independently valued c.50% of total portfolio by value (33 assets) during FY17 (including twelve lifestyle and holiday communities), confirming cap rate compression
• Average capitalisation rate for Lifestyle and Holidays tightened by approximately 50 basis points during FY17, contributing to $18.9 million value uplift1
• Valuation movements support Ingenia’s focus on metropolitan and coastal markets
• Valuations lagging market transactions – growing market evidence of rates firming

Key drivers of NAV per security movement
11
• NAV per security increased 5c (2%) over the 12 months to June 2017
• Positive impact of valuations offset by the loss on divestment of Settlers assets, income tax expense and distributions to shareholders
2.45 0.13 0.17
0.05 0.03 0.07
0.10 2.50
1.0
1.2
1.4
1.6
1.8
2.0
2.2
2.4
2.6
2.8
3.0
Openingbalance
Underlyingprofit
Impact ofRevaluations
Loss on Saleof Settlers and
Cessnock
Amortisationof
developmentprofit
Acquisitiontransaction
costs
Distribution Closingbalance
($)
5.50%
6.50%
7.50%
8.50%
9.50%
10.50%
11.50%
Jan-13 Aug-13 Mar-14 Sep-14 Apr-15 Oct-15 May-16 Nov-16 Jun-17
Impl
ied
cap
rate
%
Lifestyle and Mixed-use Communities
Mixed-use Lifestyle Poly. (Mixed-use) Poly. (Lifestyle)
Avina
Greenpoint(Boyuan)
Durack
Riverbreeze
Newport(Hometown)
CairnsCoconutRockhampton Bonny Hills
Trend Line (Lifestyle)
Trend Line (Mixed-use)
The Grange
12
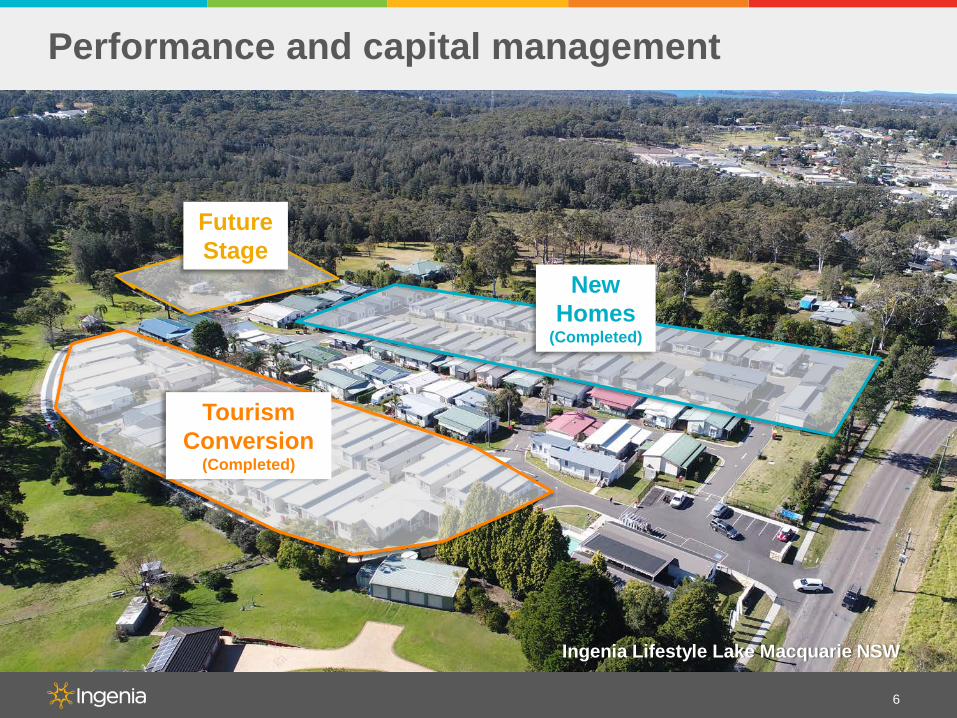
Valuations: existing communities Significant cap rate compression evident
• Capitalisation rates continuing to tighten – growing market evidence as new entrants target scale
• Greater market awareness and investment interest in sector
• Value uplift at key communities assisted by improved operating performance, integration into Ingenia platform and execution of individual asset strategies
• Best in class communities in US now transacting <4.0%
Source: Ingenia analysis.
13
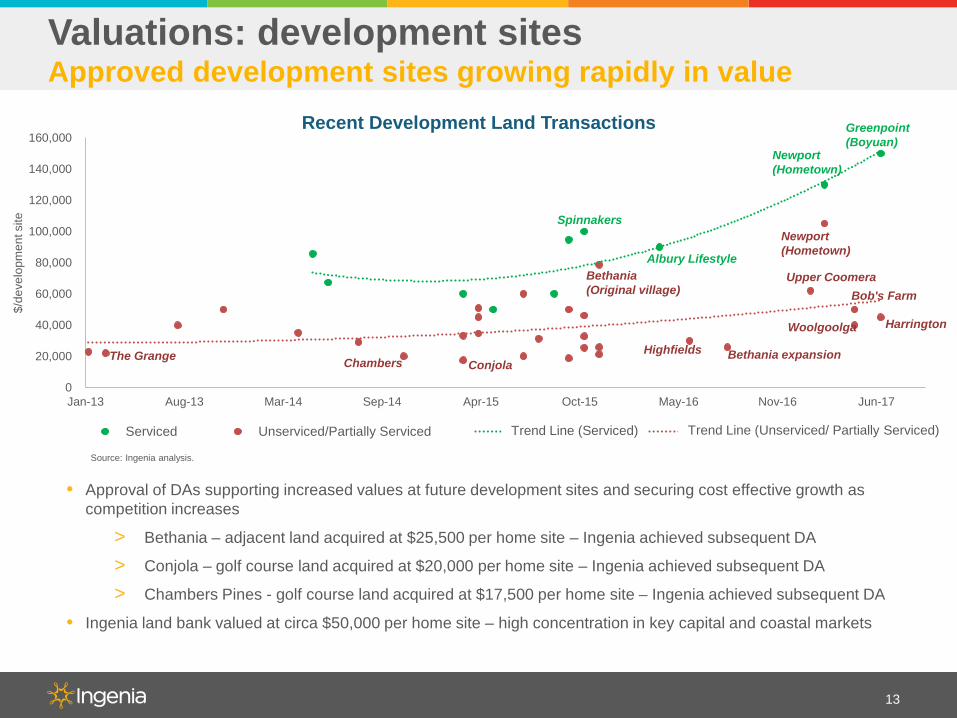
Valuations: development sitesApproved development sites growing rapidly in value
• Approval of DAs supporting increased values at future development sites and securing cost effective growth as competition increases
> Bethania – adjacent land acquired at $25,500 per home site – Ingenia achieved subsequent DA
> Conjola – golf course land acquired at $20,000 per home site – Ingenia achieved subsequent DA
> Chambers Pines - golf course land acquired at $17,500 per home site – Ingenia achieved subsequent DA
• Ingenia land bank valued at circa $50,000 per home site – high concentration in key capital and coastal markets
Source: Ingenia analysis.
0
20,000
40,000
60,000
80,000
100,000
120,000
140,000
160,000
Jan-13 Aug-13 Mar-14 Sep-14 Apr-15 Oct-15 May-16 Nov-16 Jun-17
$/de
velo
pmen
t site
Recent Development Land Transactions
Serviced Unserviced/Partially Serviced Poly. (Serviced) Poly. (Unserviced/Partially Serviced)
Greenpoint(Boyuan)
Newport(Hometown)
Newport(Hometown)
Bob's Farm
Spinnakers
Albury LifestyleBethania(Original village)
HarringtonWoolgoolga
Bethania expansionHighfieldsChambers Conjola
Trend Line (Serviced) Trend Line (Unserviced/ Partially Serviced)
The Grange
Upper Coomera
14
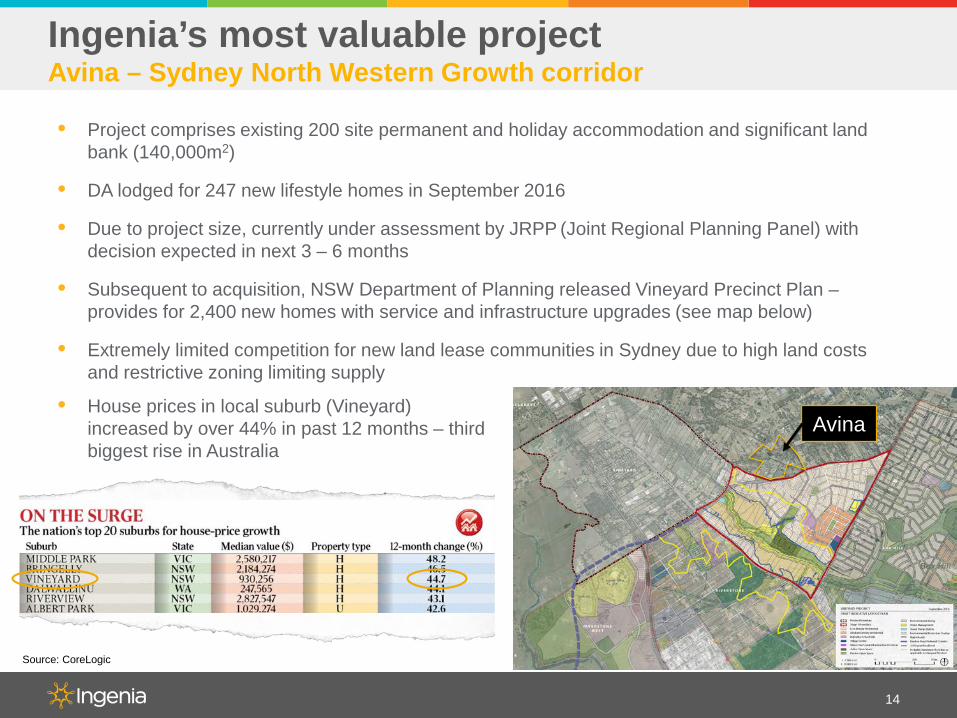
Ingenia’s most valuable projectAvina – Sydney North Western Growth corridor
• Project comprises existing 200 site permanent and holiday accommodation and significant land bank (140,000m2)
• DA lodged for 247 new lifestyle homes in September 2016
• Due to project size, currently under assessment by JRPP (Joint Regional Planning Panel) with decision expected in next 3 – 6 months
• Subsequent to acquisition, NSW Department of Planning released Vineyard Precinct Plan –provides for 2,400 new homes with service and infrastructure upgrades (see map below)
• Extremely limited competition for new land lease communities in Sydney due to high land costs and restrictive zoning limiting supply
Source: CoreLogic
• House prices in local suburb (Vineyard) increased by over 44% in past 12 months – third biggest rise in Australia
Avina
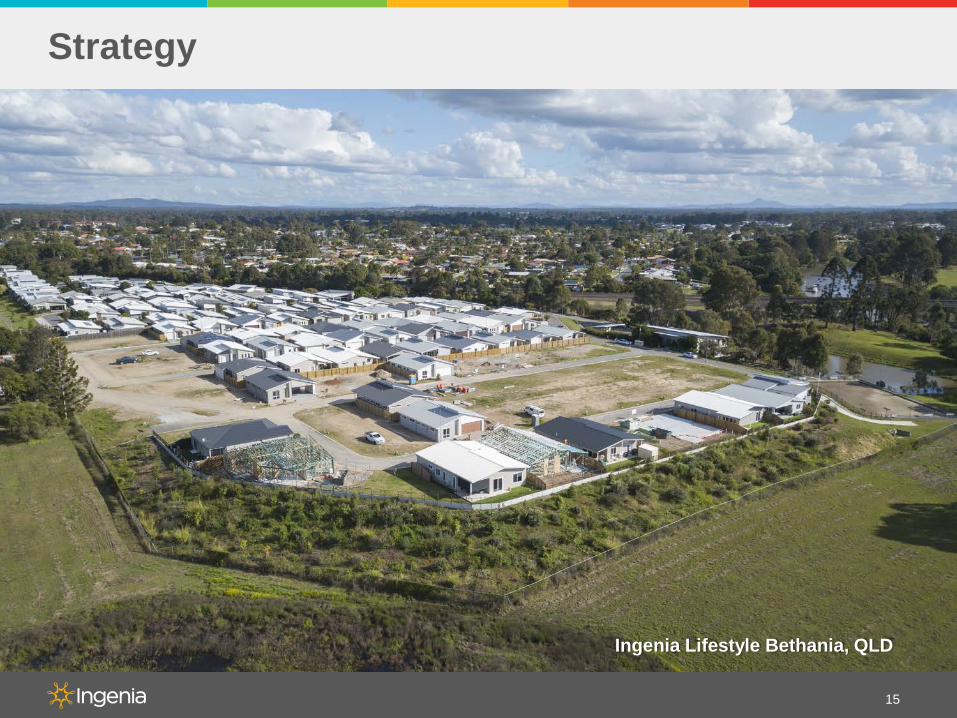
Strategy
15
Ingenia Lifestyle Bethania, QLD

16
Many seniors will struggle to fund a comfortable retirement
-
200,000
400,000
600,000
800,000
1,000,000
1,200,000
1,400,000
Jan-
00Ja
n-01
Jan-
02Ja
n-03
Jan-
04Ja
n-05
Jan-
06Ja
n-07
Jan-
08Ja
n-09
Jan-
10Ja
n-11
Jan-
12Ja
n-13
Jan-
14Ja
n-15
Jan-
16Ja
n-17
Limited savings or superannuation
Superannuation account balances
Sour
ce: A
SFA
Res
earc
h an
d R
esou
rce
Cen
tre.
Sydney Melbourne Brisbane
Sour
ce: C
oreL
ogic
/ AN
Z.
0%
20%
40%
60%
80%
100%
55–64 65–74 75 andover
Sour
ce: A
BS.
0%10%20%30%40%50%60%70%80%90%
100%
65-69 years 70-74 years 75 years +
Nil $1-99k $100-199k $200k+
Pension
…and with 82% of seniors owning
their homes outright with no mortgage, many
have considerable assets
…but more than 81% of seniors have less than
$100k in superannuation
..and relying on the pension alone
providesfor a
frugal lifestyle
Key capital cities have recorded
strong growth over past 20 years
Median House Price ($)
Home Ownership (Age)
According to ASFA a couple requires
$59,971 a year to fund a comfortable
retirement. The age pension is only
$31,238(1)
1. ASFA Super Guru August 2017.
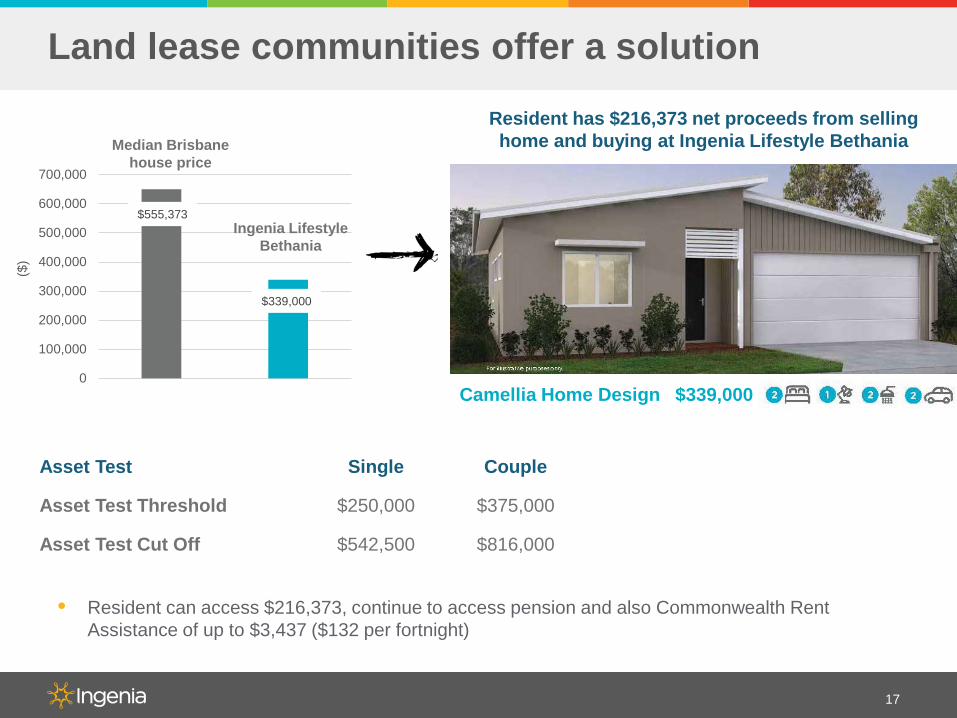
Land lease communities offer a solution
17
0
100,000
200,000
300,000
400,000
500,000
600,000
700,000
Asset Test Single Couple
Asset Test Threshold $250,000 $375,000
Asset Test Cut Off $542,500 $816,000
• Resident can access $216,373, continue to access pension and also Commonwealth Rent Assistance of up to $3,437 ($132 per fortnight)
Median Brisbane house price
Ingenia LifestyleBethania
Resident has $216,373 net proceeds from selling home and buying at Ingenia Lifestyle Bethania
($)
$555,373
$339,000
Camellia Home Design $339,000

Ingenia value levers
18
Ingenia has significant embedded opportunity within the portfolio to create value
2,470 Development Sites$20 million pa incremental rent once built out, over $705 million in sales revenue
Below Market Rents$170,000 growth pa in rent
More than 180 New Tourism Cabins$4.5 million pa rent once built out(includes some site conversions)
Highest and Best UseSell 2 – 3 communities for medium density residential
125+ New Rental Sites$1.6 million pa rent once built out
Time
Valu
e
Growing Commercial Lease Income OpportunitiesMonetise land – childcare centres, service stations, food and beverage, retail

19
Operations reviewExpanding business generating strong cashflow growth
Ingenia Lifestyle Latitude One, NSWGround Breaking
1 JULY 2017

20
Lifestyle and Holidays now 80% of portfolio by value• Additional $208 million1 committed FY17 in coastal and metro
acquisitions
• Divestment of majority of DMF portfolio completed Oct 16
Diverse cashflows with exposure a range of metro and coastal markets
• Earnings remain dominated by rental cashflows – 73% of EBIT
Large, quality portfolio establishedDiverse cashflows and return profile
Core Portfolio EBIT1
Core Portfolio by Value1
Lifestyle and Holidays Development
Lifestyle and Holidays Rent
Ingenia GardensRent
1. Excludes three remaining DMF villages. 1. Includes Sheldon and Glenwood ($32.8m) post 30 June 2017.
27%
44%
29%
Lifestyle Development
Lifestyle and Holidays Rent
Ingenia GardensRent
16%
64%
20%
Continue to refine portfolio in line with strategy
• Development pipeline to secure further growth in rental contracts and asset yield
• Focus on sale of non core and select assets
21
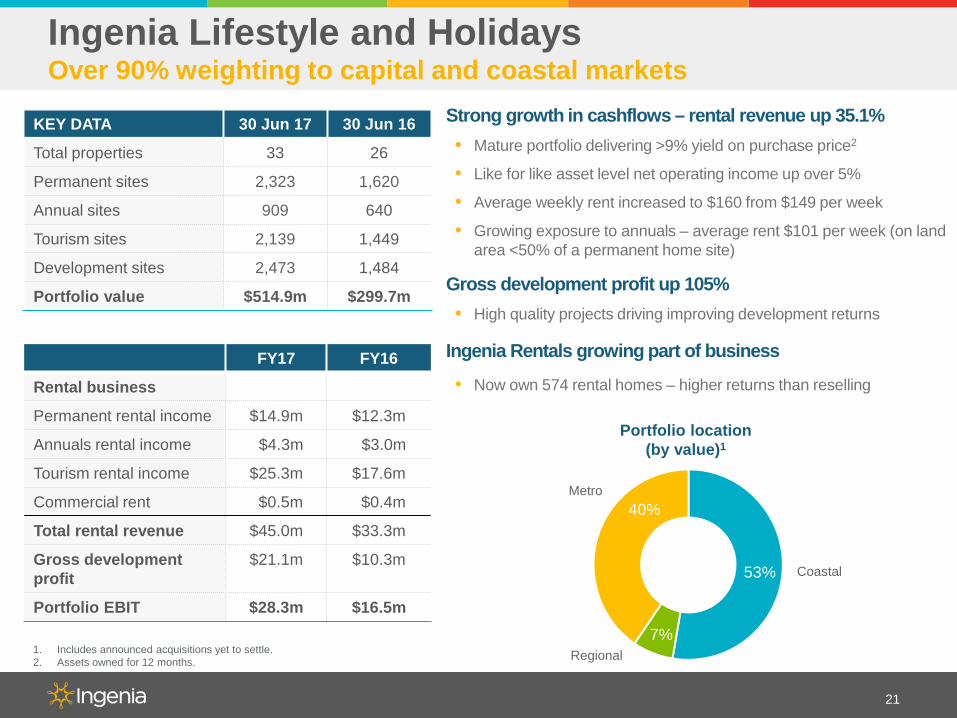
Ingenia Lifestyle and HolidaysOver 90% weighting to capital and coastal markets
FY17 FY16
Rental business
Permanent rental income $14.9m $12.3m
Annuals rental income $4.3m $3.0m
Tourism rental income $25.3m $17.6m
Commercial rent $0.5m $0.4m
Total rental revenue $45.0m $33.3m
Gross development profit
$21.1m $10.3m
Portfolio EBIT $28.3m $16.5m
KEY DATA 30 Jun 17 30 Jun 16
Total properties 33 26
Permanent sites 2,323 1,620
Annual sites 909 640
Tourism sites 2,139 1,449
Development sites 2,473 1,484
Portfolio value $514.9m $299.7m
Strong growth in cashflows – rental revenue up 35.1%• Mature portfolio delivering >9% yield on purchase price2
• Like for like asset level net operating income up over 5%
• Average weekly rent increased to $160 from $149 per week
• Growing exposure to annuals – average rent $101 per week (on land area <50% of a permanent home site)
Gross development profit up 105%• High quality projects driving improving development returns
Ingenia Rentals growing part of business
• Now own 574 rental homes – higher returns than reselling
1. Includes announced acquisitions yet to settle.2. Assets owned for 12 months.
Portfolio location (by value)1
Coastal
Regional
Metro40%
53%
7%

Holidays represents a complementary business with significant upside1. Attractive cashflows underpinned by strong repeat visitation
2. Highly leveraged to ageing population
3. Preserves long-term development optionality and maximises returns from mixed-use assets
4. Increasingly becoming first touch point with prospective residents offering multiple cross-selling opportunities
5. Fragmented ‘cottage’ industry
22
Compelling opportunity with attractive returns Brand recognition growing
• Acquired over 770 additional income producing sites in FY17
• Own some of the largest, most profitable holiday parks on East Coast
• Cairns Coconut – delivering strong cashflow
Significant revenue growth achieved (like for like up 4%)
• Actively marketing to unique database of 150,000 members – up almost 50% within 12 months
• Targeted campaigns building off-peak visitation
Demand fundamentals continue to improve
• Key family and nomad markets growing strongly
Targeted investment providing growth in returns• Rolling out free wifi across key communities to drive rate growth,
occupancy and customer loyalty
Ingenia Holidays
Regional
Metro
Coastal
Sites(by location)
10%
13%
77%
0
50
100
150
200
250
300
350
400
FY 14 FY 15 FY 16 FY 17 FY 18Target
FY 19Target
23
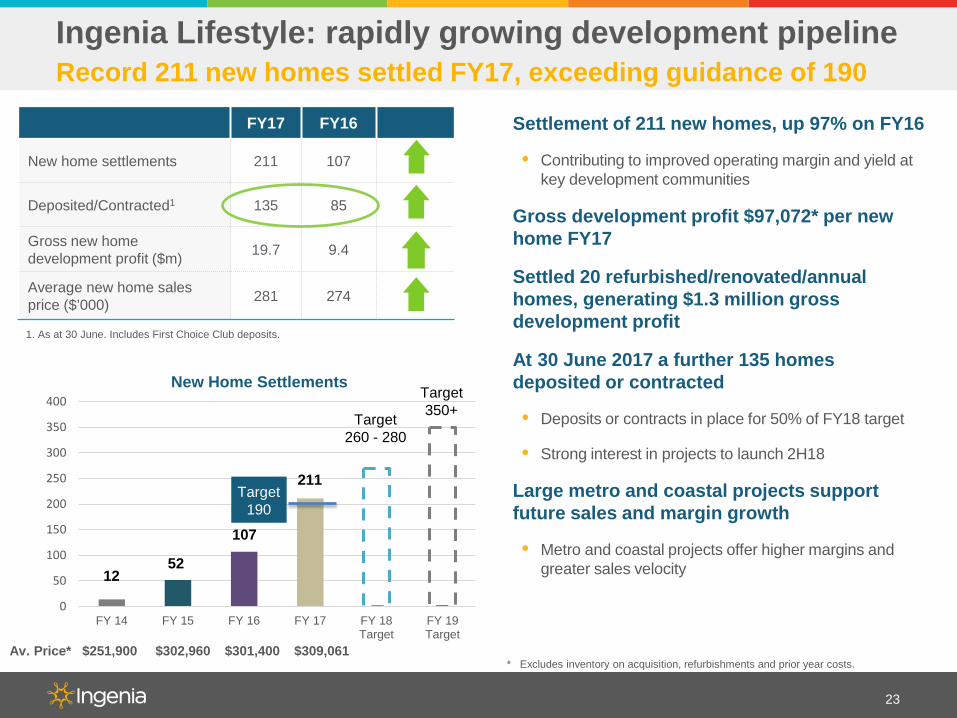
Settlement of 211 new homes, up 97% on FY16
• Contributing to improved operating margin and yield at key development communities
Gross development profit $97,072* per new home FY17
Settled 20 refurbished/renovated/annual homes, generating $1.3 million gross development profit
At 30 June 2017 a further 135 homes deposited or contracted
• Deposits or contracts in place for 50% of FY18 target
• Strong interest in projects to launch 2H18
Large metro and coastal projects support future sales and margin growth
• Metro and coastal projects offer higher margins and greater sales velocity
* Excludes inventory on acquisition, refurbishments and prior year costs.
New Home Settlements
Av. Price* $251,900 $302,960 $301,400 $309,061
Target260 - 280
211
107
5212
Target350+
FY17 FY16
New home settlements 211 107
Deposited/Contracted1 135 85
Gross new home development profit ($m) 19.7 9.4
Average new home sales price ($’000) 281 274
1. As at 30 June. Includes First Choice Club deposits.
Ingenia Lifestyle: rapidly growing development pipelineRecord 211 new homes settled FY17, exceeding guidance of 190
Target 190

24
Continuing to invest in development, sales and marketing teams to support increasing settlement targets
• Development team role includes optioning land and securing development approvals
• In house design – masterplanning efficiencies and product improvement
• Move to state-based development team structure
• Acquisitions team currently tasked with divestments and organic growth opportunities
Investing in growthRight-sizing platform as growth accelerates
Benefits emerging
• Bringing projects to market quicker and more profitably
• Increasing margin and sales rate
• Acquiring and optioning development sites well below recent market comparables
• Can support launch of eight new projects over next 14 months
• De-risking settlements – Conjola First Choice deposits represent over two thirds of stage 1 homes
Realising efficiencies across core capabilities of operations and finance

150
200
250
300
350
400
450
500
550
600
Sep-17 Dec-17 Apr-18 Jul-18 Oct-18 Feb-19
Fore
cast
Hom
e Sa
les
Pric
e ($
'000
s)
Target Settlement Commencement Date
> $500
> $250
> $375
25
Investing in growthTargeting further growth in settlements over next three years
• Dedicated land acquisition team assessing further opportunities in Melbourne, Sydney, Coastal NSW and South East Qld
• Presently negotiating acquisition of expansion land at four communities
LATITUDE ONE (NEW)
< 100 SITES
100-200 SITES
> 200 SITES
Development Size
GLENWOOD(NEW)
BETHANIA(EXPANSION)
THE GRANGE(EXPANSION)
LAKE CONJOLA
(EXPANSION)
AVINA(EXPANSION)
HERVEY BAY(NEW)
UPPER COOMERA
(NEW)

26
Swan View Gardens, WA

27
Ingenia Gardens (seniors rental)Strong, stable, government supported cashflows
Occupancy and rent growth driving operational performance• All time record occupancy achieved (92.8%)
• EBIT up 5.5% as occupancy and rents grow incrementally
• Average rent increased by $9 per week
Training of front line staff and use of digital platform providing benefits• Online presence generating an increasing portion of
leads (website traffic up 8% on FY16)
• Average resident tenure now 3.2 years and growing
Ingenia Care
• Care offering continuing to assist occupancy and tenure
• New extended care program (Ingenia CarePLUS) trialing in two villages with positive response – will assess Group-wide rollout over next six months
KEY DATA FY17 FY16
Total revenue $28.4m $27.5m
EBIT $11.6m $11.0m
30 Jun 17 30 Jun 16
Total properties 31 31
Total units 1,628 1,628
Av. weekly rent $330 $321
Occupancy 92.8% 90.7%
Portfolio value $141.3m $134.6m
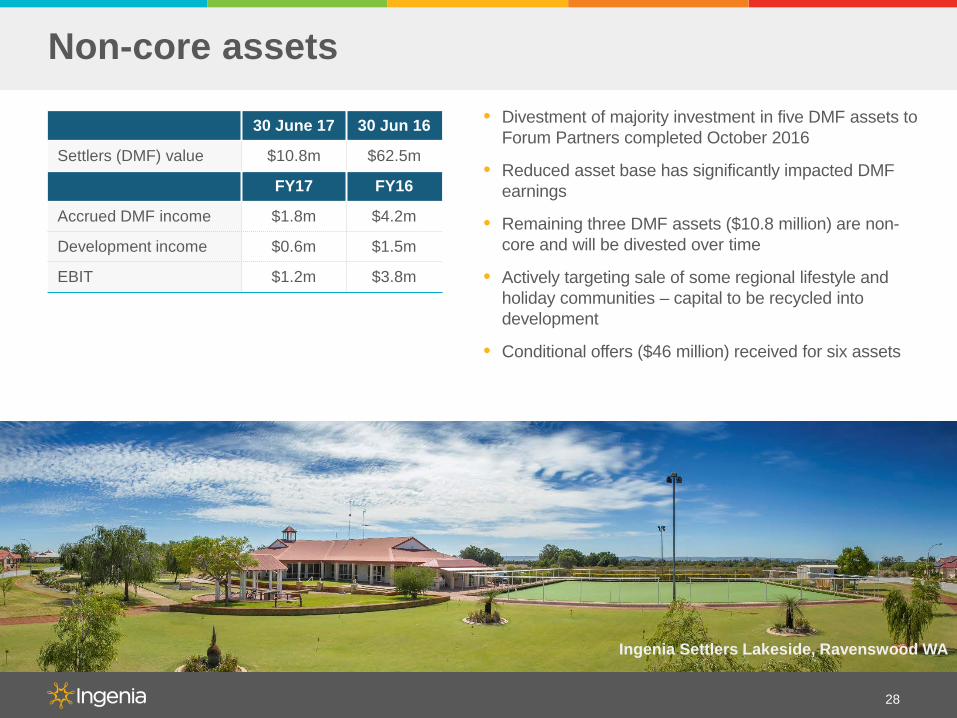
Non-core assets
28
• Divestment of majority investment in five DMF assets to Forum Partners completed October 2016
• Reduced asset base has significantly impacted DMF earnings
• Remaining three DMF assets ($10.8 million) are non-core and will be divested over time
• Actively targeting sale of some regional lifestyle and holiday communities – capital to be recycled into development
• Conditional offers ($46 million) received for six assets
30 June 17 30 Jun 16
Settlers (DMF) value $10.8m $62.5m
FY17 FY16
Accrued DMF income $1.8m $4.2m
Development income $0.6m $1.5m
EBIT $1.2m $3.8m
Ingenia Settlers Lakeside, Ravenswood WA

29
Macro/Residential Housing• Housing affordability and ageing population driving long-term core
demand
• Key risk would be slowdown in residential housing (not apartments) – alert but not alarmed
• Ageing population and changing vacation patterns driving holidays business – limited exposure to rising AUD
• Limited threats from disruption or disintermediation – continuing to invest in channel management and digital
Customer Demands• Rapidly growing consumer awareness of lifestyle community
model and differences from traditional retirement models
• Product and model continuing to evolve and broaden market appeal
• Care, accessibility and sustainability are key emerging enablers
Competition and Market • Increasing interest from overseas and larger domestic groups in
lifestyle market
• Likely increased regulatory requirement for retirement villages but expect limited impact on lifestyle communities
Outlook: market landscape

Outlook: organic growth and capital recycling
30
► Improve performance of existing assets to drive revenue growth and leverage operating and sales platform
► Accelerate development pipeline to deliver new rental contracts and increase development profit
► Progress asset sales and capital recycling to fund future growth through development
► Deliver FY18 EBIT of $42-46 million (subject to no material change in market conditions)
► Achieve 260 – 280 new home settlements and position for target of 350+ settlements in FY19
Appendices
31
photo

32
Appendix 1: underlying profitLifestyle communities key driver of earnings growth
FY17(A$m)
FY16(A$m)
Continuing operationsLifestyle – operations 17.4 11.0Lifestyle – development 10.9 5.5Ingenia Gardens 11.6 11.0Settlers 1.2 3.8Portfolio EBIT 41.1 31.3Corporate costs (9.0) (7.1)
EBIT – Continuing operations 32.1 24.2Net finance costs (6.9) (6.6)Income tax (expense)/benefit (1.7) 2.6
Underlying profit – Continuing operations 23.5 20.2
Underlying profit – Total 23.5 20.2Statutory adjustments 3.2 3.7Tax (expense)/benefit associated with adjustments (0.3) 0.4
Statutory Profit 26.4 24.3
• Growing cashflows from core business as lifestyle and holidays portfolios expand
• Corporate costs impacted by write-off of due diligence costs on transactions which did not proceed
• Underlying tax expense increase is largely attributable to increasing development profits
• Statutory adjustments include $12.7m write-off of transaction costs and stamp duty associated with acquiring new investment properties and loss on sale of DMF assets

33
Appendix 2Reconciliation to EBIT and underlying profit
(A$m)Lifestyle
OperationsLifestyleDevelop.
LifestyleTotal
Ingenia Gardens Settlers Corporate TOTAL
Rental income 45.0 - 45.0 24.8 0.2 - 70.0Accrued DMF fee income - - - - 1.8 - 1.8Manufactured home sales - 63.8 63.8 - - - 63.8Catering income - - - 3.2 - - 3.2Other property income 2.6 - 2.6 0.4 0.8 - 3.8Development profit - - - - 0.6 - 0.6Service station sales 7.3 - 7.3 - - - 7.3Total segment revenue 54.9 63.8 118.7 28.4 3.4 - 150.5Property expenses (14.8) (0.5) (15.3) (8.0) (0.9) (0.5) (24.7)Manufactured home cost of sales - (42.7) (42.7) - - - (42.7)Service Station expenses (6.2) - (6.2) - - - (6.2)All other expenses (16.5) (9.7) (26.2) (8.8) (1.3) (8.5) (44.8)
Earnings before interest and tax 17.4 10.9 28.3 11.6 1.2 (9.0) 32.1
Net finance expense - - - - - (6.9) (6.9)Income tax expense - - - - - (1.7) (1.7)Underlying profit –continuing operations 17.4 10.9 28.3 11.6 1.2 (17.6) 23.5

34
Appendix 3Cashflow
(A$m) 30 June 2017 30 June 2016Opening cash at 1 July 15.0 15.1Rental and other property income 82.6 71.2Property and other expenses (63.9) (56.0)Net cashflow associated with manufactured home development 15.8 5.1Net borrowing costs paid (6.0) (5.1)All other operating cashflows 1.8 5.8Net cashflows from operating activities 30.3 21.0Acquisitions of investment properties (180.3) (85.1)Proceeds/(costs) from sale of investments properties and equity accounted investments 40.8 (1.0)
Capital expenditure and development costs (27.1) (19.9)Purchase of plant, equipment and intangibles (1.7) (2.3)Net cashflows from investing activities (168.3) (108.3)Net proceeds from/(repayment of) borrowings 67.4 35.2Net proceeds from equity placement 85.0 65.5Distributions to security holders (18.0) (12.5)All other financing cashflows (1.8) (1.0)Net cashflows from financing activities 132.6 87.2Total cashflows (5.4) (0.1)Closing cash at 30 June 9.6 15.0
35
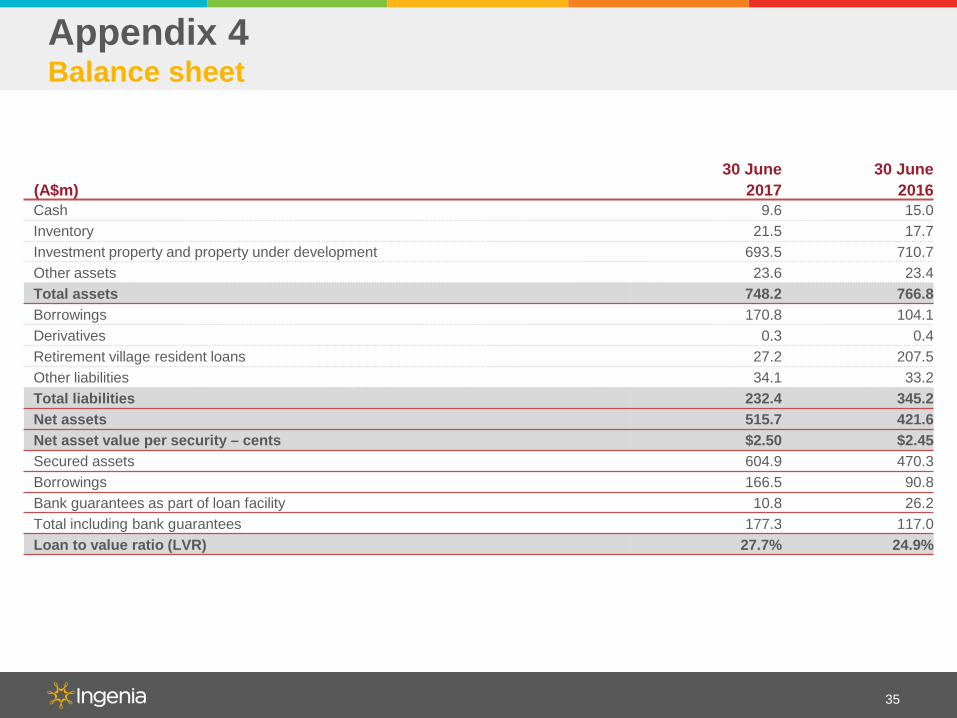
Appendix 4Balance sheet
(A$m)30 June
201730 June
2016Cash 9.6 15.0Inventory 21.5 17.7Investment property and property under development 693.5 710.7Other assets 23.6 23.4Total assets 748.2 766.8Borrowings 170.8 104.1Derivatives 0.3 0.4Retirement village resident loans 27.2 207.5Other liabilities 34.1 33.2Total liabilities 232.4 345.2Net assets 515.7 421.6Net asset value per security – cents $2.50 $2.45Secured assets 604.9 470.3Borrowings 166.5 90.8Bank guarantees as part of loan facility 10.8 26.2Total including bank guarantees 177.3 117.0Loan to value ratio (LVR) 27.7% 24.9%

36
Guidance commentary Appendix 5
Metric FY18 Guidance Comment
Settlements 260-280 homes Will depend on launch timing of new and expansion projects (Latitude One, Conjola, Glenwood and The Grange)
EBIT $42-46m
Dependant on settlement volumes and margins, timing of asset sales (earnings foregone) and contribution from recent acquisitions
Continuing investment in development and sales platform, including entry into Victorian market
Gross Sales Margin ~$110,000 Dependent on contribution from high margin new and expansion projects
(Latitude One, Glenwood and The Grange)
Growth in development and operating profit leading to forecast increase in tax expense
> Effective tax rate of 8 – 12% expected for FY18
> No cash tax payable in FY18
LVR to be maintained within 30-40% range
> June 2017 capital raise, existing debt capacity and non-core and regional asset sales to fund accelerating development
Guidance subject to no material change in market conditions

37
Case study - Lake Conjola, NSWAppendix 6
Value enhancement strategies• Install new cabin stock (six in stage 1)
• Integrate to portfolio website and revenue management platform
• Launch with online travel agents (booking.com, expedia)
• Market to Ingenia Holidays database
• Focus on operating standards and online reputation
• Introduce new Annual homes (converted lower yielding camping sites)
• Close golf course and lodge DA for new homes
Asset level operating margin up over 52% (revenue growth and cost management)*
OTA’s providing average $44k revenue per month
Digital channels (portfolio website and OTA’s) sourced 32.2% of revenue for FY17
Same period revenue growth (Sept to June FY16 and Sept to June FY17) of 6.8%, driven through additional cabin stock and yield management
Unique visitors increased by 6.6%
Development returns and locked in rent from new Annual home sales
DA achieved for 114 new homes
*Based on Sept-Dec 15 vs 16.
FY17 OutcomesAcquired Sep 15

38
32,500
24,000
4,200
1,059 1,673
5,000
15,000
17,000
19,000
21,000
23,000
25,000
27,000
29,000
31,000
33,000
35,000
Acquisition Pricein Jul-15
Improved operatingperformance
Addition of 6 newcabins and 6 new
annual cabins
Cap ratesharpening
(-60 bp)
DA approval for 114permanent homes
Book Valuein Jun-17
$'00
0s
Lake Conjola - Value Uplift
Dev Land Value ~$3.4 m
Dev Land Value ~$5.0 m
Existing Tourism
Operations~ $27.5 m
Existing Tourism
Operations~ $20.6 m
Case study – cont’dAppendix 6
39
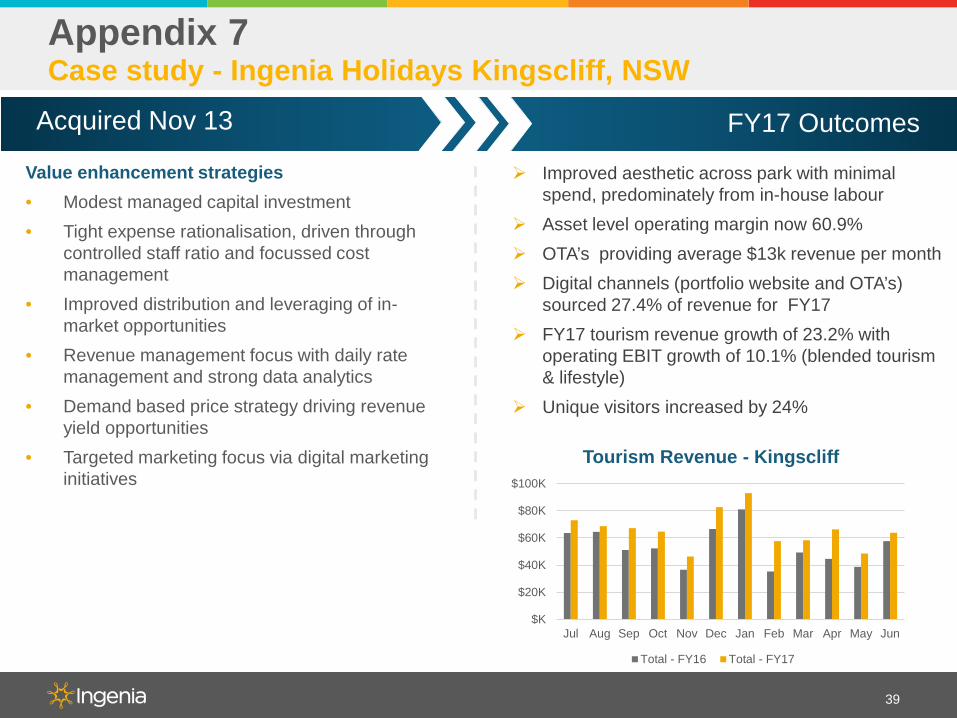
Case study - Ingenia Holidays Kingscliff, NSWAppendix 7
Value enhancement strategies• Modest managed capital investment• Tight expense rationalisation, driven through
controlled staff ratio and focussed cost management
• Improved distribution and leveraging of in-market opportunities
• Revenue management focus with daily rate management and strong data analytics
• Demand based price strategy driving revenue yield opportunities
• Targeted marketing focus via digital marketing initiatives
Improved aesthetic across park with minimal spend, predominately from in-house labour
Asset level operating margin now 60.9% OTA’s providing average $13k revenue per month Digital channels (portfolio website and OTA’s)
sourced 27.4% of revenue for FY17 FY17 tourism revenue growth of 23.2% with
operating EBIT growth of 10.1% (blended tourism & lifestyle)
Unique visitors increased by 24%
FY17 OutcomesAcquired Nov 13
$K
$20K
$40K
$60K
$80K
$100K
Jul Aug Sep Oct Nov Dec Jan Feb Mar Apr May Jun
Tourism Revenue - Kingscliff
Total - FY16 Total - FY17

40
10,500 973
248
804
12,525
7,000
8,000
9,000
10,000
11,000
12,000
13,000
Acquisition Pricein Nov-13
Improved operatingperformance
Re-configuration ofvillage to add higheryield tourism sites
Cap rate sharpening(-60 bp)
Book Valuein Jun-17
$'00
0s
Kingscliff - Value Bridge from Acquisition
Existing Tourism
Operations~ $12.5 m
Existing Tourism
Operations~ $10.5 m
Case study – cont’dAppendix 7

41
Appendix 8: competitor landscapeMajor Competitor Properties Locations Strategy
Ingenia Communities (ASX: INA)
35 NSW, QLD, and VIC Acquire lifestyle and tourism parks and undertake greenfield development.
Discovery Parks 60 NSW, NT, QLD, SA, TAS, VIC, WA
Acquired from private equity by SunSuper. Exclusively tourist and workforce accommodation. Acquired Aspen Parks Property Fund (21 assets) Feb 2016.
Gateway Lifestyle (ASX: GTY)
56 NSW, QLD, and VIC Growing portfolio of lifestyle parks, tourism conversion and greenfield lifestyle development.
NRMA 38 NSW, QLD, VIC, TAS, SA
Own, franchise and manage tourist parks. Acquired external manager ATPM (June 2017) which added 31 parks.
Palm Lake Resorts 27 NSW, QLD, VIC Largest privately owned developer and operator of greenfield residential parks. Portfolio includes 5 nursing homes.
North and South Coast Holiday Parks 29 NSW Manage Crown Reserves Holiday Parks including 29 Holiday parks on NSW mid and North Coast.
Lifestyle Communities(ASX: LIC)
13 VIC Developer and operator of greenfield residential parks. Victoria only.
Living Gems / Gem Life 12 QLD, NSW, VIC Family owned - developer and operator of greenfield residential parks. Joint venture (Gem Life) with Singaporean based Thakral to expand.
National Lifestyle Villages 10 WA Developer and operator of greenfield residential parks. Sold annuity rent roll to Blackstone for $150 million November 2014. Reportedly for sale.
Hampshire 9 NSW, VIC, ACT Privately owned portfolio of residential parks. Looking to grow.
Aspen(ASX: APZ)
6 WA, NSW and SA Own small portfolio of tourist, mining and lifestyle parks. Looking to grow with recent divestment of non core assets.
Secura Lifestyle 9 NSW, QLD, and VIC Asset aggregator looking to expand.
Allswell Communities (Eighth Gate) 8 NSW, QLD, and VIC Asset aggregator looking to expand.
Boyuan Group(ASX: BHL)
4 NSW Recent entrant. Seeking to build sizeable investment.
Hometown Australia 2 NSW Recent entrant. Seeking to build sizeable investment. Australian subsidiary of $2 billion group.

42
Contact information
Disclaimer
43
This presentation was prepared by Ingenia Communities Holdings Limited (ACN 154 444 925) and Ingenia Communities RE Limited (ACN 154 464 990) as responsible entity for Ingenia Communities Fund (ARSN 107 459 576) and Ingenia Communities Management Trust (ARSN 122 928 410) (together Ingenia Communities Group, INA or the Group). Information contained in this presentation is current as at 22 August 2017 unless otherwise stated.
This presentation is provided for information purposes only and has been prepared without taking account of any particular reader’s financial situation, objectives or needs. Nothing contained in this presentation constitutes investment, legal, tax or other advice. Accordingly, readers should, before acting on any information in this presentation, consider its appropriateness, having regard to their objectives, financial situation and needs, and seek the assistance of their financial or other licensed professional adviser before making any investment decision. This presentation does not constitute an offer, invitation, solicitation or recommendation with respect to the subscription for, purchase or sale of any security, nor does it form the basis of any contract or commitment.
Except as required by law, no representation or warranty, express or implied, is made as to the fairness, accuracy or completeness of the information, opinions and conclusions, or as to the reasonableness of any assumption, contained in this presentation. By reading this presentation and to the extent permitted by law, the reader releases each entity in the Group and its affiliates, and any of their respective directors, officers, employees, representatives or advisers from any liability (including, without limitation, in respect of direct, indirect or consequential loss or damage or loss or damage arising by negligence) arising in relation to any reader relying on anything contained in or omitted from this presentation.
The forward looking statements included in this presentation involve subjective judgment and analysis and are subject to significant uncertainties, risks and contingencies, many of which are outside the control of, and are unknown to, the Group. In particular, they speak only as of the date of these materials, they assume the success of the Group’s business strategies, and they are subject to significant regulatory, business, competitive and economic uncertainties and risks. Actual future events may vary materially from forward looking statements and the assumptions on which those statements are based. Given these uncertainties, readers are cautioned not to place undue reliance on such forward looking statements.
The Group, or persons associated with it, may have an interest in the securities mentioned in this presentation, and may earn fees as a result of transactions described in this presentation or transactions in securities in INA.
This document is not an offer to sell or a solicitation of an offer to subscribe or purchase or a recommendation of any securities.