FY 2021 Annual Performance Plan and FY 2019 Annual ... FY21 APP and FY19 APR.pdf · U.S. General...
71
U.S. GENERAL SERVICES ADMINISTRATION FY 2021 Annual Performance Plan and FY 2019 Annual Performance Report REAL ESTATE ACQUISITION TECHNOLOGY SHARED SERVICES
Transcript of FY 2021 Annual Performance Plan and FY 2019 Annual ... FY21 APP and FY19 APR.pdf · U.S. General...

U.S. GENERAL SERVICES ADMINISTRATION
FY 2021 Annual Performance Plan and
FY 2019 Annual Performance Report
REAL ESTATE ACQUISITION TECHNOLOGY SHARED SERVICES
U.S. General Services Administration Annual Performance Plan and Report
1
TABLE OF CONTENTS
EXECUTIVE SUMMARY 2
PURPOSE 2
ABOUT GSA 2
MISSION, VISION, and VALUES 3
ORGANIZATIONAL STRUCTURE 3
FY 2019 ANNUAL PERFORMANCE REPORT 8
FY 2021 ANNUAL PERFORMANCE PLAN 12
STRATEGIC FRAMEWORK 12
STRATEGIC OBJECTIVES (SO) and PERFORMANCE INDICATORS SUMMARY 13
FY 2021 ANNUAL PERFORMANCE PLAN DETAILS 18
STRATEGIC GOAL 1 18
Save taxpayer money through better management of Federal real estate. 18
STRATEGIC GOAL 2 30
Establish GSA as the premier provider of efficient and effective acquisition solutions across the Federal Government. 30
STRATEGIC GOAL 3 43
Improve the way Federal agencies buy, build, and use technology. 43
STRATEGIC GOAL 4 55
Design and deliver expanded shared services within GSA and across the Federal Government to improve performance and save taxpayer money. 55
MANAGEMENT AND PERFORMANCE CHALLENGES 67
EVIDENCE-BUILDING 67
DATA VALIDATION AND VERIFICATION 68
LOWER-PRIORITY PROGRAM ACTIVITIES 68
APPENDIX: ACRONYM AND ABBREVIATION LIST 69
U.S. General Services Administration Annual Performance Plan and Report
2
EXECUTIVE SUMMARY
PURPOSE
The U.S. General Services Administration’s FY 2021 Agency Performance Plan (APP) and FY 2019 Agency Performance Report (APR) present both the goals and objectives for the next fiscal year and provide an overview of the agency’s prior fiscal year performance. The APP summarizes the level of performance GSA aims to achieve in FY 2021. The plan communicates the strategic goals, strategic objectives, supporting performance goals, and performance indicators to be accomplished. The FY 2019 APR summarizes GSA’s performance toward meeting the goals and objectives described in the agency’s FY 2019 APP. Both the APP and the APR have been prepared in compliance with the Government Performance and Results Modernization Act of 2010, Pub L. 111-352, under guidance from the U.S. Office of Management and Budget Circular No. A-11 (2019), Preparation, Submission, and Execution of the Budget.
ABOUT GSA
GSA has the honor of serving the American people by supporting other Federal agencies as they carry out their own critical missions. GSA’s mission-support role ties back to its founding by President Harry S. Truman in 1949. In establishing GSA, President Truman sought to create one agency to help the Government avoid “senseless duplication, excess cost, and confusion in handling supplies, and providing space.” Over the last seven decades, the nation’s population has more than doubled, the price of real estate in major cities has skyrocketed, technology has advanced exponentially, and the world has become vastly more interconnected. GSA supports Federal agencies as they evolve to meet new domestic and global challenges to better serve the American public. GSA’s mission — to deliver value and savings in real estate, acquisition, technology, and other mission-support services across Government — reflects its position as a mission enabler for other Federal agencies. GSA provides the spaces, technical innovations, and goods and services essential to operate the Federal Government. It provides workplaces by constructing, managing, and preserving Government buildings and by leasing and managing commercial real estate. Its acquisition solutions offer private sector professional services, equipment, supplies, telecommunications, and information technology to Government organizations and the military. Its technology leadership helps agencies buy, build, and use technology in ways that support their missions to better serve the public. And its implementation of Government-wide policies promotes management best practices and efficient Government operations. GSA’s success relies on bringing together a talented and diverse workforce — including real estate experts, architects, acquisition specialists, programmers, data scientists, and policy analysts — and building a cohesive, customer-focused team.

U.S. General Services Administration Annual Performance Plan and Report
3
MISSION, VISION, and VALUES
MISSION Deliver value and savings in real estate, acquisition, technology,
and other mission-support services across Government.
VISION Effective and efficient Government for the American people.
VALUES Service Accountability Innovation
ORGANIZATIONAL STRUCTURE
Headquartered in Washington, D.C., GSA serves and supports more than 60 Federal departments and agencies through its:
● Central Office, ● Federal Acquisition Service, ● Public Buildings Service, ● Office of Government-wide Policy, ● 11 National Staff Offices, ● 11 Regional Offices, and ● 2 Independent Offices.

U.S. General Services Administration Annual Performance Plan and Report
4
GSA LEADERSHIP
OFFICE OF THE ADMINISTRATOR
Emily W. Murphy Administrator
Allison F. Brigati Deputy Administrator
Robert Borden Chief of Staff
Brian F. Barnes White House Liaison
NATIONAL SERVICES OFFICE OF
GOVERNMENT-WIDE POLICY
INDEPENDENT OFFICES
Julie Dunne Federal Acquisition Service
Daniel W. Mathews Public Buildings Service
Jessica Salmoiraghi Office of Government- wide Policy
Carol F. Ochoa Office of the Inspector General
Jeri Somers Civilian Board of Contract Appeals
REGIONAL SERVICES
Chris Averill Region 1 New England Boston, MA
John A. Sarcone III Region 2 Northeast & Caribbean New York, NY
Joyce C. Haas Region 3 Mid-Atlantic Philadelphia, PA
Brian Stern Region 4 Southeast Sunbelt Atlanta, GA
Bradley Hansher Region 5 Great Lakes Chicago, IL
Michael Copeland Region 6 The Heartland Kansas City, MO
Giancarlo Brizzi (Acting) Region 7 Greater Southwest Ft. Worth, TX
Penny Grout (Acting) Region 8 Rocky Mountain Denver, CO
Thomas Scott Region 9 Pacific Rim San Francisco, CA
Chaun Benjamin (Acting) Region 10 Northwest/Arctic Auburn, WA
Scott Anderson Region 11 National Capital Washington, DC
STAFF OFFICES
Bob Stafford Office of Administrative Services
Gerard Badorrek Office of the Chief Financial Officer
David A. Shive Office of GSA IT
Mary Gibert Office of Civil Rights
Jeffrey A. Post Office of Congressional and Intergovernmental Affairs
Matthew Ford (Acting) Office of Customer Experience
Jack St. John Office of General Counsel
Antonia T. Harris Office of Human Resources Management
Robert J. Carter Office of Mission Assurance
Brian F. Barnes (Acting) Office of Small Business Utilization
Mark M. McHale Office of Strategic Communication

U.S. General Services Administration Annual Performance Plan and Report
5
NATIONAL SERVICES and the OFFICE OF GOVERNMENT-WIDE POLICY
Federal Acquisition Service
The Federal Acquisition Service (FAS) offers Federal agencies more than 28 million different products and services, and annually delivers over $60 billion in information technology (IT) products, services, and solutions, telecommunications services, assisted acquisition services, travel and transportation management solutions, motor vehicles and fleet services, and charge card services. FAS manages over 219,000 leased vehicles, more than 3.5 million charge cards, and provides personal property disposal services facilitating the reuse of $1 billion in excess and surplus personal property every year. FAS leverages the buying power of the Federal Government to negotiate prices on many of the products and services required by agencies for daily operations. By arranging a network of service providers for IT and total solutions for law enforcement, including security and facility management systems, FAS is able to meet the operating and mission requirements of a vast array of Federal agencies and State, Tribal, and local governments. Leveraging its technology transformation services and IT portfolios, FAS is developing and deploying Centers of Excellence to improve the public’s experience with Government by obtaining and sharing technology applications, platforms, and processes to make agencies’ services more accessible, efficient, and effective.
Public Buildings Service
The Public Buildings Service (PBS) provides high-quality facility and workspace solutions to more than 50 Federal agencies, disposes of excess or unneeded Federal properties, and promotes the adoption of innovative workplace solutions and technologies. PBS acquires space on behalf of the Federal Government through new construction and leasing. PBS owns or leases more than 8,800 assets and maintains an inventory of nearly 370 million square feet of rentable workspace. Within this inventory, PBS has more than 413 owned and leased historic properties. Through lease and purchase transactions, PBS delivers the workspace necessary to meet the varied missions of its Federal customers.
Office of Government-wide Policy
The Office of Government-wide Policy (OGP) uses policies, data, and strategy to drive efficiency and management excellence across the Federal Government for key administrative areas to include: shared services, travel and transportation, acquisition, fleet management, information technology modernization, and real estate management. OGP influences agency behavior in these areas through the development of Government-wide policy making, performance standards, data analysis and benchmarking, and transparent reporting of Government-wide data.
U.S. General Services Administration Annual Performance Plan and Report
6
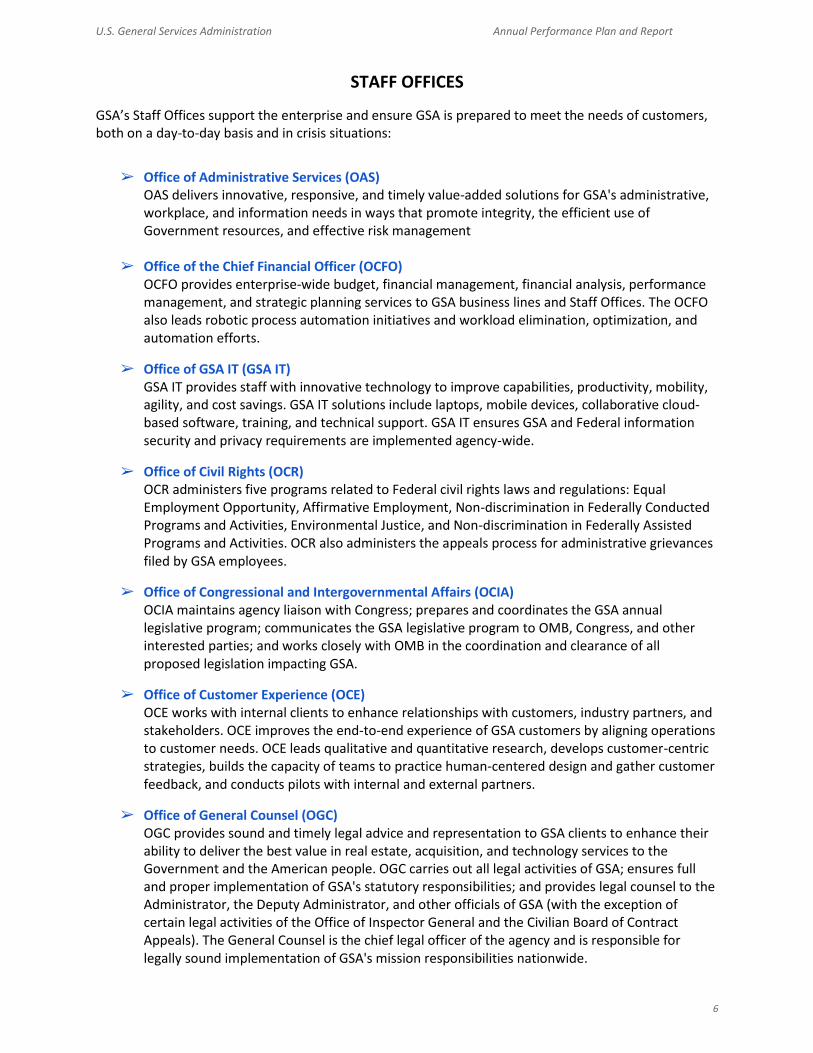
STAFF OFFICES
GSA’s Staff Offices support the enterprise and ensure GSA is prepared to meet the needs of customers, both on a day-to-day basis and in crisis situations:
➢ Office of Administrative Services (OAS) OAS delivers innovative, responsive, and timely value-added solutions for GSA's administrative, workplace, and information needs in ways that promote integrity, the efficient use of Government resources, and effective risk management
➢ Office of the Chief Financial Officer (OCFO) OCFO provides enterprise-wide budget, financial management, financial analysis, performance management, and strategic planning services to GSA business lines and Staff Offices. The OCFO also leads robotic process automation initiatives and workload elimination, optimization, and automation efforts.
➢ Office of GSA IT (GSA IT) GSA IT provides staff with innovative technology to improve capabilities, productivity, mobility, agility, and cost savings. GSA IT solutions include laptops, mobile devices, collaborative cloud-based software, training, and technical support. GSA IT ensures GSA and Federal information security and privacy requirements are implemented agency-wide.
➢ Office of Civil Rights (OCR) OCR administers five programs related to Federal civil rights laws and regulations: Equal Employment Opportunity, Affirmative Employment, Non-discrimination in Federally Conducted Programs and Activities, Environmental Justice, and Non-discrimination in Federally Assisted Programs and Activities. OCR also administers the appeals process for administrative grievances filed by GSA employees.
➢ Office of Congressional and Intergovernmental Affairs (OCIA) OCIA maintains agency liaison with Congress; prepares and coordinates the GSA annual legislative program; communicates the GSA legislative program to OMB, Congress, and other interested parties; and works closely with OMB in the coordination and clearance of all proposed legislation impacting GSA.
➢ Office of Customer Experience (OCE) OCE works with internal clients to enhance relationships with customers, industry partners, and stakeholders. OCE improves the end-to-end experience of GSA customers by aligning operations to customer needs. OCE leads qualitative and quantitative research, develops customer-centric strategies, builds the capacity of teams to practice human-centered design and gather customer feedback, and conducts pilots with internal and external partners.
➢ Office of General Counsel (OGC) OGC provides sound and timely legal advice and representation to GSA clients to enhance their ability to deliver the best value in real estate, acquisition, and technology services to the Government and the American people. OGC carries out all legal activities of GSA; ensures full and proper implementation of GSA's statutory responsibilities; and provides legal counsel to the Administrator, the Deputy Administrator, and other officials of GSA (with the exception of certain legal activities of the Office of Inspector General and the Civilian Board of Contract Appeals). The General Counsel is the chief legal officer of the agency and is responsible for legally sound implementation of GSA's mission responsibilities nationwide.

U.S. General Services Administration Annual Performance Plan and Report
7
➢ Office of Human Resources Management (OHRM) OHRM delivers comprehensive human resources services and solutions to GSA and its employees. OHRM’s primary focus is to work with GSA Services and Staff Offices to attract, motivate, develop, retain, and reward employees to maintain and enhance a mission-ready workforce.
➢ Office of Mission Assurance (OMA) OMA ensures resilience and continuity of the agency’s critical business processes by integrating and coordinating activities across all domains of security (physical, personnel, and industrial), HSPD-12 credentialing, emergency management, and contingency and continuity planning. OMA provides an enterprise-wide approach to mission assurance planning while ensuring the safety, privacy, and security of GSA facilities, personnel, and assets nationwide.
➢ Office of Small Business Utilization (OSBU) OSBU has nationwide responsibility for GSA’s small business programs, and is the chief advocate for small and disadvantaged businesses. OSBU collaborates with GSA mission-delivery and support offices to meet and exceed statutory prime and subcontracting small business and socio-economic small business goals. OSBU promotes small business access to GSA’s nationwide procurement opportunities, ensures small business participation, and provides training.
➢ Office of Strategic Communication (OSC) OSC is the agency’s resource for all internal and external communication needs, focusing on using communication to help GSA meet its mission and business goals. OSC services include internal communication, graphic design and production, media relations, web and social media, audiovisual production, writing and editing, speechwriting and executive communication, and risk communication and crisis management.
INDEPENDENT OFFICES
➢ Office of Inspector General (OIG) The OIG is responsible for promoting economy, efficiency, and effectiveness, and for detecting and preventing fraud, waste, and mismanagement in GSA programs and operations.
➢ Civilian Board of Contract Appeals (CBCA) The CBCA is an independent tribunal housed within GSA. Its primary responsibility is to adjudicate contract disputes between civilian Federal agencies and contractors under the Contract Disputes Act.

U.S. General Services Administration Annual Performance Plan and Report
8
FY 2019 ANNUAL PERFORMANCE REPORT
GOALS (G)
Strategic Objectives (SO) and Performance Indicators
(Desired trend direction: ↑= increasing ↓= decreasing ↔ = within range)
Lead Office
FY 2016 Results
FY 2017 Results
FY 2018 Results
FY 2019 Targets
FY 2019 Results
(G1) REAL ESTATE
Save taxpayer
money through better
management of Federal real
estate.
SO 1.1 Reduce the cost of the Federal inventory
Vacant space in inventory ↓ PBS 3.0% 2.9% 3.3% 3.0% 3.3%
Percent of lease agreements negotiated at or below market rates ↔ ⦿ Agency Priority Goal
PBS 49% 48% 44% 55% 48%
Percent of leased revenue available after administering leasing program ↔
PBS -1.16% -0.59% -0.40% 0 - 2% -0.56%
Percent of non-competitive sales and donations awarded within 220 days ↑
PBS 98% 90% 97.5% 93% 98%
Percent of public sale properties awarded within 135 days ↑
PBS 98% 98% 98% 98% 99%
Gross sales revenue from GSA and Federal Assets Sale and Transfers Act (FASTA) disposals (in millions) ↑
PBS $17.6 $50.2 $76.4 $15 $61.7
SO 1.2 Establish GSA as a more effective provider of real estate services for all agencies
Energy intensity reduction (cumulative percent reduction from baseline year) ↑
PBS 3.78% 6.41% 5.41% 5.66%* 5.06%
Percent of capital construction projects on schedule and on budget ↑
PBS 98% 99% 90% 85% 99%
Tenant satisfaction with Government-owned and -leased space (Facilities Management Index) ↑
PBS 69% 70% 69% 70% 70%
Percent of cleaning and maintenance costs within market range ↑
PBS 80.3% 73.2% 73.6% 80% 72%
*FY 2019 target was reset based on Executive Order 13834, Efficient Federal Operations.
U.S. General Services Administration Annual Performance Plan and Report
9
GOALS (G)
(continued) Strategic Objectives (SO) and
Performance Indicators (Desired trend direction: ↑= increasing
↓= decreasing ↔ = within range)
Lead Office
FY 2016 Results
FY 2017 Results
FY 2018 Results
FY 2019 Targets
FY 2019 Results
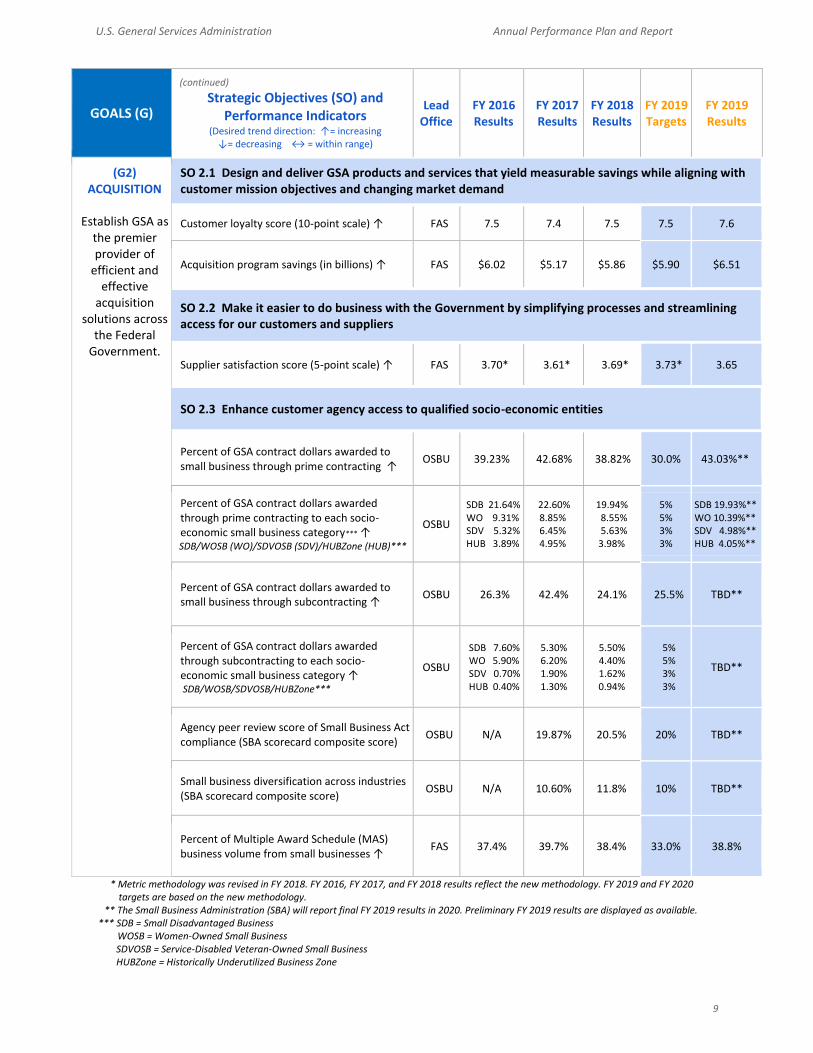
(G2) ACQUISITION
Establish GSA as
the premier provider of
efficient and effective
acquisition solutions across
the Federal Government.
SO 2.1 Design and deliver GSA products and services that yield measurable savings while aligning with customer mission objectives and changing market demand
Customer loyalty score (10-point scale) ↑ FAS 7.5 7.4 7.5 7.5 7.6
Acquisition program savings (in billions) ↑ FAS $6.02 $5.17 $5.86 $5.90 $6.51
SO 2.2 Make it easier to do business with the Government by simplifying processes and streamlining access for our customers and suppliers
Supplier satisfaction score (5-point scale) ↑ FAS 3.70* 3.61* 3.69* 3.73* 3.65
SO 2.3 Enhance customer agency access to qualified socio-economic entities
Percent of GSA contract dollars awarded to small business through prime contracting ↑
OSBU 39.23% 42.68% 38.82% 30.0% 43.03%**
Percent of GSA contract dollars awarded through prime contracting to each socio-economic small business category*** ↑
SDB/WOSB (WO)/SDVOSB (SDV)/HUBZone (HUB)***
OSBU
SDB 21.64% WO 9.31% SDV 5.32% HUB 3.89%
22.60% 8.85% 6.45% 4.95%
19.94% 8.55% 5.63% 3.98%
5% 5% 3% 3%
SDB 19.93%** WO 10.39%** SDV 4.98%** HUB 4.05%**
Percent of GSA contract dollars awarded to small business through subcontracting ↑
OSBU 26.3% 42.4% 24.1% 25.5% TBD**
Percent of GSA contract dollars awarded through subcontracting to each socio-economic small business category ↑ SDB/WOSB/SDVOSB/HUBZone***
OSBU
SDB 7.60% WO 5.90% SDV 0.70% HUB 0.40%
5.30% 6.20% 1.90% 1.30%
5.50% 4.40% 1.62%
0.94%
5% 5% 3% 3%
TBD**
Agency peer review score of Small Business Act compliance (SBA scorecard composite score)
OSBU N/A 19.87% 20.5% 20% TBD**
Small business diversification across industries (SBA scorecard composite score)
OSBU N/A 10.60% 11.8% 10% TBD**
Percent of Multiple Award Schedule (MAS) business volume from small businesses ↑
FAS 37.4% 39.7% 38.4% 33.0% 38.8%
* Metric methodology was revised in FY 2018. FY 2016, FY 2017, and FY 2018 results reflect the new methodology. FY 2019 and FY 2020 targets are based on the new methodology. ** The Small Business Administration (SBA) will report final FY 2019 results in 2020. Preliminary FY 2019 results are displayed as available.
*** SDB = Small Disadvantaged Business WOSB = Women-Owned Small Business
SDVOSB = Service-Disabled Veteran-Owned Small Business HUBZone = Historically Underutilized Business Zone
U.S. General Services Administration Annual Performance Plan and Report
10
GOALS (G)
(continued) Strategic Objectives (SO) and
Performance Indicators (Desired trend direction: ↑= increasing
↓= decreasing ↔ = within range)
Lead Office
FY 2016 Results
FY 2017 Results
FY 2018 Results
FY 2019 Targets
FY 2019 Results
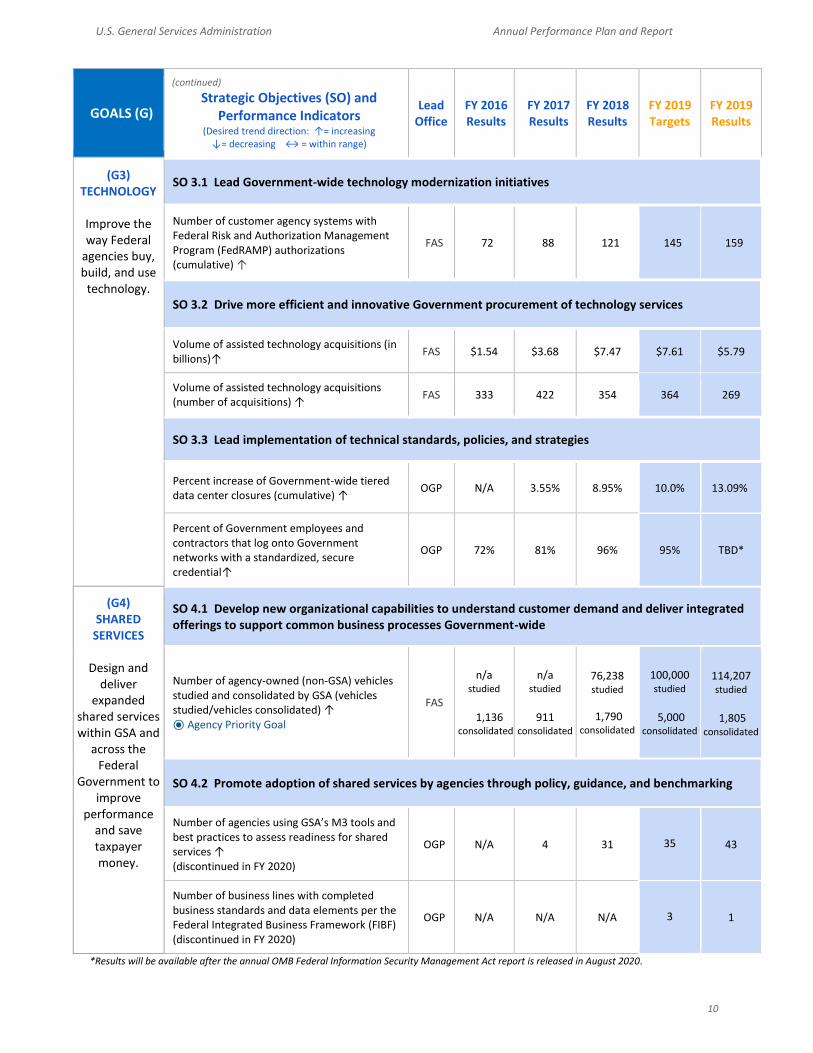
(G3) TECHNOLOGY
Improve the way Federal
agencies buy, build, and use
technology.
SO 3.1 Lead Government-wide technology modernization initiatives
Number of customer agency systems with Federal Risk and Authorization Management Program (FedRAMP) authorizations (cumulative) ↑
FAS 72 88 121 145 159
SO 3.2 Drive more efficient and innovative Government procurement of technology services
Volume of assisted technology acquisitions (in billions)↑
FAS $1.54 $3.68 $7.47 $7.61 $5.79
Volume of assisted technology acquisitions (number of acquisitions) ↑
FAS 333 422 354 364 269
SO 3.3 Lead implementation of technical standards, policies, and strategies
Percent increase of Government-wide tiered data center closures (cumulative) ↑
OGP N/A 3.55% 8.95% 10.0% 13.09%
Percent of Government employees and contractors that log onto Government networks with a standardized, secure credential↑
OGP 72% 81% 96% 95% TBD*
(G4) SHARED
SERVICES
Design and deliver
expanded shared services within GSA and
across the Federal
Government to improve
performance and save taxpayer money.
SO 4.1 Develop new organizational capabilities to understand customer demand and deliver integrated offerings to support common business processes Government-wide
Number of agency-owned (non-GSA) vehicles studied and consolidated by GSA (vehicles studied/vehicles consolidated) ↑ ⦿ Agency Priority Goal
FAS
n/a
studied
1,136
consolidated
n/a
studied
911
consolidated
76,238 studied
1,790 consolidated
100,000
studied
5,000
consolidated
114,207
studied
1,805
consolidated
SO 4.2 Promote adoption of shared services by agencies through policy, guidance, and benchmarking
Number of agencies using GSA’s M3 tools and best practices to assess readiness for shared services ↑ (discontinued in FY 2020)
OGP N/A 4 31 35 43
Number of business lines with completed business standards and data elements per the Federal Integrated Business Framework (FIBF) (discontinued in FY 2020)
OGP N/A N/A N/A 3 1
*Results will be available after the annual OMB Federal Information Security Management Act report is released in August 2020.

U.S. General Services Administration Annual Performance Plan and Report
11
GOALS (G)
(continued) Performance Indicators
(Desired trend direction: ↑= increasing ↓= decreasing ↔ = within range)
Lead Office
FY 2016 Results
FY 2017 Results
FY 2018 Results
FY 2019 Target
FY 2019 Results
(continued)
(G4) SHARED
SERVICES
Design and deliver
expanded shared services within GSA and
across the Federal
Government to improve
performance and save taxpayer money.
SO 4.3 Support the overall mission of GSA by investing in our employees and modeling how we deliver internal support services, while providing policy guidance across Government
Total GSA operating cost as a percentage of goods and services provided ↓
OCFO 9.44% 9.25% 8.45% 9.00% 8.01%
Effectiveness of GSA CXO functions, as measured by customer satisfaction (7-point scale) ↑
CXO 4.96 5.07 5.16 5.23 5.42
Percent of GSA IT portfolio utilizing cloud technologies ↑
OCIO 42% 42% 47% 50% 50%
Competition rate for GSA acquisitions ↑ OGP 80.3% 81.4% 82.6% 80.0% 85.4%
Competitive One-Bid rate for GSA acquisitions↓ OGP 14.3% 14.9% 18.0% 15.0% 15.4%
Federal Employee Viewpoint Survey — Connection to GSA's mission (percent positive) ↑
GSA Service &
Staff Offices
72.2% 76.2% 77% 78% 79.6%

U.S. General Services Administration Annual Performance Plan and Report
12
FY 2021 ANNUAL PERFORMANCE PLAN
STRATEGIC FRAMEWORK
The strategic framework as defined in the GSA FY 2018–2022 Strategic Plan is presented below:
STRATEGIC GOALS (G)
(G1) REAL ESTATE Save taxpayer money through better management of Federal real estate.
(G2) ACQUISITION Establish GSA as the premier provider of efficient and effective acquisition solutions across the Federal Government.
(G3) TECHNOLOGY Improve the way Federal agencies buy, build, and use technology.
(G4) SHARED SERVICES Design and deliver expanded shared services within GSA and across the Federal Government to improve performance and save taxpayer money.
STRATEGIC OBJECTIVES (SO) and PERFORMANCE GOALS (PG)
SO 1.1 Reduce the cost of the Federal inventory. ● PG 1.1.1 Reduce vacant space in
inventory ● PG 1.1.2 Lease cost relative to the
average market rate ● PG 1.1.3 Generate sufficient funds
from operations to effectively operate GSA leased buildings
● PG 1.1.4 Timely award of non-competitive sales and donations
● PG 1.1.5 Timely award of public sale properties
● PG 1.1.6 Generate revenue from real property sales
SO 2.1 Design and deliver GSA products and services that yield measurable savings while aligning with customer mission objectives and changing market demand. ● PG 2.1.1 Increase customer
satisfaction
● PG 2.1.2 Expand the use of GSA acquisition solutions across the Government
SO 3.1 Lead Government-wide technology modernization initiatives. ● PG 3.1.1 Provide agencies with
cloud authorizations to modernize IT portfolios
● PG 3.1.2 Expand agencies’ use of GSA technology solutions
SO 4.1 Develop new organizational capabilities to understand customer demand and deliver integrated offerings to support common business processes Government-wide. ● PG 4.1.1 Expand centralized
services
SO 2.2 Make it easier to do business with the Government by simplifying processes and streamlining access for our customers and suppliers.
● PG 2.2.1 Increase supplier
satisfaction ● PG 2.2.2 Consolidate Multiple
Award Schedule
SO 3.2 Drive more efficient and innovative Government procurement of technology services.
● PG 3.2.1 Improve agency
technology procurement capabilities through acquisition consulting
SO 4.2 Promote adoption of shared services by agencies through policy, guidance, and benchmarking. ● PG 4.2.1 Reduce barriers to entry
to facilitate easier adoption of shared services
SO 1.2 Establish GSA as a more effective provider of real estate services for all agencies. ● PG 1.2.1 Reduce total energy
intensity ● PG 1.2.2 Complete capital projects
on schedule and budget ● PG 1.2.3 Improve tenant
satisfaction in Government-owned and -leased space — Facilities Management Index
● PG 1.2.4 Provide building cleaning and maintenance at competitive costs
SO 2.3 Enhance customer agency access to qualified small and socio-economic businesses. ● PG 2.3.1 Create more
opportunities for small and socio-economic businesses
SO 3.3 Lead implementation of technical standards, policies, and strategies. ● PG 3.3.1 Provide agencies with
the tools and resources to implement IT standards and policies
SO 4.3 Support the overall mission of GSA by investing in our employees and modeling how we deliver internal support services, while providing policy guidance across Government. ● PG 4.3.1 Efficient and effective
mission-support services at GSA (CXO and non-CXO functions)
● PG 4.3.2 Highly engaged GSA workforce that is prepared to support and deliver new and expanded offerings

U.S. General Services Administration Annual Performance Plan and Report
13
STRATEGIC OBJECTIVES (SO) and PERFORMANCE INDICATORS SUMMARY
Performance Indicators (Desired trend direction: ↑= increasing
↓= decreasing ↔ = within range)
Lead Office
FY 2017 Results
FY 2018 Results
FY 2019 Results
FY 2020 Targets
FY 2021 Targets
SO 1.1 Reduce the cost of the Federal inventory
Vacant space in inventory ↓ PBS 2.9% 3.3% 3.3% 3.0% 3.0%
Lease cost relative to average market rate ↓ ⦿ FY 2020 - 2021 Agency Priority Goal
PBS -3.7% -5.2% -17% ≦ -7.0% ≦ -7.0%
Percent of leased revenue available after administering leasing program ↔
PBS -0.59% -0.40% -0.56% -1.1% to 1% -1.1% to 1%
Percent of non-competitive sales and donations awarded within 220 days ↑
PBS 90% 97.5% 98% 93% 93%
Percent of public sale properties awarded within 135 days↑ PBS 98% 98% 99% 98% 98%
Gross sales revenue from GSA disposals (in millions) ↑ PBS $50.2 $76.4 $61.7 $15.0 $13.5
SO 1.2 Establish GSA as a more effective provider of real estate services for all agencies
Energy intensity reduction (cumulative % reduction from baseline year) ↑ *
PBS 6.41% 5.41% 5.06% 5.31% -0.25% of FY 2020 Results
Percent of capital construction projects on schedule and on budget ↑
PBS 99% 90% 99% 90% 90%
Tenant satisfaction with Government-owned and -leased space (Facilities Management Index) ↑
PBS 70% 69% 70% 71% 71%
Percent of cleaning and maintenance costs within market range ↑
PBS 73.2% 73.6% 72% 80% 80%
SO 2.1 Design and deliver GSA products and services that yield measurable savings while aligning with customer mission objectives and changing market demand
Customer loyalty score (10-point scale) ↑ FAS 7.4 7.5 7.6 7.6 7.7
Acquisition program savings (in billions) ↑ FAS $5.17 $5.86 $6.51 $6.6 $6.7
* FY 2020 target was reset based on Executive Order 13834, Efficient Federal Operations.

U.S. General Services Administration Annual Performance Plan and Report
14
(continued)
Performance Indicators (Desired trend direction: ↑= increasing
↓= decreasing ↔ = within range)
Lead Office
FY 2017 Results
FY 2018 Results
FY 2019 Results
FY 2020 Targets
FY 2021 Targets
SO 2.2 Make it easier to do business with the Government by simplifying processes and streamlining access for our customers and suppliers
Supplier satisfaction score (5-point scale) ↑ FAS 3.61 3.69 3.65 3.70 3.75
Percent of vendors transitioned to new consolidated Multiple Award Schedule (MAS) ⦿ FY 2020 - 2021 Agency Priority Goal
FAS N/A N/A N/A 50% 100%
Multiple Award Schedule (MAS) Sales (in billions) ⦿ FY 2020 - 2021 Agency Priority Goal
FAS $31.1B $31.2B $32.0 $32.3 $32.5
SO 2.3 Enhance customer agency access to qualified socio-economic entities
Percent of GSA contract dollars awarded to small business through prime contracting ↑
OSBU 42.68% 38.82% 43.03%* 29.0% TBD**
Percent of GSA contract dollars awarded through prime contracting to each socio-economic small business category↑ SDB / WOSB / SDVOSB (SDV) / HUBZone (HUB) ***
OSBU
22.60% 8.85% 6.45% 4.95%
19.94% 8.55% 5.63% 3.98%
SDB 19.93%* WOSB 10.39%* SDV 4.98%* HUB 4.05%*
5% 5% 3% 3%
5% 5% 3% 3%
Percent of GSA contract dollars awarded to small business through subcontracting ↑
OSBU 42.4% 24.1% TBD* 24.0% TBD**
Percent of GSA contract dollars awarded through subcontracting to each socio-economic small business category ↑ SDB / WOSB / SDVOSB / HUBZone***
OSBU
5.30% 6.20% 1.90% 1.30%
5.50% 4.40% 1.62% 0.94%
TBD*
5% 5% 3% 3%
5% 5% 3% 3%
Agency peer review score of Small Business Act compliance (SBA scorecard composite score)
OSBU 19.87% 20.5% TBD* 20% TBD**
Small business diversification across industries (SBA scorecard composite score)
OSBU 10.6% 11.8% TBD* 10% TBD**
Percent of Multiple Award Schedule (MAS) business volume from small businesses ↑
FAS 39.7% 38.4% 38.8% 33.0% 33.0%
SO 3.1 Lead Government-wide technology modernization initiatives
Number of customer agency systems with FedRAMP authorizations (cumulative) ↑
FAS 88 121 159 183 210
Percent of Major IT Project spend with GSA involvement ↑ FAS N/A 22% 23% 24% 25%
* The Small Business Administration (SBA) will report final FY 2019 results in 2020. Preliminary FY 2019 results are displayed as available. ** Target will be set by SBA.
*** SDB = Small Disadvantaged Business WOSB = Women-Owned Small Business SDVOSB = Service-Disabled Veteran-Owned Small Business HUBZone = Historically Underutilized Business Zone
U.S. General Services Administration Annual Performance Plan and Report
15
(continued) Performance Indicators
(Desired trend direction: ↑= increasing ↓= decreasing ↔ = within range)
Lead Office
FY 2017 Results
FY 2018 Results
FY 2019 Results
FY 2020 Targets
FY 2021 Targets
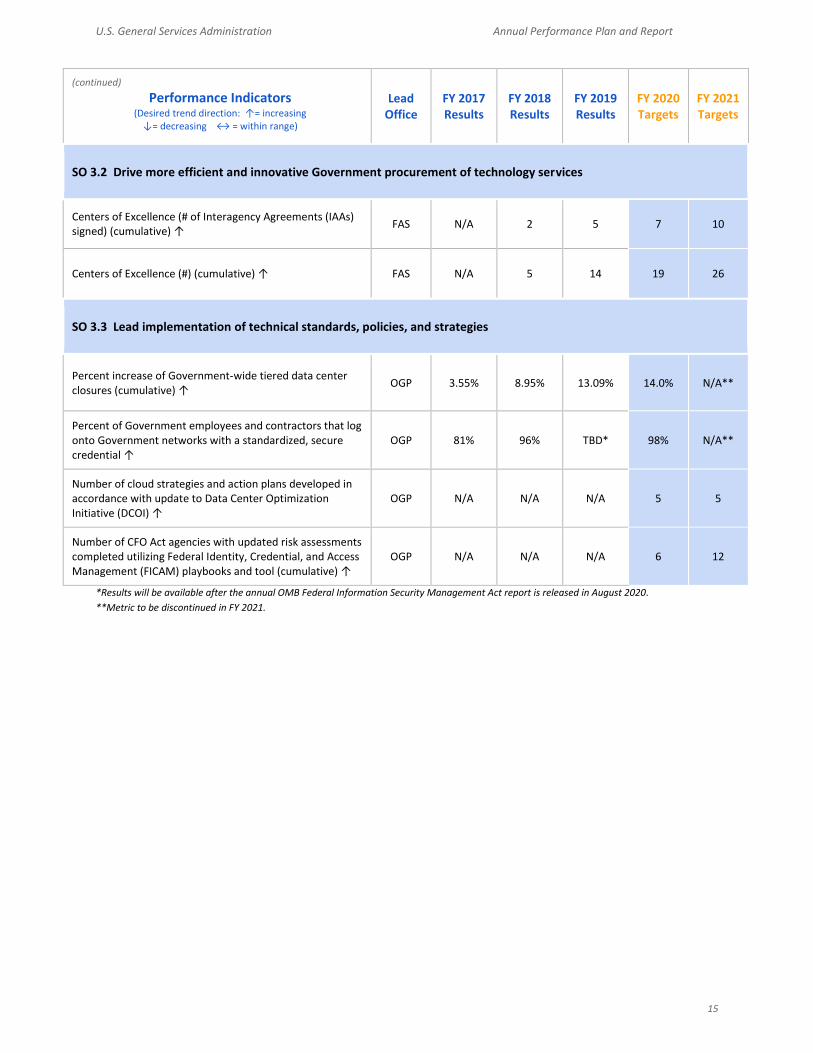
SO 3.2 Drive more efficient and innovative Government procurement of technology services
Centers of Excellence (# of Interagency Agreements (IAAs) signed) (cumulative) ↑
FAS N/A 2 5 7 10
Centers of Excellence (#) (cumulative) ↑ FAS N/A 5 14 19 26
SO 3.3 Lead implementation of technical standards, policies, and strategies
Percent increase of Government-wide tiered data center closures (cumulative) ↑
OGP 3.55% 8.95% 13.09% 14.0% N/A**
Percent of Government employees and contractors that log onto Government networks with a standardized, secure credential ↑
OGP 81% 96% TBD* 98% N/A**
Number of cloud strategies and action plans developed in accordance with update to Data Center Optimization Initiative (DCOI) ↑
OGP N/A N/A N/A 5 5
Number of CFO Act agencies with updated risk assessments completed utilizing Federal Identity, Credential, and Access Management (FICAM) playbooks and tool (cumulative) ↑
OGP N/A N/A N/A 6 12
*Results will be available after the annual OMB Federal Information Security Management Act report is released in August 2020.
**Metric to be discontinued in FY 2021.
U.S. General Services Administration Annual Performance Plan and Report
16
(continued)
Performance Indicators (Desired trend direction: ↑= increasing
↓= decreasing ↔ = within range)
Lead Office
FY 2017 Results
FY 2018 Results
FY 2019 Results
FY 2020 Targets
FY 2021 Targets
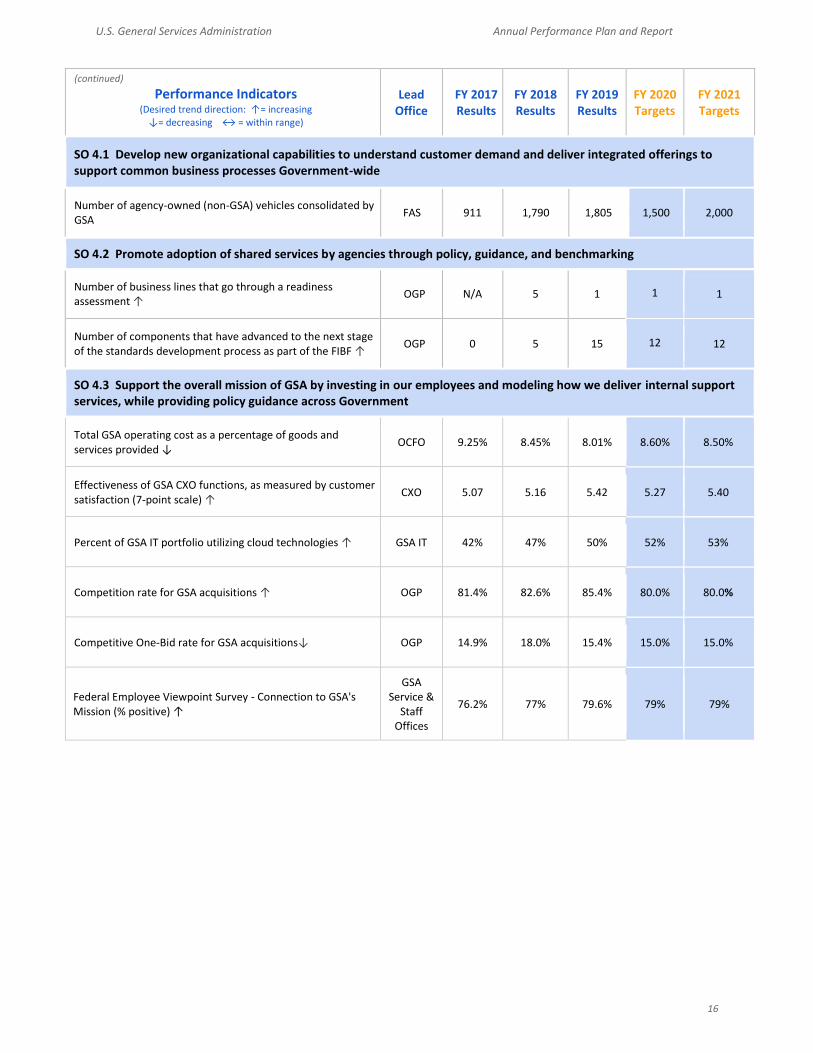
SO 4.1 Develop new organizational capabilities to understand customer demand and deliver integrated offerings to support common business processes Government-wide
Number of agency-owned (non-GSA) vehicles consolidated by GSA
FAS 911 1,790 1,805 1,500 2,000
SO 4.2 Promote adoption of shared services by agencies through policy, guidance, and benchmarking
Number of business lines that go through a readiness assessment ↑
OGP N/A 5 1 1 1
Number of components that have advanced to the next stage of the standards development process as part of the FIBF ↑
OGP 0 5 15 12 12
SO 4.3 Support the overall mission of GSA by investing in our employees and modeling how we deliver internal support services, while providing policy guidance across Government
Total GSA operating cost as a percentage of goods and services provided ↓
OCFO 9.25% 8.45% 8.01% 8.60% 8.50%
Effectiveness of GSA CXO functions, as measured by customer satisfaction (7-point scale) ↑
CXO 5.07 5.16 5.42 5.27 5.40
Percent of GSA IT portfolio utilizing cloud technologies ↑ GSA IT 42% 47% 50% 52% 53%
Competition rate for GSA acquisitions ↑ OGP 81.4% 82.6% 85.4% 80.0% 80.0%
Competitive One-Bid rate for GSA acquisitions↓ OGP 14.9% 18.0% 15.4% 15.0% 15.0%
Federal Employee Viewpoint Survey - Connection to GSA's Mission (% positive) ↑
GSA Service &
Staff Offices
76.2% 77% 79.6% 79% 79%

U.S. General Services Administration Annual Performance Plan and Report
17
FY 2020 to 2021 AGENCY PRIORITY GOALS (APGs)
APG 1
Lease Cost Relative to Market (LCRM) GSA will achieve savings for the taxpayer by negotiating leases below average market rates by engaging in longer lease terms when they allow GSA to obtain more favorable rates and conditions; increasing the use of the force multiplier tools, both the Automated Advanced Acquisition Program (AAAP) and the GSA Leasing Support (GLS) services contract; and timely replacement of expiring leases.
APG 2
Multiple Award Schedule Reform - Schedules Consolidation As part of GSA’s Federal Marketplace strategy to make the Government buying and selling experience easy, efficient, and modern, GSA will consolidate the agency’s 24 Multiple Award Schedules (MAS) into one single Schedule for products, services, and solutions by the end of FY 2021 for more than 12,000 vendors. The single Schedule will have consistent terms and conditions that also provide the opportunity for industry to come to market the way the agencies buy.
U.S. General Services Administration Annual Performance Plan and Report
18
FY 2021 ANNUAL PERFORMANCE PLAN DETAILS
STRATEGIC GOAL 1
Save taxpayer money through better management of Federal real estate.
GSA will continue to achieve significant cost savings for the Federal Government by optimizing the use of the GSA real estate portfolio. Effective asset management, integrated delivery of workspace solutions, and consistent application of project management principles will provide customers the opportunity to enhance their work environments, reduce real estate costs, and effectively deliver on their missions. Reduced real estate costs should provide opportunities for customers to shift spending to mission-related activities. Portfolio planning with customers at the national and local levels will enable customers to consider innovative workplace strategies and arrive at cost-effective, state-of-the-art real estate solutions. In doing so, GSA will continue to promote investments to optimize federally owned assets and lower the cost of the leased portfolio. GSA will continue to increase the sales of under-utilized federally owned property to ensure a Government-owned portfolio of high-performing assets.
_____________________________________________________________________________
Strategic Objective 1.1: Reduce the cost of Federal inventory. PBS’ execution of the Real Estate Investment and Savings Strategy in FY 2020 will be central to the delivery of real estate solutions and will achieve savings for the American taxpayer. This initiative presents an opportunity to reduce future spending on leased space by billions of dollars. PBS can achieve lower rental rates and reduce future rental of space payments significantly by replacing the large inventory of expiring leases with leases at a reduced square footage, with longer terms, and with rates negotiated at or below market rental rates. During the period from FY 2019 through FY 2023, approximately 60 percent of PBS leases will expire. This creates a unique opportunity to restructure this lease portfolio and meet agency facility needs at a significantly reduced cost over the life of the replacement leases. In FY 2018, PBS initiated the Lease Cost Avoidance Plan (LCAP) to replace these leases and restructure the PBS portfolio. PBS established a Lease Cost Avoidance goal of reducing Federal Buildings Fund obligations by approximately $4.7 billion over the duration of these lease contracts. This new approach to PBS leasing was incorporated into the Real Estate Investment and Savings Strategy in FY 2019. In order to achieve the benefits in managing lease expirations, PBS realigned internal resources to critical positions and will allot additional resources to increasing productivity and accelerating the lease replacement rate. Reducing lease costs for agencies will allow them to dedicate more resources to their missions. The Real Estate Investment and Savings Strategic initiative creates a tremendous opportunity for reducing the Federal footprint, saving taxpayer dollars, and fulfilling GSA’s mission. Key Strategies
A. Footprint Optimization a. Invest in major building improvements, new construction, and consolidation projects to
accelerate the reduction of space. Backfill Federal space with agencies occupying costly leased space upon lease expiration. Balance investments between new construction and existing assets to effectively manage GSA’s portfolio of Federal assets.

U.S. General Services Administration Annual Performance Plan and Report
19
b. Increase assets with positive funds from operations by continuing to identify and invest in core assets on the basis of Federal need, asset use, asset condition, and market value.
c. Dispose of underperforming Federal assets by working with agencies to develop and prioritize effective and efficient real property repositioning strategies. Aggressively identify and dispose of underperforming Federal assets through expanded sales and out leases, auctions, and transfers to local entities. Partner with stakeholders to ensure disposal projects leave a positive impact on communities.
B. Lease Cost Avoidance a. Increase use of longer lease terms, where appropriate, as a mechanism for cost
avoidance. b. Increase use of the Automated Advanced Acquisition Program (AAAP) and broker
services contracts to accelerate the lease replacement rate and avoid costly lease extensions. AAAP is a multiple award lease procurement tool. It allows potential suppliers to compete for Federal leases by submitting a single offer through an online portal. The broker contractor assists GSA in delivering the best value by leveraging private sector resources and expertise to assist in accomplishing the leasing workload.
C. PBS Productivity a. PBS is evaluating resource needs across the organization to ensure staff are in place and
equipped to successfully carry out the plan. Strategic investment in human capital, specifically with regard to expertise in lease contracting, construction management, and cost estimating will ensure staff expertise is aligned with the opportunity to capitalize on upcoming lease expirations.
b. Invest additional resources to achieve the benefits in managing lease expirations.
Goal Leader Daniel W. Mathews, Commissioner
Public Buildings Service
Contributing Programs ● Portfolio Management and Customer Engagement ● Leasing
● Real Property Utilization and Disposal
● Construction and Acquisition
Strategic Objective 1.1 – FY 2019 Progress Update
FY 2018, GSA is on a trajectory to realize major cost avoidance for the taxpayer. By partnering with customer agencies to shape the demand for leased space and improving lease execution practices, GSA avoided approximately $2 billion in full term lease costs through FY 2019 and is projecting to avoid approximately $4.7 billion in total full term lease costs by FY 2023. For FY 2019, GSA negotiated 48 percent (261 out of 544 transactions) of leases at or below the average of comparable market rates, which is an improvement over FY 2018 (44 percent). The total aggregated GSA lease costs were 17 percent below market lease costs, compared to 5.2 percent at the end of FY 2018, which is a dramatic improvement over a 2-year time period. By focusing on improving the utilization rates in larger lease transactions and negotiating longer term leases, when appropriate, GSA is generating major overall lease cost avoidance. In FY 2019, 46 percent of leases had a firm term of 10 years or greater, compared to only 26 percent at the end of FY 2017. GSA recently developed a 5-year capital improvement plan that will prioritize repair and alterations (R&A) projects in federally owned assets, and takes into consideration potential savings in reducing liabilities, consolidating agency footprints, and reducing lease costs. Consolidating tenants and improving utilization will reduce the size and cost of the overall Federal inventory. Vacant space remains
U.S. General Services Administration Annual Performance Plan and Report
20
slightly higher than the 3-percent target due to Reduce the Footprint and consolidation initiatives that require holding on to vacant space for more strategic asset business planning. While GSA is slightly higher than its target, GSA’s vacant space remains lower than the private sector. Since FY 2015, when the Reduce the Footprint Initiative began, GSA has helped its customers reduce almost 5 million rentable square feet (RSF). In FY 2019, GSA increased its portfolio by approximately 900,000 RSF; however, 1.7 million RSF in GSA’s inventory in FY 2019 was attributed to temporary lease space for Census 2020. GSA’s Real Property Disposal Division awarded 167 disposal projects on behalf of all Federal agencies totaling 879,000 RSF. In an effort to save taxpayer money through better management of Federal real estate, GSA will continue to look at ways to restructure the Federal portfolio while partnering with customer agencies.
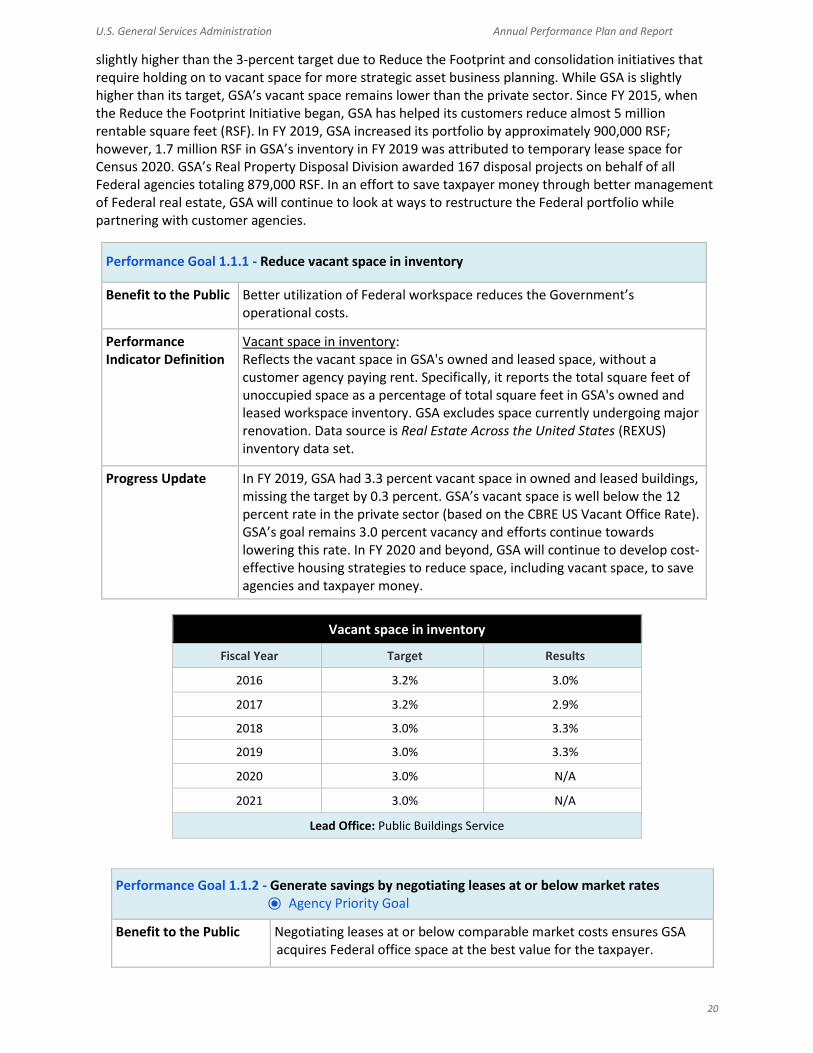
Performance Goal 1.1.1 - Reduce vacant space in inventory
Benefit to the Public Better utilization of Federal workspace reduces the Government’s operational costs.
Performance Indicator Definition
Vacant space in inventory: Reflects the vacant space in GSA's owned and leased space, without a customer agency paying rent. Specifically, it reports the total square feet of unoccupied space as a percentage of total square feet in GSA's owned and leased workspace inventory. GSA excludes space currently undergoing major renovation. Data source is Real Estate Across the United States (REXUS) inventory data set.
Progress Update In FY 2019, GSA had 3.3 percent vacant space in owned and leased buildings, missing the target by 0.3 percent. GSA’s vacant space is well below the 12 percent rate in the private sector (based on the CBRE US Vacant Office Rate). GSA’s goal remains 3.0 percent vacancy and efforts continue towards lowering this rate. In FY 2020 and beyond, GSA will continue to develop cost-effective housing strategies to reduce space, including vacant space, to save agencies and taxpayer money.
Vacant space in inventory
Fiscal Year Target Results
2016 3.2% 3.0%
2017 3.2% 2.9%
2018 3.0% 3.3%
2019 3.0% 3.3%
2020 3.0% N/A
2021 3.0% N/A
Lead Office: Public Buildings Service
Performance Goal 1.1.2 - Generate savings by negotiating leases at or below market rates ⦿ Agency Priority Goal
Benefit to the Public Negotiating leases at or below comparable market costs ensures GSA acquires Federal office space at the best value for the taxpayer.

U.S. General Services Administration Annual Performance Plan and Report
21
Performance Indicator Definition
Percent of lease agreements negotiated at or below market rates ⦿ FY 2018–2019 Agency Priority Goal (discontinued in FY 2020):
Compares GSA leasing costs to private sector benchmarks for equivalent office space in major markets. The market lease rate is based on GSA’s Bullseye report, which combines rates from respected nationwide commercial real estate sources. The net present value of life-cycle leasing transaction costs are used to compare negotiated leases with market value leases.
Lease cost relative to the average market rate ⦿ FY 2020–2021 Agency Priority Goal: Compares the aggregate net present value (NPV) of the costs of the GSA deals to the aggregate NPV of the market deals for equivalent office space.
Progress Update Through the fourth quarter of FY 2019, GSA negotiated 48 percent (261 out of 544 transactions) of leases at or below the average market rates. Although a little more than half of the individual transactions were above market costs, the total aggregated GSA lease costs were 17 percent below market lease costs ($495.4 million in present day dollars).
Percent of lease agreements negotiated at or below market rates ⦿ FY 2018–2019 Agency Priority Goal
(discontinued in FY 2020)
Fiscal Year Target Results
2016 55% 49%
2017 55% 48%
2018 55% 44%
2019 55% 48%
Lead Office: Public Buildings Service
Lease cost relative to the average market rate ⦿ FY 2020–2021 Agency Priority Goal
Fiscal Year Target Results
2017 Baseline -3.7%
2018 Baseline -5.2%
2019 Baseline -17.0%
2020 ≦ -7.0% N/A
2021 ≦ -7.0% N/A
Lead Office: Public Buildings Service
Performance Goal 1.1.3 - Generate sufficient funds from operations to effectively operate GSA leased buildings
Benefit to the Public Achieving break-even status in lease revenue available after program administration costs demonstrates that the leasing program can efficiently operate within the fees collected from customer agencies. Efficient delivery of leased workspace provides agencies greater flexibility in housing their workforce and operations and managing their resources.

U.S. General Services Administration Annual Performance Plan and Report
22
Performance Indicator Definition
Percent of leased revenue available after administering the leasing program: This performance indicator measures the leasing program’s revenue available after program administration costs and is calculated by taking the leased inventory revenue minus all expenses (excluding depreciation) associated with the inventory. If the measure is negative, costs were greater than revenues.
Progress Update In FY 2019, GSA had -0.56 percent of lease revenue available after administering the lease program, which is below GSA’s target of 0 to 2 percent. GSA is investing in additional resources dedicated to executing the Leasing program in support of its long term savings goals. Specifically, PBS in dedicating additional resources to the replacement of expiring high value leases with longer term leases to achieve greater lease savings. GSA’s adjusted targets in FY 2020 and FY 2021 reflect this strategy since the increase in funded expenses for resources will impact this measure negatively. GSA will work to improve this performance goal by working collaboratively across the organization. Specifically, GSA will focus on timely and accurate customer billing and lessor payments, vacant space and related security expenses, lease formulation and buyout costs, and general and administrative expenses in excess of PBS fee revenue for small dollar value leases. GSA is also working to capture efficiencies by automating certain processes. GSA’s goal is to balance expenses with revenue in FY 2020.
Percent of leased revenue available after administering leasing program
Fiscal Year Target Results
2016 0% to 2% -1.16%
2017 0% to 2% -0.59%
2018 0% to 2% -0.40%
2019 0% to 2% -0.56%
2020 -1.1% to 1% N/A
2021 -1.1% to 1% N/A
Lead Office: Public Buildings Service
Performance Goal 1.1.4 - Timely award of non-competitive sales and donations
Benefit to the Public Decreasing cycle times for non-competitive sales and donations increases the speed of disposing surplus Federal property and supports the management of a financially self-sustaining portfolio. Maintaining a viable, self-sustaining inventory of real properties ensures Federal agencies have the appropriate facilities at the best cost.
Performance Indicator Definition
Percent of non-competitive sales and donations awarded within 220 days: Reports the number of non-competitive sales and donations awarded within 220 days (minus hold times) as a percentage of total public sales. Hold time occurs when a disposal action experiences a delay because of

U.S. General Services Administration Annual Performance Plan and Report
23
pending legislation, environmental concerns, title problems, historical building reviews, or litigation. Non-competitive sales and donations include negotiated sales, public benefit conveyances, and Federal transfers. The time of award refers to the date the property is transferred to another agency, assigned to a sponsoring agency, or deeded to a public body.
Progress Update Real Property Utilization and Disposal has been operating at stretch-goal performance with regard to this measure; 98 percent of non-competitive sales and donations were awarded within 220 days. Although many factors beyond PBS’ control can affect the cycle-time of these types of disposals, PBS is optimistic that the organization can continue to maintain this level of stretch-goal performance in the long-term.
Percent of non-competitive sales and donations awarded within 220 days
Fiscal Year Target Results
2016 90% 98%
2017 90% 90%
2018 93% 97.5%
2019 93% 98%
2020 93% N/A
2021 93% N/A
Lead Office: Public Buildings Service
Performance Goal 1.1.5 - Timely award of public sale properties
Benefit to the Public Decreasing the cycle time for public sales accelerates the disposal of surplus Federal properties and supports the management of a financially self-sustaining portfolio of Federal real property assets. Maintaining a viable, self-sustaining inventory of real property ensures Federal agencies have the appropriate facilities at the best cost.
Performance Indicator Definition
Percent of public sale properties awarded within 135 days: Reports the number of public sales awarded within 135 days (minus hold times) as a percentage of total public sales. Hold time occurs when the disposal experiences an unavoidable delay because of pending legislation, historical building reviews, or litigation. The time of award refers to the date the offer to purchase is completed by GSA and the purchaser.
Progress Update Real Property Utilization and Disposal has been operating at stretch-goal performance and achieved 99 percent of total public sales on time in FY 2019. Although issues beyond PBS’ control can negatively affect the cycle-time for public sales (e.g., weak real estate markets, poor property condition, public resistance to the Government property sale, etc.). PBS is optimistic that this level of performance can be sustained.

U.S. General Services Administration Annual Performance Plan and Report
24
Percent of public sale properties awarded within 135 days
Fiscal Year Target Results
2016 90% 98%
2017 90% 98%
2018 98% 98%
2019 98% 99%
2020 98% N/A
2021 98% N/A
Lead Office: Public Buildings Service
Performance Goal 1.1.6 - Generate revenue from GSA disposals
Benefit to the Public Executing disposals in an accelerated and effective manner reduces the Government’s inventory of civilian real property, returns underutilized and highly valuable real property to productive use, and ensures effective monetary value returned on the taxpayer’s investments.
Performance Indicator Definition
Gross sales revenue from GSA disposals ($): This measure will track the total gross revenue of all GSA federal real properties brought to successful sale in fiscal year 2020 and 2021. This will include all sales and those done under any other disposal method. It will also include any revenue from federal transfers.
Progress Update Real Property Utilization and Disposal has several reports of excess for GSA properties in the pipeline that will contribute toward this measure. GSA continues to evaluate their portfolio and conduct due diligence to identify additional under and unutilized properties that will be reported excess with anticipated sales dates in FY 2021.
Gross sales revenue from GSA disposals (in millions)
Fiscal Year Target Results
2016 N/A $17.6
2017 N/A $50.2
2018 N/A $76.4
2019 $15.0 $61.7
2020 $15.0 N/A
2021 $13.5 N/A
Lead Office: Public Buildings Service
U.S. General Services Administration Annual Performance Plan and Report
25
______________________________________________________________________________
Strategic Objective 1.2: Establish GSA as a more effective provider of real estate services for all agencies. GSA will support Federal agencies in fulfilling their mission by offering integrated turn-key services, providing high-quality facility and workspace solutions, and improving responsiveness and value to customers. Adding to ongoing efforts, GSA will focus on reducing costs without reducing service levels through increased use of standardized contracts and GSA procurement tools for building operations and maintenance contracting. To more fully assess customer experience, GSA will use an improved methodology to gauge the Federal customer's experience and satisfaction with services. Finally, GSA will provide staff with the tools to ensure delivery of high-quality services.
Key Strategies
A. Use targeted capital investments to optimize owned Federal assets and enable lease cost avoidance.
a. Build high-value roadmap for highest return on investment (ROI) projects to reshape the portfolio.
b. Set up rapid impact teams for key clients. Streamline the process to address urgent and compelling customer needs.
c. Work with FASTA board to rapidly assess and act on proposed portfolio for real property disposals of underutilized Government real property.
d. Work with Federal Real Property Council (FRPC) to establish Government performance standards for real property.
B. Save taxpayer dollars by shaping demand for and improving the execution of leases. a. Focus efforts on the highest-value leases. Twenty percent of GSA’s leases account for 80
percent of the agency’s rental payments. b. Reduce the footprint through advanced and collaborative planning on expiring leases.
Advanced planning allows GSA to work with its customers by identifying essential needs, acting on best alternatives to improve workspace utilization, and negotiating below market rates.
c. Work with external stakeholders to improve timely appropriations associated with funding future tenant agency moves and construction projects.
C. Improve the efficiency with which GSA delivers workspace to the Government by leveraging talent and improving processes and tools.
a. Strategic Talent Management: Plan for the workforce of the future by shifting human capital to focus on higher value work.
i. Establish a strategic talent management board within PBS and in partnership with the Office of Human Resource Management (OHRM), achieving a concise and successful staffing plan.
ii. Leverage OHRM resources to deliver results within budget constraints. b. Facilities Optimization: Standardize core processes by leveraging shared tools and
resources. i. Collect information on core and non-core services, best practices, and areas of
improvement. ii. Develop a national staffing strategy for key facilities by using subject matter
experts. iii. Develop a measure for regional efficiency.
c. Global Project Management: Consistently adhere to agreed-upon practices and
standards across leasing, small projects, and capital projects.

U.S. General Services Administration Annual Performance Plan and Report
26
i. Replace and improve ePM, a web-based tool that creates a collaborative work environment for PBS-sponsored projects. This tool allows project teams to consolidate coordination of planning, design, procurement, and construction processes into a single, collaborative system.
d. Improve PBS collaboration with FAS. Coordinate on procurement and customer needs.
Goal Leader Daniel W. Mathews, Commissioner
Public Buildings Service
Contributing Programs ● Portfolio Management
● Real Property Disposal
● Construction and Acquisition
● Building Operations
● Repairs and Alterations
● GSA Customer Experience
Strategic Objective 1.2 – FY 2019 Progress Update
With the implementation of the PBS Productivity Plan, GSA strives to improve the efficiency with which it delivers programs. Standardizing core processes, leveraging shared tools, and better aligning human capital resources to core mission needs ensures that the agency can deliver the highest quality services in the most efficient and effective ways, significantly lowering costs to the American taxpayer.
In support of lower energy costs and a sustainable environment, GSA continues to focus on reducing energy consumption in Federal buildings. Over the past 3 years, GSA achieved approximately a 5-percent decrease in BTUs per gross square foot, and an almost 30 percent decrease when compared to the FY 2003 baseline year. GSA will continue to undertake cost-effective retrofit and Energy Savings Performance Contract projects in support of this goal. PBS is undertaking a nationwide effort to examine the methods and tools used to procure building maintenance and custodial services, lowering operating costs without impacting service levels to GSA’s Federal tenants. GSA continues to meet the performance target for keeping capital projects on schedule and within budget.
Performance Goal 1.2.1 - Reduce total energy intensity
Benefit to the Public Responsible management of energy use in Federal workspaces lowers costs to the American people, provides greater availability of domestic energy resources for other purposes, and contributes to better air quality, energy independence, and mission assurance.
Performance Indicator Definition
Energy intensity reduction (cumulative percent reduction in BTU per gross square foot, from baseline year of FY 2015): This measure assesses PBS' progress towards improving energy intensity in its facilities over time. Energy intensity (sometimes called energy usage index) is a common metric for describing energy efficiency in buildings, and it is measured in British thermal units of energy per gross square foot (BTU/GSF). Energy intensity reduction mandates and specific percentage targets are part of several laws and Executive orders from the past; however, the most recent Executive order (Executive Order 13693) to contain a specific energy intensity reduction target was rescinded and replaced by Order 13834. This Executive order does not contain a specific reduction target or energy usage goal.

U.S. General Services Administration Annual Performance Plan and Report
27
Progress Update Energy usage was volatile for the first few months of FY 2019 and increased by nearly 1 percent through February 2020. Weather conditions across most of the country were significantly colder in the first 5 months of FY 2019 as compared to the same period in FY 2018. As the inventory has become more efficient, the correlation between energy usage and weather conditions has grown stronger. However, by the end of the summer, PBS managed to reduce energy usage by over 1 percent from its high point earlier in the year. PBS considers this a major accomplishment even though the FY 2019 overall goal was not met. The strategy for FY 2020 is to:
Build on the successes of FY 2019;
Devote significant time to researching better methods for deriving energy targets; and
Analyze the inventory and its potential for further reduction.
Energy intensity reduction (cumulative percent reduction from FY 2015 baseline)
Fiscal Year Target Results
2016 1.70% 3.78%
2017 5.00% 6.41%
2018 7.50% 5.41%
2019 5.66% 5.06%
2020 5.31% N/A
2021 -0.25% of FY 2020 Results N/A
Lead Office: Public Buildings Service
Performance Goal 1.2.2 - Complete capital projects on schedule and on budget
Benefit to the Public Delivering space when needed enables customer agencies to most effectively carry out their missions. GSA’s efficient delivery of new and renovated facilities reduces resource demands on customer agencies and translates into higher operational effectiveness and lower operational costs.
Performance Indicator Definition
Percent of capital construction projects on schedule and on budget: Reports the percentage of prospectus-level construction projects completed on schedule and budget, weighted by the contract value. Using an earned value technique, this measure assesses project performance on all prospectus-level projects.
The project weighting criteria is based on total current contract value, which places more emphasis on large, important projects that are critical to the GSA real estate portfolio.

U.S. General Services Administration Annual Performance Plan and Report
28
Progress Update PBS finished FY 2019 with 77 projects valued at $3.4 billion in construction. Of these, 35 projects valued at $953 million reached substantial completion in FY 2019. The high level of performance can be attributed to project teams carefully keeping scope, schedule, and budget in alignment and closely managing risks on projects. The largest projects completed on schedule and budget in FY 2019 include:
Land Port of Entry, Laredo, TX ($99 million);
Harry S. Truman Building modernization, Phase 1C, Washington, DC ($86 million);
Herbert C. Hoover Building renovation, Phase 4, Washington, DC ($83 million);
Robert A. Young seismic retrofit, St. Louis, MO ($75 million);
Land Port of Entry, Columbus, TX ($71 million);
St. Elizabeth’s West Campus Phase 2A Building 54, Washington, DC ($49 million);
Belle Meade Northern Parcel remediation, Belle Meade, NJ ($46 million);
Frank Hagel Federal Building Phase 1 seismic retrofit, Richmond, CA ($28 million); and
Land Port of Entry, Phase 2, San Ysidro, CA ($157 million).
Percent of capital construction projects on schedule and on budget
Fiscal Year Target Results
2016 90% 98%
2017 90% 99%
2018 90% 90%
2019 85% 99%
2020 90% N/A
2021 90% N/A
Lead Office: Public Buildings Service
Performance Goal 1.2.3 - Improve tenant satisfaction in Government owned and leased space.
Benefit to the Public Tenant satisfaction is a good barometer for GSA to measure how well it is providing safe, reliable, productive, and sustainable workplace environments that support the business of the Federal Government at the best value to the taxpayer.
U.S. General Services Administration Annual Performance Plan and Report
29
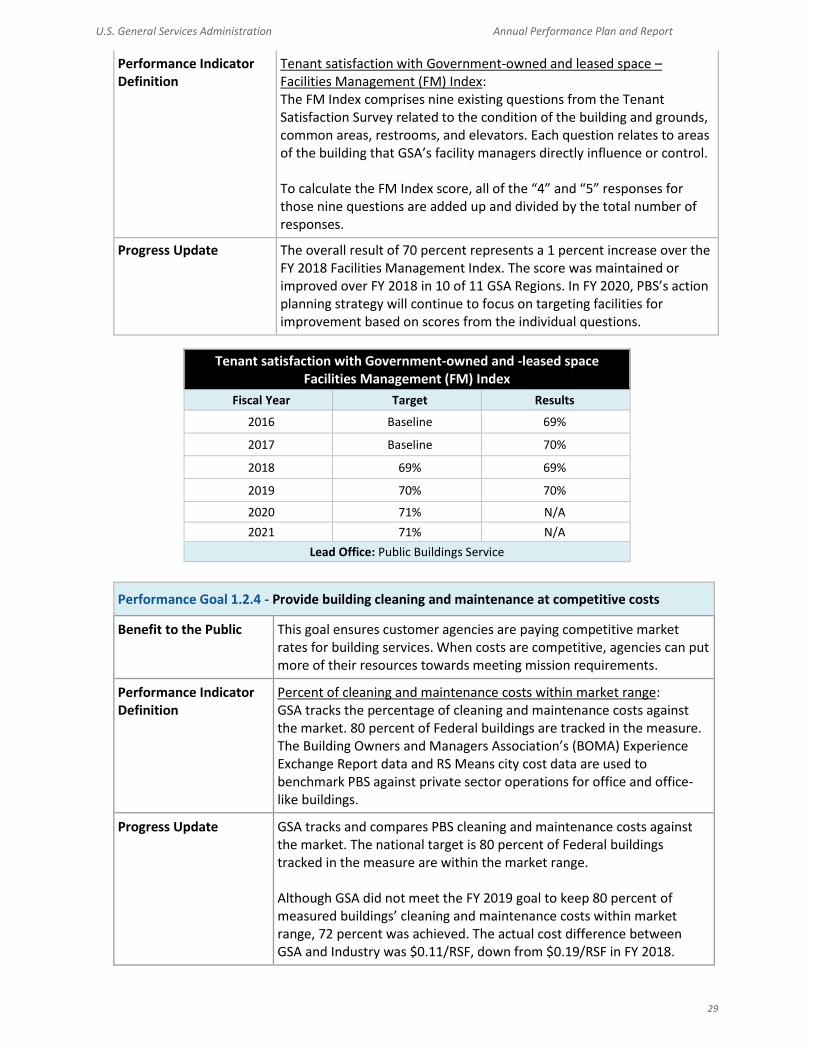
Performance Indicator Definition
Tenant satisfaction with Government-owned and leased space – Facilities Management (FM) Index: The FM Index comprises nine existing questions from the Tenant Satisfaction Survey related to the condition of the building and grounds, common areas, restrooms, and elevators. Each question relates to areas of the building that GSA’s facility managers directly influence or control.
To calculate the FM Index score, all of the “4” and “5” responses for those nine questions are added up and divided by the total number of responses.
Progress Update The overall result of 70 percent represents a 1 percent increase over the FY 2018 Facilities Management Index. The score was maintained or improved over FY 2018 in 10 of 11 GSA Regions. In FY 2020, PBS’s action planning strategy will continue to focus on targeting facilities for improvement based on scores from the individual questions.
Tenant satisfaction with Government-owned and -leased space Facilities Management (FM) Index
Fiscal Year Target Results
2016 Baseline 69%
2017 Baseline 70%
2018 69% 69%
2019 70% 70%
2020 71% N/A
2021 71% N/A
Lead Office: Public Buildings Service
Performance Goal 1.2.4 - Provide building cleaning and maintenance at competitive costs
Benefit to the Public This goal ensures customer agencies are paying competitive market rates for building services. When costs are competitive, agencies can put more of their resources towards meeting mission requirements.
Performance Indicator Definition
Percent of cleaning and maintenance costs within market range: GSA tracks the percentage of cleaning and maintenance costs against the market. 80 percent of Federal buildings are tracked in the measure. The Building Owners and Managers Association’s (BOMA) Experience Exchange Report data and RS Means city cost data are used to benchmark PBS against private sector operations for office and office-like buildings.
Progress Update GSA tracks and compares PBS cleaning and maintenance costs against the market. The national target is 80 percent of Federal buildings tracked in the measure are within the market range. Although GSA did not meet the FY 2019 goal to keep 80 percent of measured buildings’ cleaning and maintenance costs within market range, 72 percent was achieved. The actual cost difference between GSA and Industry was $0.11/RSF, down from $0.19/RSF in FY 2018.

U.S. General Services Administration Annual Performance Plan and Report
30
Percent of cleaning and maintenance costs within market range
Fiscal Year Target Results
2016 80% 80.3%
2017 80% 73.2%
2018 78% 73.6%
2019 80% 72%
2020 80% N/A
2021 80% N/A
Lead Office: Public Buildings Service
___________________________________________________
STRATEGIC GOAL 2
Establish GSA as the premier provider of efficient and effective acquisition solutions across the Federal Government.
GSA is committed to delivering service, innovation, and value through efficient operations, market expertise, and proactive partnerships with customer agencies and private sector vendors. Generating economies of scale is the cornerstone of GSA’s acquisition solutions, enabling the agency to negotiate better prices. Every day, GSA helps customers make smart purchasing decisions to acquire the goods and services they need. GSA is dedicated to improving the contract vehicles, services, and products provided to Federal agencies, military, and state and local entities. GSA makes access to the Government marketplace easier, faster, and less costly to small and socio-economic businesses. GSA is achieving this by designing and delivering solutions that meet current needs and anticipate future requirements. _____________________________________________________________________________
Strategic Objective 2.1: Design and deliver GSA products and services that yield measurable savings while aligning with customer mission objectives and changing market demand. Using the purchasing power of the Federal Government, GSA reduces Federal agencies’ operating costs, enabling them to focus on their core missions to serve the public at the best value. GSA is always looking for new ways to help these agencies make their purchases smarter and more efficient. This ability to achieve savings or avoid costs depends largely on standardizing requirements across Federal agencies that collectively leverage the Government’s purchasing power. Throughout GSA’s acquisition operations, the goal is to place customers at the center of operations, develop common requirements across the Government, and increase the adoption of solutions for agencies’ common needs. With these goals in mind, GSA has developed robust strategies to meet the current and future demands of its customers. In order to fully maximize the purchasing power of the Federal Government, GSA will provide market intelligence and acquisition expertise to the Federal Marketplace. Efforts to improve the Federal Marketplace include optimizing the buying experience by enhancing FAS’ acquisition vehicles, focusing on human-centered processes and systems, and emphasizing workforce readiness. GSA is committed to bringing Government-wide contract spend into common categories to further capture economies of scale. This approach also creates economies of skill for Government as a whole when agencies can rely on GSA to deliver the right goods and services for their mission needs.
U.S. General Services Administration Annual Performance Plan and Report
31
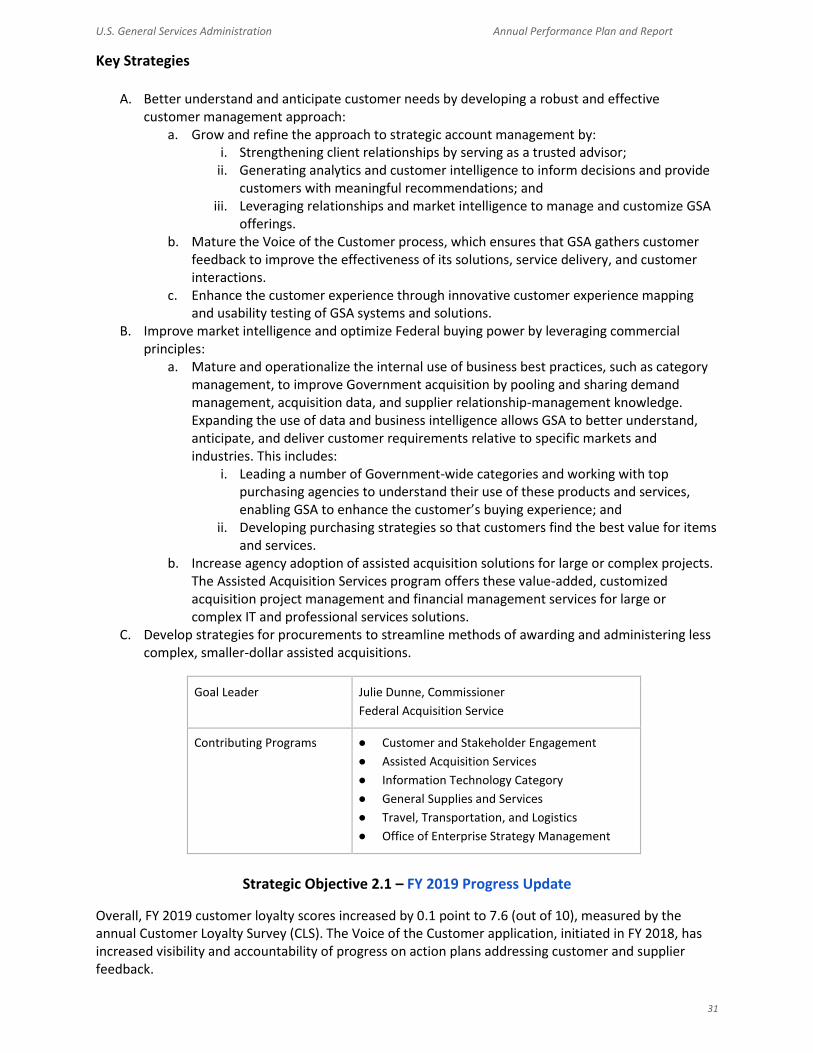
Key Strategies
A. Better understand and anticipate customer needs by developing a robust and effective customer management approach:
a. Grow and refine the approach to strategic account management by: i. Strengthening client relationships by serving as a trusted advisor;
ii. Generating analytics and customer intelligence to inform decisions and provide customers with meaningful recommendations; and
iii. Leveraging relationships and market intelligence to manage and customize GSA offerings.
b. Mature the Voice of the Customer process, which ensures that GSA gathers customer feedback to improve the effectiveness of its solutions, service delivery, and customer interactions.
c. Enhance the customer experience through innovative customer experience mapping and usability testing of GSA systems and solutions.
B. Improve market intelligence and optimize Federal buying power by leveraging commercial principles:
a. Mature and operationalize the internal use of business best practices, such as category management, to improve Government acquisition by pooling and sharing demand management, acquisition data, and supplier relationship-management knowledge. Expanding the use of data and business intelligence allows GSA to better understand, anticipate, and deliver customer requirements relative to specific markets and industries. This includes:
i. Leading a number of Government-wide categories and working with top purchasing agencies to understand their use of these products and services, enabling GSA to enhance the customer’s buying experience; and
ii. Developing purchasing strategies so that customers find the best value for items and services.
b. Increase agency adoption of assisted acquisition solutions for large or complex projects. The Assisted Acquisition Services program offers these value-added, customized acquisition project management and financial management services for large or complex IT and professional services solutions.
C. Develop strategies for procurements to streamline methods of awarding and administering less complex, smaller-dollar assisted acquisitions.
Goal Leader Julie Dunne, Commissioner
Federal Acquisition Service
Contributing Programs ● Customer and Stakeholder Engagement
● Assisted Acquisition Services
● Information Technology Category
● General Supplies and Services
● Travel, Transportation, and Logistics
● Office of Enterprise Strategy Management
Strategic Objective 2.1 – FY 2019 Progress Update
Overall, FY 2019 customer loyalty scores increased by 0.1 point to 7.6 (out of 10), measured by the annual Customer Loyalty Survey (CLS). The Voice of the Customer application, initiated in FY 2018, has increased visibility and accountability of progress on action plans addressing customer and supplier feedback.
U.S. General Services Administration Annual Performance Plan and Report
32
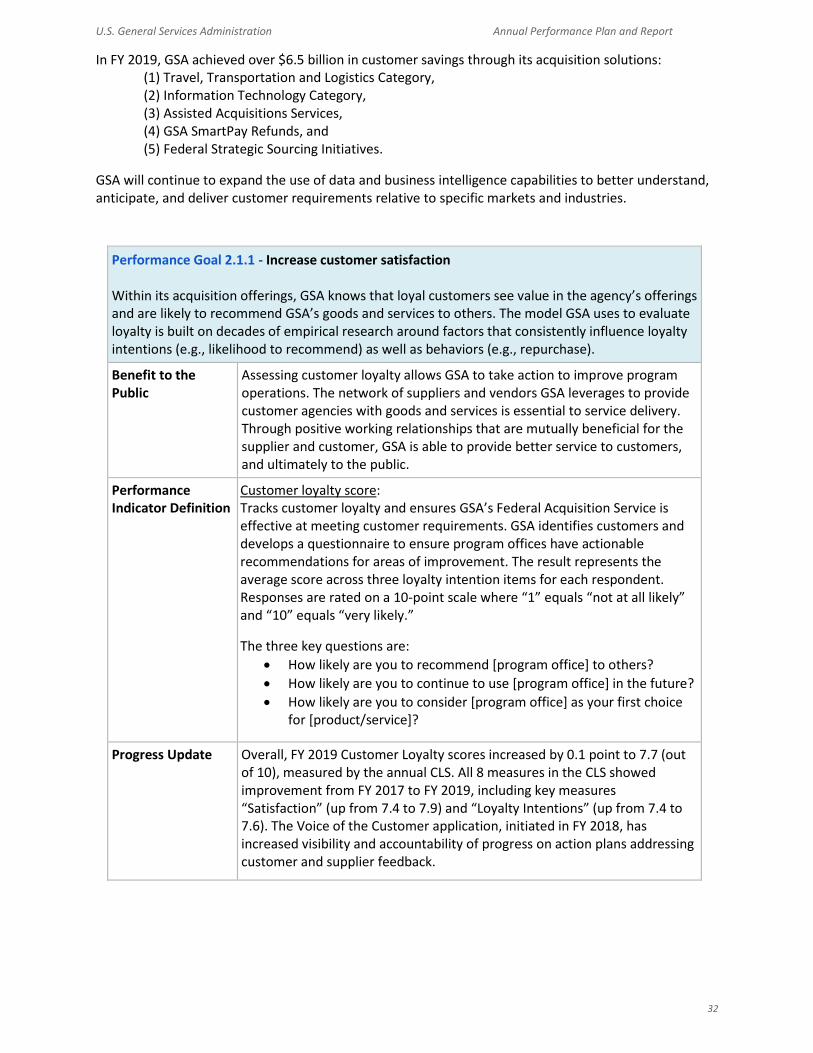
In FY 2019, GSA achieved over $6.5 billion in customer savings through its acquisition solutions: (1) Travel, Transportation and Logistics Category, (2) Information Technology Category, (3) Assisted Acquisitions Services, (4) GSA SmartPay Refunds, and (5) Federal Strategic Sourcing Initiatives.
GSA will continue to expand the use of data and business intelligence capabilities to better understand, anticipate, and deliver customer requirements relative to specific markets and industries.
Performance Goal 2.1.1 - Increase customer satisfaction Within its acquisition offerings, GSA knows that loyal customers see value in the agency’s offerings and are likely to recommend GSA’s goods and services to others. The model GSA uses to evaluate loyalty is built on decades of empirical research around factors that consistently influence loyalty intentions (e.g., likelihood to recommend) as well as behaviors (e.g., repurchase).
Benefit to the Public
Assessing customer loyalty allows GSA to take action to improve program operations. The network of suppliers and vendors GSA leverages to provide customer agencies with goods and services is essential to service delivery. Through positive working relationships that are mutually beneficial for the supplier and customer, GSA is able to provide better service to customers, and ultimately to the public.
Performance Indicator Definition
Customer loyalty score: Tracks customer loyalty and ensures GSA’s Federal Acquisition Service is effective at meeting customer requirements. GSA identifies customers and develops a questionnaire to ensure program offices have actionable recommendations for areas of improvement. The result represents the average score across three loyalty intention items for each respondent. Responses are rated on a 10-point scale where “1” equals “not at all likely” and “10” equals “very likely.”
The three key questions are:
How likely are you to recommend [program office] to others?
How likely are you to continue to use [program office] in the future?
How likely are you to consider [program office] as your first choice for [product/service]?
Progress Update Overall, FY 2019 Customer Loyalty scores increased by 0.1 point to 7.7 (out of 10), measured by the annual CLS. All 8 measures in the CLS showed improvement from FY 2017 to FY 2019, including key measures “Satisfaction” (up from 7.4 to 7.9) and “Loyalty Intentions” (up from 7.4 to 7.6). The Voice of the Customer application, initiated in FY 2018, has increased visibility and accountability of progress on action plans addressing customer and supplier feedback.
U.S. General Services Administration Annual Performance Plan and Report
33
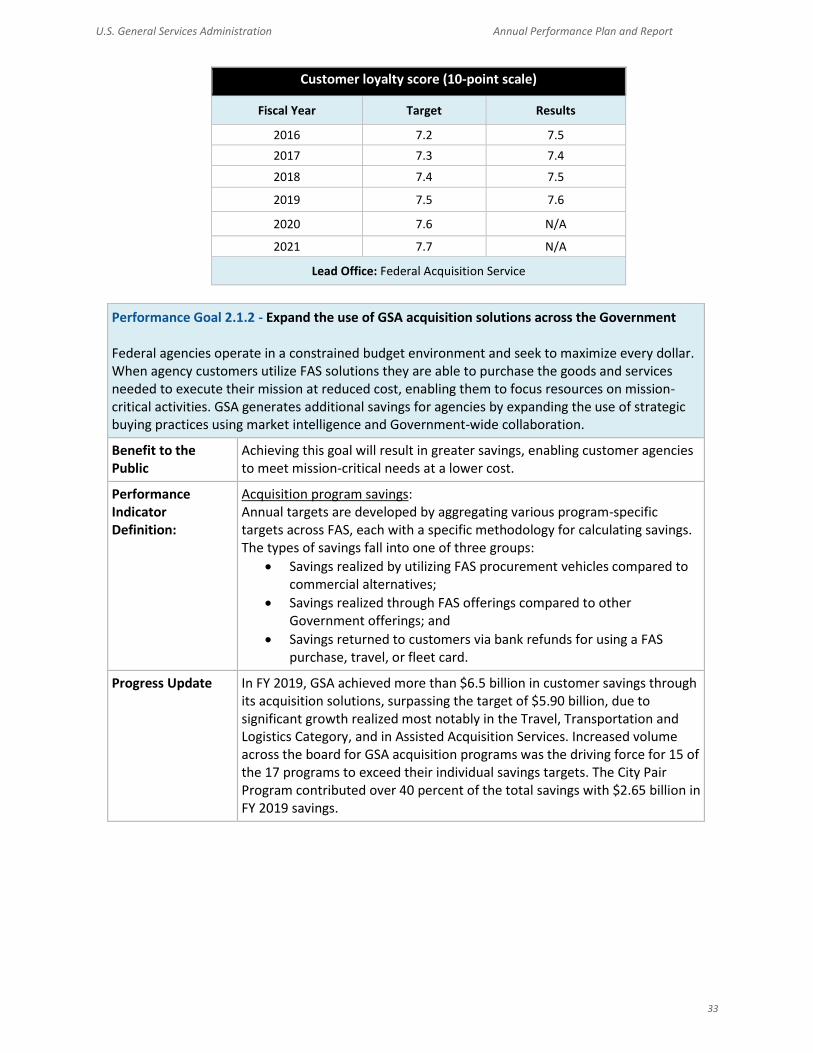
Customer loyalty score (10-point scale)
Fiscal Year Target Results
2016 7.2 7.5
2017 7.3 7.4
2018 7.4 7.5
2019 7.5 7.6
2020 7.6 N/A
2021 7.7 N/A
Lead Office: Federal Acquisition Service
Performance Goal 2.1.2 - Expand the use of GSA acquisition solutions across the Government
Federal agencies operate in a constrained budget environment and seek to maximize every dollar. When agency customers utilize FAS solutions they are able to purchase the goods and services needed to execute their mission at reduced cost, enabling them to focus resources on mission-critical activities. GSA generates additional savings for agencies by expanding the use of strategic buying practices using market intelligence and Government-wide collaboration.
Benefit to the Public
Achieving this goal will result in greater savings, enabling customer agencies to meet mission-critical needs at a lower cost.
Performance Indicator Definition:
Acquisition program savings: Annual targets are developed by aggregating various program-specific targets across FAS, each with a specific methodology for calculating savings. The types of savings fall into one of three groups:
Savings realized by utilizing FAS procurement vehicles compared to commercial alternatives;
Savings realized through FAS offerings compared to other Government offerings; and
Savings returned to customers via bank refunds for using a FAS purchase, travel, or fleet card.
Progress Update In FY 2019, GSA achieved more than $6.5 billion in customer savings through its acquisition solutions, surpassing the target of $5.90 billion, due to significant growth realized most notably in the Travel, Transportation and Logistics Category, and in Assisted Acquisition Services. Increased volume across the board for GSA acquisition programs was the driving force for 15 of the 17 programs to exceed their individual savings targets. The City Pair Program contributed over 40 percent of the total savings with $2.65 billion in FY 2019 savings.
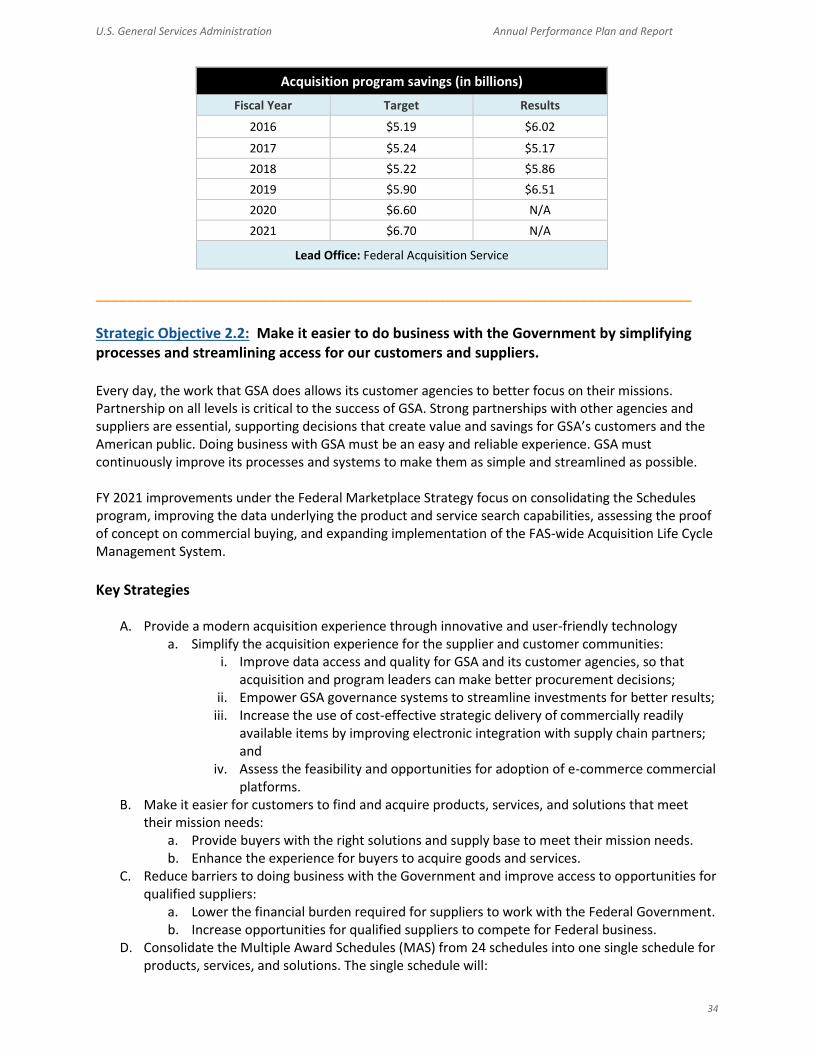
U.S. General Services Administration Annual Performance Plan and Report
34
Acquisition program savings (in billions)
Fiscal Year Target Results
2016 $5.19 $6.02
2017 $5.24 $5.17
2018 $5.22 $5.86
2019 $5.90 $6.51
2020 $6.60 N/A
2021 $6.70 N/A
Lead Office: Federal Acquisition Service
___________________________________________________________________________ Strategic Objective 2.2: Make it easier to do business with the Government by simplifying processes and streamlining access for our customers and suppliers. Every day, the work that GSA does allows its customer agencies to better focus on their missions. Partnership on all levels is critical to the success of GSA. Strong partnerships with other agencies and suppliers are essential, supporting decisions that create value and savings for GSA’s customers and the American public. Doing business with GSA must be an easy and reliable experience. GSA must continuously improve its processes and systems to make them as simple and streamlined as possible. FY 2021 improvements under the Federal Marketplace Strategy focus on consolidating the Schedules program, improving the data underlying the product and service search capabilities, assessing the proof of concept on commercial buying, and expanding implementation of the FAS-wide Acquisition Life Cycle Management System.
Key Strategies
A. Provide a modern acquisition experience through innovative and user-friendly technology
a. Simplify the acquisition experience for the supplier and customer communities: i. Improve data access and quality for GSA and its customer agencies, so that
acquisition and program leaders can make better procurement decisions; ii. Empower GSA governance systems to streamline investments for better results;
iii. Increase the use of cost-effective strategic delivery of commercially readily available items by improving electronic integration with supply chain partners; and
iv. Assess the feasibility and opportunities for adoption of e-commerce commercial platforms.
B. Make it easier for customers to find and acquire products, services, and solutions that meet their mission needs:
a. Provide buyers with the right solutions and supply base to meet their mission needs. b. Enhance the experience for buyers to acquire goods and services.
C. Reduce barriers to doing business with the Government and improve access to opportunities for qualified suppliers:
a. Lower the financial burden required for suppliers to work with the Federal Government. b. Increase opportunities for qualified suppliers to compete for Federal business.
D. Consolidate the Multiple Award Schedules (MAS) from 24 schedules into one single schedule for products, services, and solutions. The single schedule will:

U.S. General Services Administration Annual Performance Plan and Report
35
a. Use consistent terms and conditions that make it easier for industry to offer the goods and services that agencies buy. This in turn will foster better pricing and innovation for agencies to leverage.
b. Make it easier for agencies to find the goods and services they need to support their mission.
E. Promote Government-wide contracts.
Goal Leader Julie Dunne, Commissioner
Federal Acquisition Service
Contributing Programs ● FAS Systems Management
● GSA IT
● MAS Program Management Office (PMO)
● FAS Commissioner's Office
● Policy and Compliance
● Customer and Stakeholder Engagement
● Office of Enterprise Strategy Management
Strategic Objective 2.2 – FY 2019 Progress Update
The agency’s progress in making it easier to do business with the Government has been satisfactory, due to implementation of the Federal Marketplace Strategy (FMS). This FMS is designed to create a seamless, people-centric buying and selling experience. In support of FMS, GSA plans to consolidate the 24 schedules that comprise the MAS into a single schedule for products, services, and solutions by the end of FY 2020. A single schedule will provide consistent terms and conditions to simplify the procurement process for buyers (agencies) and sellers (industry). FMS initiatives also include the implementation of commercial e-commerce portals that will allow the Government to better track expenditures for open-market items outside of existing targets (estimated to be an addressable market of $6 billion); and simplifying catalog management to make it easy for suppliers to integrate their catalogs with GSA systems and processes.
The supplier satisfaction score decreased marginally to 3.65 out of a possible 5 in FY 2019, compared to 3.69 in FY 2018. GSA continues to identify ways to streamline processes, modernize technologies, improve supplier relationships, and incorporate viable best practices based on Supplier Relationship Management Survey results. GSA will continue to work with industry to ensure a strong pool of qualified vendors.
Performance Goal 2.2.1 - Increase supplier satisfaction
The network of suppliers that GSA leverages to provide products and services are critical to its success in meeting the day-to-day needs of customer agencies and providing complex, innovative, and customized solutions. Creating a mutually beneficial operating environment between the Government and the supplier community allows GSA to offer a diverse set of products and services to customer agencies at best value.
Benefit to the Public Strong supplier relationships make interactions between the Government and industry more efficient, transparent, and cost effective, creating lower-cost services that maximize taxpayer dollars. When Government and industry collaborate effectively, the highest-quality solutions can be delivered to meet customer agencies’ missions to the public.

U.S. General Services Administration Annual Performance Plan and Report
36
Performance Indicator Definition
Supplier satisfaction score: The Supplier Relationship Management Survey is distributed annually to roughly 20,000 vendors with contracts covering a diverse portfolio of GSA contract vehicles. The sources for the vendors are e-Library, FPDS-NG, and GSA’s Salesforce database.
Respondents are asked “Please consider all of your experiences interacting with [GSA program]. How satisfied are you?” Responses are rated on a 5-point scale where “1” equals “Very Dissatisfied” and “5” equals “Highly Satisfied.” The overall score represents the average of each portfolio’s average score.
Progress Update The supplier satisfaction score remained relatively constant at 3.65 out of 5 in FY 2019, compared to 3.69 in FY 2018. This decrease was not statistically significant. GSA continues to identify ways to streamline processes, modernize technologies, improve supplier relationships, and incorporate viable best practices based on Supplier Relationship Management Survey results. GSA will continue to work with industry to ensure a strong pool of qualified vendors.
The Voice of the Customer application, initiated in FY 2018, has proven to be a best practice, contributing to increased satisfaction scores with customers through increased visibility and accountability of progress on action plans addressing customer feedback. A similar process is being implemented in FY 2020 for supplier feedback gathered from the Supplier Relationship Management Survey.
Supplier satisfaction score (5-point scale)*
Fiscal Year Target Results
2016 N/A 3.70
2017 N/A 3.61
2018 3.80 3.69
2019 3.73 3.65
2020 3.70 N/A
2021 3.75 N/A
Lead Office: Federal Acquisition Service
*Metric methodology was revised in FY 2018. FY 2016 - FY 2019 results reflect the new methodology. FY 2019 target was based on the new methodology. The FY 2018 target was not recalculated and is based on the discontinued methodology.
Performance Goal 2.2.2 - Consolidate Multiple Award Schedules ⦿ FY 2020 - 2021 Agency Priority Goal As part of the GSA’s Federal Marketplace Strategy to make the Government buying and selling experience easy, efficient and modern, GSA will consolidate the 24 schedules into 1 single schedule for products, services, and solutions by the end of FY 2020 for more than 12,000 vendors. The single schedule will have consistent terms and conditions that provide the opportunity for industry to come to market the way the agencies buy.

U.S. General Services Administration Annual Performance Plan and Report
37
Benefit to the Public
Using a single schedule with consistent terms makes it easier for suppliers to do business with the Government and makes it easier for agencies (buyers) to navigate the MAS program to find and acquire goods and services.
Performance Indicator Definitions
Percent of vendors transitioned to new consolidated Multiple Award Schedule ⦿ FY 2020 - 2021 Agency Priority Goal: Measured by the percentage of existing vendors that accept the mass modification on the new schedule. Multiple Award Schedule Sales ⦿ FY 2020 - 2021 Agency Priority Goal: Measured by increase in business volume.
Progress Update GSA’s 24 Multiple Award Schedules were consolidated into a single award vehicle, completing Phase I of efforts to modernize and simplify the way GSA provides solutions to customers. The single MAS vehicle is organized in a more logical format with consistent and streamlined terms and conditions and a more logical category structure similar to the Government-wide category management structure.
Percent of vendors transitioned to new consolidated Multiple Award Schedule
⦿ FY 2020 - 2021 Agency Priority Goal
Fiscal Year Target Results
2019 N/A N/A
2020 50% TBD
2021 100% TBD
Lead Office: Federal Acquisition Service
Multiple Award Schedule Sales (in billions) ⦿ FY 2020 - 2021 Agency Priority Goal
Fiscal Year Target Results
2019 N/A N/A
2020 $32.3 TBD
2021 $32.5 TBD
Lead Office: Federal Acquisition Service
______________________________________________________________________________
Strategic Objective 2.3: Enhance customer agency access to qualified small and socio-economic businesses. GSA will collaborate with the acquisition workforce and GSA leadership on Federal acquisition requirements and best practices to promote opportunities for small and socio-economic small businesses. This encompasses all small businesses, including small disadvantaged businesses, women-owned small businesses, service-disabled veteran-owned small businesses, and businesses located in Historically Underutilized Business Zones. GSA ensures that small business and socio-economic small business participation is maximized in Federal procurement, which encourages the achievement of GSA’s prime and subcontracting goals. GSA’s Office
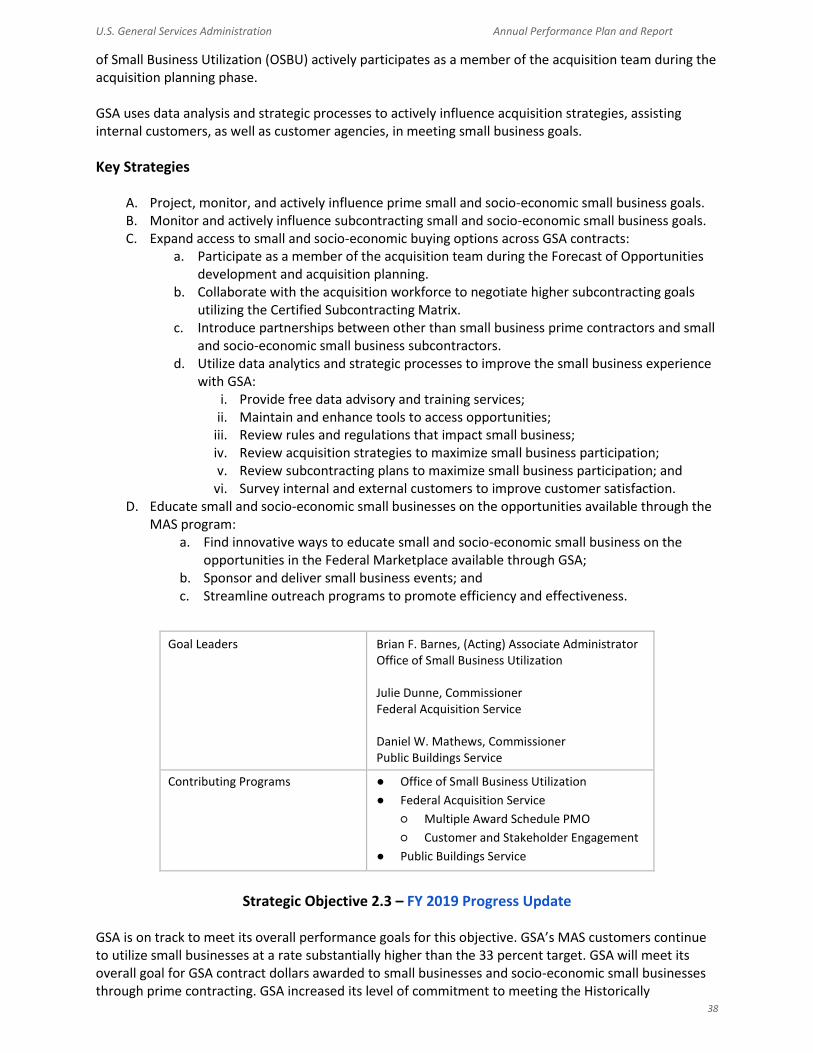
U.S. General Services Administration Annual Performance Plan and Report
38
of Small Business Utilization (OSBU) actively participates as a member of the acquisition team during the acquisition planning phase. GSA uses data analysis and strategic processes to actively influence acquisition strategies, assisting internal customers, as well as customer agencies, in meeting small business goals.
Key Strategies
A. Project, monitor, and actively influence prime small and socio-economic small business goals. B. Monitor and actively influence subcontracting small and socio-economic small business goals. C. Expand access to small and socio-economic buying options across GSA contracts:
a. Participate as a member of the acquisition team during the Forecast of Opportunities development and acquisition planning.
b. Collaborate with the acquisition workforce to negotiate higher subcontracting goals utilizing the Certified Subcontracting Matrix.
c. Introduce partnerships between other than small business prime contractors and small and socio-economic small business subcontractors.
d. Utilize data analytics and strategic processes to improve the small business experience with GSA:
i. Provide free data advisory and training services; ii. Maintain and enhance tools to access opportunities;
iii. Review rules and regulations that impact small business; iv. Review acquisition strategies to maximize small business participation; v. Review subcontracting plans to maximize small business participation; and
vi. Survey internal and external customers to improve customer satisfaction. D. Educate small and socio-economic small businesses on the opportunities available through the
MAS program: a. Find innovative ways to educate small and socio-economic small business on the
opportunities in the Federal Marketplace available through GSA; b. Sponsor and deliver small business events; and c. Streamline outreach programs to promote efficiency and effectiveness.
Goal Leaders Brian F. Barnes, (Acting) Associate Administrator Office of Small Business Utilization Julie Dunne, Commissioner Federal Acquisition Service Daniel W. Mathews, Commissioner Public Buildings Service
Contributing Programs ● Office of Small Business Utilization
● Federal Acquisition Service
○ Multiple Award Schedule PMO
○ Customer and Stakeholder Engagement
● Public Buildings Service
Strategic Objective 2.3 – FY 2019 Progress Update
GSA is on track to meet its overall performance goals for this objective. GSA’s MAS customers continue to utilize small businesses at a rate substantially higher than the 33 percent target. GSA will meet its overall goal for GSA contract dollars awarded to small businesses and socio-economic small businesses through prime contracting. GSA increased its level of commitment to meeting the Historically

U.S. General Services Administration Annual Performance Plan and Report
39
Underutilized Business Zones (HUBZone) and Women-Owned Small Business (WOSB) goals. Through senior leadership to front line communications, data analysis and tracking, in-depth review of acquisition strategies, and training, GSA has been successful in meeting the HUBZone and WOSB goals.
Performance Goal 2.3.1 - Create more opportunities for small and socio-economic businesses
By increasing access to small and socio-economic businesses for GSA contract requirements and GSA-managed Government-wide acquisition vehicles, GSA spurs job growth and drives the economy forward.
Benefit to the Public
Small businesses power the economy and contracting with them is a win-win for the Government and the small business community. The Government receives great service at a great value, while small businesses are provided opportunities to grow and create jobs. GSA offers opportunities to small businesses and socio-economic small businesses across the country through contract vehicles, contracts GSA awards for other agencies, and subcontracting opportunities.
Performance Indicator Definition
(a) Percent of GSA contract dollars awarded to small business through prime contracting: Tracks the percent of dollars awarded from GSA contracts to small business through prime contracting. GSA measures the overall percentage of eligible procurement dollars awarded to small business for prime contracting.
(b) Percent of GSA contract dollars awarded through prime contracting to each socio-economic small business category (SDB / WOSB / SDVOSB / HUBZone): Tracks the percent of dollars awarded from GSA prime contracting by measuring the overall percentage of eligible procurement dollars awarded to each socio-economic category: ● Small Disadvantaged Business (SDB), ● Women-Owned Small Business (WOSB), ● Service-Disabled Veteran Owned Small Business (SDVOSB), and ● Historically Underutilized Business Zone (HUBZone) contracting, respectively.
(c) Percent of GSA contract dollars awarded to small business through subcontracting: Tracks the percent of GSA prime contract dollars awarded to small business through subcontracting. Subcontracting results also exclude mandatory sources, contracts not governed by the Federal Acquisition Regulation, and product service codes for leasing.
(d) Percent of GSA contract dollars awarded through subcontracting to each socio-
economic small business category (SDB / WOSB / SDVOSB / HUBZone): Tracks the percent of GSA prime contract dollars awarded through subcontracting by measuring the overall percentage of eligible procurement dollars awarded to each socio-economic category: ● SDB, ● WOSB, ● SDVOSB, and ● HUBZone subcontracting, respectively.
(e) Agency peer review score of Small Business Act compliance (U.S. Small Business
Administration (SBA) scorecard composite score): Represents the achieved score for compliance with section 15(k) of the Small

U.S. General Services Administration Annual Performance Plan and Report
40
Business Act. The scoring is weighted as 20 percent of the overall agency scorecard score, and is based on an annual peer review conducted across agencies in accordance with SBA’s standards. Twenty percent on the peer review represents a perfect score on SBA’s Small Business Scorecard. The result represents GSA’s achievement in relation to the 20 percent target. Agencies can achieve scores above the target level if they show extraordinary performance.
(f) Small business diversification across industries (SBA scorecard composite score):
Measures the diversification of small business contractors in each of the 5 small business categories within GSA’s top 100 North American Industry Classification System (NAICS) codes. Scoring is based on SBA’s annual methodology, encompassing 10 percent of the overall agency score. The result represents GSA’s achievement in relation to the 10 percent goal. Agencies can achieve scores above the target level if they show extraordinary performance.
(g) Percent of Multiple Award Schedule (MAS) business volume from small
businesses: Reports the percentage of MAS business volume attributed to small businesses each year by calculating the GSA Multiple Award Schedule total business volume in dollars attributed to small businesses and dividing by the total business volume.
Progress
Update
Final FY 2019 results for the small business performance indicators will be reported by SBA in Spring 2020. Based on preliminary results, GSA will meet the performance target for prime contracting dollars awarded to small business and socio-economic small business. The MAS program is one of many methods GSA provides small and disadvantaged businesses access to the Federal Marketplace. In FY 2019, 38.8 percent of the business conducted through MAS was awarded to small and disadvantaged businesses, exceeding the target of 33 percent.
(a) Percent of GSA contract dollars awarded to small business through prime contracting
Fiscal Year Target* Results
2016 36.5% 39.23%
2017 36.5% 42.68%
2018 35.0% 38.82%
2019 30.0% 43.03%**
2020 29.0% N/A
2021 TBD N/A
Lead Office: Office of Small Business Utilization
* Targets reflect goals established by SBA for fiscal year performance. **Preliminary results, final results will be provided by SBA in spring 2020

U.S. General Services Administration Annual Performance Plan and Report
41
(b) Percent of GSA contract dollars awarded through prime contracting to each socio-economic small business category (SDB / WOSB / SDVOSB / HUBZone)
Fiscal Year Targets* Results
2016
SDB 5% WOSB 5% SDVOSB 3% HUBZone 3%
SDB 21.64% WOSB 9.31% SDVOSB 5.32% HUBZone 3.89%
2017
SDB 22.60% WOSB 8.85% SDVOSB 6.45% HUBZone 4.95%
2018
SDB 19.94% WOSB 8.55% SDVOSB 5.63% HUBZone 3.98%
2019
SDB 19.93%** WOSB 10.39%** SDVOSB 4.98%** HUBZone 4.05%**
2020 TBD
2021 TBD
Lead Office: Office of Small Business Utilization
* Targets reflect statutory requirements for fiscal year performance. **Preliminary results, final results will be provided by SBA in spring 2020
(c) Percent of GSA contract dollars awarded to small business through subcontracting
Fiscal Year Targets* Results
2016 29.0% 26.3%
2017 29.0% 42.4%
2018 29.0% 24.1%
2019 25.5% TBD**
2020 24.0% N/A
2021 TBD N/A
Lead Office: Office of Small Business Utilization
* Targets reflect goals established by SBA for fiscal year performance. ** Results to be provided by SBA in 2020.

U.S. General Services Administration Annual Performance Plan and Report
42
(d) Percent of GSA contract dollars awarded through subcontracting to each socio-economic small business category (SDB / WOSB / SDVOSB / HUBZone)
Fiscal Year Targets* Results
2016
SDB 5% WOSB 5% SDVOSB 3% HUBZone 3%
SDB 7.60% WOSB 5.90% SDVOSB 0.70% HUBZone 0.40%
2017 SDB 5.30% WOSB 6.20% SDVOSB 1.90% HUBZone 1.30%
2018 SDB 5.50% WOSB 4.40% SDVOSB 1.62% HUBZone 0.94%
2019 TBD**
2020 TBD
2021 TBD
Lead Office: Office of Small Business Utilization
* Targets reflect statutory requirements for fiscal year performance. ** Results to be provided by SBA in Spring 2020.
(e) Agency peer review score of Small Business Act compliance (SBA scorecard composite score)
Fiscal Year Target Results
2017 20% 19.87%
2018 20% 20.5%
2019 20% TBD**
2020 20% TBD
2021 TBD* TBD
Lead Office: Office of Small Business Utilization
* Targets are set by SBA.
** Results to be provided by SBA in Spring 2020.
(f) Small business diversification across industries (SBA scorecard composite score)
Fiscal Year Target Results
2017 10% 10.6%
2018 10% 11.8%
2019 10% TBD**
2020 10% TBD
2021 TBD* TBD
Lead Office: Office of Small Business Utilization
* Targets are set by SBA.
** Results to be provided by SBA in Spring 2020.

U.S. General Services Administration Annual Performance Plan and Report
43
(g) Percent of Multiple Award Schedule (MAS)
business volume from small businesses
Fiscal Year Target Results
2016 33.0% 37.4%
2017 33.0% 39.7%
2018 33.0% 38.4%
2019 33.0% 38.8%
2020 33.0% TBD
2021 33.0% TBD
Lead Office: Federal Acquisition Service
_____________________________________________________________________________________
STRATEGIC GOAL 3
Improve the way Federal agencies buy, build, and use technology.
Technology is critical to how every agency accomplishes its mission and serves the public. It is at the core of running mission-support operations, safeguarding critical information, and analyzing program data for agency decision making. However, the Federal Government continues to struggle with legacy IT systems, IT modernization hurdles, and procurement challenges, as well as keeping pace with the public’s expectations for digital services. The Administration has seen these weaknesses as growth opportunities by establishing multiple Cross Agency Priority (CAP) goals focused on IT modernization, as outlined in the President’s Management Agenda: Modernizing Government for the 21st Century (PMA). The challenge of supporting, managing, and securing legacy systems significantly hinders the ability of Federal agencies to meet current and evolving mission requirements. GSA is supporting the PMA by leading modernization initiatives across the Government that provide agencies with modern IT solutions and advisory services that can transform business operations, reduce costs, improve agility, and increase security. An overarching goal of these initiatives is to shift more Federal IT spending from operations and maintenance of legacy systems to investment in modern platforms. The Federal IT procurement process includes requirements development and acquisition practices that can be burdensome and time consuming. GSA is helping agencies adopt new approaches for buying commercial off-the-shelf and as-a-service solutions. GSA is leading the development of modular contracting approaches to enable agile and efficient development of complex new requirements. GSA’s goal is to assist agencies through the entire life cycle of procurement and system development. Keeping up with the public’s expectations for high-quality digital services has been challenging for the Government. The technology challenges facing Federal agencies and the direct effect on the public are well known by leaders across Government and the private sector, leading to a heightened focus area for improvement by the Administration. GSA is supporting the PMA goal to improve the customer experience by providing Federal agencies with technologies and professional services that make customer interactions with public services simple, fast, and secure. In FY 2017, the Administration created the Office of American Innovation and the American Technology Council to focus attention and resources on this challenge. Today and in the future, GSA will be an essential partner with the Administration to deliver innovative solutions through IT Centers of Excellence (CoEs), administration of the Technology Modernization Fund (TMF), IT Category products

U.S. General Services Administration Annual Performance Plan and Report
44
and services, and Technology Business Management (TBM) program management services. GSA’s mix of talent and expertise in acquisition, technology, and service delivery — combined with the agency’s Government-wide scope and scale — makes us an agent of transformation in how Federal agencies buy, build, and use technology.
_____________________________________________________________________________ Strategic Objective 3.1: Lead Government-wide technology modernization initiatives.
The Report to the President on Federal IT Modernization (2017) and the PMA tasks agencies with achieving an array of critical goals involving enhanced IT security, greater use of cloud-based services, and the overall consolidation and modernization of IT networks. GSA is well positioned to help agencies meet these goals. GSA offers the full spectrum of technology assistance, including experts who assess system design, apply user-centered research and design techniques common in the private sector, and ensure fit with agency needs. GSA also offers platforms, services, and vehicles to assist agencies in acquiring and utilizing modern IT tools and practices. These include supporting agency transitions to cloud-based services; authentication and authorization services that seamlessly integrate with an agency’s public-facing systems; IT infrastructure modernization; cost-efficient and well-designed tools to communicate digitally with the public; and reducing reliance on legacy IT through administration of the TMF. These partnerships with industry and customer agencies foster trust and confidence in the goal of delivering modern and essential Government services.
Key Strategies
A. Enable the provision of mature solutions to migrate agency systems to the cloud: a. Work across multiple programs to help agencies move to the cloud in the least
disruptive way. This includes: i. Issuing authorizations for cloud systems that are secure and continuously
monitored; ii. Making cloud systems available and easy to purchase; and
iii. Offering GSA technology talent to plan and implement cloud migrations that are efficient and cost-effective.
B. Improve public access to Federal Government services through secure accounts and user-friendly tools:
a. Offer the public secure and private online access to participating Government programs, with the goal of making Federal benefits, services, and applications easier to access and more secure;
b. Increase the cybersecurity of Federal IT systems hosting the public’s personally identifiable information; and
c. Improve the security position of the Government by decreasing insider threats. C. Help agency partners modernize IT infrastructure and improve digital interactions:
a. Ensure highly skilled technologists are available to help agencies think through complex business problems and develop appropriate technical designs;
b. Assist with deploying technology solutions through CoEs by leveraging private sector innovation and existing Government services to increase cloud adoption, consolidate data centers, optimize call centers, drive performance improvement, and improve customer experience; and
c. Monitor customer satisfaction with innovation, technology consulting engagements, and acquisitions through 18F, the Presidential Innovation Fellows, Schedule 70 contracts, Government-wide Acquisition Contracts (GWAC), and the Enterprise Infrastructure Solutions (EIS) program.
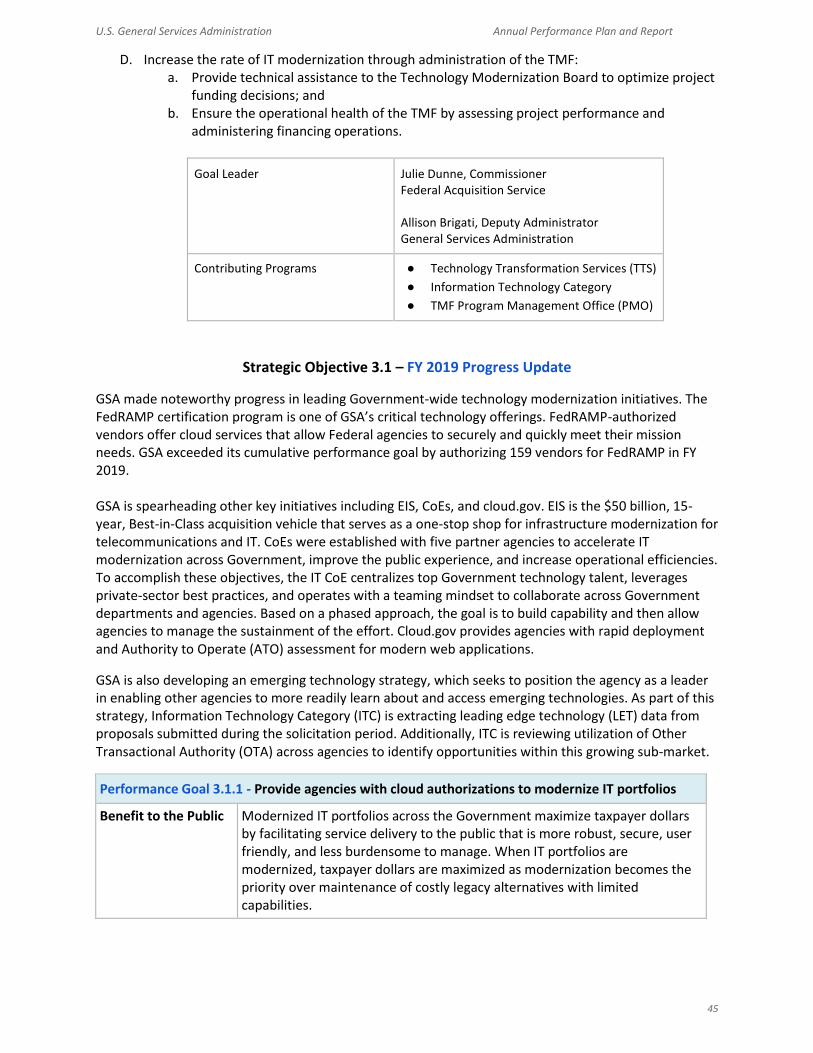
U.S. General Services Administration Annual Performance Plan and Report
45
D. Increase the rate of IT modernization through administration of the TMF: a. Provide technical assistance to the Technology Modernization Board to optimize project
funding decisions; and b. Ensure the operational health of the TMF by assessing project performance and
administering financing operations.
Goal Leader Julie Dunne, Commissioner Federal Acquisition Service Allison Brigati, Deputy Administrator General Services Administration
Contributing Programs ● Technology Transformation Services (TTS)
● Information Technology Category
● TMF Program Management Office (PMO)
Strategic Objective 3.1 – FY 2019 Progress Update
GSA made noteworthy progress in leading Government-wide technology modernization initiatives. The FedRAMP certification program is one of GSA’s critical technology offerings. FedRAMP-authorized vendors offer cloud services that allow Federal agencies to securely and quickly meet their mission needs. GSA exceeded its cumulative performance goal by authorizing 159 vendors for FedRAMP in FY 2019. GSA is spearheading other key initiatives including EIS, CoEs, and cloud.gov. EIS is the $50 billion, 15-year, Best-in-Class acquisition vehicle that serves as a one-stop shop for infrastructure modernization for telecommunications and IT. CoEs were established with five partner agencies to accelerate IT modernization across Government, improve the public experience, and increase operational efficiencies. To accomplish these objectives, the IT CoE centralizes top Government technology talent, leverages private-sector best practices, and operates with a teaming mindset to collaborate across Government departments and agencies. Based on a phased approach, the goal is to build capability and then allow agencies to manage the sustainment of the effort. Cloud.gov provides agencies with rapid deployment and Authority to Operate (ATO) assessment for modern web applications.
GSA is also developing an emerging technology strategy, which seeks to position the agency as a leader in enabling other agencies to more readily learn about and access emerging technologies. As part of this strategy, Information Technology Category (ITC) is extracting leading edge technology (LET) data from proposals submitted during the solicitation period. Additionally, ITC is reviewing utilization of Other Transactional Authority (OTA) across agencies to identify opportunities within this growing sub-market.
Performance Goal 3.1.1 - Provide agencies with cloud authorizations to modernize IT portfolios
Benefit to the Public Modernized IT portfolios across the Government maximize taxpayer dollars by facilitating service delivery to the public that is more robust, secure, user friendly, and less burdensome to manage. When IT portfolios are modernized, taxpayer dollars are maximized as modernization becomes the priority over maintenance of costly legacy alternatives with limited capabilities.

U.S. General Services Administration Annual Performance Plan and Report
46
Performance Indicator Definition
Number of customer agency systems with FedRAMP authorizations (cumulative) Measures the efficiency and effectiveness of the FedRAMP program to balance security and speed of operationalizing cloud solutions for agency use. The indicator captures the cumulative volume of authorizations that are processed through the FedRAMP program.
Progress Update FedRAMP ended FY 2019 with 159 cloud service offerings (CSOs) with vendor authorizations surpassing the target of 145. FedRAMP has active interest from other sectors (State and Local governments, energy, and banking) to leverage FedRAMP standards and authorizations to increase the value proposition for vendors participating in the program. Based on the FY 2019 results, outyear targets were revised upwards.
Number of customer agency systems with FedRAMP authorizations (cumulative)
Fiscal Year Target Results
2016 N/A 72
2017 N/A 88
2018 110 121
2019 145 159
2020 183 N/A
2021 210 N/A
Lead Office: Federal Acquisition Service
Performance Goal 3.1.2 - Expand agencies’ use of GSA technology solutions
Benefit to the Public The proposed modernization metric identifies the degree to which ITC vehicles are meeting agency mission needs for best value contracts to support major IT modernization initiatives, and is reflective of GSA’s role in improving the way Federal agencies buy, build, and use technology.
Performance Indicator Definition
Percent of Major IT Project spend with GSA involvement: Use of GSA IT Category contract vehicles to support modernization efforts when compared to total dollars used to support modernization. Major IT Spend as identified in the ITdashboard.gov is being used as a proxy for IT Modernization. “GSA Major IT Spend” includes all spend associated with a major IT project when a GSA contract was used for any portion of that contract.
Progress Update Total Major IT spend increased Government-wide over the last several years and the percent of spend where GSA is involved in those projects has also increased. GSA aims to continue this trend through continued enhancement and utilization of GSA IT Category acquisition solutions.

U.S. General Services Administration Annual Performance Plan and Report
47
Percent of Major IT Project spend with GSA involvement
Fiscal Year Target Results
2017 N/A TBD
2018 N/A 22%
2019 N/A 23%
2020 24% N/A
2021 25% N/A
Lead Office: Federal Acquisition Service
___________________________________________________________________________ Strategic Objective 3.2: Drive more efficient and innovative Government procurement of technology services.
The United States is a global leader in software and technology. Government must harness this national prowess in technology to not only drive economic growth, but to also improve internal business practices and better serve the public. The acquisition process is a key success factor in Government technology practices.
The Government Accountability Office (GAO) and industry leaders have repeatedly recommended that Government “buy more and develop less” to improve technology outcomes. This requires Government to expand the training and use of IT acquisition cadres as outlined in the Federal Information Technology Acquisition Reform Act and remove barriers to agile acquisition of new technologies. GSA is committed to developing and sharing the talent, best practices, and policy improvements needed to bring about these changes.
Multiple components of GSA play a role in driving this strategic objective. GSA’s staff is identifying and incorporating best practices in technology acquisition and offering hands-on assistance to agencies at every stage of the process, including research and scoping, user research and prototype development, solicitation drafting and technical evaluation, post-award support, and technical assistance during implementation. The skills and knowledge developed in the organization will be intentionally shared and disseminated across the Federal workforce to improve overall management of IT acquisition and operations.
Key Strategies
A. Provide agencies with the ability to seamlessly acquire and manage compliant software, systems, and infrastructure at best value:
a. Make buying and managing commercial off-the-shelf software-as-a-service easier for agencies by improving existing sales channels such as Schedule 70 multiple award contracts;
b. Further develop and improve Schedule 70 multiple award contracts to provide Federal, State, and local customer agencies the tools and expertise needed to shorten procurement cycles, ensure compliance, and obtain the best value for innovative technology products, services, and solutions, including buying and managing commercial off-the-shelf software-as-a service; and
c. Efficiently and effectively transition agency telecommunications and IT infrastructure to the EIS contract. Using the EIS contract creates a simplified process for agencies to

U.S. General Services Administration Annual Performance Plan and Report
48
acquire integrated and streamlined solutions while taking advantage of cost reductions through aggregated Government-wide demand.
B. Assist agency customers in successfully executing a modular contracting approach to enable agile and efficient development of new complex requirements:
a. Use GSA’s leadership in technology and acquisition to work with agencies to introduce agile development methods into technology procurements, build the necessary skills to solicit and manage technology projects with agile suppliers, and, if needed, guide agency leads through the duration of the project; and
b. Continue to procure high-quality, lower-risk products at best value.
Goal Leader Julie Dunne, Commissioner Federal Acquisition Service
Contributing Programs ● ITC ● TTS ● Assisted Acquisition Services (AAS)
Strategic Objective 3.2 – FY 2019 Progress Update
GSA made significant progress driving efficient and innovative Government procurement for technology services in FY 2019, realizing $5.79 billion in assisted technology acquisitions. This was short of the target as even though overall demand for assisted acquisitions increased 30% over FY 2018, a significant proportion of spending shifted from the IT category to professional services. GSA continues to work with agencies to transition their telecommunications and information technology infrastructure to the new Enterprise Infrastructure Solutions (EIS) contract. EIS allows participating agencies to meet IT Modernization objectives through services and solutions such as carrier Ethernet, Voice over Internet Protocol (VoIP), unified communications, cloud services and software-defined networking, and Internet Protocol version 6 (IPv6). Additionally, GSA launched the Cloud Information Center to support expanding agency use of cloud solutions and to provide agencies with acquisition guidance, templates, and policy documents to simplify procurement of cloud products and services. Through FY 2019:
● Five EIS contractors received ATO and agencies now have the ability to provide fair opportunities to be considered for award and award task orders.
● 11 of the top 20 agencies signed a memorandum of understanding (MOU), committing to award their task orders by September 30, 2019.
● 79 agency solicitations passed scope review, one is currently under scope review, 32 have been released to industry, and 9 task orders have been awarded.
Significant transition efforts are targeting the following milestones:
● March 31, 2020: GSA limits use of extended contracts for task orders not awarded. ● March 31, 2022: 90 percent of agencies’ telecom inventory must be off expiring contracts. ● May 31, 2023: Current contracts expire.

U.S. General Services Administration Annual Performance Plan and Report
49
Performance Goal 3.2.1 - Improve agency technology procurement capabilities through acquisition consulting
GSA provides value to agencies through assisted acquisition solutions that address the full life cycle of complex IT build and delivery. This includes acquisition consulting services to agencies to augment their support staff and obtain high-quality procurement and vendor management. This goal measures GSA’s ability to be a go-to partner for complex technology procurements across the Government.
Benefit to the Public GSA works with agencies to ensure IT systems have the best possible system design and user-centered development techniques. GSA collaborates with agency IT staff, business programs, and acquisition shops to ensure exceptional financial, contracting, and legal counsel for its acquisitions. Taking these steps reduces risk and provides best value solutions to agency customers and the taxpayers. The GSA Centers of Excellence (CoE) were established to accelerate IT modernization across Government to improve the public experience and increase operational efficiency. To accomplish these objectives, the CoEs centralize top Government tech talent, leverage private-sector best practices, and operate with a teaming mindset to collaborate across Government departments and agencies.
Performance Indicator Definition
(a) Volume of assisted technology acquisitions (dollar value) (discontinued in FY 2020): Annual dollar volume of assisted acquisitions for the Assisted Acquisition Services program and TTS/Assisted Technology Acquisitions program. Dollar volume is the ceiling amount for new awards. (b) Volume of assisted technology acquisitions (number of acquisitions) (discontinued in FY 2020): Annual number of assisted acquisitions for the Assisted Acquisition Service program and TTS/Assisted Technology Acquisitions program.
(c) Centers of Excellence (number of Interagency Agreements (IAAs) signed) (cumulative): Cumulative number of agencies who have engaged GSA to stand up at least one CoE. (d) Centers of Excellence (cumulative): Cumulative number of individual CoEs stood up across the Government.
Progress Update The CoE program accelerates the modernization of IT applications and infrastructure across the Federal Government. In FY 2019, TTS expanded the CoE program from two agencies to five. The newest CoE partner is the U.S. Department of Defense’s (DoD) Joint Artificial Intelligence Center, which will leverage GSA’s CoE expertise to strategically implement artificial intelligence within DoD.

U.S. General Services Administration Annual Performance Plan and Report
50
(a) Volume of assisted technology acquisitions (in billions) (discontinued in FY 2020)
Fiscal Year Target Results
2016 N/A $1.54
2017 N/A $3.68
2018 $4.29 $7.47
2019 $7.61 $5.79
Lead Office: Federal Acquisition Service
(b) Volume of assisted technology acquisitions (number of acquisitions) (discontinued in FY 2020)
Fiscal Year Target Results
2016 N/A 333
2017 N/A 422
2018 503 354
2019 364 269
Lead Office: Federal Acquisition Service
(c) Centers of Excellence (number of IAAs signed, cumulative)
Fiscal Year Target Results
2018 N/A 2
2019 N/A 5
2020 7 N/A
2021 10 N/A
Lead Office: Federal Acquisition Service
(d) Centers of Excellence (cumulative)
Fiscal Year Target Results
2018 N/A 5
2019 N/A 14
2020 19 N/A
2021 26 N/A
Lead Office: Federal Acquisition Service
___________________________________________________________________________
Strategic Objective 3.3: Lead implementation of technical standards, policies, and strategies. Modernizing Government IT will require the Federal Government to rethink how it builds and implements technical standards, policies, and strategies. Federal agencies, the private sector, and other stakeholders need to be actively involved throughout the entire policy development life cycle, to ensure the best outcomes.

U.S. General Services Administration Annual Performance Plan and Report
51
GSA’s core principles:
● Be a trusted Government partner — Align GSA’s mission with that of the agency’s Government clients, to continuously improve the effectiveness of Federal IT;
● Craft long-term solutions — Foster a culture and history of finding smart IT solutions for complex and challenging cross-agency issues;
● Leverage Federal scale — Maximize the purchasing and processing power of the Federal Government to enable faster, cost-effective adoption of new technologies; and
● Champion the CIO — Work with agency CIOs to understand, support, and address their most challenging issues.
GSA supports CIOs, IT procurement personnel, and other decision makers with services, expertise, and solutions to address a broad spectrum of Federal IT challenges. GSA also serves as the hub for Government-wide communities of practice, supporting cross-agency collaboration to solve the Government’s most pressing IT challenges. These strategies improve the Federal IT ecosystem, create efficiencies, and reduce burden across Government.
Key Strategies
A. Assist agencies in understanding and optimizing the value of IT investments, and enable value-driven conversations among agency IT, financial, and business leaders.
B. Support agencies’ implementation of strong network authentication for employees and contractors to ensure the right individual can access the right resource at the right time for the right reason.
C. Support agencies’ implementations of cost-effective and efficient IT infrastructure solutions by providing guidance on technology advancements, innovation, cybersecurity, acquisition, and best practices, including data center optimization and cloud computing.
D. Serve as the Federal Government’s principal coordinator for IT accessibility to help Federal agencies adopt universal design principles, and make IT products and services accessible to all.
E. Serve as the data center Shared Services Managing Partner, the Managing Partner of the Federal Government’s Data Center Line of Business (LoB), as well as the Data Center and Cloud Optimization Initiative Program Management Office (DCCOI PMO).
F. Support the Government’s web presence with trusted internet transactions, and monitor and report on policy compliance and best practices for Federal websites and digital services.
Goal Leader
Jessica Salmoiraghi, Associate Administrator
Office of Government-wide Policy
Contributing Program Office of Information Integrity and Access
Strategic Objective 3.3 – FY 2019 Progress Update GSA met and exceeded both performance goals under this objective by providing agencies with information, guidance, and tools that facilitate successful implementation of Federal policies on IT optimization. Agencies continue to identify data centers to close and means to modernize IT infrastructure with technical assistance from GSA’s DCCOI PMO. Success in this area was further enhanced with modification of Department of Homeland Security (DHS) Continuous Diagnostics, Mitigation, and Dynamic and Evolving Federal Enterprise Network Defense (DEFEND) services to include advanced Identity, Credential, and Access Management (ICAM) capabilities for agencies. GSA adjusted the performance metrics of Strategic Objective 3.3 by closing out FY 2019 objectives, and moving into FY 2020 and beyond to align with evolved guidance in OMB Directive M-19-19 (Update to the Data Center Optimization Initiative (DCOI)) and M-19-17 (Enabling Mission Delivery through
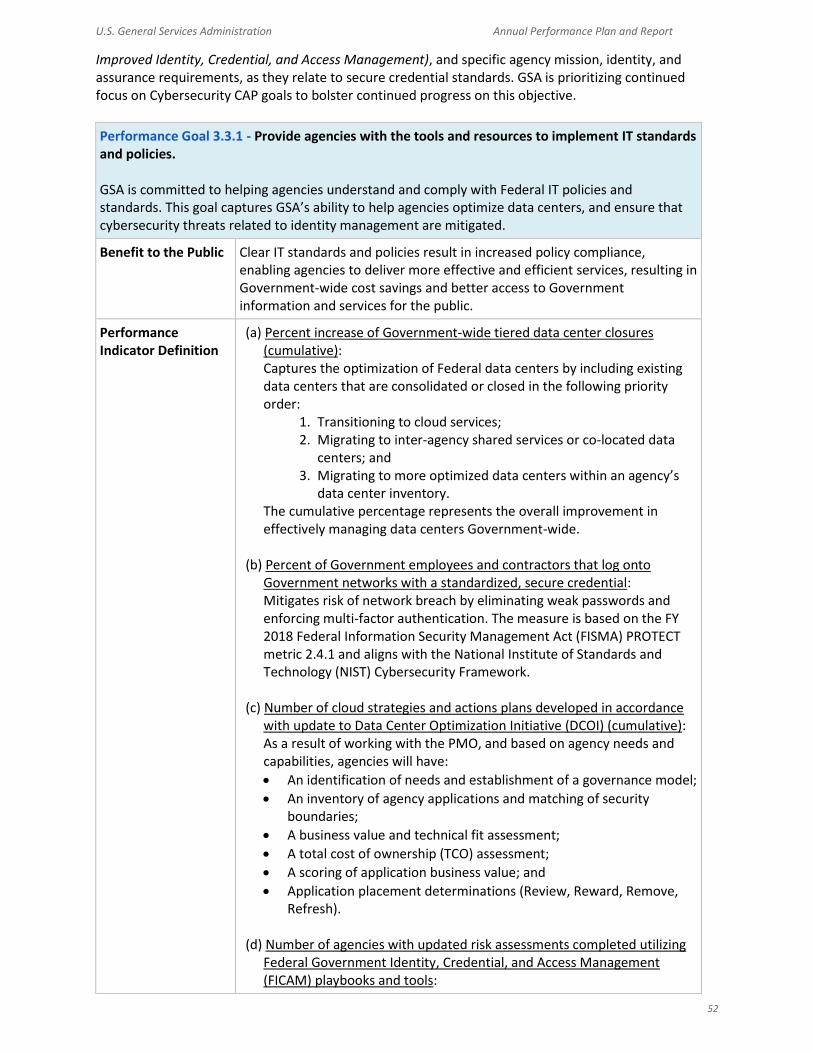
U.S. General Services Administration Annual Performance Plan and Report
52
Improved Identity, Credential, and Access Management), and specific agency mission, identity, and assurance requirements, as they relate to secure credential standards. GSA is prioritizing continued focus on Cybersecurity CAP goals to bolster continued progress on this objective.
Performance Goal 3.3.1 - Provide agencies with the tools and resources to implement IT standards and policies. GSA is committed to helping agencies understand and comply with Federal IT policies and standards. This goal captures GSA’s ability to help agencies optimize data centers, and ensure that cybersecurity threats related to identity management are mitigated.
Benefit to the Public Clear IT standards and policies result in increased policy compliance, enabling agencies to deliver more effective and efficient services, resulting in Government-wide cost savings and better access to Government information and services for the public.
Performance Indicator Definition
(a) Percent increase of Government-wide tiered data center closures (cumulative): Captures the optimization of Federal data centers by including existing data centers that are consolidated or closed in the following priority order:
1. Transitioning to cloud services; 2. Migrating to inter-agency shared services or co-located data
centers; and 3. Migrating to more optimized data centers within an agency’s
data center inventory. The cumulative percentage represents the overall improvement in effectively managing data centers Government-wide.
(b) Percent of Government employees and contractors that log onto Government networks with a standardized, secure credential: Mitigates risk of network breach by eliminating weak passwords and enforcing multi-factor authentication. The measure is based on the FY 2018 Federal Information Security Management Act (FISMA) PROTECT metric 2.4.1 and aligns with the National Institute of Standards and Technology (NIST) Cybersecurity Framework.
(c) Number of cloud strategies and actions plans developed in accordance with update to Data Center Optimization Initiative (DCOI) (cumulative): As a result of working with the PMO, and based on agency needs and capabilities, agencies will have:
An identification of needs and establishment of a governance model;
An inventory of agency applications and matching of security boundaries;
A business value and technical fit assessment;
A total cost of ownership (TCO) assessment;
A scoring of application business value; and
Application placement determinations (Review, Reward, Remove, Refresh).
(d) Number of agencies with updated risk assessments completed utilizing
Federal Government Identity, Credential, and Access Management (FICAM) playbooks and tools:

U.S. General Services Administration Annual Performance Plan and Report
53
These assessments will serve in reaching the following outcomes (as outlined in OMB M-19-17):
1. Contextualizing identity in the Federal Government; 2. Managing identities, credentials, and access in modern
Government; 3. Adapting the Government’s approach to Homeland Security
Presidential Directive 12 (HSPD-12); 4. Shifting the operating model beyond the perimeter; 5. Improving digital interactions with the American public; and 6. Enumerating Government-wide responsibilities.
Progress Update DCCOI and FICAM have achieved the desired targets of the current metrics and new metrics are under consideration. (a) Percent increase of Government-wide tiered data center closures
(cumulative): The DCCOI PMO surpassed the target number of closures for tiered data centers by helping agencies identify key mission facilities (exempt from closure) and refining the definition of a tiered vs. non-tiered data center. The new DCOI memo refined the metrics to measure the efficiency of data centers, making it easier to identify and close the least efficient and non-mission critical data centers.
(b) Percent of Government employees and contractors that log onto
Government networks with a standardized, secure credential: Results for this original FICAM metric are not available for nearly 10 months after the fiscal year closes, hindering timely decision making. Agencies report data at varying intervals throughout the fiscal year. Final numbers will be reported through OMB’s annual FISMA report to Congress which is expected in August, 2020.
(c) Number of cloud strategies and actions plans developed in accordance
with update to Data Center Optimization Initiative (DCOI) (cumulative): Since July 2019, the PMO has provided on-demand technical cloud subject matter expertise to agencies in support of their cloud strategy and action plan development. The PMO plans to continue offering this support throughout FY 2020 and encourages the creation of plans and strategies that are aligned with M-19-19 and the Cloud Smart strategy. The extent of agency participation will inform the final strategies and plans.
(d) Number of agencies with updated risk assessments completed utilizing
Federal Government Identity, Credential, and Access Management (FICAM) playbooks and tools: This new metric identifies six outcomes outlined in M-19-17 (listed in the above performance indicator definition) that agencies will achieve through in-depth risk assessments facilitated by the FICAM team. The FICAM team will use tools and best practices outlined in FICAM playbooks to achieve these outcomes.

U.S. General Services Administration Annual Performance Plan and Report
54
(a) Percent increase of Government-wide tiered data center closures (cumulative)
Fiscal Year Target Results
2016 N/A N/A
2017 N/A 3.55%
2018 6.0% 8.95%
2019 10.0% 13.09%
2020 14.0% N/A*
Lead Office: Office of Government-wide Policy
*To be discontinued in FY 2021
(b) Percent of Government employees and contractors that log onto Government networks with a standardized, secure credential
Fiscal Year Target Results
2016 N/A 72%
2017 N/A 81%
2018 83% 96%
2019 95% TBD*
2020 98% N/A**
Lead Offices: Office of Government-wide Policy and Federal Acquisition Service
* Results will be available after the annual OMB FISMA report is released in August 2020. ** To be discontinued in FY 2021
(c) Number of cloud strategies and action plans developed in accordance with update to DCOI
Fiscal Year Target Results
2019 N/A N/A
2020 5 N/A
2021 5 N/A
Lead Office: Office of Government-wide Policy
(d) Number of CFO Act agencies with updated risk assessments completed utilizing FICAM playbooks and tool (cumulative)
Fiscal Year Target Results
2019 N/A N/A
2020 6 N/A
2021 12 N/A
Lead Office: Office of Government-wide Policy

U.S. General Services Administration Annual Performance Plan and Report
55
___________________________________________________
STRATEGIC GOAL 4
Design and deliver expanded shared services within GSA and across the Federal Government to improve performance and save taxpayer money.
Mission-support services across Government are challenged by inefficiencies and manual processes, duplicative investments in technology and capabilities, and an inability to consistently modernize technology and business practices. For example, Government-wide benchmarking data shows some agencies are entering nearly all of their vendor invoices manually and paying nearly 100 times more per processed invoice than the standard for electronic invoicing. Similar examples can be cited in each of the key support functions at Federal agencies: human capital, IT support, finance, acquisition, and building services. Inefficiencies take valuable time and resources away from agency missions, impeding the Government’s ability to deliver on public priorities. GSA is able to fundamentally change the way Government conducts mission-support services by designing and delivering expanded shared services. Shared services is an industry-leading practice with proven success in consolidating processes, systems, and workforce to reduce costs and deliver common services in a standard way across complex enterprises. This practice also creates opportunities to share specialists and time-tested approaches across agencies. Helping agencies share common services and technology today will mean long-term cost savings for taxpayers, and a Government that is leaner and better equipped. GAO has stated that “moving to shared services can save the Federal Government billions of dollars as well as reduce duplicative efforts, decrease systems upgrades, and free up resources for mission-critical activities.” But the Federal Government’s efforts to establish and scale up shared services have yielded mixed results, at best. At GSA, the mission is to provide services to agencies. The agency’s robust supplier relationships and access to leading practices in industry for all support services allow GSA to bring innovative, proven solutions to the Federal Government. GSA’s role in Government-wide policy implementation and data analysis is also a key factor in helping agencies overcome barriers to improving their own mission-support operations and adopting shared services. To coordinate these efforts and fully realize its potential, GSA must develop stronger organizational capabilities to understand customer demand, work with industry to provide efficient and effective supply, and incorporate services from across GSA to satisfy the needs of Federal agencies.
___________________________________________________________________________ Strategic Objective 4.1: Develop new organizational capabilities to understand customer demand and deliver integrated offerings to support common business processes Government- wide. The first three goals in this strategic plan focus on advancing and improving GSA’s capabilities in real estate, acquisition, and technology to better support agency missions Government-wide. However, GSA’s ability to integrate those capabilities into comprehensive life-cycle solutions will create the greatest value for agencies and the American people. To accomplish this goal, GSA will collaborate with customers and improve how its components coordinate to seamlessly meet customer needs. GSA will expand its core capabilities and adapt to market demands. Scaling and adaptability are critical to addressing evolving customer needs. Strategic partnership with industry will help create an agile, responsive delivery model. GSA will also establish a specific business analysis function to conduct a

U.S. General Services Administration Annual Performance Plan and Report
56
variety of analyses to benefit customers, such as developing business cases, determining optimal bundles of products and services, and researching innovative methods to reduce costs and strengthen service quality. GSA will improve its offerings by using performance evaluation and market competition to incentivize its industry partners to deliver high-quality service. GSA’s service processes and pricing will be transparent so customers can hold the agency accountable for delivering services that achieve both quality and cost expectations. Further, GSA will provide leadership for and support of the PMA by assisting with the establishment of a strategic Government-wide framework for improving the effectiveness and efficiency of administrative services. To support implementation of this goal, the Administration established GSA as a co-lead for the Sharing Quality Services CAP goal. Among other responsibilities, GSA is expected to help expand the number and use of common solutions across Government to reduce duplication and costs. This approach will also rely on standardized administrative operations and core performance metrics to improve the quality and delivery of shared services.
Key Strategies
A. Strengthen customer interface capabilities by establishing a data-driven approach to customer engagement and standardizing intake processes to identify and address customer needs:
a. Develop a systematic, repeatable, and understandable approach to working with customers;
b. Leverage customer relationships to cultivate deep expertise and apply data-validated solutions to address customer problems across the Federal Government; and
c. Monitor customer satisfaction at every point in the life cycle and hold employees accountable for customer relationship management.
B. Develop a comprehensive, integrated menu of options for GSA’s product and service offerings: a. Conduct a high-level inventory of existing products and services and create a user
friendly catalogue of GSA offerings; and b. Recommend service packages (bundles) leveraging the catalogue to meet customer
needs, with a focus on small agency lifecycle services as an early bundle. C. Develop organizational capabilities to provide products and services, tools, methodologies, and
metrics to deliver shared services: a. Grow the talent and skill sets to establish capabilities, including business process
engineers, process improvement specialists, data specialists, technologists, and experts in large and complex project management;
b. Embed a culture that encourages performance, continual improvement, and entrepreneurship to deliver value to customers;
c. Use GSA’s technology expertise to deploy interoperable, secure, effective, and efficient technology solutions; and
d. Work with stakeholders in the executive branch and Congress to identify financial mechanisms that help agencies make the investments needed for technical upgrades, capability development and, where needed, transition to a shared services provider.
D. Expand the number and use of common solutions to reduce duplication and cost: a. Establish and operate a Quality Service Management Office (QSMO) for Civilian Human
Resources Transaction Services to plan and deliver human capital shared mission-support services to customer agencies; and
b. Assess opportunities for common solutions within core support operations across the Government, including: human resources, financial management, procurement, grants management, operations support, and IT.
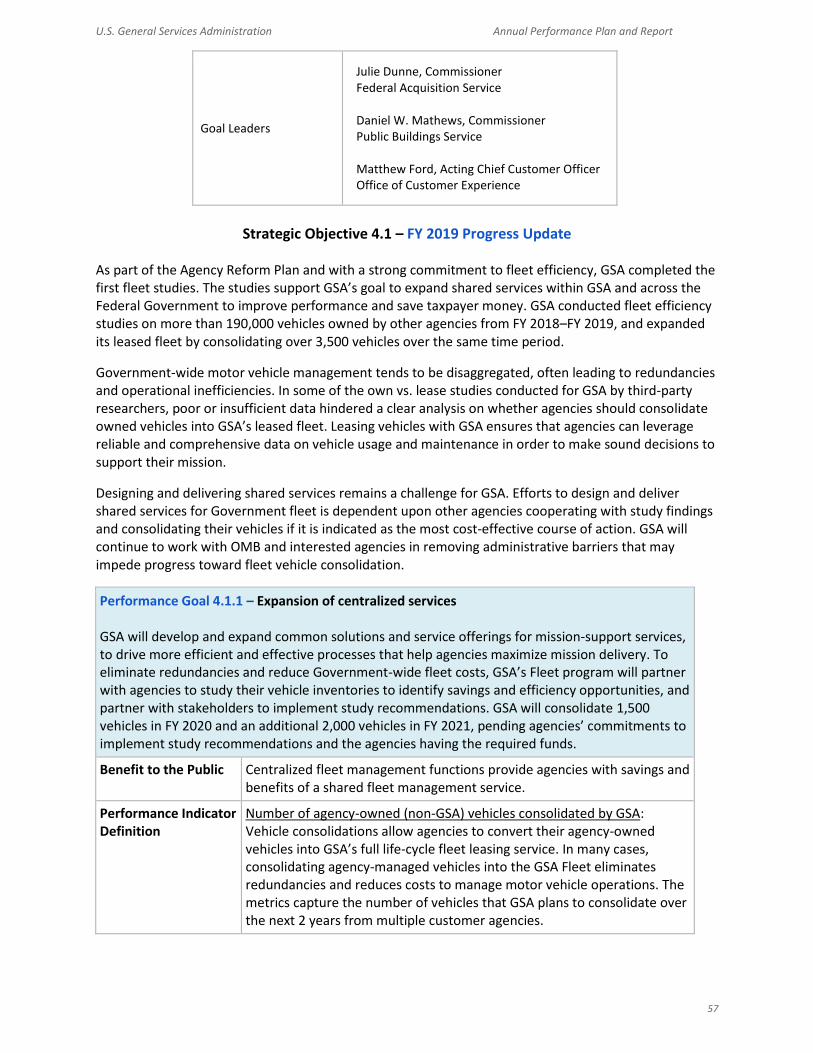
U.S. General Services Administration Annual Performance Plan and Report
57
Goal Leaders
Julie Dunne, Commissioner Federal Acquisition Service Daniel W. Mathews, Commissioner Public Buildings Service Matthew Ford, Acting Chief Customer Officer Office of Customer Experience
Strategic Objective 4.1 – FY 2019 Progress Update As part of the Agency Reform Plan and with a strong commitment to fleet efficiency, GSA completed the first fleet studies. The studies support GSA’s goal to expand shared services within GSA and across the Federal Government to improve performance and save taxpayer money. GSA conducted fleet efficiency studies on more than 190,000 vehicles owned by other agencies from FY 2018–FY 2019, and expanded its leased fleet by consolidating over 3,500 vehicles over the same time period.
Government-wide motor vehicle management tends to be disaggregated, often leading to redundancies and operational inefficiencies. In some of the own vs. lease studies conducted for GSA by third-party researchers, poor or insufficient data hindered a clear analysis on whether agencies should consolidate owned vehicles into GSA’s leased fleet. Leasing vehicles with GSA ensures that agencies can leverage reliable and comprehensive data on vehicle usage and maintenance in order to make sound decisions to support their mission.
Designing and delivering shared services remains a challenge for GSA. Efforts to design and deliver shared services for Government fleet is dependent upon other agencies cooperating with study findings and consolidating their vehicles if it is indicated as the most cost-effective course of action. GSA will continue to work with OMB and interested agencies in removing administrative barriers that may impede progress toward fleet vehicle consolidation.
Performance Goal 4.1.1 – Expansion of centralized services GSA will develop and expand common solutions and service offerings for mission-support services, to drive more efficient and effective processes that help agencies maximize mission delivery. To eliminate redundancies and reduce Government-wide fleet costs, GSA’s Fleet program will partner with agencies to study their vehicle inventories to identify savings and efficiency opportunities, and partner with stakeholders to implement study recommendations. GSA will consolidate 1,500 vehicles in FY 2020 and an additional 2,000 vehicles in FY 2021, pending agencies’ commitments to implement study recommendations and the agencies having the required funds.
Benefit to the Public Centralized fleet management functions provide agencies with savings and benefits of a shared fleet management service.
Performance Indicator Definition
Number of agency-owned (non-GSA) vehicles consolidated by GSA: Vehicle consolidations allow agencies to convert their agency-owned vehicles into GSA’s full life-cycle fleet leasing service. In many cases, consolidating agency-managed vehicles into the GSA Fleet eliminates redundancies and reduces costs to manage motor vehicle operations. The metrics capture the number of vehicles that GSA plans to consolidate over the next 2 years from multiple customer agencies.

U.S. General Services Administration Annual Performance Plan and Report
58
Progress Update In 2019, the Fleet Management team completed studies of 114,207 vehicles across 6 agencies (DOI, DOJ, USDA, USMC, Navy, and DOE) for possible consolidation into the GSA fleet. This outcome exceeded the target for the number of vehicles studied by 14 percent (Target: 100,000; Result: 114,207). Actual consolidations have not yet occurred from the FY 2019 studies. GSA continues to work closely with OMB to address agency funding and responsiveness challenges. While 1,805 vehicles were consolidated in FY 2019, none resulted from the FY 2019 completed studies and follow-up efforts (Target: 5,000; Result: 1,805). Vehicle consolidations will continue as the focus for FY 2020 and FY 2021.
Number of agency-owned (non-GSA) vehicles studied and consolidated by GSA (vehicles studied / vehicles consolidated) ⦿ FY 2018 - 2019 Agency Priority Goal
Fiscal Year Target Results
2016 N/A studied N/A consolidated
N/A studied 1,136 consolidated
2017 N/A studied N/A consolidated
N/A studied 911 consolidated
2018 25,000 studied 500 consolidated
76,238 studied 1,790 consolidated
2019 100,000 studied 5,000 consolidated
114,207 studied 1,805 consolidated
Lead Office: Federal Acquisition Service
Number of agency-owned (non-GSA) vehicles consolidated by GSA
Fiscal Year Target Results
2016 N/A 1,136
2017 N/A 911
2018 N/A 1,790
2019 N/A 1,805
2020 1,500 N/A
2021 2,000 N/A
Lead Office: Federal Acquisition Service
______________________________________________________________________________ Strategic Objective 4.2: Promote adoption of shared services by agencies through policy, guidance, and benchmarking. GSA plays a central role in the development of policy, best practices, and strategic planning for mission-support services across Government. GSA’s Office of Shared Solutions and Performance Improvement
U.S. General Services Administration Annual Performance Plan and Report
59
(OSSPI) has been a leader in educating and helping Government agencies understand the cost and operational benefits of shared services. Through management of the governance of the Shared Services Governance Board (SSGB), Business Standards Council (BSC), QSMO Roundtable, and Senior Accountable Point of Contact (SAPOC) body, OSSPI regularly engages providers and customers of the current and future shared service community. These interactions ensure the voice of the customer is incorporated throughout the standards development process and informs QSMO implementation strategies. OSSPI also analyzed the challenges in the current shared service ecosystem and recommended strategies to mitigate risks. OSSPI will continue to work with agencies to promote standardization and implement best practices to facilitate agency transitions to shared services operating models.
Key Strategies
A. Establish and lead cross-agency councils to facilitate the sharing of lessons learned, advise GSA leadership on possible shared services, and participate in the development of best practices guidance.
B. Help agencies and the Government to identify sharing opportunities and propose adoption strategies:
a. Manage and coordinate the cross-functional development of standard capabilities for mission-support functions where appropriate; and
b. Conduct periodic assessments of agencies’ performance of mission-support functions against Government-wide standards and peers to inform policy decisions, opportunities for mission-support improvement, or mitigation of risks.
C. Assist agencies with their preparation for successful migration to shared services or modernization efforts:
a. Coordinate the readiness assessment process to ensure Government-wide buy-in of administrative standards.
b. Manage the governance process of the Federal Integrated Business Framework (FIBF) templates and facilitate the resolution of cross-functional issues.
Goal Leader Jessica Salmoiraghi, Associate Administrator Office of Government-wide Policy
Contributing Programs Office of Shared Solutions and Performance Improvement (OSSPI)
Strategic Objective 4.2 – FY 2019 Progress Update
GSA continues to make progress toward establishing Government-wide standards for mission-support functions, following the FIBF. Having standards is the most critical step to establishing a successful shared service because agencies must agree on the system or service requirements in order to benefit from scale and common delivery methods. In FY 2019, the Business Standards Council focused on cross-functional synergies and defining how the various business processes will integrate. Although components of standards have been completed, no standard has been fully completed because the touch points between functional communities are a work in progress. Use of GSA’s M3 tools and best practices exceeded the FY 2019 performance goal. GSA worked closely with OMB and the QSMO to update M3 to align with the revised shared services strategy and to develop a common process to review investments while the QSMOs are becoming operational.
Performance Goal 4.2.1 - Reduce barriers to entry to facilitate easier adoption of shared services
Benefit to the Public Making it easier to move to shared services will help eliminate redundancy, mitigate risk, and consolidate buying power to reduce costs.
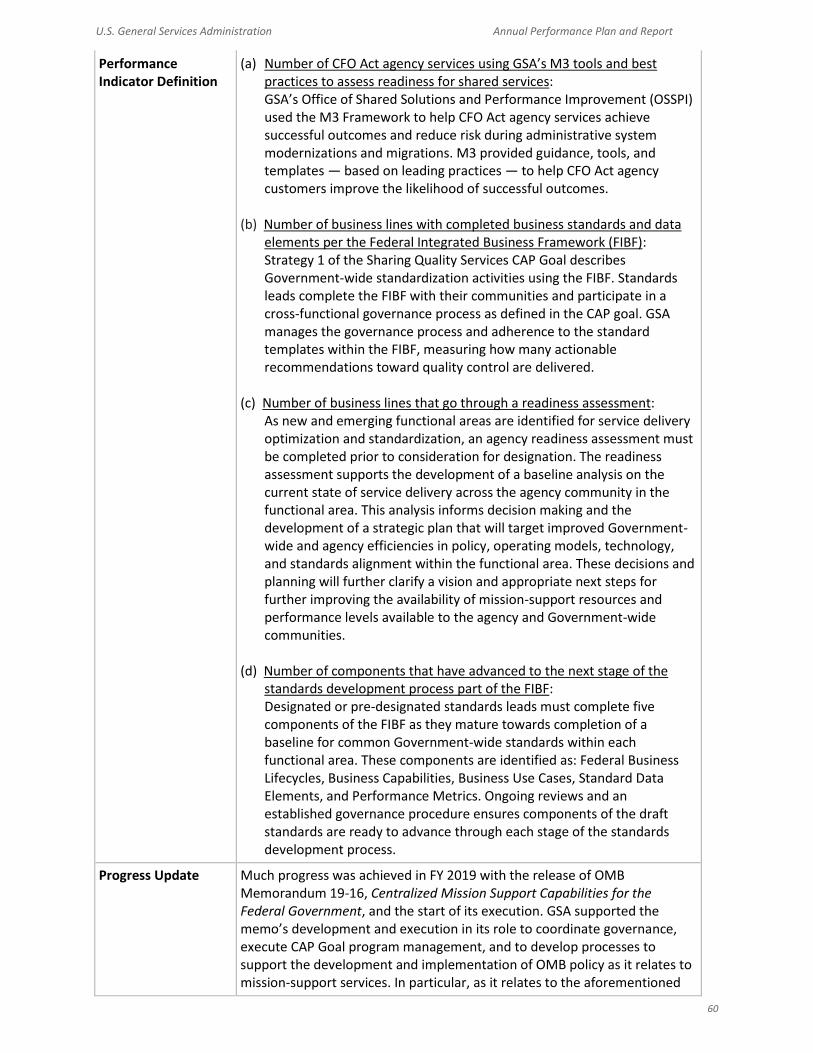
U.S. General Services Administration Annual Performance Plan and Report
60
Performance Indicator Definition
(a) Number of CFO Act agency services using GSA’s M3 tools and best practices to assess readiness for shared services: GSA’s Office of Shared Solutions and Performance Improvement (OSSPI) used the M3 Framework to help CFO Act agency services achieve successful outcomes and reduce risk during administrative system modernizations and migrations. M3 provided guidance, tools, and templates — based on leading practices — to help CFO Act agency customers improve the likelihood of successful outcomes.
(b) Number of business lines with completed business standards and data elements per the Federal Integrated Business Framework (FIBF): Strategy 1 of the Sharing Quality Services CAP Goal describes Government-wide standardization activities using the FIBF. Standards leads complete the FIBF with their communities and participate in a cross-functional governance process as defined in the CAP goal. GSA manages the governance process and adherence to the standard templates within the FIBF, measuring how many actionable recommendations toward quality control are delivered.
(c) Number of business lines that go through a readiness assessment: As new and emerging functional areas are identified for service delivery optimization and standardization, an agency readiness assessment must be completed prior to consideration for designation. The readiness assessment supports the development of a baseline analysis on the current state of service delivery across the agency community in the functional area. This analysis informs decision making and the development of a strategic plan that will target improved Government-wide and agency efficiencies in policy, operating models, technology, and standards alignment within the functional area. These decisions and planning will further clarify a vision and appropriate next steps for further improving the availability of mission-support resources and performance levels available to the agency and Government-wide communities.
(d) Number of components that have advanced to the next stage of the standards development process part of the FIBF: Designated or pre-designated standards leads must complete five components of the FIBF as they mature towards completion of a baseline for common Government-wide standards within each functional area. These components are identified as: Federal Business Lifecycles, Business Capabilities, Business Use Cases, Standard Data Elements, and Performance Metrics. Ongoing reviews and an established governance procedure ensures components of the draft standards are ready to advance through each stage of the standards development process.
Progress Update Much progress was achieved in FY 2019 with the release of OMB Memorandum 19-16, Centralized Mission Support Capabilities for the Federal Government, and the start of its execution. GSA supported the memo’s development and execution in its role to coordinate governance, execute CAP Goal program management, and to develop processes to support the development and implementation of OMB policy as it relates to mission-support services. In particular, as it relates to the aforementioned

U.S. General Services Administration Annual Performance Plan and Report
61
performance indicators, GSA OSSPI continued to support CFO Act agencies via its M3 framework to help agencies achieve successful outcomes and reduce risk during administrative system modernizations and migrations. In support of the foundational work of establishing end-to-end Government-wide mission-support standards, GSA continued to work with the standards leads on the Business Standards Council to address cross-functional touchpoints and to help new mission support areas begin to develop their Government-wide standards. To truly address and gain agreement on common touch points can take time, but it is an important step before any standards are finalized. Once standards are agreed upon, a readiness assessment is conducted to ensure agencies are in agreement with the final set.
(a) Number of agencies using GSA’s M3 tools and best practices to assess
readiness for shared services
Fiscal Year Target Results
2017 N/A 4
2018 6 31
2019 35 43
Lead Office: Office of Government-wide Policy
(b) Number of business lines with completed business standards and data elements per the Federal Integrated Business Framework (FIBF)
Fiscal Year Target Results
2018 N/A N/A
2019 3 1
Lead Office: Office of Government-wide Policy
(c) Number of business lines that go through a readiness assessment
Fiscal Year Target Results
2018 N/A 5
2019 N/A 1
2020 1 N/A
2021 1 N/A
Lead Office: Office of Government-wide Policy
(d) Number of components that have advanced to the next stage of the standards development process as part of the FIBF
Fiscal Year Target Results
2018 N/A 5
2019 N/A 15
2020 12 N/A
2021 12 N/A
Lead Office: Office of Government-wide Policy

U.S. General Services Administration Annual Performance Plan and Report
62
______________________________________________________________________________
Strategic Objective 4.3: Support the overall mission of GSA by investing in our employees and modeling how GSA delivers internal support services, while providing policy guidance across Government. To strengthen GSA’s ability to lead by example in Government management, it is important that GSA’s support services be among the most efficient and effective in Government. GSA’s CXO functions (acquisition, finance, human capital, IT) will seek to build on recent performance gains, accelerating reforms to streamline operations and align with customer needs. GSA prides itself on understanding how business operations benefit Government. GSA will look to the very best business organization equivalents for performance comparisons and benchmarks, challenging itself to match or exceed their performance. This includes practicing what we preach. When GSA is advising other agencies on methods to improve their support operations — whether through organizational fixes or migrating to shared services — GSA should adopt a like-minded approach to pursuing efficiency gains and service quality. GSA’s credibility across Government is enhanced when GSA demonstrates that the solutions it recommends externally are used inside of GSA as well. This is true for the traditional CXO functions and for non-CXO functions that also enable GSA to achieve its mission. Finally, GSA recognizes the importance of engaging the entire workforce in this mission. For many, the agency’s growing emphasis on providing customers with integrated solutions, life-cycle management, and shared services will present both a challenge and an opportunity. It is incumbent on GSA to invest in its workforce, developing the skills, tools, and inspiration for employees to excel at delivering core and emerging services to GSA’s customers and suppliers.
Key Strategies
A. Improve the performance of GSA’s CXO functions by building on GSA’s previous CXO consolidation initiatives and applying proven shared services principles:
a. Conduct a thorough review of previous CXO consolidations to implement lessons learned and drive further performance across GSA’s support functions; and
b. Partner with SSPI to assess opportunities for GSA CXO functions to incorporate principles and proven practices from the broader shared services community.
B. Ensure that GSA’s non-CXO functions deliver effective, efficient, and accountable services to GSA or, as appropriate, across the Federal Government:
a. Establish organizational performance plans and service metrics for GSA’s non-CXO functions, oriented around the customers to whom they are accountable; and
b. Build connections to and knowledge of non-CXO functions at other Federal agencies to share and adopt proven practices.
C. Complete a cost and operational review to clearly identify direct and indirect costs; develop management actions to address areas for improvement:
a. Develop a methodology for defining and measuring all forms of indirect costs for GSA operations, including Service and Staff Offices; and
b. Construct methods for allocating costs to GSA products and services to better understand their economics and inform pricing strategies.
D. Mature the agency’s workforce planning capabilities to deliver a mission-ready workforce. a. Assess SSO workforce planning maturity levels; b. Implement an enterprise-wide recruitment strategy to support, maintain and increase
quality candidate pools for mission-critical occupations; and

U.S. General Services Administration Annual Performance Plan and Report
63
c. Assess and consolidate GSA entry-level programs. E. Expand the Eliminate, Optimize, Automate (EOA) and Robotic Process Automation (RPA)
initiatives to enhance GSA’s efforts to shift from low-value to high-value work. a. Establish a Government-wide Community of Practice to accelerate RPA adoption; b. Assess the scale of opportunity; and c. Establish a pilot IT platform.
Goal Leaders GSA Service and Staff Offices
Strategic Objective 4.3 – FY 2019 Progress Update
GSA is making noteworthy progress toward achieving this strategic objective and met all of its performance goals for FY 2019. Customer satisfaction with mission-support functions — including contracting, financial management, human capital management, and information technology — improved for the third consecutive year in FY 2019. GSA is on track to provide better competition for agency acquisition contracts. GSA continues to modernize its IT portfolio through greater use of cloud technologies, modernize legacy IT systems within its portfolio, and invest in cybersecurity enhancements (tools and processes) that protect key business systems and infrastructure. Employee connection to GSA’s mission also continued its positive trend, as reported in the 2019 Federal Employee Viewpoint Survey (FEVS). During the last year, GSA made remarkable progress in streamlining operations through robotic process automation (RPA), freeing up workers to spend more time on higher-impact activities. By the end of FY 2019, GSA had deployed 29 RPA projects agency-wide, shifting about 62,000 FTE hours from low-value work to high-value work through automation and improved administrative processes. The agency identified more than 200,000 hours of low-value work that can be automated, reduced, or eliminated. In addition, GSA is leading a Government-wide community of practice to accelerate RPA adoption. All the while, the agency continues to reduce its operating costs as a percentage of goods and services provided to its customers.
Performance Goal 4.3.1 - Efficient and effective mission-support services at GSA (CXO and non-CXO functions)
GSA must ensure that internal operations are efficient and effective to support low-cost, high-quality products and services. This focus on internal excellence is carried forward in how GSA provides mission-support services to the Government-wide community.
Benefit to the Public Effective and efficient GSA internal operations decrease the cost burden to agency customers, freeing up funds to meet mission objectives for the American public.
Performance Indicator Definition
(a) Total GSA operating cost as a percent of goods and services provided: For all of GSA’s major products or services: Total operating costs (direct and indirect) divided by total revenues.
(b) Effectiveness of GSA CXO functions, as measured by customer satisfaction:
From the PMA Benchmarking Initiative’s Customer Satisfaction Survey: Equally weighted composite customer satisfaction score for GSA’s CXO functions (acquisition, financial management, human capital, IT, and services).

U.S. General Services Administration Annual Performance Plan and Report
64
(c) Percent of GSA IT portfolio utilizing cloud technologies: Divides the number of GSA IT investment line items (from IT portfolio summary) that are utilizing cloud technologies by the total number of eligible GSA IT investment line items that could adopt cloud services.
(d) Competition rate for GSA acquisitions: Provided from the Federal Procurement Data System (FPDS) source data. Total dollar value of GSA-competed actions divided by the total dollar value of GSA-obligated actions; including contracts that GSA provisions through reimbursable agreements with other agencies.
(e) Competitive One-Bid rate for GSA acquisitions:
Provided from FPDS source data. Total dollar value of GSA-competed actions with only one bid divided by the total dollar value of GSA-competed actions; includes contracts that GSA provisions through reimbursable agreements with other agencies.
Progress Update (a) Total GSA operating cost as a percent of goods and services provided: GSA far exceeded the target of 9.00% with an actual of 8.01% for total GSA operating cost as a percentage of goods and services provided. This positive result shows that GSA is efficiently managing costs relative to the demand for our goods and services.
(b) Effectiveness of GSA CXO functions, as measured by customer satisfaction:
GSA’s FY 2019 score of 5.42 exceeded the FY 2019 target of 5.23. Since FY 2016, GSA’s score has shown an annual positive increase.
(c) Percent of GSA IT portfolio utilizing cloud technologies:
● GSA has 50 percent (43 of 86) of IT investment line items using cloud technologies, as reported on the OMB IT Portfolio Summary.
● The 3 percent increase over FY 2019 is a result of an increase in the number of standard investments and changes in the number of total investments in the portfolio.
(d) Competition rate for GSA acquisitions and (e) Competitive One-Bid rate
for GSA acquisitions: GSA developed a dashboard that allows managers across the agency to regularly track competition metrics and identify areas for improvement, and communicates performance monthly. GSA exceeded the competition target, but did not meet the Competitive One-Bid target. A key driver for higher Competitive One-Bid was an increased demand for GSA’s Assisted Acquisition Service (AAS) where the business volume was up $1.5 billion and with an increase in Competitive One-Bid rate from 18.61 percent to 20.2 percent.
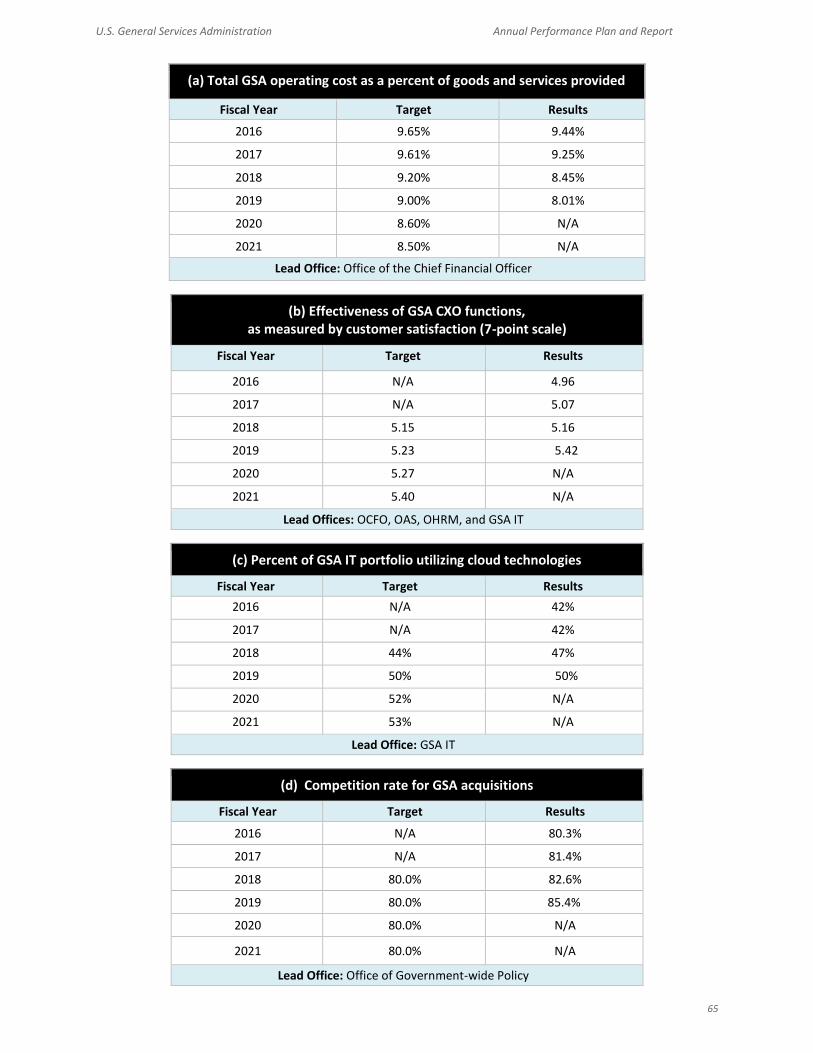
U.S. General Services Administration Annual Performance Plan and Report
65
(a) Total GSA operating cost as a percent of goods and services provided
Fiscal Year Target Results
2016 9.65% 9.44%
2017 9.61% 9.25%
2018 9.20% 8.45%
2019 9.00% 8.01%
2020 8.60% N/A
2021 8.50% N/A
Lead Office: Office of the Chief Financial Officer
(b) Effectiveness of GSA CXO functions, as measured by customer satisfaction (7-point scale)
Fiscal Year Target Results
2016 N/A 4.96
2017 N/A 5.07
2018 5.15 5.16
2019 5.23 5.42
2020 5.27 N/A
2021 5.40 N/A
Lead Offices: OCFO, OAS, OHRM, and GSA IT
(c) Percent of GSA IT portfolio utilizing cloud technologies
Fiscal Year Target Results
2016 N/A 42%
2017 N/A 42%
2018 44% 47%
2019 50% 50%
2020 52% N/A
2021 53% N/A
Lead Office: GSA IT
(d) Competition rate for GSA acquisitions
Fiscal Year Target Results
2016 N/A 80.3%
2017 N/A 81.4%
2018 80.0% 82.6%
2019 80.0% 85.4%
2020 80.0% N/A
2021 80.0% N/A
Lead Office: Office of Government-wide Policy
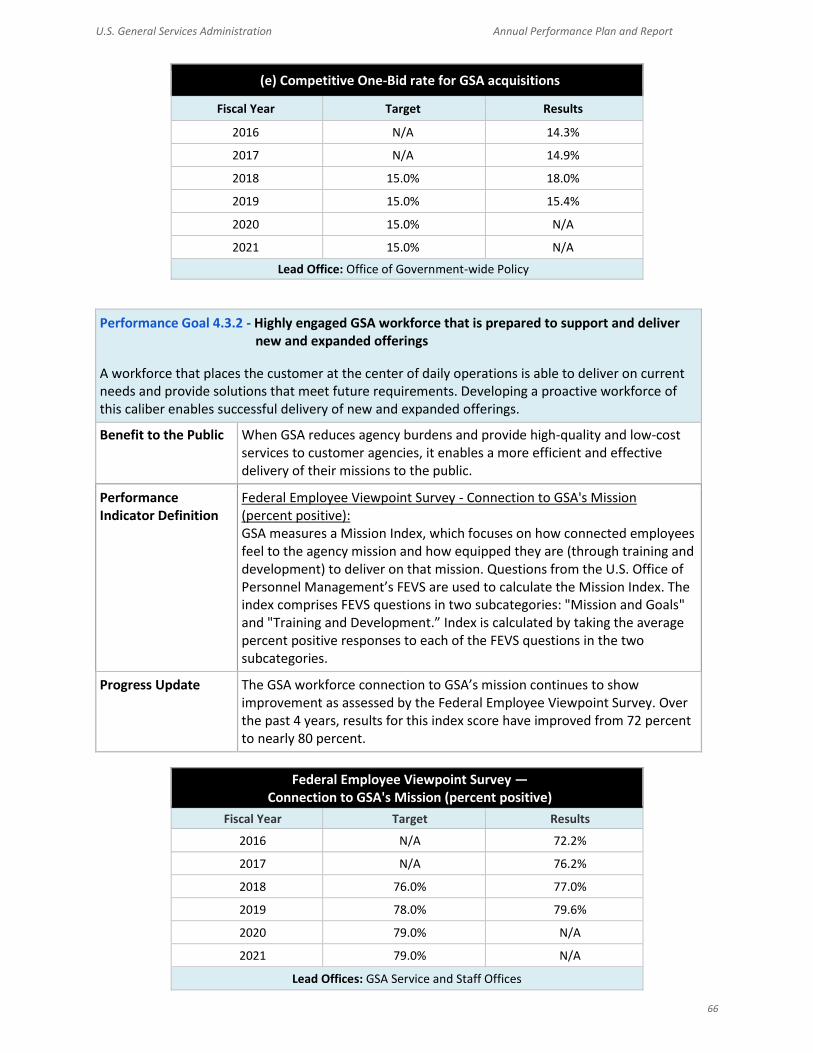
U.S. General Services Administration Annual Performance Plan and Report
66
(e) Competitive One-Bid rate for GSA acquisitions
Fiscal Year Target Results
2016 N/A 14.3%
2017 N/A 14.9%
2018 15.0% 18.0%
2019 15.0% 15.4%
2020 15.0% N/A
2021 15.0% N/A
Lead Office: Office of Government-wide Policy
Performance Goal 4.3.2 - Highly engaged GSA workforce that is prepared to support and deliver new and expanded offerings
A workforce that places the customer at the center of daily operations is able to deliver on current needs and provide solutions that meet future requirements. Developing a proactive workforce of this caliber enables successful delivery of new and expanded offerings.
Benefit to the Public When GSA reduces agency burdens and provide high-quality and low-cost services to customer agencies, it enables a more efficient and effective delivery of their missions to the public.
Performance Indicator Definition
Federal Employee Viewpoint Survey - Connection to GSA's Mission (percent positive): GSA measures a Mission Index, which focuses on how connected employees feel to the agency mission and how equipped they are (through training and development) to deliver on that mission. Questions from the U.S. Office of Personnel Management’s FEVS are used to calculate the Mission Index. The index comprises FEVS questions in two subcategories: "Mission and Goals" and "Training and Development.” Index is calculated by taking the average percent positive responses to each of the FEVS questions in the two subcategories.
Progress Update The GSA workforce connection to GSA’s mission continues to show improvement as assessed by the Federal Employee Viewpoint Survey. Over the past 4 years, results for this index score have improved from 72 percent to nearly 80 percent.
Federal Employee Viewpoint Survey — Connection to GSA's Mission (percent positive)
Fiscal Year Target Results
2016 N/A 72.2%
2017 N/A 76.2%
2018 76.0% 77.0%
2019 78.0% 79.6%
2020 79.0% N/A
2021 79.0% N/A
Lead Offices: GSA Service and Staff Offices
U.S. General Services Administration Annual Performance Plan and Report
67
____________________________________________________________________________
MANAGEMENT AND PERFORMANCE CHALLENGES
The Government Performance and Results Modernization Act of 2010 requires that Federal agencies identify and address management and performance challenges, which include programmatic or management functions that have greater vulnerability to waste, fraud, abuse, and mismanagement, and areas where failure to perform well could seriously affect the ability of an agency or the Federal Government to achieve its mission or goals. Performance Improvement Officers are responsible for encouraging and advocating greater impact through innovation, increased effectiveness and efficiency, and better customer service. The U.S. Government Accountability Office (GAO) performs annual audits of GSA’s major missions and routinely assesses the agency’s progress on management challenges identified on GAO’s High Risk List. GAO’s High Risk List, including agencies and program areas across the Government, is updated every 2 years and specifies corrective actions GAO believes necessary to improve critical operations and activities. GSA has a leading role in the management of Federal real property, a long-standing challenge on the High Risk List, and has equities in several other Government-wide areas. GSA addresses reports on major management and performance challenges, and high-risk areas from the GSA Office of Inspector General (OIG). The OIG identified nine management challenges in its Assessment of GSA's Management and Performance Challenges for FY 2020. GSA’s response to this assessment is included in the management challenges section of the FY 2019 Agency Financial Report. GSA’s Enterprise Risk Program, Management Control and Oversight Committee, and Investment Review Board also help to identify challenges. These efforts, in addition to consideration of OIG findings and GAO recommendations provide insights that inform cross-organizational initiatives. On a quarterly and annual basis, GSA tracks progress toward successful completion of performance goals and strategic objectives enterprise-wide.
EVIDENCE-BUILDING GSA is committed to improving its effectiveness (mission delivery) and efficiency (cost savings) of its operations and programs. In FY 2019, GSA continued a number of ongoing evaluation and evidence activities. These included:
● Conducting a rigorous evaluation to learn more about increasing survey responses on the USA.gov platform. USA.gov provides the central online guide to Government information and services, with 130,000 unique visitors each day and an email audience of over 1 million subscribers. USA.gov used the findings to reevaluate the frequency, content, and style of their email communications.
● GSA Fleet completed Agency Reform Plan studies of agency fleets, which included 114,207 agency-owned motor vehicles in 2019. These studies identified the potential for $170.6–189 million in annual savings for the 11 agencies studied which included 190,445 vehicles studied in 2018 and 2019.
● The Public Buildings Service (PBS) analyzed the data associated with its leased portfolio and found that short-term lease extensions came at a significant premium compared to long-term lease replacements. As a result, PBS launched the Lease Costs Avoidance Plan as part of its Real Estate Savings and Investment Strategy. PBS will focus on the high-value leases that represent nearly 80 percent of GSA’s rental obligations and replace those leases with longer firm terms at

U.S. General Services Administration Annual Performance Plan and Report
68
better rates and improved utilization. From FY 2018 through FY 2019, GSA saved over $2 billion in leasing, and is projecting savings of billions more by FY 2023.
GSA’s Office of Evaluation Sciences (OES) is expanding its role and capacity to provide Government-wide expertise and support on leading practices for evidence-building and evaluations. OES is expanding its scope to work directly with agencies to provide expertise, training, and resources on evidence-building. To meet the requirements of the Evidence-Based Policymaking Act, GSA is establishing its own internal evaluation capacity. Initially drawing from staff and expertise from OES, GSA will use existing funding to initiate internal efforts to draft a learning agenda and evaluation plan. GSA will also aim to identify prime learning and evaluation opportunities, to initiate new evaluations in FY 2020 using existing resources.
DATA VALIDATION AND VERIFICATION The GSA Chief Financial Officer certified the FY 2019 performance data contained in this report as complete and reliable, as required by the GPRA Modernization Act of 2010. GSA has verification and validation techniques in place, which provide reasonable assurance over the completeness and reliability of all performance data contained in this report. These techniques included:
(1) Maintaining a data dictionary of performance data measures, including data sources, computation methodology, and reliability assessment for each performance indicator;
(2) Verifying, at least annually, the accuracy and completeness of the information contained in the data dictionary; and
(3) Validating, at least annually, the measures reported by collecting measure source data and calculation files and applying the calculation methodology defined in the data dictionary.
LOWER-PRIORITY PROGRAM ACTIVITIES The President’s Budget identifies the lower-priority program activities, where applicable, as required under the GPRA Modernization Act of 2010, 31 U.S.C. 1115(b)(10). The public can access the volume at: http://www.whitehouse.gov/omb/budget.
U.S. General Services Administration Annual Performance Plan and Report
69
APPENDIX: ACRONYM AND ABBREVIATION LIST __________________________________________________
AAS Assisted Acquisition Service
AAAP Automated Advanced Acquisition
Program
ATO Authority to Operate
BOMA Building Owners and Managers
Association
BTU British Thermal Units
CAP Cross Agency Priority
CBCA Civilian Board of Contract Appeals
CDM Continuous Diagnostics and
Mitigation
CFO Chief Financial Officer
CIC Cloud Information Center
CoE Center of Excellence
CXO Chief _ Officer
DEFEND Dynamic and Evolving Federal
Enterprise Network Defense
DCOI Data Center Optimization Initiative
DCCOI Data Center and Cloud Optimization
Initiative
DHS Department of Homeland Security
DoD US Department of Defense
EIS Enterprise Infrastructure Solutions
FAS Federal Acquisition Service
FASTA Federal Assets Sale Transfer Act
FedRAMP Federal Risk and Authorization
Management Program
FEVS Federal Employee Viewpoint Survey
FIBF Federal Integrated Business
Framework
FICAM Federal Identity, Credential, and
Access Management
FISMA Federal Information Security
Management Act
FM Facilities Management
FPDS Federal Procurement Data System
FPISC
Federal Permitting Improvement
Steering Council
FRPC Federal Real Property Council
GLS GSA Leasing Support Services
GSA General Services Administration
GSF Gross Square Foot
GSA IT Office of the Chief Information
Officer
HSPD-12 Homeland Security Presidential
Directive 12
HUBZone Historically Underutilized Business
Zone
ICAM Identity, Credential, and Access
Management
IPv6 Internet Protocol version 6
IT Information Technology
ITC Information Technology Category
JAIC Joint Artificial Intelligence Center
LCAP Lease Cost Avoidance Plan
LCRM Lease Cost Relative to Market
LoB Line of Business
M3 Modernization and Migration
Management
MAS Multiple Award Schedule
MOU Memorandum of Understanding
NAICS North American Industry
Classification System
NIST National Institute of Standards and
Technology
OAS Office of Administrative Services
OCE Office of Customer Experience
OCFO Office of the Chief Financial Officer
OCIA Office of Congressional and
Intergovernmental Affairs
OCR Office of Civil Rights
OGC Office of the General Counsel
U.S. General Services Administration Annual Performance Plan and Report
70
OGP Office of Government-wide Policy
OHRM Office of Human Resources
Management
OIG Office of Inspector General
OMA Office of Mission Assurance
OMB Office of Management and Budget
OSBU Office of Small Business Utilization
OSSPI Office of Shared Solutions and
Performance Improvement
OSC Office of Strategic Communication
PBS Public Buildings Service
PG Priority Goal
PMA President's Management Agenda
PMO Program Management Office
PBRB Public Buildings Reform Board
QSMO Quality Service Management Office
R&A Repair and Alterations
REXUS Real Estate Across the United States
ROI Return on Investment
RPA Robotics Process Automation
RSF Rentable Square Feet
SBA Small Business Administration
SDB Small Disadvantaged Business
SDVOSB Service-Disabled Veteran-Owned
Small Business
SO Strategic Objective
SSPI Shared Solutions and Performance
Improvement
TCO Total Cost of Ownership
TBM Technology Business Management
TMF Technology Modernization Fund
TTS Technology Transformation Services
VoIP Voice over Internet Protocol
WOSB Woman-Owned Small Business