FY 2018 FIRST QUARTER EARNINGS Adient’s Q1...
15
RECENT HIGHLIGHTS ADIENT • FISCAL FIRST QUARTER 2018 EARNINGS • 1 Adient’s Q1 results impacted by headwinds in Seat Structures & Mechanisms (SS&M) business > Q1 GAAP net income and EPS diluted of $(216)M and $(2.32), respectively; Q1 adjusted-EPS diluted of $1.06 > Q1 Adjusted-EBIT of $163M (margin of 3.9%) > Cash and cash equivalents of $390M at Dec. 31, 2017 > Gross debt and net debt totaled $3,501M and $3,111M, respectively, at Dec. 31, 2017 > FY2018 outlook revised to reflect SS&M headwinds and Q1 performance “We believe we are taking the appropriate actions and moving with a sense of urgency to address and mitigate the headwinds impacting our SS&M business. Adient remains focused on executing our strategy” R. Bruce McDonald, Chairman and Chief Executive Officer ADJ. EBIT $163M -42% AS ADJUSTED vs. Q1 17 ADJ. EBIT MARGIN 3.9% -310 bps ADJ. NET INCOME attributable to Adient $99M -48% FY 2018 Q1 RESULTS OVERVIEW REVENUE $4,204M AS REPORTED EBIT $102M NET INCOME attributable to Adient $(216)M $(2.32) EPS DILUTED ADJ. EPS DILUTED $1.06 -48% Signed a joint venture agreement with Boeing to form Adient Aerospace (Adient has a majority ownership stake in the company at 50.01%). Showcased Adient’s future mobility solutions that address trends driving change in mobility (autonomous vehicles, car-and ride-sharing) at the 2018 North American International Auto Show. Impact of U.S. tax reform is expected to be positive in the short-term (FY18); certain structural changes needed to offset negative influences beginning in FY19. Unconsolidated seating revenue in Q1 2018 increased to $2.5B. FY 2018 FIRST QUARTER EARNINGS For non-GAAP and adjusted results, see appendix for detail and reconciliation to U.S. GAAP January 29, 2018 +4% vs. Q1 17 -55% -252% -254%
Transcript of FY 2018 FIRST QUARTER EARNINGS Adient’s Q1...

RECENT HIGHLIGHTS
ADIENT • FISCAL FIRST QUARTER 2018 EARNINGS • 1
Adient’s Q1 results impacted by headwinds in Seat Structures & Mechanisms (SS&M) business
> Q1 GAAP net income and EPS diluted of $(216)M and $(2.32), respectively; Q1 adjusted-EPS diluted of $1.06
> Q1 Adjusted-EBIT of $163M (margin of 3.9%) > Cash and cash equivalents of $390M at Dec. 31, 2017 > Gross debt and net debt totaled $3,501M and
$3,111M, respectively, at Dec. 31, 2017 > FY2018 outlook revised to reflect SS&M headwinds and
Q1 performance
“We believe we are taking the appropriate actions and moving with a sense of urgency to address and mitigate the headwinds impacting our SS&M business. Adient remains focused on executing our strategy” R. Bruce McDonald, Chairman and Chief Executive Officer
ADJ. EBIT
$163M-42%
AS ADJUSTED
vs. Q1 17
ADJ. EBIT MARGIN
3.9%-310 bps
ADJ. NET INCOMEattributable to Adient
$99M-48%
FY 2018 Q1 RESULTS OVERVIEW
REVENUE
$4,204MAS REPORTED
EBIT
$102M
NET INCOMEattributable to Adient
$(216)M $(2.32)EPS DILUTED
ADJ. EPS DILUTED
$1.06-48%
Signed a joint venture agreement with Boeing to form Adient Aerospace (Adient has a majority ownership stake in the company at 50.01%).
Showcased Adient’s future mobility solutions that address trends driving change in mobility (autonomous vehicles, car-and ride-sharing) at the 2018 North American International Auto Show.
Impact of U.S. tax reform is expected to be positive in the short-term (FY18); certain structural changes needed to offset negative influences beginning in FY19.
Unconsolidated seating revenue in Q1 2018 increased to $2.5B.
FY 2018 FIRST QUARTER EARNINGS
For non-GAAP and adjusted results, see appendix for detail and reconciliation to U.S. GAAP
January 29, 2018
+4%vs. Q1 17 -55% -252% -254%
CONTACTSGLEN PONCZAK+1 414 220 [email protected]
MARK OSWALD+1 734 254 [email protected]
MEDIA INVESTORS
Adient is a global leader in automotive seating. With 85,000 employees operating in 238
manufacturing/assembly plants in 34 countries worldwide, we produce and deliver automotive
seating for all vehicle classes and all major OEMs. From complete seating systems to individual
components, our expertise spans every step of the automotive seat-making process. Our integrated,
in-house skills allow us to take our products from research and design all the way to engineering and
manufacturing – and into more than 50 million vehicles every year. For more information on Adient,
please visit adient.com
ADIENT • FISCAL FIRST QUARTER 2018 EARNINGS • 2
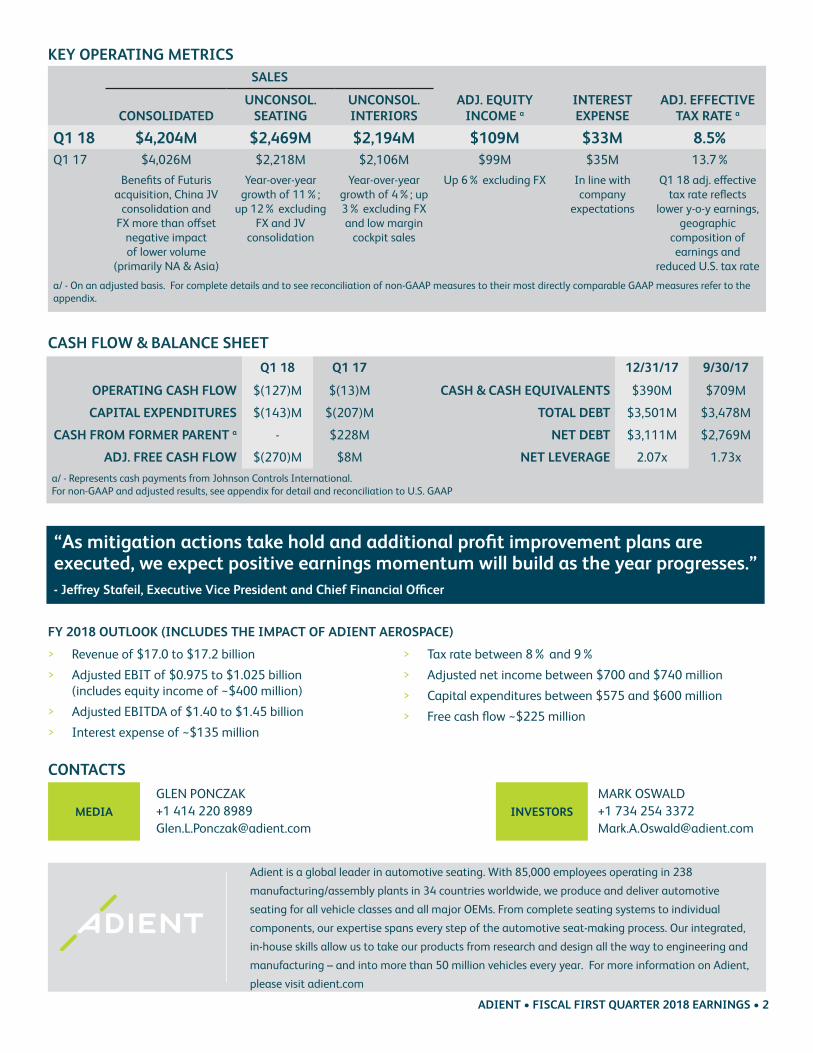
SALES
CONSOLIDATED UNCONSOL.
SEATINGUNCONSOL. INTERIORS
ADJ. EQUITY INCOME a
INTEREST EXPENSE
ADJ. EFFECTIVE TAX RATE a
Q1 18 $4,204M $2,469M $2,194M $109M $33M 8.5%Q1 17 $4,026M $2,218M $2,106M $99M $35M 13.7%
Benefits of Futuris acquisition, China JV
consolidation and FX more than offset
negative impact of lower volume
(primarily NA & Asia)
Year-over-year growth of 11%;
up 12% excluding FX and JV
consolidation
Year-over-year growth of 4%; up 3% excluding FX and low margin
cockpit sales
Up 6% excluding FX In line with company
expectations
Q1 18 adj. effective tax rate reflects
lower y-o-y earnings, geographic
composition of earnings and
reduced U.S. tax rate
a/ - On an adjusted basis. For complete details and to see reconciliation of non-GAAP measures to their most directly comparable GAAP measures refer to the appendix.
KEY OPERATING METRICS
Q1 18 Q1 17 12/31/17 9/30/17
OPERATING CASH FLOW $(127)M $(13)M CASH & CASH EQUIVALENTS $390M $709M
CAPITAL EXPENDITURES $(143)M $(207)M TOTAL DEBT $3,501M $3,478M
CASH FROM FORMER PARENT a - $228M NET DEBT $3,111M $2,769M
ADJ. FREE CASH FLOW $(270)M $8M NET LEVERAGE 2.07x 1.73xa/ - Represents cash payments from Johnson Controls International.For non-GAAP and adjusted results, see appendix for detail and reconciliation to U.S. GAAP
CASH FLOW & BALANCE SHEET
FY 2018 OUTLOOK (INCLUDES THE IMPACT OF ADIENT AEROSPACE)
> Revenue of $17.0 to $17.2 billion
> Adjusted EBIT of $0.975 to $1.025 billion (includes equity income of ~$400 million)
> Adjusted EBITDA of $1.40 to $1.45 billion
> Interest expense of ~$135 million
> Tax rate between 8% and 9%
> Adjusted net income between $700 and $740 million
> Capital expenditures between $575 and $600 million
> Free cash flow ~$225 million
“As mitigation actions take hold and additional profit improvement plans are executed, we expect positive earnings momentum will build as the year progresses.”- Jeffrey Stafeil, Executive Vice President and Chief Financial Officer
Cautionary Statement Regarding Forward-Looking Statements:
Adient has made statements in this document that are forward-looking and, therefore, are subject to risks and uncertainties. All statements in this document other than statements of historical fact are statements that are, or could be, deemed “forward-looking statements” within the meaning of the Private Securities Litigation Reform Act of 1995. In this document, statements regarding Adient’s future financial position, sales, costs, earnings, cash flows, other measures of results of operations, capital expenditures or debt levels and plans, objectives, outlook, targets, guidance or goals are forward-looking statements. Words such as “may,” “will,” “expect,” “intend,” “estimate,” “anticipate,” “believe,” “should,” “forecast,” “project” or “plan” or terms of similar meaning are also generally intended to identify forward-looking statements. Adient cautions that these statements are subject to numerous important risks, uncertainties, assumptions and other factors, some of which are beyond Adient’s control, that could cause Adient’s actual results to differ materially from those expressed or implied by such forward-looking statements, including, among others, risks related to: the ability of Adient Aerospace to successfully implement its strategic initiatives or realize the expected benefits of the joint venture, the impact of tax reform legislation through the Tax Cuts and Jobs Act, the ability of Adient to meet debt service requirements, the ability and terms of financing, general economic and business conditions, the strength of the U.S. or other economies, automotive vehicle production levels, mix and schedules, energy and commodity prices, the availability of raw materials and component products, currency exchange rates, the ability of Adient to effectively integrate the Futuris business, and cancellation of or changes to commercial arrangements. A detailed discussion of risks related to Adient’s business is included in the section entitled “Risk Factors” in Adient’s Annual Report on Form 10-K for the fiscal year ended September 30, 2017 filed with the SEC on November 22, 2017 (“FY17 Form 10-K”) and quarterly reports on Form 10-Q filed with the SEC, available at www.sec.gov. Potential investors and others should consider these factors in evaluating the forward-looking statements and should not place undue reliance on such statements. The forward-looking statements included in this document are made only as of the date of this document, unless otherwise specified, and, except as required by law, Adient assumes no obligation, and disclaims any obligation, to update such statements to reflect events or circumstances occurring after the date of this document.
In addition, this document includes certain projections provided by Adient with respect to the anticipated future performance of Adient’s businesses. Such projections reflect various assumptions of Adient’s management concerning the future performance of Adient’s businesses, which may or may not prove to be correct. The actual results may vary from the anticipated results and such variations may be material. Adient does not undertake any obligation to update the projections to reflect events or circumstances or changes in expectations after the date of this document or to reflect the occurrence of subsequent events. No representations or warranties are made as to the accuracy or reasonableness of such assumptions or the projections based thereon.
Use of Non-GAAP Financial Information:
This document also contains non-GAAP financial information because Adient’s management believes it may assist investors in evaluating Adient’s on-going operations. Adient believes these non-GAAP disclosures provide important supplemental information to management and investors regarding financial and business trends relating to Adient’s financial condition and results of operations. Investors should not consider these non-GAAP measures as alternatives to the related GAAP measures. A reconciliation of non-GAAP measures to their closest GAAP equivalent are included in the appendix. Reconciliations of non-GAAP measures related to FY2018 guidance have not been provided due to the unreasonable efforts it would take to provide such reconciliations.
ADIENT • FISCAL FIRST QUARTER 2018 EARNINGS • 3

AppendixPage 1
Adient plcCondensed Consolidated Statements of Income (Loss)
(Unaudited)
Three Months EndedDecember 31,
(in millions, except per share data) 2017 2016*Net sales $ 4,204 $ 4,026Cost of sales 4,002 3,676
Gross profit 202 350Selling, general and administrative expenses 196 217Equity income 96 94
Earnings before interest and income taxes 102 227Net financing charges 33 35
Income before income taxes 69 192Income tax provision 265 28
Net income (loss) (196) 164Income attributable to noncontrolling interests 20 22
Net income (loss) attributable to Adient $ (216) $ 142
Diluted earnings per share $ (2.32) $ 1.51
Shares outstanding at period end 93.3 93.7Diluted weighted average shares 93.2 93.9
* As disclosed at 2017 fiscal year end, prior period results have been revised to adjust equity income for inappropriately capitalized engineering costs at one of our non-consolidated joint ventures and to adjust net sales and cost of sales to present certain components of a contract on a net basis. See footnote 4 for more information on these revisions.

AppendixPage 2
Adient plcCondensed Consolidated Statements of Financial Position
(Unaudited)
(in millions)December 31,
2017September 30,
2017AssetsCash and cash equivalents $ 390 $ 709Accounts receivable - net 2,074 2,224Inventories 762 735Other current assets 851 831
Current assets 4,077 4,499
Property, plant and equipment - net 2,546 2,502Goodwill 2,545 2,515Other intangible assets - net 533 543Investments in partially-owned affiliates 1,924 1,793Other noncurrent assets 1,018 1,318
Total assets $ 12,643 $ 13,170
Liabilities and Shareholders' EquityShort-term debt $ 40 $ 38Accounts payable and accrued expenses 3,096 3,402Other current liabilities 857 888
Current liabilities 3,993 4,328
Long-term debt 3,461 3,440Other noncurrent liabilities 731 782Redeemable noncontrolling interests 29 28Shareholders' equity attributable to Adient 4,108 4,279Noncontrolling interests 321 313Total liabilities and shareholders' equity $ 12,643 $ 13,170
AppendixPage 3
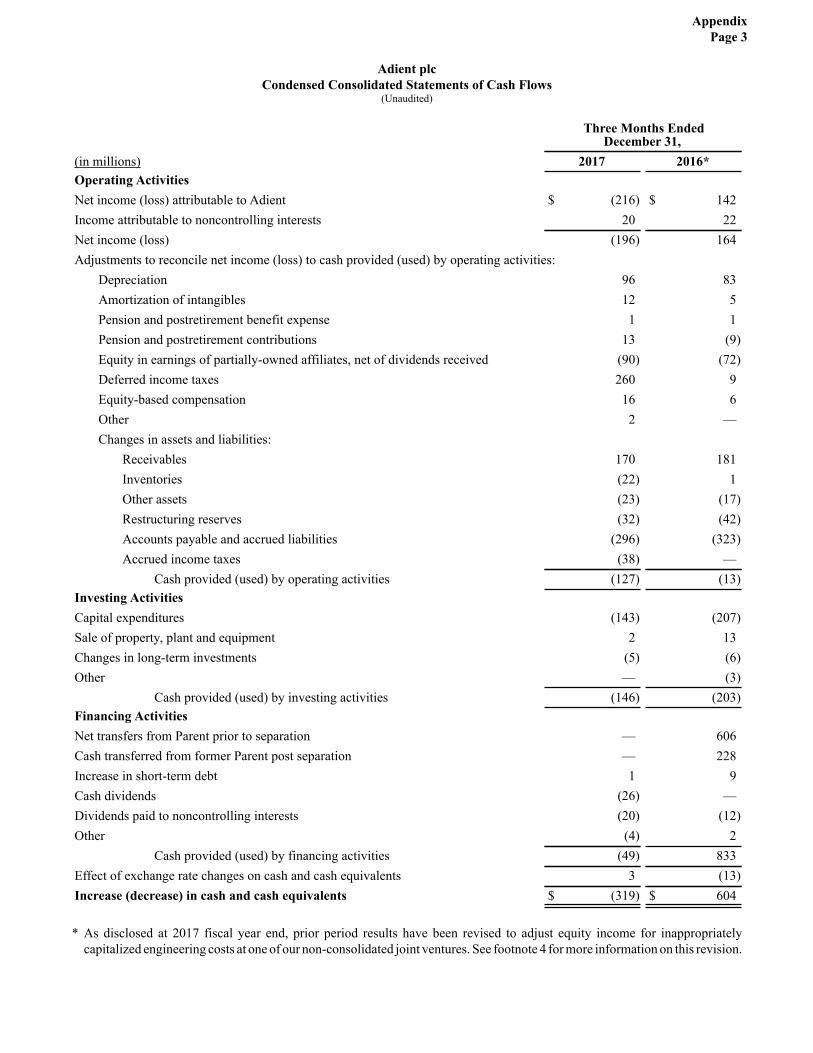
Adient plcCondensed Consolidated Statements of Cash Flows
(Unaudited)
Three Months EndedDecember 31,
(in millions) 2017 2016*Operating ActivitiesNet income (loss) attributable to Adient $ (216) $ 142Income attributable to noncontrolling interests 20 22Net income (loss) (196) 164Adjustments to reconcile net income (loss) to cash provided (used) by operating activities:
Depreciation 96 83Amortization of intangibles 12 5Pension and postretirement benefit expense 1 1Pension and postretirement contributions 13 (9)Equity in earnings of partially-owned affiliates, net of dividends received (90) (72)Deferred income taxes 260 9Equity-based compensation 16 6Other 2 —Changes in assets and liabilities:
Receivables 170 181Inventories (22) 1Other assets (23) (17)Restructuring reserves (32) (42)Accounts payable and accrued liabilities (296) (323)Accrued income taxes (38) —
Cash provided (used) by operating activities (127) (13)Investing ActivitiesCapital expenditures (143) (207)Sale of property, plant and equipment 2 13Changes in long-term investments (5) (6)Other — (3)
Cash provided (used) by investing activities (146) (203)Financing ActivitiesNet transfers from Parent prior to separation — 606Cash transferred from former Parent post separation — 228Increase in short-term debt 1 9Cash dividends (26) —Dividends paid to noncontrolling interests (20) (12)Other (4) 2
Cash provided (used) by financing activities (49) 833Effect of exchange rate changes on cash and cash equivalents 3 (13)Increase (decrease) in cash and cash equivalents $ (319) $ 604
* As disclosed at 2017 fiscal year end, prior period results have been revised to adjust equity income for inappropriately capitalized engineering costs at one of our non-consolidated joint ventures. See footnote 4 for more information on this revision.
AppendixPage 4
Footnotes
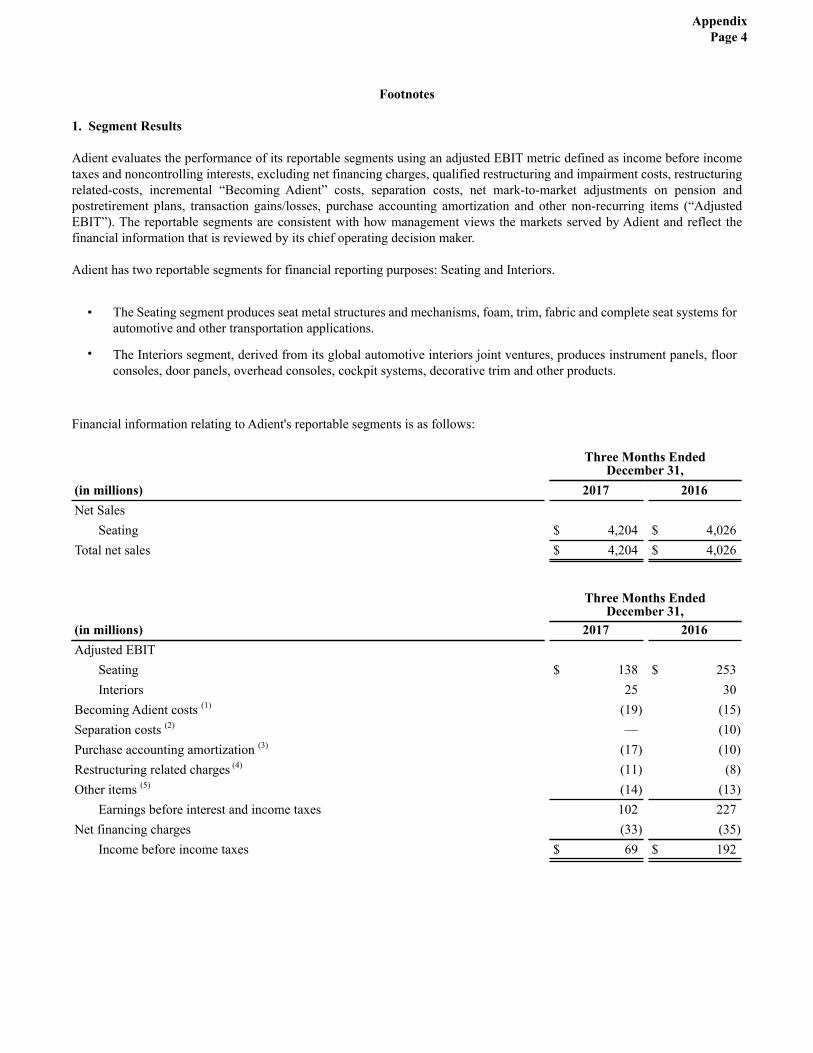
1. Segment Results
Adient evaluates the performance of its reportable segments using an adjusted EBIT metric defined as income before income taxes and noncontrolling interests, excluding net financing charges, qualified restructuring and impairment costs, restructuring related-costs, incremental “Becoming Adient” costs, separation costs, net mark-to-market adjustments on pension and postretirement plans, transaction gains/losses, purchase accounting amortization and other non-recurring items (“Adjusted EBIT”). The reportable segments are consistent with how management views the markets served by Adient and reflect the financial information that is reviewed by its chief operating decision maker.
Adient has two reportable segments for financial reporting purposes: Seating and Interiors.
• The Seating segment produces seat metal structures and mechanisms, foam, trim, fabric and complete seat systems for automotive and other transportation applications.
• The Interiors segment, derived from its global automotive interiors joint ventures, produces instrument panels, floor consoles, door panels, overhead consoles, cockpit systems, decorative trim and other products.
Financial information relating to Adient's reportable segments is as follows:
Three Months Ended
December 31,(in millions) 2017 2016Net Sales
Seating $ 4,204 $ 4,026Total net sales $ 4,204 $ 4,026
Three Months EndedDecember 31,
(in millions) 2017 2016Adjusted EBIT
Seating $ 138 $ 253Interiors 25 30
Becoming Adient costs (1) (19) (15)Separation costs (2) — (10)Purchase accounting amortization (3) (17) (10)Restructuring related charges (4) (11) (8)Other items (5) (14) (13)
Earnings before interest and income taxes 102 227Net financing charges (33) (35)
Income before income taxes $ 69 $ 192

AppendixPage 5
(1) Reflects incremental expenses associated with becoming an independent company. Includes non-cash costs of $6 million and $13 million in the three months ended December 31, 2017 and 2016, respectively.
(2) Reflects expenses associated with and incurred prior to the separation from the former Parent. (3) Reflects amortization of intangible assets including those related to the YFAI joint venture recorded within equity income.(4) Reflects restructuring related charges for costs that are directly attributable to restructuring activities, but do not meet
the definition of restructuring under ASC 420.(5) First quarter 2018 reflects $6 million of integration costs associated with the acquisition of Futuris and $8 million related
to the impact of the U.S. tax reform legislation at YFAI. First quarter 2017 reflects primarily the $12 million of initial funding of the Adient foundation.
2. Earnings Per Share
The following table reconciles the numerators and denominators used to calculate basic and diluted earnings per share:
Three Months EndedDecember 31
(in millions) 2017 2016Income available to shareholdersNet income (loss) attributable to Adient $ (216) $ 142Basic and diluted income available to shareholders $ (216) $ 142
Weighted average shares outstandingBasic weighted average shares outstanding 93.2 93.7Effect of dilutive securities:
Stock options, unvested restricted stock and unvested performance share awards — 0.2Diluted weighted average shares outstanding 93.2 93.9

AppendixPage 6
3. Non-GAAP Measures
Adjusted EBIT, Adjusted EBIT margin, Adjusted net income attributable to Adient, Adjusted effective tax rate, Adjusted earnings per share, Adjusted equity income, Adjusted free cash flow, Net debt and Net leverage as well as other measures presented on an adjusted basis are not recognized terms under U.S. GAAP and do not purport to be alternatives to the most comparable U.S. GAAP amounts. Since all companies do not use identical calculations, our definition and presentation of these measures may not be comparable to similarly titled measures reported by other companies. Management uses the identified non-GAAP measures to evaluate the operating performance of the Company and its business segments and to forecast future periods. Management believes these non-GAAP measures may assist investors and other interested parties in evaluating Adient's on-going operations and provide important supplemental information to management and investors regarding financial and business trends relating to Adient's financial condition and results of operations. Investors should not consider these non-GAAP measures as alternatives to the related GAAP measures. Reconciliations of non-GAAP measures to their closest U.S. GAAP equivalent are presented below. Reconciliations of non-GAAP measures related to FY 2018 guidance have not been provided due to the unreasonable efforts it would take to provide such reconciliations.
• Adjusted EBIT is defined as income before income taxes and noncontrolling interests excluding net financing charges, restructuring, impairment and related costs, purchase accounting amortization, transaction gains/losses, expenses associated with becoming an independent company, other significant non-recurring items, and net mark-to-market adjustments on pension and postretirement plans. General corporate and other overhead expenses are allocated to business segments in determining Adjusted EBIT. Adjusted EBIT margin is Adjusted EBIT as a percentage of net sales.
• Adjusted net income attributable to Adient is defined as net income attributable to Adient excluding restructuring, impairment and related costs, purchase accounting amortization, transaction gains/losses, Becoming Adient/separation costs, other significant non-recurring items, net mark-to-market adjustments on pension and postretirement plans, and the tax impact of these items and other discrete taxes charges/benefits.
• Adjusted effective tax rate is defined as adjusted income tax provision as a percentage of adjusted income before income taxes.
• Adjusted earnings per share is defined as Adjusted net income attributable to Adient divided by diluted weighted average shares.
• Adjusted equity income is defined as equity income excluding amortization of Adient's intangible assets related to its non-consolidated joint ventures and other unusual items impacting equity income.
• Adjusted free cash flow is defined as cash from operating activities plus payments from our former Parent (related to reimbursements for cash management actions and capital expenditures), less capital expenditures.
• Net debt is calculated as gross debt less cash and cash equivalents.• Net leverage is calculated as net debt divided by the last twelve months of adjusted EBITDA.
Summarized Income Statement Information
Three Months Ended December 31,2017 2016
(in millions, except per share data) As reported As adjusted As reported As adjustedNet sales $ 4,204 $ 4,204 $ 4,026 $ 4,026Equity income 96 109 94 99Earnings before interest and income taxes 102 163 227 283Net financing charges 33 33 35 35Income before income taxes 69 130 192 248Income tax provision 265 11 28 34Net income (loss) attributable to Adient (216) 99 142 192Diluted earnings per share (2.32) 1.06 1.51 2.04

AppendixPage 7
The following table reconciles equity income as reported to adjusted equity income:
Three Months EndedDecember 31,
(in millions) 2017 2016Equity income as reported $ 96 $ 94Purchase accounting amortization (3) 5 5US tax reform legislation at YFAI (7) 8 —Adjusted equity income $ 109 $ 99
The following table reconciles net income attributable to Adient to adjusted EBIT:
Three Months EndedDecember 31,
(in millions) 2017 2016Net income (loss) attributable to Adient $ (216) $ 142Income attributable to noncontrolling interests 20 22Income tax provision 265 28Financing charges 33 35
Earnings before interest and income taxes 102 227Becoming Adient (1) 19 15Separation costs (1) — 10Purchase accounting amortization (3) 17 10Restructuring related charges (4) 11 8Other items (7) 14 13
Adjusted EBIT $ 163 $ 283
Net sales $ 4,204 $ 4,026
Adjusted EBIT $ 163 $ 283
Adjusted EBIT margin 3.9% 7.0%
Adjusted EBIT by segment:Seating $ 138 $ 253Interiors 25 30
$ 163 $ 283

AppendixPage 8
The following table reconciles income before income taxes to adjusted income before income taxes and presents the related effective tax rate and adjusted effective tax rate:
Three Months Ended December 31,2017 2016
(in millions, except effective tax rate)
Incomebeforeincometaxes
Taximpact
Effectivetax rate
Incomebeforeincometaxes
Taximpact
Effectivetax rate
As reported $ 69 $ 265 * $ 192 $ 28 14.6%Adjustments (8) 61 (254) * 56 6 10.7%
As adjusted $ 130 $ 11 8.5% $ 248 $ 34 13.7%* Measure not meaningful.
The following table reconciles net income attributable to Adient to adjusted net income attributable to Adient and adjusted net income attributable to Adient:
Three Months EndedDecember 31,
(in millions) 2017 2016Net income (loss) attributable to Adient $ (216) $ 142Becoming Adient (1) 19 15Separation costs (1) — 10Purchase accounting amortization (3) 17 10Restructuring related charges (4) 11 8Other items (7) 14 13Tax impact of above adjustments and other tax items (8) 254 (6)
Adjusted net income attributable to Adient $ 99 $ 192
The following table reconciles diluted earnings per share as reported to adjusted diluted earnings per share:
Three Months EndedDecember 31,
2017 2016
Diluted earnings per share as reported $ (2.32) $ 1.51Becoming Adient (1) 0.20 0.16Separation costs (1) — 0.10Purchase accounting amortization (3) 0.19 0.10Restructuring related charges (4) 0.12 0.09Other items (7) 0.15 0.14Tax impact of above adjustments and other tax items (8) 2.72 (0.06)
Adjusted diluted earnings per share $ 1.06 $ 2.04

AppendixPage 9
The following table reconciles net income attributable to Adient to adjusted EBITDA:
Three Months Ended Twelve Months EndedDecember 31, December 31, December 31, September 30,
(in millions) 2017 2016 2017 2017Net income (loss) attributable to Adient $ (216) $ 142 $ 519 $ 877Income attributable to noncontrolling interests 20 22 83 85Income tax provision 265 28 336 99Net financing charges 33 35 130 132Becoming Adient (1) 19 15 99 95Separation costs (1) — 10 — 10Restructuring and impairment costs (2) — — 46 46Purchase accounting amortization (3) 17 10 50 43Restructuring related charges (4) 11 8 40 37Pension mark-to-market (5) — — (45) (45)Gain on previously held interest (6) — — (151) (151)Other items (7) 14 13 17 16Stock based compensation (9) 10 4 35 29Depreciation (10) 94 83 343 332
Adjusted EBITDA $ 267 $ 370 $ 1,502 $ 1,605
The following table presents net debt and net leverage ratio calculations:
(in millions, except net leverage)December 31,
2017September 30,
2017Cash $ 390 $ 709Total debt 3,501 3,478Net debt $ 3,111 $ 2,769
Adjusted EBITDA (last twelve months) $ 1,502 $ 1,605
Net leverage: 2.07 x 1.73 x
The following table reconciles cash from operating activities to adjusted free cash flow:
Three Months EndedDecember 31,
(in millions) 2017 2016Operating cash flow $ (127) $ (13)Capital expenditures (143) (207)Cash from former Parent — 228Adjusted free cash flow $ (270) $ 8

AppendixPage 10
The following table reconciles adjusted EBITDA to free cash flow:
ThreeMonths EndedDecember 31,
(in millions) 2017Adjusted EBITDA $ 267(-) Interest expense (33)(-) Taxes (43)(-) Restructuring (cash) (41)(+/-) Change in trade working capital (55)(+/-) Net equity in earnings (103)(+/-) Other (119)Operating cash flow $ (127)Capital expenditures (143)Adjusted free cash flow $ (270)
(1) Becoming Adient costs reflect incremental expenses associated with becoming an independent company. Separation costs reflect expenses associated with, and incurred prior to, the separation from the former Parent. Of the $19 million of Becoming Adient costs in the three months ended December 31, 2017, $13 million is included within cost of sales and $6 million is included within selling, general and administrative expenses. Of the $15 million of Becoming Adient costs in the three months ended December 31, 2016, $9 million is included within cost of sales and $6 million is included within selling, general and administrative expenses. The $10 million of separation costs in the three months ended December 31, 2016 is included within selling, general and administrative expenses. Of the $95 million of Becoming Adient costs in the twelve months ended September 30, 2017, $55 million is included within cost of sales and 40 million is included within selling, general and administrative expenses.
(2) Reflects qualified restructuring charges for costs that are directly attributable to restructuring activities and meet the definition of restructuring under ASC 420.
(3) Reflects amortization of intangible assets including those related to the YFAI joint venture recorded within equity income. Of the $17 million in the three months ended December 31, 2017, $12 million is included within selling, general and administrative expenses and $5 million is included within equity income. Of the $10 million in the three months ended December 31, 2016, $5 million is included within selling, general and administrative expenses and $5 million is included within equity income. Of the $43 million in the twelve months ended September 31, 2017, $20 million is included within selling, general and administrative expenses, $1 million is included in cost of sales and $22 million is included within equity income.
(4) Reflects non-qualified restructuring charges for costs that are directly attributable to restructuring activities, but do not meet the definition of restructuring under ASC 420. The $11 million in the three months ended December 31, 2017 is included within cost of sales. Of the $8 million in the three months ended December 31, 2016, $6 million is included within cost of sales and $2 million is included within selling, general and administrative expenses. Of the $37 million in the twelve months ended September 30, 2017, $34 million is included within cost of sales, $2 million is included within selling, general and administrative expenses and $1 million is included within equity income.
(5) Reflects net mark-to-market adjustments on pension and postretirement plans. Of the $45 million gain in fiscal 2017, $4 million is included within cost of sales and $41 million is included within selling, general and administrative expenses.
(6) In 2017, an amendment to the rights agreement with a Seating affiliate in China was finalized, giving Adient control of the previously non-consolidated JV. Adient began consolidating the affiliate in July 2017 and was required to apply purchase accounting, including recognizing a gain on our previously held interest, which has been recorded in equity income.
AppendixPage 11
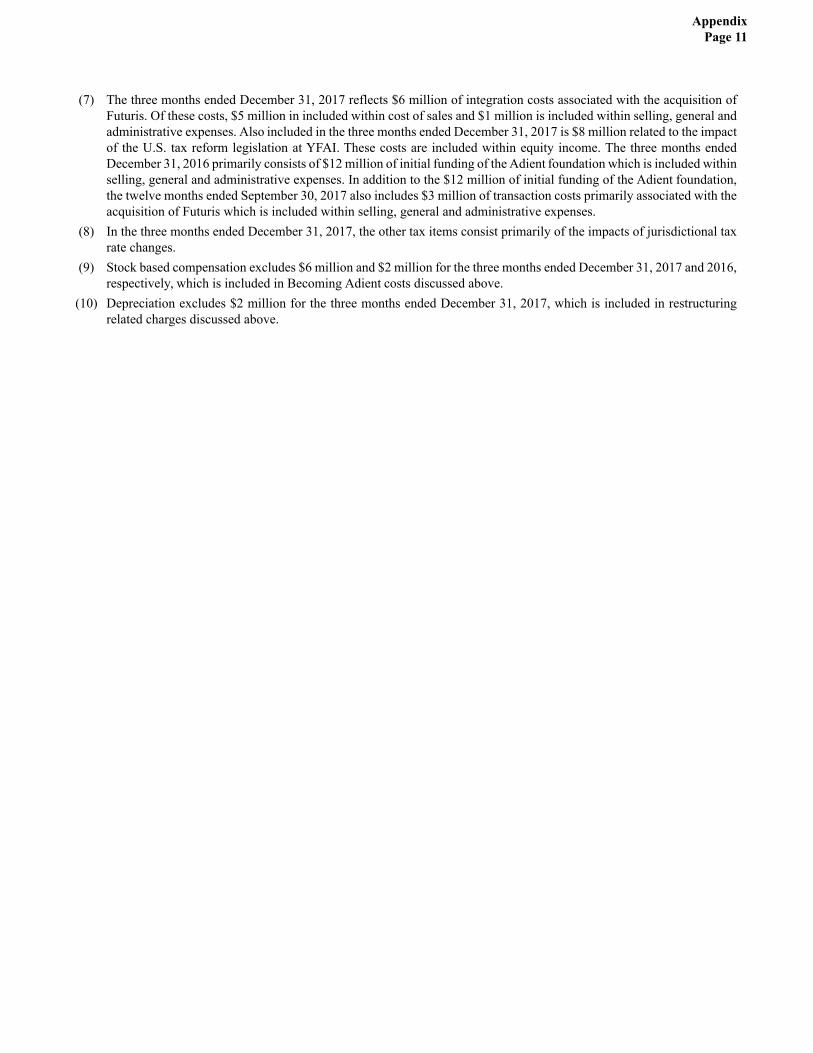
(7) The three months ended December 31, 2017 reflects $6 million of integration costs associated with the acquisition of Futuris. Of these costs, $5 million in included within cost of sales and $1 million is included within selling, general and administrative expenses. Also included in the three months ended December 31, 2017 is $8 million related to the impact of the U.S. tax reform legislation at YFAI. These costs are included within equity income. The three months ended December 31, 2016 primarily consists of $12 million of initial funding of the Adient foundation which is included within selling, general and administrative expenses. In addition to the $12 million of initial funding of the Adient foundation, the twelve months ended September 30, 2017 also includes $3 million of transaction costs primarily associated with the acquisition of Futuris which is included within selling, general and administrative expenses.
(8) In the three months ended December 31, 2017, the other tax items consist primarily of the impacts of jurisdictional tax rate changes.
(9) Stock based compensation excludes $6 million and $2 million for the three months ended December 31, 2017 and 2016, respectively, which is included in Becoming Adient costs discussed above.
(10) Depreciation excludes $2 million for the three months ended December 31, 2017, which is included in restructuring related charges discussed above.

AppendixPage 12
4. Revisions to Previously Reported Amounts
As disclosed at 2017 fiscal year end, Adient revised previously reported results to adjust equity income from a non-consolidated joint venture related to engineering costs that were inappropriately capitalized. Adient also revised previously reported net sales and cost of sales to present certain components of a contract on a net basis. The following tables disclose the quarterly impact for the three months ended December 31, 2016 of such previously disclosed revisions. Adient assessed the materiality of these misstatements on prior periods’ financial statements in accordance with SEC Staff Accounting Bulletin ("SAB") No. 99, Materiality, codified in ASC 250 ("ASC 250"), Presentation of Financial Statements, and concluded that these misstatements were not material to any prior annual or interim periods. Accordingly, in accordance with ASC 250 (SAB No. 108, Considering the Effects of Prior Year Misstatements when Quantifying Misstatements in Current Year Financial Statements), the consolidated financial statements as of and for the three months ended December 31, 2016, which are presented herein, have been revised. The following table illustrates the effect of these revisions on impacted line items in Adient's consolidated financial statements.
Consolidated Statements of Income (Loss)Three Months Ended December 31, 2016
(in millions, except per share data) As Reported Adjustment As RevisedNet sales $ 4,038 $ (12) $ 4,026Cost of sales 3,688 (12) 3,676Equity income 101 (7) 94Earnings before interest and income taxes 234 (7) 227Income before income taxes 199 (7) 192Net income (loss) 171 (7) 164Net income (loss) attributable to Adient 149 (7) 142
Earnings per share:Diluted $ 1.59 $ (0.08) $ 1.51
Consolidated Statements of Cash FlowsThree Months Ended December 31, 2016
(in millions) As Reported Adjustment As RevisedOperating ActivitiesNet income (loss) $ 171 $ (7) $ 164Equity in earnings of partially-owned affiliates, net of dividends received (79) 7 (72)