
FY 2017 Results Presentation - mediaset.itplit... · Strong audience share and Total Audience...
25
FY 2017 Results Presentation Milan, 24 th April 2018 FY 2017 Results Presentation Milan, 24 th April 2018
-
Upload
duongxuyen -
Category
Documents
-
view
214 -
download
0
Transcript of FY 2017 Results Presentation - mediaset.itplit... · Strong audience share and Total Audience...

FY 2017 Results Presentation
Milan, 24th April 2018
FY 2017 Results Presentation
Milan, 24th April 2018

FY 2017 Results Presentation
Milan, 24th April 2018
Audience & Advertising

gen-1
6
feb-1
6
mar-
16
apr-
16
mag-1
6
giu
-16
lug-1
6
ago-1
6
set-
16
ott
-16
nov-1
6
dic
-16
gen-1
7
feb-1
7
mar-
17
apr-
17
mag-1
7
giu
-17
lug-1
7
ago-1
7
set-
17
ott
-17
nov-1
7
dic
-17
gen-1
8
feb-1
8
mar-
18
services
good
TOTAL
Inflation Rate (y.o.t monhtly var.) source: ISTAT
MACRO-ECONOMIC KEY INDICATORS
| 3 |
GDP & HH EXPENDITURE GOOD & SERVICE CONSUMPTION
CONSUMPTION PRICES GOOD & SERVICE CONSUMPTION BY MACRO-SECTOR
1.1
y.o.y montly growth rate, Source: CONFCOMMERCIO y.o.y growth rate forecast 2018
GDP HH EXPENDITURE
ITALY │Macroeconomic scenario - 2017 & 2018 Outlook Key Economic Indicators
GOODS: - 1.4%
SERVICES + 2.1%
AVG: - 0.3%
2017 1Q 2018
Recreational goods and services + 1.0% +0.3%
Hotels and eating out +2.7% +2.5%
Mobility goods and services -0.7% -3.8%
Comunic. Goods and services +2.7% +0.9%
Clothing and shoes - 0.2% - 1.7%
Home goods and services + 0.7% +0.3%
Personal care goods & services +0.6% + 0.9%
Food, beverages and tobacco - 0.4% - 1.2%
3M 2017: AVG: +0.8
1.4 1.5 1.5 1.3
ISTAT OCSE
CONFINDUSTRIA INTESA S. PAOLO
1.3 1.0
1.3 1.0
ISTAT OCSE
CONFINDUSTRIA INTESA S. PAOLO
-1,0
-0,5
0,0
0,5
1,0
1,5
2,0
2,5
| 4 |
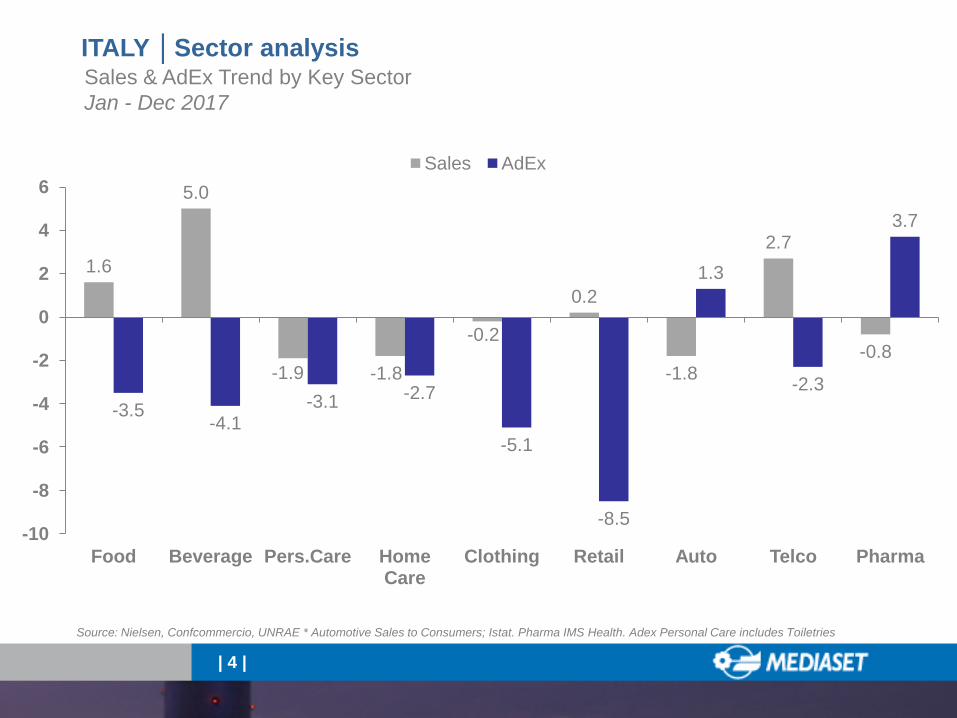
Sales & AdEx Trend by Key Sector
Jan - Dec 2017
1.6
5.0
-1.9 -1.8
-0.2
0.2
-1.8
2.7
-0.8
-3.5 -4.1
-3.1 -2.7
-5.1
-8.5
1.3
-2.3
3.7
-10
-8
-6
-4
-2
0
2
4
6
Food Beverage Pers.Care Home Care
Clothing Retail Auto Telco Pharma
Sales AdEx
ITALY │Sector analysis
Source: Nielsen, Confcommercio, UNRAE * Automotive Sales to Consumers; Istat. Pharma IMS Health. Adex Personal Care includes Toiletries

CONFIDENCE INDEXES – CONSUMERS, MANUFACTURERS &
RETAILERS
2,086.9 2,095.4
FY 2016 FY 2017
+ 0.4%
TOTAL ADVERTISING MARKET -1.9% (yoy)
MEDIASET FY 2017│Total advertising revenues FY 2017 vs FY 2016 (mio Eur)
| 5 |

3.3
23.0
15.5
8.5 11.7
3.6
8.1
5.5
20.7 Food
-4.9%
No Food
-1.8%
TLC
-2.6% Auto
+3.8%
Media
-7.6%
Pharma
+8.6%
Retail
-17.8%
Other
+7.5
MS TREND better than Total Adv Market
MS SHARE better than Total Adv Market
2.3
Finance
-3.3%
MEDIASET FY 2017│Advertising breakdown by sector FY 2017 vs FY2016
Source: Nielsen
| 6 |

2.7
35.0
10.2 8.5
12.5
31.1
Mediaset Rai La7
26.3 24.7
2.5
25.9 23.5
2.1
Mediaset DTT (Free+Pay)
Rai DTT Discovery Sky Channels Fox Channels La7 D
8.9 6.8 8.1 8.1 1.5 0.7
9.1 7.6 8.5 8.8 1.4 0.6
Sky+Fox +0.6
Mediaset -0.2
La7 -0.4
Rai -0.4
Other -0.1
Discovery +0.5
CORE CHANNELS
MULTICHANNELS
2016 2017
MEDIASET FY 2017│Audience performance Core channels vs multichannels, commercial target (15-64 yrs, 24H)
Source: Auditel, Live+Vosdal
| 7 |

| 8 |
FY17 total advertising revenues up +0,4% yoy including Radio (since H2 2016);
in each market segment (TV, Digital & Radio) Mediaset is outperforming the market
Leading TV audience share: 35.0% on commercial target (15-64 yrs, 24 H)
FY2017 advertising market share up by 80 bps vs FY2016
At the FTA business, Mediaset is achieving single digit price per GRPs inflation vs
other market players still pushing for deflation
Radio revenue growth double digit up
MEDIASET FY 2017│Advertising and audience performance

| 9 |
In Italy slow start of the advertising market due to political election and
weak private consumption
Strong audience share and Total Audience growth
Mediaset market share in Q1 flat vs last year
Radio advertising still strong
MEDIASET│Hints on first part of 2018
CONFIDENCE INDEXES – CONSUMERS, MANUFACTURERS &
RETAILERS
| 10 |
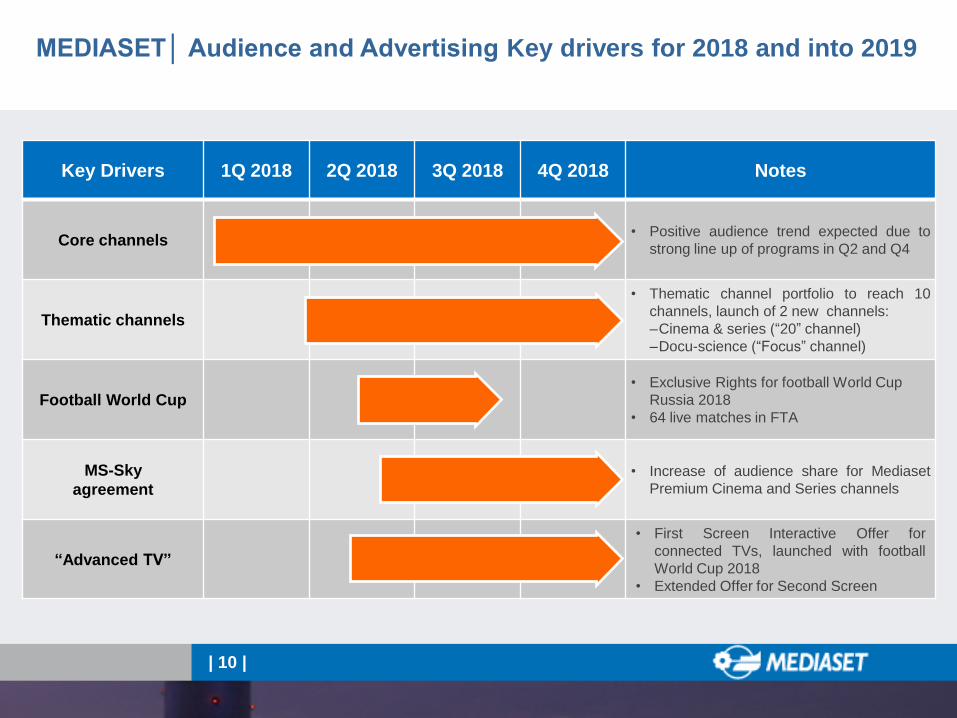
Key Drivers 1Q 2018 2Q 2018 3Q 2018 4Q 2018 Notes
Core channels • Positive audience trend expected due to
strong line up of programs in Q2 and Q4
Thematic channels
• Thematic channel portfolio to reach 10
channels, launch of 2 new channels:
–Cinema & series (“20” channel)
–Docu-science (“Focus” channel)
Football World Cup • Exclusive Rights for football World Cup
Russia 2018
• 64 live matches in FTA
MS-Sky
agreement
• Increase of audience share for Mediaset
Premium Cinema and Series channels
“Advanced TV”
• First Screen Interactive Offer for
connected TVs, launched with football
World Cup 2018
• Extended Offer for Second Screen
MEDIASET│ Audience and Advertising Key drivers for 2018 and into 2019

FY 2017 Results Presentation
Milan, 24th April 2018
Financials

MEDIASET GROUP FY 2017 | P&L Highlights
(Euro mln) FY 2016 FY 2017
Net Consolidated Revenues 3,667.0 3,631.0
Italy 2,675.9 2,636.2
Spain 992.0 996.3
EBITDA 1,171.9 1,412.6
Italy 730.5 963.6
Spain 441.8 449.1
EBIT (189.3) 316.5
Italy (413.7) 70.9
Spain 224.4 245.3
Net Profit (294.5) 90.5
Net Profit Adjusted (42.6) 115.0
Group Net Financial Position (1,162.4) (1,392.2)
Italy (1,339.8) (1,527.5)
Spain 177.4 135.3
| 12 |
* **
* Group FY2016 financials adjusted to exclude impact from non-recurring items (write-downs, PPA, others)
** Group FY2017 financials adjusted to exclude impact from restructuring items (lay-off for 19.5 million euro)

MEDIASET ITALIAN BUSINESS FY 2017 | P&L results
| 13 |
(Euro mln) FY 2016 FY 2017
Net Consolidated Revenues 2,675.9 2,636.2
EBITDA 730.5 963.6
Operating Profit (413.7) 70.9
Operating Profit Adjusted (91.6) 90.4
Financial Income (Losses) (87.5) (27.5)
Associates 0.9 5.5
Pre-Tax Profit (500.3) 48.9
Taxes 103.1 (32.5)
Minorities 17.0 (26.3)
Net Profit (380.1) (9.9)
Net Profit Adjusted (128.2) 14.6
* **
* **
* Italy FY2016 financials adjusted to exclude impact from non-recurring items (write-downs, PPA, others)
** Italy FY2017 financials adjusted to exclude impact from restructuring items (lay-off for 19.5 million euro)

MEDIASET ITALIAN BUSINESS FY 2017 | Integrated Tv activities
| 14 |
(Euro mln) FY 2016 Adjusted
FY 2017 Adjusted
Total Net Revenues 2,603.9 2,555.3
Total Gross advertising revenues 2,086.9 2,095.4
Commissions (301.0) (300.3)
Total Net Advertising Revenues 1,785.9 1,795.1
Pay Tv Revenues 619.8 587.4
Other Revenues 198.2 172.8
Total Costs (2,771.1) (2,554.9)
Personnel Costs (360.9) (362.0)
Other Operating Costs (1,269.6) (1,160.9)
Total Operating Costs (1,630.5) (1,522.9)
Rights Amortisazion (882.2) (767.8)
Other Amortisazion & Depreciation (80.6) (83.9)
Intra-company items (177.7) (180.3)
Operating Profit (167.2) 0.4
* Integrated TV FY2016 financials adjusted to exclude impact from non-recurring items (write-downs, PPA, others)
** Integrated TV FY2017 financials adjusted to exclude impact from restructuring items (lay-off for 19.5 million euro)
* **

MEDIASET ITALIAN BUSINESS FY 2017 | Investments
| 15 |
464.2 394.8
43.6 55.1
(Euro ml.) TV rights and cinema
Technical & immaterial
Total Investments
FY 2017 FY 2016
438.4 519.2

MEDIASET ITALIAN BUSINESS FY 2017 | Cash flow statement
| 16 |
(Euro mln) FY 2016 FY 2017
Initial Net Financial Position (1,051.8) (1,339.8)
Cash Flow from Operation 792.0 891.7
Investment (519.2) (438.4)
Disinvestiments 3.5 7.2
Change in Net Working Capital (CNWC) (461.3) (508.0)
Cash Flow from Core Activities (185.1) (47.5)
Equity (investment)/disinvestment (19.1) (31.4)
Dividends paid (22.7) (88.1)
Dividens received 84.9 93.2
Shares Buyback (15.6) (49.0)
Change in consolidation area (130.4) (64.9)
Total Net Cash Flow (288.0) (187.7)
Final Net Financial Position (31/12) (1,339.8) (1,527.5)
Group Net Financial Position (31/12) (1,162.4) (1,392.2)

FY 2017 Results Presentation
Milan, 24th April 2018
Back Up

MEDIASET ITALIAN BUSINESS FY 2017 | Integrated Tv activities
| 18 |
(Euro mln) FY 2016 FY 2016
Adjusted
FY 2017 Restructuring
Costs FY 2017 Adjusted
Total Net Revenues 2,603.9 2,603.9 2,555.3 2,555.3
Total Costs (3,093.0) (2,771.1) (2,574.4) 19.5 (2,554.9)
Personnel Costs (391.3) (360.9) (381.5) 19.5 (362.0)
Other Operating Costs (1,424.1) (1,269.6) (1,160.9) (1,160.9)
Total Operating Costs (1,815.4) (1,630.5) (1,542.4) (1,522.9)
Rights Amortisazion (1,015.3) (882.2) (767.8) (767.8)
Other Amortisazion & Depreciation (84.7) (80.6) (83.9) (83.9)
Intra-company items (177.7) (177.7) (180.3) (180.3)
Operating Profit (489.1) (167.2) (19.1) 0.4
* **
* Integrated TV FY2016 financials adjusted to exclude impact from non-recurring items (write-downs, PPA, others)
** Integrated TV FY2017 financials adjusted to exclude impact from restructuring items (lay-off for 19.5 million euro)

MEDIASET ITALIAN BUSINESS FY 2017 | P&L results
| 19 |
(Euro mln) FY 2016 FY 2016
Adjusted
FY 2017 FY 2017 Adjusted
Net Consolidated Revenues 2,675.9 2,675.9 2,636.2 2,636.2
EBITDA 730.5 915.3 963.6 983.1
Operating Profit (413.7) (91.6) 70.9 90.4 (
Financial Income (Losses) (87.5) (45.8) (27.5) (27.5)
Associates 0.9 0.9 5.5 5.5
Pre-Tax Profit (500.3) (136.5) 48.9 68.4
Taxes 103.1 13.3 (32.5) (27.5)
Minorities 17.0 (4.9) (26.3) (26.3)
Net Profit (380.1) (128.2) (9.9) 14.6
* **
* Italy FY2016 financials adjusted to exclude impact from non-recurring items (write-downs, PPA, others)
** Italy FY2017 financials adjusted to exclude impact from restructuring items (lay-off for 19.5 million euro)

MEDIASET ITALIAN BUSINESS FY 2017 | EI Towers
| 20 |
(Euro mln) FY 2016 FY 2017
Total Net Revenues 252.7 263.7
Third-Party Revenues 72.0 80.9
Intra-company items 180.7 182.7
Total Costs (177.3) (173.6)
Personnel (43.0) (44.3)
Other Operating Costs (87.0) (85.7)
Other Amortisation & Depreciation (44.2) (41.1)
Intra-company items (3.0) (2.5)
EI Towers Operating Profit 75.4 90.0

MEDIASET SPANISH BUSINESS | Back up Slides

MEDIASET ESPANA FY 2017 | P&L Results
| 22 |
(Euro mln) FY 2016 FY 2017
Net Consolidated Revenues 992.0 996.3
Personnel (105.9) (105.6)
Other Operating Costs (444.3) (441.5)
EBITDA 441.8 449.1
Amortisation & Depreciation (217.4) (203.7)
EBIT 224.4 245.3
Financial Income (loss) (0.1) (1.2)
Associates 1.5 3.3
Pre-Tax Profit 225.8 247.4
Taxes (55.1) (50.1)
Net Profit 171.0 197.5

MEDIASET ESPANA FY 2017 | Investments
| 23 |
160.7 153.9
19.4
(Euro ml.) Tv rights and cinema
Co-production
Total Investments
191.5 187.4
FY 2017 FY 2016
14.2 14.6
Tangible & Intangible fixed assets
16.3

MEDIASET ESPANA FY 2017 | Cash Flow Statement
| 24 |
(Euro mln) FY 2016 FY 2017
Initial Net Financial Position 192.4 177.4
Free Cash Flow 242.5 229.3
- Cash Flow from Operations 406.1 424.2
- Investments/Disinvestiments (191.5) (187.4)
- Change in Net Working Capital (CNWC) 28.0 (7.4)
Change in Equity 1.5 (4.3)
Equity (Investments)/Disinvest. (94.1) (93.7)
Dividends received 2.6 2.3
Dividends paid (167.4) (175.7)
Total Net Cash Flow (15.0) (42.2)
Final Net Financial Position (31/12) 177.4 135.3

Forward-looking Statements
Statements contained in this document, particularly the ones regarding any Mediaset Group
possible or assumed future performance, are or may be forward looking statements and in
this respect they involve some risks and uncertainties.
Mediaset Group actual results and developments may differ materially from the ones
expressed or implied by the above statements depending on a variety of factors.
Any reference to past performance of Mediaset Group shall not be taken as an indication of
future performance.
This announcement does not constitute an offer to sell or the solicitation of an offer to buy
the securities discussed herein.
The executive responsible for the preparation of the Mediaset S.p.A. accounts, Luca
Marconcini, declares that, as per para. 2 art. 154-bis, of the “Testo Unico della Finanza”, that
the accounting information contained in this document corresponds to that contained in the
company’s books.
Investor Relations Department:
Tel: +39 02 2514.7008
Fax: +39 02 2514.6719
Email: [email protected]
WebSite: www.mediaset.it/investor


![Mediaset - Billing Credential[1]](https://static.fdocuments.in/doc/165x107/577d22f21a28ab4e1e9896cc/mediaset-billing-credential1.jpg)