FY 2017 Operating & Capital Budget & 5 Year Capital ......increase in social media followers and...
133
Operating & Capital Budget & 5 Year Capital Improvements Plan Adopted November 7, 2018 2019
Transcript of FY 2017 Operating & Capital Budget & 5 Year Capital ......increase in social media followers and...

Operating & Capital Budget & 5 Year Capital Improvements Plan Adopted November 7, 2018
2019

TABLE OF CONTENTS
INTRODUCTION
Budget Message ...........................................................................................4 About the City of Corpus Christi ..................................................................... 8 History of the Corpus Christi Transportation Authority ................................... 10 Benefits of Public Transportation ................................................................. 13 Community Involvement ............................................................................. 14 Governance ................................................................................................ 16 System Facilities ......................................................................................... 18 Service Area ............................................................................................. 23 Service Map ............................................................................................. 24 Services ................................................................................................... 25 ORGANIZATIONAL STRUCTURE, PROCESSES, AND FINANCIAL POLICIES Executive Management & Organizational Structure ....................................... 27 Financial Policies and Practices .................................................................... 35 Basis of Budget .......................................................................................... 47 Budget Process and Budget Calendar ........................................................... 48 Strategic Planning Process ......................................................................... 49 Strategic Planning Process Flowchart ........................................................... 50 Performance Measures ................................................................................ 51 Fund Balance and Reserves/Contingency Requirements ................................ 52 Sources and Uses of Funds ......................................................................... 54 FINANCIAL AND BUDGET SUMMARY Strategic Plan Overview .............................................................................. 56 Twenty-Year Financial Plan ........................................................................ 57 Annual Operating Budget ............................................................................ 59 Ridership Statistics and Performance Trends ................................................ 69 Capital Budget and Five-Year Capital Plan .................................................... 79 OPERATING DETAIL BUDGET BY DEPARTMENT Departmental Structure ............................................................................... 83 Transportation ........................................................................................... 84 Customer Programs ................................................................................... 86 Purchased Transportation ............................................................................ 88 Service Development .................................................................................. 90 Management Information Systems ............................................................... 92 Vehicle Maintenance ................................................................................... 94 Facilities Maintenance ................................................................................. 96

TABLE OF CONTENTS
Procurement .............................................................................................. 98 Chief Financial Officer ............................................................................... 100 Finance and Accounting ............................................................................ 102 Materials Management .............................................................................. 104 Human Resources ..................................................................................... 106 Administration .......................................................................................... 108 Infrastructure Programs ............................................................................ 110 Marketing & Communications .................................................................... 112 Safety & Security ...................................................................................... 114 Debt Service ............................................................................................. 116 Staples Street Center ................................................................................ 118 Port Ayers Cost Center .............................................................................. 120 Special Projects ........................................................................................ 121 Sub-Recipient Grant Agreements ............................................................... 121 Street Maintenance and Depreciation ......................................................... 122 Detailed Department by Account ............................................................... 123 SUPPLEMENTAL INFORMATION Glossary ................................................................................................... 125 Service Changes ....................................................................................... 132 City demographics and employment statistics ............................................. 133
4
BUDGET MESSAGE
Back to Table of Contents
To the Citizens of the CCRTA service area and the Board of Directors
Corpus Christi Regional Transportation Authority (CCRTA) continues to prioritize transparency in all areas of the organization. We strive to be accountable to the citizens of the communities we serve by being good stewards, measuring our fiscal performance, and cultivating integrity into all aspects of our culture, operations, and services.
CCRTA operates 35 routes: Five express routes, 27 fixed routes, two on-demand response taxi services and one on-demand response shuttle. We also provide the indispensable B-Line Paratransit Service and our growing vanpool services. We drive 841 square miles in nine communities with an estimated 1,338 bus stops, four transfer stations, and three Park & Ride lots. CCRTA served 5.37 million passenger trips as of December 31, 2018.
2018 was a year of planning at CCRTA. We introduced the “Fleet Forward” initiative, a commitment to enhance the rider experience and to transform transportation within the Coastal Bend in the next five-years. The CCRTA’s goal is to deliver a more efficient mobility solution using industry best practices while preserving service with dignity and respect.
Our riders requested expanded weekend services and we responded by expanding Sunday services to mirror our Saturday service schedule. The results have been positive with an increase in ridership.
Park and Ride (free fares to community events) showed exceptional growth this year, especially when we paired our social media efforts online. We showcased the benefits of the free service and promoted the festivals at the same time which resulted in an increase in ridership and increase in event attendance. CCRTA provided free park and ride services to more than ten community events. In addition, our employees volunteered thousands of hours to help support many of the community programs.
CCRTA will continue to transform transportation in 2019 and beyond by partnering with TAMUCC and MV Transportation to provide a pilot autonomous transportation program on campus and pilot flex and express programs. Water transportation, a board priority, will be explored and considered in the coming year.
In 2019, CCRTA leadership will continue to work on our board priorities of fare recovery, safety and security of facilities, innovations, workforce development, public image, transparency, and water transportations services. We will strive in our daily jobs to always adhere to our core values, mission, and vision.
5
Back to Table of Contents
BUDGET MESSAGE
Strategic Plan Our annual budget corresponds to the 20-year financial plan and the board’s priorities. The financial plan is updated annually and also provides the data used to produce the Five-Year Sources and Uses of Fund plan which is instrumental in the budget process as well. Our financial plan format follows the Sources and Uses of Funds format. The operating budget is being funded by current earnings from (4) revenue sources: 1. Operating Revenues 2. Non-Operating Revenues which include sales tax revenues 3. Preventive Maintenance and operational Grant Revenues 4. Income from Investments The uses of funds include: 1. Operating Expenses 2. Capital and Non-Operating Expenditures 3. Debt Program The budget priorities governing the development of the budget are listed below.
Explore service enhancements to smaller cities. Improve/ maintain public image. Maintain transparency efforts Maximize collaboration between private sector and academia. Enhance the customer service experience.
Economic Condition & Outlook In 2015, oil prices dropped which lead to a reduction in job growth. Two years later job growth began to pick up in energy and manufacturing sectors from about 1.2% up to 2.1%. This year job growth is widespread across the region, as it has accelerated to nearly 3.0% post Hurricane Harvey recovery has now matured. Budget Assumptions 1. Sales Tax Revenue – It is assumed that sales tax will have a 9.03% increase due to economic trends forecasted. 2. Service Area – It is assumed that the service area will sustain minimal changes. 3. Service Levels - It is assumed that bus service hours and miles traveled will be funded at budgeted levels and that no major service level changes are presented, but only minor routing changes to better serve key destinations and schedule adjustments to improve on-time performance, transfer connections and balance passenger loads. 4. Staffing Levels - The Full-Time Equivalent (FTE) Staffing Chart on page 32 shows the staffing levels by department. Staffing levels will remain the same in FY 2019 due to no changes in the organization’s needs. 5. Compensation Increases - it was assumed that qualifying bus operators would receive a 5% step increase, while administrative staff and non-qualifying bus operators would receive a 2.5% pay increase. Retirees meanwhile were assumed to receive up to a 2.5% increase. 6. Fuel - Low fuel prices will continue through the end of FY 2019 as predicted by the trend present during the development of the budget.

6
Back to Table of Contents
BUDGET MESSAGE
Internal Budget Goals The FY 2019 Budget was designed to address several internal goals. One of the top highlighted priorities for FY 2019 budget is to overcome the prior operating budget deficits. To help meet this goal department heads were directed to develop department budgets to maintain status quo service level with no new personnel and managing a conservative year. Service Enhancements Optimized overall passenger experience by increasing Sunday frequency, improving transfer connections, and offering more efficient travel options. Public Image CCRTA has maintained the improved public image. We use what is known as a sentiment reader. It works by measuring the words associated with the agency in news, social media, and traditional media. We have seen more positive and neutral sentiment. We have also seen an increase in social media followers and positive engagement. Provided community transportation during evacuation. Provided community transportation for multiple special movements throughout the year. System Expansion Under considerable discernment, preservation is priority at this current state for the organization. System expansion should not occur until the existing system is maintained and stable. Because resources are limited, it becomes necessary to prioritize transportation options. Expanding on the system at the expense of maintaining what already exists will cause decreased mobility in established areas. Protect neighborhoods The CCRTA main objective is to establish transportation systems in that do not deteriorate neighborhood streets. Transportation facilities should not diminish neighborhood character and safety, and neighborhood streets should not be public transportation thoroughfares. The comprehensive plan will serve as the basis for addressing such issues that may arise.

7
Back to Table of Contents
BUDGET MESSAGE
Without the support of our community, stakeholders, and friends, the Corpus Christi Regional
Transportation Authority simply would not run. Thank you for your support, and we look
forward to serving you for many more years to come.
Sincerely,
Jorge G. Cruz-Aedo
Chief Executive Officer Corpus Christi Regional Transportation Authority
2019 Capital
Improvement Projects
Budgeted
Amount
Bus Shelter Amenities 559,588$
Bus Stop Improvements 350,000$
Buses 1,845,000$
Equipment 720,930$
Facilities 92,031$
Non-Revenue Vehicles 178,910$
Technology 276,351$
Transfer Stations 1,370,601$
Total in New Projects 5,393,411$

8
Back to Table of Contents
ABOUT THE CITY OF CORPUS CHRISTI
History In 1519, the Spanish explorer Alonzo Alvarez de Pineda discovered a semi-tropical bay on what is now the southern coast of Texas. From that discovery, the city sprung up and took the name of the “Body of Christ’ in celebration of the Roman Catholic Feast Day. A series of historical events took the city from a frontier trading post in 1838 to small settlement in July 1845 when U.S. troops under General Zachary Taylor set up camp in preparation for the war with Mexico. The Army remained until March 1846, when it marched southward to the Rio Grande to enforce it as the southern border of the United States. Shortly thereafter, the city took the name Corpus Christi and was incorporated on September 9, 1852. Residents elected a city council and a mayor form of government. Corpus Christi now is the largest city on the Texas coast, the sixth largest port in the nation and has a home-rule form of government with single-member districts. Economy
Since 1852, Corpus Christi has become the largest city on the Texas Coast and is the sixth largest port in the nation. The economy in Corpus Christi is as vibrant as it is diverse. Key
industries include petrochemical, tourism, health care, retail, education, shipping, agriculture, government services and higher education. The varied base has been instrumental in maintaining the relative stability of employment with the unemployment rate remaining below the national average for 105 consecutive months. The unemployment rate for Corpus Christi is 5.4% the national average is 5.2%. The population has increased by 5.2% and is expected to increase by 3.2% by 2022 adding 14,854 people. Upcoming job growth is predicted to be 33.7% over the next ten years, which is lower than the US average of 38%.

9
Back to Table of Contents
ABOUT THE CITY OF CORPUS CHRISTI
The top ten industries in the Corpus Christi economy are listed below.
Rank Business Type of Product Service Employment
2018
1 Corpus Christi ISD School District 5,944
2 Naval Air Station Corpus Christi Flight Training 4,500
3 H.E.B. Grocery Company 3,840
4 CHRISTUS Spohn Hospital Hospital 3,400
5 Corpus Christi Army Depot Helicopter Repair 3,400
6 City of Corpus Christi City Government 3,202
7 Driscoll Children’s Hospital Hospital 2,136
8 Corpus Christi Medical Center Hospital 1,885
9 Kiewit Offshore Services Industrial Construction 1,750
10 Bay Ltd Industrial Construction 1,700
2018 Labor Force = 205,195 (Texas Workforce Commission)

10
HISTORY OF THE CCRTA
Back to Table of Contents
History of the Corpus Christi Regional Transportation Authority The Corpus Christi Regional Transportation Authority (CCRTA), or “The B” as it is locally known, was established by referendum on August 10, 1985, as a political subdivision of the State of Texas, to develop, maintain and operate a public mass transportation system, principally within Nueces County, Texas and certain neighboring communities. Operations commenced on January 1, 1986.
CCRTA provides bus, paratransit, and other services to nine (9) municipalities across an 838 square mile service area with a population of approximately 375,036: this includes the cities of Agua Dulce, Banquete, Bishop, Corpus Christi, Driscoll, Gregory, Port Aransas, Robstown and San Patricio City. CCRTA has operated bus service since it started operations in 1986. Other services include assisting citizens in creating vanpools and rideshare programs, and providing demand-response curb-to-curb service for qualified individuals with a disability. Our transit services connect nearly 6,000,000 passengers to a variety of destinations within our service area.
__________________________________________________________
The “B” Logo When the Corpus Christi Regional Transportation Authority was first formed in 1985, the “B” was chosen as a symbol that would uniquely identify the CCRTA and simultaneously exemplify our mission. The “B” stands for “Bus”. The logo design has since been rebranded but the mission remains focused on providing quality services to our customers.
__________________________________________________________ Under state law, CCRTA is authorized to collect 0.5% sales and use tax on certain transactions for transit purposes, including both capital improvement and operating expenses. The 0.5% sales tax rate is collected from nine (9) participating cities and communities which include the cities of Corpus Christi, Agua Dulce, Banquete, Bishop, Driscoll, Gregory, Port Aransas, Robstown, San Patricio and the unincorporated areas of Nueces County.

11
HISTORY OF THE CCRTA
Back to Table of Contents
Reporting Entity: The Financial Reporting Entity, as defined in Section 2100 of GASB Codification of Governmental Accounting and Financial Reporting Standards, is comprised of the primary government and its component units. The primary government includes all departments and operations of the Authority that are not legally separate organizations. Component units are legally separate organizations that are fiscally dependent on the Authority or for which the Authority is financially accountable. An organization is fiscally dependent if it must receive the Authority’s approval for its budget, the levying of taxes or the issuance of debt. The Authority is financially responsible for an organization if it appoints a majority of the organization’s board and either (a) has the ability to impose its will on the organization or (b) there is a potential for the organization to provide a financial benefit to or impose a financial burden on the Authority. The Reporting entity of the Authority consists only of the primary government. There are no component units. The Authority is not included as part of another governmental reporting entity. CCRTA may issue debt in the form of bonds backed by both operating and non-operating revenues, subject to referendum. The Authority has no policy for debt, but would follow guidelines established by statute. There are no statutory limits to the amount of debt the Authority may undertake; however, the debt service must be affordable. On November 20, 2013, the Authority issued revenue bonds, in the amount of $22,025,000. The purpose of the bonds was to fund the construction of a new Customer Service Center and the remodeling of the Staples Street bus transfer station. Mission Statement – CCRTA’s mission statement defines the purpose for which the Agency was created: The Regional Transportation Authority was created by the people to provide quality transportation in a responsible manner consistent with its financial resources and the diverse needs of the people. Secondarily, The RTA will also act responsibly to enhance the regional economy. Vision Statement – CCRTA’s vision statement provides the inspiration and motivation for striving to become the preferred choice of transportation for our community. Provide an integrated system of innovative, accessible and efficient public transportation services that increase access to opportunities and contribute to a healthy environment for the people in our service area.

12
HISTORY OF THE CCRTA
Back to Table of Contents
Core Values – CCRTA believes that we may not always have all the answers, particularly with the challenges and complex situations that face the transit industry. We do however know that the best answers evolve in an environment that cultivates and supports ethical sound behavior. Embodied in every policy throughout CCRTA are the following guiding principles:
Accountability and Transparency Honesty and Integrity Commitment Decisiveness Team Work Courtesy Safe environment for both employees and riders
Environmental stewardship has long been the focus of CCRTA. We realize the importance of this responsibility and aim to articulate our vision, mission, and goals in planning strategies designed for the preservation of our environment. Through greening of our fleets and promoting environmental mobility options, CCRTA has been able to move forward in contributing to a better quality of life in our community. Concertedly, CCRTA also realizes its responsibility to offer mobility options that will increase the use of public transportation in an effort to minimize the health and environmental effects from the heavy use of automobiles. Transit studies over the years continue to reveal certain benefits of public transportation. Accordingly, the four key economic and health benefits of public transportation, as identified by the American Public Transportation Association, are being presented as follows.

13
BENEFITS OF PUBLIC TRANSPORTATION
Back to Table of Contents
1. Saves Money:
A two-person household can save, on the average, over $9,823 a year by downsizing to one car and using public transportation instead. CCRTA’s fees are affordable and are the lowest fares in the nation.
2. Protects the Environment and Improves Air Quality:
Car transportation alone accounts for nearly half of the carbon footprint of a typical American family with two cars and represents by far the largest source of household emissions and as such the largest target for potential reductions. The average passenger car in the U.S. produces just less than one pound of carbon dioxide per mile traveled. Switching to riding public transportation a person with a 20 mile round trip commute can help reduce carbon emissions by more than 4,800 pounds in a year. Just one single commuter switching their commute to public transportation can reduce the annual carbon footprint of a typical American household and improve the air quality that affects us all.
3. Improves Our Health: Studies have shown that regular transit riders tend to be healthier because of the exercise they get when walking to and from bus stops. Other health benefits include the reduction of stress levels that improves physical as well as mental health. Riding transit also increases the opportunity for social connections which have been shown to have a positive correlation with physical and mental wellbeing. Statistics also show that riding transit is safer. Traveling by bus carries 23 times less risk of fatal injury and five times less risk of non-fatal injury than those traveling by automobiles.
4. Manages Traffic Congestion: Transit agencies play a vital role in reducing congestion by providing transportation options and supporting land use patterns that reduce vehicle travel. Based on the most recent Travel and Transit Industry (TTI) report on congestion, public transportation saved travelers 541 million hours in travel time and 340 million gallons of fuel. During rush hour, a full 40-foot bus takes 35 cars off the road.

14
COMMUNITY INVOLVEMENT
Back to Table of Contents
CCRTA is invested in the City of Corpus Christi and the neighboring communities within our service area. The Authority has adopted a Community Involvement Policy that guides its efforts to engage in meaningful relationships that match with the mission and vision statements and that promote expansion of our customer base.
CCRTA also works with two advisory committees as well as one ad-hoc committee that provide recommendations and feedback on planning, operations and services and other specific topics. All committee members are board-appointed. In addition, CCRTA partners with various stakeholder organizations throughout the region to ensure that their voices are considered in agency decisions.
In addition, CCRTA partners with various nonprofits, cultural, business and social service organizations to serve the community. Aside from the monetary contributions made to sponsor the various events and functions of local organizations, CCRTA has invested significantly through the volunteer efforts of its staff. Events such as the Junior Achievement Program which mentors to school children, partnering with Catholic Charities and food bank drives which have collected food equivalent to hundreds of meals for our neighbors in need have become an integral part of the community involvement over the years.
At least once a year, the Agency holds a Customer Appreciation Day where riders are provided with bottled water, nutritional bars, and various products to show appreciation, especially during inclement weather, and during major re-routing of services due to street repairs.
For several years, CCRTA has supported annual community events by providing display buses, park-n-rides, and other special services. In coordination with city officials our participation has played a significant role in facilitating traffic and alleviating congestion. Among the annual events are:
Art Walk (First Friday of each month)
Martin Luther King Jr. Day (January, Shuttle Services) Fiesta de la Flor (April, Park-n-Ride Services) Buc Days (April/May – Parade participation and Shuttle Services) Beach to Bay (May, Shuttle Services) Mayors July 4th Celebration (Park-n-Ride & parade) Hurricane Evacuation Conference (Display Services) Dia de los Muertos (October, Park-n-Ride Services)
Jazz Fest (October, Park-n-Ride Services) Making Strides (October, Park-n-Ride Services) Ride to Vote (November, All Services) Gregory Holiday Parade (December, Parade) Feast of Sharing (December, Park-n-Ride Services)
15
COMMUNITY INVOLVEMENT
Back to Table of Contents
CCRTA also supports emergency response operations within the service area when requested and in cooperation with the City of Corpus Christi Office of Emergency Management to provide the necessary services during emergency situations which include transporting the public within the service area to evacuation locations. Moreover, CCRTA has maintained a Street Improvement Program for the purpose of reconstructing, rebuilding, and rehabilitating streets within its region. Each year funds are distributed using a formula-driven allocation process to each of our participating regional communities. Over the years, over $30,000,000 in sales tax revenues have been returned to these communities for street repairs.

16
GOVERNANCE
Back to Table of Contents
Chapter 451 of the Texas Transportation Code is the enabling legislation that sets forth the governing structure of the Authority. Because of the population size of the principal municipality, an eleven-member board, serving overlapping two-year terms, is required to govern all the activities of the Authority. The Chief Executive Officer is charged with the day-to-day operations while the board’s role is to:
Set forth operating and financial policy Provide management with direction through strategic guidance Provide legal and judiciary oversight
Focus on good stewardship and accountability of public funds Advocate customer representation
Regulated by the same legislation, the board composition requires board member appointments to follow a specific selection process as listed below.
Five members are appointed by the City of Corpus Christi Three members are appointed by the Nueces County Commissioners Two members are appointed by majority of the participating small cities. One presiding officer is appointed by the ten board members.
Board Member Title Appointing Body Term Expires
Edward Martinez Board Chairman RTA Board 1/8/2020
Michael Reeves Board Vice Chairman Committee of Mayors 9/30/2019
Dan Leyendecker Board Secretary Nueces County 9/30/2019
Tom Niskala Board Member Nueces County 9/30/2019
Scott Harris Board Member Nueces County 9/30/2019
George Clower Board Member City of Corpus Christi 6/30/2020
Patricia Dominguez Board Member City of Corpus Christi 6/30/2020
Ann Bauman Board Member City of Corpus Christi 6/30/2020
Philip Skorbarczyk Board Member City of Corpus Christi 6/30/2020
Matt Woolbright Board Member City of Corpus Christi 6/30/2020
Glenn Martin Board Member Committee of Mayors 9/30/2019

17
GOVERNANCE
Back to Table of Contents
The Board also utilizes two (2) standing committees and five (5) subcommittees in matters that require special knowledge and or technical judgement. Members of the committees are appointed by the Board Chair subject to confirmation by the Board. All policy issues and operational matters must first pass through the Administration & Finance Committee or the Operations & Capital Projects Committee before action can be taken by the Board. In addition, there is the RCAT Ad hoc Committee that advises the Board on issues primarily related to services to persons with disabilities and special needs. To effectuate the Authority’s priorities, the board and standing committees meet once a month while the subcommittees meet on as-needed basis.

18
SYSTEM FACILITIES
Back to Table of Contents
Since CCRTA’s inception in 1986, the focus of the capital improvement program has primarily been on the replacement of buses, garage facilities, amenities and Park & Ride facilities. This project is a result of the Board’s long-term planning for the future growth of our community and our organization. The site for this new location was strategically chosen to align with the expected transit growth in the uptown and downtown areas and provide a pivotal point for connecting the two districts. CCRTA has lease out space to organizations that serve similar customer needs and provide the public with convenient access to other necessary services. Since the City of Corpus Christi is the county seat of Nueces County, this concept further complements the decision to site the new building in the civic district of the city which already houses other public offices. The new building which is 168,450 square feet in garage and office facilities consolidates two departments that are currently located at opposite ends of the City. This allows for greater efficiency by bringing together the Customer Service Department along with the Administrative Support Offices that enhance development of responsive transportation services for the next 25 years. Transit operations will also experience consolidation benefits from this strategy. CCRTA’s Facilities Operations Building 5658 Bear Lane Corpus Christi, Texas 78405
Administrative & Customer Service Center 602 N. Staples Corpus Christi, Texas 78401
Park & Ride Locations CCRTA utilizes three (3) Park & Ride lots around the service area. Passengers park their privately owned vehicles and ride the Authority’s buses to various destinations.
Gregory Park & Ride Located off I-37 at the Interchange of Hwy. 181 & Hwy. 35 Gregory, Texas Calallen Park & Ride (Calallen is a district of the City of Corpus Christi) Located off I-37 on Leopard Street at Rehfield Road Corpus Christi, Texas Robstown Park & Ride Located on Avenue A at 4th Street Robstown, Texas

19
SYSTEM FACILITIES
Back to Table of Contents
Transfer Stations CCRTA offers five transfer stations centrally located throughout its service area to provide passengers with convenient transfer opportunities for connecting to their destinations. Each transfer station provides covered waiting areas and seating for customers. Transit buses meet up at these locations to allow the safe transfer of passengers from one route to another, allowing riders to complete a one-way trip on a single fare even if a trip involves a route change. Transfer stations vary in terms of age, accessibility, capacity and usage. A brief description is being provided below:
Station Year Built Bus Capacity
Park -and- Ride
Capacity
Routes Served
Weekday
Routes Served
Saturday
Routes Served Sunday
Staples Street Station 1994 9 N/A 14 13 7
Southside Station 2003 9 5 9 9 7
Port Ayers Station 1991 5 N/A 7 7 5
Six Points Station Renovated 1991
3 N/A 4 4 3
Robstown Station 2014 2 33 3 3 1
Over the years our transfer stations have been consistently renovated to increase efficiency and quality of service to our customers. In the process, we have pursued partnerships with local agencies and citizens for creative input on unique designs and artwork. As a result, the transformation of some of our transfer stations reflects the motif of neighboring communities. Evidence of these successful partnerships is the awarding of the Pedestrian Award from the National Endowment of the Arts for the Staples Street Station project.
20
SYSTEM FACILITIES
Back to Table of Contents
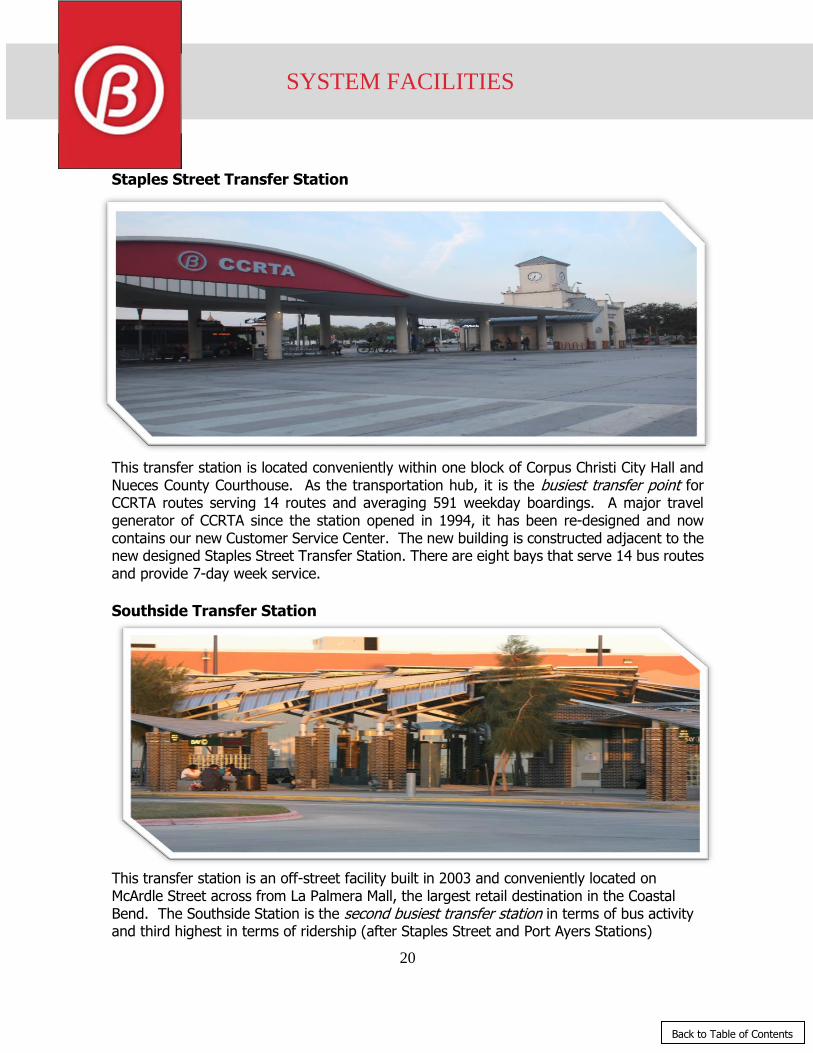
Staples Street Transfer Station
This transfer station is located conveniently within one block of Corpus Christi City Hall and Nueces County Courthouse. As the transportation hub, it is the busiest transfer point for CCRTA routes serving 14 routes and averaging 591 weekday boardings. A major travel generator of CCRTA since the station opened in 1994, it has been re-designed and now contains our new Customer Service Center. The new building is constructed adjacent to the new designed Staples Street Transfer Station. There are eight bays that serve 14 bus routes and provide 7-day week service.
Southside Transfer Station
This transfer station is an off-street facility built in 2003 and conveniently located on McArdle Street across from La Palmera Mall, the largest retail destination in the Coastal Bend. The Southside Station is the second busiest transfer station in terms of bus activity and third highest in terms of ridership (after Staples Street and Port Ayers Stations)

21
SYSTEM FACILITIES
Back to Table of Contents
averaging 1,196 weekday boardings. It has become a major community destination connecting passengers to the retail center of the City which not only includes the nearby La Palmera Mall, but a variety of other retail outlets in the area. The design utilizes a custom tubular stainless steel lamella vault with structural stainless steel standing seam roof panels which gives this station its distinct identity. With nine bays servicing ten routes this location generates the 3rd highest level of activity in the transit system.
Port Ayers Station
The Port Ayers Station, built in 1995, is the second highest ridership stop in the CCRTA system, averaging 1,492 weekday boardings with three bays servicing seven routes. The station is located at the intersection of two major streets: Ayers and Port and buses access the facility from a bus pull-out on Ayers and access lane on Port. Six Points Transfer Station

22
SYSTEM FACILITIES
Back to Table of Contents
The Six Points Transfer Station is a small triangular on-street transfer station located 1.6 miles south of the Staples Street Station and at the intersection of three major arterial streets: South Staples Street, South Alameda Street, and Ayers Street. A long standing transfer station it reopened after renovations in 1991. This station is planned to close in early 2016 due to the street constructions resulting from the City of Corpus Christi bond projects. Reconstruction of the street projects is anticipated to take two years to complete. CCRTA is currently coordinating with the City of Corpus Christi to phase construction in a manner that minimizes impact on vital bus services which will require either a temporary station or re-routing of buses prior to the temporary closure. Currently four weekday routes serve this station with three bays and 7 routes. Robstown Transfer Station
The Robstown Transfer station serves also as a park-and-ride for the City of Robstown which is a western suburb of Corpus Christi. This station opened in 2014 as one of the first climate-control facilities in the state and occupies a quarter of a block in downtown Robstown and is adjacent to an H-E-B store that is a major full service grocery chain. The facility includes an indoor waiting area and two-bus bays servicing four routes. Features include, restroom facilities, wireless internet, a television, passenger announcement system, operator breakroom, automatic security systems, bike racks, and are illuminated with energy efficient lighting.
23
SYSTEM AREA
Back to Table of Contents
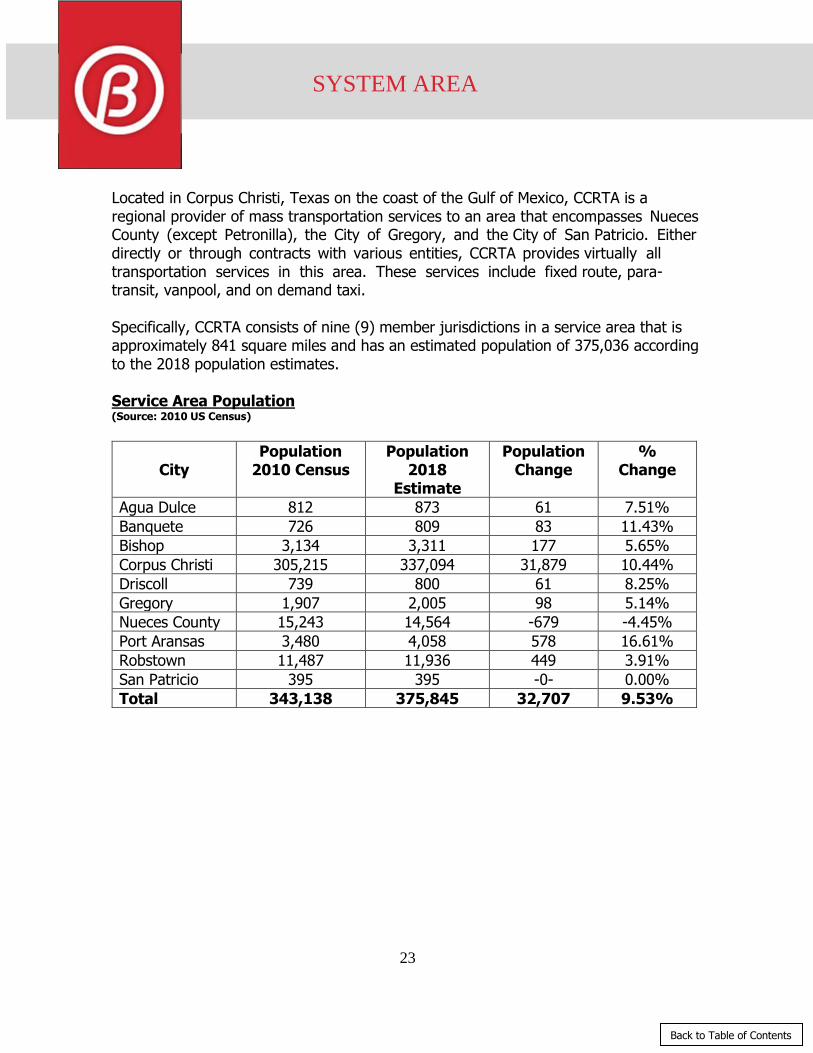
Located in Corpus Christi, Texas on the coast of the Gulf of Mexico, CCRTA is a regional provider of mass transportation services to an area that encompasses Nueces County (except Petronilla), the City of Gregory, and the City of San Patricio. Either directly or through contracts with various entities, CCRTA provides virtually all transportation services in this area. These services include fixed route, para-transit, vanpool, and on demand taxi. Specifically, CCRTA consists of nine (9) member jurisdictions in a service area that is approximately 841 square miles and has an estimated population of 375,036 according to the 2018 population estimates. Service Area Population (Source: 2010 US Census)
City
Population 2010 Census
Population 2018
Estimate
Population Change
% Change
Agua Dulce 812 873 61 7.51%
Banquete 726 809 83 11.43%
Bishop 3,134 3,311 177 5.65%
Corpus Christi 305,215 337,094 31,879 10.44%
Driscoll 739 800 61 8.25%
Gregory 1,907 2,005 98 5.14%
Nueces County 15,243 14,564 -679 -4.45%
Port Aransas 3,480 4,058 578 16.61%
Robstown 11,487 11,936 449 3.91%
San Patricio 395 395 -0- 0.00%
Total 343,138 375,845 32,707 9.53%
24
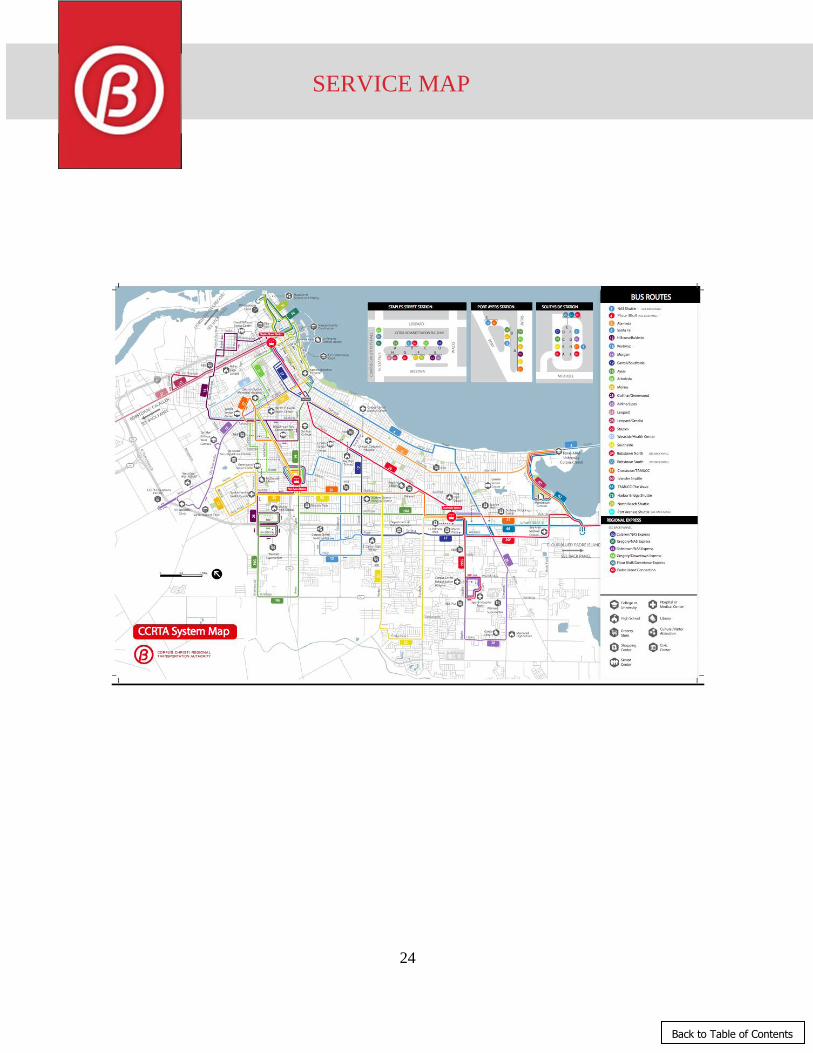
SERVICE MAP
Back to Table of Contents

25
SERVICES
Back to Table of Contents
CCRTA provides a wide variety of service types to meet different transportation needs across participating jurisdictions within the Coastal Bend including Corpus Christi, Port Aransas, Robstown, and Gregory areas. While the majority of the transit services are operated by CCRTA, there are specialized service programs that are outsourced. In outsourcing these services, the responsibility remains with CCRTA and contractors required to maintain the same performance standards through performance based contracts and an aggressive management program that monitors and audits contract compliance. Fixed Route: Fixed Route service is a public transportation mode in which a vehicle is operated along a prescribed route alignment according to a fixed schedule. CCRTA directly operates 23 fixed
route services. The 23 fixed route services are operated on weekdays, 16 on Saturdays, and 14 on Sunday.
Fixed Route Purchased Transportation: Fixed Route Purchased Transportation service is a
public transportation mode in which a vehicle is operated by a second party contracted partner along a prescribed route alignment according to a fixed schedule. CCRTA contracts 11 fixed route
services which include Routes 3, 4, 12, 16, 30, 34, 35, 54, 56, 63, and 94. The 11 fixed route services are operated on weekdays, 9 on Saturdays, and 4 on Sundays.
B-Line Paratransit: B-Line Paratransit service is a complementary shared ride service for people whose disabilities prevents them from using regular accessible fixed-route service. B-Line
is an origin-to-destination transportation service provided to riders who have been determined eligible using the Americans with Disabilities Act (ADA) guidelines. CCRTA provides curb -to-curb
demand response service with a 24-hour advance reservation. B-Line service is provided within ¾ miles of the fixed route system. Riders may travel beyond the ¾ mile boundary for a
premium fare.
On-Demand Taxi Purchased Transportation: The on-demand taxi services assist CCRTA riders
without access to fixed bus route service and is currently operated by contractors in the Bishop and Driscoll area. The CCRTA is exploring the mode to include first mile/last mile mobility solutions.
The CCRTA planning department is in the early stages of research and development of first mile/last
mile solutions. Riders will reach fixed route services through bicycle sharing, scooters, taxi or paratransit services.

26
SERVICES
Back to Table of Contents
Vanpool: The Corpus Christi Metropolitan Area is experiencing significant industrial and population
growth. The Vanpool service is an opportunity for groups of people to utilize a carpool service
originating or arriving in the CCRTA urbanized area. Additionally, the service operates as a “park and ride” experience for commuter groups, helping to alleviate vehicular traffic congestion. The
program is a resource for businesses and community groups to access services through the CCRTA and a cost-effective public transit option. The CCRTA program is currently funding operations for
eleven (11) Vanpool groups; one (1) 10-passenger van, one (1) 8-passenger SUV, and nine (9) 7-passenger vans and is seeking to expand the program throughout the region. CCRTA contribution
subsidizes the vehicle lease costing.
Flex: Flex Service runs on a fixed route schedule, with the flexibility of deviating from the route to
accommodate riders at on-demand stops. The service is a hybrid between a fixed route and on-demand service. Riders may traverse the fixed footprint or request a pick-up or drop-off at remote
stops. The driver will deviate from the fixed route and meet the rider at a specified RTA remote stop
without causing excessive delays for other passengers. Flex Service brings public transportation options to areas that have little or no fixed route service, typically rural areas or small communities.
Express Service: Express Service runs faster than normal fixed route bus service by focusing
travel between key destination stops or transfer stations. The CCRTA is developing an Express
service system to reflect the growing population and an increased demand for rapid travel
throughout the Corpus Christi metro area. The Express service is a part of the transition to a more
dynamic service for customers.
Park-and-Ride Location Parking Spaces Routes Served
Calallen Park-and Ride Leopard and Rehfeld 60 50 Calallen
Gregory Park-and-Ride SH 35 and US 181 50 (approx.) 51 Gregory
Robstown Station Avenue A and 4th Street
33 27 Leopard 34 Robstown Circulator
53 Robstown/Walmart
Corpus Christi Greenwood Walmart 53 Robstown/Walmart

27
Back to Table of Contents
EXECUTIVE MANAGEMENT & ORGANIZATIONAL STRUCTURE
The Board hires the Chief Executive Officer (CEO) who is responsible for managing all facets of the Agency. The primary function of the CEO is to carry out the goals and objectives of the Board and to ensure that optimum transportation services are provided to the community. The duties include:
Overseeing the daily operations, including the hiring, compensation, and removal of employees,
Awarding contracts for services, supplies, capital acquisitions, real estate and construction if the amount of any such contract does not exceed $50,000,
Presiding over the growth of our transit system, Providing regional leadership and visibility regarding the transportation
needs in our community.
CCRTA Executive Management
Title Name
Chief Executive Officer Jorge G. Cruz-Aedo
Managing Director of Operations Jennifer Fehribach
Managing Director of Capital Programs Sharon Montez
Managing Director of Administration Robert Saldaña
Director of Planning Gordon Robinson
Director of Finance Sandy Roddel
Director of Maintenance Bryan Garner
Director of Marketing Rita Patrick
Director of IT David Chapa
Director of Procurement Annie Hinojosa
General Manager of MV Transportation Kyle Klika
Director of Safety and Security Mike Rendon
Director of Human Resources Angelina Gaitan
Director of Transportation Derrick Majchszak
DBE/EEO Compliance Officer Christina Perez

28
Back to Table of Contents
EXECUTIVE MANAGEMENT & ORGANIZATIONAL STRUCTURE
JORGE CRUZ-AEDO / CEO
Mr. Cruz-Aedo has 36 years of experience in private and public finance and administration. He has served as the Director of Administration for the City of Houston and Assistant City Manager for the City of Corpus
Christi. He opened a facilities management operation in Corpus Christi for
the larger international facilities management company. He has served as President of the Government Finance Officers Association for both the
State of Texas and Arizona. He received his BBA with an emphasis on accounting in 1977 from Texas State University. He is a U.S. Navy Veteran.
JENNIFER FEHRIBACH / Managing Director of Operations
Ms. Fehribach brings over 8 years of experience in the transit industry which includes service operations, project management and administrative
management. Prior to working with the CCRTA Ms. Fehribach worked with
the Metropolitan Transit Authority of Harris County (Houston Metro) where she managed the operations department and administered strategies and
work methods to optimize service and plan for long-term growth throughout the Metro service area. Ms. Fehribach also oversaw the customer satisfaction
management system to ensure complaint resolution. Ms. Fehribach is a proud member of American Public Transportation Association (APTA) and holds a Bachelor’s Degree in Liberal Arts from Murray
State University.
SHARON MONTEZ / Managing Director of Capital Programs
Ms. Montez brings with her 14 and a half years of experience in the
Transit industry which includes grants, contracts and procurements,
facilities maintenance, marketing and planning. She received her Bachelor’s Degree in Business Administration and her Master’s in
Accountancy from Texas A&M University—Corpus Christi.
29
Back to Table of Contents
EXECUTIVE MANAGEMENT & ORGANIZATIONAL STRUCTURE
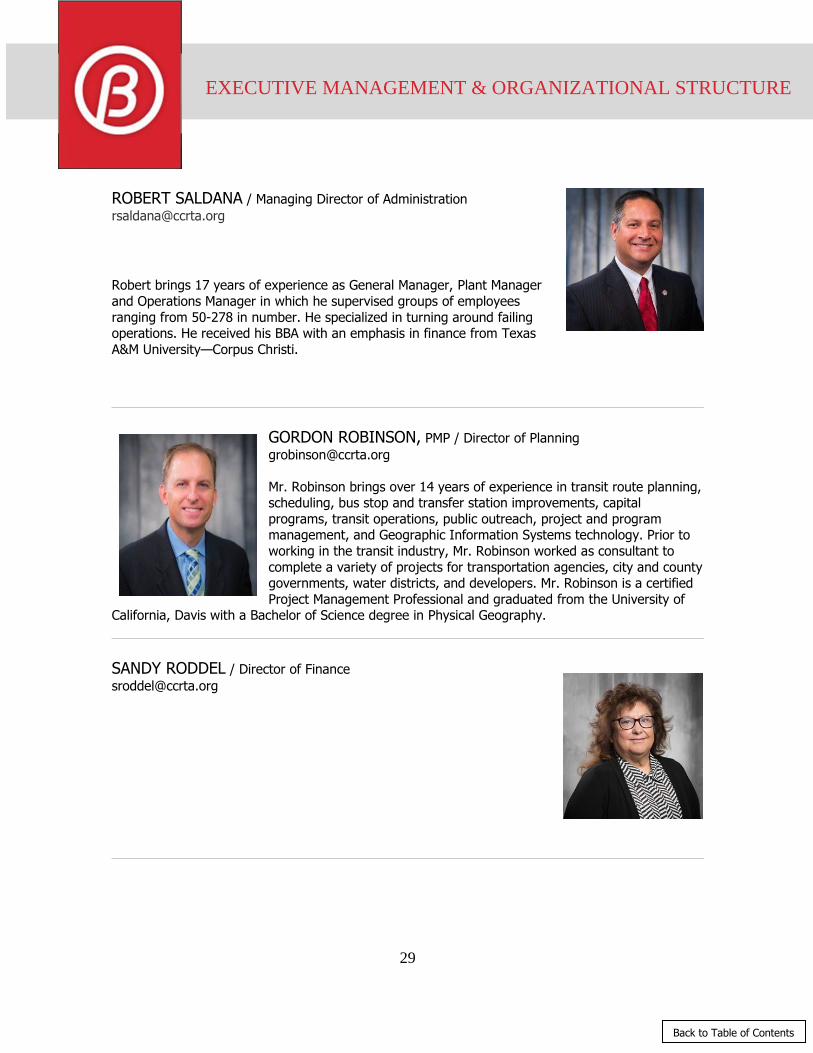
ROBERT SALDANA / Managing Director of Administration
Robert brings 17 years of experience as General Manager, Plant Manager
and Operations Manager in which he supervised groups of employees
ranging from 50-278 in number. He specialized in turning around failing operations. He received his BBA with an emphasis in finance from Texas
A&M University—Corpus Christi.
GORDON ROBINSON, PMP / Director of Planning
Mr. Robinson brings over 14 years of experience in transit route planning, scheduling, bus stop and transfer station improvements, capital
programs, transit operations, public outreach, project and program management, and Geographic Information Systems technology. Prior to
working in the transit industry, Mr. Robinson worked as consultant to
complete a variety of projects for transportation agencies, city and county governments, water districts, and developers. Mr. Robinson is a certified
Project Management Professional and graduated from the University of California, Davis with a Bachelor of Science degree in Physical Geography.
SANDY RODDEL / Director of Finance

30
Back to Table of Contents
EXECUTIVE MANAGEMENT & ORGANIZATIONAL STRUCTURE
BRYAN GARNER / Director of Maintenance
Mr. Garner began his career as an intern in Austin at Capital Metro after
earning his Associates in Diesel Mechanics. He stayed with Capital Metro for over 20 years, working his way up to Superintendent of Vehicle
Maintenance where he was involved in all aspects of the fleet. Mr. Garner moved to Las Vegas to further his career on a bigger fleet and
began to work on hybrid vehicles as well as large bus styles. In Las
Vegas, he earned his Master Transit Bus Technician ASE Certification. He transferred between Capital Metro in Austin to Phoenix Arizona, until he arrived at the CCRTA.
RITA PATRICK / Director of Marketing
DAVID CHAPA / Director of IT
Mr. Chapa received his Bachelor of Science Business Degree in
Information Technology (IT) Management from The Western Governors
University of Texas. He also graduated from Del Mar College with an Associate Degree in Computer Science in Networking Administration. He
has over 10 Years of IT Experience that includes Project Managing and IT implementation.
ANNIE HINOJOSA / Director of Procurement
Ms. Hinojosa joined the CCRTA in February 2017. As Director of Procurement, Ms. Hinojosa oversees the contract award process, but also ensures all
contracts and purchases are conducted and administered in accordance with CCRTA's procurement regulations and in compliance with all applicable
statutes. Ms. Hinojosa’s previous experience includes thirteen years of
management, procurement and strategic planning in both public and private sectors. She graduated from Texas A&M University –Kingsville with a Bachelor’s degree in Business
Administration and her Master’s in Business Administration from Texas A&M University – Commerce.

31
Back to Table of Contents
EXECUTIVE MANAGEMENT & ORGANIZATIONAL STRUCTURE
KYLE KLIKA / General Manager of MV Transportation
Mr. Klika joined the MV Transportation team at the CCRTA Division in October 2017. Having grown up with the company, Mr. Klika worked as an
intern in his teenage years in Southern California in various start-ups. After graduating with a Bachelor’s degree in Public Affairs and Community
Service with concentrations in Political Science, Criminal Justice and Sociology from the University of
North Texas, Mr. Klika was recruited as a Special Projects Manager, overseeing different departments around the country. In 2015, Mr. Klika became the Safety and Training Manager for
MV’s Fairfax, VA division FasTran, where he worked his way up to managing operations as a whole. Mr. Klika plans on bringing his experience, focus and heart to the CCRTA’s B-Line service so the
people of Corpus Christi can feel the freedom of travelling in the safest and most customer-oriented way.
MIKE RENDON / Director of Safety and Security
Mr. Rendon has over 30 years of safety and security experience. He began his career as a Military Police Officer. He then moved to manage a
security company and provide security consulting for over years. His highest priority is to maintain safety and security for all CCRTA facilities.
ANGELINA GAITAN / Director of HR
Mrs. Gaitan has been in the Human Resources field for over 10 years. She
began her career as the Human Resources Director in the hospitality field
before coming into the Public Transportation. Mrs. Gaitan holds a Masters of Arts in Administration with a concentration in Organizational
Development from the HEB School of Business and Administration from the University of Incarnate Word.

32
Back to Table of Contents
EXECUTIVE MANAGEMENT & ORGANIZATIONAL STRUCTURE
DERRICK MAJCHSZAK / Director of Transportation
Mr. Majchszak is a native of Toledo, Ohio. He brings 20 years of
leadership experience and 11 years of Public Transportation experience.
Mr. Majchszak began his professional career with the US Navy. He was stationed on Guam where he served as a Network Operations Manager.
He later returned to active duty and served 1 tour in the Middle East with the Navy Seabees as a Construction Mechanic. After being honorably
discharged, Mr. Majchszak went to work for the Fort Worth Transportation Authority. He began his career in Transit as a bus mechanic before advancing to Maintenance Supervisor, and later to
Operations Manager. As an Operations Manager, he led a team of 230 Operators and 20
Supervisors. Mr. Majchszak received his Associates Degree from Tarrant County College and will finish his BBA in 2018.
CHRISTINA PEREZ / DBE/EEO Compliance Officer
Mrs. Perez began her public transportation career over 11 years ago in Chicago, Illinois. She has worked within the Government Affairs division
and has managed the Small/Minority-owned and Disadvantaged Business Enterprise program for one of Chicago’s leading public transportation
entities. Mrs. Perez received her undergraduate degree in Criminal Justice from Northeastern Illinois
University, with a minor is Sociology.
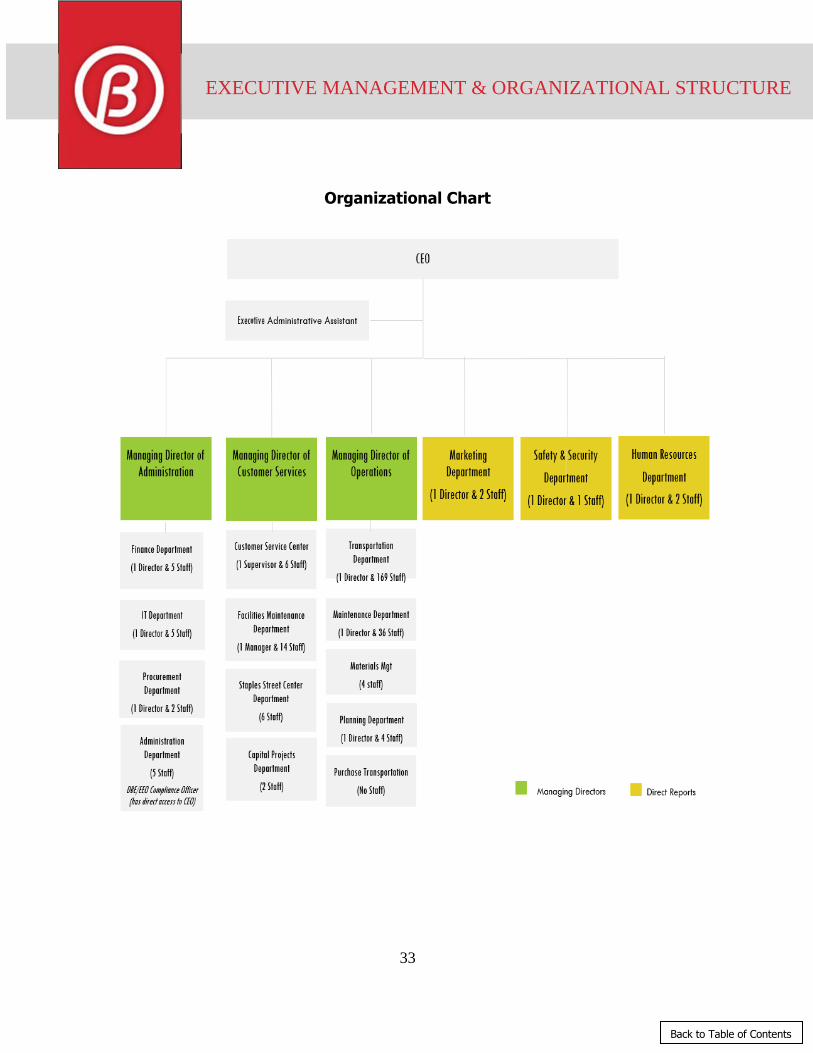
Additionally, there are department heads and staff that support these core functions. The following organizational chart provides the functional structure of CCRTA
33
Back to Table of Contents
EXECUTIVE MANAGEMENT & ORGANIZATIONAL STRUCTURE
Organizational Chart

34
EXECUTIVE MANAGEMENT & ORGANIZATIONAL STRUCTURE
Back to Table of Contents
There are 278.5 salaried and hourly positions included in the FY 2018 Annual Budget. This amount remained the same as the previous fiscal year. The Amalgamated Transit Union, Local 1769, represents the majority of our operators, and mechanics. As a Texas governmental entity, we are not legally permitted to collectively bargain or sign labor contracts with these employee representatives. However, we do meet and confer with representatives on hourly employee issues, compensation and benefits.
Full-Time Equivalent Staffing Chart
Funded
FTE's
01 TRANSPORTATION 170.00 0.00 170.00
02 CUSTOMER SERVICE CENTER 7.80 0.00 7.80
03 PURCHASED TRANSPORTATION 0.00 0.00 0.00
04 SERVICE DEVELOPMENT 5.00 0.00 5.00
07 MIS 6.00 0.00 6.00
11 VEHICLE MAINTENANCE 37.00 0.00 37.00
21 FACILITIES MANAGEMENT 15.00 0.00 15.00
40 PROCUREMENT 3.00 0.00 3.00
41 CEO 1.00 0.00 1.00
42 FINANCE AND ACCOUNTING 6.50 0.00 6.50
43 MATERIALS MANAGEMENT 3.00 0.00 3.00
44 HUMAN RESOURCES 4.50 0.00 4.50
45 ADMINISTRATION 7.00 0.00 7.00
49 CAPITAL PROJECTS 2.00 0.00 2.00
50 MARKETING & COMMUNICATION 3.00 0.00 3.00
52 SAFETY & SECURITY 2.00 0.00 2.00
77 STAPLES STREET CENTER 5.70 0.00 5.70
TOTAL CCRTA FTE's 278.5 0.00 278.5
Department
2019
Additions or
Deletions
Proposed
FTE's
2018

35
FINANCIAL POLICIES & PRACTICES
Back to Table of Contents
This s e c t i o n p r o v i de s a s um m ar y o f t h e f i n an c i a l p o l i c i e s t h a t gu ide t h e operations of the Authority. These policies conform to the accounting principles generally accepted for local governmental units (GAAP) as prescribed in the statements issued by the Governmental Accounting Standards Board (GASB) and other authoritative sources. The Authority’s primary financial goal focuses around providing effective and efficient transportation services and systems to the public in a financially responsible manner. Recognizing long-term financial implications of current and proposed operating and capital budgets, budget policies, cash management and investment policies and assumptions, the Authority strives to increase operating efficiencies while living within its means and continuing a trend of advancing and enhancing services. In order to maintain public trust and to best utilize funds, a number of procedures are in place to safeguard and maximize available resources. In short, the broad financial goals of the Authority are to: • Operate under a balanced budget • Safeguard and maximize resources The following guidance and policies are in place in order to achieve these goals. Budget and Financial Plans State law requires that an annual operating budget be adopted prior to the commencement of a fiscal year. Before the budget is adopted, a public hearing and the proposed budget must be made available to the public at least 14 days prior to the hearing. The Authority operates under a balanced budget. The Authority’s definition of a balanced budget is in accordance with the Texas Transportation Code, Section 451.103, wherein a state transit authority may not spend operating money in excess of the total amount specified in the annual operating budget unless the Board amends the budget by order after a public hearing. The Authority utilizes the zero-based budgeting concept. Developed in the 1970s, this concept causes an organization to prepare its operating budget from a zero base with all proposed expenditures starting at levels of zero. Each proposed line item expense must then be justified. This process does not assume former operating levels. Departmental reviews are conducted with the Executive Management staff. Each annual budget is performed in conjunction with long-range projections to determine the effects of decisions made in the current budget on future years’ funding. The requested uses of one-time revenues are analyzed to determine the effects on future operations.
36
FINANCIAL POLICIES & PRACTICES
Back to Table of Contents
Use of Estimates The preparation of the budget and financial statements, in conformity with accounting principles generally accepted in the United States of America, requires management to make estimates and assumptions that affect the reported amounts of assets and liabilities at the date of the financial statements and the reported amounts of revenues and expenses during the reporting period. Actual results could differ from those estimates. Cash and Investments
The Authority utilizes investment strategies and procedures that most effectively accomplish the primary goals of preservation of capital and liquidity to meet all obligations in a timely manner. Earnings will be maximized as a subsidiary goal and from the full investment of all available funds. Cash and Cash Equivalents – All Authority deposits with financial institutions are fully insured, or collateralized by securities held by a third party agent in the Authority’s name. Cash and Cash Equivalents include: cash on hand, cash in banks, U.S. government issues with original maturities of less than 90 days. Investments – The Authority reports all investments at fair value provided that the fair values of these investments are not significantly affected by the impairment of the credit standing of the issuer or by other factors. All changes in fair value are reported as unrealized gains and losses within the Statement of Revenues, Expenses, and Changes in Net Assets. For all investments stated at fair value, the Authority used Bloomberg and Unaffiliated Market Participants as the source for determining fair value. The Authority is authorized to invest in “approved securities” as outlined in the Texas Government Code, Chapter 2256, otherwise known as the “Public Funds Investment Act” (Act). These securities include repurchase agreements and direct and indirect obligations of the United States of America, certificates of deposit of state or national banks, savings and loan associations or credit unions which have membership in the FDIC, FSLIC or CUNA, commercial paper fully secured by an irrevocable letter of credit issued by a bank organized and existing under the laws of the United States, bankers’ acceptances, SEC-regulated, no load money market funds and local government investment pools. Certificates of deposit in amounts greater than $100,000 may be placed with banks, savings and loan associations, or credit unions provided they are secured by collateral pledged directly to the Authority. Investments are held in safekeeping in the name of the Authority. The Authority’s investment policy applies to operating, reserve, and capital funds and is fully compliant with the Public Funds Investment Act. The policy is required to be approved by the Board annually. It is the policy of the Authority that all available funds shall be invested in conformance with legal and administrative guidelines.

37
FINANCIAL POLICIES & PRACTICES
Back to Table of Contents
Investments shall be made with the primary objectives of: ♦ Preservation and safety of principal ♦ Liquidity to meet operating needs ♦ Diversification of investments to minimize risks ♦ Maximization of return on the portfolio The standard of prudence used by the Authority is the "prudent person rule" and shall be applied in the context of managing the overall portfolio within the applicable legal constraints. Inventories Inventory consists of repair parts and fuel. Parts are valued using a weighted average cost method and fuel is valued using the first-in first-out method. Items are systematically identified and periodically audited. Inventory of capital assets is audited on a biennial basis as required by the FTA. Parts inventory is audited annually using cycle counts. Capital Assets and Depreciation
Fixed assets for capitalization and financial reporting purposes are all items purchased that have a useful life of at least two years, are of a tangible nature (land, building, bus) or intangible (patent, copyright) and have a value of $5,000 (not including trade-ins or any taxes, government licenses, training, etc.). Items of less than $5,000 are not considered fixed assets unless they form an integral and essential part of another piece of equipment or structure considered to be a fixed asset or a part of a Capital Project. Individual assets that cost less than $5,000, but that operate as part of a network system (i.e., telephone system, computer system) will be capitalized in the aggregate, using the group method, if the estimated average useful life of the individual asset is at least two years. A network is determined to be where individual components may be below the $5,000 but are interdependent and the overriding value to the Authority is on the entire network and not the individual assets. Classification of Fixed Assets
1. Land and improvements: Purchased land will be carried in the Fixed Assets accounting module at acquired cost. Costs may include, but are not limited to, expenses for services incidental to the acquisition and other charges incurred in preparing the land for use, such as environmental assessments, appraisals, etc. In order for improvements to be capitalized, the improvement should be considered permanent and should add value or improve the use of the land. Examples of improvements are fences, retaining walls, landscaping, drainage systems, etc. In the event the Authority issues debt to finance a land
38
FINANCIAL POLICIES & PRACTICES
Back to Table of Contents
purchase, the cost to be capitalized would include both the acquisition cost and any capitalizable interest expense from the outstanding debt. 2. Buildings: All buildings will be valued at purchase price or construction cost. Cost should include all charges applicable to the building acquisition including fees for brokers, appraisers, engineering consultants, and architects. In the event that the Authority issues debt to finance a building purchase, the cost to be capitalized would include both the acquisition cost and any capitalizable interest expense from the outstanding debt. 3. Equipment and Machinery: All items of tangible property not permanently affixed to real property, which are needed in carrying out the operations of the Authority. Installation cost should be included in the capitalized amount. Examples are furniture, hydraulic lifts/jacks, milling machinery, floor scrubber, computers, etc. 4. Vehicles: All equipment that must be titled and bear a license tag. Buses, vans, and cars are examples.
5. Assets in Progress: This is primarily used in conjunction with Capital Projects. Capital Project costs are accumulated until completion, when cumulative costs are transferred to the appropriate fixed asset account. The capitalization policy does not apply in these cases, and all costs must be recorded to give accurate values. 6. Improvements: Additions and Modifications to Existing Assets: Costs are often incurred in connection with fixed assets after the original acquisition costs have been established. In general, any expenditure, which is definitely an addition to a fixed asset, or an integral part of it, that changes its useful life, should be classified as a capital expenditure and the original acquisition costs adjusted. If a component part, such as an engine or transmission, is rebuilt or replaced, the remaining undepreciated amount of the original component will be expensed and the new component will be depreciated over the remaining life of the asset. If the original component part cost cannot be determined, the cost of the new part will be expensed. The additions of an air- conditioning system to a building, or replacing or rebuilding an engine or transmission for a bus are some examples of capitalized expenses.
39
FINANCIAL POLICIES & PRACTICES
Back to Table of Contents
Items Not Considered to be Fixed Assets
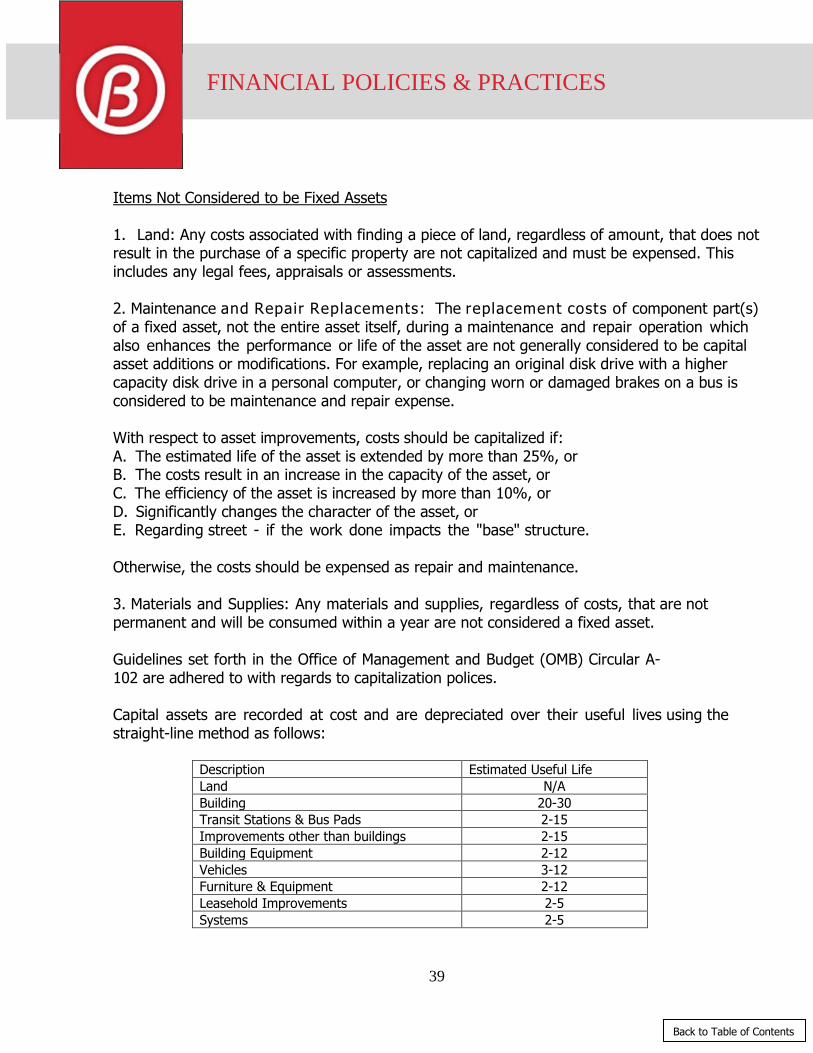
1. Land: Any costs associated with finding a piece of land, regardless of amount, that does not result in the purchase of a specific property are not capitalized and must be expensed. This includes any legal fees, appraisals or assessments. 2. Maintenance and Repair Replacements: The replacement costs of component part(s) of a fixed asset, not the entire asset itself, during a maintenance and repair operation which also enhances the performance or life of the asset are not generally considered to be capital asset additions or modifications. For example, replacing an original disk drive with a higher capacity disk drive in a personal computer, or changing worn or damaged brakes on a bus is considered to be maintenance and repair expense. With respect to asset improvements, costs should be capitalized if: A. The estimated life of the asset is extended by more than 25%, or B. The costs result in an increase in the capacity of the asset, or C. The efficiency of the asset is increased by more than 10%, or D. Significantly changes the character of the asset, or E. Regarding street - if the work done impacts the "base" structure. Otherwise, the costs should be expensed as repair and maintenance. 3. Materials and Supplies: Any materials and supplies, regardless of costs, that are not permanent and will be consumed within a year are not considered a fixed asset. Guidelines set forth in the Office of Management and Budget (OMB) Circular A- 102 are adhered to with regards to capitalization polices. Capital assets are recorded at cost and are depreciated over their useful lives using the straight-line method as follows:
Description Estimated Useful Life
Land N/A
Building 20-30
Transit Stations & Bus Pads 2-15
Improvements other than buildings 2-15
Building Equipment 2-12
Vehicles 3-12
Furniture & Equipment 2-12
Leasehold Improvements 2-5
Systems 2-5

40
FINANCIAL POLICIES & PRACTICES
Back to Table of Contents
Items Not Considered to be Fixed Assets
1. Land: Any costs associated with finding a piece of land, regardless of amount, that does not result in the purchase of a specific property are not capitalized and must be expensed. This includes any legal fees, appraisals or assessments. 2. Maintenance and Repair Replacements: The replacement costs of component part(s) of a fixed asset, not the entire asset itself, during a maintenance and repair operation which also enhances the performance or life of the asset are not generally considered to be capital asset additions or modifications. For example, replacing an original disk drive with a higher capacity disk drive in a personal computer, or changing worn or damaged brakes on a bus is considered to be maintenance and repair expense. With respect to asset improvements, costs should be capitalized if: A. The estimated life of the asset is extended by more than 25%, or B. The costs result in an increase in the capacity of the asset, or C. The efficiency of the asset is increased by more than 10%, or D. Significantly changes the character of the asset, or E. Regarding street - if the work done impacts the "base" structure. Otherwise, the costs should be expensed as repair and maintenance. 3. Materials and Supplies: Any materials and supplies, regardless of costs, that are not permanent and will be consumed within a year are not considered a fixed asset. Guidelines set forth in the Office of Management and Budget (OMB) Circular A- 102 are adhered to with regards to capitalization polices. Capital assets are recorded at cost and are depreciated over their useful lives using the straight-line method as follows:
Description Estimated Useful Life
Land N/A
Building 20-30
Transit Stations & Bus Pads 2-15
Improvements other than buildings 2-15
Building Equipment 2-12
Vehicles 3-12
Furniture & Equipment 2-12
Leasehold Improvements 2-5
Systems 2-5

41
FINANCIAL POLICIES & PRACTICES
Back to Table of Contents
Depreciation is presented as a separate operating expense in the Statement of Revenue, Expenses and Changes in Net Assets. Expenditures for renewals and betterments that increase property lives are capitalized, and maintenance and repair costs are charged to operations as incurred. Discussion of the Capital Budget is detailed in a subsequent section. Risk Management
The Authority is exposed to various risks of loss related to third party liability claims; theft of, damage to, and destruction of assets; errors and omissions and injuries to employees. The Authority has a contract with an outside insurance company to provide all-risk property coverage with various limits on property and equipment of the Authority. As a governmental unit, Authority’s general and automobile liability are limited by the Texas Tort Claims Act to $100,000 for each person and $300,000 for each occurrence for bodily injury or death and $100,000 for each occurrence for injury to or destruction of property. The Authority is fully insured through the Texas Municipal League. The Authority provides employees healthcare benefits, which include medical, drug, dental, and vision. These benefits are provided through a self-funded insurance arrangement through a third party administrator. The coverage includes specific deductibles for up to $50,000 per individual claim and an annual aggregate estimated at about $1.2 million. Revenues
Passenger fares – User charges for utilizing the transit system. Fares are recorded as revenue when the cash fare is collected or a bus pass is sold regardless of when it is used. When the Authority began operations in 1986, the base fare was $0.50. In 1999, the Authority increased its base fare from $0.50 to $0.75. Since 2005, the Authority has maintained a fare recovery ratio (the ratio of fare revenue to the cost of providing the service was approximately) between 5.58% and 7.88%. The current fare structure and revenue levels are expected to generate an estimated $1.7 million in fare revenue for FY2017 and the fare recovery ratio is estimated at 5.62%. In Fiscal 2018, the fare recovery ratio is expected to be slightly higher than FY2016 at about 6.83% as a result of lower operating costs. This fare structure remains in effect and is assumed in the budget to remain in effect through Fiscal 2018. This assumption is based on the lengthy process that is required to make fare rate changes. The process may take a minimum of six (6) months to comply with the statutory requirements regulating the approval process along with the time needed to execute proper outreach activities for informing the public. Any considerations or

42
FINANCIAL POLICIES & PRACTICES
Back to Table of Contents
recommended revisions to the current fare structure must be approved by the Board and would incorporate the following objectives:
Improve system equity Increase revenue with minimal impact on ridership and without necessarily
increasing base fares Reduce the opportunity for fare evasion
Simplify the administration of the fare system for the operators Improve the clarity of the fare structure to customers
In 2011 new electronic fare box technology was implemented to improve critical functions of the fare box collection system such as passenger data collection and revenue control. This new technology has y ie lded h igher levels of fare enforcement by s treaml in ing the t ickets and passes program and s impl i fy ing admin istrat ive requirements for vehic le operators which has a l lowed the Author i ty to focus more t ime on safety and customers. The Authority’s historical fare recovery ratio and current fare structure is as follows:
YEAR RATIO
1995 8.72%
1996 8.67%
1997 9.22%
1998 8.78%
1999 8.49%
2000 8.36%
2001 7.48%
2002 6.85%
2003 6.79%
2004 6.55%
2005 6.58%
2006 7.31%
2007 7.88%
2008 7.62%
2009 7.41%
2010 6.93%
2011 6.98%
2012 6.76%
2013 6.93%
2014 6.70%
2015 6.37%
2016 5.74%
2017 5.50% Unaudited
2018 5.58% Unaudited

43
FINANCIAL POLICIES & PRACTICES
Back to Table of Contents
Current Fare Structure CCRTA offers single ride fares, as well as a multitude of pass products. Transfers are free on fixed-routes within two hours of the purchase of a regular or reduced fare. A higher fare is charged for express services. The fare structure offers discounts for eligible customers, including senior citizens, individuals with disabilities, Medicare card holders, and students with a valid ID. Reduced fares vary by time of day. During peaks, a cash reduced fare is $0.25, whereas during off-peak times, it is only $0.10 per ride. Pass prices are discounted over regular cash fares for regular and express services. The B-Line fare is only $1.25 per ride, which is less than what is allowed by the Americans with Disabilities Act. Current Fare Structure

44
FINANCIAL POLICIES & PRACTICES
Back to Table of Contents
Sales Tax Revenue - The Authority’s ½ cent sales tax revenue is accrued on a monthly basis based upon information provided by the Comptroller of Public Accounts. The Authority receives allocations on a monthly basis for two months prior. Sales tax continues to be the primary funding source for operations. The Authority’s ½ cent sales tax has not changed since it began in 1985. Capital Replacement and Improvement Grants - The Authority funds its capital improvements with sales taxes and grants from the Federal Transit Administration (FTA). Revenue is recognized when all eligibility requirements have been met. The grantor retains a reversionary interest in the capital asset over the estimated useful life of that asset. Expenses Compensated Leave – Substantially all employees of the Authority are eligible to receive compensation for vacations, holidays, illness and certain other qualifying leave. For certain kinds of leave, the number of days compensated is generally based on length of service. Vacation leave, which has been earned and vested but not paid, has been accrued in the accompanying financial statements. Sick leave for CCRTA administrative employees, which has been earned and vested but not paid, has been accrued in the accompanying financial statements for those employees with five years or more of service. Procurement – All Authority procurements are to be in accordance with sound public contracting policies and procedures. These policies are designed to provide timely delivery of goods and services, provide quality customer service and savings through obtaining the most competitive market price to meet or exceed the agency's needs, maintaining effective and user-friendly processes and systems, building strategic partnerships with internal customers, maintaining a pool of qualified suppliers and obtaining maximum value from supplier relationships, and providing educational tools for procurement team, customers and suppliers.

45
FINANCIAL POLICIES & PRACTICES
Back to Table of Contents
Certain Authority personnel have written authorization to perform purchasing and those purchasers must certify sufficient budget funding. The spending and approval process is as follows: ♦ under $500 – One verbal quote is required if the cost is determined to be fair and reasonable and the vendor is able to meet delivery and other requirements. SAP requires purchase orders for this spending limit to be signed by authorized department personnel and must contain the Buy’s signature. ♦ $500 to $750 – Require a minimum of two oral quotes from vendors. ♦ $750 to $2,000 – Require a minimum of two written quotes from vendors ♦ $2,000 to $15,000 – Require written quotes from vendor outreach. ♦ $2,000 to $15,000 repetitive purchases – Require a contract and written offers from vendor outreach. Authorized individual limits are established for each department. Purchase orders for spending ranging from $500 and $15,000 require the signature of approval from the Director of Finance in addition to signatures of authorized department personnel and Buyer. ♦ Over $15,000 – These larger transactions require more sophisticated methods than those used for smaller purchases. Special efforts are made to make the vendor community aware of the Authority’s requirements. The Authority generally a c c e p t s b i d s o r p r o p o s a l s f r o m a n y v e n d o r w h o w i s h e s t o participate in a competition. Solicitations are advertised. The basic types of procurement methods used for larger purchases are Invitation for Bids (IFB) and Request for Proposals (RFP). Generally, goods/commodities are purchased via IFB, whereas, services are generally purchased via RFP. In both cases, the Authority develops and provides advance notice to vendors in its vendor database. The notice gives a basic description of the item to be purchased, the order of magnitude and prompts vendors to return the notice to the Authority. The solicitation is developed and includes a detailed purchase description and/or statement of work, contractual terms and conditions, and instructions on how to submit an offer to the Authority. Solicitations remain open long enough for a response.

46
FINANCIAL POLICIES & PRACTICES
Back to Table of Contents
Reserves There are presently three reserves with specific uses attached to them. They are each explained as follows: ♦ Operating Reserve - This reserve is designed to meet emergency operating needs due to revenue shortfalls and unforeseen major operations-related expenditures. It is available to fund operations as needed throughout the year. The amount of annual funding shall be 25% of the budgeted operating expenses less the designated reserve amount earmarked for employee benefits. ♦ Employee Benefits Reserve - This reserve is designed to shield the Authority from the impacts of current economic uncertainties that may affect employee benefit costs. This reserve is also intended to protect the Authority’s financial position and bond rating. The initial reserve will be funded in the amount of $964,000 and will not exceed $1.2 million. This amount is equal to: The expected annual amortized cost of the unfunded accrued liability (UAAL) of the Defined Benefit Pension Plan for the plan year. Generally, this will be the annual amortized cost of the UAAL from the most recent actuarial report. Plus: An amount equal to 20% of the average self-funded health insurance costs as determined by the five most recent audited financial statements. If during a budget cycle or periodic updating of the Authority’s long-range financial projections, it becomes clear that funding in these reserves shall be needed for other purposes, the Chief Executive Officer shall inform the Board of the nature and amounts needed and obtain Board approval for such. ♦ Capital Reserve - This reserve is designed to cover the local share of grants authorized for the RTA, specifically including (1) those grants already under contract between the RTA and the granting authority, (2) pending grants for which applications have been submitted by the RTA, and (3) any other grants which have been authorized by the federal government or other funding source but are not yet the subject of a grant contract or application. The amount of annual funding to this reserve shall equal to 25% of the current year capital budget.

47
BASIS OF BUDGET
Back to Table of Contents
The Authority uses the proprietary fund system. Proprietary funds are used to account for operations that (a) are financed and operated in a similar manner to provide business where the intent of the governing body is that the costs of providing goods or services to be the general public on a continuing basis be financed or recovered primarily through user charges, or (b) where the governing body has decided that periodic determination of revenues earned, expenses incurred, and/or net income is appropriate for capital maintenance, public policy, management control, accountability or other purposes. The Agency has utilized one proprietary fund since its inception. As a proprietary fund, the budget is prepared on a full-accrual basis of accounting. This means that expenses are recognized as they are incurred and revenues are recognized when they are earned. Accounting records and financial statements are developed and maintained in accordance with generally accepted accounting principles (GAAP) meaning that the basis of budget is prepared on a full-accrual basis of accounting as is the basis of accounting used in the Agency’s audited financial statements. To prepare the budget, the Authority uses a zero-based budgeting concept. Each year, expenses must be justified to the Chief Executive Officer, Managing Directors, Director of Finance, and the budgeting staff. Revenue projections are developed based on service levels and ridership estimates. Estimated expenses are balanced to projected revenues. The Authority’s Comprehensive Annual Financial Report includes fiduciary funds for two pension plans that are not included in this annual budget document. Instead of a budget process, there are performance assumptions used for the defined benefit plan and an annual actuarial review. Employees direct the investing activities of their funds in the defined contribution plan. Measurement Focus, Basis of Accounting and Financial Statements The accounts of the Authority are organized as a proprietary fund. Proprietary funds account for operations that are financed and operated in a manner similar to a private business enterprise, where the intent is that costs of providing services to the general public on a continuing basis are financed or recovered through user charges. The Authority’s accounts are used for all Authority assets, liabilities, equities, revenues and expenses and are maintained on the accrual basis of accounting, Revenues from operations, investments and other sources are recorded when earned and expenses, including depreciation and amortization, of providing services to the public are accrued when incurred.

48
BUDGET PROCESS & BUDGET CALENDAR
Back to Table of Contents
Budget Process Chapter 451 of the Texas Transportation Code mandates that the Authority’s Board of Directors adopt an annual operating prior to the beginning of each fiscal year and before the Authority conducts any business for that year. The budget serves as a legal policy document and operations guide, a financial plan and a communication device. The Authority may not spend more than the approved operation budget, and must approve increases to the total appropriations by a budget amendment. The CEO may approve the movement of funds by using budget transfers within the approved budget. However, if these reallocations are significant, Board approval is obtained. Governing legislation further provides that the Board of Directors shall hold a public hearing on the proposed operating budget prior to its adoption and shall, at least fourteen days before the date of such hearing, make the proposed budget available to the public. After adoption, the Board may amend the budget after similar public notice and hearing. The Authority’s budget would require an amendment if operating expenditures will exceed the budgeted amount or if significant new initiatives arise during the year.
Annual Budget Calendar
Budget Event/Activity Month
Management Team provides year-end analysis, Economic Trends, Budget key issues & challenges, key assumptions, Budget Calendar
January
Board of Directors review Agency policies, mission & vision statements, market plan, safety & security plan, annual service plan, long-range goals, capital improvement
plan, and zero base budget approach guidelines
February
Board of Directors review preliminary year-end projections and assumptions, financial position, target goals, objectives, initiatives, & guidelines, set financial
goals, set direction and budget priorities
March
Management team develops objectives and strategies to achieve organizational goals
April
Department managers develop business plans that support achievement of
objectives
May
Board reviews strategic plan June
Management review current mid-year financial status, CIP status, Capital &
preventive maintenance grant status, finalized assumptions, Budget development process begins
July
Budget workshops begins July
Preliminary department budgets due, departmental and CEO reviews, trim notifications are provided, budgets are revised and reviewed,
August
Draft Budget submitted to Board, Public hearing date and adoption date set, post
public hearing, proposed budget document on line for public review, continue budget workshops
September
Board reviews proposed budget and holds public hearing on proposed budget, trim
notifications given, and if applicable revise proposed budget for review, continue budget workshops if needed
October
Board review final board document, continue budget workshops if needed November
Final Budget Adoption Deadline December 5, 2018 December
Approved budget document is published December
49
STRATEGIC PLANNING PROCESS
Back to Table of Contents
The strategic planning process began in early January 2018 with a prior year-end financial performance analysis by the management team in preparation for the upcoming board retreats. This evaluation process continued with an assessment of the internal and external factors that affected expectations. During the next three months Board retreats were held whereby the Board and management met to discuss these findings along with a review of CCRTA’s long-range vision and organizational mission and goals. It was through this process that the Vision Statement was revised to reflect the inspirational desires of the Board. The Vision Statement was changed to the following:
VISION STATEMENT
“Provide an integrated system of innovative, accessible and efficient public transportation services that increase access to opportunities and contribute to a healthy environment for the people in our service area.”
Process for Developing the Strategic Plan The Board and management team worked together to develop the FY2018 Strategic Plan with the aim of continuing the focus on the four mainstay goal areas of the Authority:
Explore service- enhancement to smaller cities Improve (maintain) our public image Maintain transparency efforts Financial information/ data presentation of it publicly Begin placing procurement activities in report (transparency) mechanism Maximize collaboration between private sector and academia (research and
development)
Enhance the customer service experience Identify services Improved contact with citizens on demand issues
Look into multi-modal possibilities Alternate forms of personal transportation Enhancement of video usage (real-time, reaction-time, capability improvement)
Annual service levels were developed based on these strategic objectives and goals. Each department develops a business plan and a budget that supports the service levels and the objectives in the strategic plan. Two short-term factors guided the development of the annual budget. One was the uncertainty of the regional economy and the other is the uncertainty of the street construction timelines. As a result, a conservative approach was used to develop the budget. Service changes are provided in detail at the end of this document as a supplemental source of information.

50
STRATEGIC PLANNING PROCESS FLOWCHART
Back to Table of Contents
Year-end
Performance
Analysis
Public/Stakeholders
Input Market Research
Board of Directors
Budget Planning Process Service Planning Process
Strategic Plan
5-Year Service Plan
Comprehensive Operational
Analysis (COA)
Departmental
Business Plans
Draft Annual
Service Plan
Proposed Budget Document
Board of Directors Review
Public Review
Budget Adoption
Budget Execution and Implementation
Measure and monitor performance
Review impact of service change on budget
Service & CIP Guidelines
January Service Changes
May Services Changes
Budget
Amendment
Required?
August Service Changes
5-YR CIP Plan 20-YR Long Range System
Plan

51
PERFORMANCE MEASURES
Back to Table of Contents

52
Back to Table of Contents
FUND BALANCE AND RESERVES/CONTINGENCY REQUIREMENTS
In accordance with CCRTA’s strong financial policies and sound governmental financial practices, CCRTA accumulates and maintains adequate fund balances to help stabilize the budget when needed or for future spending requirements. A healthy fund balance is necessary to provide a safety net that will guard the Agency’s financial position and provide for emergencies or unforeseen events particularly in a capital and labor intensive industry that is funded primarily with sales tax revenues. To mitigate the effects of budget and cash flow shortages the Agency relies on annual updates to the 20-year financial plan to provide the funding framework for identifying our spending need based on the projected funds available. Our ability to provide the quality of service that our riders deserve is dependent on the short and long strategic planning that is required by the 20-year financial plan. During the preparation and execution of the annual budget, the guidelines from the fund balance policies are used to ensure that sufficient reserves are maintained. The fund balance is structured with three reserve components: restricted, assigned, and unrestricted. The portion of the fund balance that is restricted is imposed by statutory requirements while the assigned portion is imposed by the Agency. At the end of 2018 the fund balance is projected to be $27,469,514. The projection is based on the audited FY 2017 beginning balance of $27,299,129, the addition of the projected FY 2018 surplus of $632,904, less the assigned restriction of $462,519 to cover the local share of capital projects that are projected to be completed in FY 2019. In FY 2019 the contingencies and fund balance restrictions totaling $16,103,328 are projected to reduce the available and unrestricted portion of the fund balance to $11,366,186. Section 451.134 of the Public Transportation Code requires CCRTA to accumulate an operating reserve that is not less than an amount equal to actual operating expenses for two months. Operating expenses are projected at $33,377,866 which calculates to a statutory reserve of $5,562,978. However, CCRTA’s fund balance policies are more stringent and call for an amount equal to 25% of the operating budget less the amount calculated for employee benefit reserve. Consequently, the operating reserve is at $8,344,467 and the employee benefit assigned reserve is at $1,200,000. In addition, the fund balance policy also calls for a capital budget reserve of $1,348,353 which represents 25% of the total project costs of the FY 2019 Capital Budget. In addition to these contingencies which total $10,892,820, the fund balance is also further encumbered with $2,410,428 to cover the costs of capital projections rolling forward from previous years reducing the available projected fund balance by $16,103,328.
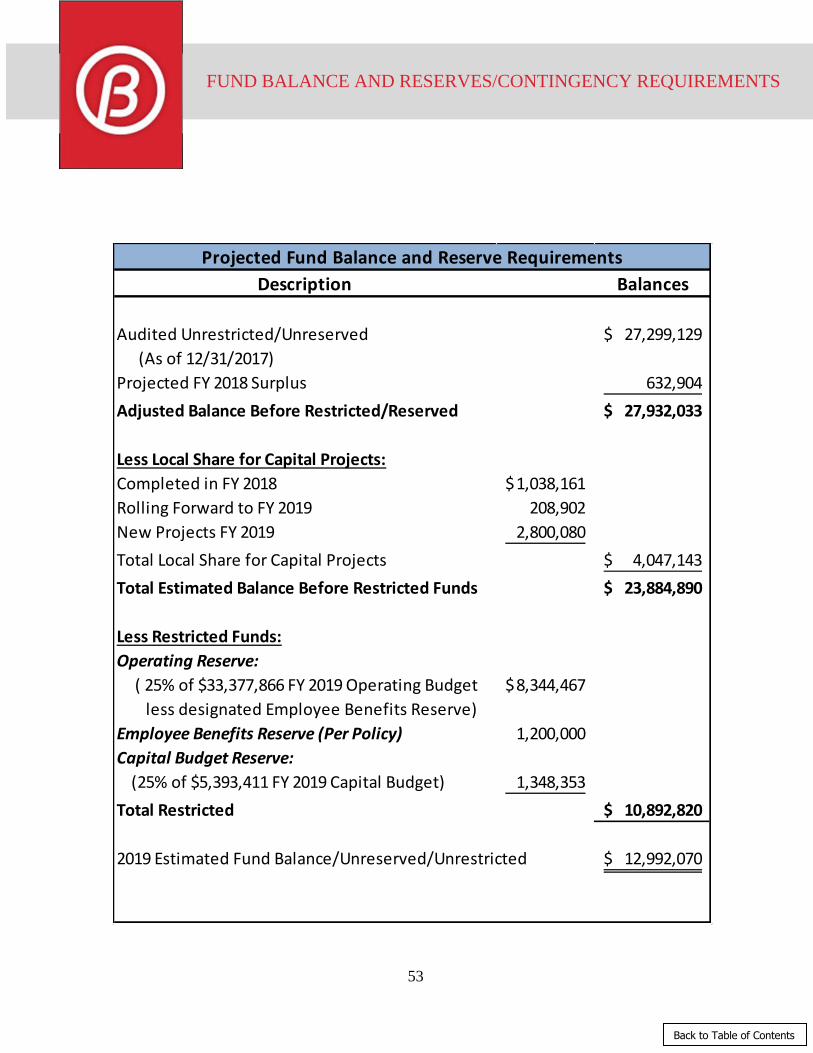
53
Back to Table of Contents
FUND BALANCE AND RESERVES/CONTINGENCY REQUIREMENTS
Description Balances
Audited Unrestricted/Unreserved 27,299,129$
(As of 12/31/2017)
Projected FY 2018 Surplus 632,904
Adjusted Balance Before Restricted/Reserved 27,932,033$
Less Local Share for Capital Projects:
Completed in FY 2018 1,038,161$
Rolling Forward to FY 2019 208,902
New Projects FY 2019 2,800,080
Total Local Share for Capital Projects 4,047,143$
Total Estimated Balance Before Restricted Funds 23,884,890$
Less Restricted Funds:
Operating Reserve:
( 25% of $33,377,866 FY 2019 Operating Budget 8,344,467$
less designated Employee Benefits Reserve)
Employee Benefits Reserve (Per Policy) 1,200,000
Capital Budget Reserve:
(25% of $5,393,411 FY 2019 Capital Budget) 1,348,353
Total Restricted 10,892,820$
2019 Estimated Fund Balance/Unreserved/Unrestricted 12,992,070$
Projected Fund Balance and Reserve Requirements

54
Back to Table of Contents
SOURCES AND USES OF FUNDS
Sources of Funds Total sources of funds as shown below consists of seven major revenue categories, projected at $44,987,639, which is 2.87% higher than the FY 2018 budget. Sales tax represents 78.06% of the total revenues and is projected to increase 9.03% from 2018, which, indicates the strengthening of the regional economy. The revenue stream from lease income at the new Staples Street Center is included in the investment Income. A portion of the increase is due to expected income generated from the Staples Station Center fully leased.
Uses of Funds Total uses of funds as shown below is projected at $44,354,735 which is $4,625,709 or 11.64% higher that FY 2018. The overall increase is attributed to the increase in health care insurance expense resulting from increased premiums. In addition two expense categories reflect the additional expense increases which are the grant reimbursement activities to sub-recipients and the operations from the new Staples Street Center (which is included in the operating expenses).
FY17
ACTUALS CATEGORY
FY18
BUDGET
FY19
BUDGET
$
CHANGE
%
CHANGE
1,696,742$ Operating Revenues 1,831,575$ 1,875,437$ 43,862$ 2.39%
146,452$ Bus Advertising 146,453$ 135,000$ (11,453)$ -7.82%
659,228$ Other Operating Revenues 4,507,902$ 1,808,970$ (2,698,932)$ -59.87%
32,570,355$ Sales and Use Tax 32,205,606$ 35,115,261$ 2,909,655$ 9.03%
4,618,731$ Federal and Other Grants 4,952,699$ 5,711,247$ 758,548$ 15.32%
85,535$ Investment Income 78,960$ 341,724$ 262,764$ 332.78%
(269,101)$ Gain/Loss on Property Disposed 7,575$ -$ (7,575)$ -100.00%
39,507,942$ Total Sources of Funds 43,730,770$ 44,987,639$ 1,256,869$ 2.87%
FY17
ACTUALS CATEGORY
FY18
BUDGET
FY19
BUDGET
$
CHANGE
%
CHANGE
30,836,739$ Operating Expenses (net of lease revenue) 30,624,732$ 34,708,629$ 4,083,897$ 13.34%
3,003,298$ Street Improvement Program 2,828,222$ 3,006,967$ 178,745$ 6.32%
8,271,963$ Depreciation Expense 4,398,419$ 4,287,705$ (110,714)$ -2.52%
1,047,287$ Debt Service (Principal & Interest) 1,605,708$ 1,605,570$ (138)$ -0.01%
99,479$ Sub-Receipient Grant Reimbursements 271,945$ 745,864$ 473,919$ 174.27%
43,258,766$ Total Uses of Funds 39,729,026$ 44,354,735$ 4,625,709$ 11.64%

55
Back to Table of Contents
SOURCES AND USES OF FUNDS
Five-Year Sources and Uses Funding Plan
Five-Year Forecast Assumptions
This table depicts our five-year forecast assumptions which illustrates that inflows will be sufficient to cover the projected operational expenses and capital projects. Assumptions include sales tax projections remaining at 1.1% until FY 2021 then decrease to 1.003% in 2023 when the local market is expected to weaken and supports the decrease. A CPI of 1.03% is factored into the operating expenses for FY 2020 but increases to 1.08%, 1.005% and 1.055% respectively.
Inflows 2019 2020 2021 2022 2023
Revenues
Operating Revenues
Fare Box Revenue 1,875,437$ 1,912,946$ 1,951,205$ 1,970,717$ 1,990,424$
Bus Advertising 135,000 139,050 143,222 147,518 151,944$
Other Income 529,167 529,167 529,167 529,167 529,167
Total Operating Revenues 2,539,604 2,581,163 2,623,593 2,647,402 2,671,535$
Non-Operating Revenues
Sales Tax Revenue 35,115,261 38,626,787 39,013,055 39,208,120 39,404,161$
Staples Street Center 478,304 490,849 424,465 424,465 424,465
Interst Income 341,724 358,810 365,986 384,286 403,500
Sale of Assets - 34,500 46,000 22,000 25,000
Total Non-Operating Revenues 35,935,289 39,510,946 39,849,507 40,038,871 40,257,126
Grants
Operating Related Grants 188,072 18,092 - - 800,000
Operating Grants (Overhauls) 611,928 781,908 339,960 - -
Sub-Recipients 292,557 - - - -
Capital Grants 5,420,189 10,101,046 1,174,742 4,770,116 701,778$
Total Grant Revenue 6,512,746 10,901,046 1,514,702 4,770,116 1,501,778
TOTAL REVENUES 44,987,639$ 52,993,155$ 43,987,802$ 47,456,389$ 44,430,438$
Operating Expenses 30,694,453$ 31,615,287$ 34,144,509$ 34,315,232$ 36,202,570$
Sub-Recipients 292,557$ -$ -$ -$ -$
Street Maintenance Program 2,800,000$ 3,375,981$ 3,409,741$ 3,348,373$ 3,439,983$
Total Operating & Non-Operating 33,787,010$ 34,991,268$ 37,554,250$ 37,663,606$ 39,642,553$
Capital Program Expenses 5,371,844$ 14,143,016$ 2,451,017$ 6,063,645$ 988,594$
Staples Street Center 875,153$ 918,911$ 946,478$ 974,872$ 1,004,118$
Debt Service Expenses
Bond Principal 555,000$ 570,000$ 595,000$ 620,000$ 640,000$
Bond Interest 1,050,570 1,034,908 1,009,770 987,565 966,345
Pension Additonal Annual Contribution 717,000 717,000 717,000 717,000 717,000
Total Debt Expenses 2,322,570$ 2,321,908$ 2,321,770$ 2,324,565$ 2,323,345$
Total Expenses 42,356,577$ 52,375,102$ 43,273,515$ 47,026,688$ 43,958,611$
Revenue Over Expenses (Excluding Depreciation) 2,631,062$ 618,053$ 714,286$ 429,701$ 471,828$
Depreciation 2019 2020 2021 2022 2023
Local Share (100%) 3,275,577$ 3,633,818$ 3,679,723$ 3,739,183$ 3,766,516$
Federal Share (20%) 948,964$ 1,100,395$ 1,115,901$ 1,150,002$ 1,157,021$
Total Depreciation Expense 4,224,541$ 4,734,213$ 4,795,624$ 4,889,185$ 4,923,537$

56
Back to Table of Contents
2020 Strategic Plan Overview Vision “Provide an integrated system of innovative, accessible and efficient public transportation services that increase access to
opportunities and contribute to a healthy environment for the people in our service area.” Mission The Corpus Christi Regional Transportation Authority was created by the people to provide quality transportation and enhance
the regional economy in a responsible manner consistent with its financial resources and the diverse needs of the people. Goal Areas Customer
Service/Satisfaction Leadership Community Value Organizational
Development Goal
(Initiatives / Priorities)
1. Deliver the best possible experience
2. Enhance awareness of Agency in the Region
3.Enhance awareness of the value of the transportation system in
the community
4. Continue to improve organizational practices
Objectives Promote a culture of safety Improve lighting in bus
stops; Upgrade security software & hardware; Automate accident investigation process; Automate Officers and Facilities Assessment process; Focus on employee safety training & re-
training; Continue quarterly safety meetings; Continue with safety plan awareness campaign Improve efficiency & effective services delivery:
Evaluate KPI’s monthly
and identify area of transit improvement through Comprehensive Operational Analysis
1.3 Pursue construction discipline to increase reliability & customer service by targeting:
Visual attractiveness of services with bus stop and bench improvements; Provide adequate shading at bus stops;
Passenger amenities
Transfer Station construction, SSC & Remodeling projects
1.4 Continue Operation “Deep Clean” by maintaining vehicles, facilities, and amenities clean
Promote boarding experiences with technological services
with On-Board Monitors Mobile Ticketing and real time passenger
info system
1.7 Increase customer feedback through surveys to increase interaction with customer service
2.1 Promote Brand Awareness
2.2 Continue Community
Report/Faces Campaign
2.3 Continue Bus and
Sponsorships
2.4 Focus efforts on annual marketing plan, ridership campaigns utilizing fact cards and social media platforms/metric for measuring awareness 2.5 Expand DBE program to include local funds 2.6 Pursue service expansion opportunities – San Patricio County, College and University Programs, Phase II of Vamonos – Convert Route 27 to PTN, Vanpool Program, Bicycle Program, Park and Rides, and service to new developments
3.1 Pursue new funding streams to sustain long and short term growth
3.2 Continue to pursue financial stability of Agency by optimizing available resources through effective budget controls, procurement management, management of capital projects, updated short and long financial plans including cash flow projections and capital improvement plans 3.3 Pursue participation in Downtown Redevelopment Planning
3.4 Continue programs to
increase ridership’s - Develop new ridership markets –
3.5 Strengthen relationships with stakeholders, public and private sector in support of economic development; develop strong internal & external collaborative relationships 3.6 Pursue and respond to public needs 3.7 Continue to provide safe, dependable, and comfortable public transportation services
3.8 Continue to use core values in every aspect of the Agency
4.1 Continue workforce development by providing career development
programs & workflow optimization through updated training, policies & procedural manuals and technological platform manuals 4.2 Continue to evaluate cost controls and adjust accordingly with automation
and more training including customer service. 4.3 Pursue compensation and wage studies to maintain workforce market competitiveness in support of Agency’s goals and
objectives
4.4 Continue to use internship programs as a recruiting tool to promote
new specialized strengths
4.5 Implement Board
Engagement priorities for: Automated Board Agenda Process, Social Media Training, Board Policy Review and quarterly board retreats 4.6 CIP - Improve ability to track fulfillment of strategic objectives and lower costs; Implement State of Good Repair Management

57
TWENTY-YEAR FINANCIAL PLAN
Back to Table of Contents
The budget process is guided by a Twenty-Year Financial Plan that is updated annually. The plan reflects the dynamics of the region and identifies the current and future needs based on population projections and travel patterns. Projections include estimating operating revenues, funding, operating expenses, capital expenditures, and other financial information. Updating the plan annually allows management to identify the affordability levels required by system expansion and maintenance commitments, operating requirements, and debt repayment. The plan is an integral part of the strategic planning process that is necessary to successfully achieve the short term as well as the long term goals of the Board while maintaining the sustainability of a robust transit network. The first step however in planning long-term goals is to determine the amount of funds needed to cover the short term expenses. Once this is accomplished we have the means to determine how much to invest in projects that take more than one year to complete. From this point steps are taken to update the 20-Year Financial Plan accordingly which provides the information needed for budget development. As you can see from the below tables our Twenty-Year Financial Plan projects that inflows are expected to be sufficient to cover the operational and capital needs of the Agency. The Plan also reflects a positive fund balance. In the first five years of the plan we anticipate funding approximately $363,843,471 in capital projects and approximately $257,893,471 through FY 2037. Through 2022 capital expenditures have no impact on the operating budget as they are either replacing or upgrading existing assets.
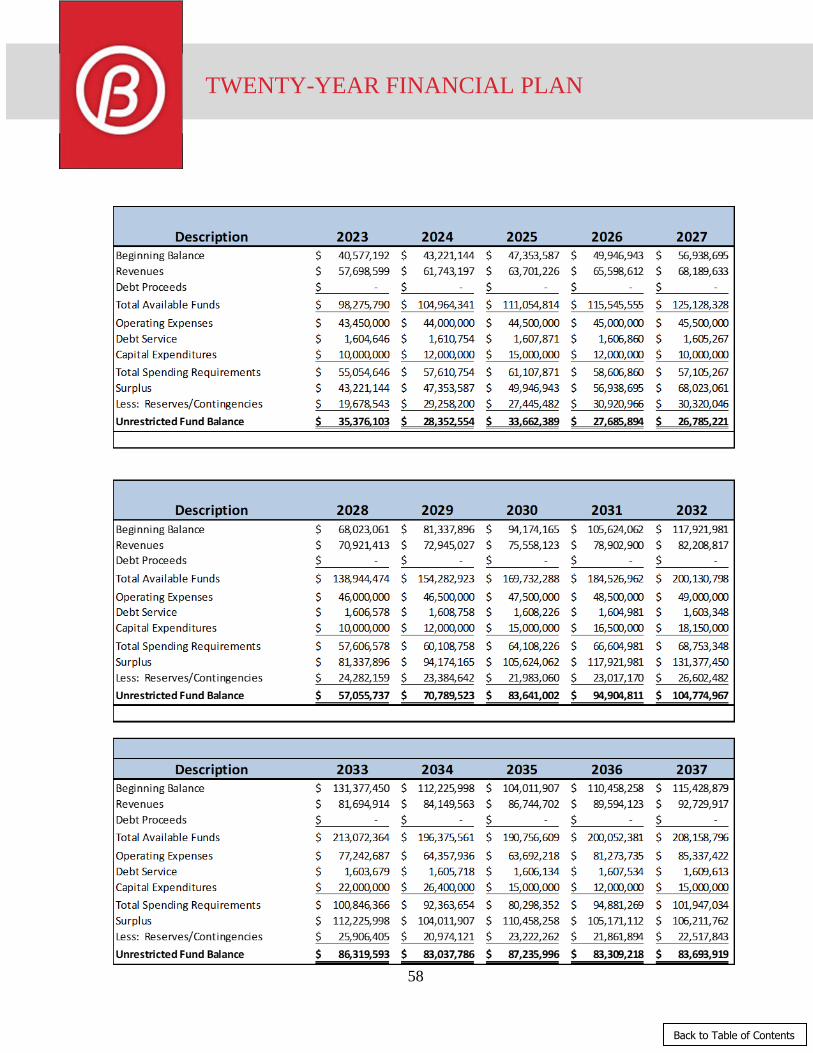
58
TWENTY-YEAR FINANCIAL PLAN
Back to Table of Contents

59
ANNUAL OPERATING BUDGET
Back to Table of Contents
The exhibit below provides a summary view of the FY 2019 Annual Budget which calls for $49,748,146 and consists of an operating budget in the amount of $44,354,735 and a capital budget of $5,393,411. The operating budget has increased from the previous year 4,485,346 and the capital budget decreased by $757,537. The increase in the capital budget is due to health insurance premium increases.
FY17
Actuals Category FY18 Budget FY19 Budget
$
Change
%
Change
$43,258,766 Operating Budget $39,869,389 $44,354,735 $4,485,346 11.25%
7,549,339 Capital Budget 4,635,874 5,393,411 $757,537 16.34%
$50,808,105 Total Uses of Fund $44,505,263 $49,748,146 $2,464,126 11.78%

60
ANNUAL OPERATING BUDGET
Back to Table of Contents
Revenue by Category The below schedule shows FY 2019 revenue projections along with the net change in dollars and percentage from the FY 2018 budget.
BUDGET ESTIMATED PROPOSED
2018 2018 2019
Operating Revenues
PASSENGER FARES $846,377 $880,858 $880,858 $34,481 4.07%
PRESOLD PASSES/TICKET $232,505 $204,538 $216,810 ($15,695) -6.75%
SERVICE CONTRACTS $265,000 $317,211 $368,255 $103,255 38.96%
STUDENT TICKETS $2,906 $2,059 $2,183 ($723) 100.00%
PORT ARANSAS SERVICES $0 $550 $550 $550 100.00%
HARBOR FERRY $0 $112 $281 $281 0.00%
EXPRESS FARES - PARK AND RIDE $160,000 $177,925 $188,600 $28,600 17.88%
EXPRESS FARES - COMMUTER CARDS $4,406 $1,316 $1,395 ($3,011) -68.34%
DEMAND RESPONSE $170,878 $205,065 $217,368 $46,490 27.21%
VANPOOL REVENUE $69,167 $0 $0 ($69,167) -100.00%
BUS BENCH ADVERTISING $164,561 $128,454 $135,000 ($29,561) -17.96%
OTHER OPERATING REVENUE $521,549 $688,455 $549,891 $28,342 5.43%
TOTAL OPERATING REVENUE $2,437,349 $2,606,543 $2,561,191 $123,842 5.08%
Non-Operating Revenues
INVESTMENT INCOME $78,960 $318,049 $341,724 $262,764 332.78%
GAIN(LOSS) ASSET DISPOSAL $7,575 $7,575 $0 ($7,575) -100.00%
STAPLES STREET CENTER $458,216 $336,198 $458,216 $0 0.00%
SALES TAX REVENUES $32,205,606 $34,247,213 $35,115,261 $2,909,655 9.03%
FEDERAL CAPITAL GRANTS $8,543,064 $3,644,654 $6,511,247 ($2,031,817) -23.78%
TOTAL NON-OPERATING REVENUES $41,293,421 $38,553,689 $42,426,448 $1,133,027 2.74%
TOTAL FUND REVENUES $43,730,770 $41,160,232 $44,987,639 $1,256,869 2.87%
REVENUES
FY 2018 FY 2019
Fund Revenues $ Change % Change
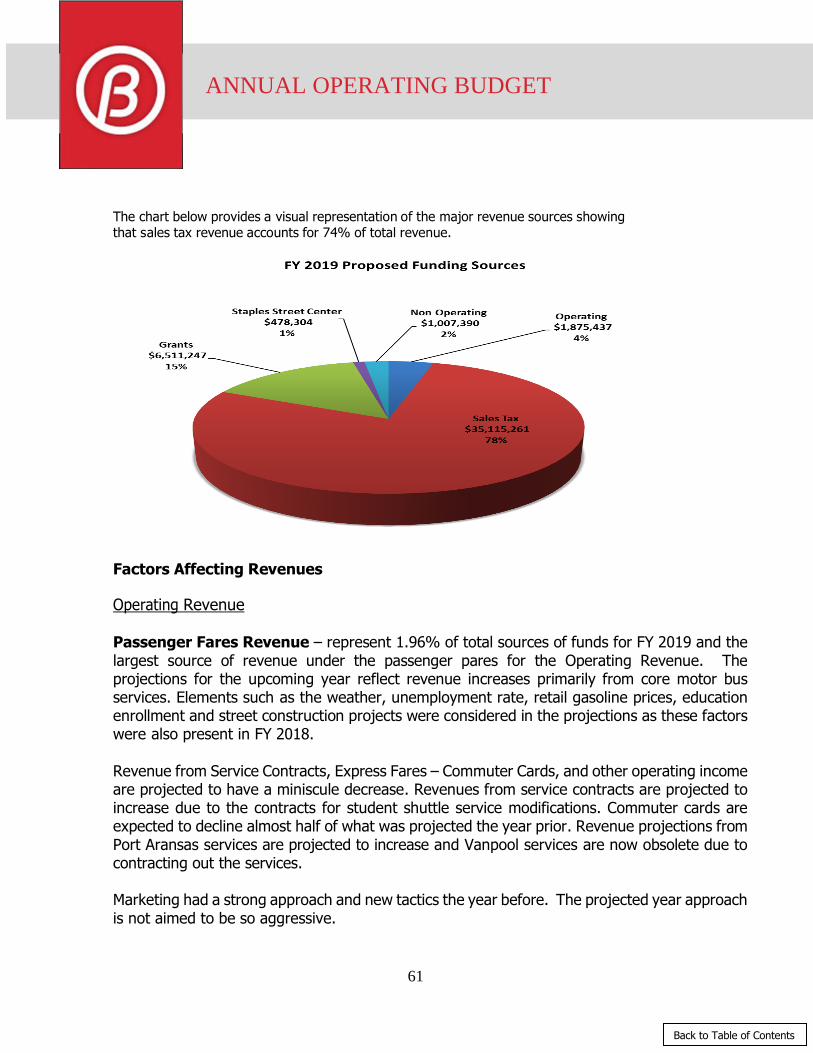
61
ANNUAL OPERATING BUDGET
Back to Table of Contents
The chart below provides a visual representation of the major revenue sources showing that sales tax revenue accounts for 74% of total revenue.
Factors Affecting Revenues Operating Revenue Passenger Fares Revenue – represent 1.96% of total sources of funds for FY 2019 and the largest source of revenue under the passenger pares for the Operating Revenue. The projections for the upcoming year reflect revenue increases primarily from core motor bus services. Elements such as the weather, unemployment rate, retail gasoline prices, education enrollment and street construction projects were considered in the projections as these factors were also present in FY 2018. Revenue from Service Contracts, Express Fares – Commuter Cards, and other operating income are projected to have a miniscule decrease. Revenues from service contracts are projected to increase due to the contracts for student shuttle service modifications. Commuter cards are expected to decline almost half of what was projected the year prior. Revenue projections from Port Aransas services are projected to increase and Vanpool services are now obsolete due to contracting out the services. Marketing had a strong approach and new tactics the year before. The projected year approach is not aimed to be so aggressive.
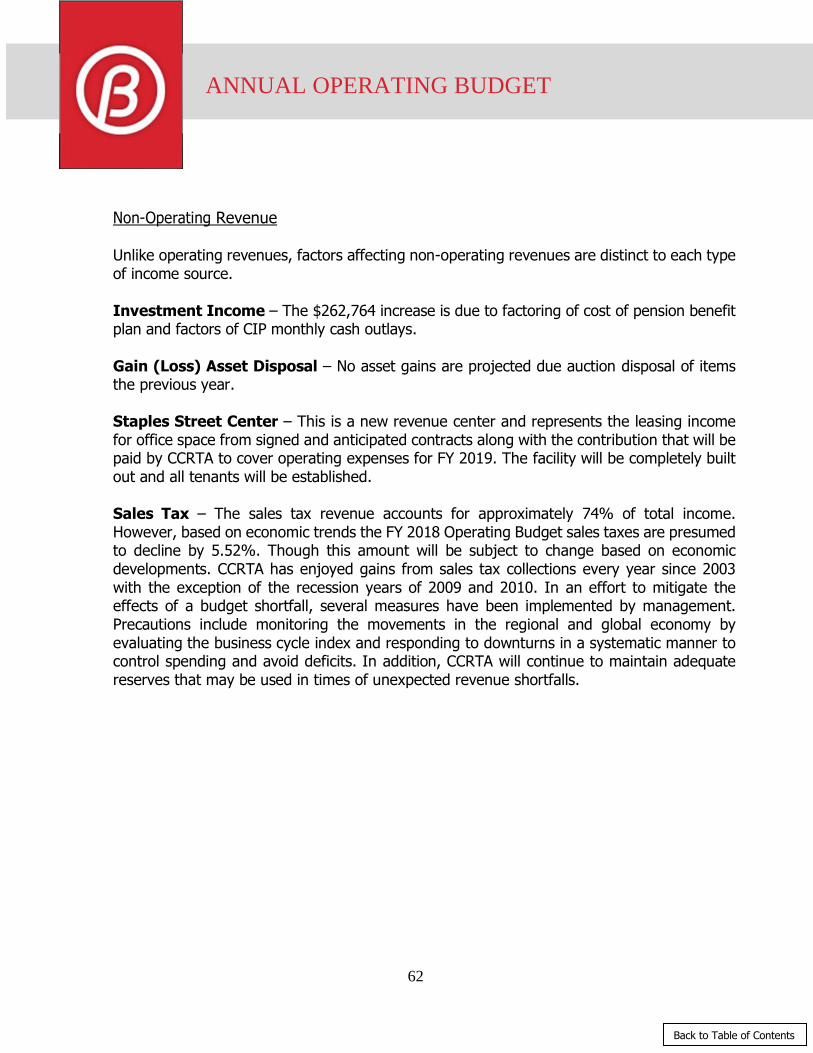
62
ANNUAL OPERATING BUDGET
Back to Table of Contents
Non-Operating Revenue Unlike operating revenues, factors affecting non-operating revenues are distinct to each type of income source.
Investment Income – The $262,764 increase is due to factoring of cost of pension benefit plan and factors of CIP monthly cash outlays.
Gain (Loss) Asset Disposal – No asset gains are projected due auction disposal of items the previous year. Staples Street Center – This is a new revenue center and represents the leasing income for office space from signed and anticipated contracts along with the contribution that will be paid by CCRTA to cover operating expenses for FY 2019. The facility will be completely built out and all tenants will be established. Sales Tax – The sales tax revenue accounts for approximately 74% of total income. However, based on economic trends the FY 2018 Operating Budget sales taxes are presumed to decline by 5.52%. Though this amount will be subject to change based on economic developments. CCRTA has enjoyed gains from sales tax collections every year since 2003 with the exception of the recession years of 2009 and 2010. In an effort to mitigate the effects of a budget shortfall, several measures have been implemented by management. Precautions include monitoring the movements in the regional and global economy by evaluating the business cycle index and responding to downturns in a systematic manner to control spending and avoid deficits. In addition, CCRTA will continue to maintain adequate reserves that may be used in times of unexpected revenue shortfalls.

63
ANNUAL OPERATING BUDGET
Back to Table of Contents

64
ANNUAL OPERATING BUDGET
Back to Table of Contents
Operating Grants The Urbanized Area Formula Grant Program (49 U.S.C 5307) makes federal funding from the Federal Transit Administration (FTA available to CCRTA for authorized projects and initiatives under prescribed legislative formulas. Since CCRTA falls under the urbanized area with 200,000 in population and over, funds are apportioned and flow directly to the Agency as a designated recipient. Eligible projects included: Transit planning projects Engineering design and evaluation
Capital Investment in fleet replacement of buses Security equipment and crime prevention
Construction and maintenance of crime prevention computer hardware and software
Preventive maintenance costs CCRTA also utilizes federal funding from other formula grant programs such as: 5310 – Seniors and Individuals with Disabilities 5316, - Job Access: Route Frequency Improvements
5317 - New Freedom Flexible Route Service It is noted that funds from the 5317 New Freedom Program will assist CCRTA in furthering the Agency’s ADA commitment as the program is for capital and operating expenses for new public transportation services and new public transportation alternatives that go beyond the requirements of the Americans with Disabilities Act of 1990.
In FY2018 CCRTA had projects totaling $7,684,937 in progress. Close to 78.26% of these projects will be grant funded. Of these grant funded project, eighty percent of the cost or $4,409,163 will be funded by these formula grants. Twenty percent of federal funds will flow to projects relating to individuals with disabilities while earmarking the balance of federal funds as follows:
11.10% for preventive maintenance
2.46% for eligible new jobs
66.44% for bus replacements.

65
ANNUAL OPERATING BUDGET
Back to Table of Contents
Operating Expense by Category
Personnel cost represent the largest investment of the agency accounting for 34% of the total operating budget.
2017 2018 2019
EXPENSE CATEGORY ACTUAL BUDGET ESTIMATED PROPOSED
BUDGET TO
BUDGET
CHANGE
% CHANGE
Salaries & Benefits 14,254,047 $13,930,569 $13,576,982 $15,237,700 $1,307,132 9.38%
Services 3,265,661 $3,277,293 $2,979,692 $4,159,229 $881,936 26.91%
Materials & Supplies 3,025,468 $3,264,802 $2,621,521 $3,246,402 -$18,400 -0.56%
Utilities 695,316 $795,114 $614,931 $704,111 -$91,003 -11.45%
Insurance 4,026,603 $3,158,482 $3,802,354 $4,254,242 $1,095,760 34.69%
Purchased Transportation 5,558,295 $5,754,039 $6,498,131 $6,464,442 $710,403 12.35%
Miscellaneous 435,107 $680,245 $331,271 $1,337,774 $657,529 96.66%
Interest 1,046,487 $1,604,908 $1,028,985 $1,605,570 $662 0.04%
Leases & Rentals 33,789 $36,934 $33,939 $50,594 $13,660 36.98%
Street Maintenance 4,429,985 $2,828,222 $4,398,419 $3,006,967 $178,745 6.32%
Depreciation 4,249,998 $4,398,419 $2,828,222 $4,287,705 -$110,714 -2.52%
TOTAL 01 FUND EXPENDITURES $41,020,756 $39,729,025 $38,714,447 $44,354,735 $4,625,710 11.64%

66
ANNUAL OPERATING BUDGET
Back to Table of Contents
Factors Affecting Operating Expenses
Salaries and Benefits- The 9.38% increase is a result of increases in refunding FTE’s
COLA, and step increases. In addition a reserve has been set aside to cover the adjustments for a compensation study that will be completed in 2019.
Services- Costs for contracted services in the facilities department are expected to increase. Services include refuse collection services, building and shelter maintenance and CNG fueling station maintenance.
Materials & Supplies – There is a decrease from new cost efficient contracts and new cost cutting methods.
Utilities – The decrease in this line item is due to the new cost efficient contract of energy costs for both facilities.
Insurance - The cost of insuring the Agency’s Assets and providing health insurance
through a self-insured program is expected to increase 34.69% due to increase in premiums.
Purchased Transportation – The costs in Purchased Transportation is projected to increase by 12% in order to incorporate the Fall Service Improvements.
Miscellaneous – The budget is projected to increase due to intergovernmental expense which is a federal grant that compensates the expenditure.
Leases & Rentals – This budget includes a minor increase in equipment rental & leasing
costs.
Transfer to Capital/SSC- Moving local funds to cover the cost of capital projects is not necessary in FY2019.
Street Maintenance – The budget includes a 6.32% increase to participating communities for street repairs. The amount is indexed to annual sales tax revenues and is payable through inter-local agreements in consideration for rehabilitating streets used by CCRTA for transit operations within its service region.
Depreciation – FY 2019 budget depreciation expense declined due to covering 100% of local depreciation and 20% of Federal Depreciation.

67
ANNUAL OPERATING BUDGET
Back to Table of Contents
Operating Budget Summary
The Budget Summary provides an overall comparative budget-to-budget analysis of the Sources and Uses of Funding between the Proposed FY2018 and the Adopted FY2017.
This graph shows the expenditure composition and illustrates that 75% of the budget is used to fund operations including administrative support operations.
Description
2018
Adopted
Budget
2018
Estimates
2019
Proposed
Budget to
Budget
Change
Budget
to
Budget %
Source of Funding
Operating Revenues 1,750,235$ 1,789,881$ 1,875,437$ 125,202$ 7.15%
Advertising Revenue 81,340 128,454 135,000 53,660$ 65.97%
Sales Tax Revenue 32,205,606 34,247,213 35,115,261 2,909,655$ 9.03%
Grants 8,543,064 3,644,654 6,511,247 (2,031,817)$ -23.78%
Other Income 1,150,526 1,350,031 1,350,694 200,169$ 17.40%
Total Source of Funds 43,730,770$ 41,160,233$ 44,987,639$ 1,256,869$ 2.87%
Uses of Funding
Department Expenses 29,769,619$ 27,737,578$ 33,377,866$ 3,608,247$ 12.12%
Debt Service 1,605,708 1,605,570 1,605,570 (138)$ -0.01%
Staples Street Center 805,115 986,323 986,323 181,208$ 100.00%
Port Ayers Cost Center 50,000 344,440 344,440 294,440$ 100.00%
Capital Transfer Out - - - -$ 100.00%
Sub-Recipient Grant Agreements 271,945 745,864 745,864 473,919$ 100.00%
Street Maintenance 2,828,222 3,006,967 3,006,967 178,745$ 6.32%
Depreciation 4,398,419 4,287,705 4,287,705 (110,714)$ -2.52%
Total Uses of Funding 39,729,028$ 38,714,447$ 44,354,735$ 4,625,707$ 11.64%
Sources in Excess of Uses/Net Income 4,001,742$ 2,445,786$ 632,904$ (3,368,838)$
BUDGET SUMMARY
$33,377,866 75%
$986,323 2%
$4,287,705 10%
$3,006,967 7%
$1,605,570 3%
FY 2019 Expenditure Composition
Departmental Expenses
Staples Street Center
Depreciation
Street Improvement
Port Ayers Cost Center
Sub-Recipent Agreements
Debt Service
$44,354,735

68
ANNUAL OPERATING BUDGET
Back to Table of Contents
Operating Budgets By Department
This table expands on the 75% funding for operations by providing a listing of the departmental budgets along with the department’s percentage relative to the entire operating budget to illustrate the funding levels of each department.
DEPARTMENT
Proposed
FY2019 % of Budget
01 TRANSPORTATION $7,111,538 16.03%
02 CUSTOMER SERVICE CENTER $386,696 0.87%
03 PURCHASED TRANSPORTATION $6,464,442 14.57%
04 SERVICE DEVELOPMENT $437,883 0.99%
07 MIS $941,702 2.12%
11 VEHICLE MAINTENANCE $4,846,441 10.93%
21 FACILITIES MANAGEMENT $2,069,772 4.67%
40 PROCUREMENT $220,988 0.50%
41 CEO $708,526 1.60%
42 FINANCE AND ACCOUNTING $573,744 1.29%
43 MATERIALS MANAGEMENT $136,364 0.31%
44 HUMAN RESOURCES $6,211,818 14.00%
45 ADMINISTRATION $608,498 1.37%
49 INFASTRUCTURE PROGRAMS $170,127 0.38%
50 MARKETING AND COMMUNICATION $583,200 1.31%
52 SECURITY $1,361,127 3.07%
65 DEBT SERVICE $1,605,570 3.62%
77 STAPLE STREET CENTER $986,323 2.22%
78 PORT AYERS COST CENTER $344,440 0.78%
80 TRANSFER TO CIP $0 0.00%
83 SPECIAL PROJECTS $545,000 1.23%
85-SUBRECIPIENT GRANT AGREEMENTS $745,864 1.68%
88 STREET MAINTENANCE $3,006,967 6.78%
90 DEPRECIATION $4,287,705 9.67%
TOTAL EXPENSES $44,354,735 100.00%

69
RIDERSHIP STATISTICS AND PERFORMANCE TRENDS
Back to Table of Contents
This system-wide monthly operations performance report contains monthly and Year-to-Date
(YTD) operating statistics and performance measurement summaries containing ridership,
performance metrics by service type, miles between road calls and customer service feedback.

70
RIDERSHIP STATISTICS AND PERFORMANCE TRENDS
Back to Table of Contents
1. System-wide Ridership and Service Performance Results
Boardings for all services in December 2018 totaled 415,137. This represents a 6.0% increase as
compared to 391,511 boardings in December 2017 or 23,626 more boardings this month.
December 2018 December 2017 Variance
20 Weekdays 20 Weekdays -
5 Saturdays 5 Saturdays -
5 Sundays 5 Sundays -
1 Holiday reduced service level 1 Holiday reduced service level -
31 Days 31 Days -
Average retail gas prices for unleaded fuel was approximately $1.97 per gallon this December
compared to approximately $2.13 per gallon in December 20171. December rainfall was below
normal at approximately 0.72 inches compared to December 2017 which was above normal at 4.37
inches.2
1. GasBuddy.com historical data at http://www.gasbuddy.com. 2. https:// www.usclimatedata.com/climate/corpus-christi/texas/united-states
415,137
300,000
400,000
500,000
600,000
Jan Feb Mar Apr May Jun Jul Aug Sep Oct Nov Dec
PassengerTrips
Months
RTA System Monthly Ridership Trends
2014 2015 2016 2017 2018

71
RIDERSHIP STATISTICS AND PERFORMANCE TRENDS
Back to Table of Contents
The chart below shows monthly ridership results for all services. CCRTA recorded 23,626 more
boardings for an increase of 6.0% this month as compared to December 2017.
The chart below shows YTD ridership results for all services. CCRTA recorded 7,737 fewer
boardings for an YTD decrease of -0.1% in 2018 as compared to the same period in 2017.
VanpoolFlexi-B
(ContractDemand)
B-LineFixed-Route
BusSystemOverall
Dec-2017 274 164 14,460 376,613 391,511
Dec-2018 2,084 135 15,682 397,236 415,137
% Change 660.6% -17.7% 8.5% 5.5% 6.0%
0
100,000
200,000
300,000
400,000
500,000
600,000
Pa
ss
en
ge
r T
rip
s
Monthly System Ridership
VanpoolFlexi-B
(ContractDemand)
B-LineFixed-Route
BusSystemOverall
YTD 2017 9,802 2,196 192,905 5,169,303 5,374,206
YTD 2018 16,098 2,026 195,952 5,153,005 5,367,081
% Change 64.2% -7.7% 1.6% -0.3% -0.1%
0
1,000,000
2,000,000
3,000,000
4,000,000
5,000,000
6,000,000
Pa
ss
en
ge
r T
rip
s
YTD System Ridership

72
RIDERSHIP STATISTICS AND PERFORMANCE TRENDS
Back to Table of Contents
The following charts report system-wide productivity for the month of December 2018 vs.
December 2017 and YTD figures.
The following table shows on-time performance of fixed route services.
16.83
2.54
13.85
18.07
2.44
14.40
0
5
10
15
20
25
RTA Fixed-Route Bus
B-Line RTA System(Overall)
PPH Passengers Per Hour (Monthly)
Dec-2017Dec-2018
19.30
2.55
15.41
18.70
2.57
15.08
0
5
10
15
20
25
RTA Fixed-Route Bus
B-Line RTA System(Overall)
PPH Passengers Per Hour (YTD)
YTD 2017
YTD 2018
1.24
0.15
0.96
1.36
0.15
1.01
0
1
2
3
RTA Fixed-Route Bus
B-Line RTA System(Overall)
PPM Passengers Per Mile (Monthly)
Dec-2017
Dec-2018
1.44
0.15
1.081.38
0.15
1.04
0
1
2
3
RTA Fixed-RouteBus
B-Line RTA System(Overall)
PPM Passengers Per Mile (YTD)
YTD 2017
YTD 2018

73
RIDERSHIP STATISTICS AND PERFORMANCE TRENDS
Back to Table of Contents
Schedule Adherence Oct-18 Nov-18 Dec-18
3-Month
Average
Early Departure 0.0% 0.3% 0.2% 0.2%
Departures within 0-5 minutes 85.1% 87.9% 86.1% 86.4%
Monthly Wheelchair Boardings 5,347 4,377 4,589 4,771
Monthly Bicycle Boardings 9,663 7,714 7,275 8,217
The following detours potentially impact on-time performance:
Comanche St. Overpass-(9) month project-To be completed January 2019
Route 21
S. Alameda St. (Ayers-Louisiana)-(19) month project-To be completed Feb. 2019
Routes 5, 19 & 29
Ayers St. (Santa Fe-Alameda)-(17) month project-To be complete Jan. 2019
Route 19
North Staples St (IH-37 Bridge Overpass)-To be complete Late April 2019
Route 12
Corona Dr. (Flynn-Everhart)-(10) month project- To be complete March 2019
Route 17
Carroll Ln. (Houston-McArdle)-(27) month project-To be complete October
2019
Route 17
Gollihar Rd. (Staples-Kostoryz)-(2) year project-To be complete March 2019
Routes 32 & 37
Old Robstown Rd. (Leopard-Agnes-Hwy 44)-(1) year project-To be complete
April 2019
Routes 12
South Staples St. (Brawner Parkway-Kostoryz)-Half complete- traffic switched
to south side lanes of travel.
Routes 17 & 29
North Beach Improvements (5) month project-To be complete May 2019
Routes 76 & 78
Ayers St. (SPID-Gollihar) (12) month project-To be complete March 2020
Routes 19G & 19M
Everhart Rd. (Holly Rd-SPID) (22) month project-To be complete March 2021
Routes 17 & 32
Morgan Ave. (Staples-Crosstown) (14) month project-To be complete April 2020
Routes 16 & 23
No Detour
On Detour
On Detour
On Detour
No Detour
On Detour
On Detour
On Detour
On Detour
No Detour
No Detour
No Detour
No Detour
On Detour

74
RIDERSHIP STATISTICS AND PERFORMANCE TRENDS
Back to Table of Contents
Morgan Ave. (Staples-Ocean Dr) (15) month project-To be complete Sept. 2020
Route 23
S. Staples St. (Kostoryz- Baldwin) (29) month project-To be complete Dec. 2021
Route 29
Leopard St. (Palm-Nueces Bay) (14) month project-To be complete Nov. 2020
Routes 27 & 28
Leopard St. (Crosstown-Palm) (13) month project-To be complete Dec. 2020
Routes 27 & 28
Sea Town Improvements (5) month project-To be complete March 2019
Routes 76 & 78
2. Purchased Transportation Department Report: B-Line Service Contract Standards &
Ridership Statistics
Productivity: 2.54 PPH did meet the contract standard of 2.50 PPH.
Denials: 0 denials or 0.0% did meet contract standard of 0.0%.
Miles between Road Calls: 19,449 did meet the contract standard of 12,250 miles.
Ridership Statistics: 9,814 ambulatory; 4, 608 wheelchair boardings
Metric Standard Oct-18 Nov-18 Dec-18 (3) Month-Ave.
Passengers per Hour 2.50 2.63 2.55 2.54 2.57
Denials 0.00% 0.00% 0.00% 0.00% 0.0%
Miles Between Road calls 12,250 13,337 15,924 19,449 16,237
Monthly Wheelchair Boardings No standard 5,378 4,848 4,608 4,945
3. Customer Programs Monthly Customer Assistance Form (CAF) Report
For December 2018, Customer Service received and processed 22 Customer Assistance Forms
(CAF’s) of which 10 or 45% were verified as valid. This represents a decrease of 11 CAFs
received and verified from the 21 CAF’s in November 2018. Of the 22 CAFs received 2 were
commendations in the month of December.
Currently there are 8 detoured routes out of 32 fixed routes travelling on local streets
(25%).
No Detour
No Detour
No Detour
No Detour

75
RIDERSHIP STATISTICS AND PERFORMANCE TRENDS
Back to Table of Contents
3a. CAF Reports: Historical Trends
2637
31
43
25
4133 35
2634
41
21
10
0
20
40
60
80
100
120
Dec Jan Feb Mar Apr May Jun Jul Aug Sep Oct Nov Dec
Number of CAFsReported
Months
10
0
20
40
60
80
100
120
1 2 3 4 5 6 7 8 9 10 11 12
Number of CAFsReported
Months
2014 2015 2016 2017 2018721551 691 377
26
51
38
675
67
Yearly Totals:
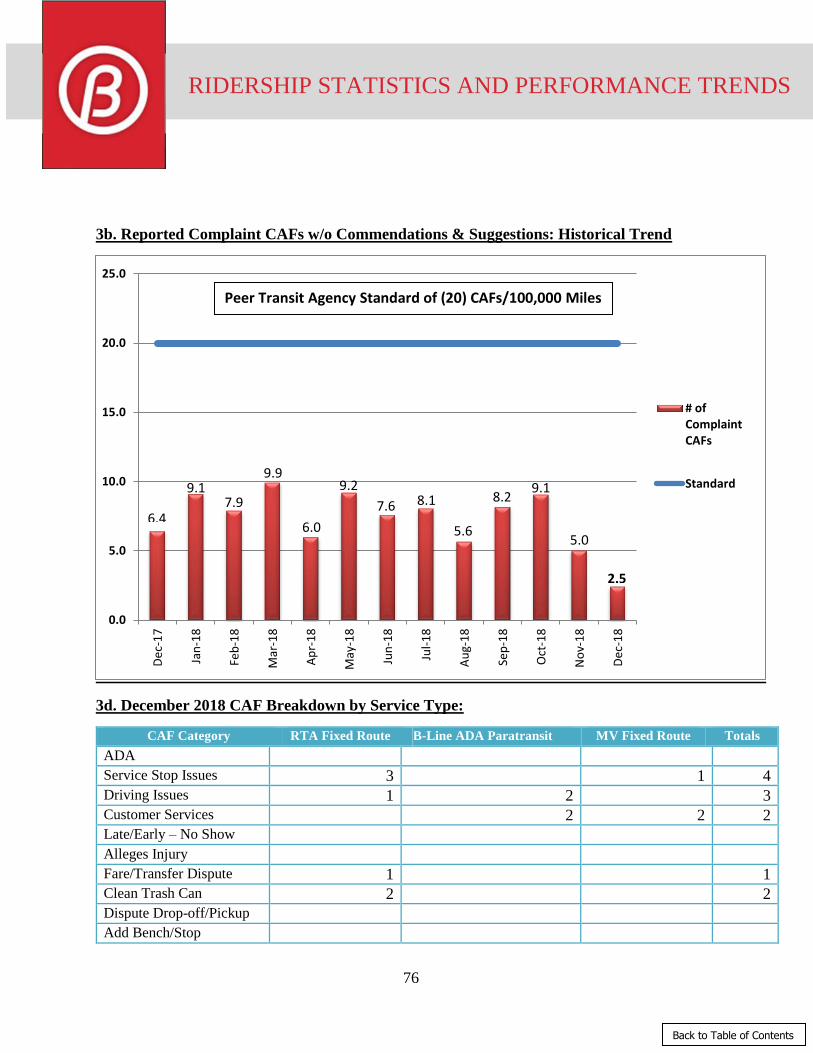
76
RIDERSHIP STATISTICS AND PERFORMANCE TRENDS
Back to Table of Contents
3b. Reported Complaint CAFs w/o Commendations & Suggestions: Historical Trend
3d. December 2018 CAF Breakdown by Service Type:
CAF Category RTA Fixed Route B-Line ADA Paratransit MV Fixed Route Totals
ADA
Service Stop Issues 3 1 4
Driving Issues 1 2 3
Customer Services 2 2 2
Late/Early – No Show
Alleges Injury
Fare/Transfer Dispute 1 1
Clean Trash Can 2 2
Dispute Drop-off/Pickup
Add Bench/Stop
0.0
5.0
10.0
15.0
20.0
25.0
De
c-1
7
Jan
-18
Feb
-18
Mar
-18
Ap
r-1
8
May
-18
Jun
-18
Jul-
18
Au
g-1
8
Sep
-18
Oct
-18
No
v-1
8
De
c-1
8
# ofComplaintCAFs
Standard
Peer Transit Agency Standard of (20) CAFs/100,000 Miles
9.1 8.2
7.6
9.9
2.5
6.4 6.0
9.2
5.6
9.1
5.0
7.9 8.1

77
RIDERSHIP STATISTICS AND PERFORMANCE TRENDS
Back to Table of Contents
Tie Down Issues
Inappropriate Behavior
B-line Calls
Incident at Stop
Incident at Station 1
1
Incident on Bus 1
1
No Wi-Fi
Denial of Service 2 1 1 4
Safety & Security
Rude 2 2
Facility Maintenance
Service Development
Transportation (Other)
Over Crowded Vehicle
Route Suggestion
Stop Location Dirty
TOTAL CAFs 13 5 2 20
Commendations 2 0 0 2
3c. Route Summary Report for December 2018:
Route # of CAFs Route # of CAFs
#3 NAS Shuttle
#32 Southside Mini-B
#4 Flour Bluff Mini B 1 #34 Robstown North Circulator
#5 Alameda
#35 Robstown South Circulator
#5x Alameda Express #37 Crosstown/TAMUCC
#6 Santa Fe/Malls #50 Calallen/NAS Ex (P&R)
#12 Saxet Oak Park 1 #51 Gregory/NAS Ex (P&R)
#15 Kostoryz #53 Robstown/NAS Ex (P&R)
#16 Morgan #54 Gregory/Downtown Express
#17 Carroll/Southside 1 #56 Flour Bluff/Downtown Express
#19 Ayers 2 #63 The Wave
#19G Greenwood #65 Padre Island Connection
#19M McArdle #76 Harbor Bridge Shuttle
#21 Arboleda #78 North Beach Shuttle 1
#23 Molina #90 Flexi-B Port Aransas
#25 Gollihar/Greenwood #94 Port Aransas Shuttle
#26 Airline/Lipes 1 B-Line (Para-transit) Services 5
#27 Northwest Safety & Security 2
#27x Northwest (Express) Safety/Transportation

78
RIDERSHIP STATISTICS AND PERFORMANCE TRENDS
Back to Table of Contents
#28 Leopard /Omaha Facility Maintenance 2
#29 Staples 3 Service Development/Facilities
#29F Staples/Flour Bluff 1 Transportation (Other)
#29SS Staples/Spohn South IT
#30 Westside/Health Clinic TOTAL CAF’s 20
4. Vehicle Maintenance Department Monthly Miles Between Road Calls Report
For December 2018, 14,604 miles between road calls (MBRC) were recorded as compared to
9,593 MBRC in December 2017. A standard of 6,500 miles between road calls is used based on
the fleet size, age, and condition of CCRTA vehicles.
Dec2017
Jan2018
Feb2018
Mar2018
Apr2018
May2018
June2018
July2018
Aug2018
Sept2018
Oct2018
Nov2018
Dec2018
MBRC 9,593 9,358 7,360 10,596 16,528 12,330 9,031 9,707 7,700 11,306 10,129 10,287 14,604
Goal 6,500 6,500 6,500 6,500 6,500 6,500 6,500 6,500 6,500 6,500 6,500 6,500 6,500
0
2,000
4,000
6,000
8,000
10,000
12,000
14,000
16,000
18,000Miles Between Roadcalls (MBRC) Gillig vs Fleet Comparison Previous 13
Month Period
14,604

79
Back to Table of Contents
CAPITAL BUDGET & 5YR CAPITAL PLAN
Capital acquisitions represent the purchase of equipment and other assets that have a value of $5,000 and a useful life of at least two years. This criterion also applies to individual assets that cost less than $5,000 but that operate as part of a network system such as a telephone system or a computer system. Capital projects on the other hand are of a construction nature that may span more than one fiscal year. Capital projects are typically more complex, and involve two or more components of costs such as construction, equipment, labor, or professional services.
The table shown below lists the nineteen (28) new projects in the FY 2019 Capital Budget with total project costs of $5,393,411. CCRTA anticipates grant funding of $2,593,331for projects that meet eligibility requirements and funding the balance of $2,800,080 from local funds.
Capital acquisitions will allow for the replacement of sixteen (16) Paratransit fleet replacement, 80% of this is funded by a federal grant ($1,408,000) and 20% or $352,000, from operating funds. As well as Port-A Fleet Replacement unit federally funded amount of 68,000 and $17,000 locally. These purchases will continue to extend the life of our ageing
fleet and will keep the fleet in a state of good repair to meet daily service demand.
The Capital Budget also includes the purchase of fourteen (14) Bus Automatic Passenger Counting Solution of which 80% is funded by a federal grant and 20% or $39,320 from operations. Having APC’s will provide detailed information about riders, routes, stops and improve passenger amenities. This technology will help the agency use resources more efficiently when planning routes.
In addition we will be continuing the road maintenance program involving ADA bus stop improvement projects costing approximately $350,000, and funded 20% with local funds at $70,000. The project calls for the construction of 11’ x 60’ bus stop concrete street pads aimed to support the decelerations/accelerations of the buses at bus stops.
The budget also calls for a Port Ayers Renovation. The existing station has been in place since 1996. The station is in need of renovation and expansion. One of the bays does not allow for bus traffic to be completely out of the traffic Right-of-Way. Also, with safety at the forefront, there ae areas at the station that block the clear line of sight for security. For expansion, land would need to be purchased to expand and renovate the station. The proposed new station would allow for ten bays instead of just 7. Enhance lighting, technology and security equipment would be installed. The renovation is projected to start in the latter part of 2019.

80
Back to Table of Contents
CAPITAL BUDGET & 5YR CAPITAL PLAN
New Projects Approved for FY2019 FY 2019 Budget Grant Funds Local Funds
Del Mar South Campus $209,588 $167,670 $41,918
Cunningham @ South Park Middle School $350,000 $350,000
Misc Concrete Improvements (Bus Pads) -DBE $350,000 $280,000 $70,000
Paratransit Fleet Replacement (16) $1,760,000 $1,408,000 $352,000
Port A Fleet Replacement $85,000 $68,000 $17,000
Bus DVR Camera Replacements $323,030 $258,424 $64,606
Mobile Bus Lift $80,000 $64,000 $16,000
Fluid storage tanks $27,500 $22,000 $5,500
Coin Sorter $11,000 $8,800 $2,200
Shelves for Windshields & Windows $25,000 $20,000 $5,000
Rim Polisher $140,000 $140,000
Service Trucks Utility Bed $57,000 $57,000
Tough Books 20 (4) $6,400 $6,400
Electric Charging Unit @ Staples Street Center $51,000 $51,000
Bear Land Fencing Replacement - DBE $31,035 $24,828 $6,207
Demolition of Contractor's (MV) Building $60,996 $60,996
Hybrid SUV Replacement (2) $74,910 $59,928 $14,982
VPG Support Vehicles Replacement (2) $68,000 $54,400 $13,600
Electric Utility Vehicle $18,000 $18,000
Ford Focus Support Vehicles $18,000 $18,000
Bus Automatic Passenger Counting Soluiton (14) $196,601 $157,281 $39,320
Adobe Acrobat Reader Replacement $15,200 $15,200
Microsoft Email Server Replacement $17,950 $17,950
Microsoft Office Replacement $14,000 $14,000
Microsoft Server Software Replacement $15,000 $15,000
Staff Computers $17,600 $17,600
Dismas Land Purchase $750,000 $750,000
Port/Ayers Renovation Project $620,601 $620,601
Total of 28 New Projects $5,393,411 $2,593,331 $2,800,080
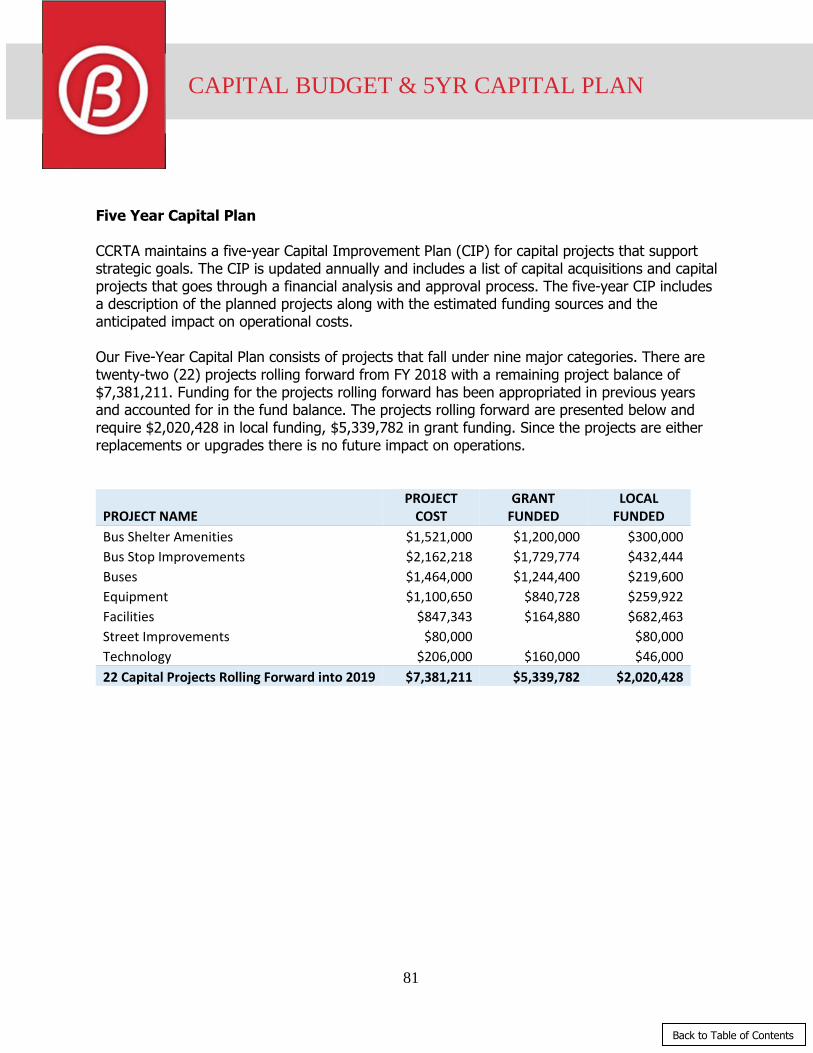
81
Back to Table of Contents
CAPITAL BUDGET & 5YR CAPITAL PLAN
Five Year Capital Plan CCRTA maintains a five-year Capital Improvement Plan (CIP) for capital projects that support strategic goals. The CIP is updated annually and includes a list of capital acquisitions and capital projects that goes through a financial analysis and approval process. The five-year CIP includes a description of the planned projects along with the estimated funding sources and the anticipated impact on operational costs. Our Five-Year Capital Plan consists of projects that fall under nine major categories. There are twenty-two (22) projects rolling forward from FY 2018 with a remaining project balance of $7,381,211. Funding for the projects rolling forward has been appropriated in previous years and accounted for in the fund balance. The projects rolling forward are presented below and require $2,020,428 in local funding, $5,339,782 in grant funding. Since the projects are either replacements or upgrades there is no future impact on operations.
PROJECT NAME PROJECT
COST GRANT
FUNDED LOCAL
FUNDED
Bus Shelter Amenities $1,521,000 $1,200,000 $300,000
Bus Stop Improvements $2,162,218 $1,729,774 $432,444
Buses $1,464,000 $1,244,400 $219,600
Equipment $1,100,650 $840,728 $259,922
Facilities $847,343 $164,880 $682,463
Street Improvements $80,000 $80,000
Technology $206,000 $160,000 $46,000
22 Capital Projects Rolling Forward into 2019 $7,381,211 $5,339,782 $2,020,428

82
Back to Table of Contents
CAPITAL BUDGET & 5YR CAPITAL PLAN
The table below is a detail listing of the projects rolling forward. This identifies provides the project
numbers and the funding sources for each project.
FIVE YEAR CIP PLAN
Project # CIP Carryover Project Name Category
2018
Budget
Federal
Funds
Local Funds
(Less
Federal)
2015-04 Bus Stop Improv Phase VI DBE BS Improvement 885,120$ 708,096 177,024
2016-05 Trip-End Facility Installation Facilities $ 74,100 59,280 14,820
2017-02 Port Ayers Land, Design, Environmental Transferred Facilities $ 641,243 - 641,243
2017-04 ADA, Pedestrian & Bicycle Infra Imprvnts (City Bus Shelter Amenities $ 1,500,000 1,200,000 300,000
2017-08 Golihar Bond Project (City Project/RTA Capitalize) Street Improvements $ 80,000 - 80,000
2018-04 Floor Crane Equipment $ 10,000 8,000 2,000
2018-05 Mobile Bus Lift Equipment $ 45,000 36,000 9,000
2018-06 Metal Brake Equipment $ 15,000 12,000 3,000
2018-07 Rolling Trolley Lift Equipment $ 35,500 28,400 7,100
2018-08 Engine & Transmission Overhaul (18 Engines) Equipment $ 764,910 611,928 152,982
2018-09 19-26' Bus Replacement (6/Port A) $244,000 each Buses $ 1,464,000 1,244,400 219,600
2018-10 Fuel Island Diesel Fuel Dispensers 6 @ $6000 Facilities $ 36,000 28,800 7,200
2018-11 Cummins Inline 7 Data Link Technology $ 6,000 - 6,000
2018-12 Mobile App Creation Technology $ 200,000 160,000 40,000
2018-13 Air Compressor for Shop Equipment $ 25,500 20,400 5,100
2018-14 Trailer for Hauling Equipment $ 13,000 - 13,000
2018-15 Gas Generator 350 kw Bear Operations Equipment $ 155,000 124,000 31,000
2018-16 Bear Lane Roof Repl-Operations 12,000 sf @ $8/sf Facilities $ 96,000 76,800 19,200
2018-17 Bus Stop Improvements VII DBE Bus Stop Improvements $ 1,000,000 800,000 200,000
2018-18 GFI Genfare, Inc.(Transfer from 2106-06) Equipment $ 36,740 - 36,740
2018-20 Port/Ayers Renovation Bus Stop Improvements $ 277,098 221,678 55,420
2018-21 Hector P. Garcia Stop Bus Stop Shelter Amenities $ 21,000 - - Totals ( 22 PROJECTS) 7,381,211$ 5,339,782$ 2,020,428$
PROJECT NAME PROJECT COST GRANT FUNDED LOCAL FUNDED
Bus Shelter Amenities $2,808,937 $1,967,150 $841,787
Bus Stop Improvements $2,665,000 $1,880,000 $785,000
Buses $7,594,816 $6,363,344 $1,231,472
Vehicles $1,199,287 $793,030 $406,257
Equipment $2,044,062 $1,135,340 $908,722
Facilities $967,031 $724,828 $242,203
Technology $698,608 $157,281 $541,327
Transfer Station $14,961,942 $10,500,130 $4,382,949
30 Capital Projects Rolling Forward into 2019 $32,939,683 $23,521,103 $9,339,717

83
DEPARTMENTAL STRUCTURE
Back to Table of Contents
There are 24 departments in CCRTA’s organizational structure. As you can see from the below chart, seven departments are used to carry out transit operations while nine departments are used to provide administrative assistance to support all operations. In addition, there are five departments that are used to only record related transactions specific to that department and do not contain operating or personnel costs as functions are performed by the Finance and Accounting Department. The newly created Department #77 & #78 are being used to account for the business-type activities of the Staples Street Center and Port Ayers Cost Center and Department 83 is dedicated to unanticipated projects that arise during the year that are essential to the operations of the organization.
In FY 2019 more than 50% of the budget is concentrated in transit operations.
The next several pages present individual detail budgets.
Department FY2017 FY2018 FY2019
Budget Budget Budget
Transit Operations 20,406,532$ 20,306,432$ 21,453,136$ 1,146,704$ 5.65%
Administration Support 10,087,742$ 9,463,186$ 11,379,730$ 1,916,544$ 20.25%
Indirect Cost Allocation 8,478,627$ 9,104,294$ 10,191,106$ 1,086,812$ 11.94%
Staples Street Center 891,427$ 805,115$ 986,323$ 181,208$ 22.51%
Port Ayers Cost Center -$ 50,000$ 344,440$ 294,440$ 588.88%
Total Expenditures 39,864,328$ 39,729,028$ 44,354,735$ 4,625,707$ 11.64%
Budget to
Budget Change % Change

84
TRANSPORTATION- DEPARTMENT # 1
-
Back to Table of Contents
Functions and Responsibilities
Transportation is responsible for providing the safest and most efficient method of navigating throughout
the serviced areas in comfort with specific bus routes, timetables, and schedules to meet the demands of our customers and community. In providing these services this department is charged with the
responsibility of monitoring effective delivery of services. This department has the largest budget and
employs the largest number of employees.
FY 2018 Accomplishments
• Maintained an on-time efficiency of 88.2% despite experiencing traffic disruptions on 33% of
fixed bus routes, detouring due to street construction activities. • Completed (7) seven-week training sessions for new bus operators, ranging from 2 to 5 new
hires per session. • Completed 5,367,169 trips; 5,283,727 revenue miles; 362,316 revenue service hours; across
the RTA’s fixed route system.
• Achieved a consistent uniform appearance by transitioning Bus Operators to matching uniforms.
• Implemented a semi-annual Transportation Operator and Administration staff performance appraisal.
• Bus Operator Oscar Zamora won 3rd place in the 35’ bus competition at both Roadeo events, TTA State and APTA International.
• Transportation Supervisor Ray Mancilla received the TTA 2018 Distinguished Service Award.
FY 2019 Planned Initiatives
• Continue to utilize quarterly meetings in conjunction with IT, Customer Service, Human
Resources, and Safety and Security departments to conduct group Operator and Administration training and development sessions.
• Continue to conduct return-to-work retraining sessions for Operators. • Continue to utilize quarterly meetings to review performance measure outcomes and identify
solutions for improvements. • Continue to assist Human Resources with recruiting efforts for Bus Operators.
• Continue to evaluate and improve the Bus Operator training program.
• Continue to target issues that improve the customer experience and perception using Customer Advocacy methodology.
• Continue to keep on-time efficiency above 85%. • Continue to maintain a preventable collision rate below 2 per 100,000 revenue miles.
• Continue to keep the number of CAF’s below 20 per 100,000 revenue miles.
Budgetary Changes
o Salaries and Wages increased 2.79% which included bus operator’s step & COLA increase.
o Decrease in Materials and Supplies due to the defunding other materials and supplies.
o Travel, Training and Meetings increased 14.29% to attend APTA conference.

85
TRANSPORTATION- DEPARTMENT # 1
-
Back to Table of Contents
FUND01 FUND
LINE ITEMSBUDGET
2018
ESTIMATED
2018
PROPOSED
2019
$
CHANGE
%
CHANGE50101010 SALARIES AND WAGES - OPERATOR $5,070,800 $4,704,746 $5,166,145 $95,345 1.88%
50102010 SALARIES AND WAGES - OTHER $1,016,914 $1,008,570 $1,055,533 $38,619 3.80%
50103010 OVERTIME - OTHER $30,000 $41,026 $35,000 $5,000 16.67%
50104010 OVERTIME - OPERATORS $520,683 $792,547 $542,445 $21,762 4.18%
50201010 MEDICARE $92,599 $91,322 $98,588 $5,989 6.47%
50205010 LIFE INSURANCE $34,098 $31,131 $33,930 ($168) -0.49%
50206010 DISABILITY INSURANCE $42,347 $41,109 $65,272 $22,925 54.14%
50213010 UNIFORM AND TOOL ALLOWANCE $0 $581 $0 $0 0.00%
50214110 TUITION REIMBURSEMENT $0 $338 $1,000 $1,000 100.00%
50214310 INCENTIVE AWARDS $26,000 $15,383 $26,000 $0 0.00%
SALARIES AND BENEFITS TOTAL $6,833,441 $6,726,751 $7,023,913 $7,023,913 2.79%
50491110 OFFICE SUPPLIES $4,500 $3,331 $4,500 $4,500 0.00%
50491210 POSTAGE AND EXPRESS $0 $9 $0 $0 0.00%
50491310 MINOR TOOLS AND EQUIPMENT $2,000 $1,404 $1,500 $1,500 -25.00%
50491410 MINOR OFFICE EQUIPMENT $500 $217 $500 $500 0.00%
50492010 PRINTING $3,500 $528 $3,000 $3,000 -14.29%
50493010 UNIFORMS $53,150 $45,022 $51,365 $51,365 -3.36%
50499910 OTHER MATERIALS AND SUPPL $5,000 $5,939 $0 $0 -100.00%
MATERIALS AND SUPPLIES TOTAL $68,650 $56,448 $60,865 $60,865 -11.34%
50502010 TELECOMMUNICATIONS $2,760 $2,551 $2,760 $2,760 0.00%
UTILITIES TOTAL $2,760 $2,551 $2,760 $2,760 0.00%
50901010 DUES AND SUBSCRIPTIONS $0 $16 $0 $0 $0
50902110 TRAVEL, TRAINING AND MTNGS $15,000 $16,310 $18,000 $18,000 20.00%
50908010 ADVERT/PROMO MEDIA EXP. $1,500 $0 $1,000 $1,000 -33.33%
50909010 PROMPT PAYMENT ACT $0 $0 $0 $0 0.00%
50909510 COMMUNITY SERVICES $0 $0 $0 $0 0.00%
50909910 OTHER MISCELLANEOUS EXP. $4,500 $2,009 $5,000 $5,000 0.00%
MISCELLANEOUS TOTAL $21,000 $18,335 $24,000 $24,000 14.29%
01 TOTAL $6,925,851 $6,804,086 $7,111,538 $185,687 2.68%
CC REGIONAL TRANSPORTATION AUTHORITY
DEPARTMENT DIVISION01 TRANSPORTATION 01 TRANSPORTATION
LINE ITEM DETAIL
CHANGES FY 2019
0.00 147.00
0.00 3.00
0.00 1.00
0.00 5.00
0.00 1.00
0.00 1.00
0.00 6.00
0.00 3.00
0.00 3.00
0.00 170.00
PERSONNEL SCHEDULE
POSITION TITLE FY 2018
BUS OPERATOR 147.00
BUS OPERATOR (PT) 3.00
DIRECTOR OF TRANSPORTATION 1.00
DISPATCHER 5.00
MANG. DIR OF OPERATIONS 1.00
RECEPTIONIST 1.00
ROAD MONITOR 6.00
TRAINING INSTRUCTOR 3.00
TRANS SUPERVISOR 3.00
TOTAL FTEs 170.00

86
CUSTOMER SERVICE- DEPARTMENT # 2
-
Back to Table of Contents
Functions and Responsibilities
The Customer Service department is comprised of two functions: Call Center and Transit Store. The Call Center provides telephone, email, and web-assisted customer service by delivering accurate route and scheduling information, providing timely response and resolution to customer comments, and educating the public on CCRTA’s products and services. The Transit Store provides retail pass sales, reduced fare ID card issuance, lost and found services, and assistant with general information and inquiries.
FY 2018 Accomplishments
Deliver the Best Possible Customer Experience
o Processed nearly 49,427 calls. o Process 7,280 walk-ins for passes o Processed 950 CAFs (Customer Assistant Form). o The Transit Store produced $318,332.25 sales for passes (including online sales).
FY 2019 Planned Initiatives
Continue to improve Organizational Practices o Continue training and development programs for personnel with emphasis on o Customer Service and Safety o Continue training and development programs associated with technological changes from new
website design demands and new electronic devices to better assist customers with their needs o Continue training and development programs that will enable personnel to deliver a WOW
experience from the amenities of the new Customer Service o Building o Continue to integrate functions of Customer Advocate to improve customer experience and
perception. o Continue efforts to perfect customer experience of Transit Store purchase of passes.
Budgetary Changes
Increase in Services due to a development in other professional services. Materials & Supplies decrease of 30.85% due to maintaining a conservative allowance in office
supplies, postage, minor office equipment, printing, and uniforms.
Increase in Miscellaneous expenses due to projected Travel and Training. Leases & Rentals were eliminated.

87
CUSTOMER SERVICE- DEPARTMENT # 2
-
Back to Table of Contents
FUND01 FUND
LINE ITEMSBUDGET
2018
ESTIMATED
2018
PROPOSED
2019
$
CHANGE
%
CHANGE50102010 SALARIES AND WAGES - OTHER $270,921 $275,625 $280,376 $9,455 3.49%
50103010 OVERTIME - OTHER $0 $583 $1,000 $1,000 100.00%
50201010 MEDICARE $3,950 $3,834 $4,080 $130 3.29%
50205010 LIFE INSURANCE $1,100 $1,472 $1,984 $884 80.39%
50206010 DISABILITY INSURANCE $2,263 $1,782 $2,500 $237 10.47%
50214110 TUITION REIMBURSEMENT $13,500 $0 $7,000 ($6,500) 100.00%
50214310 INCENTIVE AWARDS $0 $63 $500 $500 100.00%
SALARIES AND BENEFITS TOTAL $291,734 $283,359 $297,440 $5,706 1.96%
50329910 OTHER PROFESSIONAL SERV $14,950 $14,478 $17,194 $2,244 15.01%
SERVICES TOTAL $14,950 $14,478 $17,194 $2,244 15.01%
50490110 REPAIR PARTS $0 $80 $0 $0 $0
50490210 BUS CLEANING SUPPLIES $0 $153 $0 $0 $0
50491110 OFFICE SUPPLIES $1,000 $1,865 $1,600 $600 60.00%
50491210 POSTAGE AND EXPRESS $500 $0 $500 $0 0.00%
50491410 MINOR OFFICE EQUIPMENT $0 $545 $0 $0 0.00%
50492010 PRINTING $90,000 $49,151 $60,862 ($29,138) -32.38%
50493010 UNIFORMS $1,000 $133 $1,000 $0 0.00%
MATERIALS AND SUPPLIES TOTAL $92,500 $51,927 $63,962 ($28,538) -30.85%
50902110 TRAVEL, TRAINING AND MTNGS $4,000 $1,628 $8,100 $4,100 102.50%
MISCELLANEOUS TOTAL $4,000 $1,628 $8,100 $4,100 102.50%
02 TOTAL $403,184 $351,392 $386,696 ($16,488) -4.09%
CORPUS CHRISTI RTA
DEPARTMENT DIVISION02 CUSTOMER SERVICE CENTER 02 CUSTOMER SERVICE CENTER
LINE ITEM DETAIL
CHANGES FY2019
0.00 1.00
0.00 1.00
0.00 1.00
0.00 3.00
0.00 0.80
0.00 1.00
0.00 7.80
INFOA PT 0.80
MOBILITY COORDINATOR 1.00
TOTAL FTEs 7.80
CUSTOMER ADVOCATE 1.00
ELIGIBILITY COORDINATOR 1.00
INFOA 3.00
PERSONNEL SCHEDULE
POSITION TITLE FY2018
CC SUPERVISOR 1.00

88
PURCHASED TRANSPORTATION- DEPARTMENT # 3
-
Back to Table of Contents
Functions and Responsibilities
Although the majority of the transportation services are provided directly by CCRTA, there are situations that
are more cost effective to outsource. Services ordered on an as-needed basis such as paratransit and certain bus mode services are outsourced to better utilize our resources. While the Agency remains responsible for
these programs, our contracts establish operating performance standards which the contractors are expected
to meet. This Department is responsible for maintaining an aggressive program to monitor and audit contractor compliance. This includes coordination of contract management, data collection and analysis, and quality
assurance activities for all contractor-operated transit services, including B-Line, ADA Paratransit, commuter, rural, seasonal, the Port Aransas trolley and Port Aransas Flexi-B. This department has the second largest budget
in terms of operating funds, the largest budget being the Transportation Department.
All paratransit services are outsourced to M.V. Transportation, Inc. under a four-year contract that expires
December 2018 which also includes fleet maintenance for support vehicles. In addition CCRTA utilizes outsourcing contracts with Paisano Transit and REAL, Inc. to provide rural services.
FY 2018 Accomplishments
Paratransit
o Optimized route bids to incorporate higher ridership and maintain key performance indicators. o Improved customer service standards by implementing call center oversight processes and a CAF tracking
report. Vanpool
o Planning staff implemented significant improvements to oversite and expansion of the Vanpool program.
o Successfully brought the Vanpool program into NTD compliance regarding operation/reporting standards. Contracted Fixed Route (Port Aransas)
o Planning staff implemented significant improvements to oversight, monitored ridership data for Route 90
and Route 94 bus route services. Contracted Demand Taxi (Paisano Transportation & REAL Transportation Inc.)
o With the assistance of CCRTA Customer Services Staff, Planning has enhanced existing lines of
communication between CCRTA staff and both contracted Demand Taxi contractors.
FY 2019 Planned Initiatives
Paratransit
o Optimize schedules and routes to increase key performance indicators and maintain contract compliance.
Vanpool
o Re-brand the current vanpool service as part of the CCRTA Fleet Forward. o Seek to join the Vanpool industry association, ACT (Association for Commuter Transportation) Red River
chapter, to increase; knowledge, expand training resources, and improve participation. Contracted Fixed Route (Port Aransas)
o Implement Pilot Flex Route 91 in lieu of traditional fixed route service, expand the area serviced and
introduce daily morning and evening express service from downtown Corpus Christi. o Incorporate Ferry Shuttle service into the Pilot Flex Route 91.
Contracted Demand Taxi (Paisano Transportation & REAL Transportation Inc.)
o Review the areas serviced by Paisano Transportation and REAL Inc. for a potential Flex route that better coincides with the CCRTA Fixed Route System days and hours of operation, expanding connectivity to
rural areas of Nueces County and portions of San Patricio County.
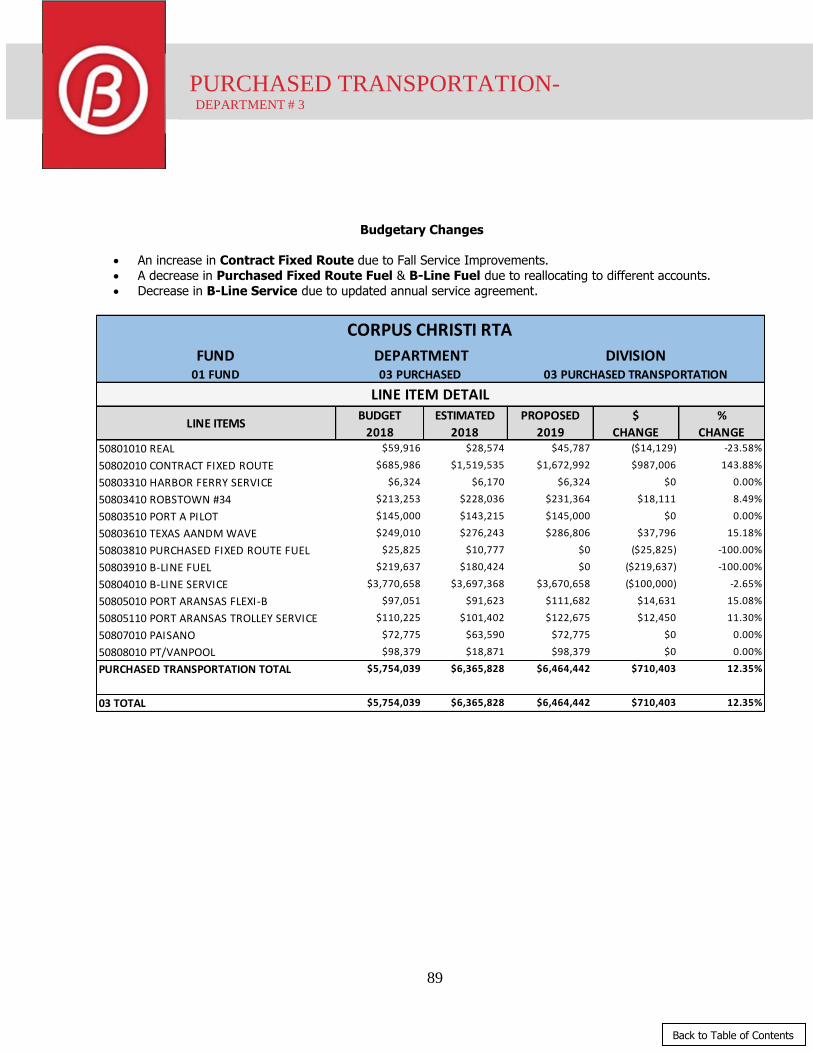
89
PURCHASED TRANSPORTATION- DEPARTMENT # 3
-
Back to Table of Contents
Budgetary Changes
An increase in Contract Fixed Route due to Fall Service Improvements.
A decrease in Purchased Fixed Route Fuel & B-Line Fuel due to reallocating to different accounts.
Decrease in B-Line Service due to updated annual service agreement.
FUND01 FUND
LINE ITEMSBUDGET
2018
ESTIMATED
2018
PROPOSED
2019
$
CHANGE
%
CHANGE50801010 REAL $59,916 $28,574 $45,787 ($14,129) -23.58%
50802010 CONTRACT FIXED ROUTE $685,986 $1,519,535 $1,672,992 $987,006 143.88%
50803310 HARBOR FERRY SERVICE $6,324 $6,170 $6,324 $0 0.00%
50803410 ROBSTOWN #34 $213,253 $228,036 $231,364 $18,111 8.49%
50803510 PORT A PILOT $145,000 $143,215 $145,000 $0 0.00%
50803610 TEXAS AANDM WAVE $249,010 $276,243 $286,806 $37,796 15.18%
50803810 PURCHASED FIXED ROUTE FUEL $25,825 $10,777 $0 ($25,825) -100.00%
50803910 B-LINE FUEL $219,637 $180,424 $0 ($219,637) -100.00%
50804010 B-LINE SERVICE $3,770,658 $3,697,368 $3,670,658 ($100,000) -2.65%
50805010 PORT ARANSAS FLEXI-B $97,051 $91,623 $111,682 $14,631 15.08%
50805110 PORT ARANSAS TROLLEY SERVICE $110,225 $101,402 $122,675 $12,450 11.30%
50807010 PAISANO $72,775 $63,590 $72,775 $0 0.00%
50808010 PT/VANPOOL $98,379 $18,871 $98,379 $0 0.00%
PURCHASED TRANSPORTATION TOTAL $5,754,039 $6,365,828 $6,464,442 $710,403 12.35%
03 TOTAL $5,754,039 $6,365,828 $6,464,442 $710,403 12.35%
CORPUS CHRISTI RTA
DEPARTMENT DIVISION03 PURCHASED 03 PURCHASED TRANSPORTATION
LINE ITEM DETAIL

90
SERVICE DEVELOPMENT DEPARTMENT # 4
-
Back to Table of Contents
Functions and Responsibilities
This department is tasked with the responsibility of five major areas: Service Planning and Scheduling, Long-
Range Planning and Transit-Oriented Development, Environmental sustainability, National Transit Database (NTD) Reporting and Civil Rights Act of 1964 Title VI Compliance. Each function is designed to support the
planning, development, evaluation, and ultimate delivery of public transportation solutions and infrastructure.
Key functions include: development and administration of bus route, schedule, and bus stop changes including
amenities; implementation of quarterly service changes; evaluation of ridership and service performance including operational data collection; NTD reporting; development of monthly and annual performance reports.
FY 2018 Accomplishments
Developed service plan and implemented the 2018 Fall Service Improvements campaign to,
increasing Sunday frequency; improving transfer connections; and offer more travel options. Re-
allocated unproductive service hours to support higher ridership areas. o Sunday ridership increased by 14% in September and October over the same period last
year
o 32 bus routes were modified to increase service efficiency o Approximately 50 bus stops were re-directed to improve travel time
o 25 public outreach activities were conducted Approximately 500 customers surveyed to collect feedback
Successfully reviewed and commented on multiple City of Corpus Christi Development Plans:
o 142 Plats o 4 Zoning Site Development Cases
o 1 Corpus Christi Independent School District: Southpark/Cunningham Middle School, 1 Del Mar College bus stop, 16 bond and state roadway reconstruction projects.
FY 2019 Planned Initiatives
Develop service improvements under 2019 system re-design effort.
o Design new Flex and Express services and restructure fixed route services to a more dynamic system that increases ridership.
o Identify on-demand service options for less populated areas. o Define phased service improvements in alignment with Five-Year Service Plan.
Support successful completion of 2016-2018 Federal Transit Administration Triennial Review.
Lead the completion of the National Transit Database 2018 Annual Report.
Complete Title VI fare equity analysis by May 31, 2019 in support of the fare restructuring efforts.
Support the implementation of the 2019 Automated Passenger Counting technology.
Award new contract to Vanpool provider by April 1, 2019.
o Apply new Fleet Forward branding on vehicles o Increase program ridership
Major Budgetary Changes
A reduction in Services due to the completion of the NTD contract, and COA Task 1 & 2 phases. A minimal increase in Materials & Supplies in office supplies
Increase in Miscellaneous Expense due to more travel and training projected.

91
SERVICE DEVELOPMENT DEPARTMENT # 4
-
Back to Table of Contents
FUND01 FUND
LINE ITEMSBUDGET
2018
ESTIMATED
2018
PROPOSED
2019
$
CHANGE
%
CHANGE50102010 SALARIES AND WAGES - OTHER $296,914 $304,387 $313,467 $16,553 5.57%
50103010 OVERTIME - OTHER $1,250 $92 $1,250 $0 0.00%
50201010 MEDICARE $4,303 $4,272 $4,563 $260 6.04%
50205010 LIFE INSURANCE $938 $958 $1,018 $80 8.49%
50206010 DISABILITY INSURANCE $2,018 $1,739 $3,005 $987 48.91%
50214310 INCENTIVE AWARDS $0 $1,389 $2,800 $2,800 100.00%
SALARIES AND BENEFITS TOTAL $305,423 $312,838 $326,102 $20,679 6.77%
50329910 OTHER PROFESSIONAL SERV $75,356 $59,012 $75,356 $0 0.00%
50346010 CONTRACTED MAINTENANCE $30,445 $28,936 $30,000 ($445) -1.46%
SERVICES TOTAL $105,801 $87,948 $105,356 ($445) -0.42%
50491110 OFFICE SUPPLIES $150 $253 $350 $200 133.33%
50493010 UNIFORMS $200 $212 $200 $0 0.00%
MATERIALS AND SUPPLIES TOTAL $350 $466 $550 $200 57.14%
50901010 DUES AND SUBSCRIPTIONS $225 $168 $250 $25 11.11%
50902110 TRAVEL, TRAINING AND MTNGS $3,750 $4,541 $4,125 $375 10.00%
50908010 ADVERT/PROMO MEDIA EXP. $1,500 $666 $1,500 $0 0.00%
MISCELLANEOUS TOTAL $5,475 $5,375 $5,875 $400 7.31%
04 TOTAL $417,049 $406,627 $437,883 $20,834 5.00%
CORPUS CHRISTI RTA
DEPARTMENT DIVISION04 SERVICE DEVELOPMENT 04 SERVICE DEVELOPMENT
LINE ITEM DETAIL
CHANGES FY 20190.00 1.00
0.00 1.00
0.00 1.00
0.00 1.00
0.00 1.00
0.00 5.00
PERSONNEL SCHEDULE
POSITION TITLE FY 2018DATA TECHNICIAN 1.00
SR. TRANSIT PLANNER 1.00
TOTAL FTEs 5.00
DIR OF PLANNING 1.00
OUTREACH COORD 1.00
PLANNING TECHNICIAN 1.00

92
MIS DEPARTMENT # 7
-
Back to Table of Contents
Functions and Responsibilities
This department provides strategic planning and implementation of all technology projects and
ensures the integrity, availability, reliability and security of all CCRTA systems. In addition, the IT department is responsible for procurement, installation, and day-to-day, 24/7 support of all
installed hardware, software, data and communications network.
FY 2018 Accomplishments
CCRTA Transfer Station Upgrades
o Digital Information Displays were installed at four transfer stations. Locations of the
installations were at the Staples Street Center, South Side Transfer Station, Port Ayers
and Robstown. o New Security Cameras systems were installed at both South Side Transfer station and
Port Ayers Transfer Station.
CCRTA IT Technology Upgrades
o Upgraded CCRTA’s Main Network Switch for better security and performance
enhancements to our whole network. o Installed a new Genfare Server System so the RTA’s fare revenue systems work
efficiency without interruption.
Operations Building IT Technology
o Installed and configured new Wireless Access Points for Wireless Video Pulls from our bus fleet.
o New Security Cameras were installed at Bear Lane facilities.
o Genfare Vault was replaced and this will make it convenient for emptying of Genfare bus cashboxes and secure storage of revenue.
FY 2019 Planned Initiatives
Deliver the Best Possible Experience
o Implement free-on line Mobile App for mobile devices to promote the CCRTA and to give our customers easy-to-use trip planning and mobile ticketing.
o Ensure the system infrastructure operates securely, efficiently, effectively, and without interruption
o Continue to enhance the ability to send/receive information on mobile platforms that deliver real-time information on bus services
Continue to Improve Organization Practices and Development Staff
o Implement all the technological projects to the existing building in preparation for the move of transit operations located in other buildings
o Collaborate with other CCRTA organizational units to implement more effective comprehensive business systems
o Support CCRTA utilization of data to facilitate policy and work process improvements

93
MIS DEPARTMENT # 7
-
Back to Table of Contents
FUND01 FUND
LINE ITEMSBUDGET
2018
ESTIMATED
2018
PROPOSED
2019
$
CHANGE
%
CHANGE50102010 SALARIES AND WAGES - OTHER $320,720 $306,921 $348,433 $27,713 8.64%
50103010 OVERTIME - OTHER $1,750 $2,734 $1,750 $0 0.00%
50201010 MEDICARE $5,225 $4,349 $5,078 ($147) -2.81%
50205010 LIFE INSURANCE $1,375 $1,099 $1,526 $151 11.01%
50206010 DISABILITY INSURANCE $1,950 $1,947 $0 ($1,950) -100.00%
50213010 UNIFORM AND TOOL ALLOWANCE $0 $1,500 $1,500 0.00%
50214110 TUITION REIMBURSEMENT $11,300 $371 $9,200 ($2,100) -18.58%
50214310 INCENTIVE AWARDS $0 $1,606 $2,450 $2,450 100.00%
SALARIES AND BENEFITS TOTAL $342,320 $319,028 $369,937 $7,023,913 8.07%
50326010 COMPUTER CONSULTING SERV $0 $0 $15,000 $15,000 100.00%
50329910 OTHER PROFESSIONAL SERV $3,260 $3,851 $3,638 $378 11.58%
50346010 CONTRACTED MAINTENANCE $215,126 $213,236 $272,855 $57,729 26.83%
SERVICES TOTAL $218,386 $217,087 $291,492 $7,023,913 33.48%
50490110 REPAIR PARTS $32,613 $19,718 $30,099 ($2,514) -7.71%
50491210 POSTAGE AND EXPRESS $750 $1,858 $1,120 $370 49.33%
50491410 MINOR OFFICE EQUIPMENT $27,200 $11,472 $9,200 ($18,000) -66.18%
50493010 UNIFORMS $450 $1,663 $600 $150 33.33%
MATERIALS AND SUPPLIES TOTAL $61,013 $34,710 $41,019 $7,023,913 -32.77%
50502010 TELECOMMUNICATIONS $207,624 $193,591 $200,299 ($7,324) -3.53%
UTILITIES TOTAL $207,624 $193,591 $200,299 $7,023,913 -3.53%
50902110 TRAVEL, TRAINING AND MTNGS $2,000 $6,555 $9,160 $7,160 358.00%
MISCELLANEOUS TOTAL $2,000 $6,555 $9,160 $7,023,913 358.00%
51201010 LEASES AND RENTALS $27,234 $24,563 $29,794 $2,560 9.40%
LEASES AND RENTALS TOTAL $27,234 $24,563 $29,794 $7,023,913 9.40%
07 TOTAL $858,577 $795,534 $941,702 $7,023,913 9.68%
CORPUS CHRISTI RTA
DEPARTMENT DIVISION07 MIS 07 MIS
LINE ITEM DETAIL
CHANGES FY 2019
0.000 1.000
0.000 3.000
0.000 1.000
0.000 1.000
0.000 6.000TOTAL FTEs 6.000
ELECTRONIC TECH 3.000
IT SYSTEMS COORDINATOR 1.000
SYSTEM TECH 1.000
PERSONNEL SCHEDULE
POSITION TITLE FY 2018
DIRECTOR OF IT 1.000
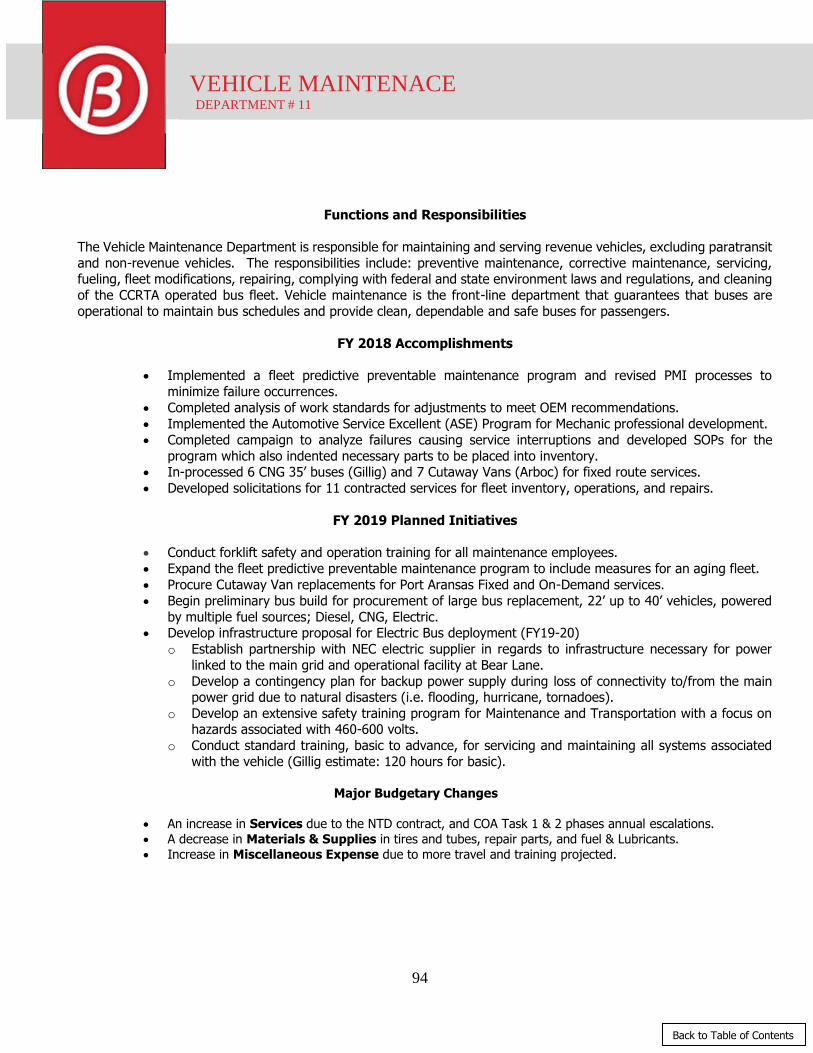
94
VEHICLE MAINTENACE DEPARTMENT # 11
-
Back to Table of Contents
Functions and Responsibilities
The Vehicle Maintenance Department is responsible for maintaining and serving revenue vehicles, excluding paratransit
and non-revenue vehicles. The responsibilities include: preventive maintenance, corrective maintenance, servicing, fueling, fleet modifications, repairing, complying with federal and state environment laws and regulations, and cleaning
of the CCRTA operated bus fleet. Vehicle maintenance is the front-line department that guarantees that buses are
operational to maintain bus schedules and provide clean, dependable and safe buses for passengers.
FY 2018 Accomplishments
Implemented a fleet predictive preventable maintenance program and revised PMI processes to
minimize failure occurrences.
Completed analysis of work standards for adjustments to meet OEM recommendations.
Implemented the Automotive Service Excellent (ASE) Program for Mechanic professional development.
Completed campaign to analyze failures causing service interruptions and developed SOPs for the
program which also indented necessary parts to be placed into inventory. In-processed 6 CNG 35’ buses (Gillig) and 7 Cutaway Vans (Arboc) for fixed route services.
Developed solicitations for 11 contracted services for fleet inventory, operations, and repairs.
FY 2019 Planned Initiatives
Conduct forklift safety and operation training for all maintenance employees.
Expand the fleet predictive preventable maintenance program to include measures for an aging fleet.
Procure Cutaway Van replacements for Port Aransas Fixed and On-Demand services.
Begin preliminary bus build for procurement of large bus replacement, 22’ up to 40’ vehicles, powered
by multiple fuel sources; Diesel, CNG, Electric. Develop infrastructure proposal for Electric Bus deployment (FY19-20)
o Establish partnership with NEC electric supplier in regards to infrastructure necessary for power
linked to the main grid and operational facility at Bear Lane.
o Develop a contingency plan for backup power supply during loss of connectivity to/from the main power grid due to natural disasters (i.e. flooding, hurricane, tornadoes).
o Develop an extensive safety training program for Maintenance and Transportation with a focus on hazards associated with 460-600 volts.
o Conduct standard training, basic to advance, for servicing and maintaining all systems associated
with the vehicle (Gillig estimate: 120 hours for basic).
Major Budgetary Changes
An increase in Services due to the NTD contract, and COA Task 1 & 2 phases annual escalations.
A decrease in Materials & Supplies in tires and tubes, repair parts, and fuel & Lubricants.
Increase in Miscellaneous Expense due to more travel and training projected.
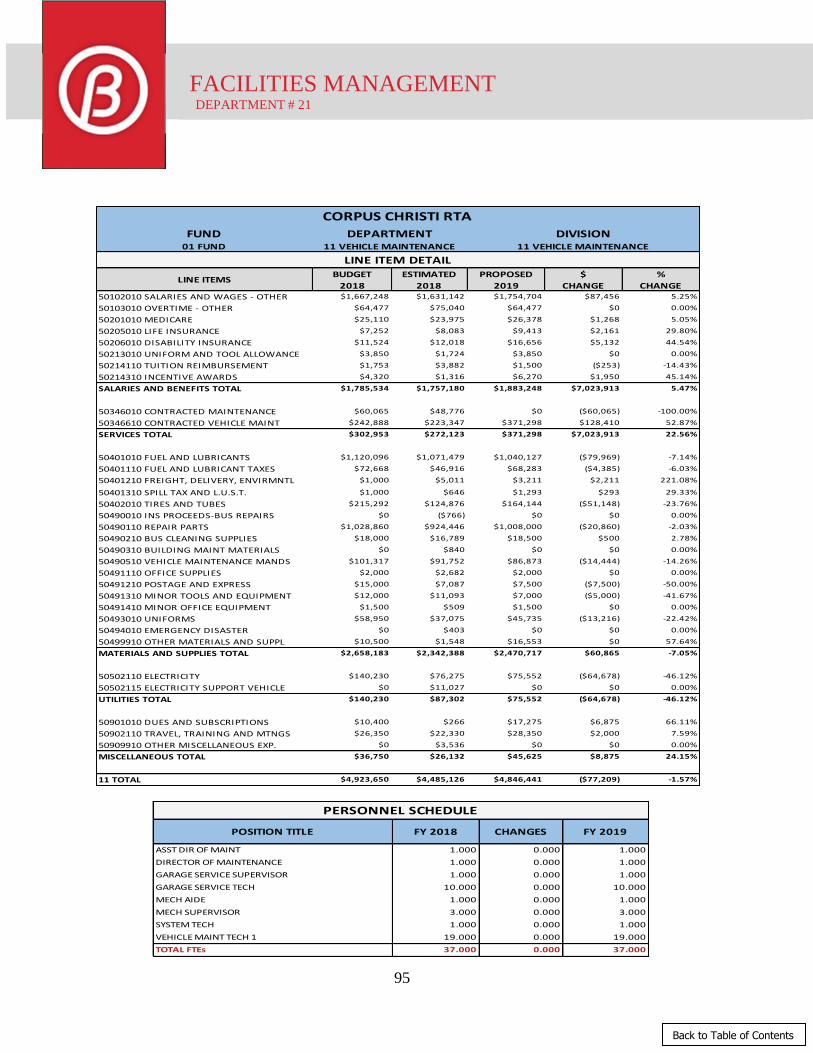
95
FACILITIES MANAGEMENT DEPARTMENT # 21
-
Back to Table of Contents
FUND01 FUND
LINE ITEMSBUDGET
2018
ESTIMATED
2018
PROPOSED
2019
$
CHANGE
%
CHANGE50102010 SALARIES AND WAGES - OTHER $1,667,248 $1,631,142 $1,754,704 $87,456 5.25%
50103010 OVERTIME - OTHER $64,477 $75,040 $64,477 $0 0.00%
50201010 MEDICARE $25,110 $23,975 $26,378 $1,268 5.05%
50205010 LIFE INSURANCE $7,252 $8,083 $9,413 $2,161 29.80%
50206010 DISABILITY INSURANCE $11,524 $12,018 $16,656 $5,132 44.54%
50213010 UNIFORM AND TOOL ALLOWANCE $3,850 $1,724 $3,850 $0 0.00%
50214110 TUITION REIMBURSEMENT $1,753 $3,882 $1,500 ($253) -14.43%
50214310 INCENTIVE AWARDS $4,320 $1,316 $6,270 $1,950 45.14%
SALARIES AND BENEFITS TOTAL $1,785,534 $1,757,180 $1,883,248 $7,023,913 5.47%
50346010 CONTRACTED MAINTENANCE $60,065 $48,776 $0 ($60,065) -100.00%
50346610 CONTRACTED VEHICLE MAINT $242,888 $223,347 $371,298 $128,410 52.87%
SERVICES TOTAL $302,953 $272,123 $371,298 $7,023,913 22.56%
50401010 FUEL AND LUBRICANTS $1,120,096 $1,071,479 $1,040,127 ($79,969) -7.14%
50401110 FUEL AND LUBRICANT TAXES $72,668 $46,916 $68,283 ($4,385) -6.03%
50401210 FREIGHT, DELIVERY, ENVIRMNTL
FEE
$1,000 $5,011 $3,211 $2,211 221.08%
50401310 SPILL TAX AND L.U.S.T. $1,000 $646 $1,293 $293 29.33%
50402010 TIRES AND TUBES $215,292 $124,876 $164,144 ($51,148) -23.76%
50490010 INS PROCEEDS-BUS REPAIRS $0 ($766) $0 $0 0.00%
50490110 REPAIR PARTS $1,028,860 $924,446 $1,008,000 ($20,860) -2.03%
50490210 BUS CLEANING SUPPLIES $18,000 $16,789 $18,500 $500 2.78%
50490310 BUILDING MAINT MATERIALS $0 $840 $0 $0 0.00%
50490510 VEHICLE MAINTENANCE MANDS $101,317 $91,752 $86,873 ($14,444) -14.26%
50491110 OFFICE SUPPLIES $2,000 $2,682 $2,000 $0 0.00%
50491210 POSTAGE AND EXPRESS $15,000 $7,087 $7,500 ($7,500) -50.00%
50491310 MINOR TOOLS AND EQUIPMENT $12,000 $11,093 $7,000 ($5,000) -41.67%
50491410 MINOR OFFICE EQUIPMENT $1,500 $509 $1,500 $0 0.00%
50493010 UNIFORMS $58,950 $37,075 $45,735 ($13,216) -22.42%
50494010 EMERGENCY DISASTER $0 $403 $0 $0 0.00%
50499910 OTHER MATERIALS AND SUPPL $10,500 $1,548 $16,553 $0 57.64%
MATERIALS AND SUPPLIES TOTAL $2,658,183 $2,342,388 $2,470,717 $60,865 -7.05%
50502110 ELECTRICITY $140,230 $76,275 $75,552 ($64,678) -46.12%
50502115 ELECTRICITY SUPPORT VEHICLE $0 $11,027 $0 $0 0.00%
UTILITIES TOTAL $140,230 $87,302 $75,552 ($64,678) -46.12%
50901010 DUES AND SUBSCRIPTIONS $10,400 $266 $17,275 $6,875 66.11%
50902110 TRAVEL, TRAINING AND MTNGS $26,350 $22,330 $28,350 $2,000 7.59%
50909910 OTHER MISCELLANEOUS EXP. $0 $3,536 $0 $0 0.00%
MISCELLANEOUS TOTAL $36,750 $26,132 $45,625 $8,875 24.15%
11 TOTAL $4,923,650 $4,485,126 $4,846,441 ($77,209) -1.57%
CORPUS CHRISTI RTA
DEPARTMENT DIVISION11 VEHICLE MAINTENANCE 11 VEHICLE MAINTENANCE
LINE ITEM DETAIL
CHANGES FY 2019
0.000 1.000
0.000 1.000
0.000 1.000
0.000 10.000
0.000 1.000
0.000 3.000
0.000 1.000
0.000 19.000
0.000 37.000
VEHICLE MAINT TECH 1 19.000
TOTAL FTEs 37.000
MECH AIDE 1.000
MECH SUPERVISOR 3.000
SYSTEM TECH 1.000
DIRECTOR OF MAINTENANCE 1.000
GARAGE SERVICE SUPERVISOR 1.000
GARAGE SERVICE TECH 10.000
PERSONNEL SCHEDULE
POSITION TITLE FY 2018
ASST DIR OF MAINT 1.000

96
FACILITIES MANAGEMENT DEPARTMENT # 21
-
Back to Table of Contents
Functions and Responsibilities
This department is responsible for maintaining facilities, grounds, and equipment. It oversees the
maintenance of administrative and operations offices, transfer centers, bus shelters, and bus stops throughout the service region. Specifically, this department inspects repairs and maintains air
conditioning, plumbing, electrical equipment, sprinkler systems, and lighting at all facilities. The
department is also responsible for overseeing capital improvements and monitoring contracted services.
FY 2018 Accomplishments
Deliver the Best Possible Experience
o Installation of new bike amenities at bus stops. o Completed 100% of scheduled facilities PMI’s to include bus lifts, generators, bus wash,
and fuel and lubricant pumps. o Replaced new bus stop signs for Fall Service changes and removed bus stops no longer
being serviced, due to the changes.
o Supported various special events, such as the Buccaneer Commission at the Staples Street Center during the Buc Parade along with the
o CCRTA employee event held at the Staples Street Center during the annual Buc Parade and the annual CCRTA Roadeo just to name a few.
FY 2019 Planned Initiatives
Continue to Improve Organizational Practices
o Ensure all facilities are physically viable for its intended purpose
o Ensure all facilities meet health and safety needs o Maintain cosmetic upgrades to increase customer satisfaction
o Maintain system of work orders to ensure emergency and non-
o emergency requests are completed on a timely basis o Proceed with procurement of new bus stop shelter amenities.
Budgetary Changes
Increases in Services by 2.76% due to annual contract increases.
Increase in Materials and Supplies by 122.10% due to the building maintenance and
shelter maintenance supplies.
Increase in Other Miscellaneous Expense of $4,560 due to projected travel and training
expenses.
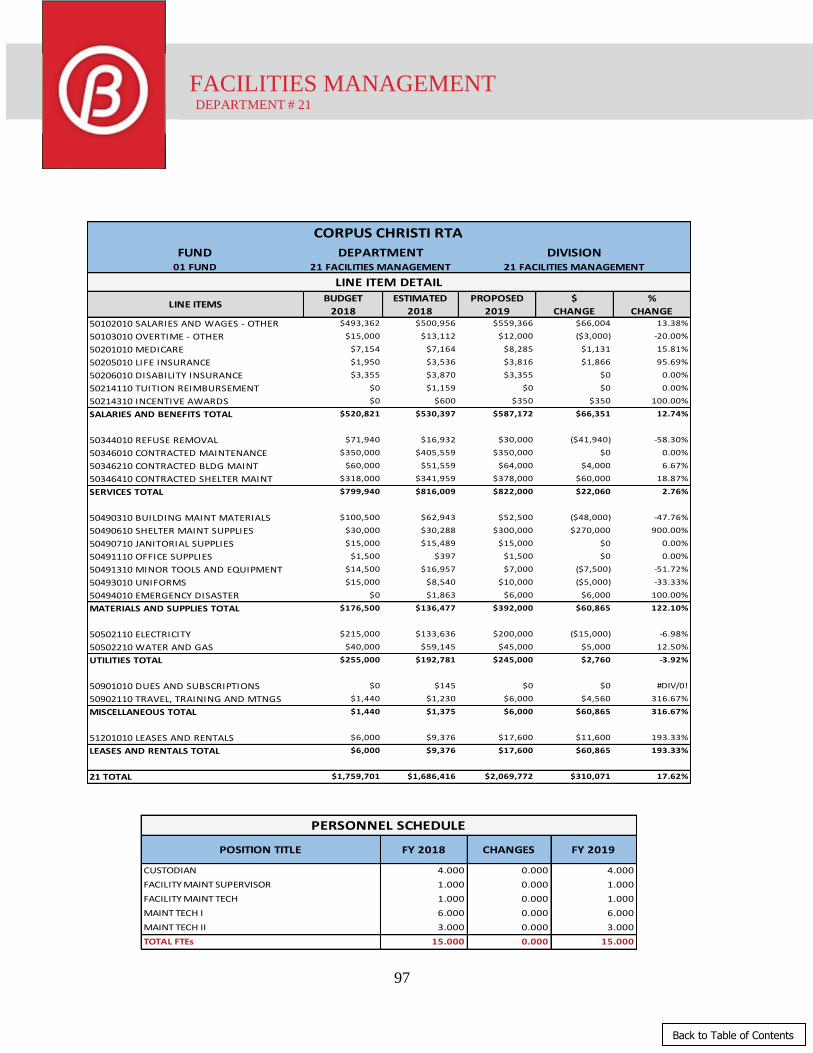
97
FACILITIES MANAGEMENT DEPARTMENT # 21
-
Back to Table of Contents
FUND01 FUND
LINE ITEMSBUDGET
2018
ESTIMATED
2018
PROPOSED
2019
$
CHANGE
%
CHANGE50102010 SALARIES AND WAGES - OTHER $493,362 $500,956 $559,366 $66,004 13.38%
50103010 OVERTIME - OTHER $15,000 $13,112 $12,000 ($3,000) -20.00%
50201010 MEDICARE $7,154 $7,164 $8,285 $1,131 15.81%
50205010 LIFE INSURANCE $1,950 $3,536 $3,816 $1,866 95.69%
50206010 DISABILITY INSURANCE $3,355 $3,870 $3,355 $0 0.00%
50214110 TUITION REIMBURSEMENT $0 $1,159 $0 $0 0.00%
50214310 INCENTIVE AWARDS $0 $600 $350 $350 100.00%
SALARIES AND BENEFITS TOTAL $520,821 $530,397 $587,172 $66,351 12.74%
50344010 REFUSE REMOVAL $71,940 $16,932 $30,000 ($41,940) -58.30%
50346010 CONTRACTED MAINTENANCE $350,000 $405,559 $350,000 $0 0.00%
50346210 CONTRACTED BLDG MAINT $60,000 $51,559 $64,000 $4,000 6.67%
50346410 CONTRACTED SHELTER MAINT $318,000 $341,959 $378,000 $60,000 18.87%
SERVICES TOTAL $799,940 $816,009 $822,000 $22,060 2.76%
50490310 BUILDING MAINT MATERIALS $100,500 $62,943 $52,500 ($48,000) -47.76%
50490610 SHELTER MAINT SUPPLIES $30,000 $30,288 $300,000 $270,000 900.00%
50490710 JANITORIAL SUPPLIES $15,000 $15,489 $15,000 $0 0.00%
50491110 OFFICE SUPPLIES $1,500 $397 $1,500 $0 0.00%
50491310 MINOR TOOLS AND EQUIPMENT $14,500 $16,957 $7,000 ($7,500) -51.72%
50493010 UNIFORMS $15,000 $8,540 $10,000 ($5,000) -33.33%
50494010 EMERGENCY DISASTER $0 $1,863 $6,000 $6,000 100.00%
MATERIALS AND SUPPLIES TOTAL $176,500 $136,477 $392,000 $60,865 122.10%
50502110 ELECTRICITY $215,000 $133,636 $200,000 ($15,000) -6.98%
50502210 WATER AND GAS $40,000 $59,145 $45,000 $5,000 12.50%
UTILITIES TOTAL $255,000 $192,781 $245,000 $2,760 -3.92%
50901010 DUES AND SUBSCRIPTIONS $0 $145 $0 $0 #DIV/0!
50902110 TRAVEL, TRAINING AND MTNGS $1,440 $1,230 $6,000 $4,560 316.67%
MISCELLANEOUS TOTAL $1,440 $1,375 $6,000 $60,865 316.67%
51201010 LEASES AND RENTALS $6,000 $9,376 $17,600 $11,600 193.33%
LEASES AND RENTALS TOTAL $6,000 $9,376 $17,600 $60,865 193.33%
21 TOTAL $1,759,701 $1,686,416 $2,069,772 $310,071 17.62%
CORPUS CHRISTI RTA
DEPARTMENT DIVISION21 FACILITIES MANAGEMENT 21 FACILITIES MANAGEMENT
LINE ITEM DETAIL
CHANGES FY 2019
0.000 4.000
0.000 1.000
0.000 1.000
0.000 6.000
0.000 3.000
0.000 15.000
PERSONNEL SCHEDULE
POSITION TITLE FY 2018
CUSTODIAN 4.000
MAINT TECH II 3.000
TOTAL FTEs 15.000
FACILITY MAINT SUPERVISOR 1.000
FACILITY MAINT TECH 1.000
MAINT TECH I 6.000

98
PROCUREMENT DEPARTMENT # 40
-
Back to Table of Contents
Functions and Responsibilities
This department is responsible for procurement activities, contract and grant administration. In the
procurement capacity it is responsible for the acquisition of all goods, services, and construction needed by CCRTA at fair and reasonable prices, on time, and in compliance with sound public purchasing policies
and procedures, in accordance with solicitation documents and board awarded approval requirements. This
department also is responsible for issuing solicitations for procurements and purchase orders. Among the contract administration responsible is the managing CCRTA’s contracts and agreements,
conducting contract compliance review, and maintaining required documentation. The Grants Section is responsible for the administration and management of all grants including filing quarterly grant reports,
annual NTD reports, and tracking grant expenditures.
FY 2018 Accomplishments
Improvements on Organizational Practices and Development of Staff
o Increased professional development through fundamental courses such as Orientation to
Transit Procurement and Contract Administration that were provided by NTI. o Implemented new policies and procedures that enhances the procurement process to
incorporate FTA’s rules and regulations.
Enhanced CCRTA’s Procurement Experience
o Created forms (Bid/Proposal Submission Form) and informational Power Point Presentation to
educate vendors & contractors on how to avoid submitting flawed bid/proposal responses. o Participated in professional purchasing associations that emphasize education and best
practices for purchasing professionals as well as vendor outreach efforts and networking events. The most recent vendor outreach was the Del Mar College PTAC.
o Created informational Power Point Presentations for our internal customer’s that provided information on the updated forms that the procurement department has created for future use.
FY 2019 Planned Initiatives
Continue to Improve Organizational Practices and Develop Staff
o Increased professional development through fundamental courses that are provided by NTI and APTA.
Pursue Innovation o Implement an e-procurement systems that will allow bidders and proposers to submit bids and
proposals via electronically.
Improve relationships with vendors and surrounding small businesses
o The Procurement Dept. will host quarterly networking events to educate business how to do business with CCRTA, the do’s and don’ts of procurement, upcoming procurement scopes and
opportunities.
Budgetary Changes
A 4.03% increase in Salaries & Benefits due to step and COLA increases.
No change in Materials & Supplies due the maintenance of material responsibilities.
A 28.80% increase in Miscellaneous due to future training and travel.

99
PROCUREMENT DEPARTMENT # 40
-
Back to Table of Contents
CHANGES FY 2019
0.000 2.000
0.000 1.000
0.000 3.000
2.000
DIRECTOR OF PROCUREMENT 1.000
TOTAL FTEs 3.000
PERSONNEL SCHEDULE
POSITION TITLE FY 2018
BUYER
FUND01 FUND
LINE ITEMSBUDGET
2018
BUDGET
2018
PROPOSED
2019
$
CHANGE
%
CHANGE50102010 SALARIES AND WAGES - OTHER $189,544 $183,245 $190,258 $714 0.38%
50201010 MEDICARE $3,124 $2,575 $2,759 ($365) -11.69%
50205010 LIFE INSURANCE $489 $718 $763 $274 56.07%
50206010 DISABILITY INSURANCE $1,572 $1,206 $1,347 ($225) -14.33%
50214110 TUITION REIMBURSEMENT $3,000 $0 $10,000 $7,000 233.33%
50214310 INCENTIVE AWARDS $325 $436 $900 $575 176.92%
SALARIES AND BENEFITS TOTAL $198,054 $188,181 $206,026 $7,973 4.03%
50493010 UNIFORMS $150 $150 $150 $0 0.00%
MATERIALS AND SUPPLIES TOTAL $150 $150 $150 $0 0.00%
50901010 DUES AND SUBSCRIPTIONS $500 $100 $512 $12 2.40%
50902110 TRAVEL, TRAINING AND MTNGS $3,000 $6,646 $5,000 $2,000 66.67%
50908010 ADVERT/PROMO MEDIA EXP. $8,000 $5,214 $9,300 $1,300 16.25%
MISCELLANEOUS TOTAL $11,500 $11,960 $14,812 $3,312 28.80%
40 TOTAL $209,704 $200,291 $220,988 $11,285 5.38%
CORPUS CHRISTI RTA
DEPARTMENT DIVISION40 PROCUREMENT 40 PROCUREMENT
LINE ITEM DETAIL
100
CHIEF EXECUTIVE OFFICER DEPARTMENT # 41
-
Back to Table of Contents
Functions and Responsibilities
As Chief Executive and Administrative Head of the Authority, the General Manager is responsible to the
Board of Directors for the proper direction, coordination and administration of all affairs in accordance with the policies determined by the Board and the laws and regulations of local, state, and federal governments.
FY 2018 Accomplishments
Continue to Improve Organizational Practices and Develop Staff
o Enhanced and streamlined weekly report to Board with Friday Flash for communicating status of projects and pertinent transit information.
o Improved interaction and topic exchange information at morning “Standup Meetings” and
weekly EMT meetings. o Reviewed and updated Agency policies for board review at first 2016 Board Retreat
o Initiated review and evaluation of all contractual services to ensure compliance from o vendors and establish score cards
2019 Planned Initiatives
Continue to Improve Organizational Practices and Develop Staff
o Ensure strategic direction of Board is executed accordingly o Promote leadership awareness internally and externally
o Partner with City and other state holders to advance opportunities for expansion of services
o Enhance relations with community leaders to promote value of organization and public
transportation o Support community involvement throughout the organization
o Increase customer service and customer perception of organization and public o transportation
o Improve business practices by continuing to standardize and document Board policies to
increase efficiency and transparency o Evaluate and update Board adopted policies to ensure compliance and the application of
best practices in industries o Evaluate and continue to improve the use of technology in communicating with the Board
and the public, including but not limited to, improved access to backup materials.
Budgetary Changes
3.98% increase in Salaries & Benefits as a result of cost of living increase.
$1,294 increase in Materials & Supplies due to managing a conservative year.
An increase in Miscellaneous due to projected Travel, Training and Meetings.

101
CHIEF EXECUTIVE OFFICER DEPARTMENT # 41
-
Back to Table of Contents
FUND01 FUND
LINE ITEMSBUDGET
2018
ESTIMATED
2018
PROPOSED
2019
$
CHANGE
%
CHANGE50102010 SALARIES AND WAGES - OTHER $175,000 $174,945 $180,250 $5,250 3.00%
50201010 MEDICARE $2,537 $2,698 $2,800 $263 0.00%
50202010 PENSION $8,906 $10,087 $10,815 $1,909 0.00%
50205010 LIFE INSURANCE $317 $196 $350 $33 10.41%
50206010 DISABILITY INSURANCE $461 $441 $461 $0 0.00%
50214310 INCENTIVE AWARDS $0 $5,326 $0 $0 100.00%
SALARIES AND BENEFITS TOTAL $187,221 $193,694 $194,676 $7,455 3.98%
50322010 CONSULTING SERVICES $152,437 $135,817 $156,000 $3,563 2.34%
50324010 LEGAL FEES $65,000 $27,731 $70,000 $5,000 7.69%
SERVICES TOTAL $217,437 $163,548 $226,000 $8,563 3.94%
50491110 OFFICE SUPPLIES $2,435 $2,125 $3,000 $565 23.22%
50492010 PRINTING $271 $0 $1,000 $729 268.73%
MATERIALS AND SUPPLIES TOTAL $2,706 $2,125 $4,000 $1,294 47.83%
50901010 DUES AND SUBSCRIPTIONS $66,135 $74,758 $70,500 $4,365 6.60%
50902110 TRAVEL, TRAINING AND MTNGS $85,050 $93,380 $112,750 $27,700 32.57%
50908010 ADVERT/PROMO MEDIA EXP. $43,500 $911 $55,000 $11,500 26.44%
50909010 PROMPT PAYMENT ACT $0 $0 $0 $0 0.00%
50909510 COMMUNITY SERVICES $19,100 $22,609 $39,100 $20,000 104.71%
50909910 OTHER MISCELLANEOUS EXP. $3,000 $0 $6,500 $3,500 116.67%
MISCELLANEOUS TOTAL $216,785 $191,658 $283,850 $67,065 30.94%
41 TOTAL $624,149 $551,024.98 $708,526 $84,377 13.52%
CORPUS CHRISTI RTA
DEPARTMENT DIVISION41 CEO 41 CEO
LINE ITEM DETAIL
CHANGES FY 2019
0.000 1.000
0.000 1.000
PERSONNEL SCHEDULE
POSITION TITLE FY 2018
CEO 1.000
TOTAL FTEs 1.000

102
FINANCE & ACCOUNTING DEPARTMENT # 42
-
Back to Table of Contents
Functions and Responsibilities
The Finance department is responsible for managing the financial data for the Authority, ensuring accurate
and timely accounting and reporting, monitoring financial performance, processing timely payment of goods and services procured this department is responsibility for the management, processing, dissemination,
and integrity of the financial data for the Authority. Included is the safekeeping, tracking, and management
of fixed assets, coordination of the annual audit processes, investment of funds, and for providing on-going support to management and departments.
FY 2018 Accomplishments
Asset Management o Inventory – Fixed Assets
Conducted comprehensive physical inventory of fixed assets.
Designed fill-in templates with policies and procedures to track.
CAFR, Audits and Reporting
o Submitted application for Certificate of Achievement for Excellence in Financial Reporting for
the CAFR for the year ending December 31, 2017
o Underwent an FTA Financial Management Oversight (FMO) for 2016 & 2017 on seven public
accounting standards for financial management successfully.
Efficiencies
o Increased investments in Certificates of Deposits and government investment pools resulting in
over $400,000 in additional investment income
o Developed and implemented Stock Replenishment Order forms, Project Close-Out Form and
Procedures, and invoice receiving and payment authorization process using stampers to help
identify the various stages of the accounts payable cycle including electronic distribution of
invoices with digital payment authorization signatures.
FY 2019 Planned Initiatives
Continue to Improve Organizational Practices and Develop Staff
o Issue Request for Proposals (RFP) for banking services that resulted in a contract award that will produce savings in service fees and increasing investment income potential by $70,000.
o Continue streamlining of accounting functions to increase efficiency and effectiveness o Continue use of webinars as cost effective tool for expanding knowledge
Enhance Awareness of the Value of the Transportation System in the Community
o Submit the FY2019 Comprehensive Annual Financial Report to the Government Finance
o Officers Association for award consideration
Budgetary Changes
14.07% increase in Salaries and Benefits due to the refunding of a FTE.
9.24% increase in Services due to anticipated increases in audit fees and accounting
software contracted maintenance costs
106.88% increase in Miscellaneous due to travel and training expenses projected.

103
FINANCE & ACCOUNTING DEPARTMENT # 42
-
Back to Table of Contents
FUND01 FUND
LINE ITEMSBUDGET
2018
ESTIMATED
2018
PROPOSED
2019
$
CHANGE
%
CHANGE50102010 SALARIES AND WAGES - OTHER $343,234 $333,591 $355,856 $12,622 3.68%
50103010 OVERTIME - OTHER $5,825 $783 $6,450 $625 10.74%
50201010 MEDICARE $5,001 $4,807 $5,258 $257 5.14%
50205010 LIFE INSURANCE $1,233 $1,154 $1,183 ($50) -4.03%
50206010 DISABILITY INSURANCE $2,091 $1,719 $1,938 ($153) -7.30%
50214110 TUITION REIMBURSEMENT $0 $0 $36,000 $36,000 100.00%
50214310 INCENTIVE AWARDS $0 $600 $1,000 $1,000 100.00%
SALARIES AND BENEFITS TOTAL $357,384 $342,654 $407,686 $50,302 14.07%
50329910 OTHER PROFESSIONAL SERV $103,127 $111,317 $111,579 $8,453 8.20%
50330010 TEMPORARY SERVICES $6,000 $10,551 $0 ($6,000) -100.00%
50346010 CONTRACTED MAINTENANCE $27,775 $28,508 $37,973 $10,198 36.72%
SERVICES TOTAL $136,902 $150,376 $149,552 $12,651 9.24%
50490710 JANITORIAL SUPPLIES $0 $0 $0 $0 $0
50491110 OFFICE SUPPLIES $1,650 $1,750 $2,071 $421 25.54%
50491210 POSTAGE AND EXPRESS $50 $50 $100 $50 100.00%
50491410 MINOR OFFICE EQUIPMENT $2,300 $2,200 $2,300 $0 0.00%
50492010 PRINTING $1,200 $1,200 $1,635 $435 36.25%
MATERIALS AND SUPPLIES TOTAL $5,200 $5,200 $6,106 $906 17.43%
50901010 DUES AND SUBSCRIPTIONS $2,297 $681 $2,297 $0 0.00%
50902110 TRAVEL, TRAINING AND MTNGS $1,865 $457 $7,000 $5,136 275.44%
50909910 OTHER MISCELLANEOUS EXP. $865 $0 $1,102 $237 27.40%
MISCELLANEOUS TOTAL $5,027 $1,137 $10,399 $5,373 106.88%
42 TOTAL $504,513 $499,367 $573,744 $69,231 13.72%
CORPUS CHRISTI RTA
DEPARTMENT DIVISION42 FINANCE AND 42 FINANCE AND ACCOUNTING
LINE ITEM DETAIL
CHANGES FY 2019
0.000 1.000
0.000 1.000
0.000 1.000
0.000 1.000
0.000 1.500
0.000 1.000
0.000 6.500
MONEY ROOM COUNTER 1.500
PAYROLL COORDINATOR 1.000
TOTAL FTEs 6.500
ACCOUNTS PAYABLE 1.000
COMPTROLLER 1.000
DIR OF FINANCE 1.000
PERSONNEL SCHEDULE
POSITION TITLE FY 2018
ACCOUNTANT 1.000

104
MATERIALS MANAGEMENT DEPARTMENT # 43
-
Back to Table of Contents
Functions and Responsibilities
This department is primarily responsible for planning, organizing, and controlling the uninterrupted flow of
materials to the maintenance department. The department is required to provide a consistent level of services that will enable the Agency to achieve its goals and objectives of providing excellent customer service in a safe
environment. In addition, this department is responsible for maintaining an adequate inventory to support a
diversified fleet, purchase goods and services related to parts, and conduct cycle counts.
FY 2018 Accomplishments
Met daily service demands & special movement request including ensuring materials and supplies
were available to complete fleet repairs.
Implemented a support infrastructure for the new predictive preventable program, setting inventory
levels to coincide within the new PMI cycle schedule. Introduced a sister campaign to support new SOPs identifying failures causing service interruptions,
usage spikes trigger a notification process for leadership to investigate and identify trends or product
quality concerns. Implemented an environmental protection program for Maintenance employees to include Hazard
Containment Spill Protection Kits, Mechanic and Utility operations.
Completed updating the fleet inventory, entry of all new part IDs into Fleet Net and removal of
obsolete parts to include non-movement stock.
FY 2019 Planned Initiatives
Maximize bulk storage by replacing outdated containment structures to include racks for glass
inventory. Conduct forklift safety and operation training for all maintenance employees.
Analyze stocking requirements and standardize quantities to improve cycling of inventory.
Implement a support infrastructure for the enhanced preventative cleaning program, coordinating
with vendors to supply/stock materials to meet new consumption levels.
Research new scanning device technology for inventory control with features to efficiently and
accurately charge out parts from inventory.
Budgetary Changes
12.48% increase in Salaries & Benefits as a result of modifying salary of FTE previously added to
the dept. 45.86% decrease in Materials & Supplies due to cost efficiencies in uniforms.
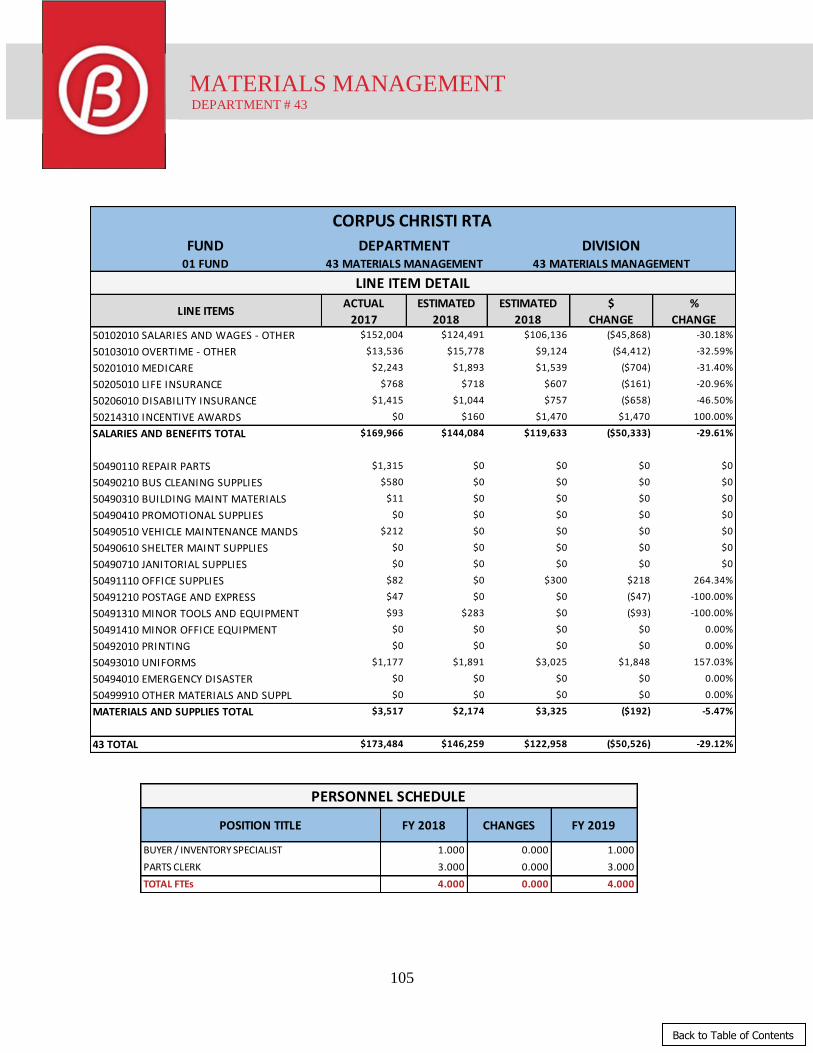
105
MATERIALS MANAGEMENT DEPARTMENT # 43
-
Back to Table of Contents
FUND01 FUND
LINE ITEMSACTUAL
2017
ESTIMATED
2018
ESTIMATED
2018
$
CHANGE
%
CHANGE50102010 SALARIES AND WAGES - OTHER $152,004 $124,491 $106,136 ($45,868) -30.18%
50103010 OVERTIME - OTHER $13,536 $15,778 $9,124 ($4,412) -32.59%
50201010 MEDICARE $2,243 $1,893 $1,539 ($704) -31.40%
50205010 LIFE INSURANCE $768 $718 $607 ($161) -20.96%
50206010 DISABILITY INSURANCE $1,415 $1,044 $757 ($658) -46.50%
50214310 INCENTIVE AWARDS $0 $160 $1,470 $1,470 100.00%
SALARIES AND BENEFITS TOTAL $169,966 $144,084 $119,633 ($50,333) -29.61%
50490110 REPAIR PARTS $1,315 $0 $0 $0 $0
50490210 BUS CLEANING SUPPLIES $580 $0 $0 $0 $0
50490310 BUILDING MAINT MATERIALS $11 $0 $0 $0 $0
50490410 PROMOTIONAL SUPPLIES $0 $0 $0 $0 $0
50490510 VEHICLE MAINTENANCE MANDS $212 $0 $0 $0 $0
50490610 SHELTER MAINT SUPPLIES $0 $0 $0 $0 $0
50490710 JANITORIAL SUPPLIES $0 $0 $0 $0 $0
50491110 OFFICE SUPPLIES $82 $0 $300 $218 264.34%
50491210 POSTAGE AND EXPRESS $47 $0 $0 ($47) -100.00%
50491310 MINOR TOOLS AND EQUIPMENT $93 $283 $0 ($93) -100.00%
50491410 MINOR OFFICE EQUIPMENT $0 $0 $0 $0 0.00%
50492010 PRINTING $0 $0 $0 $0 0.00%
50493010 UNIFORMS $1,177 $1,891 $3,025 $1,848 157.03%
50494010 EMERGENCY DISASTER $0 $0 $0 $0 0.00%
50499910 OTHER MATERIALS AND SUPPL $0 $0 $0 $0 0.00%
MATERIALS AND SUPPLIES TOTAL $3,517 $2,174 $3,325 ($192) -5.47%
43 TOTAL $173,484 $146,259 $122,958 ($50,526) -29.12%
CORPUS CHRISTI RTA
DEPARTMENT DIVISION43 MATERIALS MANAGEMENT 43 MATERIALS MANAGEMENT
LINE ITEM DETAIL
CHANGES FY 2019
0.000 1.000
0.000 3.000
0.000 4.000
1.000
PARTS CLERK 3.000
TOTAL FTEs 4.000
PERSONNEL SCHEDULE
POSITION TITLE FY 2018
BUYER / INVENTORY SPECIALIST

106
HUMAN RESOURCES DEPARTMENT # 44
-
Back to Table of Contents
Functions and Responsibilities
The primary function of this department is to ensure that CCRTA operates in compliance with all labor
laws. In addition this department assists management with all the personnel activities and operations, including recruitment and selection, classification and compensation, employee and labor relations,
employee records management, workers’ compensation, benefits insurance, employee and organizational
development. Other services include the administration and implementation of: employee performance improvement plans, recognition programs, wellness and fitness programs, policy and procedures, liaison
with outside regulatory and employment related agencies, organizational effectiveness, employee new hire orientation and training, strategic, succession planning. In addition, this department also assists in
various employment services including confidential assessments, counseling, crises interventions and
referral services.
This department captures costs of various agency-wide employee benefits, such as health, pension, workers compensation, and unemployment.
FY 2018 ACCOMPLISHMENTS
Free on-site Flu Shot Clinic for Employees and Covered Dependent at both locations
Nine (9) Professional Development Training conducted.
Established new contracts for employee benefits for Long-Term Disability, Short-Term
Disability, Life Insurance for $100,000 coverage for all employees, and Occupational Health Services.
Coordinated successful events to include employee appreciation luncheon, Thanksgiving
luncheon, annual holiday event, and other employee recognition functions for employees.
FY 2019 Planned Initiatives
Updated Employee Handbook effective 1st Quarter of 2019.
Coordinated Wellness initiatives with staff and wellness agents to include weight loss
challenges, walking programs, effective resources that can be utilized
Retirement Seminar for Employees to include ICMA, Nationwide and Wells Fargo.
Introduce more healthcare education with Christus Spohn representatives.
Budgetary Changes
25.92% increase in Salaries & Benefits due to the anticipated staffing of all positions in the
department and pension increases.
12.00% increase in Services due increase in consulting services and employee exams.
128.44% increase in Miscellaneous due to involving more staff in travel and training
expenses and cost for employee relations activities and employee appreciation programs.

107
HUMAN RESOURCES DEPARTMENT # 44
-
Back to Table of Contents
FUND01 FUND
LINE ITEMSBUDGET
2018
ESTIMATED
2018
PROPOSED
2019
$
CHANGE
%
CHANGE50102010 SALARIES AND WAGES - OTHER $167,601 $170,646 $175,787 $8,186 4.88%
50103010 OVERTIME - OTHER $60 $121 $100 $40 66.67%
50201010 MEDICARE $2,430 $2,355 $2,549 $119 4.90%
50202010 PENSION $1,425,533 $1,425,533 $1,909,000 $483,467 0.00%
50204010 DENTAL $90,000 $38,803 $55,345 ($34,655) 0.00%
50205010 LIFE INSURANCE $600 $718 $763 $163 27.20%
50206010 DISABILITY INSURANCE $550 $1,009 $1,500 $950 172.73%
50207010 UNEMPLOYMENT $44,000 $13,788 $60,000 $16,000 0.00%
50214110 TUITION REIMBURSEMENT $5,000 $1,126 $10,000 $5,000 100.00%
50214210 WORKERS COMPENSATION $132,000 $122,483 $132,000 $0 0.00%
50214310 INCENTIVE AWARDS $550 $1,855 $5,550 $5,000 909.09%
SALARIES AND BENEFITS TOTAL $1,868,324 $1,778,437 $2,352,594 $484,270 25.92%
50322010 CONSULTING SERVICES $73,000 $80,460 $91,400 $18,400 25.21%
50324010 LEGAL FEES $25,000 $24,178 $25,000 $0 0.00%
50329910 OTHER PROFESSIONAL SERV $38,000 $20,767 $21,530 ($16,470) -43.34%
50372010 EMPLOYEE EXAMS $31,600 $34,824 $49,785 $18,185 57.55%
SERVICES TOTAL $167,600 $160,229 $187,715 $20,115 12.00%
50490410 PROMOTIONAL SUPPLIES $4,875 $2,190 $19,055 $14,180 290.87%
50491110 OFFICE SUPPLIES $890 $614 $990 $100 11.24%
50491210 POSTAGE AND EXPRESS $280 $92 $0 ($280) -100.00%
50492010 PRINTING $350 $0 $400 $50 14.29%
MATERIALS AND SUPPLIES TOTAL $6,395 $2,896 $20,445 $14,050 219.70%
50610010 HEALTH CARE SELF INSURANCE $2,600,000 $3,411,075 $3,607,969 $1,007,969 38.77%
INSURANCE TOTAL $2,600,000 $3,411,075 $3,607,969 $1,007,969 38.77%
50901010 DUES AND SUBSCRIPTIONS $240 $3,651 $240 $0 0.00%
50902110 TRAVEL, TRAINING AND MTNGS $12,725 $9,476 $36,455 $23,730 186.48%
50908010 ADVERT/PROMO MEDIA EXP. $5,500 $4,159 $6,000 $500 9.09%
50909510 COMMUNITY SERVICES $400 $0 $400 $0 0.00%
MISCELLANEOUS TOTAL $18,865 $17,286 $43,095 $24,230 128.44%
44 TOTAL $4,661,184 $5,369,923 $6,211,818 $1,550,634 33.27%
CORPUS CHRISTI RTA
DEPARTMENT DIVISION44 HUMAN RESOURCES 44 HUMAN RESOURCES
LINE ITEM DETAIL
CHANGES FY 2019
0.000 1.000
0.000 1.000
0.000 1.000
0.000 1.500
0.000 4.500TOTAL FTEs 4.500
HR ANALYST 1.000
HR TECH 1.000
INTERN 1.500
PERSONNEL SCHEDULE
POSITION TITLE FY 2018
DIRECTOR OF HR 1.000

108
ADMINISTRATION DEPARTMENT # 45
-
Back to Table of Contents
Functions and Responsibilities
This department is responsible for ensuring compliance with federal regulations governing: Implemented
Civil Rights Act of 1964 (title VI, Title VII, EEO, equal access to federal equipment) Disadvantage Business Program including the participating guidance from 49 CFR Part 26 Americans with Disabilities Act of 1992
including transportation services requirements from 49 CFR parts 37 and accessibility specifications
requirements for transportation vehicles from 49 CFR part 38 All other federal contract compliance issues such as the Davis Bacon Act and Equal Pay Act as they pertain to contracting opportunities.
This department is also responsible for the administration of the budget process and provides management
and oversight monitoring expertise to the following departments:
o Finance & Accounting o Contracts, Grants & Procurement
o Management Information Systems
FY 2018 Accomplishments
Continue to Improve Organizational Practices and Develop Staff
o Received the Distinguished Budget Presentation Award for FY2016
o Finance Department established a 5-year Capital Improvement Plan for the Agency o Finance Department established a 5-year Budget
o Finance Department updated the 5-year Financial Plan/projection o Administration Department completed a Fare structure presentation that was discussed in the
o September 2017 Board of Director’s Workshop o Administration and Finance reviewed economic indicators and used this information to project the
5-year budget & 5-year Financial plans o Administration worked with the CEO, Capital Projects and Operations to layout a working plan to
accommodate additional growth needs for the Port-Ayers Transfer Station
o Administration/Finance established a TexPool account and reallocated maturing CCRTA’s o investments to leverage our rate of return
FY 2018 Planned Initiatives9
Submit 2019 Annual Budget for Government Finance Officers Association (GFOA)
consideration
Develop a 5-year Capital Improvement Plan for the Agency
Develop a 5-year Agency Budget projection
Have the Finance department work with Marketing to improve the agency’s financial
transparency
Update/revise the Procurement manual
Develop/update written SOP’s for the Finance and Procurement departments
Budgetary Changes
2.42% decrease in Salaries & Benefits due to salaries and wages adjustment.
39.39% increase in Services due to increase in contracted maintenance.
No changes in Materials and Supplies due to maintaining current trends.

109
ADMINISTRATION DEPARTMENT # 45
-
Back to Table of Contents
FUND01 FUND
LINE ITEMSBUDGET
2018
ESTIMATED
2018
PROPOSED
2019
$
CHANGE
%
CHANGE50102010 SALARIES AND WAGES - OTHER $452,794 $418,369 $441,086 ($11,708) -2.59%
50103010 OVERTIME - OTHER $1,500 $1,354 $750 ($750) -50.00%
50201010 MEDICARE $6,588 $6,013 $6,407 ($181) -2.75%
50205010 LIFE INSURANCE $1,447 $1,437 $1,781 $334 23.07%
50206010 DISABILITY INSURANCE $1,750 $2,560 $2,675 $925 52.86%
50214310 INCENTIVE AWARDS $2,400 $5,577 $2,500 $100 4.17%
SALARIES AND BENEFITS TOTAL $466,479 $435,310 $455,198 ($11,281) -2.42%
50322010 CONSULTING SERVICES $30,000 $18,060 $30,000 $0 $0
50329910 OTHER PROFESSIONAL SERV $1,000 $249 $27,000 $0 $0
50346010 CONTRACTED MAINTENANCE $35,000 $28,909 $35,000 $0 $0
SERVICES TOTAL $66,000 $47,218 $92,000 $0 $0
50490410 PROMOTIONAL SUPPLIES $3,000 $1,636 $3,000 $0 0.00%
50491110 OFFICE SUPPLIES $20,000 $6,301 $20,000 $0 0.00%
50491210 POSTAGE AND EXPRESS $11,000 $6,045 $11,000 $0 0.00%
50492010 PRINTING $2,000 $0 $2,000 $0 0.00%
50493010 UNIFORMS $1,000 $0 $1,000 $0 0.00%
MATERIALS AND SUPPLIES TOTAL $37,000 $13,982 $37,000 $0 0.00%
50901010 DUES AND SUBSCRIPTIONS $1,000 $801 $1,000 $0 0.00%
50902110 TRAVEL, TRAINING AND MTNGS $6,700 $6,976 $15,600 $8,900 132.84%
50909510 COMMUNITY SERVICES $4,500 $0 $4,500 $0 0.00%
MISCELLANEOUS TOTAL $12,200 $7,778 $21,100 $8,900 72.95%
51201010 LEASES AND RENTALS $3,200 $0 $3,200 $0 $0
LEASES AND RENTALS TOTAL $3,200 $0 $3,200 $0 $0
45 TOTAL $584,879 $504,288 $608,498 $23,619 4.04%
CORPUS CHRISTI RTA
DEPARTMENT DIVISION45 ADMINISTRATION 45 ADMINISTRATION
LINE ITEM DETAIL
CHANGES FY 2019
0.000 1.000
0.000 1.000
0.000 1.000
0.000 1.000
0.000 1.000
0.000 1.000
0.000 1.000
0.000 7.000TOTAL FTEs 7.000
GRANT WRITER 1.000
MD OF ADMINISTRATION 1.000
SENIOR ADMINISTRATIVE 1.000
DBE COMPLIANCE OFFICER 1.000
DBE COORDINATOR 1.000
EXECUTIVE ADMIN. ASST 1.000
PERSONNEL SCHEDULE
POSITION TITLE FY 2018
BUDGET ANALYST 1.000
110
INFASTRUCTURE PROGRAMS DEPARTMENT # 49
-
Back to Table of Contents
Functions and Responsibilities
This department is responsible for the planning and development of capital projects of all customer and
administrative facilities for the Authority. The department serves as the central area for the project management, design and construction of all capital facilities projects, including all the Authority’s bus
stops, Park & Rides, and transit centers. In addition this department is responsible for the bus stop
accessibility improvement program, street programs and environmental programs.
FY 2018 Accomplishments
Continue to Improve Organization Practices
o Completed construction on General Land Office tenant space. o Completed construction for ADA Bus Stop Improvements Phase VI.
o Completed construction for Leopard/Artesian parking lot. o Started the demolition of the Six Points Transfer Station.
o Issued the Request for Quotes for the Bus Stop Improvements for the Dr. Hector P. Garcia
location. o Issued the Memorandum of Agreement to CCISD for the Bus Stop Improvements at
Cunningham at South Park Middle School.
FY 2019 Planned Initiatives
Deliver the Best Possible Experience
o Continue to pursue construction discipline to confirm projects are moving o forward as planned
o Award a contract for the design of the Del Mar College – Southside Campus. o Award a contract for the design of the Port Ayers Transfer Station.
o Award a contract for the demolition of the Port Ayers Transfer Station.
o Award contracts for engineering design and construction for ADA Bus Stop improvements Phase VII.
o Procure a larger generator for the Operations Building at Bear Lane, for the support of building during power loss situations.
o Procure shelter amenities and install throughout the service area. o Replace the existing roof at the Bear Lane Operations building.
o Construct 10 bus pads at various bus stops.
Budgetary Changes
13.41% decrease in Salaries and Benefits due to adjustments made in salaries and wages.
No changes in Materials and Supplies due to controlling cost efficiencies in office supplies.
12.99% increase in Miscellaneous due to the scheduling in the travel and training expenses.
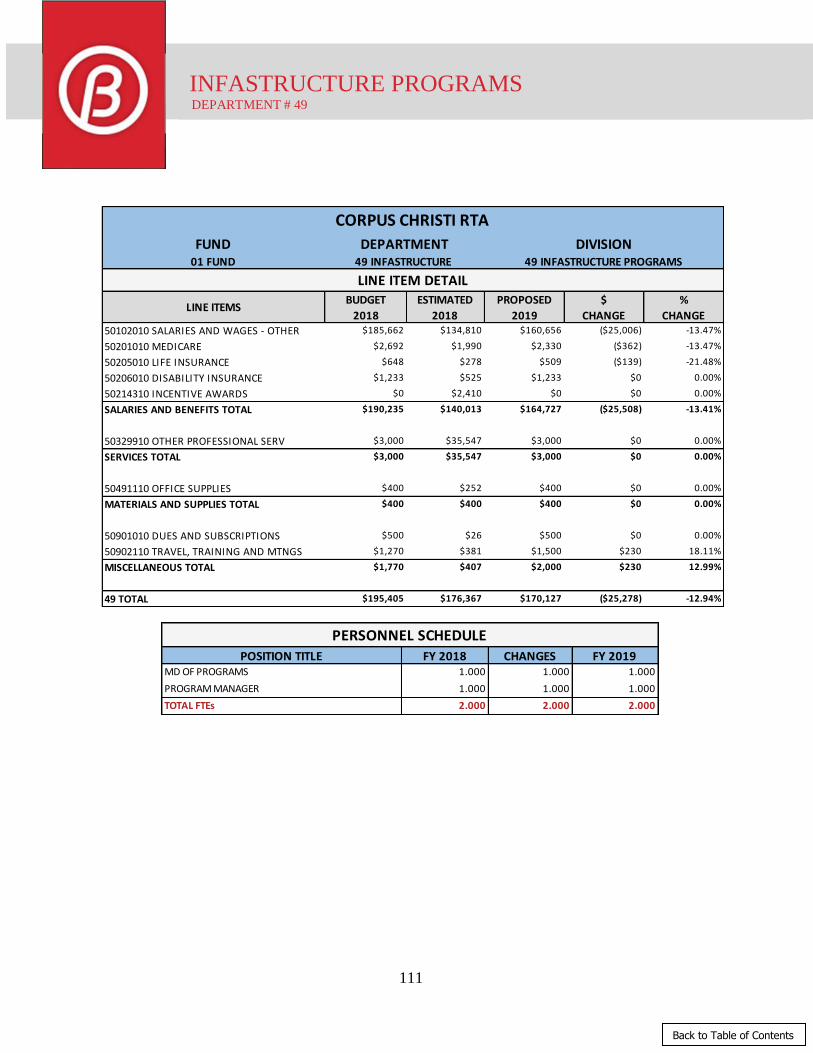
111
INFASTRUCTURE PROGRAMS DEPARTMENT # 49
-
Back to Table of Contents
FUND01 FUND
LINE ITEMSBUDGET
2018
ESTIMATED
2018
PROPOSED
2019
$
CHANGE
%
CHANGE50102010 SALARIES AND WAGES - OTHER $185,662 $134,810 $160,656 ($25,006) -13.47%
50201010 MEDICARE $2,692 $1,990 $2,330 ($362) -13.47%
50205010 LIFE INSURANCE $648 $278 $509 ($139) -21.48%
50206010 DISABILITY INSURANCE $1,233 $525 $1,233 $0 0.00%
50214310 INCENTIVE AWARDS $0 $2,410 $0 $0 0.00%
SALARIES AND BENEFITS TOTAL $190,235 $140,013 $164,727 ($25,508) -13.41%
50329910 OTHER PROFESSIONAL SERV $3,000 $35,547 $3,000 $0 0.00%
SERVICES TOTAL $3,000 $35,547 $3,000 $0 0.00%
50491110 OFFICE SUPPLIES $400 $252 $400 $0 0.00%
MATERIALS AND SUPPLIES TOTAL $400 $400 $400 $0 0.00%
50901010 DUES AND SUBSCRIPTIONS $500 $26 $500 $0 0.00%
50902110 TRAVEL, TRAINING AND MTNGS $1,270 $381 $1,500 $230 18.11%
MISCELLANEOUS TOTAL $1,770 $407 $2,000 $230 12.99%
49 TOTAL $195,405 $176,367 $170,127 ($25,278) -12.94%
CORPUS CHRISTI RTA
DEPARTMENT DIVISION49 INFASTRUCTURE 49 INFASTRUCTURE PROGRAMS
LINE ITEM DETAIL
CHANGES FY 20191.000 1.000
1.000 1.000
2.000 2.000
PROGRAM MANAGER 1.000
TOTAL FTEs 2.000
PERSONNEL SCHEDULEPOSITION TITLE FY 2018
MD OF PROGRAMS 1.000

112
MARKETING & COMMUNICATIONS DEPARTMENT # 50
-
Back to Table of Contents
Functions and Responsibilities
This department provides marketing and communication services for the entire regional transit system. The
Department provides graphic designs and internal and external communications support services to the Authority, staff, and contractors. Functions include: communicates transit related information by means of
radio, billboards, television, web-site, and other media outlets; serves as liaison for the Authority through
multiple community relationships; promotes increased usage of all alternative modes of transportation; and creates strategic marketing, brand development, special projects, small scale graphic designs, in house print
jobs, media placement and buying, and positions the Authority as a positive force for the community through brand reinforcement to stakeholders, community members, and citizens.
FY 2018 Accomplishments
Continue to Improve Public Image, Transparency and Branding
o Increased brand awareness through marketing/advertising the Fleet Forward program
o CCRTA grew its social media presence dramatically in the last quarter of 2018; increasing
interaction by 193%
o Heightened public awareness of CCRTA in a positive manner by partnering with non-profit
organizations and local festival organizers by offering free park and ride shuttle services to various
festivals and special events
o Held well-received press conference in November announcing Fare Free Election Day; media
coverage for four days was estimated at more than $20,000
o CCRTA Outreach program offered students from schools throughout the surrounding area the
opportunity to tour CCRTA facilities and sign up for student IDs and bus passes
o Our Outreach program also participated in various senior programs and community education
FY 2019 Planned Initiatives
Expand the Fleet Forward campaign in 2019 to include: flex program, express services, and increase
awareness of vanpool services
Create a new branding program for the Fleet Forward expanded program
Continue to increase awareness through traditional and social media
Increase stakeholder outreach program
Celebrate successes through digital media and videos to the communities we serve
Begin laying out plan for Mobile App Development for the CCRTA
Update CCRTA website
Continue to focus on customer service and public communication.
Budgetary Changes
11.00% increase in Salaries and Benefits due to funding of tuition reimbursement.
A 35.28% decrease of Services due to exchange of computer consulting services.
Miscellaneous Expense increased 80.95% due to impending travel and training expenses.

113
MARKETING & COMMUNICATIONS DEPARTMENT # 50
-
Back to Table of Contents
FUND01 FUND
LINE ITEMSBUDGET
2018
ESTIMATED
2018
PROPOSED
2019
$
CHANGE
%
CHANGE50102010 SALARIES AND WAGES - OTHER $162,866 $108,438 $171,946 $9,079 5.57%
50201010 MEDICARE $2,364 $1,562 $2,493 $129 5.46%
50205010 LIFE INSURANCE $576 $402 $763 $187 32.42%
50206010 DISABILITY INSURANCE $600 $644 $612 $12 2.00%
50214110 TUITION REIMBURSEMENT $0 $0 $10,000 $10,000 100.00%
50214310 INCENTIVE AWARDS $1,000 $2,784 $0 ($1,000) -100.00%
SALARIES AND BENEFITS TOTAL $167,406 $113,935 $185,814 $18,407 11.00%
50310010 PRODUCTION FEES $21,140 $10,570 $23,000 $1,860 8.80%
50322010 CONSULTING SERVICES $22,000 $9,802 $36,000 $14,000 63.64%
50326010 COMPUTER CONSULTING SERV $240,840 $145,461 $100,000 ($140,840) -58.48%
50329910 OTHER PROFESSIONAL SERV $3,500 $28,560 $25,000 $21,500 614.29%
50379910 OTHER SERVICES $5,320 $131 $5,500 $180 3.38%
SERVICES TOTAL $292,800 $194,525 $189,500 ($103,300) -35.28%
50490410 PROMOTIONAL SUPPLIES $15,845 $10,558 $35,000 $19,155 120.89%
50491110 OFFICE SUPPLIES $2,000 $406 $4,000 $2,000 100.00%
50491210 POSTAGE AND EXPRESS $386 $0 $386 $0 0.00%
50491410 MINOR OFFICE EQUIPMENT $0 $9,096 $0 $0 0.00%
50492010 PRINTING $21,000 $4,016 $55,000 $34,000 161.90%
50493010 UNIFORMS $800 $0 $2,000 $1,200 150.00%
MATERIALS AND SUPPLIES TOTAL $40,031 $24,075 $96,386 $56,355 140.78%
50901010 DUES AND SUBSCRIPTIONS $0 $1,216 $1,500 $1,500 100.00%
50902110 TRAVEL, TRAINING AND MTNGS $10,370 $5,577 $35,000 $24,630 237.51%
50908010 ADVERT/PROMO MEDIA EXP. $46,000 $23,857 $60,000 $14,000 30.43%
50909510 COMMUNITY SERVICES $3,250 $6,977 $15,000 $11,750 361.54%
50909910 OTHER MISCELLANEOUS EXP. $2,000 $168 $0 ($2,000) -100.00%
MISCELLANEOUS TOTAL $61,620 $37,795 $111,500 $49,880 80.95%
50 TOTAL $561,857 $370,330 $583,200 $21,342 3.80%
CORPUS CHRISTI RTA
DEPARTMENT DIVISION50 MARKETING AND 50 MARKETING AND COMMUNICATION
LINE ITEM DETAIL
CHANGES FY 2019
0.000 1.000
0.000 1.000
0.000 1.000
0.000 3.000
PERSONNEL SCHEDULE
POSITION TITLE FY 2018
AMBASSADOR 1.000
DIRECTOR OF MARKETING 1.000
PRODUCTION AND MARKETING COORDINATOR 1.000
TOTAL FTEs 3.000

114
SAFETY & SECURITY DEPARTMENT # 52
-
Back to Table of Contents
Functions and Responsibilities
This department’s primary goal is to achieve the highest practical level of safety and security for our
passengers, employees, contractors and the general public by conducting frequent patrols on foot, in vehicles and electronically. The department maintains professional development and training of security
personnel to enhance or increase skill levels. Additionally, Security collaborates with local law
enforcement agencies and community entities to provide enhanced services to the customers, employees, and contractors. In addition, this department maintains the access control components for all
facilities.
FY 2018 Accomplishments
Conducted six (6) active shooter classes at the Staples Street Center for CCRTA employees and
tenants;
Held two (2) fire drills at Staples Street Center – evacuation was successful, everyone evacuated
in less than 5 minutes;
Hosted the Texas Transportation Safety and Security Professional Association quarterly meeting;
Enhanced security coverage at Staples Street Center – increased officer visibility during peak
business hours
Installed access control on the East and West doors at the Staples Street Center to allow for
employee and tenant use only (South doors are utilized as the public access entrance);
Developed SMS (Safety Management System) Plan which was adopted by CCRTA Board of
Directors;
Improved perimeter security at Bear Lane Operations Facility – i.e. vehicle long-range access
control;
Provided police officer training in the Spring covering active shooter; the escalation; and
customer service;
Provided police officer training in the Fall covering reporting CCRTA stats; crisis intervention;
communicating police professionalism;
Director of Safety and Security attended conference in Washington DC covering Safety
Management Systems (SMS)
FY 2019 Planned Initiatives
Initiate and execute the SMS Plan;
Strengthen the Safety culture within the Agency;
Elevate communication channels between tenants and the Safety and Security Department;
Conduct fire drills at CCRTA Operations Facility at Bear Lane.
Budgetary Changes
8.29% increase in Services due to the managing of the upcoming year.
80.38% decrease in Materials & Supplies due to adjustments in contracted maintenance.
38.31% decrease in Miscellaneous due the readjusting of other miscellaneous expenses.

115
SAFETY & SECURITY DEPARTMENT # 52
-
Back to Table of Contents
FUND01 FUND
LINE ITEMSBUDGET
2018
ESTIMATED
2018
PROPOSED
2019
$
CHANGE
%
CHANGE50102010 SALARIES AND WAGES - OTHER $154,616 $155,448 $163,235 $8,619 5.57%
50201010 MEDICARE $2,242 $2,226 $2,367 $125 5.57%
50205010 LIFE INSURANCE $410 $479 $509 $99 24.10%
50206010 DISABILITY INSURANCE $1,051 $882 $1,559 $508 48.29%
50214310 INCENTIVE AWARDS $0 $1,200 $1,200 $1,200 100.00%
SALARIES AND BENEFITS TOTAL $158,319 $160,235 $168,869 $10,550 6.66%
50324010 LEGAL FEES $0 $0 $5,000 $5,000 100.00%
50329910 OTHER PROFESSIONAL SERV $7,661 $8,357 $0 ($7,661) -100.00%
50346010 CONTRACTED MAINTENANCE $82,103 $5,090 $33,061 ($49,042) -59.73%
50346210 CONTRACTED BLDG MAINT $3,615 $3,944 $0 ($3,615) -100.00%
50360010 SECURITY SERVICE $593,398 $525,619 $705,630 $112,232 18.91%
SERVICES TOTAL $686,777 $543,011 $743,691 $56,914 8.29%
50491110 OFFICE SUPPLIES $500 $305 $200 ($300) -60.00%
50491210 POSTAGE AND EXPRESS $60 $0 $300 $240 400.00%
50491310 MINOR TOOLS AND EQUIPMENT $933 $0 $0 ($933) -100.00%
50491410 MINOR OFFICE EQUIPMENT $1,056 $1,480 $0 ($1,056) -100.00%
MATERIALS AND SUPPLIES TOTAL $2,549 $1,784 $500 ($2,049) -80.38%
50502010 TELECOMMUNICATIONS $4,500 $2,404 $1,200 ($3,300) -73.33%
UTILITIES TOTAL $4,500 $2,404 $1,200 ($3,300) -73.33%
50603010 PROPERTY AND LIABILITY
INSURANCE
$401,705 $391,279 $441,273 $39,568 9.85%
INSURANCE TOTAL $401,705 $391,279 $441,273 $39,568 9.85%
50901010 DUES AND SUBSCRIPTIONS $894 $0 $894 $0 0.00%
50902110 TRAVEL, TRAINING AND MTNGS $4,700 $2,481 $4,700 $0 0.00%
50909910 OTHER MISCELLANEOUS EXP. $3,474 $242 $0 ($3,474) -100.00%
MISCELLANEOUS TOTAL $9,068 $2,723 $5,594 ($3,474) -38.31%
52 TOTAL $1,262,918 $1,101,436 $1,361,127 $98,209 7.78%
CORPUS CHRISTI RTA
DEPARTMENT DIVISION52 SECURITY 52 SECURITY
LINE ITEM DETAIL
CHANGES FY 2019
0.000 1.000
0.000 1.000
0.000 2.000
1.000
SAFETY COORDINATOR 1.000
TOTAL FTEs 2.000
PERSONNEL SCHEDULE
POSITION TITLE FY 2018
DIRECTOR OF SAFETY & SECURITY

116
DEBT SERVICE DEPARTMENT # 65
-
Back to Table of Contents
This department is used to account for the interest portion of the annual debt servicing requirements.
On November 20, 2013, the Authority issued its first debt instrument in the form of revenue bonds totaling
$22,025,000. The bonds were secured for the purpose of financing the construction of the new Staples Street Center and the Staples Street Transfer Station. The debt consists of two issues; one for
$11,525,000 tax exempt bonds and the other for $10,500,000 for taxable bonds with an interest rate that
resets periodically during the life of the bonds. The 25-year bonds are first lien revenue bonds, and will be repaid semi-annually from the pledged operating revenues of the Authority. The Agency began repaying the
debt in 2014. The first optional call date for these bonds is December 1, 2013. A combined amortization schedule is being provided on the next page. There are no current plans to issue any additional debt in the
future.
The Authority has no policy for debt, but may issue debt subject to referendum in accordance with guidelines
established by statute. There are no statutory limits to the amount of debt the Authority may undertake however; the debt service must be affordable and sustainable. To ensure the Agency has sufficient funds to
meet obligations, financial policies have been established to provide the framework to operate responsibly and
measure fiscal performance. As part of our risk assessment each month the fund balance on hand is compared to the computation reserve requirements. In addition the revenue coverage ratio is also computed which
measures the cash available from operating revenues to the current debt obligation of interest and principal payments. A ratio greater than 1 means there is sufficient funds to cover annual debt payments ad you can
see from the table below.
Revenue Recovery Ratio

117
DEBT SERVICE DEPARTMENT # 65
-
Back to Table of Contents
118
STAPLES STREET CENTER DEPARTMENT # 77
-
Back to Table of Contents
Functions and Responsibilities The construction of this new facility was completed in May 2016. This department will be used to record the costs for operating and managing this building. This budget includes the staffing, security, maintenance, and all other costs necessary to efficiently operate and manage the property.
FY 2018 Accomplishments
Enhance Awareness of the Value of the Transportation System in Community
o Completed the construction on the last available lease space. Coordination of move in from the new tenant, Texas General Land Office (GLO).
Completed the Leopard at Artesian parking lot improvement for the Texas GLO. o Continued to monitor existing leases, to maintain required ROI, and achieve the projected
occupancy rate to meet the anticipated cash flow projections.
o Enhanced the security features at the Staples Street Center by: Installed card reader access for the East and West doors to be used by tenants and employees
only.
Public entrance now only allowed at the Southside entrance doors.
Security guards are outside in parking lots during busiest times of day to provide added safety
oversight, for visitors, tenants and employees.
FY 2019 Planned Initiatives
Enhanced the Safety/Security of the Staples Street Center
o Enhance the security features at the Staples Street Center by:
Installation of a metal detection system at the Southside entrance doors. Addition of two new security guards to the building.
Installation of card reader access to restrooms on the all floors. Enhance the Security Officers awareness of visitors in the building, through visitor check-
ins.
Budgetary Changes
55.92% increase in Services due to increases in safety and security of the facility. 15.62% decrease in Materials & Supplies due to adjustments in building maintenance
materials, janitorial supplies and uniforms.
14.81% increase in Insurance due increases in property & Liability rates.

119
STAPLES STREET CENTER DEPARTMENT # 77
-
Back to Table of Contents
CHANGES FY 2019
0.000 3.000
0.000 1.000
0.000 0.700
0.000 1.000
0.000 5.700
PERSONNEL SCHEDULE
POSITION TITLE FY 2018
CUSTODIAN 3.000
MAINT TECH II 1.000
RECEPTIONIST 0.700
SR ADMIN ASST 1.000
TOTAL FTEs 5.700
FUND01 FUND
LINE ITEMSBUDGET
2018
ESTIMATED
2018
PROPOSED
2019
$
CHANGE
%
CHANGE50102010 SALARIES AND WAGES - OTHER $131,911 $140,590 $166,336 $34,425 26.10%
50103010 OVERTIME - OTHER $1,300 $4,703 $3,486 $2,186 168.15%
50201010 MEDICARE $2,416 $2,038 $2,461 $45 1.86%
50205010 LIFE INSURANCE $888 $1,135 $1,450 $562 63.26%
50206010 DISABILITY INSURANCE $797 $1,124 $900 $103 12.98%
50213010 UNIFORM AND TOOL ALLOWANCE $0 $0 $800 $800 0.00%
50214110 TUITION REIMBURSEMENT $0 $0 $3,500 $3,500 100.00%
50214210 WORKERS COMPENSATION $929 $0 $1,000 $71 0.00%
50214310 INCENTIVE AWARDS $0 $1,298 $600 $600 100.00%
SALARIES AND BENEFITS TOTAL $138,241 $150,888 $180,533 $42,292 30.59%
50329910 OTHER PROFESSIONAL SERV $18,586 $19,574 $20,448 $1,862 10.02%
50344010 REFUSE REMOVAL $6,246 $3,489 $5,258 ($988) -15.82%
50346010 CONTRACTED MAINTENANCE $0 $22,248 $3,700 $3,700 100.00%
50346210 CONTRACTED BLDG MAINT $45,000 $49,627 $28,100 ($16,900) -37.56%
50350010 CUSTODIAL SERVICE $0 $0 $43,200 $43,200 100.00%
50360010 SECURITY SERVICE $194,915 $179,373 $312,084 $117,169 60.11%
SERVICES TOTAL $264,747 $274,312 $412,790 $148,043 55.92%
50490310 BUILDING MAINT MATERIALS $21,000 $20,077 $16,000 ($5,000) -23.81%
50490710 JANITORIAL SUPPLIES $30,000 $4,023 $25,000 ($5,000) -16.67%
50491110 OFFICE SUPPLIES $500 $100 $500 $0 0.00%
50491310 MINOR TOOLS AND EQUIPMENT $5,000 $447 $7,000 $2,000 40.00%
50491410 MINOR OFFICE EQUIPMENT $350 $1,659 $0 ($350) -100.00%
50493010 UNIFORMS $3,000 $0 $2,000 ($1,000) -33.33%
MATERIALS AND SUPPLIES TOTAL $59,850 $26,305 $50,500 ($9,350) -15.62%
50502110 ELECTRICITY $150,000 $103,675 $140,000 ($10,000) -6.67%
50502210 WATER AND GAS $35,000 $32,625 $22,500 ($12,500) -35.71%
UTILITIES TOTAL $185,000 $136,300 $162,500 ($22,500) -12.16%
50603010 PROPERTY AND LIABILITY
INSURANCE
$156,777 $89,639 $180,000 $23,223 14.81%
INSURANCE TOTAL $156,777 $89,639 $180,000 $23,223 14.81%
51201010 LEASES AND RENTALS $500 $525 $0 ($500) -100.00%
LEASES AND RENTALS TOTAL $500 $525 $0 ($500) -100.00%
77 TOTAL $805,115 $541,669 $986,323 $181,208 22.51%
CORPUS CHRISTI RTA
DEPARTMENT DIVISION77 STAPLES STREET CENTER 77 STAPLES STREET CENTER
LINE ITEM DETAIL

120
PORT AYERS COST CENTER DEPARTMENT # 78
-
Back to Table of Contents
Functions and Responsibilities
This department will be used to record the costs for operating and managing the Port Ayers station. This budget includes the rental fees for the building located on the property as well as the demolition of the building. The budget also includes the renovation of the Transfer station.
FY 2018 Accomplishments
Kleberg Bank paid rental fees on the building for the full year. Inspections of the building of taken place to identify what is to be disposed of and what is to be salvaged.
FY 2019 Planned Initiatives
Demolition the Kleberg Bank building during 2019. Award a contract for the design of the Master Plan for Port Ayers Transfer Station Renovation.
Budgetary Changes
55.92% increase in Services due to increases in safety and security of the facility.
15.62% decrease in Materials & Supplies due to adjustments in building maintenance materials,
janitorial supplies and uniforms.
4.81% increase in Insurance due increases in property & Liability rates.
FUND01 FUND
LINE ITEMSBUDGET
2018
ESTIMATED
2018
PROPOSED
2019
$
CHANGE
%
CHANGE50329910 OTHER PROFESSIONAL SERV $0 $0 $300,000 $300,000 100.00%
50346010 CONTRACTED MAINTENANCE $0 $0 $2,640 $2,640 100.00%
SERVICES TOTAL $0 $0 $302,640 $302,640 100.00%
50499910 OTHER MATERIALS AND SUPPL $50,000 $50,000 $0 ($50,000) -100.00%
MATERIALS AND SUPPLIES TOTAL $50,000 $50,000 $0 ($50,000) -100.00%
50502110 ELECTRICITY $0 $0 $12,000 $12,000 100.00%
50502210 WATER AND GAS $0 $0 $4,800 $4,800 100.00%
UTILITIES TOTAL $0 $0 $16,800 $16,800 100.00%
50603010 PROPERTY AND LIABILITY
INSURANCE
$0 $0 $25,000 $25,000 100.00%
INSURANCE TOTAL $0 $0 $25,000 $25,000 100.00%
78 TOTAL $50,000 $50,000 $344,440 $294,440 588.88%
CORPUS CHRISTI RTA
DEPARTMENT DIVISION78 PORT AYERS COST CENTER 78 PORT AYERS COST CENTER
LINE ITEM DETAIL

121
SPECIAL PROJECTS / SUB-RECIPIENT GRANT AGREEMENTS DEPARTMENT # 83 / 85
-
Back to Table of Contents
The CCRTA undertakes diverse range of special projects every year. The goal of this department is
to support unanticipated endeavors that may arise during the year.
Sub-Recipient Grant Agreements – Department #85 This department is used to record eligible reimbursements made to sub-recipients from Section 5310 federal grant funds. The FY 2019 budget of $745,864 represents the available funding to sub-recipients for eligible
project expenses. Five (5) sub-recipients were awarded federal funds for capital projects associated with
mobility services to seniors and people with disabilities. FY 2018 there was $271,945 in sub-recipients funding. CCRTA is the designated recipient of the federal grant funds and is responsible for the management
and administration of the grants. There is no financial impact to the budget as grant revenues will equal to the amount of reimbursements charged to this department.
Expense Category 2017 Actual 2018 2018 2019 $
Audited Budget Estimate Proposed Change % Change Salaries & Benefits $ - $ - $ - $ - $ - 0.00% Services $ 99,479 $ 271,945 $ 41,547 $ 745,864 $ 473,919 174.27% Materials & Supplies $ - $ - $ - $ - $ - 0.00% Utilities $ - $ - $ - $ - $ - 0.00% Insurance $ - $ - $ - $ - $ - 0.00% Purchased Transportation $ - $ - $ - $ - $ - 0.00% Miscellaneous $ - $ - $ - $ - $ - 0.00% Debt Service $ - $ - $ - $ - $ - 0.00% Depreciation $ - $ - $ - $ - $ - 0.00% Transfer to Other Funds $ - $ - $ - $ - $ - 0.00% Leases & Rentals $ - $ - $ - $ - $ - 0.00% Total Expenditures $ 99,479 $ 271,945 $ 41,547 $ 745,864 $ 473,919 174,27%
FUND01 FUND
LINE ITEMSBUDGET
2018
ESTIMATED
2018
PROPOSED
2019
$
CHANGE
%
CHANGE50102010 SALARIES AND WAGES - OTHER $0 $0 $300,000 $300,000 100.00%
SALARIES AND BENEFITS TOTAL $0 $0 $300,000 $300,000 100.00%
50329910 OTHER PROFESSIONAL SERV $0 $0 $45,000 $45,000 100.00%
50379910 OTHER SERVICES $0 $0 $200,000 $200,000 100.00%
SERVICES TOTAL $0 $0 $245,000 $0 100.00%
83 TOTAL $0 $0 $545,000 $545,000 100.00%
CORPUS CHRISTI RTA
DEPARTMENT DIVISION83 SPECIAL PROJECTS 83 SPECIAL PROJECTS
LINE ITEM DETAIL

122
STREET MAINTENANCE / DEPRECIATION DEPARTMENT # 88 / 90
-
Back to Table of Contents
Streets Maintenance – Department #88
In 1985, CCRTA initiated the Street Improvement Program for the purpose of assisting participating members in funding rehabilitating project costs of streets within its service region. These projects represent a major investment in enhancing mobility, reducing congestion and improving the overall service area. The streets are not the property of CCRTA and, thus, the expenditures are reported as non-operating expenses in the Agency’s financial statements. The level of funding is determined annually based on several factors. Each year allocations are calculated using a formula that is sales tax driven but employs multiple factors in its computations to ensure the equitable distribution of
funds. Accordingly, the allocation methodology utilizes two safeguards. First a fixed baseline is established to protect cities with a small tax base. Secondly, a maximum level of funding is established to protect CCRTA from sales tax decreases. Although the allocation formula is indexed, these cities will remain at the fixed allocation level unless the total CCRTA sales tax receipts decreases, allowing all members to share on a pro-rata basis the decreases in sales tax receipts as well. Six of the nine participants have a small tax base while the cities highlighted in the budget below identify the larger cities. This department records distributions to regional entities for street repairs in accordance with the terms of the respective inter-local agreements
Depreciation – Department #90 This department is used to capture the annual depreciation expense of qualified capital assets. These assets are recorded at cost and are depreciated over their useful lives using the straight-line method in accordance to the depreciation policy. Expense Category 2017 Actual 2018 2018 2019 $
Audited Budget Estimate Proposed Change % Change Salaries & Benefits $ - $ - $ - $ - $ - 0.00% Services $ - $ - $ - $ - $ - 0.00% Materials & Supplies $ - $ - $ - $ - $ - 0.00% Utilities $ - $ - $ - $ - $ - 0.00% Insurance $ - $ - $ - $ - $ - 0.00% Purchased Transportation $ - $ - $ - $ - $ - 0.00% Miscellaneous $ - $ - $ - $ - $ - 0.00% Debt Service $ - $ - $ - $ - $ - 0.00% Depreciation $ 4,249,998 $ 4,398,419 $ 4,373,291 $ 4,287,705 $ (110,714) - 2.52% Transfer to Other Funds $ - $ - $ - $ - $ - 0.00% Leases & Rentals $ - $ - $ - $ - $ - 0.00% Total Expenditures $ 4,249,998 $ 4,398,419 $ 4,373,291 $ 4,287,705 $ (110,714) -2.52%
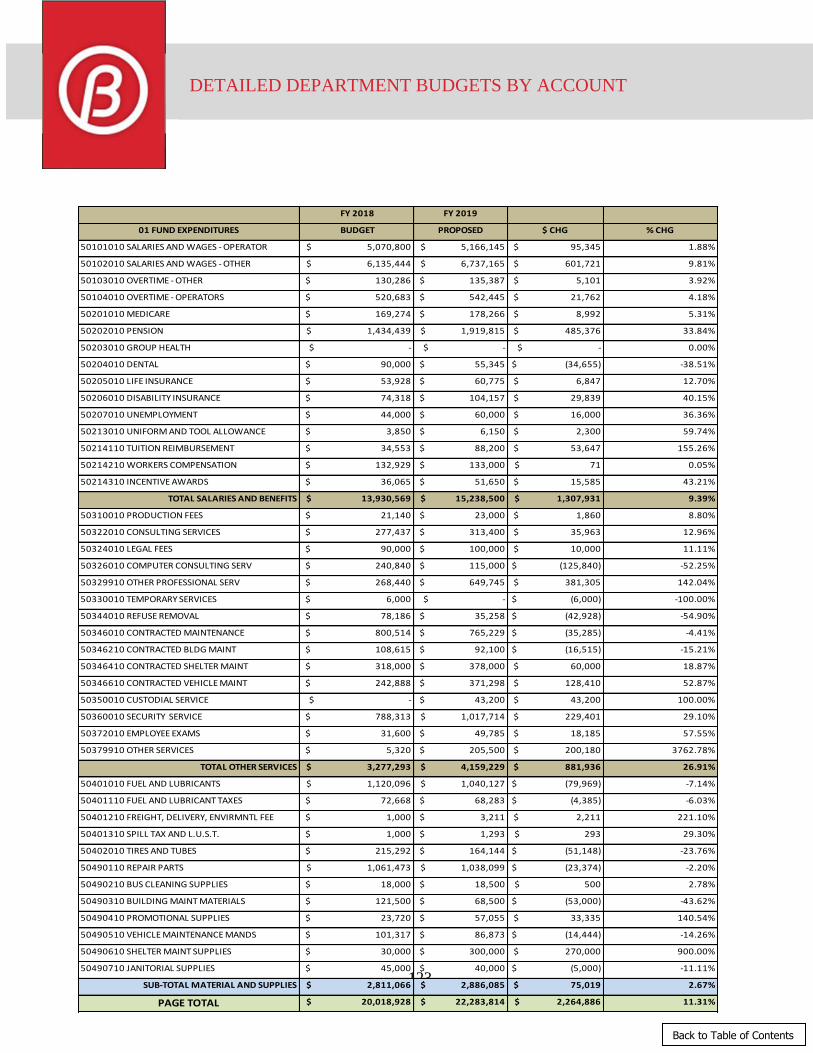
123
DETAILED DEPARTMENT BUDGETS BY ACCOUNT
-
Back to Table of Contents
FY 2018 FY 2019
01 FUND EXPENDITURES BUDGET PROPOSED $ CHG % CHG
50101010 SALARIES AND WAGES - OPERATOR $ 5,070,800 $ 5,166,145 $ 95,345 1.88%
50102010 SALARIES AND WAGES - OTHER $ 6,135,444 $ 6,737,165 $ 601,721 9.81%
50103010 OVERTIME - OTHER $ 130,286 $ 135,387 $ 5,101 3.92%
50104010 OVERTIME - OPERATORS $ 520,683 $ 542,445 $ 21,762 4.18%
50201010 MEDICARE $ 169,274 $ 178,266 $ 8,992 5.31%
50202010 PENSION $ 1,434,439 $ 1,919,815 $ 485,376 33.84%
50203010 GROUP HEALTH $ - $ - $ - 0.00%
50204010 DENTAL $ 90,000 $ 55,345 $ (34,655) -38.51%
50205010 LIFE INSURANCE $ 53,928 $ 60,775 $ 6,847 12.70%
50206010 DISABILITY INSURANCE $ 74,318 $ 104,157 $ 29,839 40.15%
50207010 UNEMPLOYMENT $ 44,000 $ 60,000 $ 16,000 36.36%
50213010 UNIFORM AND TOOL ALLOWANCE $ 3,850 $ 6,150 $ 2,300 59.74%
50214110 TUITION REIMBURSEMENT $ 34,553 $ 88,200 $ 53,647 155.26%
50214210 WORKERS COMPENSATION $ 132,929 $ 133,000 $ 71 0.05%
50214310 INCENTIVE AWARDS $ 36,065 $ 51,650 $ 15,585 43.21%
TOTAL SALARIES AND BENEFITS $ 13,930,569 $ 15,238,500 $ 1,307,931 9.39%
50310010 PRODUCTION FEES $ 21,140 $ 23,000 $ 1,860 8.80%
50322010 CONSULTING SERVICES $ 277,437 $ 313,400 $ 35,963 12.96%
50324010 LEGAL FEES $ 90,000 $ 100,000 $ 10,000 11.11%
50326010 COMPUTER CONSULTING SERV $ 240,840 $ 115,000 $ (125,840) -52.25%
50329910 OTHER PROFESSIONAL SERV $ 268,440 $ 649,745 $ 381,305 142.04%
50330010 TEMPORARY SERVICES $ 6,000 $ - $ (6,000) -100.00%
50344010 REFUSE REMOVAL $ 78,186 $ 35,258 $ (42,928) -54.90%
50346010 CONTRACTED MAINTENANCE $ 800,514 $ 765,229 $ (35,285) -4.41%
50346210 CONTRACTED BLDG MAINT $ 108,615 $ 92,100 $ (16,515) -15.21%
50346410 CONTRACTED SHELTER MAINT $ 318,000 $ 378,000 $ 60,000 18.87%
50346610 CONTRACTED VEHICLE MAINT $ 242,888 $ 371,298 $ 128,410 52.87%
50350010 CUSTODIAL SERVICE $ - $ 43,200 $ 43,200 100.00%
50360010 SECURITY SERVICE $ 788,313 $ 1,017,714 $ 229,401 29.10%
50372010 EMPLOYEE EXAMS $ 31,600 $ 49,785 $ 18,185 57.55%
50379910 OTHER SERVICES $ 5,320 $ 205,500 $ 200,180 3762.78%
TOTAL OTHER SERVICES $ 3,277,293 $ 4,159,229 $ 881,936 26.91%
50401010 FUEL AND LUBRICANTS $ 1,120,096 $ 1,040,127 $ (79,969) -7.14%
50401110 FUEL AND LUBRICANT TAXES $ 72,668 $ 68,283 $ (4,385) -6.03%
50401210 FREIGHT, DELIVERY, ENVIRMNTL FEE $ 1,000 $ 3,211 $ 2,211 221.10%
50401310 SPILL TAX AND L.U.S.T. $ 1,000 $ 1,293 $ 293 29.30%
50402010 TIRES AND TUBES $ 215,292 $ 164,144 $ (51,148) -23.76%
50490110 REPAIR PARTS $ 1,061,473 $ 1,038,099 $ (23,374) -2.20%
50490210 BUS CLEANING SUPPLIES $ 18,000 $ 18,500 $ 500 2.78%
50490310 BUILDING MAINT MATERIALS $ 121,500 $ 68,500 $ (53,000) -43.62%
50490410 PROMOTIONAL SUPPLIES $ 23,720 $ 57,055 $ 33,335 140.54%
50490510 VEHICLE MAINTENANCE MANDS $ 101,317 $ 86,873 $ (14,444) -14.26%
50490610 SHELTER MAINT SUPPLIES $ 30,000 $ 300,000 $ 270,000 900.00%
50490710 JANITORIAL SUPPLIES $ 45,000 $ 40,000 $ (5,000) -11.11%
SUB-TOTAL MATERIAL AND SUPPLIES $ 2,811,066 $ 2,886,085 $ 75,019 2.67%
PAGE TOTAL $ 20,018,928 $ 22,283,814 $ 2,264,886 11.31%

124
DETAILED DEPARTMENT BUDGETS BY ACCOUNT
-
Back to Table of Contents
FY 2018 FY 2019
01 FUND EXPENDITURES BUDGET PROPOSED $ CHG % CHG
SUB-TOTAL MATERIAL AND SUPPLIES $ 2,811,066 $ 2,886,085 $ 75,019 2.67%
50491110 OFFICE SUPPLIES $ 37,825 $ 41,411 $ 3,586 9.48%
50491210 POSTAGE AND EXPRESS $ 28,026 $ 20,906 $ (7,120) -25.40%
50491310 MINOR TOOLS AND EQUIPMENT $ 34,433 $ 22,500 $ (11,933) -34.66%
50491410 MINOR OFFICE EQUIPMENT $ 32,906 $ 13,500 $ (19,406) -58.97%
50492010 PRINTING $ 118,321 $ 123,897 $ 5,576 4.71%
50493010 UNIFORMS $ 136,725 $ 115,550 $ (21,175) -15.49%
50494010 EMERGENCY DISASTER $ - $ 6,000 $ 6,000 100.00%
50499910 OTHER MATERIALS AND SUPPL $ 65,500 $ 16,553 $ (48,947) -74.73%
TOTAL MATERIAL AND SUPPLIES $ 3,264,802 $ 31,302,386 $ 28,037,584 858.78%
50502010 TELECOMMUNICATIONS $ 214,884 $ 204,259 $ (10,625) -4.94%
50502110 ELECTRICITY $ 505,230 $ 427,552 $ (77,678) -15.37%
50502210 WATER AND GAS $ 75,000 $ 72,300 $ (2,700) -3.60%
TOTAL UTILITIES $ 795,114 $ 704,111 $ (91,003) -11.45%
50603010 PROPERTY AND LIABILITY INSURANCE $ 558,482 $ 646,273 $ 87,791 15.72%
50610010 HEALTH CARE SELF INSURANCE $ 2,600,000 $ 3,607,969 $ 1,007,969 38.77%
TOTAL INSURANCE $ 3,158,482 $ 4,254,242 $ 1,095,760 34.69%
50801010 REAL $ 59,916 $ 45,787 $ (14,129) -23.58%
50802010 CONTRACT FIXED ROUTE $ 685,986 $ 1,672,992 $ 987,006 143.88%
50803310 HARBOR FERRY SERVICE $ 6,324 $ 6,324 $ - 0.00%
50803410 ROBSTOWN #34 $ 213,253 $ 231,364 $ 18,111 8.49%
50803510 PORT A PILOT $ 145,000 $ 145,000 $ - 0.00%
50803610 TEXAS A&M WAVE $ 249,010 $ 286,806 $ 37,796 15.18%
50803810 PURCHASED FIXED ROUTE FUEL $ 25,825 $ - $ (25,825) -100.00%
50803910 B-LINE FUEL $ 219,637 $ - $ (219,637) -100.00%
50804010 B-LINE SERVICE $ 3,770,658 $ 3,670,658 $ (100,000) 0.00%
50805010 PORT ARANSAS FLEXI-B $ 97,051 $ 111,682 $ 14,631 15.08%
50805110 PORT ARANSAS TROLLEY SERVICE $ 110,225 $ 122,675 $ 12,450 11.30%
50807010 RURAL - ROUTE 67 $ 72,775 $ 72,775 $ - 0.00%
50808010 PT/VANPOOL $ 98,379 $ 98,379 $ - 0.00%
TOTAL PURCHASED TRANSPORTATON $ 5,754,039 $ 6,464,442 $ 710,403 12.35%
50901010 DUES AND SUBSCRIPTIONS $ 82,191 $ 94,968 $ 12,777 15.55%
50902110 TRAVEL, TRAINING AND MTNGS $ 178,220 $ 291,740 $ 113,520 63.70%
50905010 INTERGOVERNMENTAL EXPENSE $ 271,945 $ 745,864 $ 473,919 174.27%
50908010 ADVERT/PROMO MEDIA EXP. $ 106,000 $ 132,800 $ 26,800 25.28%
50909510 COMMUNITY SERVICES $ 27,250 $ 59,000 $ 31,750 116.51%
50909910 OTHER MISCELLANEOUS EXP. $ 14,639 $ 13,402 $ (1,237) -8.45%
TOTAL OTHER MISCELLANEOUS $ 680,245 $ 1,337,774 $ 657,529 96.66%
51102010 INTEREST EXPENSE $ 1,604,908 $ 1,604,770 $ (138) -0.01%
51201010 LEASES AND RENTALS $ 36,934 $ 50,594 $ 13,660 36.98%
TOTAL INTEREST EXPENSE AND LEASES & RENTALS $ 1,641,842 $ 1,655,364 $ 13,522 0.82%
60230110 DEPRECIATION EXPENSE $ 4,398,419 $ 4,287,705 $ (110,715) -2.52%
60355510 STREET IMPROVEMENT PROGRAM $ 2,828,222 $ 3,006,967 $ 178,745 6.32%
TOTAL DEPRECIATION, STREET MAINTENANCE &
CAPITAL
$ 7,226,641 $ 7,294,671 $ 68,030 0.94%
PLUS FIRST PAGE TOTAL $ 20,018,928 $ 22,283,814 $ 2,264,886 11.31%
TOTAL 01 FUND EXPENDITURES $ 39,729,028 $ 44,354,735 $ 4,625,709 11.64%

GLOSSARY
125
Accessible – As defined by FTA, a site, building facility, or portion thereof that complies with defined standards and that can be approached, entered, and used by persons with disabilities.
Accessible Service – A term used to describe service that is accessible to non-ambulatory riders with disabilities. This includes fixed-route bus service with wheelchair lifts or paratransit service with wheelchair lift-equipped vehicles.
Accidents per 100,000 Miles – Measures vehicle accidents reported (Bus and Paratransit) per 100,000 miles of actual fixed-route mileage. Management’s objective is to reduce this ratio.
Calculation = [(Vehicle Accidents/Actual Mileage) * 100,000]
Accounting Basis - CCRTA uses the accounting principles and methods appropriate for a government enterprise fund. Financial statements are prepared on the accrual basis of accounting under which revenues and expenses are recognized when earned or incurred.
Accrual Method of Accounting - An accounting method that measures the performance and position of a company by recognizing economic events in the period they occur regardless of when cash transactions occur (i.e., recognize revenue in the period in which it is earned rather than when the cash is received; and recognize expenses when incurred rather than when cash is paid).
ADA (The Americans with Disabilities Act of 1990) - This federal act requires changes to transit vehicles, operations, and facilities to ensure that people with disabilities have access to jobs, public accommodations, telecommunications, and public services, including public transit.
ADA Paratransit Service – This is a non-fixed-route paratransit service utilizing vans and small buses to provide pre-arranged trips to and from specific locations within the service area to certified participants in the program.
Ambulatory Disabled – A person with a disability that does not require the use of a wheelchair or have a visual or
hearing impairment.
American Public Transit Association (APTA) - Membership organization whose stated mission is to serve and lead its diverse membership through advocacy, innovation, and information sharing to strengthen and expand public transportation.
American Recovery and Reinvestment Act (ARRA) – The American Recovery and Reinvestment Act were signed into law by President Barack Obama on February 17, 2009. ARRA included appropriations and tax law changes totaling approximately $787 billion to support government-wide efforts to stimulate the economy. Goals of the statute include the preservation or creation of jobs and the promotion of an economic recovery, as well as the investment in transportation, environmental protection, and other infrastructure providing long-term economic benefits.
Arbitrage – Investment earnings representing the difference between interest paid on bonds and the interest earned on the investment made using bond proceeds.
Associated Capital Maintenance (ACM) – This is a Federal Transit Administration capital program that subsidizes
the cost of operations through the funding of certain bus and rail maintenance expenses.
Average Fare – Represents the average fare paid per passenger boarding on each mode of service during the
period.
Calculation = (Modal Passenger Revenue – Commissions & Discounts) / (Modal Passenger Boardings)

GLOSSARY
126
Average Weekday Ridership – The average number of passenger boardings (or HOV users) on a weekday. This measurement does not include ridership on Saturdays, Sundays, or holidays.
Balanced Budget – This is a budget in which projected revenues equal projected expenses during a fiscal period.
Boardings - Number of passengers utilizing transit service, measured on entrance of vehicle. Capital – Funds that finance construction, renovation, and major repair projects or the purchase of machinery, equipment, buildings, and land.
Capital budget - The portion of the budget that provides for the funding of construction, improvements, projects, and major equipment purchases. Generally, a capital item is one that has a cost in excess of $5,000, and a useful life of at least two years.
Capital Expenditure - Expenditures made to purchase capital assets or increase the efficiency, capacity, useful life, or economy of an existing asset.
Major Capital Transit Investment Program – A federal grants program providing capital assistance for new
fixed guideway, extensions of existing fixed guideway, or a corridor-based bus rapid transit system. This program includes New Starts, Small Starts, and Core Capacity projects.
Car Mile or Vehicle Mile – A single bus, traveling one mile.
CAFR (Comprehensive Annual Financial Report) - A Comprehensive Annual Financial Report is a set of U.S. government financial statements comprising the financial report of a state, municipal or other governmental entity that complies with the accounting requirements promulgated by the Governmental Accounting Standards Board (GASB).
Certified Riders – Certified riders are passengers who have been deemed eligible for Paratransit services because their disability prevents them from functionally accessing fixed route services. Eligibility is determined in accordance with the criteria outlined in the Americans with Disabilities Act of 1990.
Complaints Per 100,000 Passengers – This is a modal quality ratio that measures the number of service complaints per 100,000 passenger boardings (or per 1,000 boards for Paratransit). Management’s objective is to reduce this ratio.
Calculation = [(Service Complaints Received / Modal Passenger Boardings) * 100,000]
Cost per Revenue Mile – Efficiency ratio that measures the cost of providing a revenue mile of service. This measurement is based on fully loaded costs and excludes operating revenues. Management’s objective is to reduce this ratio.
Calculation = [Total Operating Expenses / Revenue Miles]
Deadhead - Hours or miles that the buses are in service, but there is not a reasonable expectation of carrying
passengers. Examples include traveling between routes, between the garage and the start of a route.
Debt Service – The payment of interest and the repayment of principal on long-term borrowed funds according to a predetermined schedule.
GLOSSARY
127
Demand Response - Paratransit passengers call to request service; therefore, that service is provided on demand, and is considered to be demand responsive, rather than scheduled This service is outsourced and all operating costs are reported separately in the Purchased Transportation Department.
Depreciation – This refers to the allocation of the cost of assets to periods in which the assets are used. The cost is
allocated as an expense that affects the net income. The process is used to portion the cost over the life of the assets to account for wear and tear, deterioration, action of the physical elements, inadequacy, and obsolescence.
Directly Operated Motor Bus - Scheduled bus service that is provided directly by CCRTA.
Enterprise Fund – This type of fund establishes a separate accounting and financial reporting mechanism for services for which a fee is charged. Revenues and expenses from these services are segregated into a fund with financial statements separate from all other activities.
Equity - Captures the aggregate of accumulated revenues and expenses from previous years and is reflected on the Statement of Net Assets or Balance Sheet in and organization’s financial statements under the caption of “Net
Assets.”
Fare box Recover Ratio – The fare box recover ratio of a passenger transportation system is the portion of operating costs that are covered by the fares paid by passengers.
Calculation = [Modal Fare box Revenue / Modal Operating Expense]
Fare box Revenue – All revenue from the sale of passenger tickets, passes, or other instruments of fare payment.
Fare Revenue Per Passenger - This calculation provides the ratio of total fare box revenues to the total number of passengers during the same period. Good indicator of revenue efficiency. Higher numbers indicate better performance.
Fares – The amount charged to passengers for use of various transportation services.
FTA (Federal Transit Administration) – The FTA is the federal agency that helps cities and communities provide mobility to their citizens. Through its grant programs, FTA provides financial and planning assistance to help plan, build, and operate bus, rail, and paratransit systems.
Fiscal year - A fiscal year is a 12-month period for which an organization plans the use of its funds, which does not necessarily correspond to a calendar year. The fiscal year adopted by CCRTA is on a calendar basis January 1 through December 31.
Fixed Route Service - This is a type of service that operates according to fixed schedules and routes; for CCRTA that is local bus service with fixed intervals and travel paths.
Full-time equivalent (FTE): This represents a measurement equal to one staff person working a full-time work
schedule for one year based on 2,080 work hours per year.
Fund Balance – This is the difference between a fund’s assets and liabilities which is also referred to as Fund Equity. Often this term refers to moneys set aside or earmarked for future needs. CCRTA uses “reserves” as well as
funds to ensure resources are available for anticipated and unanticipated needs.
Funding Formula – A specific formula used to determine a subsidy level.
GLOSSARY
128
GAAP - This is an acronym that stands for “Generally Accepted Accounting Principles” used in the United States of
America and recognized as the standards in the accounting profession.
GASB – This is an acronym that stands for “Governmental Accounting Standards Board” which is the source of generally accepted principals used by State and Local governments in the United States. The mission of the Governmental Accounting Standards Board is to establish and improve standards of state and local governmental accounting and financial reporting that will result in useful information for users of financial reports and guide and educate the public, including issuers, auditors, and users of those financial reports.
Grants - This is a source of revenue that is received from another governmental body such as local, federal, and state governments to provide capital or operating assistance.
Headway – The time span between service vehicles on a specific route.
High occupancy vehicle lanes (HOV) - A lane of traffic in a major roadway reserved for vehicles carrying two or
more (sometimes three or more) persons.
Investment Income - Income gained from interest on funds that have been invested. JARC (Job Access Reverse Commute)/ New Freedom – JARC is a federally funded program that provides operating and capital assistance for transportation services planned, designed, and carried out to meet the transportation needs of eligible low-income individuals and of reverse commuters regardless of income. The New Freedom program provides new public transportation services and public transportation alternatives beyond those required by the Americans with Disabilities Act (ADA).
Labor Expenditure – This refers to the cost of wages and salaries (including overtime) to employees for the performance of work.
Lift Malfunctions - The percent of times that a lift or ramp malfunctions when a person in a wheelchair boards a bus on a lift or ramp. This information indicates effectiveness and convenience of service performance for passengers in wheelchairs. Lower percentage indicates better performance.
Line Item – An appropriation that is itemized on a separate line in a budget or financial plan.
Maintenance Expenditure – This term refers to the expenditures for labor, materials, services, and equipment to repair and service transit and service vehicles and facilities.
Map-21 – The Moving Ahead for Progress in the 21st Century Act – This Act was signed into law by President Obama on July 6, 2012 to provide over $105 billion in funds for surface transportation programs in 2013 and 2014.
Mean Distance Between Service Calls – This is a quality ratio that measures the average number of miles a vehicle operates before a service call occurs. Management’s objective is to increase this ratio.
Calculation = [Total Miles Operated / Total # of Service Calls]
Miles between Road calls - This a reliability ratio that measures the total system miles to number of mechanical road calls. Management’s objective is to increase this ratio, with a higher mileage number indicating better performance.
New Starts Program – A federal program which provides funding for fixed guideway transit projects which utilize and occupy a separate right-of-way or other high occupancy vehicle. This type of funding is also referred to as discretionary federal transit funds.
Net Assets - See “Equity” above.
129
GLOSSARY
-
Back to Table of Contents
Obligation – This is the term used to refer to funds that have been obligated to a specific purpose but have not been expended. Off-Peak – Non-rush hour time periods.
On-Time Performance – This is a quality ratio that measures how often a service is on time (i.e., at a designated pick-up spot within a predetermined timeframe). The timeframe differs based on mode and frequency of service. Generally, for fixed route, on-time performance is defined as not arriving at a point early or and not leaving more than 5 minutes late. For paratransit services, it is no more than a half hour before or after a scheduled pick-up time. Management’s
objective is to increase this ratio. Calculation = [(# Scheduled Trips Sampled - # of Times Early or Late) / Total # of Scheduled Trips Sampled] Operating Budget - The planning of revenue and expenditures for a given period of time to maintain daily operations is referred to as the Operating Budget. Operating Cost Per Hour –This is a service cost efficiency ratio of total operating costs to the total number of vehicle hours operated during the same period. This does not include depreciation or the cost to fund the street improvement program. Management’s objective is to decrease this ratio. Operating Revenues – Revenues from fare box, special events service, advertising, and pass sales are included in this revenue category and does not include sales tax revenue, interest income, or gain on sale of assets. Operating Expenses – Expenses required to operate CCRTA’s revenue services and general mobility projects are included in this expense category and do not include the cost of road improvement or the staff costs for providing administrative
support services Paratransit Services: This type of service refers to the complementary transportation services for the elderly and disabled that are provided and established in accordance with ADA.
Passenger Canceled Trips Ratio – This ratio measures the percentage of times that Paratransit users cancel a scheduled a trip. Total schedule trips include actual trips made, cancellations, and no-shows. Calculation = [# of Canceled Trips / Total # of Scheduled Trips] Passenger Mile – This refers to a single passenger traveling one mile.
Passenger No-Show Ratio – This is a quality ratio for Paratransit service that measures the number of times a Paratransit user makes a reservation and does not show-up for the ride. This measurement is different from the
Passenger Cancelled Trips Ratio that requires the user to cancel a scheduled trip. Management’s objective is to reduce this number so that other trips can be scheduled in that timeframe. Users can lose the ability to access the Paratransit system if they have an excessive number of no-shows.
Calculation = [# of No-Shows / Total # of Scheduled Trips] Passengers per Hour – This is a productivity ratio that measures the ridership to the hours of service operated during the same period. Management’s objective is to increase this number. Calculation = [Actual Passenger Boardings / Revenue Hours] Passengers per Vehicle Mile: This is a productivity ratio that measures route productivity by comparing the number of passenger boardings to the number of revenue miles. Management’s objective is to increase this ratio. Calculation = [Passenger Boardings / Revenue Miles]

130
GLOSSARY
-
Back to Table of Contents
Passenger Revenue - Revenue earned through fares charged directly to passengers for transit services.
Peak Period - The period during which the maximum amount of travel occurs.
Principal – This represents the amount borrowed or the amount still owed on a loan, separate from the interest.
Purchased Transportation Demand Response - This type of service is provided on an "as-needed" basis by a vendor under contract to the Authority. Reduced Fares – Our fare structure offers a variety of discounted fares. Refer to table containing fee structure for specifics. Reserves – CCRTA uses “reserves” as well as “funds” to ensure resources are available for anticipated and unanticipated needs. This is a means used for the accumulation of cash for future purposes to cover contingencies, statutory and board requirements, Revenue Bond – This is a bond on which debt service is payable solely from a restricted revenue source.
Revenue Hours - The number of hours that the buses are available to the general public where there is a reasonable expectation of carrying passengers (this includes layover time) is referred to revenue hours. May be scheduled or actual; see revenue service below.
Revenue Miles - The number of miles that the buses are available to the general public and there is a reasonable expectation of carrying passengers is referred to as revenue miles. Revenue Passengers - Transit passengers who enter the system through the payment of a fare as distinguished from those who enter via an employee or complimentary pass is referred to as revenue passengers. Revenue Service: This is used to identify the transit service run for the purpose of generating revenue, with a route beginning and end point and is distinguished from trips run for maintenance purposes or trips which carry passengers without charge.
Ridership - The number of boardings (each time a passenger boards a bus) which measures service effectiveness and usefulness. Directly impacts budget revenues. Higher ridership indicates better service and community image. Sales Tax
- A tax levied and collected by the State. Texas has six metropolitan transit authorities (MTA’s), two City Transit
Departments (CTD’s), one County Transit Authority (CTA) and one Advanced Transit District (ATD) that imposes a sales and use tax. CCRTA is under the jurisdiction of the Corpus Christi MTA and receives monthly allocations for the ½% transit sales tax collected. Section 5307 Urbanized Area Formula (Formerly Section 9) - A Federal grant administered by the Federal Transit Administration for urbanized areas, providing capital, operating, and planning assistance for mass transportation. Funds are apportioned to urbanized areas utilizing a formula based on population, population density and other factors associated with transit service and ridership. Section 5309 Capital Program Funds - A Federal grant that provides assistance for the establishment of new rail transit projects, improvement and maintenance of existing rail transit and other fixed-guideway systems, buses and other bus-related capital projects. The bus-funding portion is a discretionary allocation program. Van Pool Program - A service provided for a group of people who live and work in close proximity to each other. This service relieves congestion, and reduces pollution.
131
GLOSSARY
-
Back to Table of Contents
Vehicle Hours - The amount of time a bus spends in operation, from the time that it leaves the Garage to the time that it returns at the end of its assignment. Measures service levels provided to community; directly impacts budgeted operating costs. Lower vehicle hour levels indicate lower service levels, but also lower expenses. Vehicle Miles - The distance a bus operates from when it leaves the Garage when it returns at the end of its assignment. Measures service levels provided to community. Vehicle miles directly impacts budgeted operating costs for example; lower vehicle hour levels indicate lower service levels, but also lower expenses.
Wheelchair Boardings - The number of times the wheelchair lift was used on buses.
Zero-based Budgeting - A method of budgeting in which all expenditures must be justified for each new budget period as opposed to only explaining the amounts requested in excess of the previous period’s funding.

132
Back to Table of Contents
SERVICE IMPROVEMENTS
-

133
Back to Table of Contents
CITY DEMOGRAPHICS AND EMPLOYEMENT STATISTICS
-