
FY 2017 - EasyJetcorporate.easyjet.com/~/media/Files/E/Easyjet/pdf/investors/... · A320 mix Lean...
46
FY 2017 Analyst & investor presentation 21 November 2017
Transcript of FY 2017 - EasyJetcorporate.easyjet.com/~/media/Files/E/Easyjet/pdf/investors/... · A320 mix Lean...

FY 2017 Analyst & investor presentation
21 November 2017

business review
Carolyn McCall- Chief Executive Officer

Proven business model in all market conditions
• Strong performance in a tough year
• £509m headline PBT (@ constant currency)
• Purposeful and disciplined growth; reinforcing our market positions
• Capacity growth of 8.5%
• Revenue and network differentiate easyJet and drive RPS
• Positive revenue trend through 2017 continuing into H1 2018
• Strong cost performance
• Headline CPS down 4.4% (@ constant currency)
• Strong balance sheet
• easyJet Europe established in July
3
3

Robust & sustainable business model
4
Winning Network Strategy
Focused on Our Customers Continuing to Innovate
Relentless Focus on Cost
Lean delivers sustainable savings*
41
4332
46
95
85
400
58
2016 2018 2011-17 2012 2013 2014 2015 2011
Committed to our People
* Financial year Lean savings in £ millions

5.7%
7.6%
8.7% 8.3%
6.9%
3.6%
4.2%
4.9%
Capacity change total SH Market Competitors on easyJet markets Capacity Change easyJet markets easyJet capacity change
H1 growth in European Short Haul market
5
2017 2017 2017 2017 2018 2018 2018 2018
H1 2018 capacity (Oct’17 – Mar’18) Capacity taken out by Ryanair & Monarch in H1
* Data from OAG – Does not include growth from Air Berlin transaction

winning network strategy
Protect the profitable core
Capture the national opportunity in France
Target investment in key cities
Purposeful investment
Disciplined use of capital
Well positioned in a dynamic market
Efficient basing
+
+
6

easyJet growth in 2018
7
c.6% easyJet capacity growth in 2018*
UK
France
Italy
Switzerland
Germany
Netherlands
1.3m 5%
0.8m 7%
0.2m 5%
(0.2)m (5%)
0.5m 6%
0.9m 9%
Spain
0.4m 5%
XXm X%
2018 growth (seats / %)
* Not including growth from Air Berlin transaction

• Allocated seat conversion +6 ppt since launch of new website
• 420k+ hands free bags sold since May 2017
• Launch of pre-order for inflight retail
• 23m app downloads
• 24% of customers using mobile boarding passes
• 15.6m personalised push notifications sent
• App opened over 600,000 times each day
• Recognising customer to tailor content and messages
• Launch of new digital interface in May 2017 driving increased conversion
PERSONALISED PRODUCT AND OFFERS
PERSONALISED BUYING EXPERIENCE
COMMERCIALISED CUSTOMER JOURNEY
• Empowering our people to better serve using digital tools and relevant data
• Access to purchase history and customer profiles
CONNECTED PEOPLE
• Worldwide
• Airtime (onboard entertainment platform) launching on select Swiss routes – Nov 30th)
DIGITAL / INFLIGHT EXPERIENCE
Driving revenue - customer & digital initiatives
8

9
Partner Extending across the travel value chain
Inflight World class retail offer with brands you love
Product*
Targeted options aligned to customer needs
Tariff A fair tariff if customer plans change and no
surprises
Ancillary revenue performance
FY14-17 (£m)
strong ancillary revenue performance
Old “non-seat” definition
Extended “ancillary revenue” definition
9
£739m £770m £837m
£986m
FY14 FY15 FY16 FY17PFY17
* Product includes but is not limited to the provision of checked baggage, allocated seating, speedy (priority) boarding services, sports equipment

Relentless focus on cost
10
CPS ex fuel target: flat 2015 vs 2019*
2015 CPS (ex Fuel @ cc)*
2019 CPS (ex Fuel @ cc)*
Lean programme offsets inflation
Efficient and effective cost base
Lean delivers sustainable savings**
41
43
32
46
95
85
58
400
2013 2012 2011 2011-17 2017 2016 2015 2014
* Flat headline cost per seat excluding fuel at constant currency, excluding hedging, from the 2015 financial year to the 2019 financial year, assuming normal levels of disruption (excludes Air Berlin transaction)
**Lean savings in £ millions

delivering operational improvements
11
Delivering step change improvements Focus on operational performance
Decreased by 238
H2 delays over 3hrs
"easyJet has been a real driving force, working with us to help create a world leading bag drop process in
North Terminal”
Stewart Wingate, CEO London Gatwick
+4.5 ppts
LGW H2 OTP
FY 2017 Cancellations
Down 3.4%
FY 2017 EU261 events
Decreased by 19%
Easyjet Europe
12
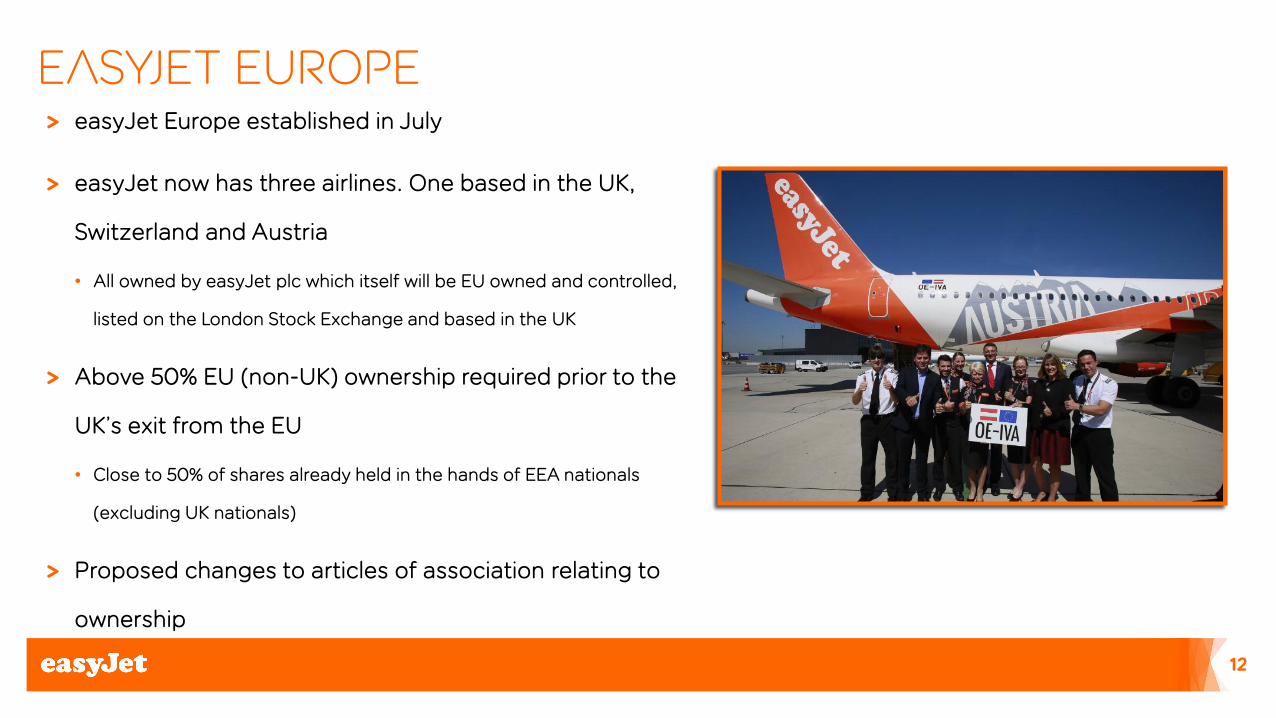
> easyJet Europe established in July
> easyJet now has three airlines. One based in the UK,
Switzerland and Austria
• All owned by easyJet plc which itself will be EU owned and controlled,
listed on the London Stock Exchange and based in the UK
> Above 50% EU (non-UK) ownership required prior to the
UK’s exit from the EU
• Close to 50% of shares already held in the hands of EEA nationals
(excluding UK nationals)
> Proposed changes to articles of association relating to
ownership
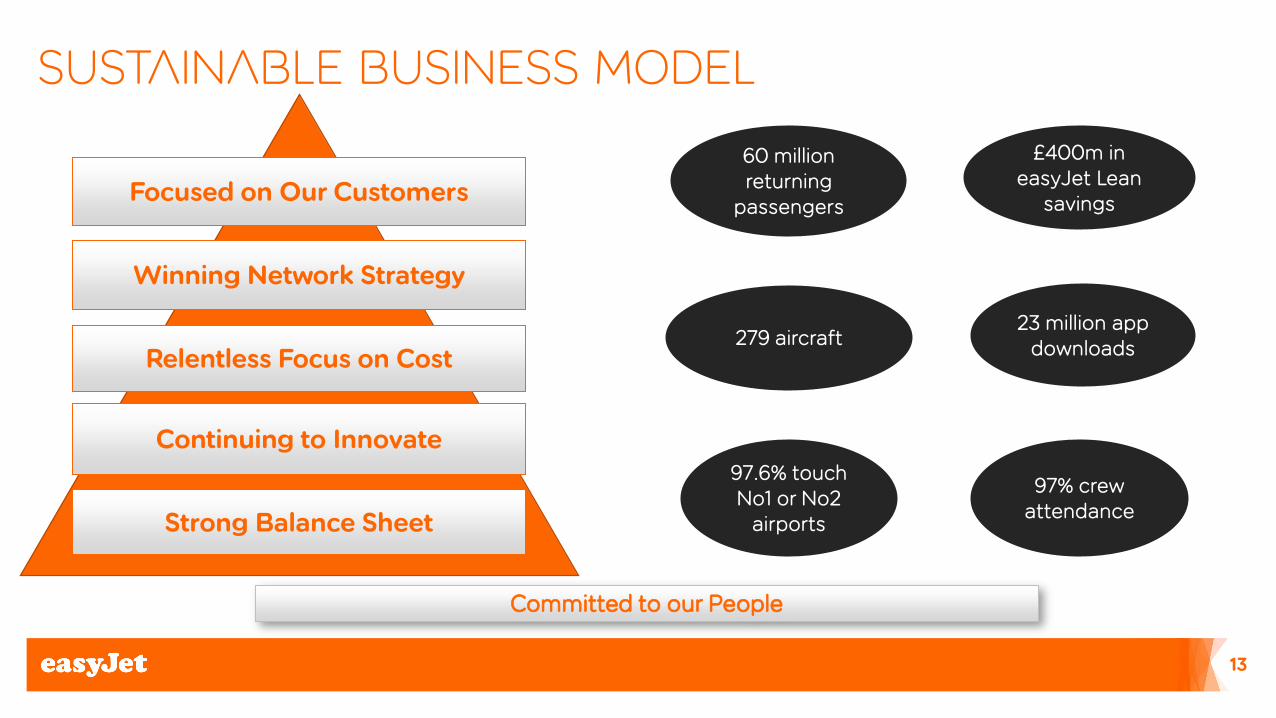
Sustainable business model
13
97.6% touch No1 or No2
airports
60 million returning
passengers
£400m in easyJet Lean
savings
279 aircraft 23 million app
downloads
Winning Network Strategy
Focused on Our Customers
Continuing to Innovate
Relentless Focus on Cost
Committed to our People
Strong Balance Sheet
97% crew attendance

Financial review
Andrew Findlay- Chief Financial Officer

Key performance indicators
FY 2017 FY 2016* Change**
Seats flown (m) 86.7 79.9 8.5%
Passengers (m) 80.2 73.1 9.7%
Load factor (%) 92.6% 91.6% +1ppt
Average sector length (km) 1,105 1,098 0.6%
Revenue per seat - reported currency (£) 58.23 58.46 (0.4%)
Revenue per seat - constant currency (£) 55.83 58.46 (4.5%)
Headline cost per seat incl fuel - reported currency (£) 53.52 52.28 (2.4%)
Headline cost per seat incl fuel - constant currency (£) 49.96 52.28 4.4%
Headline cost per seat excl fuel - reported currency (£) 41.27 38.33 (7.7%)
Headline cost per seat excl fuel - constant currency (£) 38.69 38.33 (0.9%)
* Restated
** Favourable/(adverse)
15

Financial performance
FY 2017 FY 2016* Change**
£ m £ m
Total revenue 5,047 4,669 8.1%
Headline costs:
Headline costs excluding fuel (3,577) (3,061) (16.9%)
Fuel (1,062) (1,114) 4.7%
Headline profit before tax 408 494 £(86) m
Headline profit before tax at constant currency 509 494 £15 m
Non-headline items (23) 13 £(36) m
Total profit before tax 385 507 £(122) m
Headline basic earnings per share (pence) 82.5 108.4 (23.9%)
Total basic earnings per share (pence) 77.4 110.9 (30.2%)
Headline diluted earnings per share (pence) 81.9 107.6 (23.9%)
Dividend per share (pence) 40.9 53.8 (24.0%)
Headline return on capital employed (%) 11.9% 15.0% (3.1ppt)
* Restated
** Favourable/(adverse)
16

Revenue performance
17
£3.10
-4.5%
FY17 @ PYCC
£55.83
Other
£0.08
Allocated Seating
£0.16
First Bag
£0.23
Passenger FY16
£58.46 (5.3%)
+0.4% +0.3% +0.1%
-6.1%
-9.5%
H2’17 H1’17
Improving trend in Passenger RPS (adjusted for Easter)
Strong ancillary performamce in 2017
-6.5%
4.5%
-4.5%
Passenger RPS
Ancillary RPS
Total RPS
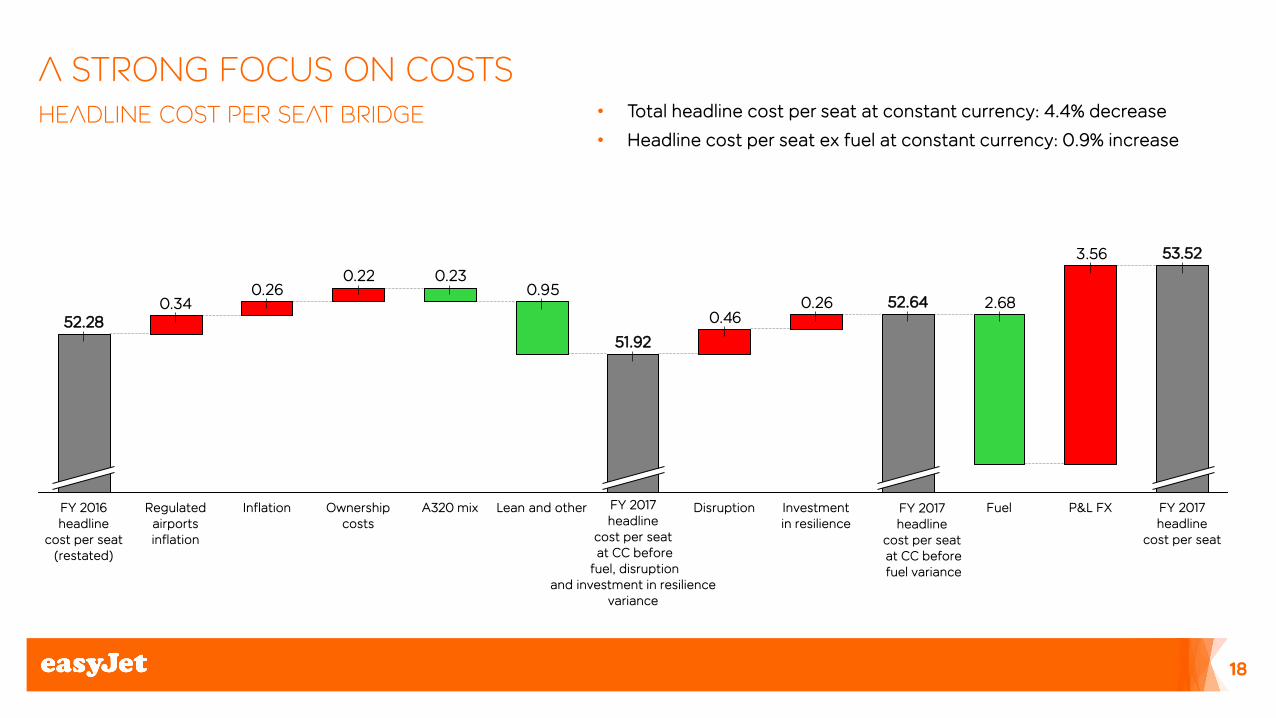
A strong focus on costs Headline cost per seat bridge • Total headline cost per seat at constant currency: 4.4% decrease
• Headline cost per seat ex fuel at constant currency: 0.9% increase
3.56
2.680.260.46
0.950.230.22
0.260.34
Lean and other A320 mix FY 2017 headline
cost per seat
Fuel
52.64
P&L FX Investment in resilience
53.52
Disruption
51.92
Ownership costs
Inflation Regulated airports inflation
FY 2016 headline
cost per seat (restated)
52.28
FY 2017 headline
cost per seat at CC before fuel variance
FY 2017 headline
cost per seat at CC before
fuel, disruption and investment in resilience
variance
18

Impact of fuel & currency
FY 2017 fuel impact FY 2017 FY 2016 Change*
Fuel $ per metric tonne
Market rate 501 415 (86)
Effective price 596 754 158
US dollar rate
Market rate 1.27 1.41 (14 cents)
Effective price 1.45 1.57 (12 cents)
Difference between market rate and effective rate 0.18 0.16
Actual cost of fuel £ per metric tonne 412 479 67
FY 2017 currency impact on headline PBT* EUR CHF USD Other Total
£m
Revenue 151 42 6 8 207
Fuel (1) - (84) - (85)
Headline costs excluding fuel (165) (28) (26) (4) (223)
Total (15) 14 (104) 4 (101)
*Favourable/(adverse)
19
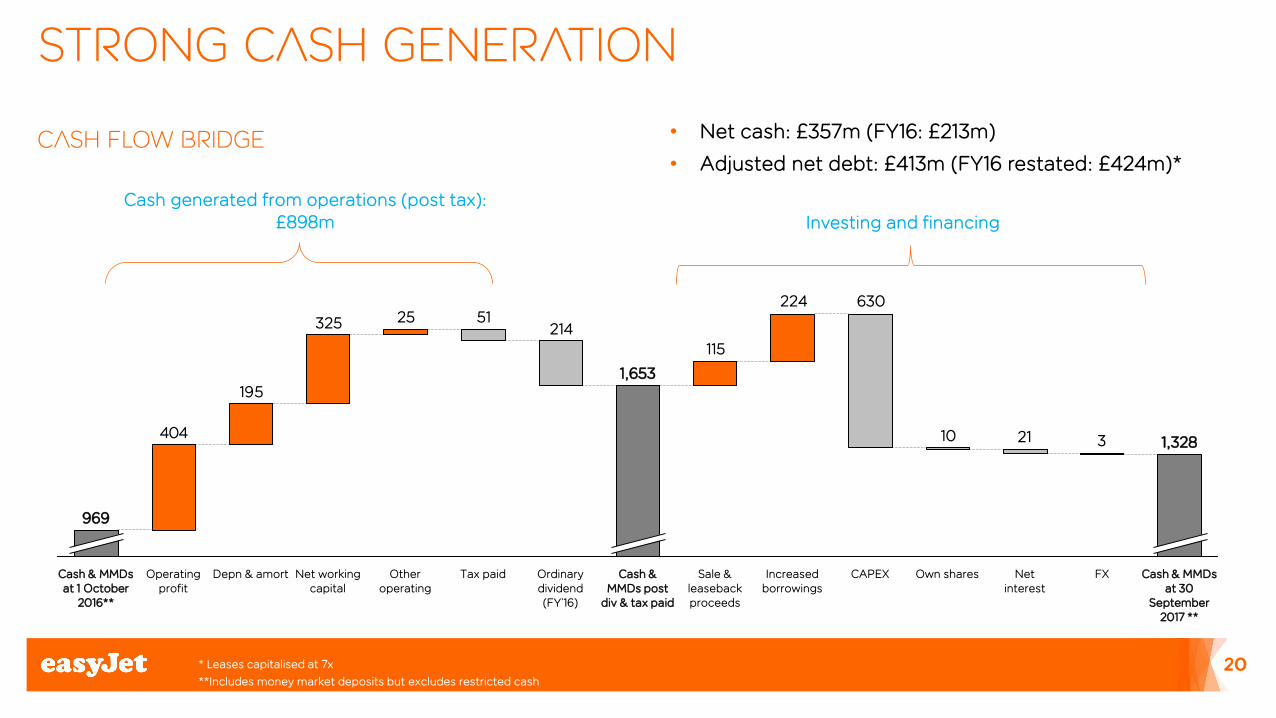
Strong cash generation
* Leases capitalised at 7x
**Includes money market deposits but excludes restricted cash
Cash flow bridge • Net cash: £357m (FY16: £213m)
• Adjusted net debt: £413m (FY16 restated: £424m)*
Cash generated from operations (post tax): £898m Investing and financing
20
32110
630224
115214
5125325
195
404
Own shares Increased borrowings
CAPEX Cash & MMDs at 30
September 2017 **
1,328
FX Net interest
Sale & leaseback proceeds
Cash & MMDs post
div & tax paid
1,653
Ordinary dividend (FY’16)
Tax paid Other operating
Net working capital
Depn & amort Operating profit
Cash & MMDs at 1 October
2016**
969

Strong balance sheet
£m FY 2017 FY 2016*
Goodwill and other intangible assets 544 517
Property, plant and equipment 3,525 3,252
Derivative financial instruments 92 98
Other assets (excluding cash and money market deposits) 348 324
Unearned revenue (727) (568)
Other liabilities (excluding debt) (1,337) (1,142)
Capital employed 2,445 2,481
Cash and money market deposits** 1,328 969
Debt (971) (756)
Net cash 357 213
Net assets 2,802 2,694
Liquidity is supported by the 500 million US dollar Revolving Credit Facility that has no financial covenants or draw-stops
• *Restated
• ** Excludes restricted cash
21

Utilising flexibility in fleet planning
- Delivery schedule assumes base case fleet plan
- Excludes Air Berlin transaction
- Downside cases assume sale at 16 years of age
22
279
302 306
326
342 348
302
317
337
364 363
293
271
293
302 300
282
260
280
300
320
340
360
380
FY2017 FY2018 FY2019 FY2020 FY2021 FY2022
Planned Fleet Size
Maximum Fleet Size using existing assets
Fleet Size with exercise of deferral options and all operating leases returned at maturity(Amendment #5)
Fleet Size with exercise of deferral options (Amendment #5)
Fleet plan as at 30 Sept 2017
0
5
10
15
20
25
30
35
40
FY2018 FY2019 FY2020 FY2021 FY2022
easyJet Orderbook Delivery Schedule
A320CEO A320NEO A321NEO

Gross capital expenditure
23
FY’20
£1,000m
FY’19
£900m
FY’18
£1,200m
FY’17
£630m
• Incremental capex in FY18 & FY19 driven by replacement expenditure
• Four A321 deliveries moved into FY 18
• Maintenance capex is projected to remain relatively stable over the next 3 years
• Revised Capex spend updated for current exchange rates
Growth Replacement Maintenance & Other
- Excludes Air Berlin transaction

H1 forward bookings
H1 2018 (October 2017 to March 2018) as at XX November 2017
24
90%
83%
59%
31%
18%
12%
50%
93%
86%
59%
32%
22%
16%
52%
Oct Nov Dec Jan Feb Mar H1
Last Year
This Year

Purposeful investment Air Berlin asset acquisition

DEAL HIGHLIGHTS
26
> easyJet has reached a binding agreement to acquire part of Air Berlin operations at Berlin Tegel airport,
subject to antitrust clearance and regulatory approval
• easyJet will operate up to 25 A320 family aircraft
> Consideration of €40m payable in cash upon completion
• Completion subject to regulatory approval
• £60m headline & £100m non-headline PBT adverse impact in FY’18
> Leadership in large Berlin market created with combined presence in Berlin-Tegel and Berlin-Schönefeld
> Acquisition expected to deliver attractive financial returns to easyJet shareholders
• Earnings accretive by FY 2019; synergies from increased presence in Berlin provides potential upside
> Consideration to be financed through internal sources

Tegel fleet plan
Winter Summer Shoulder
Wet lease easyJet
Summer Peak
Tegel fleet plan by month (2018)
Jan Mar Feb Apr Jul Nov
(steady
state)
Sep Aug Oct May Jun
easyjet is a combination of existing fleet and crew to be reallocated to TXL
and conversion of AB aircraft and crew
27

> Strong correlation between strong performance and #1 positions
> We have a targeted plan to build more airports into #1 positions
Being number 1 delivers returns Superior product > widest range of routes > best frequencies / times > strongest brand awareness
Cost advantage > Leverage scale on airport fees > procurement of ground handling > economies of scale from media spend
Operational advantage > improved crew productivity > more flexible scheduling (larger slot portfolio)
#1 positions
#2
Other
Re
turn
s
28
Delivering returns in strong market positions

DELIVERING SUPERIOR MARKET POSITIONS
29
Total Berlin Capacity* (m seats)
Airport Positions
Total Berlin #1 #2 #3 #4 #5 #6 #7
• FY 2017 OAG data adjusted for transaction:
• AirBerlin TXL capacity and Niki PMITXL included in easyJet figure
• NIKI and LGW capacity included in Eurowings
Ryanair IAG Norwegian easyJet AF-KLM Lufthansa Group
5.5
5.3
16.0
10.7
0.7 1.1
5.9
Turkish
1.6 0.8
Eurowings
Seats at SXF (5.8m)

EXPECTED TIMING
> Antitrust clearance, regulatory approval and closing expected in December 2017
> First flight out of Tegel planned for early January
> Update on implementation at Q1
30

PBT accretive from 2019 onwards
Revenue
31
Headline Impact
Non-Headline Impact
Air Berlin perimeter 2018
Load factor: below average RPS: below average
High cost / mainly wet leasing
c. £60m adverse Headline AB PBT Impact
c. £100m adverse
Cost
• Flying a partial winter schedule • Uncertain on competitors schedules • Lower load factor / build demand
• Wet lease aircraft required to fly initial schedule as Air Berlin leased aircraft come on line
• Crew recruiting and training • Aircraft leasing and fleet conversion costs

Positive FY’18 Underlying trading
32
Current easyJet PBT consensus FY’18 £465m Based on input from 27 analysts
H1 Trading vs consensus c. +£55m Includes one off benefits from capacity decreases post Monarch / Air Berlin administration and operational issues at Ryanair
Consensus post H1 trading upside £520m
Fuel and FX update (£15)m Fuel at $630 per metric tonne
Headline PBT consensus pre Air Berlin transaction
£505m
Impact from Air Berlin transaction c.(£60)m
Headline PBT incl Air Berlin impact £445m

Fuel and foreign exchange hedging
Fuel requirement US dollar requirement Euro Surplus
Six months to 30 March 2018
82% @ $512/tonne 80% @ $1.36/£ 71% @ €1.25/£
Full year ending 30 September 2018
75% @ $514/tonne 73% @ $1.36/£ 73% @ €1.24/£
Full year ending 30 September 2019
45% @ $533/tonne 47% @ $1.30/£ 51% @ €1.13/£
As at 30th September 2017
33

2018 headline Outlook – excluding Air Berlin
H1 2018 (October 2017 to March 2018) as at 20 November 2017
* Based on fuel spot price range of $580 - $650 ; GBP: EUR 1.12; GBP: USD 1.132
34
Capacity (seats flown) • FY c.+6% increase
Revenue per seat at constant currency
• Q1 / H1 2018 revenue per seat low to mid single digits positive
Cost per seat at constant currency
• FY headline cost per seat excluding fuel: up to 1% increase (assuming normal levels of disruption)
• FY headline cost per seat: down c. 1% (assuming normal levels of disruption)
FX / Fuel*
• FY: c.£5 million adverse movement from foreign exchange rates on headline PBT
• FY: unit fuel costs £100 million to £125 million favourable
• Expected total fuel cost £1,100 million
Air Berlin transaction – Headline PBT impact • Circa £60 million adverse

Summary
> 2017 performance has been robust in a low yield environment
> Positive revenue per seat momentum - easyJet is winning in the market
> Leading the way in customer initiatives to drive loyalty and ancillary revenue
> Strong cost performance delivered
> Continued focus to improve On-time Performance and Customer Satisfaction
> Strong balance sheet and cash position
> The Air Berlin transaction will deliver long term value to easyJet
35

Q & A
appendix
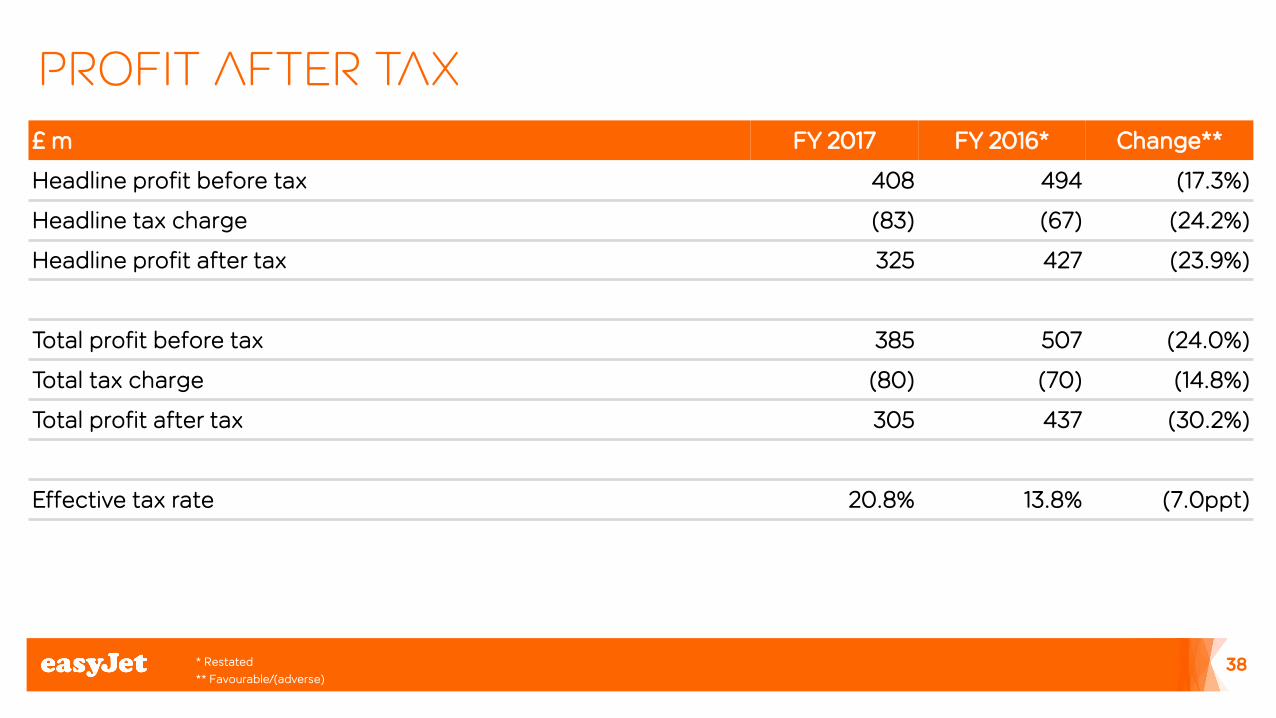
Profit after tax
£ m FY 2017 FY 2016* Change**
Headline profit before tax 408 494 (17.3%)
Headline tax charge (83) (67) (24.2%)
Headline profit after tax 325 427 (23.9%)
Total profit before tax 385 507 (24.0%)
Total tax charge (80) (70) (14.8%)
Total profit after tax 305 437 (30.2%)
Effective tax rate 20.8% 13.8% (7.0ppt)
* Restated
** Favourable/(adverse)
38

Revenue per seat £ per seat FY 2017 FY 2016 Change*
Seat revenue 57.20 57.43 (0.4%)
Non-seat revenue 1.03 1.03 0.7%
Total revenue 58.23 58.46 (0.4%)
£ per seat FY 2017 FY 2016 Change*
Passenger revenue 46.85 47.98 (2.4%)
Ancillary revenue 11.38 10.48 8.6%
Total revenue 58.23 58.46 (0.4%)
*Favourable/(adverse)
Seat revenue includes all revenue except for commissions earned from goods and/or services sold on behalf of partners. Non-seat revenue arises from commissions earned from goods and/or services sold on behalf of partners.
Passenger revenue arises from the sale of flight seats and is recognised net of government taxes in the period in which the service is provided, that being when the flight is flown.
Ancillary revenue primarily arises from the discretionary purchase of additional goods and/or services in addition to passenger revenue. This includes but is not limited to the provision of checked baggage, allocated seating, speedy (priority) boarding services, sports equipment and change fees, and commissions earned from goods and/or services sold on behalf of partners.
Under the new presentation from 1 October, total revenue would have been categorised between passenger and ancillary revenue as follows:
39

H2 Performance Reported £m H2 2017 H2 2016* Change**
Total revenue 3,220 2,898 11.1%
Fuel (603) (652) 7.6%
Headline operating costs excluding fuel (1,830) (1,593) (15.0%)
Headline EBITDAR 787 653 20.4%
Headline ownership costs (167) (138) (20.6%)
Headline profit before tax 620 515 20.4%
Headline PBT margin 19.3% 17.8% 1.5ppt
Seats (m) 49.2 45.3 8.6%
Constant currency £ per seat H2 2017 H2 2016* Change**
Total revenue 63.06 63.93 (1.4%)
Fuel (11.29) (14.39) 21.5%
Headline operating costs excluding fuel (35.53) (35.12) (1.2%)
Headline EBITDAR 16.24 14.42 12.6%
Headline ownership costs (3.26) (3.06) (6.7%)
Headline profit before tax 12.98 11.36 14.2%
40 * Restated
** Favourable/(adverse)

Headline CPS excluding fuel – key drivers
Cost per seat excluding
fuel £
Variance to prior year at constant
currency* £
Variance to prior year at constant
currency* %
Weighted variance at constant currency*
£
Drivers
Navigation 4.40 0.16 4.0% 0.4% • Price benefits in France and Germany
Maintenance 3.09 0.22 7.2% 0.6% • Upgauging of fleet from A319s to A320s • Engineering and maintenance savings such as the component supply contract
Crew 7.44 (0.29) (4.2%) (0.7%)
• Pay increases • Increase in average sector length • Investment into operational resilience over the summer peak
Overheads 5.69 (0.44) (8.8%) (1.1%) • Higher disruption costs • Higher wet leasing costs
Airports and ground handling 16.90 0.21 1.3% 0.5%
• Annualised increases in charges at regulated airports • Increased de-icing costs due to a colder winter • Offset by savings from volume deals and renegotiated airport and ground handling contracts
Ownership 3.75 (0.22) (6.5%) (0.6%)
• Increase in depreciation due to new aircraft purchased • Increase in interest payable due to the bond issues • Partially offset by decreasing lease costs due to a favourable lease mix
Total headline CPS excluding fuel 41.27 (0.36) (0.9%) (0.9%)
*Favourable/(adverse)
41
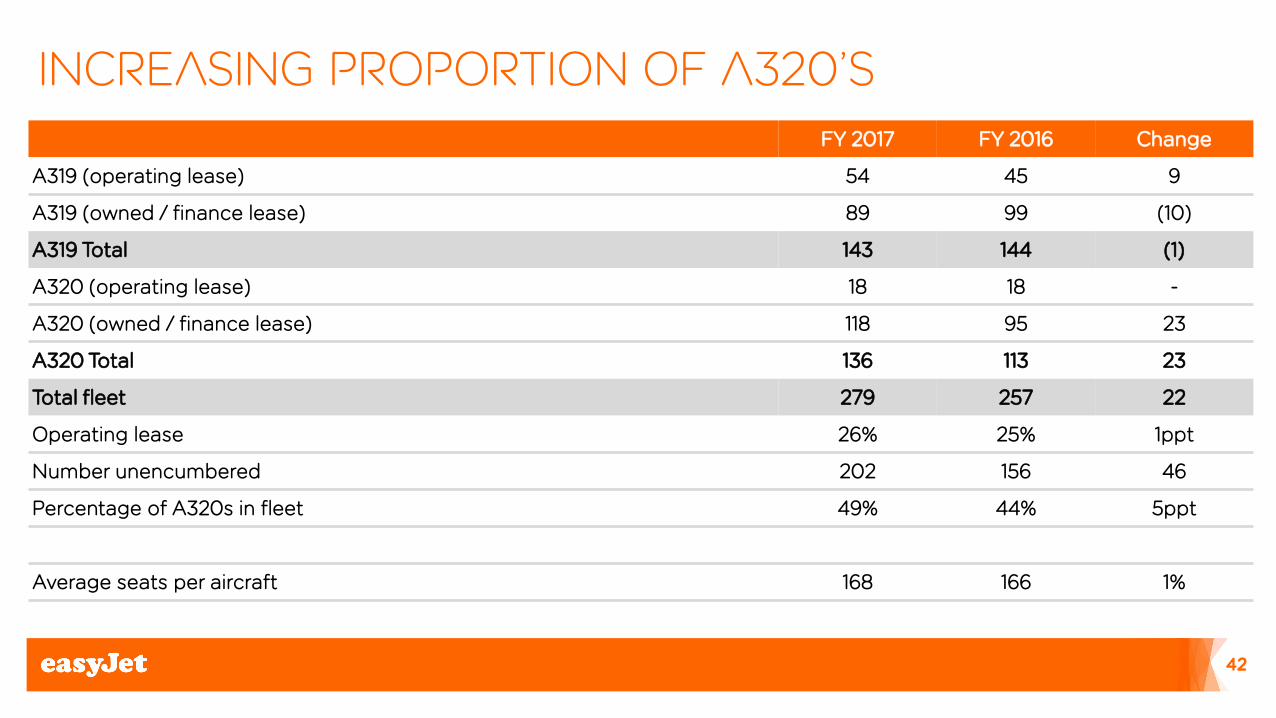
Increasing proportion of A320’s
FY 2017 FY 2016 Change
A319 (operating lease) 54 45 9
A319 (owned / finance lease) 89 99 (10)
A319 Total 143 144 (1)
A320 (operating lease) 18 18 -
A320 (owned / finance lease) 118 95 23
A320 Total 136 113 23
Total fleet 279 257 22
Operating lease 26% 25% 1ppt
Number unencumbered 202 156 46
Percentage of A320s in fleet 49% 44% 5ppt
Average seats per aircraft 168 166 1%
42

Non-headline items FY 2017 FY 2016 Change* Description
£ m £ m £ m
Sale and leaseback charge (16) - (16) The sale and leaseback of the Group’s 10 oldest A319 aircraft resulted in a loss on disposal of the assets of £10 million and a £6 million maintenance provision catch up.
Organisational review (6) (1) (5) The programme involves redundancy costs and associated third party adviser fees.
Air Operator Certificate ('AOC') (2) (1) (1) Cost of establishing a multi-AOC post-Brexit structure following the UK’s referendum vote to leave the European Union (‘EU’).
Maintenance reserves discounting - 8 (8) In 2016 the maintenance provision was discounted reflecting the time value of money. The discount applied generated a cumulative one-off non-headline credit.
Balance sheet foreign exchange gain 2 3 (1) Foreign exchange gains or losses arising from the retranslation of foreign currency monetary assets and liabilities held in the statement of financial position.
Fair value adjustment (1) 4 (5) Fair value adjustments associated with the cross-currency interest rate swaps put in place to hedge the bond issued in February 2016.
Total non-headline items (23) 13 (36)
*Favourable/(adverse)
43
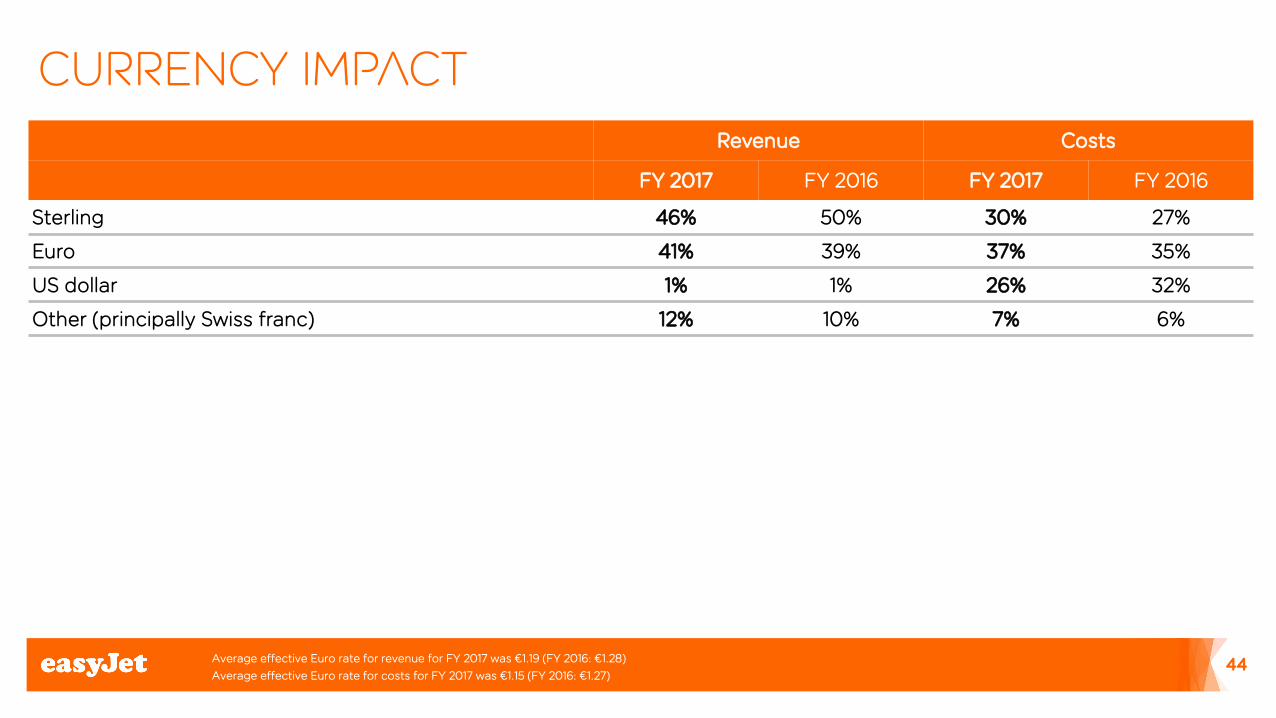
Currency impact
Revenue Costs
FY 2017 FY 2016 FY 2017 FY 2016
Sterling 46% 50% 30% 27%
Euro 41% 39% 37% 35%
US dollar 1% 1% 26% 32%
Other (principally Swiss franc) 12% 10% 7% 6%
Average effective Euro rate for revenue for FY 2017 was €1.19 (FY 2016: €1.28)
Average effective Euro rate for costs for FY 2017 was €1.15 (FY 2016: €1.27)
44

ROCE calculation
Reported £m FY 2017 FY 2016*
Earnings before interest and tax – reported 404 511
Interest element of operating lease payments 37 30
Earnings before interest and tax - adjusted 441 541
Tax 19% 20%
Normalised operating profit after tax (NOPAT) 357 433
Average shareholders’ equity – reported 2,748 2,457
Average net cash – reported (285) (324)
Opening capitalised leases 637 798
Closing capitalised leases 770 637
Average capitalised leases 704 718
Average capital employed 3,167 2,851
Return on capital employed – 7x basis 11.3% 15.2%
45 * Restated

Headline ROCE calculation
Reported £m FY 2017 FY 2016*
Headline earnings before interest and tax – reported 428 504
Interest element of operating lease payments 37 30
Headline earnings before interest and tax - adjusted 465 534
Tax 19% 20%
Normalised headline operating profit after tax (NOPAT) 376 427
Average shareholders’ equity – reported 2,748 2,457
Average net cash – reported (285) (324)
Opening capitalised leases 637 798
Closing capitalised leases 770 637
Average capitalised leases 704 718
Average capital employed 3,167 2,851
Return on capital employed – 7x basis 11.9% 15.0%
46 * Restated


