FY 2017-2026 Transportation Capital Improvement Plan Update · 2019-12-30 · FY 2017-2026...
28
FY 2017-2026 Transportation Capital Improvement Plan Update Arlington Committee for Transportation Choices November 1, 2017
Transcript of FY 2017-2026 Transportation Capital Improvement Plan Update · 2019-12-30 · FY 2017-2026...

FY 2017-2026
Transportation Capital Improvement
Plan Update
Arlington Committee for Transportation Choices
November 1, 2017
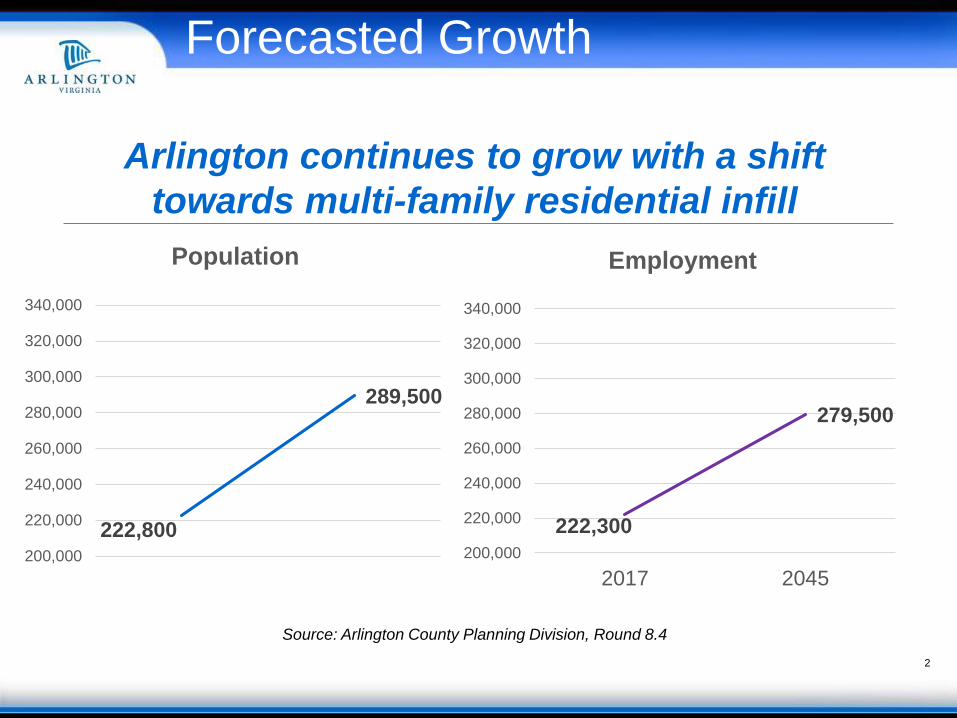
Source: Arlington County Planning Division, Round 8.4
2
222,800
289,500
200,000
220,000
240,000
260,000
280,000
300,000
320,000
340,000
Population
222,300
279,500
200,000
220,000
240,000
260,000
280,000
300,000
320,000
340,000
2017 2045
Employment
Arlington continues to grow with a shift
towards multi-family residential infill
Forecasted Growth

37 million sq. ft. of office space
36 million sq. ft. in Metrorail station areas
with over 6 million sq. ft. of supporting retail
and services.
Rosslyn-Ballston and Route 1 corridors
support the County’s commercial tax base.
114,000 housing units
Over 47,080 in Metrorail station areas and
17,600 units along Columbia Pike corridor.
56% of all housing in established transit
corridors.
Success in concentrating growth around three transit corridors
Source: Arlington County Planning Division, March 20163
Transit-Oriented Development

• 1,094 lane-miles of streets and 19
miles of HOV lanes
• Over 5,500 on-street metered parking
spaces
• 12 miles of Metrorail and 11 stations
• VRE commuter rail
• Extensive regional (23 Metrobus routes)
and local bus service (16 ART routes)
• Carshare program with nearly 90 cars,
plus point-to-point carsharing in
conjunction with DC (500 vehicles)
• Growing Bikeshare program with 88
stations – and 20 more funded
• 50 miles of multi-use trails and 36
miles of on-street bike lanes and
sharrows
• Extensive and growing network of
sidewalks
County is investing to enhance
the quality of all travel options
4
Providing Travel Options

Investments in transportation infrastructure and services help the community meet its sustainability goals
R-B CORRIDOR 1970
R-B CORRIDOR TODAY
5
Achieving a Sustainable Community

Smart growth has allowed Arlington to add
population while decreasing traffic volumes
Traffic on main arterials is down over 15-20 year period.
6
Street Segment Street Type 1996 2011/2012% Change
1996-20122014/2015
% Change
2012-2015
Lee Hwy - Rosslyn EW 6-lane arterial 37,770 31,951 -15.40% 25,400 -20.50%
Wash. Blvd. - VA Square EW 4-lane arterial 20,469 17,500 -14.50% 16,885 -3.50%
Clarendon Blvd. EW 2-lane 1-way arterial 13,980 13,292 -5.00% 12,000 -9.70%
Wilson Blvd. - Clarendon EW 2-lane 1-way arterial 16,368 12,603 -23.00% 11,000 -12.70%
Arlington Blvd. EW 6-lane arterial 55,865 65,259 16.80% 66,445 1.80%
Glebe Road - Ballston NS 6-lane arterial 35,230 31,000 -12.00% 28,000 -9.70%
Glebe Road - South of Col. Pike NS 4-lane arterial 29,000 27,000 -6.00% 24,000 -11.10%
George Mason Drive* NS 4-lane arterial 20,002 20,518 2.30% 20,405 -0.60%
Route 1 north of Glebe Rd. NS 6-lane arterial 52,000 44,000 -15.40% 48,500 10.20%
*2016 volumes were included due to unavailability of 2015 counts
Traffic Volumes Declining

Vehicle Miles Declining
7

Safety is Improving
8
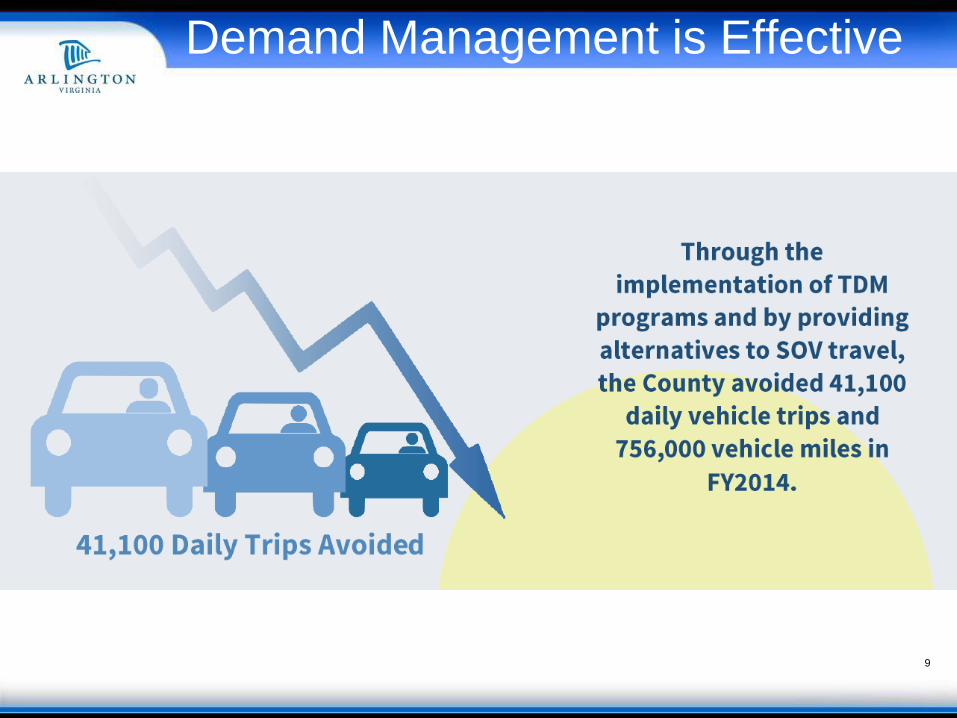
Demand Management is Effective
9

Residents Bike and Walk More
10

Arlington’s focus on developing high-quality transit is
moving more people without more traffic.
Transit ridership grew significantly over 19-year period but
Metro and VRE ridership have declined in recent years.
FY1996 Actual FY2015 Actual % Growth
Metrorail Arlington Stations 45,335,000 56,191,208 23.9%
Metrobus Arlington Routes 12,049,000 14,247,548 18.5%
VRE – Crystal City 567,000 829,137 46.2%
Arlington Transit (ART) 105,000 2,821,980 2,587%
Total Annual Ridership 58,056,000 78,122,856 27.7%
40% of Virginia’s total annual transit ridership is from
Arlington-related trips.
11
Transit Ridership Increasing

ART ridership continues to increase, counter to the significant
declines in transit ridership region-wide
12
674,806
926,5741,060,441
1,225,427
1,428,827
1,990,402
2,261,100
2,537,0002,644,000
2,833,0002,823,346
3,111,575
3,405,000
0
500,000
1,000,000
1,500,000
2,000,000
2,500,000
3,000,000
3,500,000
4,000,000
FY 05 FY 06 FY 07 FY 08 FY 09 FY 10 FY 11 FY 12 FY 13 FY 14 FY 15 FY 16 FY17
Fiscal Year
An
nu
al
Rid
ers
hip
Local Bus Ridership Growing

Master Transportation Plan (MTP)
MTP General Policies:
A. Integrate transportation with
land use
B. Support the design and
operation of Complete
Streets
C. Manage travel demand and
transportation systems
13
County Board-adopted policy guides our
transportation CIP investments.

Accessibility – Expanding Options
14

Recent Accomplishments
15

16
Columbia Pike Street Improvements and Utility
Undergrounding - South Wakefield to Four Mile Run
Freedmans Village BridgeNew Commuter Store at Rosslyn Metro Station
Capital Bikeshare expansion
Recent Accomplishments

17
Crystal City Potomac Yard Transitway
Bus stop improvementsWilson Boulevard restriping (between
Frederick and Manchester Streets)
Recent Accomplishments

Building out the County’s ITS
Fiber Network
Benefits:
• Provides increased capacity
and reliability by replacing
obsolete copper
communications
• Will connect more than 290
traffic signals to central
system, and will serve public
safety sites such as fire
stations
• Final phase of County’s
Transportation System
Management Communications
Upgrades
Recent Accomplishments
18

During next 10 years, Arlington plans to invest over $1
billion in transportation improvements to enhance the
quality of life and economic well-being of residents, workers
and visitors
Complete street projects to enhance multimodal accessibility in
our neighborhoods
Metrorail station projects to improve accessibility, safety for riders
A new Premium Transit Network for Columbia Pike, Pentagon City,
Crystal City, Potomac Yard
Maintenance and reconstruction of County bridges and roads
Improvements to street lights and signals
Enhancements to the pedestrian and bicycle network and parking
Continues Arlington's commitment to developing, maintaining and
managing a transportation system that expands travel choice and
provides equal access for all users
Overview of Transportation CIP
19

Transportation Program Summary
Complete Streets44.2%
Transit 39.9%
Paving 11.9%
Other Maintenance Capital 0.5%
Program Administration 3.5%
Prog ram $M
Complete S treets 568
Trans it 512
Paving 152
Other Maintenanc e Capital 7
Program A dminis tration 44
T otal 1,284
20

Transportation Funding Summary
Federal 6%
State 14%
NVTA Regional23%
PAYG/Other 12%
GO Bond 13%
TCF 27%
TIF 5%
Source $M*
Federal 72
State 182
NVTA Regional 290
PAYG/Other 160
GO Bond 169
TCF 344
TIF 65
Total 1,284
* Figures for the various
sources include new funds as
well as previously approved
funds
21

External/Dedicated Funding Sources
Funding SourceRestrictions on Use of Funding(per state code or other binding documentation)
Federal Formula Multiple programs, small annual allocations, focused on improvements
related to safety, air quality, and multimodal transportation (0-20% match)
State Transit Formula Transit service expansion and capital improvements (match varies)
State House Bill 2 Roadway improvements, transit capacity expansion, TDM (no match)
State Revenue Sharing Roadway improvements (50% match)
Northern Virginia
Transportation Authority
(NVTA) Regional
Roadway and transit improvements included in the NVTA Regional Plan
that provide greatest congestion reduction relative to cost (no match)
Toll Revenues – I-66, I-395* Multimodal improvements on parallel corridors that increase person
throughput and benefit the toll-paying users of the toll road (no match)
Transportation Capital Fund
(TCF) – Commercial and
Industrial (C&I) Tax
New or enhanced road / transit improvements that add capacity, service,
or access and capital or operating costs related to the new projects, and
benefit the business community
TCF – NVTA Local Additional roadway construction, capital improvements that reduce
congestion, or public transportation purposes
Tax Increment Financing
(TIF)
Capital and public infrastructure improvements in the TIF area: Crystal
City, Pentagon City, Potomac Yard
* This source is anticipated and does not yet exist
22

Route 1
Rosslyn-Ballston County-wide
Transit
Complete Streets
Maintenance Capital
Investment Areas
Columbia Pike
Implementing the MTP and Supporting
Land Use Plans
23

Investments – Route 1 CorridorProjects:Complete streets:
• 18th St. S. – S. Fern St. to S. Eads St.
• S. Hayes St. – Pentagon City Multimodal – Army Navy Dr.
to 15th St. N.
• 27th St. S. – US1 to Crystal Drive
• Crystal Drive – US 1 to 27th Street
• Clark/Bell Streets – 12th to 18th Streets
• Clark/Bell Streets – Vicinity of 15th Street
• 18th Street – US 1 to Crystal Drive
• S. Eads Street – 15th to 23rd Streets
• 12th Street S. – S. Eads to S. Clark Streets
• Airport Viaduct Removal
• Viaduct Trail Access to National Airport
• 12th St. S. – S. Fern St. to S Eads St.
• 23rd St. S. – US1 to Crystal Drive
Transit:
• CCPY Transitway Extension to Pentagon City
• Crystal City Metro Station East Entrance
Benefits:
• Improve pedestrian, bicycle,
vehicle and transit access and
safety.
• Improve Metrorail station access
and safety.
Source: Crystal City
Sheraton
CCPY Transitway Extension to Pentagon City
24

Investments – Columbia PikeProjects:Complete Streets:
• Columbia Pike:
o S. Frederick St. to Jefferson St
o Oakland St. to S Wakefield St.
o S. Garfield St. to Quinn St.
o Orme St. to Joyce St.
o Courthouse Road to S. Quinn St.
• Bike Boulevards – Bicycle facility improvements
• 12th St. S. – Glebe Rd. to Monroe St.
• 11th St. S. – Glebe Rd. to Monroe St.
Transit:
• Transit Stations
Benefits:• Improve pedestrian, bicycle, vehicle and transit access
and safety
Columbia Pike Complete Street cross-section
Columbia Pike Multimodal Street Improvements

Investments – Rosslyn - Ballston
Projects:Complete Streets:
• Rosslyn-Ballston Corridor Accessibility
• Rosslyn Esplanade – N. Lynn St. & Custis Trail
• 13th St. N. Phase III – Hudson St. to Ivy St.
• Hudson St. & Wilson Blvd.
• Washington Blvd. – Wilson Blvd. to Kirkwood Rd.
• 10th St. N. at Fairfax Dr.
• Clarendon Circle Pedestrian Improvements
• Wilson Blvd. – N. Lincoln Street to 10th Street N.
Transit:
• Court House Metro Station Second Elevator
• Ballston Metro Station Multimodal Improvements
• Ballston-MU – Metro Station West Entrance
Benefits:
• Improve pedestrian, bicycle, vehicle
and transit access and safety
• Improve Metrorail station access and
safety
Proposed Court House Station Second Elevator
Proposed Ballston - MU Station West Entrance 26

ART Light Duty Maintenance Facility
Investments – County-wideProjects/Programs:
Transit:
• ART Facilities and Fleet Expansion
• Bus Stop/Shelter and Accessibility Improvements
Complete Streets:
• Transportation Systems & Traffic Signals Investments to
Support Multimodal Operations
• Arterial Streets/Intersections Outside Major Business Corridors
• Walk Arlington/Bike Arlington/Safe Routes to School
• Neighborhood Complete Streets
Other:
• Capital Bikeshare System Expansion
• Commuter Stores
Benefits: Improve pedestrian, bicycle, vehicle and
transit access and safety.
Capital Bikeshare
27

CIP Update Process
• The County 10—year CIP is updated every 2 years
• The update process starts with staff technical work in the
Fall of 2017
• The County Manager presents a proposed CIP to the
County Board in late Spring 2018, followed by
commission/community briefings
• County Board hearings and CIP adoption scheduled for
Summer 2018
• The Transportation CIP is informed by County Board
adopted plans and policies (ex: sector plans)
• It is also shaped by the available funding sources and
associated requirements
28