FY 2016 Results - Ryanair | Investor Relations 2016 Profits +43% *excludes accounting gain €317.5m...
21
1 FY 2016 Results
Transcript of FY 2016 Results - Ryanair | Investor Relations 2016 Profits +43% *excludes accounting gain €317.5m...

1
FY 2016 Results

2
Europe ’s Favour i te A i r l ine
Europe’s Lowest Fare/Lowest Cost Carrier
No. 1, Traffic – 116m
No. 1, Cover – 84 Bases
No. 1, Service – Low Fares/On-time/Bags/Canx
– “Always Getting Better” Program
Fwd Bookings & Traffic Rising
330 new a/c order = growth to 180m by FY24

3
Europe ’s Lowest Fares
Source: Latest Annual Reports, *includes 1st checked bag
Avg. Fare % > Ryanair Ryanair* €46 Wizz* €61 +33% Norwegian €80 +74% easyJet €91 +98% Air Berlin €123 +167% Lufthansa €226 +391% IAG €230 +400%
Air France/KLM €249 +441%
Avg Competitor Fare €151 +229%

4
Europe ’s Lowest Costs
Source: Latest Annual Reports
(€ per pax ex-fuel) RYA WIZ EZJ NOR AB1 LUV
Staff 5 5 10 15 19 48
Airport & Hand. 8 12 22 19 28 9
Route Charges 6 6 6 8 9 0
Own’ship & maint. 6 14 9 25 31 18
S & M other 3 3 8 6 29 17
Total (PY) 28 (29) 40 (39) 55 (51) 73 (62) 116 (107) 92 (74)
%> Ryanair 43% 96% 161% 314% 230%

5
84 bases
200 airports
33 countries
1,800+ routes
116m c’mers
340 x B737 fleet
330 x B737s on order
Europe ’s No. 1 Coverage
6
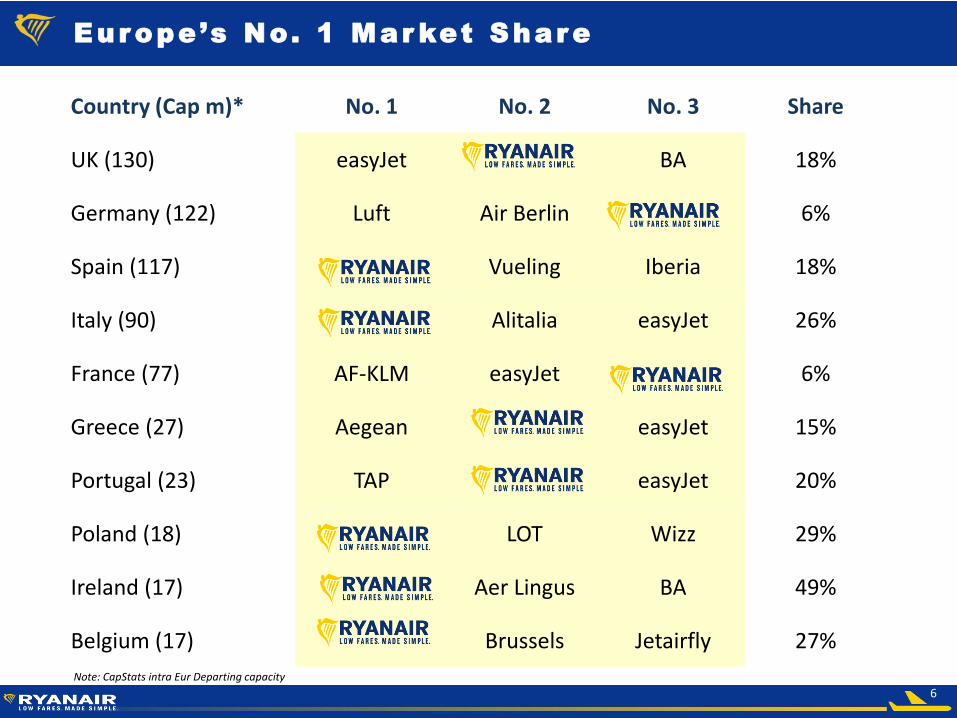
Europe ’s No. 1 Mar ket Share
Note: CapStats intra Eur Departing capacity
Country (Cap m)* No. 1 No. 2 No. 3 Share
UK (130) easyJet BA 18%
Germany (122) Luft Air Berlin 6%
Spain (117) Vueling Iberia 18%
Italy (90) Alitalia easyJet 26%
France (77) AF-KLM easyJet 6%
Greece (27) Aegean easyJet 15%
Portugal (23) TAP easyJet 20%
Poland (18) LOT Wizz 29%
Ireland (17) Aer Lingus BA 49%
Belgium (17) Brussels Jetairfly 27%

7
Or der book fac i l i tates prof i tab le g rowth
Source: Annual Reports, company forecasts
C’mers (m) 15/16
69
79 79
88
106
116
125
135 140
150
160
170
180
0
20
40
60
80
100
120
140
160
180
FY17 FY18 FY19 FY20 FY21 FY22 FY23 FY24
8
73
7-8
00
Ord
er
MA
X O
rde
r
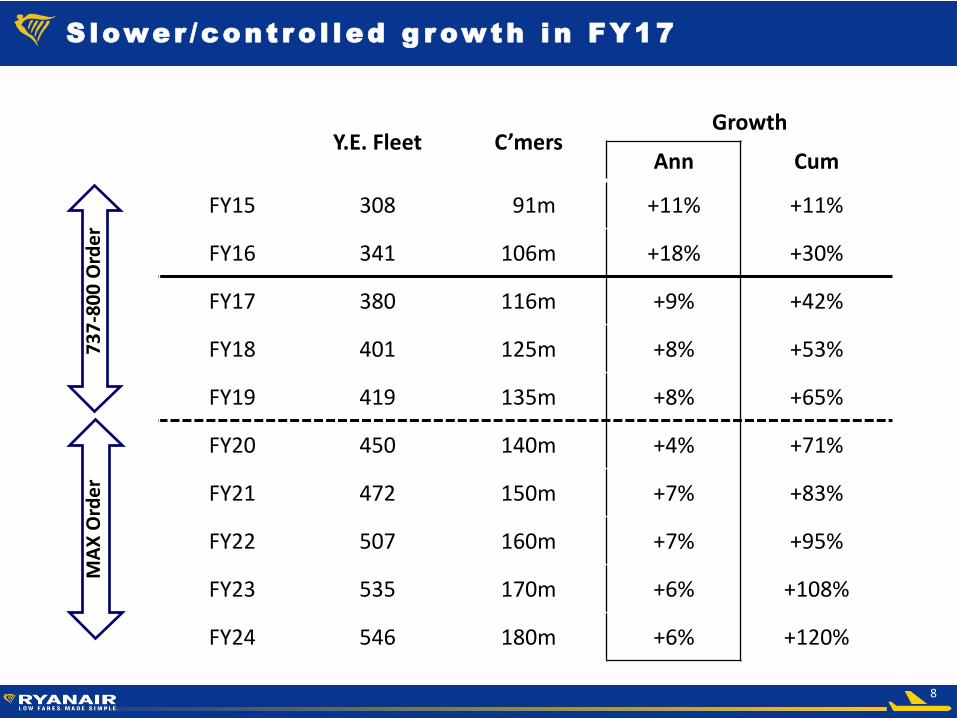
Slower /cont ro l led g rowth in FY17
Y.E. Fleet C’mers Growth
Ann Cum
FY15 308 91m +11% +11%
FY16 341 106m +18% +30%
FY17 380 116m +9% +42%
FY18 401 125m +8% +53%
FY19 419 135m +8% +65%
FY20 450 140m +4% +71%
FY21 472 150m +7% +83%
FY22 507 160m +7% +95%
FY23 535 170m +6% +108%
FY24 546 180m +6% +120%

9
Mar 15 Mar 16
Traffic (m) 90.6 106.4 +18%
Load Factor 88% 93% +5%
Avg. fare (incl. bag) €47 €46 -1%
Revenue (€m) 5,654
6,536 +16%
Net Profit (€m) 867 1,242 +43%
Net Margin 15% 19% +4%
EPS (€cent) 62.59 92.59 +48%
FY 2016 Prof i ts +43%
*excludes accounting gain €317.5m on Aer Lingus sale
*
*
*
10
(buy-back.
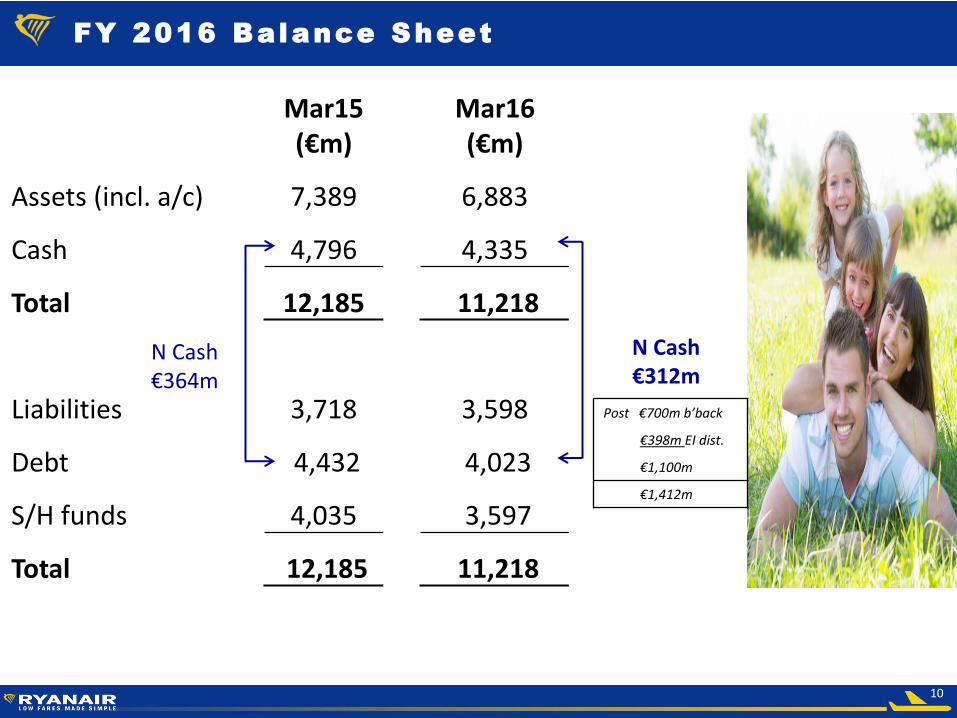
FY 2016 Balance Sheet
(i)
Mar15 Mar16 (€m) (€m)
Assets (incl. a/c) 7,389 6,883
Cash 4,796 4,335
Total 12,185 11,218
Liabilities 3,718 3,598
Debt 4,432 4,023
S/H funds 4,035 3,597
Total 12,185 11,218
N Cash €364m
N Cash €312m
Post €700m b’back
€398m EI dist.
€1,100m
€1,412m
11
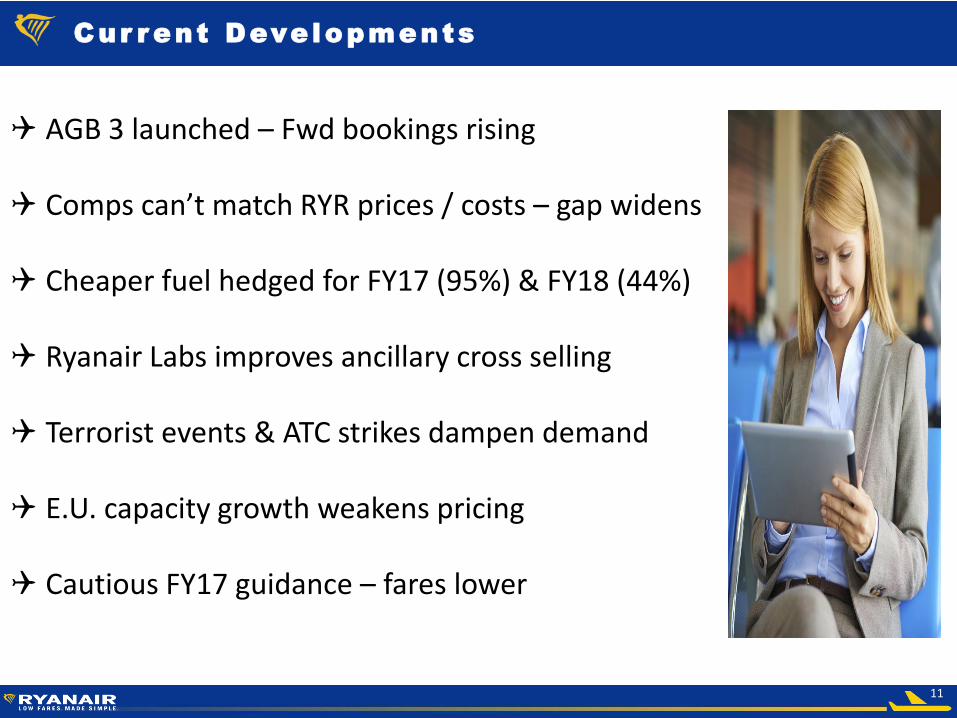
Cur rent Developments
AGB 3 launched – Fwd bookings rising
Comps can’t match RYR prices / costs – gap widens
Cheaper fuel hedged for FY17 (95%) & FY18 (44%)
Ryanair Labs improves ancillary cross selling
Terrorist events & ATC strikes dampen demand
E.U. capacity growth weakens pricing
Cautious FY17 guidance – fares lower

12
Even lower fares, more primary airports
New interiors (more legroom) & uniforms
Leisure Plus & better Business Plus
Travel extras in app & ‘one-flick’ pay
Rate my flight feature / Auto check-in
Events & restaurant discounts
New groups website & schools travel
A lways Gett ing Better – Year 3
13
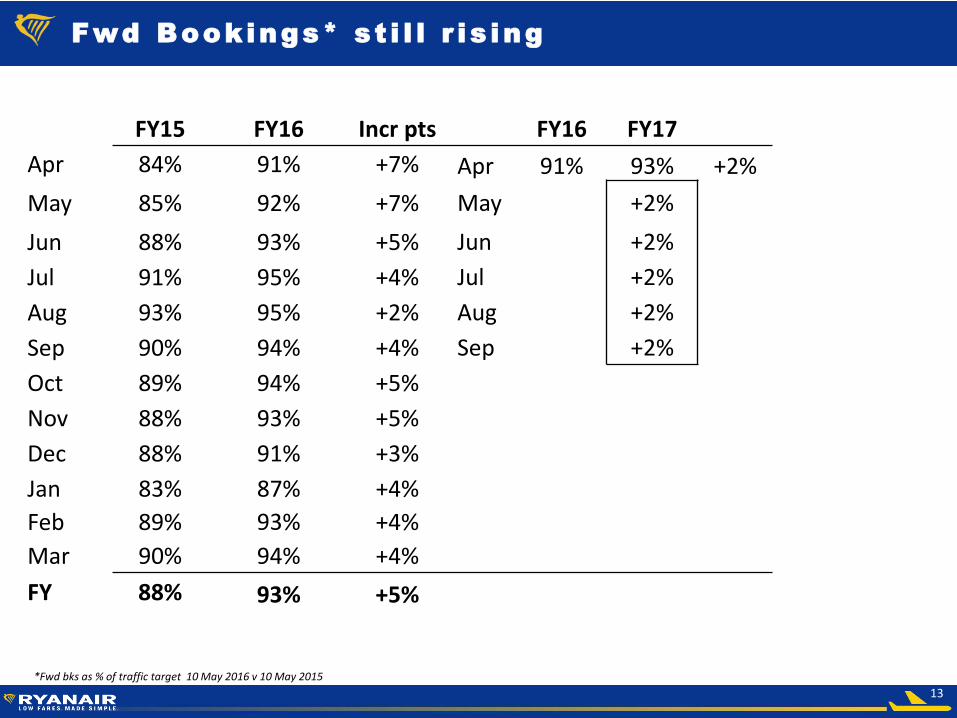
Fwd Bookings* s t i l l r i s ing
FY15 FY16 Incr pts FY16 FY17
Apr 84% 91% +7% Apr 91% 93% +2%
May 85% 92% +7% May +2%
Jun 88% 93% +5% Jun +2%
Jul 91% 95% +4% Jul +2%
Aug 93% 95% +2% Aug +2%
Sep 90% 94% +4% Sep +2%
Oct 89% 94% +5%
Nov 88% 93% +5%
Dec 88% 91% +3%
Jan 83% 87% +4%
Feb 89% 93% +4%
Mar 90% 94% +4%
FY 88% 93% +5%
*Fwd bks as % of traffic target 10 May 2016 v 10 May 2015
14
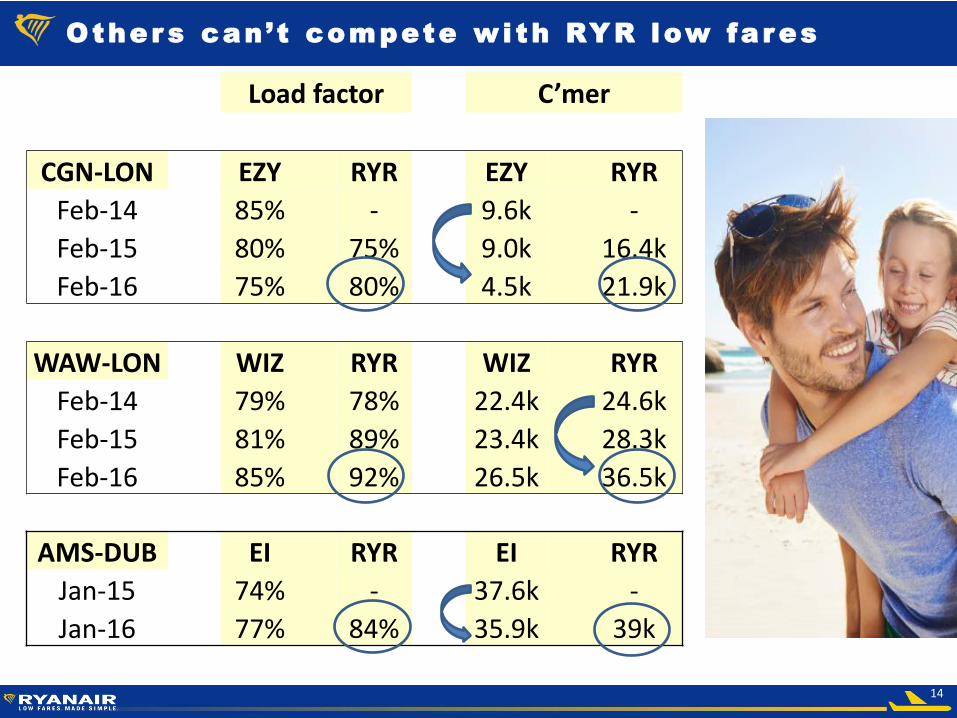
Other s can’ t compete wi th RYR low fares
Load factor C’mer
CGN-LON EZY RYR EZY RYR
Feb-14 85% - 9.6k -
Feb-15 80% 75% 9.0k 16.4k
Feb-16 75% 80% 4.5k 21.9k
WAW-LON WIZ RYR WIZ RYR
Feb-14 79% 78% 22.4k 24.6k
Feb-15 81% 89% 23.4k 28.3k
Feb-16 85% 92% 26.5k 36.5k
AMS-DUB EI RYR EI RYR
Jan-15 74% - 37.6k -
Jan-16 77% 84% 35.9k 39k
15
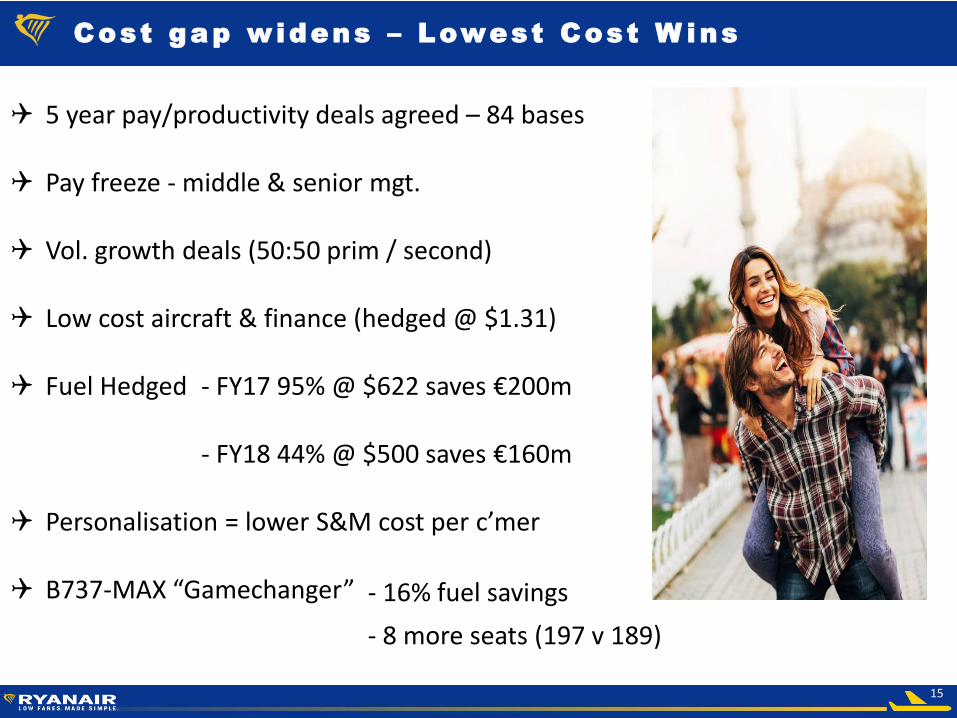
Cost gap widens – Lowest Cost W ins
5 year pay/productivity deals agreed – 84 bases
Pay freeze - middle & senior mgt.
Vol. growth deals (50:50 prim / second)
Low cost aircraft & finance (hedged @ $1.31)
Fuel Hedged - FY17 95% @ $622 saves €200m
- FY18 44% @ $500 saves €160m
Personalisation = lower S&M cost per c’mer
B737-MAX “Gamechanger”
- 16% fuel savings
- 8 more seats (197 v 189)
16
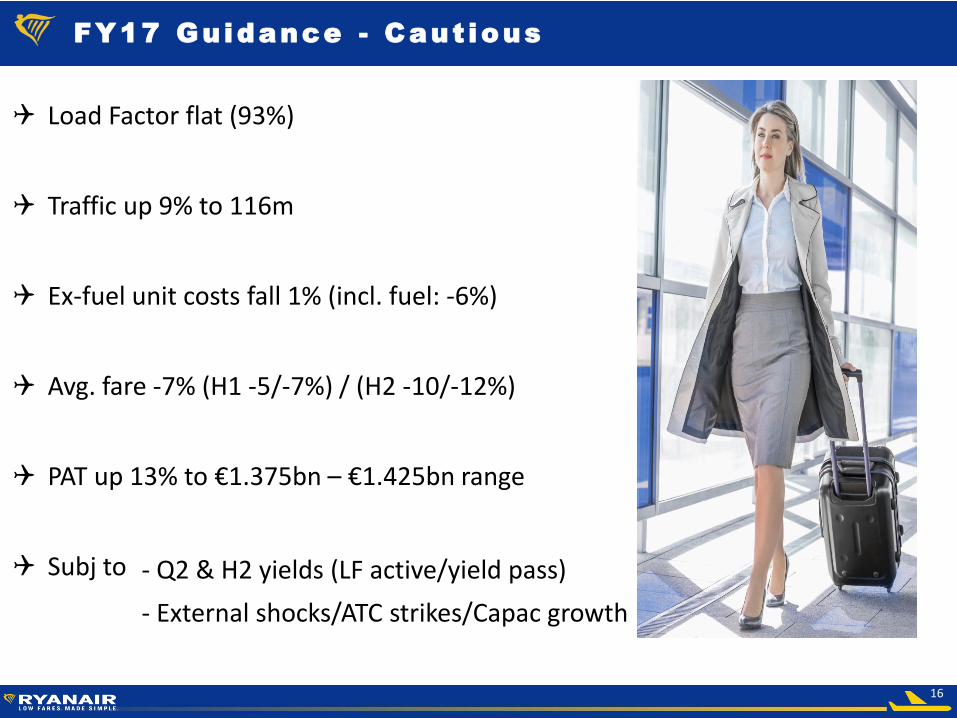
FY17 Guidance - Caut ious
Load Factor flat (93%)
Traffic up 9% to 116m
Ex-fuel unit costs fall 1% (incl. fuel: -6%)
Avg. fare -7% (H1 -5/-7%) / (H2 -10/-12%)
PAT up 13% to €1.375bn – €1.425bn range
Subj to
- Q2 & H2 yields (LF active/yield pass)
- External shocks/ATC strikes/Capac growth

17
Appendices
Appendices
18
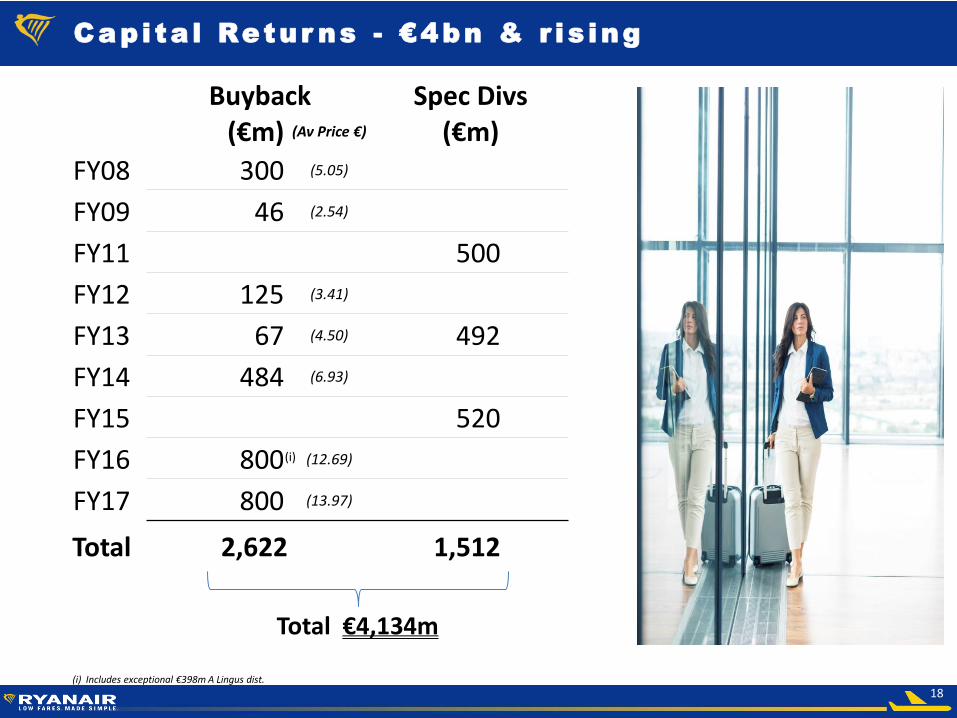
Cap i ta l Retur ns - €4bn & r is ing
Buyback Spec Divs (€m) (Av Price €) (€m)
FY08 300 (5.05)
FY09 46 (2.54)
FY11 500
FY12 125 (3.41)
FY13 67 (4.50) 492
FY14 484 (6.93)
FY15 520
FY16 800 (12.69)
FY17 800 (13.97)
Total 2,622 1,512
Total €4,134m
(i)
(i) Includes exceptional €398m A Lingus dist.

19
On l y 3 EZ bases not ser ved (S . 2016)
EZ base (by size) FR Base FR Dest. (FY 17 Growth)
1 London LGW (83%)
2 Milan Malpensa (new) (100%)
3 Geneva
4 London LTN (18%)
5 Amsterdam (135%)
6 Paris – CDG BVA
7 Berlin – SXF (new) (100%)
8 Basel
9 Bristol (18%)
10 Belfast (new) (100%)
11 Nice
12 Edinburgh (17%)
13 Barcelona (14%)
14 Manchester (30%)
15 Paris – Orly BVA
16 London – STN (5%)
17 Palma Mallorca (15%)
18 Lyon
19 Naples
20 Liverpool (6%)
21 Venice - Marco Polo TSF (9%)
22 Toulouse (100%)
23 Lisbon (4%)
24 Glasgow Intl. (21%)
25 Hamburg (new) (251%)
26 Porto (5%)
27 Newcastle (140%)
28 London Southend STN (5%)
RYR v EZ City Pairs S’16
40% EZ network competes with RYR
20% RYR network competes with EZJ
20
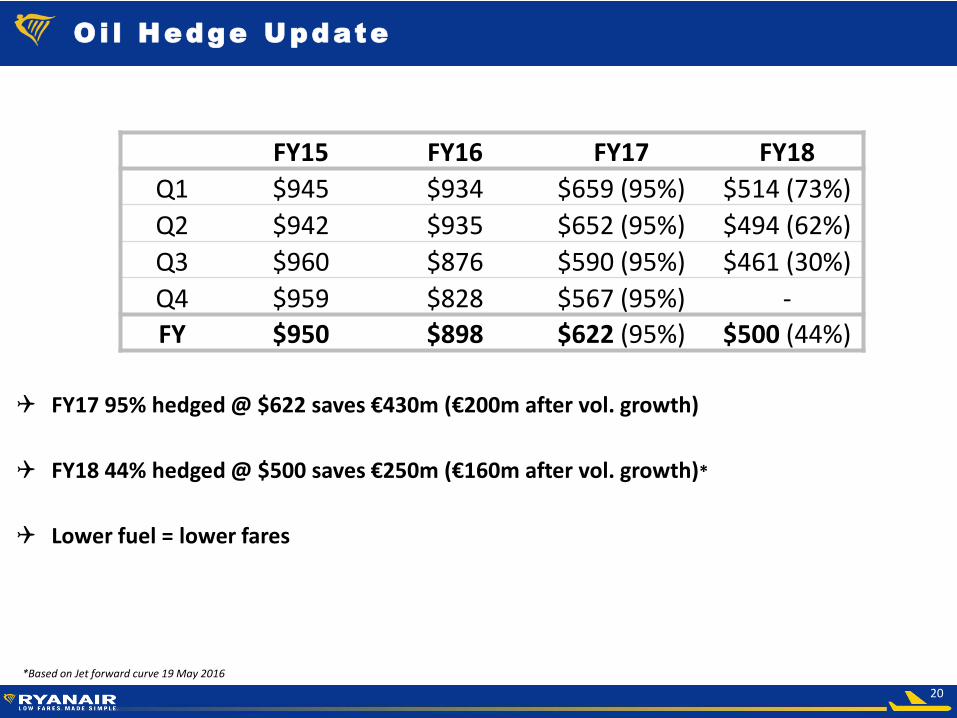
O i l Hedge Update
FY17 95% hedged @ $622 saves €430m (€200m after vol. growth)
FY18 44% hedged @ $500 saves €250m (€160m after vol. growth)*
Lower fuel = lower fares
FY15 FY16 FY17 FY18
Q1 $945 $934 $659 (95%) $514 (73%)
Q2 $942 $935 $652 (95%) $494 (62%)
Q3 $960 $876 $590 (95%) $461 (30%)
Q4 $959 $828 $567 (95%) -
FY $950 $898 $622 (95%) $500 (44%)
*Based on Jet forward curve 19 May 2016

21
Certain of the information included in this presentation is forward looking and is subject to important risks and uncertainties that could cause actual results and developments to differ materially from those expressed in or implied by such forward-looking statements. By their nature, forward-looking statements involve risk and uncertainty because they relate to events and depend upon future circumstances that may or may not occur. A number of factors could cause actual results and developments to differ materially from those express or implied by the forward-looking statements including those identified in this presentation and other factors discussed in our Annual Report on Form 20-F filed with the SEC. It is not reasonably possible to itemise all of the many factors and specific events that could affect the outlook and results of an airline operating in the European economy. Among the factors that are subject to change and could significantly impact Ryanair’s expected results are the airline pricing environment, fuel costs, competition from new and existing carriers, market prices for the replacement aircraft, costs associated with environmental, safety and security measures, actions of the Irish, U.K., European Union (“EU”) and other governments and their respective regulatory agencies, fluctuations in currency exchange rates and interest rates, airport access and charges, labour relations, the economic environment of the airline industry, the general economic environment in Ireland, the UK and Continental Europe, the general willingness of passengers to travel and other economics, social and political factors and flight interruptions caused by volcanic ash emissions or other atmospheric disruptions. These and other factors could adversely affect the outcome and financial effects of events or developments referred to in this presentation on the Ryanair Group. Forward looking statements contained in this presentation based on trends or activities should not be taken as a representation that such trends or activities will continue in the future. Except as may be required by the Market Abuse Rules of the Central Bank of Ireland, Listing Rules of the Irish Stock Exchange or by any other rules of any applicable regulatory body or by law, the Company disclaims any obligation or undertaking to release publicly any updates or revisions to any forward statements contained herein to reflect any changes in the Company’s expectations with regard to any change in events, conditions or circumstances on which any such statement is based. This presentation contains certain forward-looking statements as defined under US legislation. By their nature, such statements involve uncertainty; as a consequence, actual results and developments may differ from those expressed in or implied by such statements depending on a variety of factors including the specific factors identified in this presentation and other factors discussed in our Annual Report on Form 20-F filed with the SEC
Discla imer