FY 2016 Financial Results Presentation
21
Dom Development S.A. 2016 Results Presentation 28 February 2017
-
Upload
dom-development-sa-investor-relations -
Category
Investor Relations
-
view
58 -
download
0
Transcript of FY 2016 Financial Results Presentation

Dom Development S.A.
2016 Results Presentation 28 February 2017

2016
• Net profit of PLN 125.7m (+56% YoY)
• Record-high sales of 2 735 units (+15% YoY)
and handovers of 2 482 units (+20% YoY)
• Average transaction value of PLN 512k in 2016 - a result of a shift up-market
• Net operating Cash Flow of PLN 265m
• High cash levels (PLN 437m) and no net debt as of 31.12.2016
2

Residential Market
• Strong sales with prices slightly increasing
• Supply and demand still balanced
• Record low interest rates support demand
• Increasing share of cash buyers – approx. 40% of overall
transactions at Dom Development
• High competition on land market
3
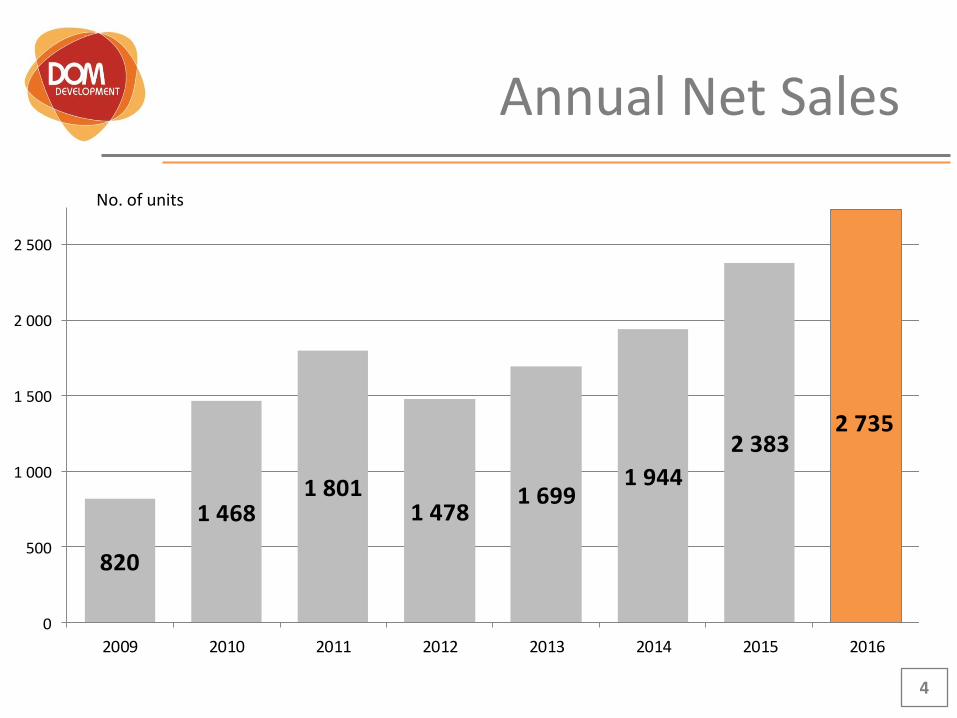
820
1 4681 801
1 4781 699
1 944
2 3832 735
0
500
1 000
1 500
2 000
2 500
2009 2010 2011 2012 2013 2014 2015 2016
Annual Net Sales
4
No. of units

Quarterly Net Sales
5
407
483509
545
467
598640
678
615
701 705 714
0
100
200
300
400
500
600
700
I kw. 2014 II kw. 2014 III kw. 2014 IV kw. 2014 I kw. 2015 II kw. 2015 III kw. 2015 IV kw. 2015 I kw. 2016 II kw. 2016 III kw. 2016 IV kw. 2016
No. of units

6
37% 30% 28% 25% 21%
32% 38%
37% 32%
23%
17% 16% 18%
22%
24%
14% 16% 18% 21% 32%
0%
10%
20%
30%
40%
50%
60%
70%
80%
90%
100%
2012 2013 2014 2015 2016
up to PLN 350k 350-450k 450-550k over PLN 550k
Sales segmentation based on transaction value
* Transaction value includes price of a flat with fit-out (if purchased), storage room (if purchased) and parking place (if purchased).

1 621 1 555 1 545 1 679 2 022
1 696 2 104
219 242 496 261
312 557
402
-
500
1 000
1 500
2 000
2 500
31/12/2010 1 840
31/12/2011 1 797
31/12/2012 2 041
31/12/2013 1 940
31/12/2014 2 334
31/12/2015 2 253
31/12/2016 2 506
Units under construction Finished units
Dom’s Offer
7
As of 31/12/2016 Dom’s offer includes units in 15 Warsaw and 2 Wroclaw sites
No. of units

New construction starts
8
Liczba lokali
2 projekty 3 projekty 2 projekty 4 projekty 4 projekty 7 projektów 1 projekt 3 projekty
2 199
1 716 1 7211 892 1 960
2 403
Q1: 426
Q2:1 349
Q3: 557
Q4:555
0
500
1 000
1 500
2 000
2 500
3 000
2010 2011 2012 2013 2014 2015 2016
2016: 2 887 units in 19 projects
10 projects
10 projects
12 projects
11 projects
13 projects
12 projects
No. of units

Units under construction and in preparation
2 989 2 153
3 029 2 927 2 958 3 543
8 190
7 152 6 360
4 672
6 504 6 450
0
1 000
2 000
3 000
4 000
5 000
6 000
7 000
8 000
31/12/2011 31/12/2012 31/12/2013 31/12/2014 31/12/2015 31/12/2016
Under construction In preparation
9
No. of units

Handovers
10
Units sold but not delivered (presales)
31.12.2015 31.12.2016
1 427 units
1 680 units, including
• 241 finished units • 1 439 units under construction
707
1 313
2 0111 594
1 996 2 0622 482
0
500
1 000
1 500
2 000
2 500
2010 2011 2012 2013 2014 2015 2016
No. of units

11
Cumulative net sales to be recognized in P&L
PLN m
200
300
400
500
600
700
800
900
1 000
1 100
I II III IV V VI VII VIII IX X XI XII I II III IV V VI VII VIII IX X XI XII I II III IV V VI VII VIII IX X XI XII I II III IV V VI VII VIII IX X XI XII
2013 2014 2015 2016
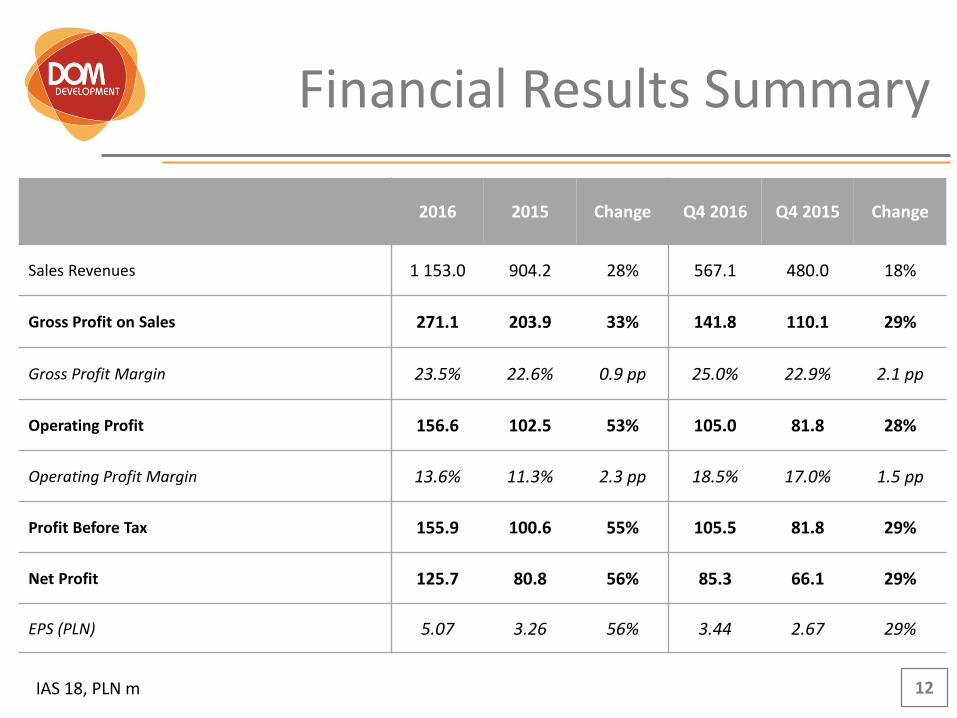
Financial Results Summary
2016 2015 Change Q4 2016 Q4 2015 Change
Sales Revenues 1 153.0 904.2 28% 567.1 480.0 18%
Gross Profit on Sales 271.1 203.9 33% 141.8 110.1 29%
Gross Profit Margin 23.5% 22.6% 0.9 pp 25.0% 22.9% 2.1 pp
Operating Profit 156.6 102.5 53% 105.0 81.8 28%
Operating Profit Margin 13.6% 11.3% 2.3 pp 18.5% 17.0% 1.5 pp
Profit Before Tax 155.9 100.6 55% 105.5 81.8 29%
Net Profit 125.7 80.8 56% 85.3 66.1 29%
EPS (PLN) 5.07 3.26 56% 3.44 2.67 29%
12 IAS 18, PLN m

Balance Sheet and Profitability
13
Consolidated Balance Sheet IAS 18, PLN m 31.12.2016 31.12.2015 Change
Shareholders’ funds (equity) 929.5 883.4 5%
Net debt* (57.1) 144.6 (139)%
Gearing (net debt/equity) (6.1)% 16.4% (22.5) pp
Net asset value per share (PLN) 37.50 35.66 5%
Shares in issue (m) 24.8 24.8 -
ROE 14.2% 9.4% 4.8 pp
ROCE 13.2% 8.2% 5.0 pp
*Bank debt plus bonds in issue less cash at banks (including escrow accounts)

Dividends
14
0,15
2,04
0,80 0,80 0,90 1,50
3,68
2,20 2,25
3,25
5,05*
0,1%
3,3%
2,1% 1,5%
1,9%
4,9%
8,5%
4,4% 4,5%
6,3%
0,0%
1,0%
2,0%
3,0%
4,0%
5,0%
6,0%
7,0%
8,0%
9,0%
0,00
1,00
2,00
3,00
4,00
5,00
2006 2007 2008 2009 2010 2011 2012 2013 2014 2015 2016
3% 25% 14% 23% 56% 45% 100% 100% 100% 100% 100%
Dividend Yield
*Managment Board’s Recommendation % of net profit
According to the Dividend Policy in place from 3 April 2013, the Company pays as dividends 100% of its consolidated net profit, starting
with the net profit for the year 2012. The Management Board plans to maintain this dividend policy even if the acquisition of the Euro
Styl Capital Group housing business takes place.
Dividend per share (PLN)
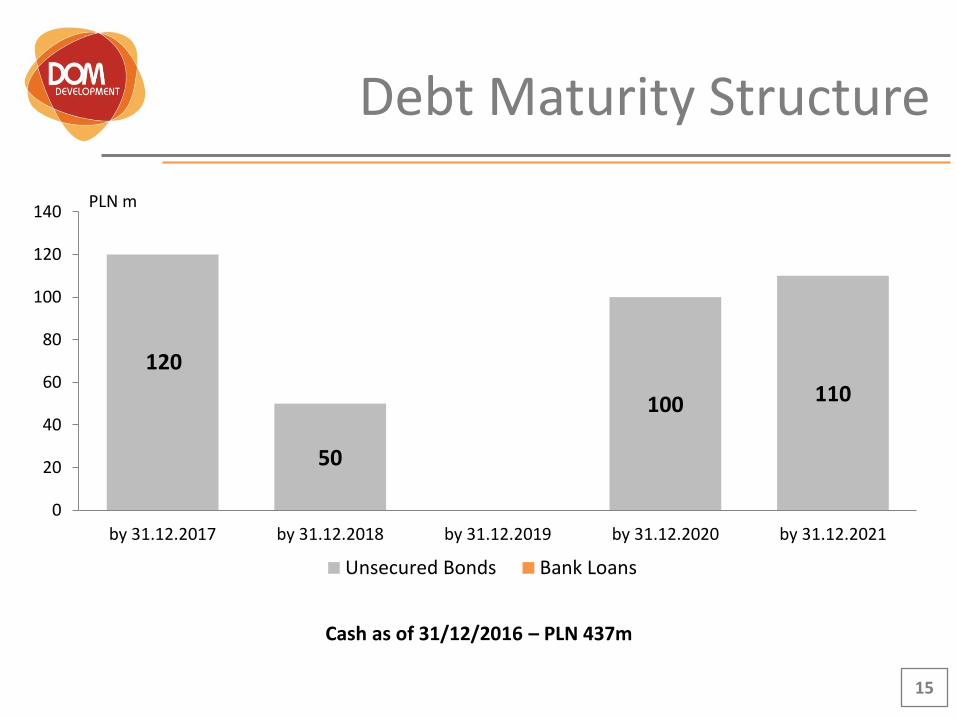
Debt Maturity Structure
15
120
50
100 110
0
20
40
60
80
100
120
140
by 31.12.2017 by 31.12.2018 by 31.12.2019 by 31.12.2020 by 31.12.2021
Unsecured Bonds Bank Loans
PLN m
Cash as of 31/12/2016 – PLN 437m

2016
16
Summary:
Net profit of PLN 125.7m (+56% YoY)
Record-high sales of 2 735 units (+15% YoY) and handovers of 2 482 units (+20% YoY)
Commencement of 19 new projects with 2 887 units
Record-high number of locations in the offer (Warsaw - 15, Wroclaw - 2)
Land bank diversification by project location, scale and segment
Cooperation with the best general contractors – all 12 project completions planned for
2016 were on time or ahead of schedule
Strong balance sheet - PLN 437m of cash and no net debt
Consistent dividend policy – recommendation of 100% of the net profit payment for the
fifth consecutive time

Appendices

18
NO PROJECT UNDER
CONTRUCTION
IN PREPARATIO
N
1 ŻOLIBORZ ARTYSTYCZNY 403 ---
2 PREMIUM 576 361
3 OS. PRZYJACIÓŁ 95 ---
4 WŁODARZEWSKA 30 (NOWOSOLIPSOWSKA)
123 ---
5 OS. POD RÓŻAMI III 50 ---
6 PRZY PARKU --- 46
7 MARINA MOKOTÓW --- 731
8 APARTAMENTY MOKOTÓW NAD SKARPĄ (BUKOWIŃSKA II)
184 ---
9 BUKOWIŃSKA III --- 190
10 CYBERNETYKI --- 633
11 TANECZNA 119 ---
12 URSYNOVIA (ANODY) 190 ---
13 SOBIESKIEGO --- 153
TOTAL LEFT BANK 1 740 2 114
NO PROJECT UNDER
CONTRUCTION IN
PREPARATION
14 REGATY --- 217
15 PALLADIUM (AKACJE) 214 566
16 KLASYKÓW 204 ---
17 KOWALCZYKA --- 792
18 MODERNA 554 184
19 AMSTERDAM (SAMARYTANKA)
60 514
20 WILNO 240 1 556
21 FORMA (MOTOROWA)
--- 507
22 SASKA III 359 ---
TOTAL RIGHT BANK 1 631 4 336
Warsaw
TOTAL UNDER
CONSTRUCTION IN PREPARATION FINISHED
WARSAW 3 371 6 450 26 176
WROCŁAW (AURA PROJCET)
172 --- 721
DOM 3 543 6 450 26 897
1 2
4 5
12
9
15 16
22
14
17 18
20
21
7 6
13
11
3
10 8
19
Appendix 1:
Projects Under Construction and in Preparation no. of units, as of 31/12/2016
PROJECT IN PREPARATION
PROJECT UNDER CONSTRUCTION

19
Project No. of units in project Commencement of handovers
Q2
Moderna etap 1 171 May 2017
Premium etap 1 206 May2017
Apartamenty Mokotów nad Skarpą 184 June 2017
Q3 Osiedle Przyjaciół etap 3 95 August 2017
Palladium etap 1 214 September 2017
Q4
Premium etap 2 236 October 2017
Ursynovia etap 1 79 October 2017
Ursynovia etap 2 111 October 2017
Moderna etap 2 194 November 2017
Osiedle Pod Różami etap 3 50 November 2017
Saska III 359 November 2017
Żoliborz Artystyczny etap 5 126 November 2017
Żoliborz Artystyczny etap 6 137 November 2017
Żoliborz Artystyczny etap 7 140 November 2017
Wille Taneczna 119 December 2017
Wilno III etap 2 129 December 2017
Wilno III etap 3 111 December 2017
Appendix 2:
Commencement of handovers in 2017

5 January 2017 – Dom Development S.A. obtained an exclusivity until 30 June 2017 to conduct negotiations concerning the purchase of the housing development segment of the Euro Styl Capital Group
Euro Styl is one of the Tri-City market leaders
20
661 units sold in 2016 (+24% YoY)
527 unit offer as of 31.12.2016
1 800 unit land bank as of 31.12.2016
10 years in housing development
3 803 units sold to date
Appendix 3:
Tri-City expansion plans

21
For further information, please contact: Magdalena Cumanis Investor Relations
tel. +48 22 351 68 49 e-mail: [email protected] www.inwestor.domd.pl
Dom Development S.A. endeavours to ensure that the information in the presentation is complete. up-to-date and accurate. However. we do not make any guarantees in this respect. Dom Development S.A. connot accept responsibilty for the consequences of using such information. and in particular any loss caused by reliance thereon for the purpose of investment decisions. The material contained in the presentation originates from reliable public sources and to the best knowledge of Dom Development S.A. may be considered reliable.