FY 2013 RESULTS AND REVIEW - Julius Baer
43
Presentation for Investors, Analysts & Media Zurich, 3 February 2014 FY 2013 RESULTS AND REVIEW
Transcript of FY 2013 RESULTS AND REVIEW - Julius Baer

Presentation for Investors, Analysts & MediaZurich, 3 February 2014
FY 2013 RESULTS AND REVIEW

Forward-looking statementsThis presentation by Julius Baer Group Ltd. (“the company”) includes forward-looking statements that reflect the company's intentions, beliefs or current expectations and projections about the company's future results of operations, financial condition, liquidity, performance, prospects, strategies, opportunities and the industries in which it operates. Forward-looking statements involve all matters that are not historical fact. The company has tried to identify those forward-looking statements by using the words "may", "will", "would", "should", "expect", "intend", "estimate", "anticipate", "project", "believe", "seek", "plan", "predict", "continue" and similar expressions. Such statements are made on the basis of assumptions and expectations which, although the company believes them to be reasonable at this time, may prove to be erroneous.
These forward-looking statements are subject to risks, uncertainties and assumptions and other factors that could cause the company's actual results of operations, financial condition, liquidity, performance, prospects or opportunities, as well as those of the markets it serves or intends to serve, to differ materially from those expressed in, or suggested by, these forward-looking statements. Important factors that could cause those differences include, but are not limited to: changing business or other market conditions; legislative, fiscal and regulatory developments; general economic conditions in Switzerland, the European union and elsewhere; and the company's ability to respond to trends in the financial services industry. Additional factors could cause actual results, performance or achievements to differ materially. In view of these uncertainties, readersare cautioned not to place undue reliance on these forward-looking statements. The company and its subsidiaries, its directors, officers, employees and advisors expressly disclaim any obligation or undertaking to release any update of or revisions to any forward-looking statements in this presentation and these materials and any change in the company’s expectations or any change in events, conditions or circumstances on which these forward-looking statements are based, except as required by applicable law or regulation.
2
Financial informationThis presentation contains certain pro forma financial information. This information is presented for illustrative purposes only and, because of its nature, may not give a true picture of the financial position or results of operations of the company. Furthermore, it is not indicative of the financial position or results of operations of the company for any future date or period.
By attending this presentation or by accepting any copy of the materials presented,you agree to be bound by the foregoing limitations.
Ratings informationThis statement may contain information obtained from third parties, including ratings from rating agencies such as Standard & Poor’s, Moody’s, Fitch and other similar rating agencies. Reproduction and distribution of third-party content in any form is prohibited except with the prior written permission of the related third-party. Third-party content providers do not guarantee the accuracy, completeness, timeliness or availability of any information, including ratings, and are not responsible for any errors or omissions (negligent or otherwise), regardless of the cause, or for the results obtained from the use of such content. Third-party content providers give no express or implied warranties, including, but not limited to, any warranties of merchantability or fitness for a particular purpose or use. Third-party content providers shall not be liable for any direct, indirect, incidental, exemplary, compensatory, punitive, special or consequential damages, costs, expenses, legal fees, or losses (including lost income or profits and opportunity costs) in connection with any use of their content, including ratings.Credit ratings are statements of opinions and are not statements of fact or recommendations to purchase, hold or sell securities. They do not address the market value of securities or the suitability of securities for investment purposes, and should not be relied on as investment advice.
CAUTIONARY STATEMENT ON FORWARD-LOOKING INFORMATION
FY 2013 Results and Review, 3 February 2014
IntroductionBoris F.J. Collardi, CEO
Financial Results FY 2013Dieter A. Enkelmann, CFO
IWM Integration: Finance UpdateDieter A. Enkelmann, CFO
Business UpdateBoris F.J. Collardi, CEO
Q&A Session
Appendices
3
CONTENT

FY 2013 Results and Review, 3 February 2014
RE-BRANDING JULIUS BAER
4
Combining innovation and tradition
Rationale• Substantial growth in terms of
international reach• New international reference in pure
private banking• Innovative new visual identity • Taking strong tradition into account• Even closer to our clients
Visual conceptSingularity of purpose captured in creative platform ‘Purity’, reflecting• Absolute essence of who we are• Closeness of our relationships• Clarity of insights• Strong Swiss heritage
• Staggered roll-out in 2014
FY 2013 Results and Review, 3 February 2014
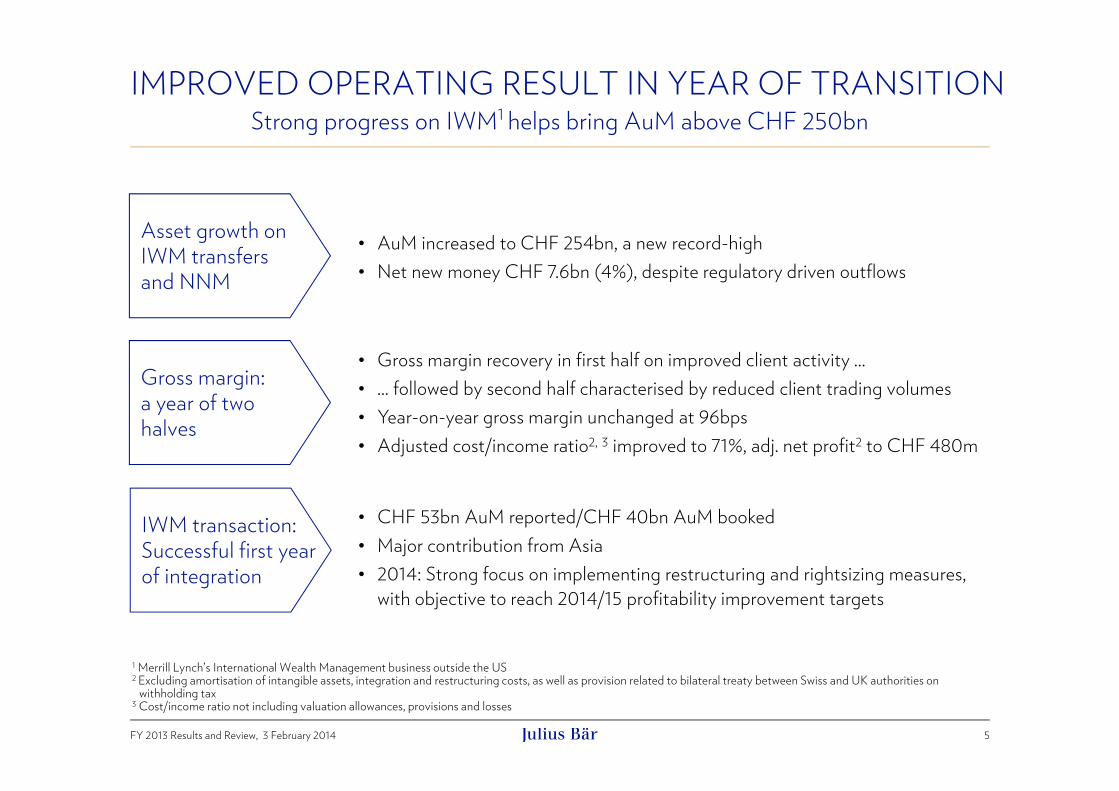
IMPROVED OPERATING RESULT IN YEAR OF TRANSITION
5
Strong progress on IWM1 helps bring AuM above CHF 250bn
Asset growth on IWM transfersand NNM
Gross margin: a year of two halves
• AuM increased to CHF 254bn, a new record-high• Net new money CHF 7.6bn (4%), despite regulatory driven outflows
• Gross margin recovery in first half on improved client activity …• … followed by second half characterised by reduced client trading volumes• Year-on-year gross margin unchanged at 96bps• Adjusted cost/income ratio2, 3 improved to 71%, adj. net profit2 to CHF 480m
IWM transaction:Successful first yearof integration
• CHF 53bn AuM reported/CHF 40bn AuM booked• Major contribution from Asia • 2014: Strong focus on implementing restructuring and rightsizing measures,
with objective to reach 2014/15 profitability improvement targets
1 Merrill Lynch’s International Wealth Management business outside the US2 Excluding amortisation of intangible assets, integration and restructuring costs, as well as provision related to bilateral treaty between Swiss and UK authorities on
withholding tax3 Cost/income ratio not including valuation allowances, provisions and losses

FY 2013 Results and Review, 3 February 2014
IWM INTEGRATION UPDATE
6
Very satisfactory result after the first year of integration
Key achievements in 2013
• Successfully completed transfer process in Hong Kong and Singapore• Close to half of AuM booked at year end from Asia • Asia now represents almost quarter of Group AuM
• EMEA generally on target• LatAm so far slower than expected, but improving
momentum towards year-end• Overall CHF 53bn AuM reported/CHF 40bn AuM
booked & paid• 365 financial advisers joined so far• Local transaction closings took place in 151 locations• Promising first year of leveraging strategic cooperation
agreement with Bank of America Merrill Lynch
Focus topics going forward
• Successfully complete asset transfers• Integrate the remaining IWM
locations • Increase overall profitability of
onboarded assets • Realise the identified synergies • Turn organisation’s focus from
transition back to business • Expected to achieve target, towards
lower end of CHF 57 – 72bn
1 Merrill Lynch Bank Switzerland (Geneva and Zurich), Uruguay, Chile, Luxembourg, Monaco, Hong Kong, Singapore, UK, Spain, Israel, Panama, Bahrain, Lebanon, UAE

FY 2013 Results and Review, 3 February 2014
IntroductionBoris F.J. Collardi, CEO
Financial Results FY 2013Dieter A. Enkelmann, CFO
IWM Integration: Finance UpdateDieter A. Enkelmann, CFO
Business UpdateBoris F.J. Collardi, CEO
Q&A Session
Appendices
7
CONTENT

FY 2013 Results and Review, 3 February 2014
SCOPE OF PRESENTATION OF FINANCIALSRestatement 2012
Financial results are presented as usual on the adjusted basis• Excluding integration and restructuring expenses and the amortisation of intangible assets
related to previous acquisitions or divestitures as well as in 2013 a provision in relation to the withholding tax treaty between Switzerland and the UK (CHF 29m before tax, CHF 22m after tax)
• Reconciliation from the IFRS results to the adjusted results is outlined on slide 36• Please refer to the Consolidated Financial Statements1 for the full IFRS results
Restatement 2012• Revised IFRS accounting standards related to the Group’s pension plans (IAS 19 – Employee
Benefits) that became effective on 1 January 2013 and are described in the Group’s Consolidated Financial Statements1, resulted in a restatement of personnel and tax expenses and certain balance sheet items for the 2012 reporting period
• The final restated figures for 2012 differ from the preliminary 2012 restatement initially communicated with the presentation of the H1 2013 results on 22 July 2013
• Please refer to restated adjusted P&L for FY 2012, H1 2012, and H2 2012 on slides 15, 37 and 38
8
1 Available from www.juliusbaer.com
FY 2013 Results and Review, 3 February 2014
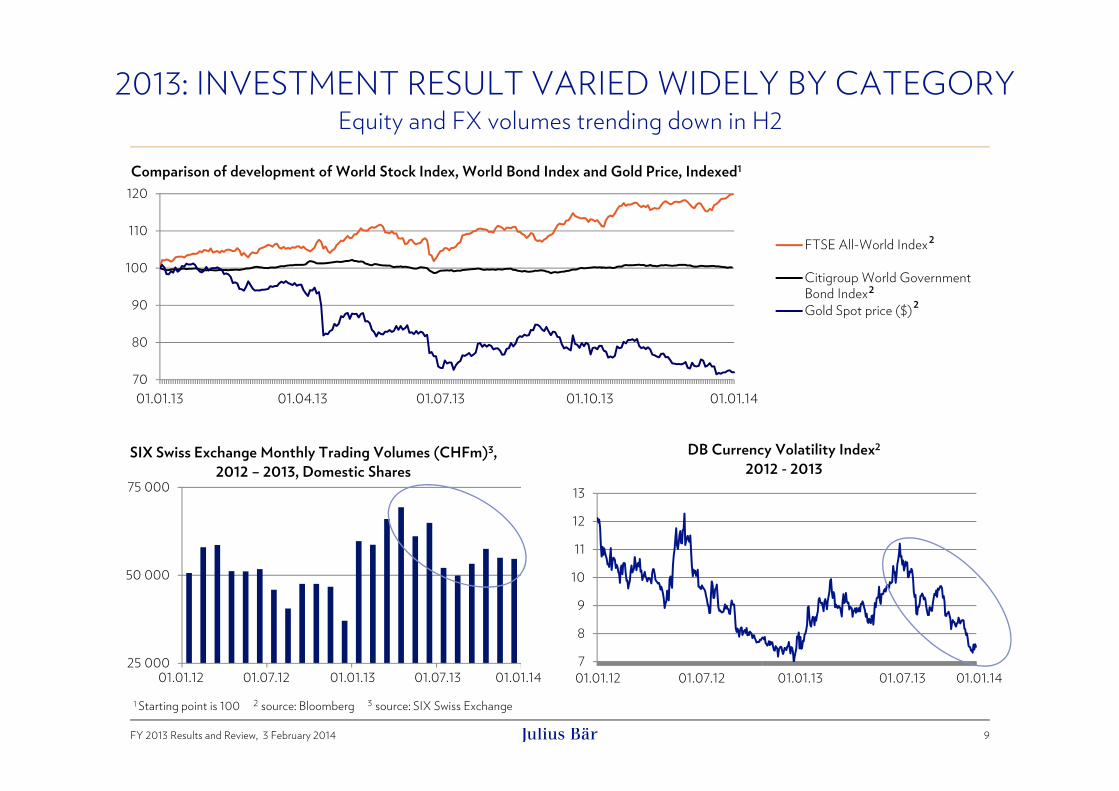
2013: INVESTMENT RESULT VARIED WIDELY BY CATEGORY
9
Equity and FX volumes trending down in H2
7
8
9
10
11
12
13
01/03/12 06/29/12 01/03/13 06/25/13 25 000
50 000
75 000
01.01.12 07.01.12 01.01.13 07.01.13
SIX Swiss Exchange Monthly Trading Volumes (CHFm)3, 2012 – 2013, Domestic Shares
DB Currency Volatility Index2
2012 - 2013
1 Starting point is 100 2 source: Bloomberg 3 source: SIX Swiss Exchange
Comparison of development of World Stock Index, World Bond Index and Gold Price, Indexed1
70
80
90
100
110
120
12/31/12 03/29/13 06/26/13 09/23/13 12/19/13
FTSE All-World Index
Citigroup World GovernmentBond IndexGold Spot price ($)
2
22
01.01.13 01.04.13 01.07.13 01.10.13 01.01.14
01.01.12 01.07.1301.01.13 01.01.1401.07.12 01.01.12 01.07.1301.01.13 01.01.1401.07.12
FY 2013 Results and Review, 3 February 2014
170.3
189.3
254.4
7.6
0.77.0 -3.052.8
December2011
December2012
Net NewMoney
IWM OtherAcquisitions/Divestment
MarketPerformance
CurrencyImpact
December2013
10
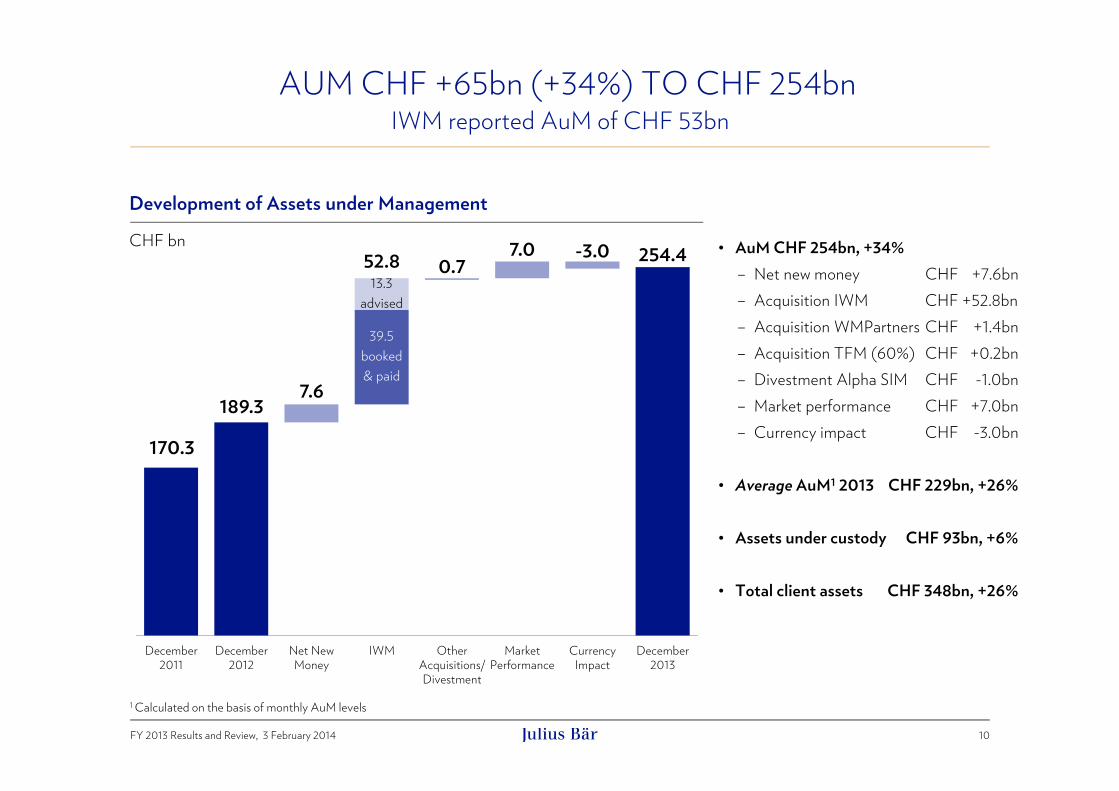
AUM CHF +65bn (+34%) TO CHF 254bnIWM reported AuM of CHF 53bn
• AuM CHF 254bn, +34%– Net new money CHF +7.6bn– Acquisition IWM CHF +52.8bn– Acquisition WMPartners CHF +1.4bn– Acquisition TFM (60%) CHF +0.2bn– Divestment Alpha SIM CHF -1.0bn– Market performance CHF +7.0bn– Currency impact CHF -3.0bn
• Average AuM1 2013 CHF 229bn, +26%
• Assets under custody CHF 93bn, +6%
• Total client assets CHF 348bn, +26%
Development of Assets under Management
CHF bn
13.3advised
39.5booked& paid
1 Calculated on the basis of monthly AuM levels
FY 2013 Results and Review, 3 February 2014
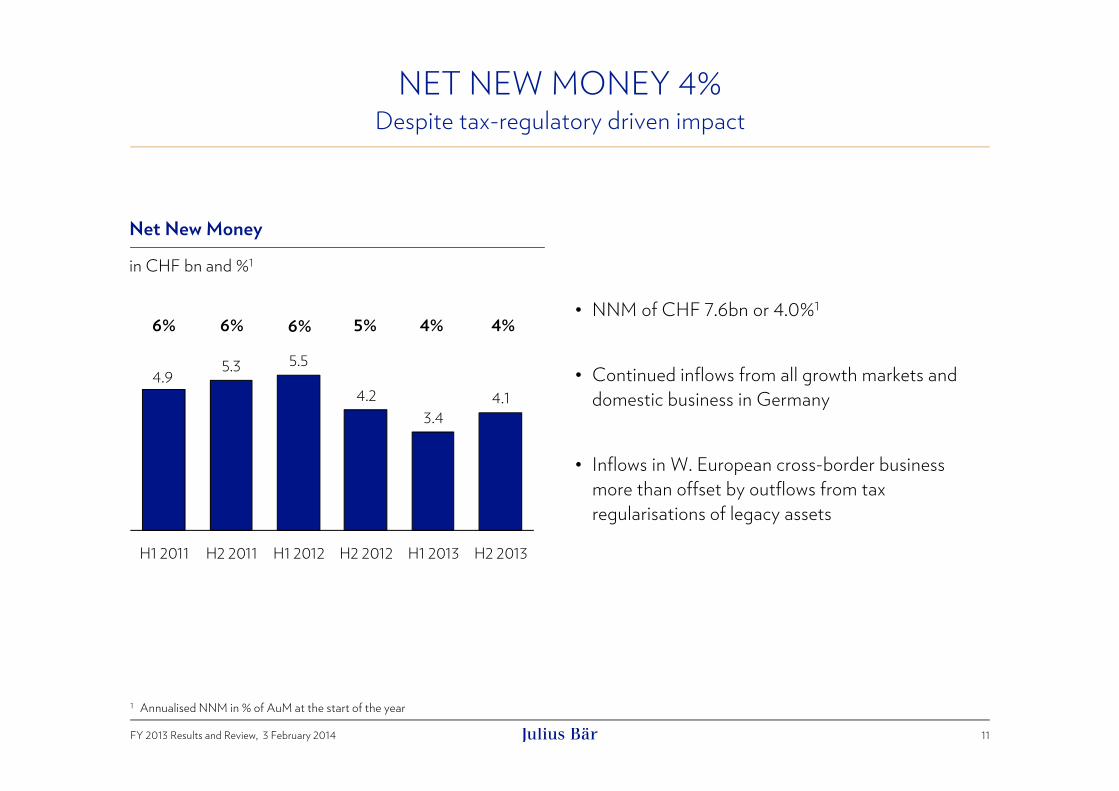
Net New Money
in CHF bn and %1
11
NET NEW MONEY 4%Despite tax-regulatory driven impact
1 Annualised NNM in % of AuM at the start of the year
6% 6% 4% 4%• NNM of CHF 7.6bn or 4.0%1
• Continued inflows from all growth markets and domestic business in Germany
• Inflows in W. European cross-border business more than offset by outflows from tax regularisations of legacy assets
4.9 5.3 5.5
4.23.4
4.1
H1 2011 H2 2011 H1 2012 H2 2012 H1 2013 H2 2013
6% 5%

FY 2013 Results and Review, 3 February 2014
942 9801,277
533 559
552269 173
3159 26
51
1,753 1,737
2,195
2011 2012 2013Net commission & fee income Net interest & dividend income
Net trading income Other ordinary results
CHF m
12
OPERATING INCOME +26% TO CHF 2,195mIn line with increase in average AuM
Net commission/fee +30% to CHF 1,277m• Mainly on increase in average AuM• Partly helped by allocated revenues from
BAML platform being booked under c&f income
Net interest/dividend income -1% to CHF 552m• Excluding dividend income on trading portfolios1,
underlying NII +10% …• … as increase in credit income was partly offset by
increased interest expense on debt issued and slightly lower treasury income
Net trading income +82% to CHF 315m• Crediting back dividend income on trading
portfolios1, underlying net trading income +33%
Other ordinary results doubled to CHF 51m• Includes a.o. income from associates (GPS, Kairos),
brand licensing income, rental income, gains onAFS disposals
+100%
+82%
-1%
+30%
vs. FY 12
+26%
1 Dividend income on trading portfolios CHF 38m (2012: CHF 93m, 2011: CHF 101m)

105bps
13
GROSS MARGIN1
Interest & trading income adjusted for dividends on trading portfolios2
• Net commission/fee income 56bps (+2bps)
• Net interest income2 22bps (-4bps)
• Net trading income2 15bps : unchanged year-on-year, but “year of two halves”: 21bps in H1, 11bps in H2
Gross margin
56 54 56
26 26 22
2215 15
11 2
FY 201196bps
FY 201296bps
FY 2013
Extrapolated split (in bps) H1 H2
FY 2013
Julius Baerstand-alone 102 96 99IWM 94 70 76Total 102 91 96
1 Operating income divided by period monthly average AuM in basis points. Average AuM for H2 2013 was CHF 246bn, up 33% compared to H2 2012 and up 16% from CHF 212bn in H1 2013
2 Net interest income adjusted to exclude dividends on trading portfolios, net trading income adjusted to include the same(H1 2011: CHF 97m, H2 2011: CHF 4m, H1 2012: CHF 90m, H2 2012: CHF 3m, H1 2013: CHF 33m, H2 2013: CHF 5m)
58 54 53 55 57 55
26 26 26 25 23 22
21 23 16 13 2111
12 1
23
105 104 98 94102
91
H1 2011 H2 2011 H1 2012 H2 2012 H1 2013 H2 2013
Net commission & fee income Net interest & dividend incomeNet trading income Other ordinary results
• IWM extrapolated H2 gross margin was negatively impacted by the preparations for the significant asset transfers that took place in that period

FY 2013 Results and Review, 3 February 2014
787 820984
360 349
5366566 79
911,279 1,247
1,611
2011 2012 2013
Personnel expenses General expensesGermany payment Depreciation/amortisation
14
OPERATING EXPENSES1 +29% TO CHF 1,611mExcluding swing in valuation allowances, provisions and losses: +24%
Personnel expenses +20% to CHF 984m• Avg #FTEs (relevant for adjusted result) +29%
mainly on transfer of IWM business
General expenses2 +54% to CHF 536m• Mainly due to IWM integration and swing in
valuation allowances, provisions and losses (excluding the latter: +34% to CHF 490m)
• Includes CHF 35m for US tax situation (2012: CHF 38m), of which CHF 15m as provisions for future legal costs
Cost/income ratio3 at 71% (2012: 73%)• Excluding costs related to US tax situation:
70% (2012: 71%)
NB: IWM rightsizing measures only started in Q42013, as planned
+29%+15%
+54%
+20%
vs. FY 12
(68.0%) (72.8%) (71.3%)(C/I )3
CHF m
2
1 Excluding amortisation of intangible assets, integration and restructuring costs, as well as provisionfor UK withholding tax. 2012 is restated for final assessment of the amended standard (IAS 19)
2 Including valuation allowances, provisions and losses3 Cost/income ratio not considering valuation allowances, provisions and losses
FY 2013 Results and Review, 3 February 2014 15
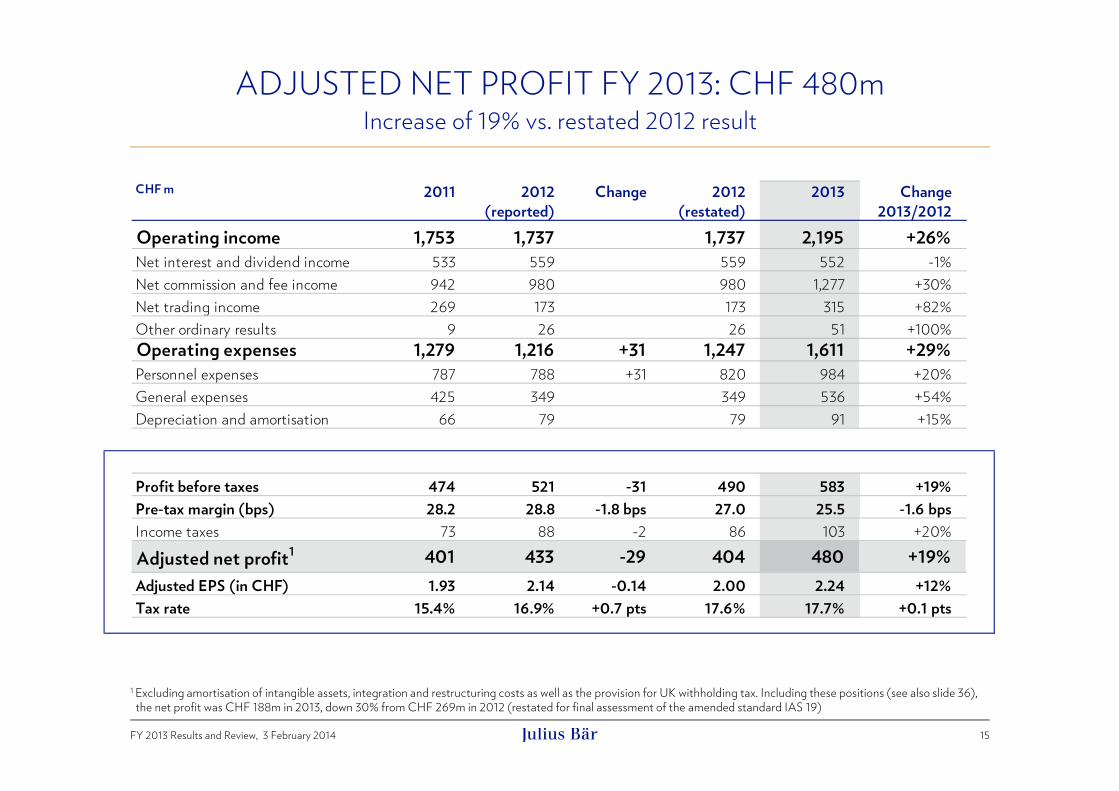
ADJUSTED NET PROFIT FY 2013: CHF 480mIncrease of 19% vs. restated 2012 result
CHF m 2011 2012(reported)
Change 2012(restated)
2013 Change2013/2012
Operating income 1,753 1,737 1,737 2,195 +26%Net interest and dividend income 533 559 559 552 -1%Net commission and fee income 942 980 980 1,277 +30%Net trading income 269 173 173 315 +82%Other ordinary results 9 26 26 51 +100%Operating expenses 1,279 1,216 +31 1,247 1,611 +29%Personnel expenses 787 788 +31 820 984 +20%General expenses 425 349 349 536 +54%Depreciation and amortisation 66 79 79 91 +15%
Profit before taxes 474 521 -31 490 583 +19%Pre-tax margin (bps) 28.2 28.8 -1.8 bps 27.0 25.5 -1.6 bpsIncome taxes 73 88 -2 86 103 +20%
Adjusted net profit1 401 433 -29 404 480 +19%Adjusted EPS (in CHF) 1.93 2.14 -0.14 2.00 2.24 +12%Tax rate 15.4% 16.9% +0.7 pts 17.6% 17.7% +0.1 pts
1 Excluding amortisation of intangible assets, integration and restructuring costs as well as the provision for UK withholding tax. Including these positions (see also slide 36),the net profit was CHF 188m in 2013, down 30% from CHF 269m in 2012 (restated for final assessment of the amended standard IAS 19)

FY 2013 Results and Review, 3 February 2014
2.1 5.02.2 3.1
10.2
13.1
4.8
5.9
51.6
27.5
8.011.5
16
SOLID BALANCE SHEET – LOW RISK PROFILEDeposits +32%, loans +39%, broadly in line with AuM growth
Assets Liabilities & EquityCHF 72.5bn
(CHF 54.8bn)Due from banks
(Open trading positions; repo)
Loans(Incl. lombard lending and
mortgages to private clients)
Trading portfolios
Financial investmentsavailable-for-sale
Cash
OthersGoodwill & other intangible assets Total equityOthers
Financial liabilities(Structured products volume)
Due to customers(Incl. client deposits)
Due to banks(Incl. open trading volumes and Group debt)
(6.0)
(19.8)
(4.1)
(11.8)
(9.6)
(1.9)(1.6)
(4.3)
(39.1)
(3.2)(3.6)(4.7)
Figures as at 31 December 2013, summarised and regrouped from Financial Statements. In brackets: figures as at 31 December 2012 (restated for IAS 19 revised)
Liability Driven
CHF bn
Loan-to-deposit ratio 0.53 (0.51)

22.4% BIS TOTAL CAPITAL RATIOUnchanged capital targets: total capital ratio > 15%; tier 1 ratio > 12%
17
For further details on capital and capital ratios please refer to slides 39 and 40 in the appendix
BIS approach / CHF m31.12.2012
Basel 2.531.12.2012
Basel III 2
pro forma
31.12.2013Basel III 2
31.12.2012Basel III
fully applied 4
31.12.2013Basel III
fully applied 4
Total risk-weighted positions 12,451 12,551 15,908 12,770 16,223CET1 capital 1 - 3,622 3,328 3,000 2,665Tier 1 capital 1 3,645 3,622 3,328 3,470 3,115Eligible total capital 1 3,940 3,893 3,561 3,788 3,399CET1 capital ratio 1 - 28.9% 20.9% 23.5% 16.4%Tier 1 capital ratio 1 29.3% 28.9% 20.9% 27.2% 19.2%Total capital ratio 1 31.6% 31.0% 22.4% 29.7% 21.0%
Tangible equity in % of total assets 5.6% 5.6% 4.0% 5.6% 4.0%Loan-to-deposit ratio 0.51 0.51 0.53 0.51 0.53Liquidity coverage ratio (LCR) 145.7% 145.7% 110.5% 145.7% 110.5%Net stable funding ratio (NSFR) 123.4% 123.2% 121.3% 122.7% 120.7%Leverage ratio 3 6.8% 6.7% 4.7% 6.4% 4.4%
1 After dividend2 In Switzerland the Basel III framework came into effect on 1 January 2013. The Basel III effects but also the effects of IAS 19-revised relating to pension liabilities will be
phased in between 2014 and 2018 for the calculation of the eligible capital. Furthermore, non-compatible Basel III tier 1 and tier 2 capital instruments will be phased out between 2013 and 2022 (2012 Basel III pro forma phased out as in 2013)
3 Basel III framework (tier 1 capital divided by the sum total of: on-balance sheet exposures net of provisions, minus derivatives and reverse repo exposures, plus securities financing transaction exposures netted, plus derivative exposures netted, plus off-balance sheet items)
4 Assuming that old-style capital instruments are replaced with Basel-III compliant instruments
FY 2013 Results and Review, 3 February 2014
IntroductionBoris F.J. Collardi, CEO
Financial Results FY 2013Dieter A. Enkelmann, CFO
IWM Integration: Finance UpdateDieter A. Enkelmann, CFO
Business UpdateBoris F.J. Collardi, CEO
Q&A Session
Appendices
18
CONTENT

FY 2013 Results and Review, 3 February 2014
• Asia: successfully completed transfer process in Hong Kong and Singapore:• Close to half of AuM booked at year-end from Asia• Asia now represents almost quarter of Group AuM
• EMEA generally on target• LatAm so far slower than expected, but improving
momentum towards year-end
• Expected to achieve target – towards lower end of CHF 57 - 72bn range, based on• Expected remaining local closings and transfers• Market and currency performance• Outflows from the BAML platform
– Small clients, excluded as agreed with BAML– Clients leaving with FAs– Clients not seeking private banking services– Compliance-driven non-acceptance
Applicable local closings of the transaction in 2013:• Feb: Merrill Lynch Bank Switzerland • April: Uruguay2, Chile2, Luxembourg2,
Monaco2
• May: Hong Kong3, Singapore3
• July: UK2, 3, Spain2, Israel3• Nov: Panama3
• Dec: Bahrain3, Lebanon2, UAE3
Expected in 2014:• France2, Ireland3, Netherlands3
• Italy3 (to Kairos)
Expected in early 2015:• India2
19
IWM: CHF 53bn AUM REPORTED / CHF 40bn AUM BOOKED1
Expected to achieve target, towards lower end of range
1 Booked = booked and paid2 Legal entity acquisition 3 Business transfer
FY 2013 Results and Review, 3 February 2014
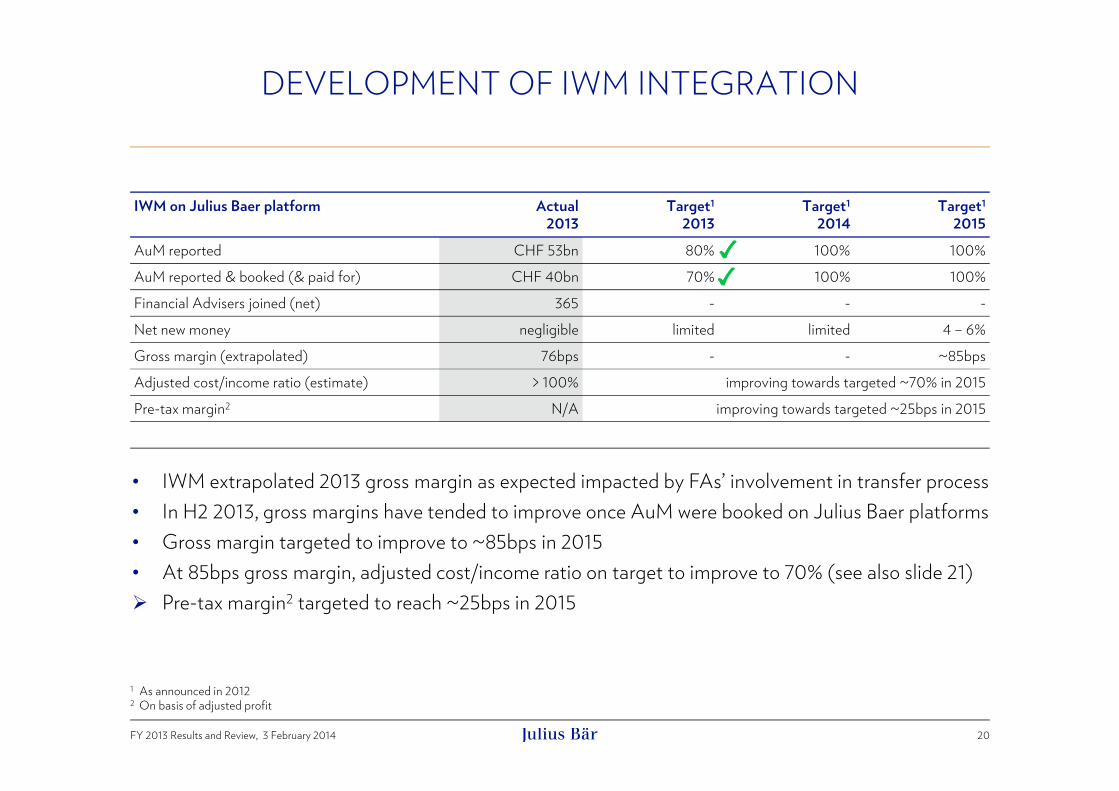
IWM on Julius Baer platform Actual2013
Target1
2013Target1
2014Target1
2015AuM reported CHF 53bn 80% 100% 100%AuM reported & booked (& paid for) CHF 40bn 70% 100% 100%Financial Advisers joined (net) 365 - - -Net new money negligible limited limited 4 – 6%Gross margin (extrapolated) 76bps - - ~85bpsAdjusted cost/income ratio (estimate) > 100% improving towards targeted ~70% in 2015Pre-tax margin2 N/A improving towards targeted ~25bps in 2015
20
DEVELOPMENT OF IWM INTEGRATION
1 As announced in 20122 On basis of adjusted profit
• IWM extrapolated 2013 gross margin as expected impacted by FAs’ involvement in transfer process• In H2 2013, gross margins have tended to improve once AuM were booked on Julius Baer platforms• Gross margin targeted to improve to ~85bps in 2015• At 85bps gross margin, adjusted cost/income ratio on target to improve to 70% (see also slide 21) Pre-tax margin2 targeted to reach ~25bps in 2015
FY 2013 Results and Review, 3 February 2014
TARGETED PROFITABILITY1 OF IWM INTEGRATION
21
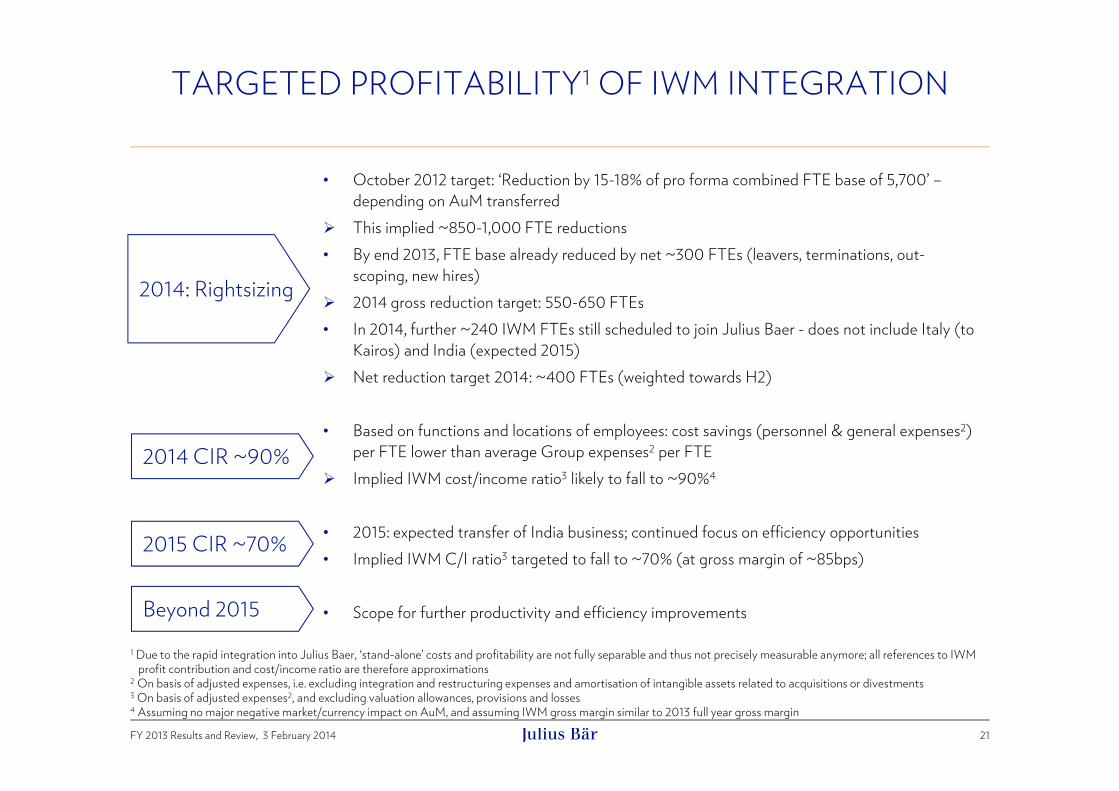
• October 2012 target: ‘Reduction by 15-18% of pro forma combined FTE base of 5,700’ –depending on AuM transferred
This implied ~850-1,000 FTE reductions• By end 2013, FTE base already reduced by net ~300 FTEs (leavers, terminations, out-
scoping, new hires) 2014 gross reduction target: 550-650 FTEs• In 2014, further ~240 IWM FTEs still scheduled to join Julius Baer - does not include Italy (to
Kairos) and India (expected 2015) Net reduction target 2014: ~400 FTEs (weighted towards H2)
• Based on functions and locations of employees: cost savings (personnel & general expenses2) per FTE lower than average Group expenses2 per FTE
Implied IWM cost/income ratio3 likely to fall to ~90%4
• 2015: expected transfer of India business; continued focus on efficiency opportunities• Implied IWM C/I ratio3 targeted to fall to ~70% (at gross margin of ~85bps)
• Scope for further productivity and efficiency improvements
2014: Next wave of rightsizing
2014 CIR ~90%
1 Due to the rapid integration into Julius Baer, ‘stand-alone’ costs and profitability are not fully separable and thus not precisely measurable anymore; all references to IWMprofit contribution and cost/income ratio are therefore approximations
2 On basis of adjusted expenses, i.e. excluding integration and restructuring expenses and amortisation of intangible assets related to acquisitions or divestments3 On basis of adjusted expenses2, and excluding valuation allowances, provisions and losses4 Assuming no major negative market/currency impact on AuM, and assuming IWM gross margin similar to 2013 full year gross margin
2014: Rightsizing
2014 CIR ~90%
2015 CIR ~70%
Beyond 2015

FY 2013 Results and Review, 3 February 2014
IntroductionBoris F.J. Collardi, CEO
Financial Results FY 2013Dieter A. Enkelmann, CFO
IWM Integration: Finance UpdateDieter A. Enkelmann, CFO
Business UpdateBoris F.J. Collardi, CEO
Q&A Session
Appendices
22
CONTENT
FY 2013 Results and Review, 3 February 2014
20132005
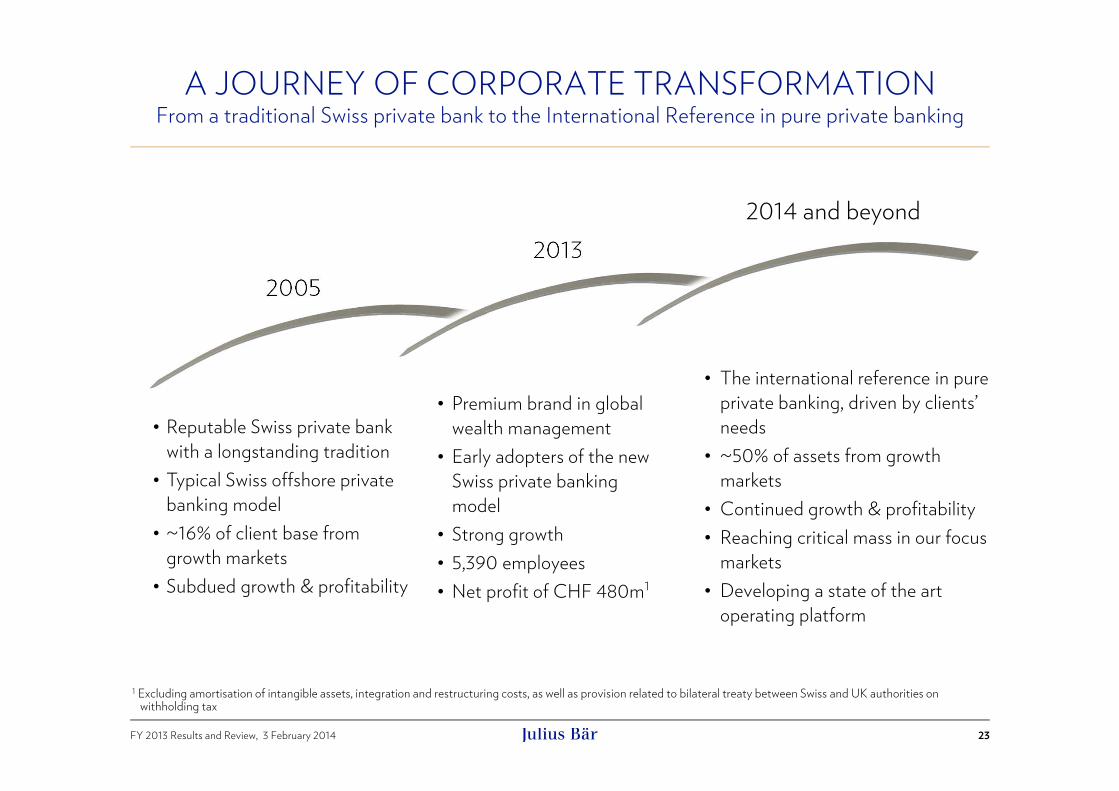
A JOURNEY OF CORPORATE TRANSFORMATIONFrom a traditional Swiss private bank to the International Reference in pure private banking
23
• Reputable Swiss private bank with a longstanding tradition • Typical Swiss offshore private
banking model• ~16% of client base from
growth markets• Subdued growth & profitability
• Premium brand in global wealth management
• Early adopters of the new Swiss private banking model
• Strong growth • 5,390 employees• Net profit of CHF 480m1
• The international reference in pure private banking, driven by clients’ needs
• ~50% of assets from growth markets
• Continued growth & profitability • Reaching critical mass in our focus
markets • Developing a state of the art
operating platform
2014 and beyond
1 Excluding amortisation of intangible assets, integration and restructuring costs, as well as provision related to bilateral treaty between Swiss and UK authorities onwithholding tax
FY 2013 Results and Review, 3 February 2014
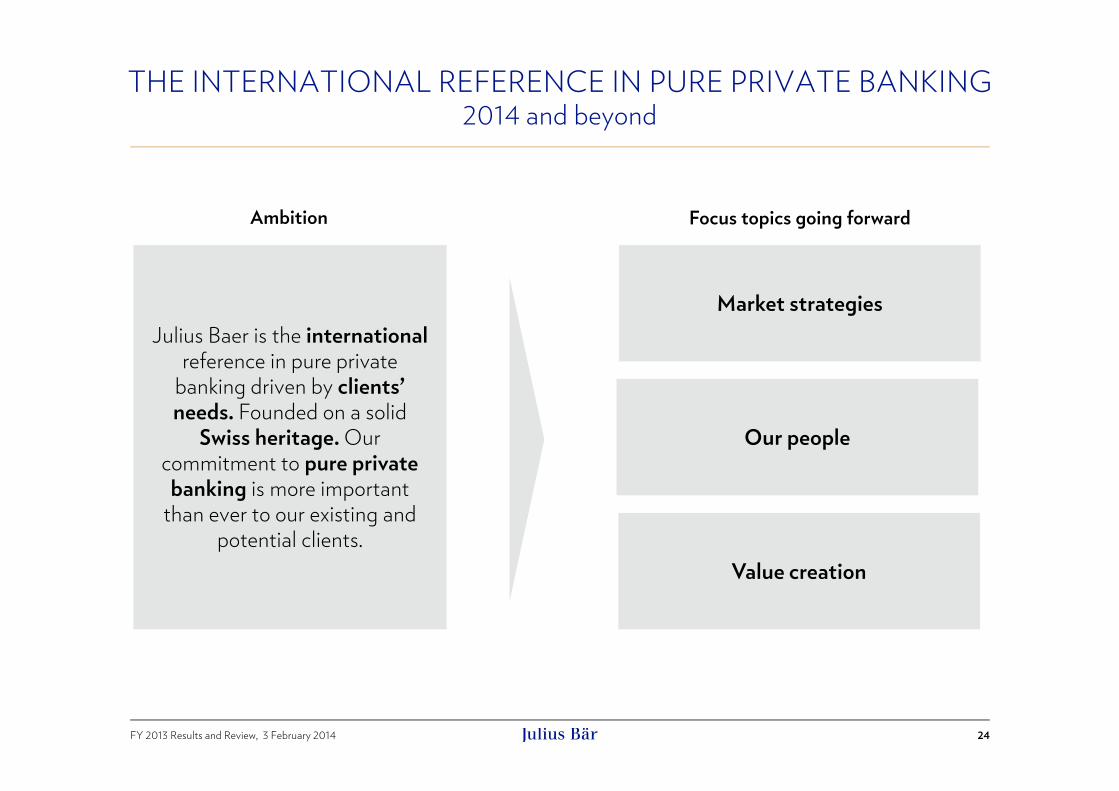
THE INTERNATIONAL REFERENCE IN PURE PRIVATE BANKING2014 and beyond
24
Focus topics going forward
Julius Baer is the internationalreference in pure private
banking driven by clients’ needs. Founded on a solid
Swiss heritage. Our commitment to pure private banking is more important
than ever to our existing and potential clients.
Market strategies
Our people
Value creation
Ambition

FY 2013 Results and Review, 3 February 2014
SWITZERLANDIncreasing penetration in our home market
Head OfficeOther Julius Baer locations
SionVerbier
Crans-MontanaGeneva
Berne
Ascona
Lugano
Lausanne
Basel
ZugLucerne
ZurichKreuzlingen
St. Gallen
St. Moritz
25
• Region Switzerland continued to develop successfully
• Offering full scope of domestic private banking services
• Merrill Lynch Bank (Suisse) S.A. in Geneva: acquisition and legal merger in 2013
• Honoured for second time in a row as “Best Private Bank Switzerland”1
• Benefitting from consolidation in EAM landscape:acquired WMPartners, one of the largest EAMs in Switzerland2
1 The trade publication CFI Capital Finance International honours Julius Baer as “Best Private Bank Switzerland” in 20132 Increasing AuM by CHF 1.4bn

FY 2013 Results and Review, 3 February 2014
EUROPEWell-positioned for changing regulatory environment
Germany • Named as “Best Private Bank in Germany”1
• Strong NNM contribution from domestic business• Successfully completed transformation from pure
onshore bank to European hub (booking facility for European IWM assets)
Italy • Completed Kairos transaction, next step towards
creating a leading onshore wealth manager• IWM local closing 2014 – to be integrated
into Kairos Julius BaerUnited Kingdom • Expanded presence through IWM in London, creating
one of the premier local private banks Tax regularisations on-going• Further aiming towards having European clients tax
compliant by 2015Offices Kairos (Julius Baer owns 19.9% of Kairos)New locations from IWM
Existing Julius Baer booking centres Other existing Julius Baer advisory locations
MadridRome
Monaco
MilanTurin
ViennaMunichStuttgart
WürzburgFrankfurtDuesseldorf
LuxembourgParis*
Guernsey
London
Dublin*Amsterdam* HamburgKiel
26
Mannheim
Integration expected in 2014*1 Julius Baer named “Best Private Bank in Germany” by Manager Magazin

FY 2013 Results and Review, 3 February 2014
Central & Eastern Europe • Solid franchise in the region leading to continued
net inflows• Further strengthened our dedicated desks in
Zurich, Geneva, London, Monaco, Singapore and Vienna
Israel• Extended market penetration via additional
financial advisory license• IWM add-on complementing our local businessMiddle East • Strong inflows thanks to on-going increase of
market coverage• Additional local presence in Beirut and Manama
through IWM transaction
CENTRAL & EASTERN EUROPE AND MIDDLE EASTStrong franchise supporting NNM
Existing Julius Baer advisory locationsNew locations from IWM
Geneva
DubaiAbu DhabiManama
BeirutTel Aviv
Cairo
Istanbul
Moscow
27

FY 2013 Results and Review, 3 February 2014
ASIAClose to 25% of Group AUM
• Positioned well within the top 10 of Asia’s wealth managers• Perfect constellation to tackle new growth in North &
South East Asia as well as India • IWM asset transfers successfully completed • India to be integrated early 2015Japan• Increased coverage of Japanese market together with
TFM Asset Management AG (60% owned)
Named “Best Boutique Private Bank in Asia”2 for the4th time in a row
Another year of successful collaboration with our partners
TFM Asset Management AG, majority participation of 60%
Existing Julius Baer booking centresOther existing Julius Baer advisory locations
Hong Kong
Shanghai
Tokyo
Singapore
Jakarta
28
India1
1 IWM main office in Mumbai – plus four smaller offices in Bangalore, Kolkata, Chennai, New Delhi. Integration expected early 20152 Julius Baer again named “Best Boutique Private Bank in Asia” by The Asset Triple A award
New locations from IWM (integration expected in early 2015)

FY 2013 Results and Review, 3 February 2014
• Well established as Group’s second pillar of growth • Solid inflows in competitive market
• All IWM local transaction closings took place in 2013 (Montevideo, Santiago, Panama)
• Panama to become Group’s LatAm hub over time • LatAm so far slower than expected, but improving
momentum towards year-end
GPS (Brazilian partner, 30% stake)• Successful collaboration with one of Brazil’s largest
independent wealth managers• Reached BRL 15bn (~CHF 6bn) in 2013, again
double-digit asset growth
LATIN AMERICASignificantly growing our position along various dimensions
Offices of Julius Baer partner GPS (30% stake)New locations from IWM
Existing Julius Baer booking centresOther existing Julius Baer advisory locations
Lima
MontevideoSantiago de Chile
Rio de JaneiroSão Paulo
Panama
Nassau
29
FY 2013 Results and Review, 3 February 2014
OUR PEOPLE
30
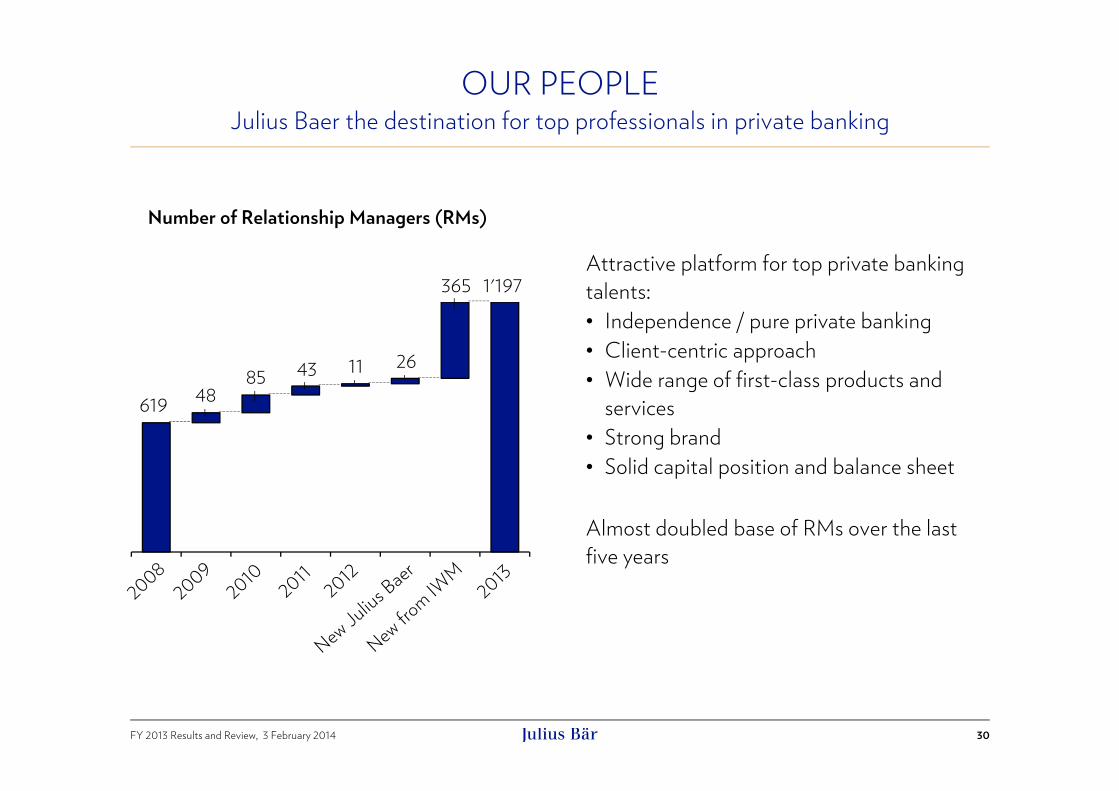
Attractive platform for top private banking talents:• Independence / pure private banking • Client-centric approach • Wide range of first-class products and
services• Strong brand• Solid capital position and balance sheet
Almost doubled base of RMs over the last five years
Julius Baer the destination for top professionals in private banking
619 4885 43 11 26
365 1'197
Number of Relationship Managers (RMs)
FY 2013 Results and Review, 3 February 2014
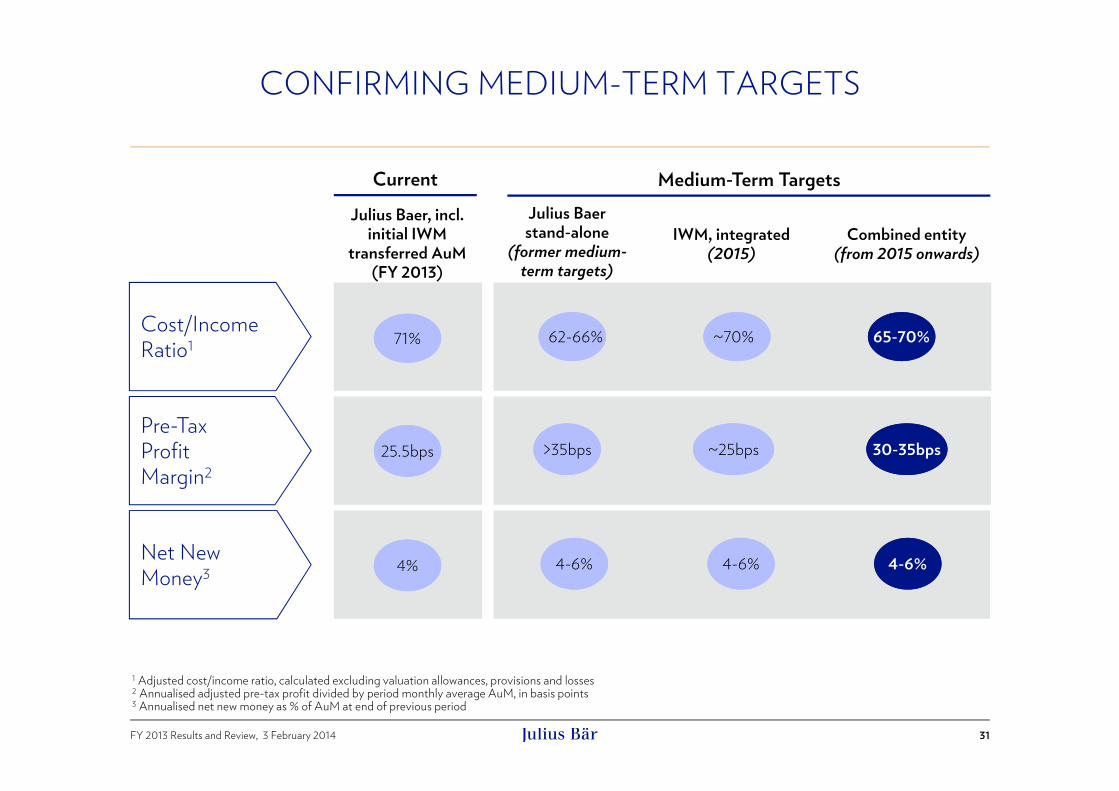
CONFIRMING MEDIUM-TERM TARGETS
31
Julius Baer stand-alone
(former medium-term targets)
Combined entity(from 2015 onwards)
IWM, integrated (2015)
Medium-Term Targets
1 Adjusted cost/income ratio, calculated excluding valuation allowances, provisions and losses2 Annualised adjusted pre-tax profit divided by period monthly average AuM, in basis points3 Annualised net new money as % of AuM at end of previous period
Cost/IncomeRatio1 62-66% ~70% 65-70%
Pre-TaxProfitMargin2
>35bps ~25bps 30-35bps
Net NewMoney3 4-6% 4-6% 4-6%
Julius Baer, incl. initial IWM
transferred AuM(FY 2013)
71%
25.5bps
4%
Current

FY 2013 Results and Review, 3 February 2014
IntroductionBoris F.J. Collardi, CEO
Financial Results FY 2013Dieter A. Enkelmann, CFO
IWM Integration: Finance UpdateDieter A. Enkelmann, CFO
Business UpdateBoris F.J. Collardi, CEO
Q&A Session
Appendices
33
CONTENT

FY 2013 Results and Review, 3 February 2014
AuMReportedand Booked
AuMReported
IWM: ECONOMICS TRANSFERRED IN TWO STAGES
34
Transfer of FAs and advised AuM drives the timing of transfer of economics
1 For both legal entity sales and business transfers2 Except Merrill Lynch Bank (Suisse) S.A. which was acquired at principal closing on 1 February 20133 Allocation charges, which relate primarily to custody services provided with respect to AuM that remain on IWM platforms, are calculated by reference to allocations made
by Bank of America to the IWM business in 2011, which were USD 81.3m. Allocation charges will be calculated on a monthly basis and are capped at the lower of (i) one-twelfth of USD 81.3m and (ii) a specified percentage of revenue for a given month
1. Transfer of client advisory relationships1 (FAs/clients)
2. Transfer of custody relationships to Julius Baer platform
RevenuesAssociated direct costsPlatform allocationcharges to BofAML3
(max. 10bps)
Client Assets• Shares• Bonds• Funds• Deposits• …
RevenuesAssociated direct costsJulius Baerplatform costs
FA joins Julius BaerRevenues & costs follow, AuM re-
mains booked on BofAML platforms2
AuM transferredBofAML platform
allocation charges cease
FinancialAdviser
FY 2013 Results and Review, 3 February 2014
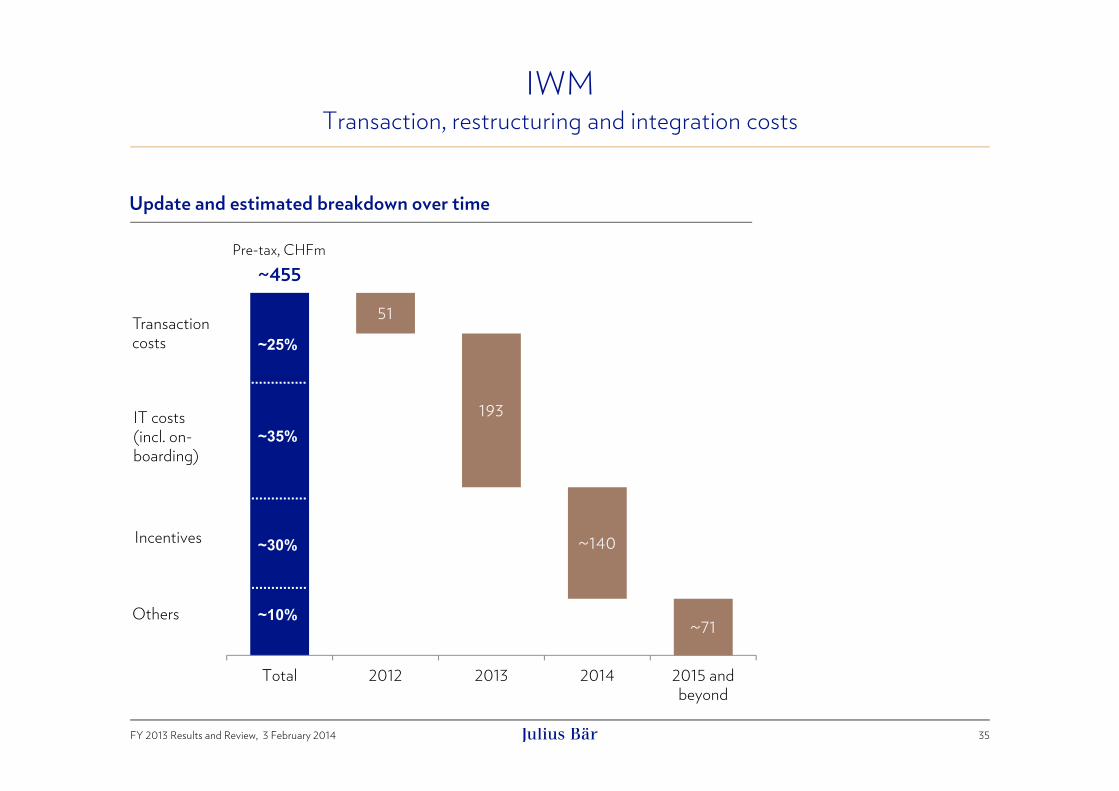
~455
51
193
~140
~71
050
100150
200250300350400450500
Total 2012 2013 2014 2015 andbeyond
~25%
~35%
~30%
~10%
Pre-tax, CHFm
~16
35
IWM
Transaction costs
IT costs(incl. on-boarding)
Incentives
Others
Update and estimated breakdown over time
Transaction, restructuring and integration costs
FY 2013 Results and Review, 3 February 2014
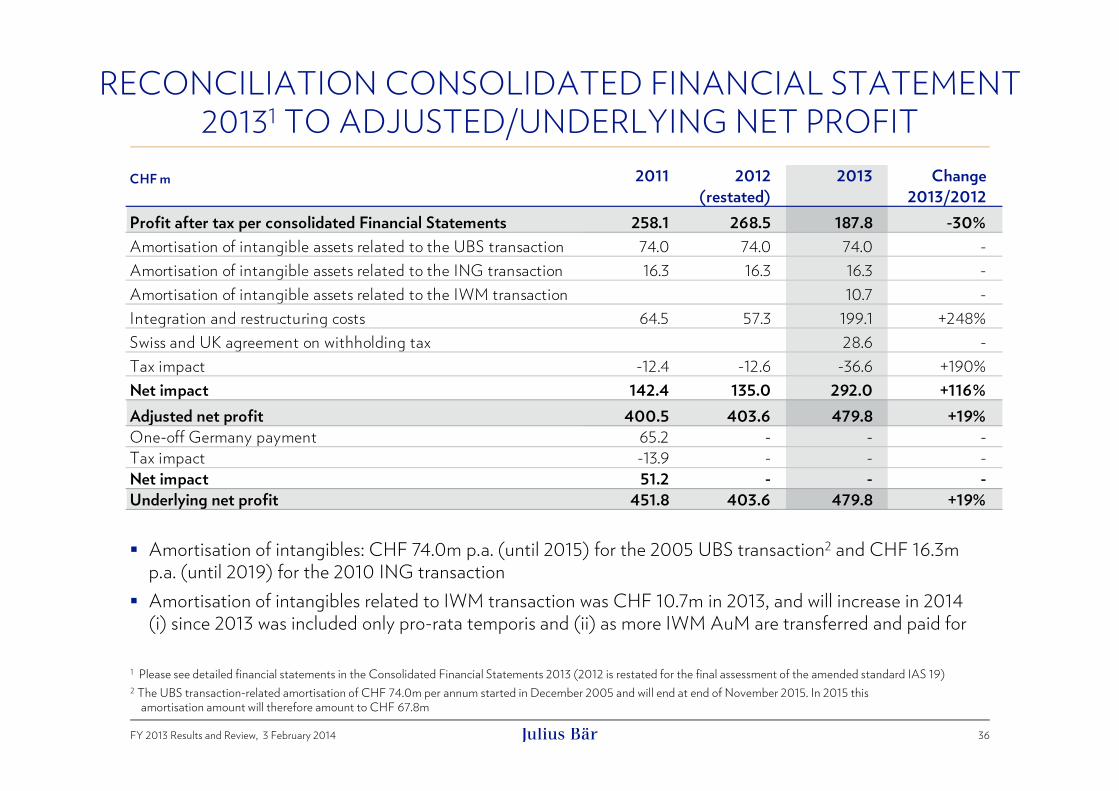
RECONCILIATION CONSOLIDATED FINANCIAL STATEMENT 20131 TO ADJUSTED/UNDERLYING NET PROFIT
36
Amortisation of intangibles: CHF 74.0m p.a. (until 2015) for the 2005 UBS transaction2 and CHF 16.3m p.a. (until 2019) for the 2010 ING transaction
Amortisation of intangibles related to IWM transaction was CHF 10.7m in 2013, and will increase in 2014 (i) since 2013 was included only pro-rata temporis and (ii) as more IWM AuM are transferred and paid for
1 Please see detailed financial statements in the Consolidated Financial Statements 2013 (2012 is restated for the final assessment of the amended standard IAS 19)2 The UBS transaction-related amortisation of CHF 74.0m per annum started in December 2005 and will end at end of November 2015. In 2015 this
amortisation amount will therefore amount to CHF 67.8m
CHF m 2011 2012(restated)
2013 Change2013/2012
258.1 268.5 187.8 -30%Amortisation of intangible assets related to the UBS transaction 74.0 74.0 74.0 -Amortisation of intangible assets related to the ING transaction 16.3 16.3 16.3 -Amortisation of intangible assets related to the IWM transaction 10.7 -Integration and restructuring costs 64.5 57.3 199.1 +248%Swiss and UK agreement on withholding tax 28.6 -Tax impact -12.4 -12.6 -36.6 +190%Net impact 142.4 135.0 292.0 +116%
400.5 403.6 479.8 +19%One-off Germany payment 65.2 - - -Tax impact -13.9 - - -Net impact 51.2 - - -
451.8 403.6 479.8 +19%
Profit after tax per consolidated Financial Statements
Adjusted net profit
Underlying net profit

ADJUSTED* NET PROFIT CHF 480m
37
* Excl. amortisation of intangible assets, integration and restructuring costs, as well as provision related to bilateral treaty between Swiss and UK authorities on withholding tax1 Net interest income contains dividend income (FY 2011: CHF 101m, FY 2012: CHF 93m, FY 2013: CHF 38m) on trading portfolios2 Including valuation allowances, provisions and losses3 Including non-controlling interests of CHF 0.2m for FY 2011, CHF 0.6m for FY 2012 and CHF 0.3m for FY 20134 Based on average AuM 5 Not considering valuation allowances, provisions and losses
CHF m 2011 2012(restated)
2013 Change2013/2012
2013in %
Net interest and dividend income 1 533 559 552 -1% 25%Net commission and fee income 942 980 1,277 +30% 58%Net trading income 1 269 173 315 +82% 14%Other ordinary results 9 26 51 +100% 2%Operating income 1,753 1,737 2,195 +26% 100%Personnel expenses 787 820 984 +20% 61%General expenses 2 425 349 536 +54% 33%Depreciation and amortisation 66 79 91 +15% 6%Operating expenses 1,279 1,247 1,611 +29% 100%Profit before taxes 474 490 583 +19%Pre-tax margin (bps) 4 28.2 27.0 25.5 -1.6 bpsIncome taxes 73 86 103 +20%Adjusted net profit 3 401 404 480 +19%Underlying net profit (excl. Germany payment) 452 404 480 +19%Adjusted EPS (in CHF) 1.93 2.00 2.24 +12%Underlying EPS (in CHF) 2.18 2.00 2.24 +12%Gross margin (bps) 4 104.5 95.9 95.9 -0.1 bpsCost/income ratio (%) 5 68.0 72.8 71.3 -1.4% ptsTax rate 15.4% 17.6% 17.7% +0.1% ptsStaff (FTE) 3,643 3,721 5,390 +45%Valuation allowances, provisions and losses 87.5 -17.1 45.7 -Net new money (CHF bn) 10.2 9.7 7.6 -22%Assets under management (CHF bn) 170.3 189.3 254.4 +34%Average assets under management (CHF bn) 167.7 181.1 229.0 +26%

ADJUSTED* CONSOLIDATED INCOME STATEMENTHalf-yearly
38
* Excl. amortisation of intangible assets, integration and restructuring costs, ,as well as provision related to bilateral treaty between Swiss and UK authorities on withholding tax1 Net interest income contains dividend income (H2 2012: CHF 3m, H1 2013: CHF 33m, H2 2013: CHF 5m) on trading portfolios2 Including valuation allowances, provisions and losses3 Including non-controlling interests of CHF 0.4m for H2 2012, CHF 0.3m for H1 2013 and CHF -0.03m for H2 20134 Based on average AuM 5 Not considering valuation allowances, provisions and losses
CHF m H1 2012(restated)
H2 2012(restated)
H1 2013 H2 2013 ChangeH2 13/H2 12
ChangeH2 13/H1 13
H2 2013in %
Net interest and dividend income 1 323 236 275 277 +18% +1% 25%Net commission and fee income 471 510 599 678 +33% +13% 61%Net trading income 1 52 121 185 130 +8% -29% 12%Other ordinary results 18 8 19 32 +303% +74% 3%Operating income 863 874 1,077 1,118 +28% +4% 100%Personnel expenses 419 401 488 496 +24% +2% 58%General expenses 2 161 188 226 310 +65% +37% 36%Depreciation and amortisation 32 47 44 47 +1% +7% 6%Operating expenses 612 636 758 854 +34% +13% 100%Profit before taxes 251 239 319 264 +11% -17%Pre-tax margin (bps) 4 28.5 25.8 30.1 21.5 -4.3 bps -8.7bpsIncome taxes 42 45 57 46 +3% -20%Adjusted net profit 3 210 194 261 218 +13% -16%Adjusted EPS (in CHF) 1.05 0.96 1.23 1.02 +6% -17%Gross margin (bps) 4 97.7 94.3 101.8 90.7 -3.6 bps -11.1 bpsCost/income ratio (%) 5 72.1 73.4 69.3 73.3 -0.1% pts +4.1% ptsTax rate 16.6% 18.7% 18.0% 17.4% -1.3% pts -0.6% ptsStaff (FTE) 3'649 3,721 4,505 5,390 +45% +20%Valuation allowances, provisions and losses -10.7 -6.4 12.1 33.5 - +176%Net new money (CHF bn) 5.5 4.2 3.4 4.1 -2% +20%Assets under management (CHF bn) 178.8 189.3 217.7 254.4 +34% +17%Average assets under management (CHF bn) 176.6 185.3 211.5 246.4 +33% +16%
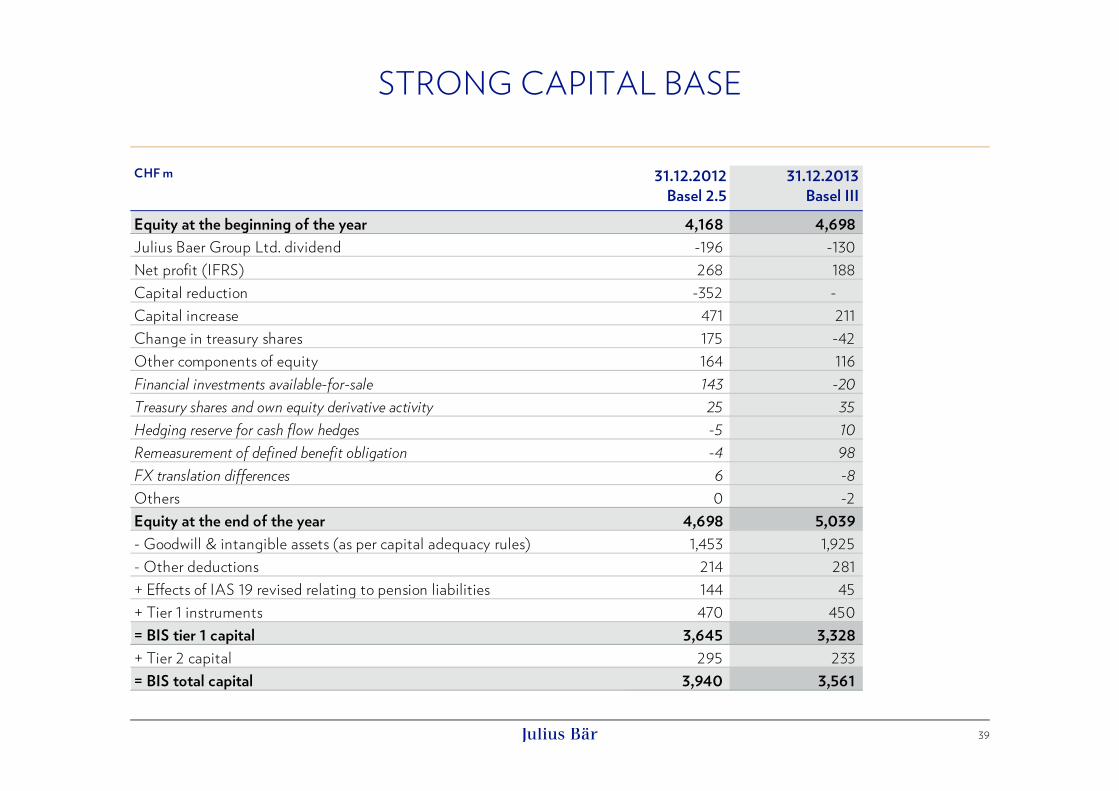
STRONG CAPITAL BASE
39
CHF m 31.12.2012Basel 2.5
31.12.2013Basel III
Equity at the beginning of the year 4,168 4,698 Julius Baer Group Ltd. dividend -196 -130 Net profit (IFRS) 268 188 Capital reduction -352 - Capital increase 471 211 Change in treasury shares 175 -42 Other components of equity 164 116 Financial investments available-for-sale 143 -20 Treasury shares and own equity derivative activity 25 35 Hedging reserve for cash flow hedges -5 10 Remeasurement of defined benefit obligation -4 98 FX translation differences 6 -8 Others 0 -2 Equity at the end of the year 4,698 5,039 - Goodwill & intangible assets (as per capital adequacy rules) 1,453 1,925 - Other deductions 214 281 + Effects of IAS 19 revised relating to pension liabilities 144 45 + Tier 1 instruments 470 450 = BIS tier 1 capital 3,645 3,328 + Tier 2 capital 295 233 = BIS total capital 3,940 3,561
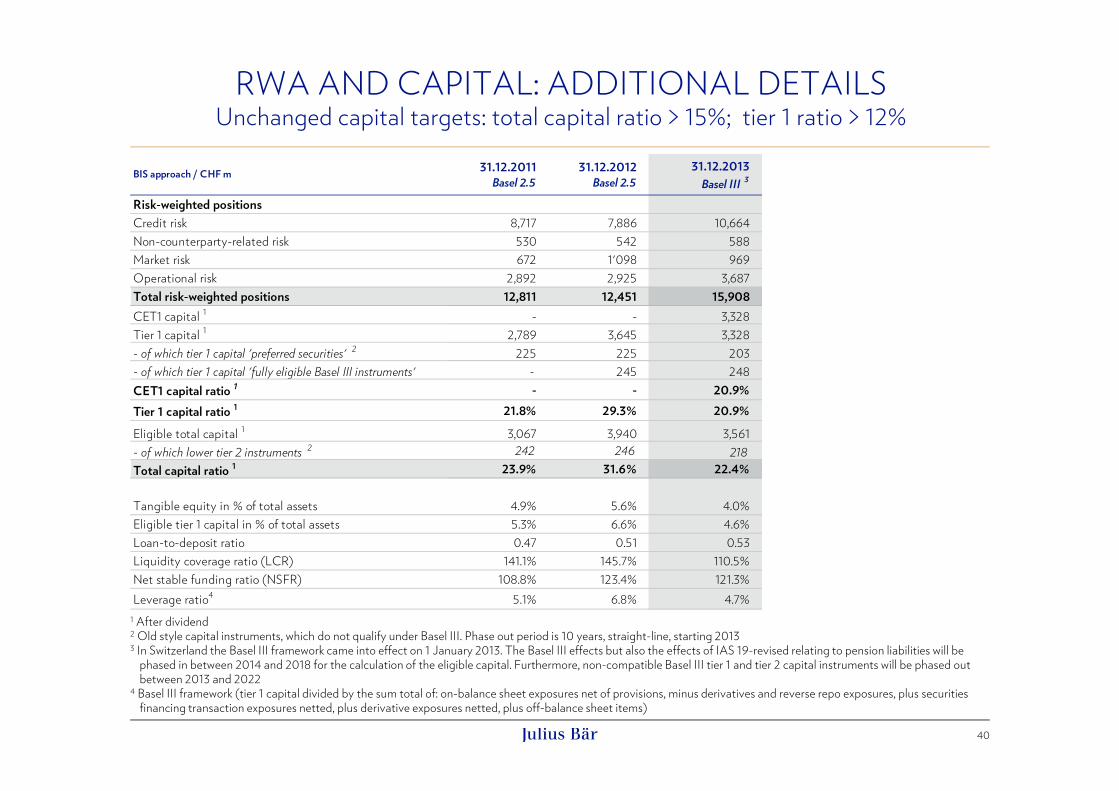
RWA AND CAPITAL: ADDITIONAL DETAILSUnchanged capital targets: total capital ratio > 15%; tier 1 ratio > 12%
40
BIS approach / CHF m 31.12.2011Basel 2.5
31.12.2012Basel 2.5
31.12.2013Basel III 3
Risk-weighted positionsCredit risk 8,717 7,886 10,664Non-counterparty-related risk 530 542 588Market risk 672 1'098 969Operational risk 2,892 2,925 3,687Total risk-weighted positions 12,811 12,451 15,908CET1 capital 1 - - 3,328Tier 1 capital 1 2,789 3,645 3,328- of which tier 1 capital 'preferred securities' 2 225 225 203- of which tier 1 capital 'fully eligible Basel III instruments' - 245 248CET1 capital ratio 1 - - 20.9%Tier 1 capital ratio 1 21.8% 29.3% 20.9%
Eligible total capital 1 3,067 3,940 3,561- of which lower tier 2 instruments 2 242 246 218Total capital ratio 1 23.9% 31.6% 22.4%
Tangible equity in % of total assets 4.9% 5.6% 4.0%Eligible tier 1 capital in % of total assets 5.3% 6.6% 4.6%Loan-to-deposit ratio 0.47 0.51 0.53Liquidity coverage ratio (LCR) 141.1% 145.7% 110.5%Net stable funding ratio (NSFR) 108.8% 123.4% 121.3%Leverage ratio4 5.1% 6.8% 4.7%
1 After dividend2 Old style capital instruments, which do not qualify under Basel III. Phase out period is 10 years, straight-line, starting 20133 In Switzerland the Basel III framework came into effect on 1 January 2013. The Basel III effects but also the effects of IAS 19-revised relating to pension liabilities will be
phased in between 2014 and 2018 for the calculation of the eligible capital. Furthermore, non-compatible Basel III tier 1 and tier 2 capital instruments will be phased out between 2013 and 2022
4 Basel III framework (tier 1 capital divided by the sum total of: on-balance sheet exposures net of provisions, minus derivatives and reverse repo exposures, plus securities financing transaction exposures netted, plus derivative exposures netted, plus off-balance sheet items)
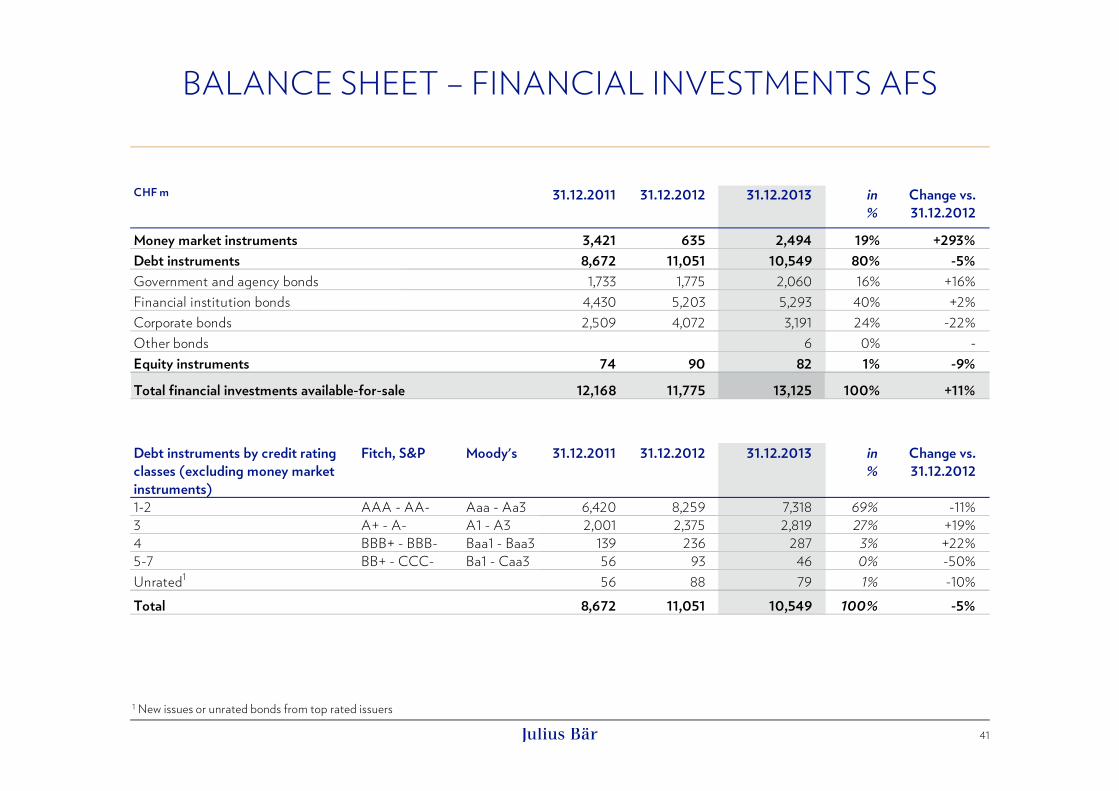
BALANCE SHEET – FINANCIAL INVESTMENTS AFS
41
CHF m 31.12.2011 31.12.2012 31.12.2013 in%
Change vs.31.12.2012
3,421 635 2,494 19% +293%8,672 11,051 10,549 80% -5%
Government and agency bonds 1,733 1,775 2,060 16% +16%Financial institution bonds 4,430 5,203 5,293 40% +2%Corporate bonds 2,509 4,072 3,191 24% -22%Other bonds 6 0% -
74 90 82 1% -9%
Total financial investments available-for-sale 12,168 11,775 13,125 100% +11%
Debt instruments by credit rating classes (excluding money market instruments)
Fitch, S&P Moody's 31.12.2011 31.12.2012 31.12.2013 in%
Change vs.31.12.2012
1-2 AAA - AA- Aaa - Aa3 6,420 8,259 7,318 69% -11%3 A+ - A- A1 - A3 2,001 2,375 2,819 27% +19%4 BBB+ - BBB- Baa1 - Baa3 139 236 287 3% +22%5-7 BB+ - CCC- Ba1 - Caa3 56 93 46 0% -50%Unrated1 56 88 79 1% -10%Total 8,672 11,051 10,549 100% -5%
Money market instruments
Equity instruments
Debt instruments
1 New issues or unrated bonds from top rated issuers
FY 2013 Results and Review, 3 February 2014
1 Initial target range CHF 57-72bn. Agreed transaction price 1.2%. First USD150m payable in cash; next USD 500m payable in 50% cash and 50% equity; remainder againin cash
2 The number of shares to be issued to BofA was fixed in 2012 based on the then prevailing share price and USD/CHF exchange rate, resulting in (a maximum of) 7.1mshares to be issued. These shares were created in January 2013 and are transferred as and when payments are due. At the end of 2013, 5.1m shares had been transferred
3 The impact on goodwill and capital is determined by the market value of the shares at the moment of transfer 4 Excluded from adjusted expenses
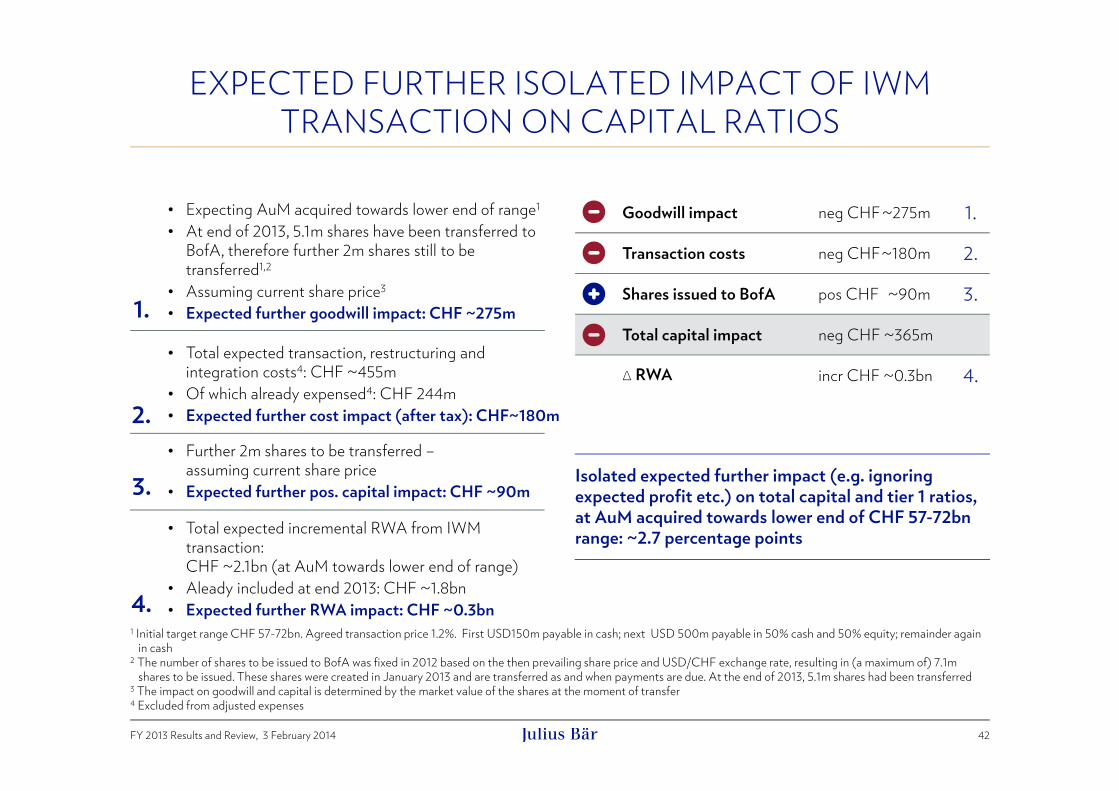
Isolated expected further impact (e.g. ignoring expected profit etc.) on total capital and tier 1 ratios, at AuM acquired towards lower end of CHF 57-72bn range: ~2.7 percentage points
42
EXPECTED FURTHER ISOLATED IMPACT OF IWMTRANSACTION ON CAPITAL RATIOS
• Expecting AuM acquired towards lower end of range1
• At end of 2013, 5.1m shares have been transferred to BofA, therefore further 2m shares still to be transferred1,2
• Assuming current share price3
• Expected further goodwill impact: CHF ~275m1.
2.
• Total expected transaction, restructuring and integration costs4: CHF ~455m
• Of which already expensed4: CHF 244m• Expected further cost impact (after tax): CHF~180m
• Total expected incremental RWA from IWM transaction: CHF ~2.1bn (at AuM towards lower end of range)
• Aleady included at end 2013: CHF ~1.8bn• Expected further RWA impact: CHF ~0.3bn4.
3.• Further 2m shares to be transferred –
assuming current share price• Expected further pos. capital impact: CHF ~90m
Goodwill impact neg CHF ~275m 1.
Transaction costs neg CHF~180m 2.
Shares issued to BofA pos CHF ~90m 3.
Total capital impact neg CHF ~365m
∆ RWA incr CHF ~0.3bn 4.

FY 2013 Results and Review, 3 February 2014
BREAKDOWN OF JULIUS BAER GROUP AUMIncluding in 2013 the AuM of the transferred IWM businesses
43
Asset mix 31.12.2011 31.12.2012 31.12.2013Equities 25% 25% 27%Bonds (including Convertible Bonds) 23% 23% 20%Investment Funds 1 19% 20% 22%Money Market Instruments 8% 7% 5%Client Deposits 18% 18% 20%Structured Products 5% 5% 5%Other 2 2% 2% 1%Total 100% 100% 100%
Currency mix 31.12.2011 31.12.2012 31.12.2013CHF 17% 17% 14%EUR 29% 27% 24%USD 32% 34% 39%GBP 4% 3% 5%SGD 2% 2% 2%HKD 2% 2% 3%RUB 1% 1% 1%CAD 2% 2% 1%Other 11% 12% 11%Total 100% 100% 100%
1 Includes further exposure to equities and bonds through equity funds and bond funds2 Including alternative investment assets