FY 2007 Miniature Spherical Retroreflectors Final Report€¦ · · 2008-03-07FY 2007 Miniature...
34
PNNL-17287 FY 2007 Miniature Spherical Retroreflectors Final Report NC Anheier BE Bernacki K Krishnaswami January 2008 Prepared for the U.S. Department of Energy under Contract DE-AC05-76RL01830
Transcript of FY 2007 Miniature Spherical Retroreflectors Final Report€¦ · · 2008-03-07FY 2007 Miniature...

PNNL-17287
FY 2007 Miniature Spherical Retroreflectors Final Report NC Anheier BE Bernacki K Krishnaswami January 2008 Prepared for the U.S. Department of Energy under Contract DE-AC05-76RL01830


PNNL-17287
FY 2007 Miniature Spherical Retroreflectors Final Report NC Anheier BE Bernacki K Krishnaswami January 2008 Prepared for the U.S. Department of Energy under Contract DE-AC05-76RL01830 Pacific Northwest National Laboratory Richland, Washington 99352


Summary
Miniature spherical retroreflectors, less than 8 millimeters in diameter, are currently being developed to enhance remote optical detection of nuclear proliferation activities. These retroreflecting spheres resemble small, sand-colored marbles that have the unique optical property of providing a strong reflection directly back to the source (i.e., retroreflecting) when illuminated with a laser. The addition of specific coatings, sensitive to specific chemicals or radioactive decay in the environment, can be applied to the surface of these retroreflectors to provide remote detection of nuclear proliferation activities. The presence of radioactive decay (e.g., alpha, gamma, neutron) or specific chemicals in the environment (e.g., TBP, acids) will change the optical properties of the spheres in a predictable fashion, thus indicating the presence or absence of the target materials. One possible scenario might employ an airborne infrared laser system (e.g., quantum-cascade lasers) to illuminate a section of ground littered with these retroreflective spheres. Depending on the coating and the presence of a specific chemical or radioisotope in the environment, the return signal would be modified in some predictable fashion because of fluorescence, frequency shifting, intensity attenuation/enhancement, or change in polarization. Research conducted in FY 2007 focused on developing novel optical fabrication processes and exploiting the unique material properties of chalcogenide infrared-transparent glass (germanium-arsenic-sulfur-tellurium compounds) to produce highly efficient retroreflectors. Pacific Northwest National Laboratory’s approach provides comparable performance to the ideal graded index sphere concept, developed by R. K. Luneburg in 1944 (Luneburg 1944), while greatly reducing the complexity in fabrication by utilizing chalcogenide glass materials and compression-molding processes.
iii

iv
Acronyms
CTE coefficient of thermal expansion
dB decibels
GLS Gallium Lanthanum Sulfide
IR infrared
LIDAR light detecting and ranging
LRE laser radar equation
PLC programmable logic controller
PNNL Pacific Northwest National Laboratory
v

vi

Contents
Summary ................................................................................................................................................... iii Acronyms.................................................................................................................................................. v 1.0 Introduction....................................................................................................................................... 1 2.0 Retroreflector Design Methodology ................................................................................................. 1
2.1 An Archetypal Spherical Gradient Index Design...................................................................... 2 2.2 Optimum Retroreflector Return ................................................................................................ 4 2.3 Retroreflector Designs for Visible Wavelengths....................................................................... 6
3.0 Retroreflector Fabrication ................................................................................................................. 8
3.1 Process Development ................................................................................................................ 9 3.2 Hemispherical Shell Forming.................................................................................................... 9 3.3 Clad Ball Assembly................................................................................................................... 10 3.4 IR Retroreflector Fabrication .................................................................................................... 11 3.5 Retroreflector Thermal Issues and Solutions ............................................................................ 12
4.0 Optical Characterization of Retroreflectors ...................................................................................... 13 5.0 Application Analysis using the Laser Radar Equation...................................................................... 14
5.1 Modeling Results....................................................................................................................... 16 6.0 Summary and Conclusions................................................................................................................ 20 7.0 References ......................................................................................................................................... 21
Figures
1 Ray Trace Plot for a Luneburg Lens ................................................................................................. 2
2 Index Profile for the Optimized 5-mm Diameter Spherical Gradient Index Design Starting with a Surface Index Value of 2.777 at a Wavelength of 10 μm ........................................ 3
3 Layout Drawing Showing the Clad Ball Approach to Achieving Efficient Retroreflection............. 3
4 Index Profiles for the IG3 Step Index Clad ZnS Sphere Versus the Optimized IG3 Spherical Gradient Index Solution.................................................................................................... 4
5 Plot of the Strehl Ratio versus the F/# of the Input Beam Bundle for a 7.756-mm-diameter Homogeneous ZnS Ball, the Clad Spherical Retroreflector, and the Optimized Spherical Gradient Index Retroreflector ........................................................................................... 5
vii
viii
6 Return versus Reflectance for a Ball Lens Showing the Peak Return at r = 0.33............................. 6
7 Prototype Retroreflector for the Visible Portion of the Spectrum in which a 1.65-mm-thick Epoxy Cladding was Injected Around a 6.97-mm-diameter Sphere of LaSFN9 Glass ................................................................................................................................................. 7
8 Comparison between Strehl Ratio versus Beam Diameter Plots for a 10.28-mm-diameter Epoxy Clad LaSFN9 Glass Retroreflector, Homogeneous S-LAH79 Retroreflector, and a Homogeneous LaSFN-9................................................................................................................. 7
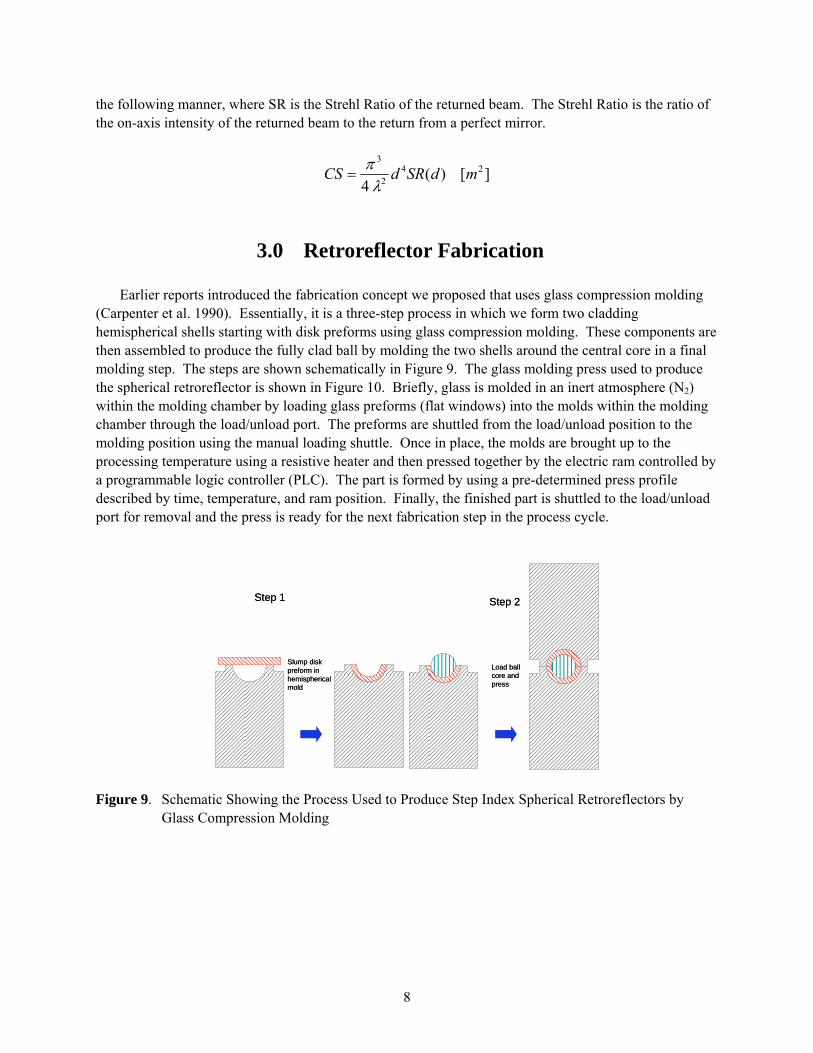
9 Schematic Showing the Process Used to Produce Step Index Spherical Retroreflectors by Glass Compression Molding........................................................................................................ 8
10 Glass Molding Press Procured to Produce the Miniature Spherical Retroreflectors......................... 9
11 Images Showing the Sequential Steps Required to Produce a Clad Ball by Using Super Vidron for the Shell and BK7 Glass for the Core ............................................................................. 10
12 Picture Sequence Showing the Assembly of the Clad Ball............................................................... 11
13 IG3 Hemispherical Shells Shown Flanking a GLS 5-mm Spherical Core........................................ 11
14 Images Showing the Partially Assembled Spherical Retroreflector as well as the Fully Assembled Retroreflector ................................................................................................................. 12
15 Apparatus to Measure Return Signal Efficiency of the Fabricated Retroreflectors Using a Tunable CO2 Laser and a Focal Plane Array Thermal Camera ........................................................ 14
16 Beam Propagation Modeling at a Wavelength of 1.257 µm to Determine the Optimum Transmitter Beam Diameter.............................................................................................................. 16
17 Beam Propagation Modeling at a Wavelength of 9.0 µm to Determine the Optimum Transmitter Beam Diameter.............................................................................................................. 17
18 Roundtrip Propagation Loss Versus Target Range, at a Wavelength of 1.257 µm, as a Function of Retroreflector Diameter................................................................................................. 18
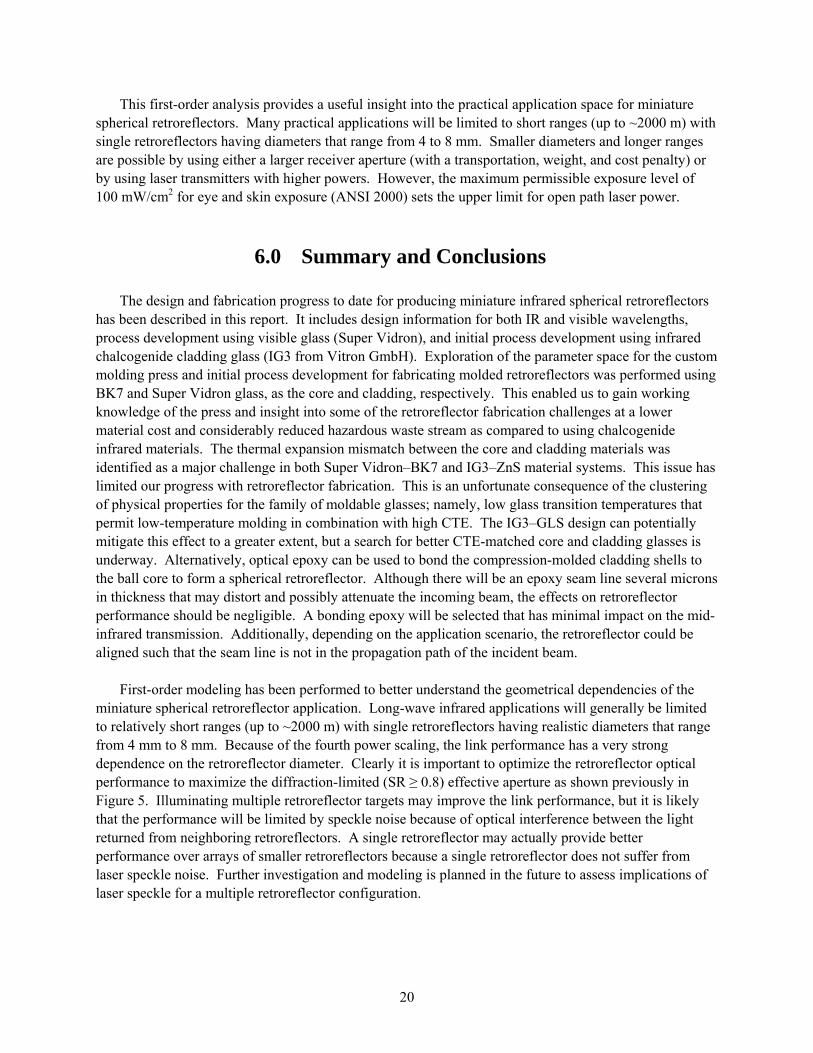
19 Light Returned to the Transceiver Varies as a Function of Retroreflector Diameter ....................... 18
20 Relative Loss in dB as a Function of Retroreflector Diameter, Demonstrating the Scaling .............................................................................................................................................. 19
dr4
21 Roundtrip Propagation Loss Versus Target Range as a Function of Retroreflector Diameter at a Wavelength of 9.0 µm................................................................................................ 19
1.0 Introduction
Optical retroreflectors find application in fields as diverse as atmospheric research (light detecting and ranging [LIDAR], both monostatic and bi-static), optical communications (Handerek et al. 2006; Burmistrov et al. 2002), and optical metrology (Zurcher et al. 1995) methods that use coordinate measuring machines and laser tracking systems (Takatsuji et al. 1999; Oakley 2007). Typically, they take the form of corner-cube reflectors or cat’s eye reflectors but these configurations are not symmetric and suffer from a small acceptance angle that limits their effectiveness in many applications. Spherical retroreflectors are ideally rotationally symmetric capable of extremely large acceptance angles, subject to the effects of spherical aberration, and are well suited for remote sensing applications. Our research efforts, therefore, continue to focus on development of spherical retroreflectors with large acceptance angles and efficient returns for use in the infrared (IR) portion of the spectrum. In this report we provide a summary of the FY 2007 research progress for the Miniature Spherical Retroreflector project (PL211A). In Section 2, we provide an update on the step index ball lens retroreflector design. In Section 3, we discuss our progress in fabrication using our custom compression-molding press. Section 4 describes a new apparatus that was built to characterize retroreflector performance in the mid-infrared. Section 5 provides modeling results that are useful to better understand the practical application space for miniature spherical retroreflectors.
2.0 Retroreflector Design Methodology
As has been reported in earlier reports (Anheier et al. 2005, 2006), the ideal spherical retroreflector is embodied by the Luneburg lens (Luneburg 1964). Essentially, the Luneburg lens brings a parallel beam of light (e.g., a collimated laser beam) to a perfect focus at the rear surface of the sphere (Figure 1). The beam can fill the entire aperture of the Luneburg lens and still not suffer from the effects of spherical aberrations. This ideal construct is achieved through a special spherically symmetric gradient index profile that varies according to the expression below for an aperture normalized to a radius of 1 with the origin at the center of the sphere.
)10(2)( 2 ≤≤−= rrrn The first impediment to realizing this theoretical construct for a practical optical device is the condition at the edge of the ball; that is, the ball-air interface. We see that when r = 1, n(r) must equal 1. This is not possible for any practical optical media, where 1.3 is approximately the minimum index achievable. The ideal design, therefore, is not physically realizable. Also, at the center of the sphere (r = 0) the index increases to a value of √2, requiring an index change of approximately 0.4, a value larger than that producible by any known method of gradient index technology.
1
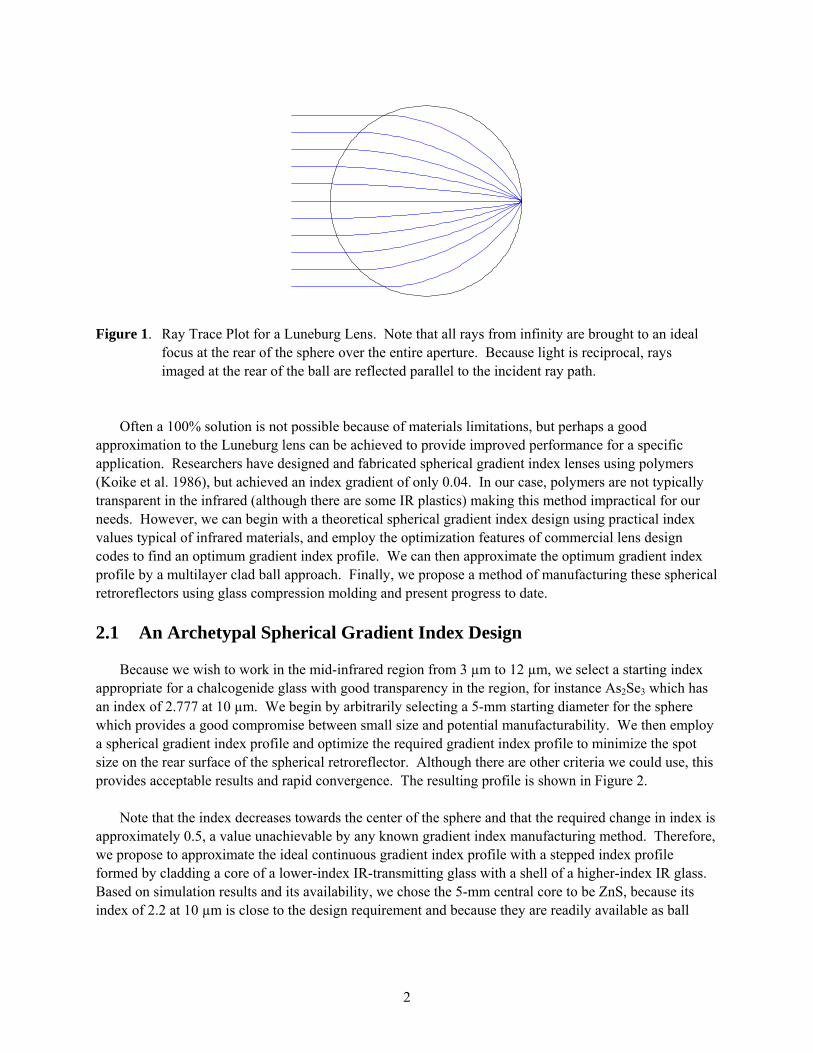
Figure 1. Ray Trace Plot for a Luneburg Lens. Note that all rays from infinity are brought to an ideal
focus at the rear of the sphere over the entire aperture. Because light is reciprocal, rays imaged at the rear of the ball are reflected parallel to the incident ray path.
Often a 100% solution is not possible because of materials limitations, but perhaps a good approximation to the Luneburg lens can be achieved to provide improved performance for a specific application. Researchers have designed and fabricated spherical gradient index lenses using polymers (Koike et al. 1986), but achieved an index gradient of only 0.04. In our case, polymers are not typically transparent in the infrared (although there are some IR plastics) making this method impractical for our needs. However, we can begin with a theoretical spherical gradient index design using practical index values typical of infrared materials, and employ the optimization features of commercial lens design codes to find an optimum gradient index profile. We can then approximate the optimum gradient index profile by a multilayer clad ball approach. Finally, we propose a method of manufacturing these spherical retroreflectors using glass compression molding and present progress to date. 2.1 An Archetypal Spherical Gradient Index Design
Because we wish to work in the mid-infrared region from 3 µm to 12 µm, we select a starting index appropriate for a chalcogenide glass with good transparency in the region, for instance As2Se3 which has an index of 2.777 at 10 µm. We begin by arbitrarily selecting a 5-mm starting diameter for the sphere which provides a good compromise between small size and potential manufacturability. We then employ a spherical gradient index profile and optimize the required gradient index profile to minimize the spot size on the rear surface of the spherical retroreflector. Although there are other criteria we could use, this provides acceptable results and rapid convergence. The resulting profile is shown in Figure 2. Note that the index decreases towards the center of the sphere and that the required change in index is approximately 0.5, a value unachievable by any known gradient index manufacturing method. Therefore, we propose to approximate the ideal continuous gradient index profile with a stepped index profile formed by cladding a core of a lower-index IR-transmitting glass with a shell of a higher-index IR glass. Based on simulation results and its availability, we chose the 5-mm central core to be ZnS, because its index of 2.2 at 10 µm is close to the design requirement and because they are readily available as ball
2

Figure 2. Index Profile for the Optimized 5-mm Diameter Spherical Gradient Index Design Starting with
a Surface Index Value of 2.777 at a Wavelength of 10 μm lenses of this size. Additionally, ZnS also has a very high melting temperature of 2103 K (Klocek 1991) and will not be affected by the low processing temperature of approximately 330°C at which the cladding is formed. One proposed design incorporating a 5-mm ZnS core results in a retroreflector geometry with a cladding thickness of 1.378 mm constructed from IG3 chalcogenide glass(a) (Ge30As13Se32Te25), for a total retroreflector diameter of 7.756 mm. The design was optimized to have an image space of F/1.1, resulting in a diffraction-limited design over a 4.3-mm diameter aperture. This retroreflector design is shown in Figure 3. F-number (F/#) is defined as the ratio of the focal length of an optic to its diameter, and provides a convenient and dimensionless way to compare optical systems.
Figure 3. Layout Drawing Showing the Clad Ball Approach to Achieving Efficient Retroreflection
(a) http://www.cvdmaterials.de
3

To compare the design performance of the clad ball approach to the gradient index solution, a spherical gradient index was designed and optimized for a sphere of the same diameter as the clad ball design, using the same F/# to optimize each design. The resulting index profiles for the IG3 glass-clad ZnS sphere and the optimized IG3 glass spherical gradient index profile are shown in Figure 4.
Figure 4. Index Profiles for the IG3 Step Index Clad ZnS Sphere (in red) Versus the Optimized IG3
Spherical Gradient Index Solution Next the Strehl ratio of the rear-surface image was calculated while varying the diameter of the input ray bundle admitted into the system. The Strehl ratio is a handy figure of merit that is defined as the drop in the central intensity of the point-spread function of a system compared with the unaberrated or ideal point-spread function (Welford 1986). The Strehl criteria for diffraction-limited performance results in a ratio of 0.8, which corresponds to a root-mean-square wavefront error of λ/14. Figure 5 shows that both the gradient index and clad sphere designs remain diffraction-limited at λ = 10 µm for input beam diameters up to around 4.4 mm, which is 56 percent of the full aperture of the spherical retroreflector. Although the theoretical gradient index solution presented here provides a slightly better image (and consequently, a more efficiently reflected beam) compared to our step-index approximation, the design is impractical because there are no known fabrication solutions that will provide the required spherical gradient profile. Furthermore, seeking a fabrication solution appears to be imprudent, because the performance of the clad design is remarkably good in comparison and the design is practical in terms of manufacturability. 2.2 Optimum Retroreflector Return
We reported in the FY 2006 Final Report that one could optimize the return from the spherical retroreflector by choosing an optimum partially reflective coating for the sphere. It is helpful to review this finding to show how the functional dependence of return fraction on surface reflectivity can be exploited for various applications requiring a modulated return from the retroreflector.
4

Figure 5. Plot of the Strehl Ratio versus the F/# of the Input Beam Bundle for a 7.756-mm-diameter
Homogeneous ZnS Ball, the Clad Spherical Retroreflector, and the Optimized Spherical Gradient Index Retroreflector
Although at first thought it would seem that anything one might do to enhance the reflectivity and hence return from a spherical retroreflector might also reduce its transmission and work against us. This is not so, as we shall show by writing the expression for the return from a spherical retroreflector and finding the optimum reflectivity of the device for maximum efficiency. We assume for the sake of simplicity that there is negligible return from the clad-core interface, because Δn between these materials is much smaller than that of the air-core interface. Therefore, the total return from a retroreflecting sphere can be expressed using the function below. 2)1( rrRtotal −= If one takes the first derivative of this expression and sets it equal to zero, we find the maximum return fraction is achieved when the reflectivity r is equal to 1/3. Here we define return fraction solely as the fraction of returned light from the retroreflector compared to light incident on the surface of the retroreflector without considering any other sources of loss. In the case of a retroreflector having a surface reflectance of 33 percent, one can achieve an optimum return of 14.8 percent of the incident beam. A plot of the reflectance function is shown in Figure 6. Because the index of IG3 used in the IR design is 2.787 at 10 µm, the return for the uncoated miniature retroreflector using the clad ball approach is 13.5%, which provides nearly the optimum return with no further processing. What is interesting about this behavior is that there is significant potential for modulating the return from the retroreflector if one can bias the reflectance on the steep slope of the return fraction function (e.g., reflectivity set to 0.1) and make small changes in reflectivity to obtain relatively large modulation changes in the returned light. For example, if a change in reflectivity of ±0.05, biased at r = 0.1, could be produced by a functionalized coating whose reflectivity could be influenced by external stimuli, such as changes in temperature, light
5
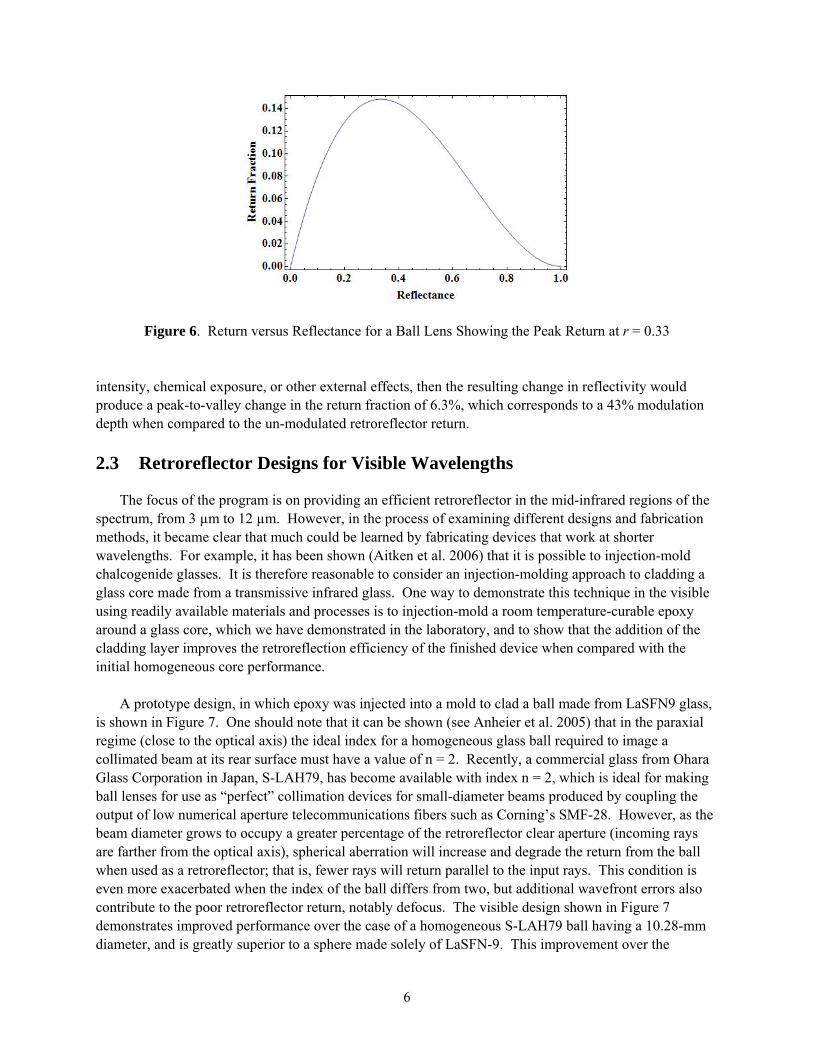
Figure 6. Return versus Reflectance for a Ball Lens Showing the Peak Return at r = 0.33 intensity, chemical exposure, or other external effects, then the resulting change in reflectivity would produce a peak-to-valley change in the return fraction of 6.3%, which corresponds to a 43% modulation depth when compared to the un-modulated retroreflector return. 2.3 Retroreflector Designs for Visible Wavelengths
The focus of the program is on providing an efficient retroreflector in the mid-infrared regions of the spectrum, from 3 µm to 12 µm. However, in the process of examining different designs and fabrication methods, it became clear that much could be learned by fabricating devices that work at shorter wavelengths. For example, it has been shown (Aitken et al. 2006) that it is possible to injection-mold chalcogenide glasses. It is therefore reasonable to consider an injection-molding approach to cladding a glass core made from a transmissive infrared glass. One way to demonstrate this technique in the visible using readily available materials and processes is to injection-mold a room temperature-curable epoxy around a glass core, which we have demonstrated in the laboratory, and to show that the addition of the cladding layer improves the retroreflection efficiency of the finished device when compared with the initial homogeneous core performance. A prototype design, in which epoxy was injected into a mold to clad a ball made from LaSFN9 glass, is shown in Figure 7. One should note that it can be shown (see Anheier et al. 2005) that in the paraxial regime (close to the optical axis) the ideal index for a homogeneous glass ball required to image a collimated beam at its rear surface must have a value of n = 2. Recently, a commercial glass from Ohara Glass Corporation in Japan, S-LAH79, has become available with index n = 2, which is ideal for making ball lenses for use as “perfect” collimation devices for small-diameter beams produced by coupling the output of low numerical aperture telecommunications fibers such as Corning’s SMF-28. However, as the beam diameter grows to occupy a greater percentage of the retroreflector clear aperture (incoming rays are farther from the optical axis), spherical aberration will increase and degrade the return from the ball when used as a retroreflector; that is, fewer rays will return parallel to the input rays. This condition is even more exacerbated when the index of the ball differs from two, but additional wavefront errors also contribute to the poor retroreflector return, notably defocus. The visible design shown in Figure 7 demonstrates improved performance over the case of a homogeneous S-LAH79 ball having a 10.28-mm diameter, and is greatly superior to a sphere made solely of LaSFN-9. This improvement over the
6
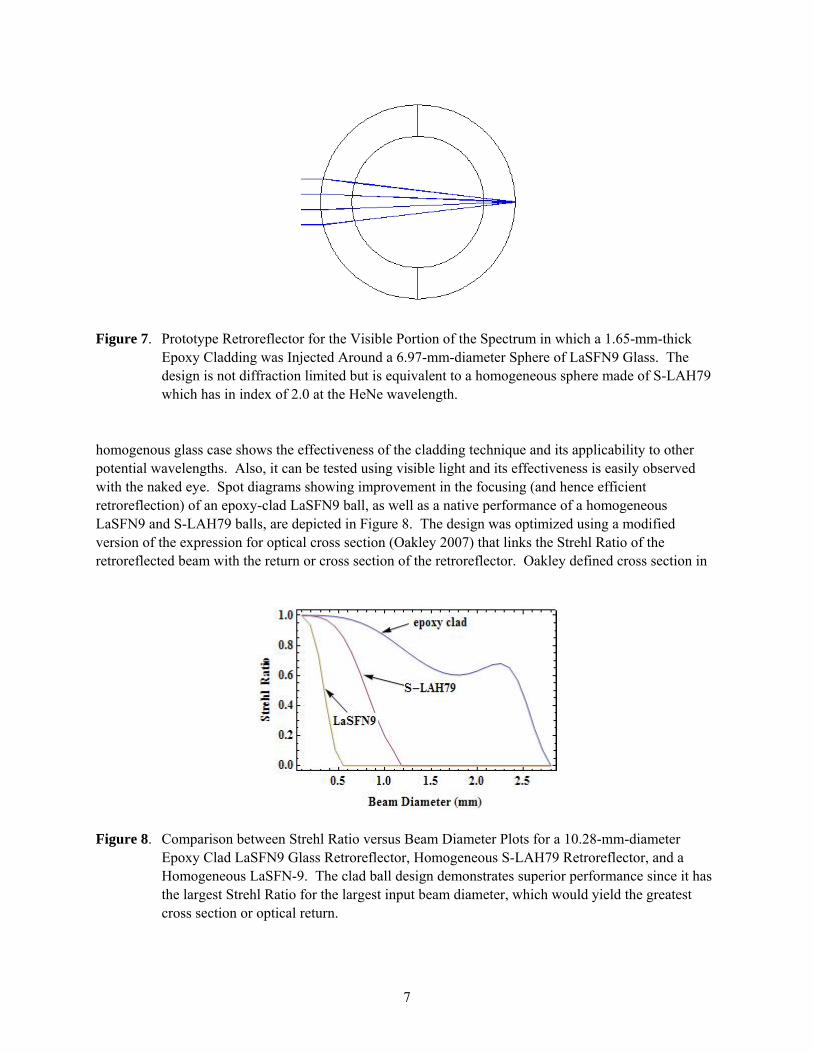
Figure 7. Prototype Retroreflector for the Visible Portion of the Spectrum in which a 1.65-mm-thick
Epoxy Cladding was Injected Around a 6.97-mm-diameter Sphere of LaSFN9 Glass. The design is not diffraction limited but is equivalent to a homogeneous sphere made of S-LAH79 which has in index of 2.0 at the HeNe wavelength.
homogenous glass case shows the effectiveness of the cladding technique and its applicability to other potential wavelengths. Also, it can be tested using visible light and its effectiveness is easily observed with the naked eye. Spot diagrams showing improvement in the focusing (and hence efficient retroreflection) of an epoxy-clad LaSFN9 ball, as well as a native performance of a homogeneous LaSFN9 and S-LAH79 balls, are depicted in Figure 8. The design was optimized using a modified version of the expression for optical cross section (Oakley 2007) that links the Strehl Ratio of the retroreflected beam with the return or cross section of the retroreflector. Oakley defined cross section in
Figure 8. Comparison between Strehl Ratio versus Beam Diameter Plots for a 10.28-mm-diameter
Epoxy Clad LaSFN9 Glass Retroreflector, Homogeneous S-LAH79 Retroreflector, and a Homogeneous LaSFN-9. The clad ball design demonstrates superior performance since it has the largest Strehl Ratio for the largest input beam diameter, which would yield the greatest cross section or optical return.
7
the following manner, where SR is the Strehl Ratio of the returned beam. The Strehl Ratio is the ratio of the on-axis intensity of the returned beam to the return from a perfect mirror.
][)(4
242
3
mdSRdCSλ
π=
3.0 Retroreflector Fabrication
Earlier reports introduced the fabrication concept we proposed that uses glass compression molding (Carpenter et al. 1990). Essentially, it is a three-step process in which we form two cladding hemispherical shells starting with disk preforms using glass compression molding. These components are then assembled to produce the fully clad ball by molding the two shells around the central core in a final molding step. The steps are shown schematically in Figure 9. The glass molding press used to produce the spherical retroreflector is shown in Figure 10. Briefly, glass is molded in an inert atmosphere (N2) within the molding chamber by loading glass preforms (flat windows) into the molds within the molding chamber through the load/unload port. The preforms are shuttled from the load/unload position to the molding position using the manual loading shuttle. Once in place, the molds are brought up to the processing temperature using a resistive heater and then pressed together by the electric ram controlled by a programmable logic controller (PLC). The part is formed by using a pre-determined press profile described by time, temperature, and ram position. Finally, the finished part is shuttled to the load/unload port for removal and the press is ready for the next fabrication step in the process cycle.
Step 1 Step 2
Slump disk preform in hemispherical mold
Load ball core and press
Step 1 Step 2
Slump disk preform in hemispherical mold
Load ball core and press
Figure 9. Schematic Showing the Process Used to Produce Step Index Spherical Retroreflectors by
Glass Compression Molding
8
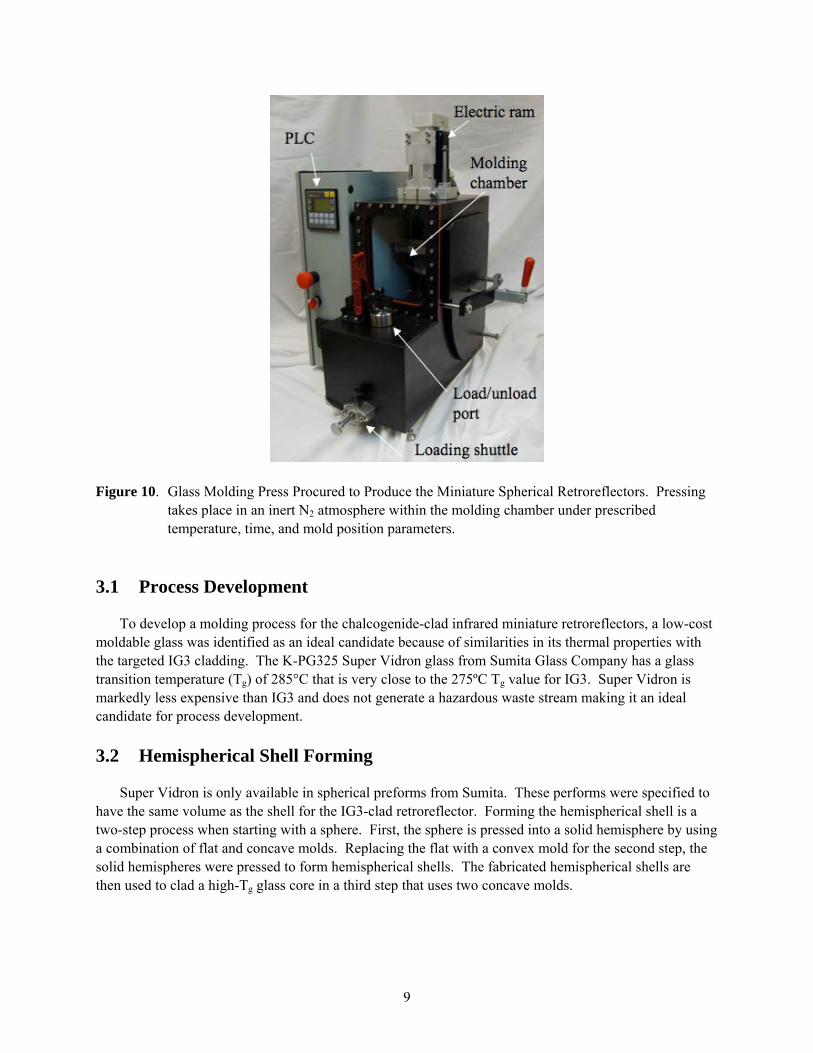
Figure 10. Glass Molding Press Procured to Produce the Miniature Spherical Retroreflectors. Pressing
takes place in an inert N2 atmosphere within the molding chamber under prescribed temperature, time, and mold position parameters.
3.1 Process Development
To develop a molding process for the chalcogenide-clad infrared miniature retroreflectors, a low-cost moldable glass was identified as an ideal candidate because of similarities in its thermal properties with the targeted IG3 cladding. The K-PG325 Super Vidron glass from Sumita Glass Company has a glass transition temperature (Tg) of 285°C that is very close to the 275ºC Tg value for IG3. Super Vidron is markedly less expensive than IG3 and does not generate a hazardous waste stream making it an ideal candidate for process development. 3.2 Hemispherical Shell Forming
Super Vidron is only available in spherical preforms from Sumita. These performs were specified to have the same volume as the shell for the IG3-clad retroreflector. Forming the hemispherical shell is a two-step process when starting with a sphere. First, the sphere is pressed into a solid hemisphere by using a combination of flat and concave molds. Replacing the flat with a convex mold for the second step, the solid hemispheres were pressed to form hemispherical shells. The fabricated hemispherical shells are then used to clad a high-Tg glass core in a third step that uses two concave molds.
9
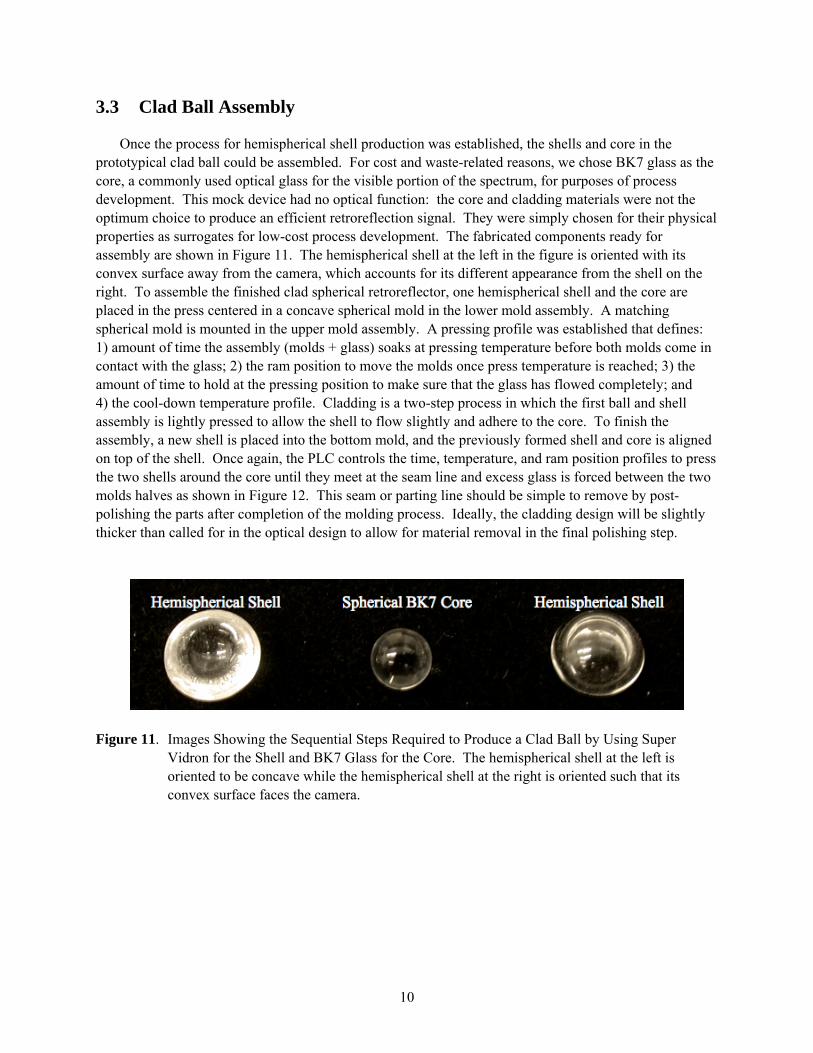
3.3 Clad Ball Assembly
Once the process for hemispherical shell production was established, the shells and core in the prototypical clad ball could be assembled. For cost and waste-related reasons, we chose BK7 glass as the core, a commonly used optical glass for the visible portion of the spectrum, for purposes of process development. This mock device had no optical function: the core and cladding materials were not the optimum choice to produce an efficient retroreflection signal. They were simply chosen for their physical properties as surrogates for low-cost process development. The fabricated components ready for assembly are shown in Figure 11. The hemispherical shell at the left in the figure is oriented with its convex surface away from the camera, which accounts for its different appearance from the shell on the right. To assemble the finished clad spherical retroreflector, one hemispherical shell and the core are placed in the press centered in a concave spherical mold in the lower mold assembly. A matching spherical mold is mounted in the upper mold assembly. A pressing profile was established that defines: 1) amount of time the assembly (molds + glass) soaks at pressing temperature before both molds come in contact with the glass; 2) the ram position to move the molds once press temperature is reached; 3) the amount of time to hold at the pressing position to make sure that the glass has flowed completely; and 4) the cool-down temperature profile. Cladding is a two-step process in which the first ball and shell assembly is lightly pressed to allow the shell to flow slightly and adhere to the core. To finish the assembly, a new shell is placed into the bottom mold, and the previously formed shell and core is aligned on top of the shell. Once again, the PLC controls the time, temperature, and ram position profiles to press the two shells around the core until they meet at the seam line and excess glass is forced between the two molds halves as shown in Figure 12. This seam or parting line should be simple to remove by post-polishing the parts after completion of the molding process. Ideally, the cladding design will be slightly thicker than called for in the optical design to allow for material removal in the final polishing step.
Figure 11. Images Showing the Sequential Steps Required to Produce a Clad Ball by Using Super
Vidron for the Shell and BK7 Glass for the Core. The hemispherical shell at the left is oriented to be concave while the hemispherical shell at the right is oriented such that its convex surface faces the camera.
10

Figure 12. Picture Sequence Showing the Assembly of the Clad Ball. The hemispherical shells are
arranged around the core (left) and pressed to yield the final assembly (right). 3.4 IR Retroreflector Fabrication
The process development using Super Vidron allowed us to become acquainted with the subtleties of the press and the compression molding steps. Once the initial process development steps yielded acceptable examples of clad balls, our work was shifted to the infrared materials to determine if there were any issues not uncovered by working with Super Vidron and various core materials. One significant difference in the move to infrared materials is the shape of the preform used to form the shells. IG3 is procured in disk form, with appropriate thickness and diameter chosen to ensure the correct shell volume. Our prior work using spherical preforms capitalized on the self-centering nature of the spherical component within the concave mold surface, while the new disk preform places a greater demand on the now manual process of centering the preform in the mold. With this one caveat, the fabrication steps were replicated as previously described in the process development section with the exception that the windows were pressed into shells using the combination of a convex and concave mold. Initial prototypes were fabricated using both ZnS and gallium lanthanum sulfide (GLS) glass balls. GLS is an attractive chalcogenide cladding glass, because it has a high melting point and with a higher coefficient of thermal expansion (CTE) that is better matched to the IG3 cladding glass. Matching the CTE is essential to ensuring the mechanical integrity of the retroreflector as a function of temperature. A picture showing the hemispherical shells formed from the IG3 disk preforms and the GLS core are shown in Figure 13. The partially assembled and fully molded spherical retroreflector are shown in Figure 14.
Figure 13. IG3 Hemispherical Shells Shown Flanking a GLS 5-mm Spherical Core
11
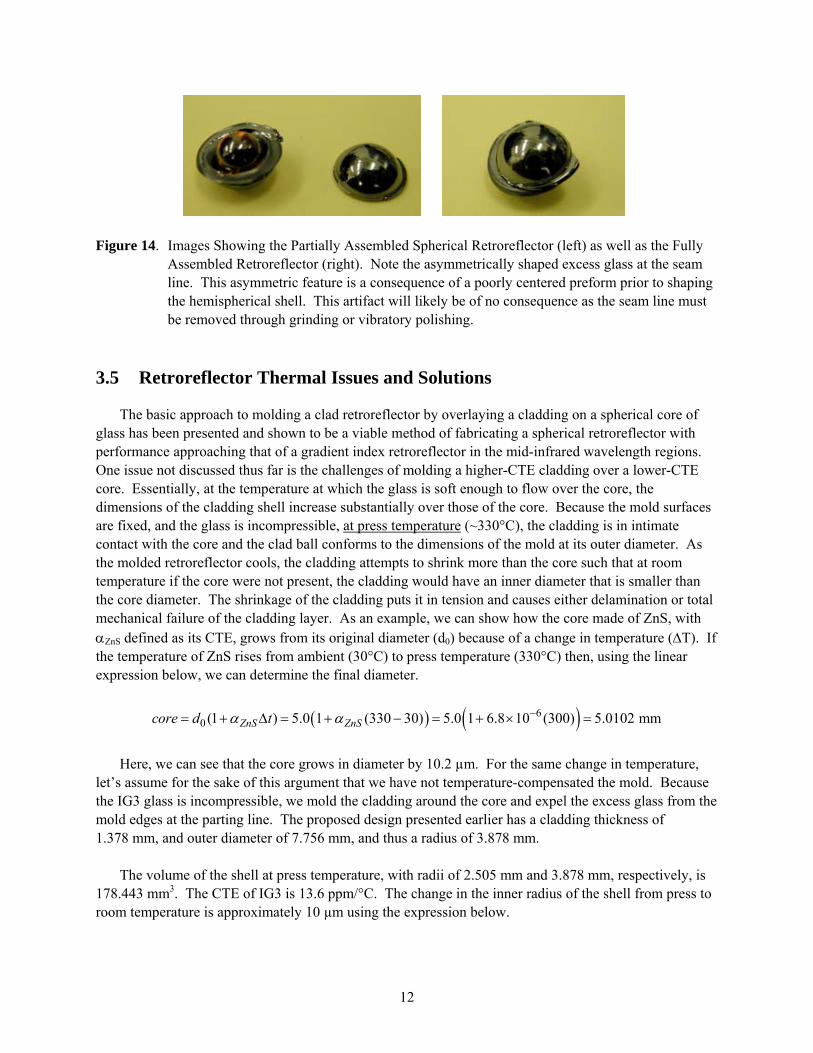
Figure 14. Images Showing the Partially Assembled Spherical Retroreflector (left) as well as the Fully
Assembled Retroreflector (right). Note the asymmetrically shaped excess glass at the seam line. This asymmetric feature is a consequence of a poorly centered preform prior to shaping the hemispherical shell. This artifact will likely be of no consequence as the seam line must be removed through grinding or vibratory polishing.
3.5 Retroreflector Thermal Issues and Solutions
The basic approach to molding a clad retroreflector by overlaying a cladding on a spherical core of glass has been presented and shown to be a viable method of fabricating a spherical retroreflector with performance approaching that of a gradient index retroreflector in the mid-infrared wavelength regions. One issue not discussed thus far is the challenges of molding a higher-CTE cladding over a lower-CTE core. Essentially, at the temperature at which the glass is soft enough to flow over the core, the dimensions of the cladding shell increase substantially over those of the core. Because the mold surfaces are fixed, and the glass is incompressible, at press temperature (~330°C), the cladding is in intimate contact with the core and the clad ball conforms to the dimensions of the mold at its outer diameter. As the molded retroreflector cools, the cladding attempts to shrink more than the core such that at room temperature if the core were not present, the cladding would have an inner diameter that is smaller than the core diameter. The shrinkage of the cladding puts it in tension and causes either delamination or total mechanical failure of the cladding layer. As an example, we can show how the core made of ZnS, with αZnS defined as its CTE, grows from its original diameter (d0) because of a change in temperature (ΔT). If the temperature of ZnS rises from ambient (30°C) to press temperature (330°C) then, using the linear expression below, we can determine the final diameter.
( ) ( )60 (1 ) 5.0 1 (330 30) 5.0 1 6.8 10 (300) 5.0102 mmZnS ZnScore d tα α −= + Δ = + − = + × =
Here, we can see that the core grows in diameter by 10.2 µm. For the same change in temperature, let’s assume for the sake of this argument that we have not temperature-compensated the mold. Because the IG3 glass is incompressible, we mold the cladding around the core and expel the excess glass from the mold edges at the parting line. The proposed design presented earlier has a cladding thickness of 1.378 mm, and outer diameter of 7.756 mm, and thus a radius of 3.878 mm. The volume of the shell at press temperature, with radii of 2.505 mm and 3.878 mm, respectively, is 178.443 mm3. The CTE of IG3 is 13.6 ppm/°C. The change in the inner radius of the shell from press to room temperature is approximately 10 µm using the expression below.
12

mmr IGinner 010.050509.2300106.1350509.2300 63 −=⋅⋅×−=⋅⋅−=Δ −α
So, we see that at room temperature, the core shrinks back to a radius of 2.5 mm, but the inner radius of the IG3 shell tries to shrink to 2.505 mm–0.010 mm or 2.495 mm. As the shell tries to reach this equilibrium value for its radius that is 5 µm smaller than the core radius, the tensile stresses increase in the cladding until it shatters. An alternative solution for the core material has been considered that uses the GLS chalcogenide glass, which has a CTE of 10 ppm/ºK. This is about 1.5X as large as that of ZnS, and so the mismatch of cladding and ball radii at room temperature will be only one half as much, or about 2.5 µm, which may be small enough to result in thermally stable spherical retroreflectors. Unfortunately, GLS is only available from a United Kingdom supplier, ChG Southampton, and attempts to contact them to obtain additional technical information and quotations have been without success to date. Therefore, we will pursue a dual path of obtaining GLS glass if possible and also to consider assembly of the hemispherical shells and core ball at room temperature using a room-temperature-curable epoxy.
4.0 Optical Characterization of Retroreflectors
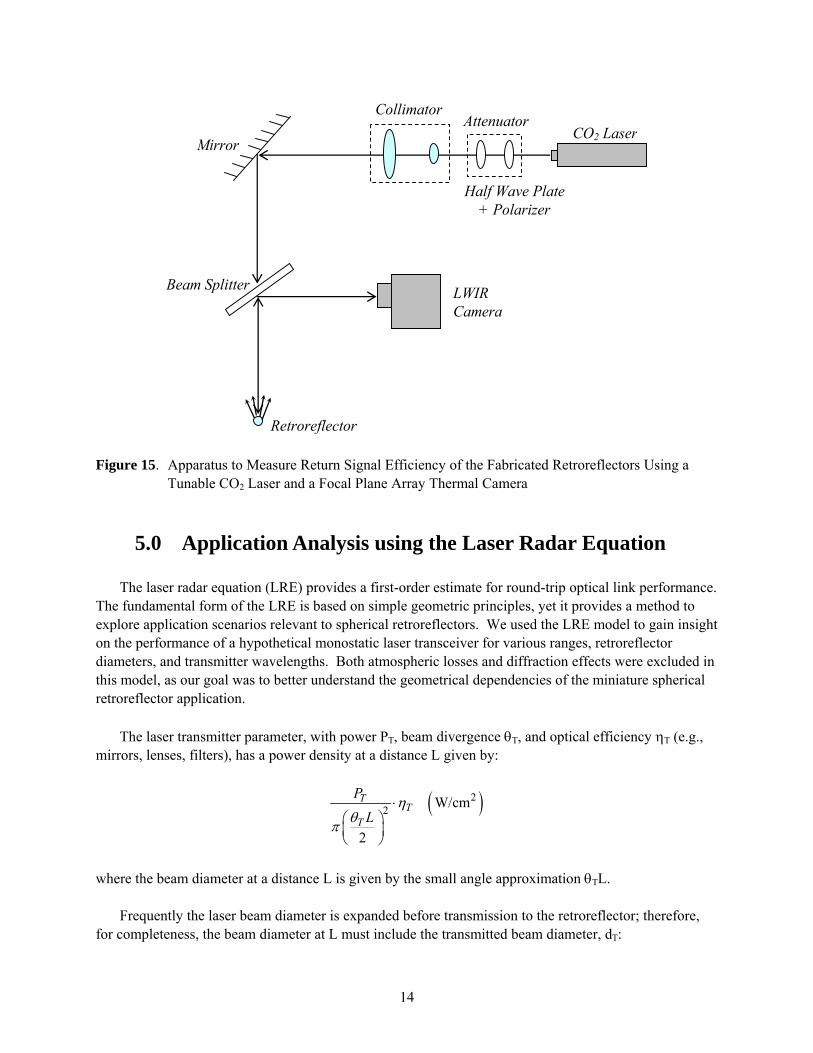
An apparatus was built to measure the efficiency of return signals from the fabricated retroreflectors at the long-wave infrared wavelength of operation. The apparatus comprises a tunable CO2 laser that spans the infrared spectrum from 9.3 to 10.8 µm in conjunction with an infrared microbolometer or ferroelectric focal plane array thermal imaging camera. A schematic of the apparatus is provided in Figure 15. The combination of the half-wave plate and polarizer together function as a variable attenuator to limit the amount of power that impinges the focal plane array, thereby preventing pixel damage. The emitted beam from the CO2 laser is expanded to provide an approximate 25-mm beam diameter, which is subsequently used to overfill the prototype retroreflector under test. A portion of the retroreflected signal is reflected by the beam splitter and directed to the focal plane array for analysis. This apparatus will be modified in the future to accommodate a scanning detector with a large dynamic range to facilitate profiling the retroreflected beam. Efficiency will be determined by finding the fraction of the returned light when compared with the intensity of the light incident on a perfect mirror of equivalent cross section.
13
CO2 Laser Mirror
Beam Splitter
Attenuator
Half Wave Plate + Polarizer
Collimator
LWIR Camera
Retroreflector Figure 15. Apparatus to Measure Return Signal Efficiency of the Fabricated Retroreflectors Using a
Tunable CO2 Laser and a Focal Plane Array Thermal Camera
5.0 Application Analysis using the Laser Radar Equation
The laser radar equation (LRE) provides a first-order estimate for round-trip optical link performance. The fundamental form of the LRE is based on simple geometric principles, yet it provides a method to explore application scenarios relevant to spherical retroreflectors. We used the LRE model to gain insight on the performance of a hypothetical monostatic laser transceiver for various ranges, retroreflector diameters, and transmitter wavelengths. Both atmospheric losses and diffraction effects were excluded in this model, as our goal was to better understand the geometrical dependencies of the miniature spherical retroreflector application. The laser transmitter parameter, with power PT, beam divergence θT, and optical efficiency ηT (e.g., mirrors, lenses, filters), has a power density at a distance L given by:
( )22 W/cm
2
TT
T
P
Lη
θπ
⋅⎛ ⎞⎜ ⎟⎝ ⎠
where the beam diameter at a distance L is given by the small angle approximation θTL. Frequently the laser beam diameter is expanded before transmission to the retroreflector; therefore, for completeness, the beam diameter at L must include the transmitted beam diameter, dT:
14
( )22 W/cm
2
TT
T T
P
L dη
θπ
⋅+⎛ ⎞
⎜ ⎟⎝ ⎠
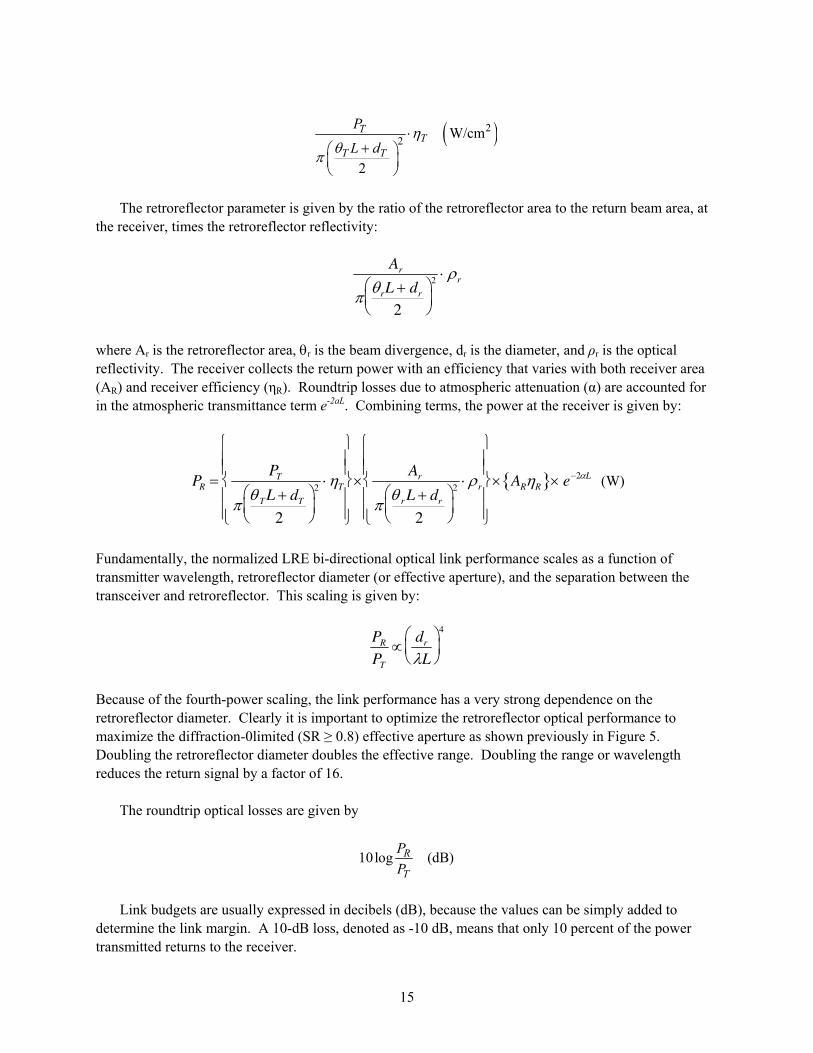
The retroreflector parameter is given by the ratio of the retroreflector area to the return beam area, at the receiver, times the retroreflector reflectivity:
Ar
π θrL + dr
2
⎛ ⎝ ⎜
⎞ ⎠ ⎟
2 ⋅ ρr
where Ar is the retroreflector area, θr is the beam divergence, dr is the diameter, and ρr is the optical reflectivity. The receiver collects the return power with an efficiency that varies with both receiver area (AR) and receiver efficiency (ηR). Roundtrip losses due to atmospheric attenuation (α) are accounted for in the atmospheric transmittance term e-2aL. Combining terms, the power at the receiver is given by:
PR =PT
π θ TL + dT
2
⎛ ⎝ ⎜
⎞ ⎠ ⎟
2 ⋅ηT
⎧
⎨ ⎪ ⎪
⎩ ⎪ ⎪
⎫
⎬ ⎪ ⎪
⎭ ⎪ ⎪
×Ar
π θ rL + dr
2
⎛ ⎝ ⎜
⎞ ⎠ ⎟
2 ⋅ ρr
⎧
⎨ ⎪ ⎪
⎩ ⎪ ⎪
⎫
⎬ ⎪ ⎪
⎭ ⎪ ⎪
× ARηR{ }× e−2αL (W)
Fundamentally, the normalized LRE bi-directional optical link performance scales as a function of transmitter wavelength, retroreflector diameter (or effective aperture), and the separation between the transceiver and retroreflector. This scaling is given by:
PR
PT
∝dr
λL
⎛ ⎝ ⎜
⎞ ⎠ ⎟
4
Because of the fourth-power scaling, the link performance has a very strong dependence on the retroreflector diameter. Clearly it is important to optimize the retroreflector optical performance to maximize the diffraction-0limited (SR ≥ 0.8) effective aperture as shown previously in Figure 5. Doubling the retroreflector diameter doubles the effective range. Doubling the range or wavelength reduces the return signal by a factor of 16. The roundtrip optical losses are given by
10log (dB)R
T
PP
Link budgets are usually expressed in decibels (dB), because the values can be simply added to determine the link margin. A 10-dB loss, denoted as -10 dB, means that only 10 percent of the power transmitted returns to the receiver.
15

5.1 Modeling Results
Our analysis began by determining the optimum transmitted laser beam diameter for link ranges of 100, 500, 1000, and 2000 meters. The parameters for this analysis consisted of a fixed 8-mm-diameter retroreflector, 250-mm-diameter receiver aperture, and transmitter wavelengths of 1.257 µm (a wavelength available on PNNL’s mini-LIDAR system) and 9-µm (typical quantum cascade laser wavelength). The optical system and the atmospheric transmittance were neglected in this analysis. Ray-trace modeling of an optimized clad ball retroreflector has demonstrated that only roughly 50 percent of the retroreflector diameter provides a diffraction-limited retroreflection for long wave infrared wavelengths, based on Strehl Ratio analysis. Diffraction effects become more pronounced as the wavelength is reduced. Typically only 10 percent of the aperture maintains a Strehl Ratio ≥ 0.8 for wavelengths near 1 µm. For the purpose of this modeling, a 0.5 and 0.1 effective aperture was used for
the 9-µm and 1.257-µm modeling, respectively. The roundtrip optical loss (10log R
T
PP
) versus launch
beam diameter for transmitter wavelengths of 1.257 µm and 9 µm are shown in Figure 16 and Figure 17, respectively. The modeling results show that the optimum transmitter beam diameter increases with increasing range while the functional dependence becomes less pronounced.
Figure 16. Beam Propagation Modeling at a Wavelength of 1.257 µm to Determine the Optimum
Transmitter Beam Diameter
16
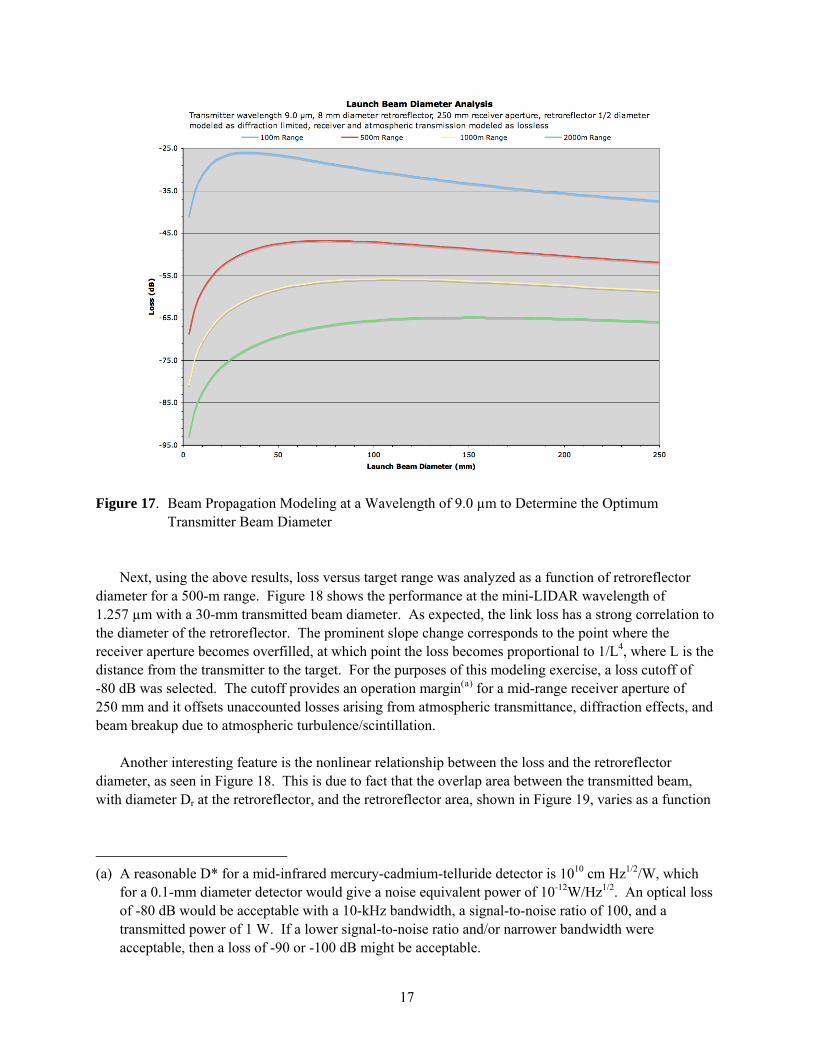
Figure 17. Beam Propagation Modeling at a Wavelength of 9.0 µm to Determine the Optimum
Transmitter Beam Diameter Next, using the above results, loss versus target range was analyzed as a function of retroreflector diameter for a 500-m range. Figure 18 shows the performance at the mini-LIDAR wavelength of 1.257 µm with a 30-mm transmitted beam diameter. As expected, the link loss has a strong correlation to the diameter of the retroreflector. The prominent slope change corresponds to the point where the receiver aperture becomes overfilled, at which point the loss becomes proportional to 1/L4, where L is the distance from the transmitter to the target. For the purposes of this modeling exercise, a loss cutoff of -80 dB was selected. The cutoff provides an operation margin(a) for a mid-range receiver aperture of 250 mm and it offsets unaccounted losses arising from atmospheric transmittance, diffraction effects, and beam breakup due to atmospheric turbulence/scintillation. Another interesting feature is the nonlinear relationship between the loss and the retroreflector diameter, as seen in Figure 18. This is due to fact that the overlap area between the transmitted beam, with diameter Dr at the retroreflector, and the retroreflector area, shown in Figure 19, varies as a function
(a) A reasonable D* for a mid-infrared mercury-cadmium-telluride detector is 1010 cm Hz1/2/W, which
for a 0.1-mm diameter detector would give a noise equivalent power of 10-12W/Hz1/2. An optical loss of -80 dB would be acceptable with a 10-kHz bandwidth, a signal-to-noise ratio of 100, and a transmitted power of 1 W. If a lower signal-to-noise ratio and/or narrower bandwidth were acceptable, then a loss of -90 or -100 dB might be acceptable.
17
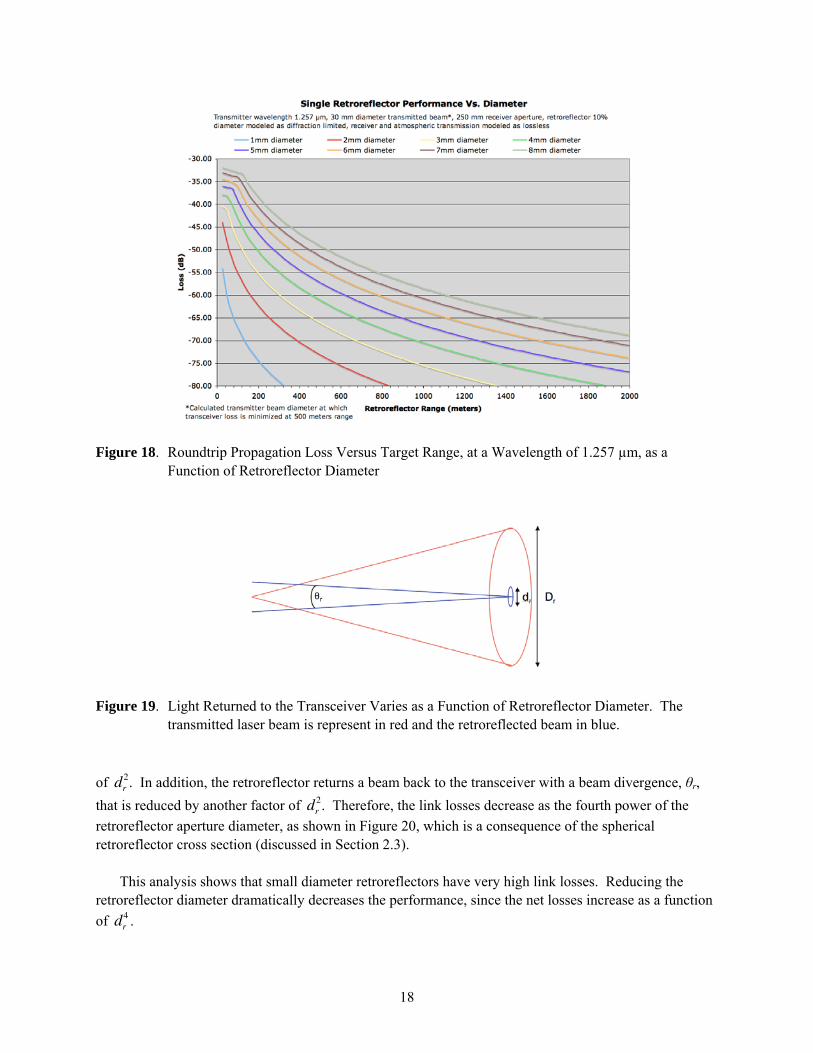
Figure 18. Roundtrip Propagation Loss Versus Target Range, at a Wavelength of 1.257 µm, as a
Function of Retroreflector Diameter
Figure 19. Light Returned to the Transceiver Varies as a Function of Retroreflector Diameter. The transmitted laser beam is represent in red and the retroreflected beam in blue.
of . In addition, the retroreflector returns a beam back to the transceiver with a beam divergence, θr, that is reduced by another factor of . Therefore, the link losses decrease as the fourth power of the retroreflector aperture diameter, as shown in
dr2
dr2
Figure 20, which is a consequence of the spherical retroreflector cross section (discussed in Section 2.3). This analysis shows that small diameter retroreflectors have very high link losses. Reducing the retroreflector diameter dramatically decreases the performance, since the net losses increase as a function of . dr
4
18

Figure 20. Relative Loss in dB as a Function of Retroreflector Diameter, Demonstrating the d Scaling r
4
Figure 21 shows the link loss for a quantum cascade laser transmitter at 9.0 µm, with a transmit beam diameter of 30 mm. The onset of the 1/L4 loss is evident at shorter ranges compared to data shown in Figure 17. As the transmitter wavelength is increased, the link losses are increased by increased beam divergence because of diffraction, which is linearly dependent on wavelength, for both the transmitted beam and the retro-reflected beam.
Figure 21. Roundtrip Propagation Loss Versus Target Range as a Function of Retroreflector Diameter at
a Wavelength of 9.0 µm
19
This first-order analysis provides a useful insight into the practical application space for miniature spherical retroreflectors. Many practical applications will be limited to short ranges (up to ~2000 m) with single retroreflectors having diameters that range from 4 to 8 mm. Smaller diameters and longer ranges are possible by using either a larger receiver aperture (with a transportation, weight, and cost penalty) or by using laser transmitters with higher powers. However, the maximum permissible exposure level of 100 mW/cm2 for eye and skin exposure (ANSI 2000) sets the upper limit for open path laser power.
6.0 Summary and Conclusions
The design and fabrication progress to date for producing miniature infrared spherical retroreflectors has been described in this report. It includes design information for both IR and visible wavelengths, process development using visible glass (Super Vidron), and initial process development using infrared chalcogenide cladding glass (IG3 from Vitron GmbH). Exploration of the parameter space for the custom molding press and initial process development for fabricating molded retroreflectors was performed using BK7 and Super Vidron glass, as the core and cladding, respectively. This enabled us to gain working knowledge of the press and insight into some of the retroreflector fabrication challenges at a lower material cost and considerably reduced hazardous waste stream as compared to using chalcogenide infrared materials. The thermal expansion mismatch between the core and cladding materials was identified as a major challenge in both Super Vidron–BK7 and IG3–ZnS material systems. This issue has limited our progress with retroreflector fabrication. This is an unfortunate consequence of the clustering of physical properties for the family of moldable glasses; namely, low glass transition temperatures that permit low-temperature molding in combination with high CTE. The IG3–GLS design can potentially mitigate this effect to a greater extent, but a search for better CTE-matched core and cladding glasses is underway. Alternatively, optical epoxy can be used to bond the compression-molded cladding shells to the ball core to form a spherical retroreflector. Although there will be an epoxy seam line several microns in thickness that may distort and possibly attenuate the incoming beam, the effects on retroreflector performance should be negligible. A bonding epoxy will be selected that has minimal impact on the mid-infrared transmission. Additionally, depending on the application scenario, the retroreflector could be aligned such that the seam line is not in the propagation path of the incident beam. First-order modeling has been performed to better understand the geometrical dependencies of the miniature spherical retroreflector application. Long-wave infrared applications will generally be limited to relatively short ranges (up to ~2000 m) with single retroreflectors having realistic diameters that range from 4 mm to 8 mm. Because of the fourth power scaling, the link performance has a very strong dependence on the retroreflector diameter. Clearly it is important to optimize the retroreflector optical performance to maximize the diffraction-limited (SR ≥ 0.8) effective aperture as shown previously in Figure 5. Illuminating multiple retroreflector targets may improve the link performance, but it is likely that the performance will be limited by speckle noise because of optical interference between the light returned from neighboring retroreflectors. A single retroreflector may actually provide better performance over arrays of smaller retroreflectors because a single retroreflector does not suffer from laser speckle noise. Further investigation and modeling is planned in the future to assess implications of laser speckle for a multiple retroreflector configuration.
20
7.0 References
Aitken BG, SC Currie, BC Monahan, L-M Wu, and EW Coonan. 2006. “Chalcogenide glass for low viscosity extrusion and injection molding.” US Patent No. 7,116,211 B2. Anheier NC, Jr., BE Bernacki, BR Johnson, BJ Riley and WA Sliger. 2005. FY 2005 Miniature Spherical Retroreflectors Final Report. PNNL-15577. Pacific Northwest National Laboratory, Richland, Washington. Anheier NC, Jr., BE Bernacki and K Krishnaswami. 2006. FY 2006 Miniature Spherical Retroreflectors Final Report. PNNL-16320. Pacific Northwest National Laboratory, Richland, Washington. ANSI. 2000. The American National Standard for the Safe Use of Lasers. ANSI Z136.1-2000. American National Standards Institute, New York. Burmistrov V, N Parkhomenko, Y Roy, V Shargorodsky, JD Vasiliev, S Habib, V Glotov, and N Sokolov. 2002. “Spherical retroreflectors with an extremely small target error: International experiment in space,” in Proceedings of 13th International Workshop on Laser Ranging. Washington, DC. pp. 1–6. Carpenter LL, RJ Hagerty, RO Maschmeyer, ML Morrell, and PA Schrauth. 1990. “Method of Molding Glass Optical Element.” US Patent 4,929,265. Handerek V, C. Boulet, M. Griffith, and L. Laycock. 2006. “Coherent System Tests of Experimental Retroreflectors with Very Wide Field of View for Free-Space Optical Communications,” 3rd EMRS DTC Technical Conference Digest. Klocek P, Ed. 1991. Handbook of Infrared Optical Materials. Marcel Dekker, New York. p. 415. Koike Y, Y Sumi and Y Ohtsuka. 1986. “Spherical gradient-index sphere lens.” Appl Optics 25:3356–3363. Luneburg RK. 1944. Mathematical Theory of Optics. Brown University, Rhode Island. pp. 189-213. Luneburg RK. 1964. Mathematical Theory of Optics. University of California Press, Berkeley. pp. 182-187. Oakley JP. 2007. “Whole-angle spherical retroreflector using concentric layers of homogeneous optical media.” Appl Optics 46:1026–1031. Takatsuji T, M Goto, S Osawa, R Yin and T Kurosawa. 1999. “Whole-viewing-angle cat’s eye retroreflector as a target of laser trackers.” Meas Sci Technol 10:N97–N90. Welford WT. 1986. Aberrations of Optical Systems. Adam Hilger, Boston.
21

22
Zurcher W, R Loser and SA Kyle. 1995. “Improved retroreflector for interferometric tracking in three dimensions.” Opt Eng 34:2740–2743.
PNNL-17287
Distribution No. of Copies OFFSITE
Dr. Victoria T. Franques United States DOE NNSA/NA-22 1000 Independence Ave. SW Washington, DC 20585 Dr. Rhys M. Williams United States DOE NNSA/NA-22 1000 Independence Ave. SW Washington, DC 20585 Mr. Ralph Hastings United States DOE NNSA/NA-22 1000 Independence Ave. SW Washington, DC 20585 Mr. Eric Sanders United States DOE NNSA/NA-22 1000 Independence Ave. SW Washington, DC 20585
Mr. W. Randy Bell United States DOE NNSA/NA-22 1000 Independence Ave. SW Washington, DC 20585
No. of Copies
Dr. Vaughn Standley United States DOE NNSA/NA-22 1000 Independence Ave. SW Washington, DC 20585
ONSITE 13 Pacific Northwest National Laboratory
Anheier, NC (4) K5-25 Bernacki, BE K5-25 Bruckner-Lea, C K5-25 Clemmer, RG K8-02 Dudder, GB K8-29 Krishnaswami, K K5-25 Myers, TL K5-25 Sharpe, SW K8-88 Information Release Office (2) K1-06
Distr.1

PNNL-17287
Distr.2