FY 10/3 First Half Results PresentationContents 1. FY 10/3 First Half Results 2. FY 10/3 Full Year...
25
FY 10/3 First Half Results Presentation http://www.dts.co.jp/en/ November 16, 2009 DTS Corporation
Transcript of FY 10/3 First Half Results PresentationContents 1. FY 10/3 First Half Results 2. FY 10/3 Full Year...

FY 10/3 First HalfResults Presentation
http://www.dts.co.jp/en/
November 16, 2009
DTS Corporation

Contents
1. FY 10/3 First Half Results2. FY 10/3 Full Year Forecast
Sales and income forecasts included in this document are based on assumptions made on the basis of information currently available, including business trends, economic circumstances, clients’ trends, etc., and can be affected by various uncertainties. Actual sales and income may differ materially from the forecasts.
Caution

1. FY 10/3 First Half Results

Non-Consolidated Results
Amount Ratio to sales (%) YoY (%) vs. initial
forecast
Net sales 16,066 - 83.7 91.3
Gross profit 1,606 10.0 50.6 57.8
Operating income 97 0.6 6.5 8.3
Recurring income 261 1.6 15.2 19.9
Net income 188 1.2 19.4 24.3
(Units: Million yen, %)
4

Sales by Service (non-consolidated)
(Units: Million yen, %) Amount Ratio to sales (%) YoY (%) vs. initial
forecast
IT Services 15,777 98.2 84.6 91.2
System 10,419 64.9 82.7 90.1Operation 5,358 33.3 88.6 93.3
Products 288 1.8 52.4 96.2Total 16,066 100.0 83.7 91.3
5
Mainly system sales decreased because of reduced ITspending in response to the economic downturn
and the conclusion of integration projects.

Sales by End Users (non-consolidated, information services)
Decline in finance sales attributable to the conclusionof integration projects.
Strong public sector sales.
6
Finance (80.2% YoY) - Largely attributable to the conclusion of
integration projects in the year-ago period.- In real terms (excluding the effect of
concluding integration projects), sales up year on year, reflecting growth in finance projects for the next fiscal year.
Communications (88.9% YoY)- Decline in certain carrier projects.- Solid performance in next-generation
communication network projects.
Services (84.3% YoY)- Declined given reduced IT spending from
second half of last fiscal year
Manufacturing (70.0% YoY) - Decline in specified customer projects.
Other (104.7% YoY)- Strong public sector sales
Million yen
Finance Communications Services Manufacturing Other
6,693
4,945
4,190
1,350 1,469
944
4,398
3,533
5,365
1,537
0
1,000
2,000
3,000
4,000
5,000
6,000
7,000
8,000FY 09/3 H1
FY 10/3 H1 (current term)
Down around 1,400 million, but fell with the conclusion ofintegration projects

Gross Profit (non-consolidated)
7
Gross profit: ¥1,606 million (50.6% YoY; 10.0% of sales (-6.5% pts YoY))
Gross profit margin down due to (1) higher indirect cost ratio,(2) loss-making projects, and (3) less favorable contract terms.
Reduction in
outsourcing expenses
Loss-making
projects
Prom
otion ofin-house production
Improvem
ent inoperating
efficiency
Decline in labor
utilization ratio
Project orders w
ithless favorable
terms
Higher indirect
cost ratio, etc.FY 09/3H1
FY 10/3H1
10.0%
+0.4%
-2.2%
-3.2%
-2.7%16.5%
+0.2%
+1.8%-0.8%

Non-operating income: ¥163 million (75.0% YoY; 1.0% of sales (-0.1% pts YoY))
SG&A expenses: ¥1,509 million (90.1% YoY; 9.4% of sales (+0.7% pts YoY))
Operating Income, Recurring Income (non-consolidated)
8
Operating income: ¥97 million (6.5% YoY; 0.6% of sales (-7.2% pts YoY))
Recurring income: ¥261 million (15.2% YoY; 1.6% of sales (-7.3% pts YoY))
Decreased dividend income, etc. -¥54 million
Reduction as a result of cost-cutting efforts -¥181 millionRise in strategic investment (new business, etc.) +¥16 million
Significant reduction in SG&A expenseas a result of cost-cutting initiatives.
Strategic investment outlays conducted in line with the plan.
Net income: ¥188 million (19.4% YoY; 1.2% of sales (-3.9% pts YoY))

Consolidated Results
(Units: Million yen, %) AmountRatio to sales (%)
YoY (%) vs. initial forecast
Consolidated/non-consolidated
ratio
Net sales 25,269 - 84.8 93.6 1.57 times
Gross profit 2,823 11.2 57.4 68.5 1.76 times
Operating income 74 0.3 4.2 6.4 0.76 times
Recurring income 177 0.7 9.4 14.9 0.68 times
Net income -264 - - - -
- SG&A expenses: ¥2,749 million (87.7% YoY; 10.9% of sales (+0.4% pts))- Extraordinary loss: ¥244 million (adjustment for unrealized profits on intra-
group transactions from prior years, etc.)9

Group Company Results(Units: Million yen, %) Sales Operating income
Company name Amount YoY (%) vs. initial forecast Amount Ratio to
sales (%) YoY (%) vs. initial forecast
DATALINKS Corporation 4,571 104.3 109.0 170 3.7 111.4 139.5
JAPAN SYSTEMSENGINEERING Corporation 2,352 79.7 91.9 -274 - [-147] [-30]
FAITEC Corporation 2,311 86.6 101.0 168 7.3 59.2 86.4
SOUGOU SYSTEMSERVICE Corporation 506 71.1 81.1 19 3.8 22.0 86.8
KYUSHU DTS Corporation 491 82.1 91.0 13 2.8 74.3 50.3
MIRUCA Corporation 205 95.5 98.6 38 18.8 55.2 206.3
ASTERISK INC. 62 384.3 96.4 0 0.6 [+43] [+0]
Notes:Figures for each company are on a non-consolidated basis, so the total does not equal consolidated figures.Figures in brackets represent FY 10/3 amount minus FY 09/3 amount. 10

■■Develop system integration (Develop system integration (SI) SI) structurestructure□ Bolster infrastructure construction capability and
hardware procurement capability.⇒⇒Acquire SI business from Digital Technologies Acquire SI business from Digital Technologies
Corporation (slated for December 1)Corporation (slated for December 1)
Measures for Growth, and Results (1)
11
DTS GroupConsulting,
Application development
Maintenance, Operation
Digital Technologies Corporation (SI business)
Infrastructure construction, Hardware procurement
Bolster SI capabilityBolster SI capability

Measures for Growth, and Results (2)■■Develop SI structure (contDevelop SI structure (cont’’d)d)
□ Adopt international standards for development and operational processes.⇒Launch initiatives to achieve CMMI Level 5 in March
2011 (planned)□ Strengthen offshore structure.
⇒Capital participation in two BP firms in China (Shanghai, Dalian)
⇒Strengthening ties in Vietnam□ Train employees in advanced skills.
(current term)FY 08/3 H1 FY 09/3 H1 FY 10/3 H1
⇒External standards 170.0% 178.4% 197.6%⇒ Internal certifications 384 578 960
12

Measures for Growth, and Results (3)■■New business New business (press releases)(press releases)
13
Jul. 31
Signed the ASTERIA Master Partner Agreement withInfoteria, and strengthened links with the SaaS business
Aug. 3
Launched business intelligence (BI) tool "Data Studio@WEB Ver.2"
Aug. 25
Launched the integrated ID management system "Jix@s"
Sep. 1
Launched the location information management system "iZCOM"
Sep. 15
Developed the Bank of Tokyo-Mitsubishi UFJ’s"Branch Temporary Deposit Management System" and marketed system to other financial institutions.

Measures for Growth, and Results (4)Steady growth in both the (1) prime or SI ratio and
(2) number of customers (with sales record)
Number of customers (companies)Prime or SI ratio (%)
14
213221
229
229
251
27.6%31.5%
40.6%
50.1%52.7%
0.0%
10.0%
20.0%
30.0%
40.0%
50.0%
60.0%
FY 06/3 H1 FY 07/3 H1 FY 08/3 H1 FY 09/3 H1 FY 10/3 H1100
200
300Companies
2. FY 10/3 Full Year Forecast
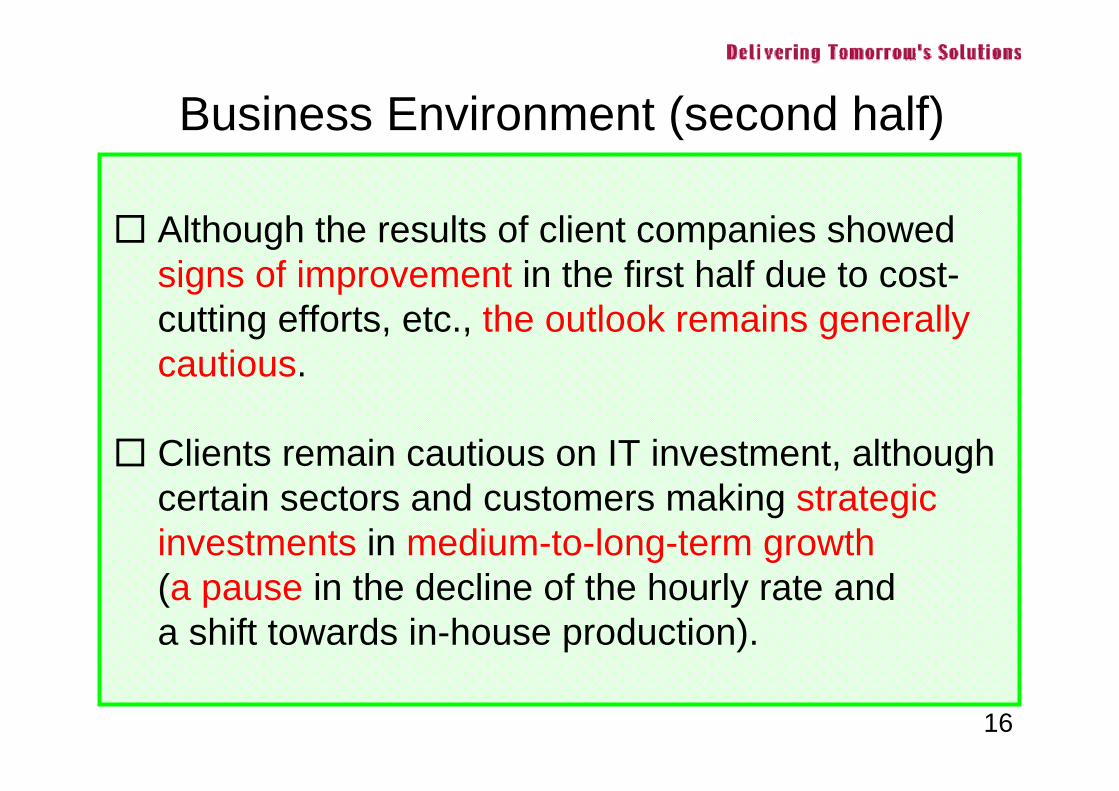
Business Environment (second half)
□ Although the results of client companies showed signs of improvement in the first half due to cost-cutting efforts, etc., the outlook remains generally cautious.
□ Clients remain cautious on IT investment, although certain sectors and customers making strategic investments in medium-to-long-term growth(a pause in the decline of the hourly rate anda shift towards in-house production).
16
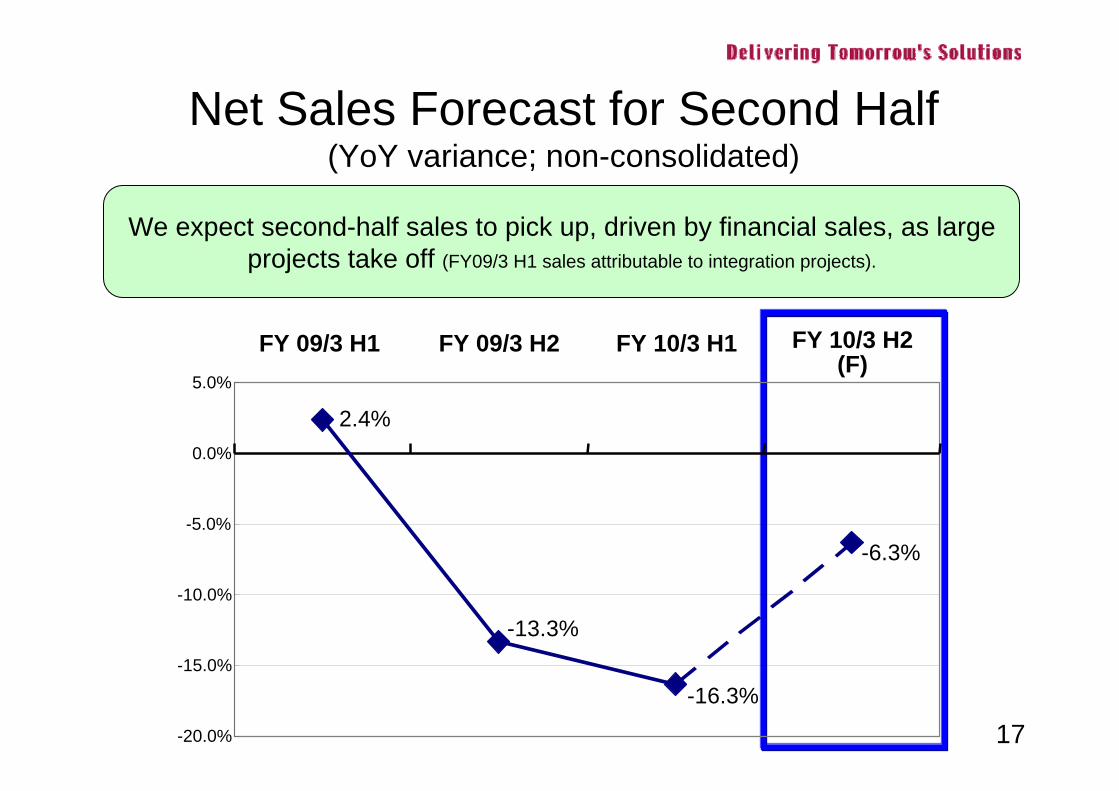
We expect second-half sales to pick up, driven by financial sales, as large projects take off (FY09/3 H1 sales attributable to integration projects).
17
Net Sales Forecast for Second Half (YoY variance; non-consolidated)
2.4%
-13.3%
-16.3%
-6.3%
-20.0%
-15.0%
-10.0%
-5.0%
0.0%
5.0%
FY 09/3 H1 FY 09/3 H2 FY 10/3 H1 FY 10/3 H2(F)

Profit Margin Forecast for Second Half(gross profit margin; non-consolidated)
Improvement in the gross margin due to (1) increased project profitability,(2) a lower indirect cost ratio as a result of increased sales,
and (3) improvement in labor utilization ratio, etc.
18
Gross profit margin(non-consolidated)
FY 10/3H1
+1.9%
10.0%
15.9%
FY 10/3H2
(forecast)
+0.8%
+3.2%
Increased projectprofitability
Improvem
ent in laborutilization ratio*
Lower indirect cost ratio as
a result of increased sales
*Project orders with m
ore favorable term
s, improvem
ent in operating efficiency, low
er outsourcing costs, etc.

Second Half Year Forecast (consolidated/non-consolidated)
(Units: Million yen, %)
Amount Ratio to sales YoY
Consolidated/non-consolidated
ratio
26,530 - 87.9 1.48 times
4,476 16.9 94.3 1.57 times
1,425 5.4 84.1 1.24 times
1,493 5.6 87.4 1.27 times
734 2.8 109.8 1.08 times
Amount Ratio to sales YoY
17,934 - 93.7
2,843 15.9 98.3
1,152 6.4 93.7
1,179 6.6 92.7
682 3.8 114.7
ConsolidatedNon-consolidated
Net sales
Gross profit
Operating income
Recurring income
Net income
19
Increased earnings through improvement in thenon-consolidated gross-profit margin.
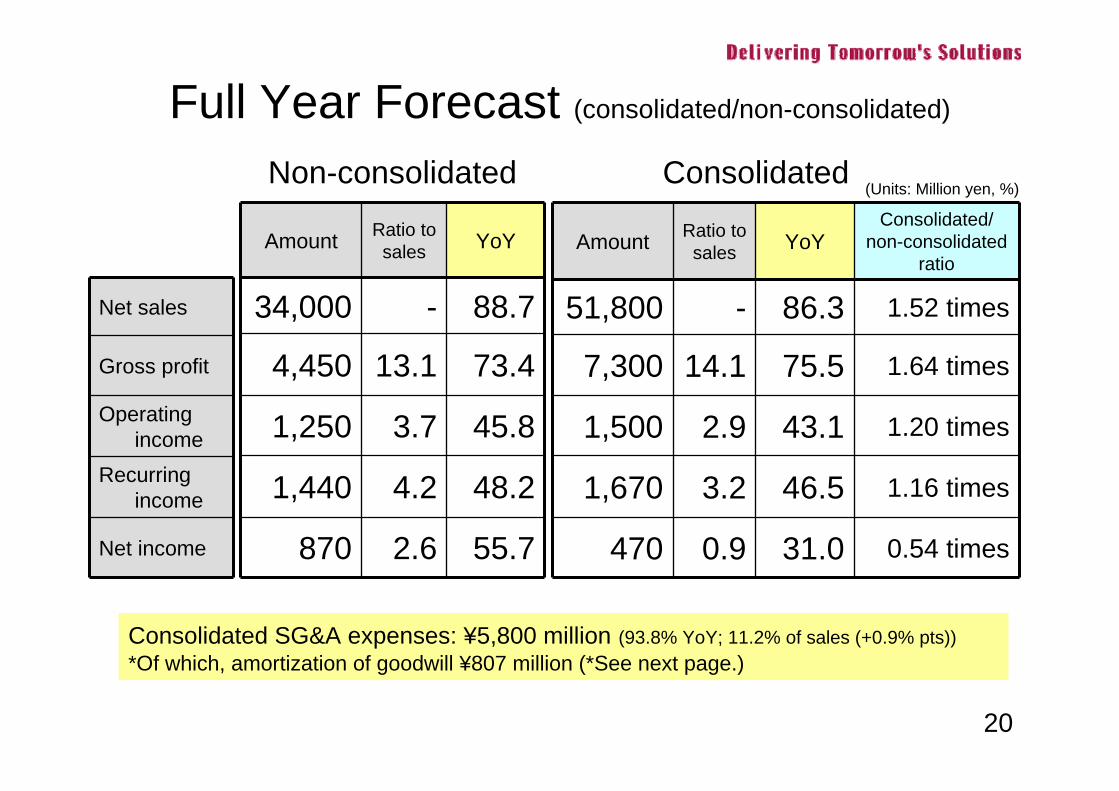
Consolidated SG&A expenses: ¥5,800 million (93.8% YoY; 11.2% of sales (+0.9% pts))*Of which, amortization of goodwill ¥807 million (*See next page.)
Full Year Forecast (consolidated/non-consolidated)
Amount Ratio to sales YoY
Consolidated/non-consolidated
ratio
51,800 - 86.3 1.52 times
7,300 14.1 75.5 1.64 times
1,500 2.9 43.1 1.20 times
1,670 3.2 46.5 1.16 times
470 0.9 31.0 0.54 times
Amount Ratio to sales YoY
34,000 - 88.7
4,450 13.1 73.4
1,250 3.7 45.8
1,440 4.2 48.2
870 2.6 55.7
Net sales
Gross profit
Operating income
Recurring income
Net income
20
(Units: Million yen, %)ConsolidatedNon-consolidated

(Ref.) Trends in Amortization of Goodwill
21
Estimated decreaseof around 450million yen
*Goodwill amortization expense for Digital Technologies
Corporation yet to be determined.
Amortization of Goodwill (consolidated SG&A expenses)Million yen
0
200
400
600
800
1,000
FY 07/3 FY 08/3 FY 09/3 FY 10/3(F)
FY 11/3(F)
FY 12/3(F)

Full Year Forecast for Group Companies
(Units: Million yen, %) Sales Operating income
Company name Amount YoY (%) AmountRatio to sales (%)
YoY (%)
DATALINKS Corporation 8,203 92.1 280 3.4 71.7JAPAN SYSTEMS
ENGINEERING Corporation 4,978 82.3 -274 - [-142]
FAITEC Corporation 4,700 84.8 392 8.3 67.5SOUGOU SYSTEM
SERVICE Corporation 1,272 90.2 120 9.5 74.8KYUSHU DTS Corporation 1,100 92.1 53 4.8 107.0MIRUCA Corporation 408 103.8 16 4.2 21.4ASTERISK INC. 112 159.8 -19 - [+34]
22Notes:Figures for each company are on a non-consolidated basis, so the total does not equal consolidated figures.Figures in brackets represent FY 10/3 amount minus FY 09/3 amount.

Measures for Growth (second half)■■Developing an SIDeveloping an SI structurestructure
□ Develop the capability to create system infrastructure and procure hardware.⇒Generate synergies with Digital Technologies
Corporation.□ Adopt international standards for development
and operational processes.⇒CMMI Level 5 Launch pilot application
□ Strengthen offshore structure.⇒Step up offshore development as well as
development directed at local firms (DTS Shanghai).□ Train employees in advanced skills.
⇒Adopt more sophisticated training (upstream development process, operational design, etc.).
23

Measures for Growth (second half)
■■New businessNew business□ Housing solutions
⇒Virtual simulations (applying cloud computing), Housing information packages, Environmental business (solar energy generation simulation)
□ Solutions for financial institutions⇒Sales support packages (financing proposals, mobile CRM)
□ BI tool⇒Full launch of Data Studio@WEB Ver.2
□ SI for small and medium businesses⇒Commencement of advisory business
24
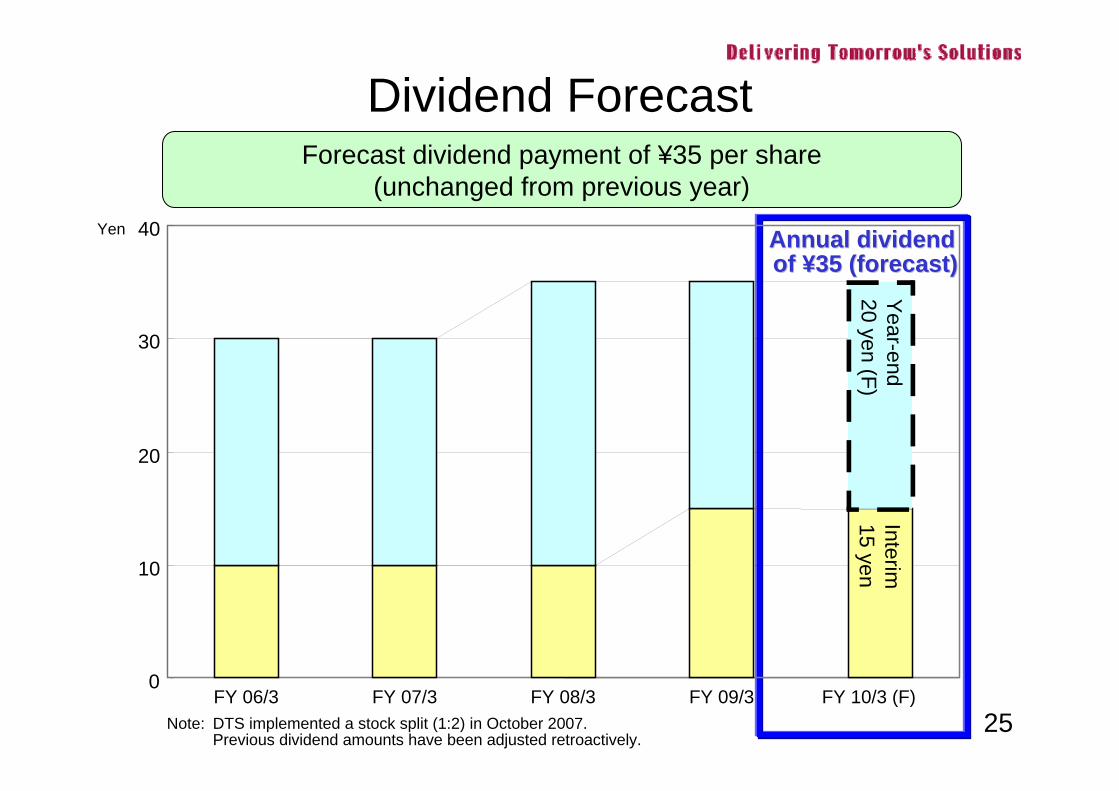
Dividend ForecastForecast dividend payment of ¥35 per share
(unchanged from previous year)
Note: DTS implemented a stock split (1:2) in October 2007. Previous dividend amounts have been adjusted retroactively.
25
Annual dividend Annual dividend of of ¥¥35 (forecast)35 (forecast)
0
10
20
30
40
FY 06/3 FY 07/3 FY 08/3 FY 09/3 FY 10/3 (F)
YenY
ear-end20 yen (F)
Interim15 yen