Fuzzy transfer learning in time series forecasting for ...
13
Fuzzy transfer learning in time series forecasting for stock market prices Shanoli Samui Pal , Samarjit Kar Abstract Transfer learning involves transferring prior knowledge of solving similar problems in order to achieve quick and efficient solution. The aim of fuzzy transfer learning is to transfer prior knowledge in an imprecise environment. Time series like stock market data are non-linear in nature and movement of stock is uncertain, so it is quite difficult following the stock market and in decision making. In this study, we propose a method to forecast stock market time series in the situation when we can use prior experience to make decisions. Fuzzy transfer learning (FuzzyTL) is based on knowledge transfer in that and adapting rules obtained domain. Three different stock market time series data sets are used for comparative study. It is observed that the effect of knowledge transferring works well together with smoothing of dependent attributes as the stock market data fluctuate with time. Finally, we give an empirical application in Shenzhen stock market with larger data sets to demonstrate the performance of the model. We have explored FuzzyTL in time series prediction to unerstand the essence of FuzzyTL. We were working on the question of the capability of FuzzyTL in improving prediction accuracy. From the comparisons, it can be said fuzzy transfer learning with smoothing improves prediction accuracy efficiently. Keywords: Fuzzy transfer learning, time series fore- casting, stock market data 1 Introduction Stock market is unpredictable as there are several com- plex factors influencing its movements. Therefore the trend of the series is also affected by those factors and by their non-linear relationship. In stock market forecast- ing, technical analysis is one of the traditional meth- ods applied by investors for decision making. There are some other statistical methods such as autoregres- sive conditional heteroscedasticity (ARCH) model [1], generalized ARCH (GARCH) model [2], autoregressive moving average (ARMA) model [3], autoregressive in- tegrated moving average (ARIMA) model [3]. All these Department of Mathematics, NIT Durgapur, Durgapur 713209, West Bengal, India, (email: [email protected]) Department of Mathematics, NIT Durgapur, Durgapur 713209, West Bengal, India, (email: kar s [email protected]) models are different types of regression models assuming some mathematical distribution, those distributions are not always followed by realistic stock market time series data. Nowadays, several data mining approaches like evo- lutionary algorithms, artificial neural networks, fuzzy logic, rough set theory, and their hybridization have been developed. All these approaches perform well in forecasting of stock markets. Back propagation neural network have been used to find the fuzzy relationship in fuzzy time series [4]. A hybridized genetic algorithm and neural network model has been developed to pre- dict stock price index [5]. Caia [6] proposed a hybrid GA model based on fuzzy time series together with ge- netic algorithm (FTSGA) working on TAIEX as experi- mental data set and concluded that the model improved the accuracy. Teoh et al.[7] proposed a hybrid model based on multi-order fuzzy time series by using rough sets theory to mine fuzzy logical relationships from time series and an adaptive expectation model to improve forecasting accuracy on TAIEX and National Associa- tion of Securities Dealers Automated Quotations (NAS- DAQ) experimental data sets. Pai and Lin [8] developed a hybrid ARIMA and support vector machine model in stock price forecasting. There are several pieces of work on fuzzy time se- ries. A novel method on fuzzy time series had been pro- posed by Wang and Mendel [12] involving fuzzification of real data set, rule generation, rule reduction to reduce rule redundancy, defuzzification to real value, and finally forecasting from the analysis. The model had been ap- plied on truck backer-upper control, Mackey-Glass time series prediction. Traditional data mining technologies are not capable of handling the information when there is a time gap in their collection periods. Traditional data mining does not consider the domain transfer concept when inferenc- ing from information hidden in data. Transfer learning is the technology which works in situations like domain dif- ference. It has been successfully applied to several areas of application like classification problems [13],[14], col- laborative filtering problems [15], graph-based method on identifying games [16]. Fuzzy logic based transfer learning is the new technique which works on infor- mation with uncertainty, or, in imprecise environment. Shell and Coupland [17] proposed a fuzzy logic based transfer learning (TL) to form a prediction model in In- telligent Environments (IEs). They compared their re- 1
Transcript of Fuzzy transfer learning in time series forecasting for ...

Fuzzy transfer learning in time series forecasting for stock market prices
Shanoli Samui Pal*, Samarjit Kar�
Abstract
Transfer learning involves transferring prior knowledgeof solving similar problems in order to achieve quick andefficient solution. The aim of fuzzy transfer learning isto transfer prior knowledge in an imprecise environment.Time series like stock market data are non-linear innature and movement of stock is uncertain, so it isquite difficult following the stock market and in decisionmaking. In this study, we propose a method to forecaststock market time series in the situation when we canuse prior experience to make decisions. Fuzzy transferlearning (FuzzyTL) is based on knowledge transferin that and adapting rules obtained domain. Threedifferent stock market time series data sets are usedfor comparative study. It is observed that the effectof knowledge transferring works well together withsmoothing of dependent attributes as the stock marketdata fluctuate with time. Finally, we give an empiricalapplication in Shenzhen stock market with larger datasets to demonstrate the performance of the model. Wehave explored FuzzyTL in time series prediction tounerstand the essence of FuzzyTL. We were working onthe question of the capability of FuzzyTL in improvingprediction accuracy. From the comparisons, it can besaid fuzzy transfer learning with smoothing improvesprediction accuracy efficiently.
Keywords: Fuzzy transfer learning, time series fore-casting, stock market data
1 Introduction
Stock market is unpredictable as there are several com-plex factors influencing its movements. Therefore thetrend of the series is also affected by those factors and bytheir non-linear relationship. In stock market forecast-ing, technical analysis is one of the traditional meth-ods applied by investors for decision making. Thereare some other statistical methods such as autoregres-sive conditional heteroscedasticity (ARCH) model [1],generalized ARCH (GARCH) model [2], autoregressivemoving average (ARMA) model [3], autoregressive in-tegrated moving average (ARIMA) model [3]. All these
*Department of Mathematics, NIT Durgapur, Durgapur713209, West Bengal, India, (email: [email protected])
�Department of Mathematics, NIT Durgapur, Durgapur713209, West Bengal, India, (email: kar s [email protected])
models are different types of regression models assumingsome mathematical distribution, those distributions arenot always followed by realistic stock market time seriesdata.
Nowadays, several data mining approaches like evo-lutionary algorithms, artificial neural networks, fuzzylogic, rough set theory, and their hybridization havebeen developed. All these approaches perform well inforecasting of stock markets. Back propagation neuralnetwork have been used to find the fuzzy relationshipin fuzzy time series [4]. A hybridized genetic algorithmand neural network model has been developed to pre-dict stock price index [5]. Caia [6] proposed a hybridGA model based on fuzzy time series together with ge-netic algorithm (FTSGA) working on TAIEX as experi-mental data set and concluded that the model improvedthe accuracy. Teoh et al.[7] proposed a hybrid modelbased on multi-order fuzzy time series by using roughsets theory to mine fuzzy logical relationships from timeseries and an adaptive expectation model to improveforecasting accuracy on TAIEX and National Associa-tion of Securities Dealers Automated Quotations (NAS-DAQ) experimental data sets. Pai and Lin [8] developeda hybrid ARIMA and support vector machine model instock price forecasting.
There are several pieces of work on fuzzy time se-ries. A novel method on fuzzy time series had been pro-posed by Wang and Mendel [12] involving fuzzificationof real data set, rule generation, rule reduction to reducerule redundancy, defuzzification to real value, and finallyforecasting from the analysis. The model had been ap-plied on truck backer-upper control, Mackey-Glass timeseries prediction.
Traditional data mining technologies are not capableof handling the information when there is a time gap intheir collection periods. Traditional data mining doesnot consider the domain transfer concept when inferenc-ing from information hidden in data. Transfer learning isthe technology which works in situations like domain dif-ference. It has been successfully applied to several areasof application like classification problems [13],[14], col-laborative filtering problems [15], graph-based methodon identifying games [16]. Fuzzy logic based transferlearning is the new technique which works on infor-mation with uncertainty, or, in imprecise environment.Shell and Coupland [17] proposed a fuzzy logic basedtransfer learning (TL) to form a prediction model in In-telligent Environments (IEs). They compared their re-
1

sult with the method proposed by Wang and Mendel[12].
We are motivated by the concept of transferringknowledge in a similar application domain. We havelearnt from the application of FuzzyTL prediction modelby [17] in Intelligent Environments, and applied our ob-tained knowledge in the stock market time series, whcihis a bit different from IEs where the data sources are sen-sors. But, in both cases FuzzyTL has been applied forprediction purpose. So, we adapted this concept as thepurpose of both the use cases is prediction. The maincontributions of this paper are : (1) multi-attributes ofstock market data are represented as labeled and unla-beled data, (2) fuzzy transfer learning (FuzzyTL) is yetnot explored in the time series forecasting, so it has beenexplored in time series of stock market price with modi-fication, (3) FuzzyTL has been applied on three differentstock market time series for results comparison with themodel proposed by Wang and Mendel [12], Chen[18],and Cheng [19], and (4) a case study on Shenzhen stockprice with a larger data set.
The remainder of this paper is organized as follows.First, there is a brief discussion on transfer learning inSection 2. In Section 3, we introduce fuzzy transferlearning. Our proposed approach is presented in Sec-tion 4. Data sets descriptions are given in Section 5.Results and discussions have been presented in Section6. A case study on Shenzhen stock price is elaboratedin Section 7. In section 8, we have summerized our workand discussed limitations of it. Finally, our conclusionsand future research directions are presented in Section9. The appendix is given thereafter.
2 Basic of transfer learning (TL)
Transfer learning (TL) contains two principle elements,a Domain and a Task. Pan and Yang [9] defined Do-main as a pair of two components : a feature spaceX and a marginal probability distribution P(X) whereX = x1, x2, ..., xn and Task as a pair of two compo-nents : a label space Y = y1, y2, ..., yn and a predictivefunction f(.). The predictive function can be learnedfrom the training data which is a pair (xi, yi), xi ∈X and yi ∈ Y . The source domain can be defined asDs = (xs1 , ys1), (xs2 , ys2), ..., (xsn , ysn), where xs ∈ Xis the input data point and ys ∈ Y is the correspond-ing label. The task domain can be defined as Dt =(xt1 , yt1), (xt2 , yt2), ..., (xtn , ytn), where xt ∈ X is the in-put data point and yt ∈ Y is the corresponding output.
Transfer learning (TL) can be defined as : ([9], [10])Given a source domain Ds and a learning task Ts, atarget domain Dt and a learning task Tt, objective ofthe TL process is to improve the learning of a new taskTt through the transfer of knowledge from previously-acquired knowledge or task Ts by the learning of thepredictive function ft(.) in the target domain Dt where,
Ds 6= Dt or Ts 6= Tt.When the source and target domains are the same
(Ds = Dt) and their learning tasks are also same (Ts =Tt), then the learning problem becomes a traditional ma-chine learning problem. Based on the application pointof view, TL techniques can be classified into four cate-gories such as (a) Neural network in transfer learning,(b) Bayesian techniques in transfer learning, (c) fuzzylogic in transfer learning, and (d) transfer learning withevolutionary algorithms [11].
In this work we are focusing on fuzzy transfer learningin stock market time series analysis and prediction. It isdiscussed briefly in the following section.
3 Fuzzy transfer learning(FuzzyTL)
FuzzyTL is the combination of fuzzy logic (FL) and TLto bridge the knowledge gap by the learning process andan adaptation from the learning process of one contextto another. The change of context may be due to changeof domain, missing information, change of situation etc.TL has the ability to transfer knowledge from one situ-ation to another. Here, knowledge can be in the form ofinformation.
There are two distinct processes : one is transferringthe fuzzy concepts along with their inter relationship andanother is the adaptation of the fuzzy concepts.In the first process, source data are used to developFuzzy Inference System (FIS), which consists of fuzzysets and fuzzy rules. FIS captures the knowledge fromthe source and is used to transfer it to the target task.The second process is the adaptation of the FIS. Theadaptation process uses the knowledge learned from pre-vious information to the unlabeled task data set. Thisprocess adapts the individual components of the FIS tocapture the variations in the data. Alterations and vari-ations from situation to situation are absorbed throughthe changes made within the domains of the fuzzy setsand adaptations of the rulebase.
� Fuzzy framework for producing output:
1. In FuzzyTL, a source domain Ds can be de-fined as
Ds = {(xs1, xs2, ys)}Ns (1)
where x1, x2 ∈ X are inputs, y ∈ Y is anoutput, and N is the number of data tuplesin the source domain. The domains of theeach input and output are the intervals, i.e.,the universe of discourse of that particular do-main. Based on this definition, a source do-main can be defined using the interval denotedas DI
s = {[x1sL, x1sR], [x2sL, x2sR], [ysL, ysR]}.
2

A domain with fuzzy sets of two inputs and aoutput is defined as
Ds = {(fXs1 ,
f Xs2 ,
f Y s)}Ns (2)
where fXs1 and fXs
2 are fuzzy inputs and fY s
is the fuzzy output.The universe of discourse of each input andoutput is partitioned into equal number of par-titions or unequal number of partitions as perthe requirement. Membership function of thefuzzy sets can be Gaussian, Triangular etc.
2. Fuzzy rulebase :Rulebase containing two antecedent and oneconsequent sets can be constructed as :
R = {fXr1 ,
f Xr2 ,
f Y r}P (3)
where X1 and X2 are the inputs, Y is theoutput, and P is the number of rules. Thisrulebase is called exhaustive rulebase whenP = N .
If N is large, then the number of rules is alsolarge. So, the rulebase is reduced by the fol-lowing mechanism proposed by Shell and Cou-pland [17], which will be discussed in next stepTransferring fuzzy concepts.
After reducing the rulebase, fuzzy sets are de-fuzzified to get the output of the target domainby using the method proposed by Wang andMendel [12], given in Appendix.
3. Transferring fuzzy concepts : This is thefirst stage of generating the FIS (Fuzzy Infer-ence System) of FuzzyTL. This method usesnumerical data of labeled data i.e., the pair ofinput and output to produce the sets and ruleswhich are previously discussed. A rule reduc-tion method is used to reduce the repetition ofrules and the impact of anomalous data, andincreases the use of information mostly sup-ported by the numerical data. Fuzzy frequencymeasure [17] is used to form the reduced rule-base. This concept extends the Wang-Mendelmethod.
In standard Wang-Mendel method [12], themembership values of each data instanceare used to decide the strength of a rule.In [17], the FuzzyTL framework uses afrequency value for each rule according tothe number of the repetition of their an-tecedents to capture more information fromthe exhaustive rulebase. FuzzyTL uses thefollowing fuzzy measure function for each rule :
µFreq(F ) = e
−(Fr − c)2
2σ2 (4)
where Fr is the frequency of each rule which isthe input to the function, c is the value Fmax
that denotes the quantity of highest occurringrule, σ is {(Fmax − Fmin) × 0.5}, and Fmin
denotes the quantity of lowest occurring rules.
� Adaptation of the fuzzy concepts :The adaptation of the fuzzy concept consists of thefollowing five stages :
1. External input domain adjustment :Input domains of the source are adapted ac-cording to the target task when a knowledgegap occurs due to the target inputs outsidethe respective intervals. It is adapted if it isneeded as an input domain of the target inputs.The input intervals are adapted if the valueextends beyond the left or right boundaries.The boundaries are adjusted based on the datafrom target domain. Each input is comparedwith the respective interval, if it is less thanthe left boundary, then the left boundary isdecreased to that input value, if it is greaterthan the right boundary, then right boundaryis increased to that input value.
2. Internal input domain adjustment :This work also focuses on input domainadaptation when the knowledge gap occursdue to fully or partially overlapped intervalsof source and target tasks. It also workson input domains. Source input domainsare transferred to adapt the knowledge gapaccording to target the input domains. Thewhole process are described below in fewsteps.Step 1: The target input intervals are com-pared to the source input intervals [xl, xr].Step 2: The adaptation procedure uses thelocal minimum and maximum of the targetvalues to compare with the source values.Step 3: If one, or both of these values liewithin the interval that is represented by thesource values xl and xr, a proximity measure[17] is calculated to decide whether the domainis able to adapt or not. The measure taken isassigning a membership function based on thesource input domain interval.Step 4: Here, in this procedure, a thresholdvalue is considered above which the member-ship function of those intervals is adapted.Otherwise, the local minimum and maximumare accepted as lower and upper end points oftarget values.
3. Output domain adaptation :The adaptation of the output generated from
3

the framework is itself based upon the targetdomain. Gradient control [17] mechanism isused to adapt the knowledge gap in targetconsequent sets. There are few steps describedbelow.Step 1: m sized sliding window data of sourceand target domain are collected for each inputx ∈ X and output y ∈ Y . The output valuesfor target domain are generated beforehandby the framework of the fuzzy set itself usingWang-Mendel [12] defuzzification procedure.Step 2: Gradients are calculated for eachinput and output of source data set, takingthe mean and standard deviation of thoseelements within n window size. The gradientsare obtained by normalization based on thestandard score method defined as
z =x − x
σ(5)
where z is the gradient of input or output par-ticular x, x is the mean, and σ is the standarddeviation of the sliding window.Step 3: Gradients are compared with eachother at each individual input value.Step 4: The differences within the sourceand target gradients show the knowledge gapswhich are required to adapt for improvisingthe unlabeled data. The consequent adapta-tion can be expressed as
dDa = φ
n∑i=1
(gsi − gti) (6)
where dDa denotes the delta to adapt theconsequent sets, φ is a learning parameterthat can be user defined [17], gs and gt are thegradients of source and target data for slidingwindow size n respectively.
Positive differences between source targetoutput gradients produce a reduction in thedomain, whereas negative differences initiatethe enlargement of the domain.
The previous three stages consider the domainadaptation of the fuzzy sets. The followingstages describe the adaptation of the fuzzyrulebase.
4. Rulebase modification according to theadaptation rulebase :Exhaustive rulebase is used to produce anadaptive rulebase. Reduced rulebase andadaptive rulebase are compared to get thefinal rulebase. Reduced rules are examinedand applied to the target domain data to
check their applicability. The exhaustiverulebase is evaluated iteratively to find themost used rules with greater weighting, whichshows greater applicability of those ruleswithin the target domain. The steps are listedgiven below.Step 1: Examine the exhaustive rulebase toidentify the rules those fire using the targetinput data.Step 2: Rules those fire with the highestmembership value from each data point arekept as adaptive rulebase.Step 3: The adaptive rulebase is comparedto the reduced rulebase. The better is keptin adaptive rulebase. Any rule which is inreduced rulebase but not in adaptive rulebase,then that rule is added in the adaptive rule-base.
5. Rule adaptation using Euclidean dis-tance measure :The knowledge gap is not fully covered by pre-viously learned information, it needs new in-formation to remove incompleteness. To do so,the formation of antecedent sets based on do-main adaptation, described in previous stages,is required to move input domains of the targettowards the true state. In the case of the conse-quent set, the euclidean distance based on thesource input values against the target inputvalues is evaluated. The source output cor-responding to the closest source input valuesrepresent the target output of the correspond-ing target inputs, for which Euclidean distancemeasure is calculated.
4 Proposed approach
Transfer learning (TL) can transfer knowledge in theform of information gained through past experience toutilize the same in the similar or sort of similar do-mains of problem. In this paper, FuzzyTL is appliedwith modification to study the stock market data wherewe use a set of labeled data to acquire knowledge andthe gained knowledge is used on unlabeled data predic-tion. Stock market data has basic indexes high price, lowprice, opening price, closing price, volume etc., amongthem, high and low price represents input pair whereasclosing price represents output. In case of labeled data,the mentioned inputs and output are known. As ex-ample, 241 data points are used as labeled data and 84data points are used as unlabeled data of the BSE stockmarket where inputs high and low price are known, butit is assumed that output closing prices are unknown.Another important thing is that, as current time pointdata are highly dependent on just the previous histori-
4

cal data points, we have used here adaptive forecasting.Adaptive forecasting is a smoothing technique with thejust the previous history along with a smoothing factor.
Labeled data set is fuzzified to form the framework ofFuzzyTL which is previously mentioned. Then n num-ber of rules in an exhaustive rulebase are formed basedon maximum membership in their respective input oroutput region where there are n number data points areconsidered in labeled data. To reduce the exhaustiverulebase, the method in section Transferring fuzzyconcepts is used. Then the Wang-Mendel defuzzifica-tion method is used to get the output for unlabeled dataset.
To transfer the knowledge present in the domain aswell as in rulebase all the steps like, External inputdomain adjustment, Internal input domain adjustment,Output domain adaptation according to the adaptationrulebase, discussed previously, are utilized. To transferknowledge from the rulebase, we have followed separatesteps, which are not similar to the forth and fifth stagesdescribed in previous section.
4.1 Adapted rule reduction :
In this section, we describe the modification of FuzzyTLfor our approach. The output values for the target do-main are generated beforehand by the fuzzy sets frame-work itself using Wang-Mendel [12] defuzzification pro-cedure. Now, using the target inputs we find the universeof discourse of the target output and we partition theuniverse into some region. Gaussian memberships arecalculated in each region for each target output. Maxi-mum membership gives the inclusion of each target valuein a particular region and the rules are generated. Thereare some repetitions in the rules. So, rules with the sameantecedent and consequent fuzzy sets form a group andrepresented by one rule. Using those combined rules andWang-Mendel defuzzification method, we get the finaltarget output values.
Another methodology using smoothing factor on justprevious output, the current output is calculated. Thisis called adaptive forecasting. The equation is givenbelow.
Ft = Ot−1 + α× (defuzzFt − Ot−1) (7)
where Ft is the predicted value at tth time point, Ot−1
represents closing price value at (t − 1)th time pointas it is output in our work, α is the smoothing factorwhere 0 < α < 1, and defuzzFt is the defuzzified valueof tth data point.
5 Data sets descriptions
Stock market data are multi-attribute in nature andstock market prediction depends on several factors so it
Table 1: Maximum and minimum of labeled BSE data
Maximum Minimuminput1 28822.369141 20255.519531input2 28538.439453 19963.119141output 28693.990234 20193.349609
is quite difficult to build forecasting models for itself.As there are several factors for stock exchange ups anddowns, it is non-linear in pattern. In our work, basicindices of stock exchange time series data such as highprice, low price and closing price are used to build up themodels. Time series data from three different stock ex-changes are collected as labeled and unlabeled data sets.
� Bombay stock exchange (BSE):BSE’s popular equity index - the S&P BSESENSEX- is India’s mostly tracked stock marketbenchmark index. There are several types of worki.e., stock market analysis, forecasting models onBSE data [20], [21]. In our work, labeled data setsare collected daily from Jan to Dec, 2014 (241 datapoints) and unlabeled data sets are collected dailyfrom Jan to April, 2015 (84 data points) [24].
� New York stock exchange (NYSE):NYSE is American stock exchange, hugely analysedin several research works [22], [23]. In our work,labeled data set is collected daily from Jan to Dec,2014 (252 data points) and unlabeled data setcollected daily from Jan to April, 2015 (82 datapoints) are used [25].
� Taiwan stock exchange corporation(TAIEX):TAIEX is Taiwan stock exchange benchmark index.It is also hugely used in several analyses [6], [7]. Inour work, labeled data set is collected daily fromJan to Dec, 2014 (247 data points) and unlabeleddata set collected daily from Jan to April, 2015 (81data points) are used [26].
6 Result and discussion
Stock indices of high and low price are used as the pairof input and closing price as output. Number of labeleddata and unlabeled data are described in section 5 foreach BSE, NYSE and TAIEX time series.
Here, each input and output data set are partitionedinto 10 overlapping regions, which are represented by10 linguistic variables. The maximum and minimum
5

are used to decide the universe of discourse (UOD). Ta-ble 1, Table 2, Table 3, and Table 4 show the detailsfor the BSE time series. Similar details have been ob-tained for NYSE and TAIEX time series. Table 1 showsthe maximum and minimum for high price (input1), lowprice (input2), and closing price (output) of BSE. UODis [19000, 29000] for each input1, input2, and output.Gaussian membership is calculated for each data pointin each region. Based on the maximum value linguis-tic is assigned to the respective data point. Then, anexhaustive rulebase is obtained.
To reduce repeating the rules, the method proposed byShell and Coupland [17] is followed and we get the num-ber of groups and the members in each group which isshown in Table 2. Table 3 depicts the reduced rulebase.Input domains are adopted using the first three stagesof adaptation of the fuzzy concepts method described insection 3.
Then, Wang-Mendel defuzzification method is used toget the target output from FuzzyTL framework. Theadapted target input domain and the target output orig-inated from FuzzyTL are used to produce a new set ofrulebase for target data set. First, UODs are found out,then those are partitioned into 10 regions. A Gaussianmembership is assigned to each data point with respectto each region. The rulebase is generated based on themaximum membership. Then, the repeated rules are re-duced to get the final set of rulebase. Table 4 shows thenumber of groups and the members of each group for thetarget data set. Finally, Wang-Mendel defuzzification isused to get the final target outputs.
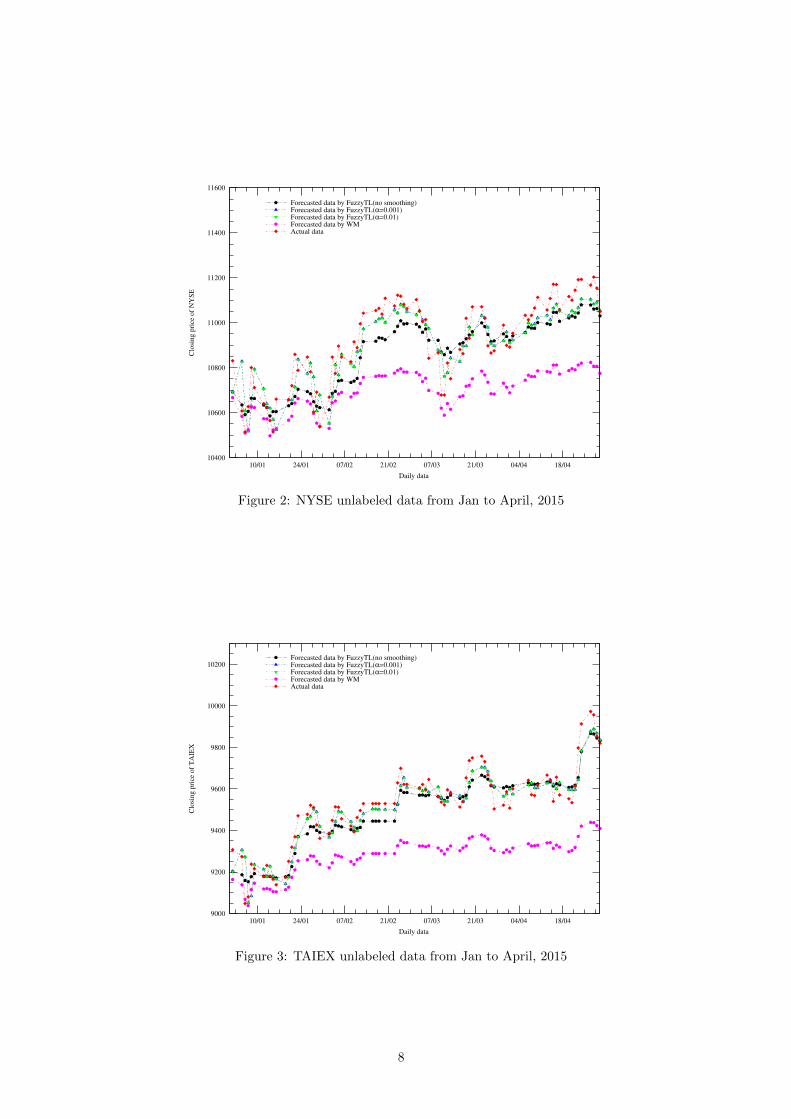
It is well known that, the movement of current stockmarket data highly depends on its previous historicaldata. So, we have tried smoothing techniques, the ex-pressions which is given in equation (7). The result com-parisons of three stock market data are given in Table 5.Root mean square errors (RMSEs) of proposed model to-gether with Wang-Mendel method [12], Chen [18] model,and Cheng [19] models have been presented. In Ta-ble 5, the columns with Wang-Mendel (WM) methodand FuzzyTL with WM are the existing approaches.Our novelty lies in applying the existing FuzzyTL withWM existing method in stock market data and addingsmoothing coefficients with the existing method. Com-parison exhibiting an improved accuracy as compared tothe results obtained in existing methods given in Table 5.RMSE on FuzzyTL with smoothing factors α = 0.001and α = 0.01 are also depicted in Table 5. From theresult, it is observed that FuzzyTL performs better thanthe Wang-Mendel [12], Chen [18], and Cheng [19] meth-ods in learning and transferring experience from pastinformation to uncover better future inferences.
Figure 1, Figure 2, and Figure 3 respectively show theactual and forecasted stock market time series of BSE,NYSE and TAIEX for unlabeled data.
The time complexity of an algorithm depends on
the execution time of each statement of the code. InFuzzyTL code, as well as, the Wang-Mendel code, fortime series prediction, we have used a block of codeswhere the exhaustive rulebase is generated for source do-main. In case of transfer learning, number of unlabeleddata is less than number of labeled data. Labeled dataare considered as source domain and unlabeled data astarget domain. In that block of codes, we need to usethe for-loop N2-times, where N is the number of sourcedata points. So, time complexity of the Wang-Mendelcode is O(N2). But, FuzzyTL takes little bit more timecomparison to Wang-Mendel method as the same blockof code is used for target domain. If M is the number oftarget data points, then time complexity of FuzzyTL isO(N2 +M2) where N > M .
7 Case study on Shenzhen stockprices
Economic conditions in China hugely depend on stockprice movements. Shenzhen stock exchange is one ofthe three stock exchanges in China. There are severalexisting works on Shenzhen stock exchange [27], [28].Opening, high, low, and closing prices of 30 stocks arecollected and analyzed. There are 573 data points ofeach stock from 11th April, 2004 to 3rd Dec, 2015.Among these long period time series data points, wehave considered 80% as labeled data and remaining asunlabeled data. Deciding the domains or UODs of 20%target data points are difficult in case of some Shenzhenstock prices because the time series have sudden ups anddowns. The domains are adapted using first step Exter-nal input domain adjustment discussed in adapta-tion of the fuzzy concepts method described in section3. The output values for target domain are obtainedby adapted Wang-Mendel method [12] after generatingthe set of reduced rules from labeled data. Some of thestock’s original and predicted movement on unlabeleddata are shown in Figure 4. RMSE comparison betweenWang-Mendel method [12] and FuzzyTL are shown inTable 6. It is observed that the forecasting model byusing FuzzyTL performs better in most of the cases incomparison to the model by Wang-Mendel [12]. Boldface fonts shows the better results in Table 6.
7.1 Statistical significant test
In this subsection, we elaborate the non-parametric sta-tistical test Wilcoxon signed-ranks test to test the signif-icant difference between two methods: (1) WM method,and (2) FuzzyTL in time series forecasting. This sta-tistical test examines the null-hypothesis that both themethodologies perform equally well. Data sets on 29stocks of the Shenzhen stock exchange are used to ob-serve the performance of the two mentioned methodolo-gies. RMSEs are tabulated in Table 6 for the actual and
6

Table 2: Exhaustive rulebase for labeled BSE data (Total no of group 25)
Gr. Members
0 0, 9, 10, 11, 12, 13, 14, 15, 16, 17, 44, 45, 46, 49, 50, 51, 53, 54, 55
1 1, 40, 42
2 2, 3, 4, 5, 6, 7, 18, 19, 20, 21, 22, 23, 25, 26, 27,28, 29, 30, 31, 32, 33, 34, 35, 36, 37, 38, 39
3 8, 41, 43
4 24
5 47, 48, 52
6 56, 57
7 58, 59, 60, 61, 62, 63, 64, 65, 66, 67, 68, 69, 70, 71, 72,73, 74, 75, 76, 77, 78, 79, 80, 81, 82, 83, 84
8 85
9 86, 88, 89
10 87
11 90
12 91, 92, 93, 94, 95, 97, 98, 99, 100, 101, 102, 103
13 96
14 104, 116, 130, 131
15 105, 106, 107, 108, 109, 110, 111, 112, 113, 114, 115, 117, 118, 119, 120, 121, 122, 123, 124,125, 128, 129, 132, 133, 134, 135, 136, 144, 145, 146, 147, 148, 149, 150, 151, 152
16 126, 137, 142, 153, 193
17 127, 141, 143, 192
18 138, 139, 140, 154, 155, 156, 157, 158, 159, 160, 161, 162, 163,173, 174, 175, 180, 181, 182, 183, 184, 185, 186, 187, 188,
189, 190, 191, 194, 195, 196, 197, 198, 199, 233
19 164, 166, 167, 172, 176, 178, 200, 234
20 165, 168, 169, 170, 177, 201, 202, 203, 205, 207, 228, 229, 230, 231, 235, 236, 237, 238, 239, 240
21 171, 179, 232
22 204, 206, 209, 227
23 208, 210, 211, 213, 214
24 212, 215, 216, 217, 218, 219, 220, 221, 222, 223, 224, 225, 226
26500
27000
27500
28000
28500
29000
29500
30000
30500
31000
10/01 24/01 07/02 21/02 07/03 21/03 04/04 18/04
Clo
sing p
rice
of
BS
E
Daily data
Forecasted data by FuzzyTL(no smoothing)Forecasted data by FuzzyTL(α=0.001)Forecasted data by FuzzyTL(α=0.01)Forecasted data by WMActual data
Figure 1: BSE unlabeled data from Jan to April, 2015
7
10400
10600
10800
11000
11200
11400
11600
10/01 24/01 07/02 21/02 07/03 21/03 04/04 18/04
Clo
sing p
rice
of
NY
SE
Daily data
Forecasted data by FuzzyTL(no smoothing)Forecasted data by FuzzyTL(α=0.001)Forecasted data by FuzzyTL(α=0.01)Forecasted data by WMActual data
Figure 2: NYSE unlabeled data from Jan to April, 2015
9000
9200
9400
9600
9800
10000
10200
10/01 24/01 07/02 21/02 07/03 21/03 04/04 18/04
Clo
sing p
rice
of
TA
IEX
Daily data
Forecasted data by FuzzyTL(no smoothing)Forecasted data by FuzzyTL(α=0.001)Forecasted data by FuzzyTL(α=0.01)Forecasted data by WMActual data
Figure 3: TAIEX unlabeled data from Jan to April, 2015
8

8
10
12
14
16
18
20
07/13 10/13 01/14 04/14 07/14 10/14 01/15 04/15 07/15 10/15 01/16
Original time seriesWM predictionFuzzyTL prediction
(a) 000001.SZ
6
8
10
12
14
16
18
20
07/13 10/13 01/14 04/14 07/14 10/14 01/15 04/15 07/15 10/15 01/16
Original time seriesWM predictionFuzzyTL prediction
(b) 000002.SZ
10
15
20
25
30
35
40
45
50
07/13 10/13 01/14 04/14 07/14 10/14 01/15 04/15 07/15 10/15 01/16
Original time seriesWM predictionFuzzyTL prediction
(c) 000004.SZ
8
10
12
14
16
18
20
22
24
07/13 10/13 01/14 04/14 07/14 10/14 01/15 04/15 07/15 10/15 01/16
Original time seriesWM predictionFuzzyTL prediction
(d) 000009.SZ
30
40
50
60
70
80
90
100
07/13 10/13 01/14 04/14 07/14 10/14 01/15 04/15 07/15 10/15 01/16
Original time seriesWM predictionFuzzyTL prediction
(e) 000028.SZ
5
10
15
20
25
30
07/13 10/13 01/14 04/14 07/14 10/14 01/15 04/15 07/15 10/15 01/16
Original time seriesWM predictionFuzzyTL prediction
(f) 000032.SZ
Figure 4: Original and forecasted unlabeled closing price data of Shenzhen stock exchange from 8th Sept, 2013 to3rd Dec, 2015
9

Table 3: Reduced rulebase of labeled BSE data
If x1 is l3 and x2 is l3 then y is l3If x1 is l3 and x2 is l2 then y is l2If x1 is l2 and x2 is l2 then y is l2If x1 is l3 and x2 is l2 then y is l3If x1 is l2 and x2 is l1 then y is l2If x1 is l4 and x2 is l3 then y is l3If x1 is l4 and x2 is l3 then y is l4If x1 is l4 and x2 is l4 then y is l4If x1 is l5 and x2 is l4 then y is l4If x1 is l5 and x2 is l5 then y is l5If x1 is l6 and x2 is l5 then y is l5If x1 is l7 and x2 is l5 then y is l6If x1 is l6 and x2 is l6 then y is l6If x1 is l7 and x2 is l6 then y is l6If x1 is l7 and x2 is l6 then y is l7If x1 is l7 and x2 is l7 then y is l7If x1 is l8 and x2 is l7 then y is l8If x1 is l8 and x2 is l7 then y is l7If x1 is l8 and x2 is l8 then y is l8If x1 is l9 and x2 is l8 then y is l9If x1 is l9 and x2 is l9 then y is l9If x1 is l9 and x2 is l8 then y is l8If x1 is l10 and x2 is l9 then y is l9If x1 is l10 and x2 is l9 then y is l10If x1 is l10 and x2 is l10 then y is l10
predicted values using two methodologies. In Table 6,differences, absolute differences, and ranks based on dif-ferences are also tabulated. Exact critical value, say Tis calculated as min(R+, R−), where R+ is the sum ofthe ranks for the data sets on which second methodologyoutperformed the first, and R− is the sum of the ranksfor the others. For larger number of data sets, if thestatistics
z =T − 1
4N(N + 1)√124N(N + 1)(2N + 1)
(8)
is smaller than -1.96 with confidence level α =0.05, then null-hypothesis can be rejected where Nis the number of data sets. Here, in our case,T = min(R+, R−) = min(401, 34) = 34,N = 29,z = − 3.96785. So, we can conclude thatnull-hypothesis can be rejected and the two methodolo-gies have significant difference.
8 Summarization and limitation
Our motivation for this work is to implement fuzzytransfer learning concepts in time series prediction. Fordomain transfer concept we have used multi-attributedtime series. To adapt the transferred knowledge, do-main of discourses are adjusted and then rule base have
been generated. The proposed approach has been imple-mented on stock market time series and result compar-isons have been provided considering traditional fuzzytime series models. So, main advantage of this work isto implement transfer learning in time series prediction.
There are two main steps in FuzzyTL: domain adjust-ment and rule base generation. For our model building,we have considered the unlabeled data as labeled data.In creating an adapted rule base, we have used Wang-Mendel [12] defuzzification procedure as we are dealingwith unlabeled data. If we apply the FuzzyTL in pre-dicting proper labeled data, classification algorithms canbe implemented to get the predicting attributes. Usingproper labeled data and deciding predicted attributes forreduced rule base have not been considered in our work,which may be considered as limitations of this work.
9 Conclusion
A novel FuzzyTL for time series forecasting has beenproposed in this paper. The concept of learning fromlabeled data and transferring the knowledge (or experi-ence) to make a decision on unlabeled data is applied tosome extent. Proposed approach has advantage as wellas some limitations due to the use of unlabeled data. Itwas observed in previous pieces of work that the currenttime point value is highly dependent on just the previousor some of the previous time point values on time seriesanalysis. So, here we have implemented this observationas it is true in case of stock market data. Wang-Mendelmethod [12] used this characteristic of time series anal-ysis to predict Mackey-Glass time series. Here, we haveconsidered the same concept on stock price time seriesprediction. It is observed that FuzzyTL with smoothingand without smoothing work better in comparison toWang-Mendel method [12]. Also, it is performing wellin comparison to some traditional fuzzy time series mod-els, where transfer learning concept is not considered.
In future, we can apply all the five stages (discussedin section 3) of TL adaptation for better performance.Also rule reduction can be improved by using rough settheory.
Appendix
10 Wang-Mendel defuzzificationmethod :
After finding the exhaustive rulebase, weighting is as-signed to each rule, based on that and similar an-tecedents of rules , a reduced rulebase or combined fuzzyrulebase is generated. First, for a given input (x1, x2),we combine the antecedents of the ith fuzzy rule usingproduct operation to decide the degree diOi
of the output
10

Table 4: Adapted reduced rulebase for unlabeled BSE data (Total no of group 13)
Group Members0 01 1, 11, 122 2, 27, 56, 57, 58, 59, 62, 63, 64, 65, 76, 78, 793 3, 44 5, 6, 7, 8, 60, 61, 77, 80, 81, 825 96 107 13, 14, 24, 30, 40, 708 15, 16, 21, 22, 23, 36, 37, 38, 39, 46, 50, 71, 729 17, 31, 32, 33, 34, 35, 41, 42, 44, 4510 18, 19, 20, 4311 25, 26, 28, 29, 47, 48, 49, 51, 52, 53, 54,
55, 66, 67, 68, 69, 73, 74, 7512 83
Table 5: Root mean square error (RMSE) for unlabeled BSE, NYSE, TAIEX data
Time Wang-Mendel (WM) Chen Cheng FuzzyTLseries method Model Model α=0.001 α =0.01 No smoothing(FuzzyTL WM)BSE 1150.3713 688.9020 387.6920 274.0837 273.4513 457.1822
NYSE 240.6533 103.7715 103.9815 86.0553 86.0666 98.6410TAIEX 263.9279 88.8127 86.4081 62.7620 62.7070 68.2226
y corresponding to (x1, x2), i.e.,
diOi= mi
I1(x1)miI2(x2) (9)
where Oi denotes the output region of the ith rule,mi
I1(x1) denotes the membership of the input x1 at
Ii1 region of the ith rule and miI2
(x2) denotes the
membership of the input x2 at Ii2 region of the ith rule.The centroid defuzzification formula to map the outputin crisp value is given following:
y =
∑ri=1 d
iOiyi∑r
i=1 diOi
(10)
where y is the crisp output, yi is the center value of theregion Oi of the ith rule and r is the number of combinedrules.
Acknowledgement
The first author would like to thank DST INSPIRE, In-dia for their help and supports to sustain the work.
References
[1] R. F. Engle, “Autoregressive conditional het-eroscedasticity with estimator of the variance of
United Kingdom inflation,” Econometrica, vol. 50,pp. 987-1008, 1982.
[2] T. Bollerslev, “Generalized autoregressive condi-tional heteroscedasticity,” Journal of Econometrics,vol. 31, pp. 307-327, 1986.
[3] G. Box and G. Jenkins, “Time Series Analysis: Fore-casting and Control,” Holden-Day, San Francisco,2nd ed., 1976.
[4] K. Hurang and H. K. Yu, “The application of neuralnetworks to forecast fuzzy time series,” Physica A,vol. 363, pp. 481-491, 2006.
[5] C. Nikolopoulos and P. Fellrath, “A hybrid expertsystem for investment advising,” Expert Systems,vol. 11, pp. 245-250, 1994.
[6] Q. Caia, D. Zhanga, B. Wua, and S. C. H. Leung, “Anovel stock forecasting model based on fuzzy time se-ries and genetic algorithm,” Proc. Computer Science,vol. 18, pp. 1155-1162, 2013.
[7] H. J. Teoh, T. L. Chen, C. H. Cheng, and H. H. Chu,“A hybrid multi-order fuzzy time series for forecast-ing stock markets,” Expert Systems with Applica-tions, vol. 36, pp. 7888-7897, 2009.
11

Table 6: Root mean square error (RMSE) for unlabeled closing price data of Shenzhen stock exchange
Stocks WM method FuzzyTL Differences Absolute differences Ranks000001.SZ 1.611087 0.766559 +0.844528 0.844528 13000002.SZ 1.897229 0.688697 +1.208532 1.208532 16000004.SZ 10.978931 2.358990 +8.619941 8.619941 26000005.SZ 1.305526 0.963013 +0.342513 0.342513 11000006.SZ 3.287760 0.914095 +2.373665 2.373665 18000007.SZ 3.005471 1.105950 +1.899521 1.899521 17000008.SZ 7.185155 2.168828 +5.016327 5.016327 23000009.SZ 1.004225 1.054493 -0.050268 0.050268 3000010.SZ 0.771558 0.957016 -0.185458 0.185458 9000011.SZ 1.104852 1.012296 +0.092556 0.092556 6000012.SZ 1.111374 0.613068 +0.498306 0.498306 12000014.SZ 1.971918 1.897595 +0.074323 0.074323 4000016.SZ 6.724792 1.543654 +5.181138 5.181138 24000017.SZ 4.210160 1.300020 +2.91014 2.91014 21000018.SZ 12.644798 2.543516 +10.101282 10.101282 27000019.SZ 1.002364 1.134859 -0.132495 0.132495 7000020.SZ 5.634376 1.769913 +3.864463 3.864463 22000021.SZ 0.798732 0.886530 -0.087798 0.087798 5000022.SZ 0.955108 0.948929 +0.006179 0.006179 1000023.SZ 9.151912 1.645808 +7.506104 7.506104 25000024.SZ 1.397051 1.352104 +0.044947 0.044947 2000025.SZ 16.454901 5.001511 +11.45339 11.45339 28000026.SZ 1.268778 1.119854 +0.148924 0.148924 8000027.SZ 2.058834 1.183786 +0.875048 0.875048 14000028.SZ 20.620278 3.607171 +17.013107 17.013107 29000029.SZ 1.864301 0.844695 +1.019606 1.019606 15000030.SZ 0.518349 0.811959 -0.29361 0.29361 10000031.SZ 3.684534 1.178407 +2.506127 2.506127 19000032.SZ 4.094317 1.455326 +2.638991 2.638991 20
12

[8] P. F. Pai and C. S. Lin, “A hybrid ARIMA and sup-port vector machines model in stock price forecast-ing,” Omega, vol. 33, pp. 497-505, 2005.
[9] S. Pan and Q. Yang, “A survey on transfer learning,”IEEE Transactions on Knowledge and Data Engi-neering, vol. 22, pp. 1345-1359, 2009.
[10] L. Torrey and J. Shavlik, “Transfer learning,”Handbook of Research on Machine Learning Appli-cations, vol. 3, IGI Global 3, 2009, pp. 17-35.
[11] J. Lu, V. Behbood, P. Hao, H. Zuo, S. Xue, andG. Zhang, “Transfer learning using computationalintelligence: A survey,” Knowledge-Based Systems,vol. 80, pp. 14-23, 2015.
[12] L. X. Wang and J. M. Mendel, “Generating fuzzyrules by learning from examples,” IEEE Transac-tions on Systems, Man, and Cybernetics, vol. 22, pp.1414-1427, 1992.
[13] J. Blitzer, M. Dredze, and F. Pereira, “Biographies,Bollywood, Boom-Boxes and Bleders: Domain adap-tation for sentiment classification,” Proc. 45th Ann.Meeting of the Assoc. Computational Linguistics, pp.432-439, 2007.
[14] P. Wu and T. G. Dietterich, “Improving SVM ac-curacy by training on auxiliary data sources,” Proc.21st Int’l Conf. Machine Learning, pp.110, July2004.
[15] B. Li, Q. Yang, and X. Xue, “Transfer learning forcollaborative filtering via a rating-matrix generativemodel,” Proc. 26th Int’l Conf. Machine Learning,June 2009.
[16] G. Kuhlmann and P. Stone, “Graph-based domainmapping for transfer learning in general games,”Proc. 18th European Conf. Machine Learning, pp.188-200, Sept. 2007.
[17] J. Shell and S. Coupland, “Fuzzy transfer learn-ing: Methodology and application,” InformationSciences, vol. 293, pp. 59-79, 2015.
[18] S. -M. Chen, “Forecasting enrollments based onfuzzy time series,” Fuzzy Sets System, vol. 81, no.3, pp. 311–319, 1996.
[19] C. -H. Cheng, Y.-S. Chen, and Y.-L. Wu, “Fore-casting innovation diffusion of products using trend-weighted fuzzy time-series model,” Expert Systemswith Applications, vol. 36, no. 2, pp. 1826–1832, 2009.
[20] S. S. Gangwar and S. Kumar, “Probabilistic andIntuitionistic Fuzzy Sets–Based Method for FuzzyTime Series Forecasting,” Cybernetics and Systems:An International Journal, vol. 45, pp. 349-361, 2014.
[21] B. P. Joshi and S. Kumar, “Intuitionistic Fuzzy SetsBased Method for Fuzzy Time Series Forecasting,”Cybernetics and Systems: An International Journal,vol. 43, pp. 34-47, 2012.
[22] W. Leigh, R. Purvis, and J. M. Ragusa, “Forecast-ing the NYSE composite index with technical anal-ysis, pattern recognizer, neural network, and geneticalgorithm: a case study in romantic decision sup-port,” Decision Support Systems, vol. 32, pp. 361-377, 2002.
[23] C. W. J. Granger, “Forecasting stock market prices:Lessons for forecasters,” International Journal ofForecasting, vol. 8, pp. 3-13, 1992.
[24] “BSE data set”,https //in.finance.yahoo.com/q/hp?s=BSESN.
[25] “NYSE data set”,http //finance.yahoo.com/q/hp?s=NYA+Historical+Prices.
[26] “TAIEX data set”,http //finance.yahoo.com/q/hp?s=TWII+Historical+Prices.
[27] R. Zhou, Y. Zhan, R. Cai, and G. Tong, “A mean-variance hybrid-entropy model for portfoli selectionwith fuzzy returns,” Entropy, vol. 17, pp. 3319-3331,2015.
[28] Y. Lin and Y. Yang, “Stock markets forecastingbased on fuzzy time series model,” IEEE Int’l Conf.Intelligent Computing and Intelligent Systems, pp.782-786, Nov. 2009.
13