FUZZY IMAGE SEGMENTATION USING VALIDITY INDEXES CORRELATION
12
International Journal of Computer Science & Information Technology (IJCSIT) Vol 7, No 3, June 2015 DOI:10.5121/ijcsit.2015.7302 15 FUZZY IMAGE SEGMENTATION USING VALIDITY INDEXES CORRELATION Daniel Fernando Tello Gamarra 1 1 Department of Control Engineering and Automation, Universidade Federal de Santa Maria (UFSM), Santa Maria, Brazil ABSTRACT This paper introduces an algorithm for image segmentation using a clustering technique; the technique is based on the fuzzy c means algorithm (FCM) that is executed iteratively with different number of clusters. Furthermore, simultaneously five validity indexes are calculated and their information is correlated to determine the optimal number of clusters in order to segment an image, results and simulations are shown in the paper. KEYWORDS Image Segmentation, Validity Indexes, Fuzzy C Means, Indexes Correlation. 1. INTRODUCTION Image processing is used in applications for different fields like medicine, industry or robotics ([1] [2] [3] [4] [5]). Segmentation is the first step in image processing and is the supports for the execution of other tasks such as refinement or features identification as referred in [6]. Segmentation is a low-level operation with the objective of dividing homogeneous or heterogeneous regions. The homogeneous regions with borders belong to objects or part of them in the images. The approach for segmentation followed in this paper applies Fuzzy logic, there are some previous efforts executed following this approach, for instance, Lopes in [7] uses an automatic threshold method based on a fuzziness measure; Cheng in [8] uses principles of fuzzy c-partition and the maximum entropy to select threshold values for gray-level images. Other topic that explores this work is the use of validity indexes. Previously, Gamarra in [9] applied validity indexes to find the optimal number of clusters. Besides, some interesting works have explored the application of validity indexes for image segmentation. Bensaid in [10] proposed a new validity index, the partition index (SC), and introduced a new clustering algorithm, the validity-guided (re) clustering (VGC), in Bensaid´s work the validity index is not used to find the optimal number of clusters, that is already known; the validity index is used to improve the quality of partitions generated by a clustering algorithm. The VGC was applied exclusively for Magnetic Resonance Images (MRI) images. In addition, the work developed for Velthuizen in [11] applies the VGC algorithm to MRI images for brain tumor segmentation. This work will explore the application of different validity indexes, which will have their information correlated in order to find an adequate number of clusters for an image segmentation task. The remainder of the paper is as follows. the second section explains the different algorithms used in the paper; the third section presents the proposed algorithm designed for the image segmentation; in the fourth section the experimental platform setup is detailed; in the fifth section the experimental results are described; finally, conclusions are drawn in the last section.
-
Upload
ijcsit -
Category
Engineering
-
view
40 -
download
2
Transcript of FUZZY IMAGE SEGMENTATION USING VALIDITY INDEXES CORRELATION

International Journal of Computer Science & Information Technology (IJCSIT) Vol 7, No 3, June 2015
DOI:10.5121/ijcsit.2015.7302 15
FUZZY IMAGE SEGMENTATION USING VALIDITY
INDEXES CORRELATION
Daniel Fernando Tello Gamarra1
1Department of Control Engineering and Automation, Universidade Federal de Santa
Maria (UFSM), Santa Maria, Brazil
ABSTRACT
This paper introduces an algorithm for image segmentation using a clustering technique; the technique is
based on the fuzzy c means algorithm (FCM) that is executed iteratively with different number of clusters.
Furthermore, simultaneously five validity indexes are calculated and their information is correlated to
determine the optimal number of clusters in order to segment an image, results and simulations are shown
in the paper.
KEYWORDS
Image Segmentation, Validity Indexes, Fuzzy C Means, Indexes Correlation.
1. INTRODUCTION
Image processing is used in applications for different fields like medicine, industry or robotics
([1] [2] [3] [4] [5]). Segmentation is the first step in image processing and is the supports for the
execution of other tasks such as refinement or features identification as referred in [6].
Segmentation is a low-level operation with the objective of dividing homogeneous or
heterogeneous regions. The homogeneous regions with borders belong to objects or part of them
in the images. The approach for segmentation followed in this paper applies Fuzzy logic, there are
some previous efforts executed following this approach, for instance, Lopes in [7] uses an
automatic threshold method based on a fuzziness measure; Cheng in [8] uses principles of fuzzy
c-partition and the maximum entropy to select threshold values for gray-level images.
Other topic that explores this work is the use of validity indexes. Previously, Gamarra in [9]
applied validity indexes to find the optimal number of clusters. Besides, some interesting works
have explored the application of validity indexes for image segmentation. Bensaid in [10]
proposed a new validity index, the partition index (SC), and introduced a new clustering
algorithm, the validity-guided (re) clustering (VGC), in Bensaid´s work the validity index is not
used to find the optimal number of clusters, that is already known; the validity index is used to
improve the quality of partitions generated by a clustering algorithm. The VGC was applied
exclusively for Magnetic Resonance Images (MRI) images. In addition, the work developed for
Velthuizen in [11] applies the VGC algorithm to MRI images for brain tumor segmentation.
This work will explore the application of different validity indexes, which will have their
information correlated in order to find an adequate number of clusters for an image segmentation
task. The remainder of the paper is as follows. the second section explains the different
algorithms used in the paper; the third section presents the proposed algorithm designed for the
image segmentation; in the fourth section the experimental platform setup is detailed; in the fifth
section the experimental results are described; finally, conclusions are drawn in the last section.

International Journal of Computer Science & Information Technology (IJCSIT) Vol 7, No 3, June 2015
16
2. THEORETICAL BACKGROUND
2.1. Fuzzy C Means Algorithm (FCM) As stated in [12], fuzzy C means is very simple; unsupervised and convergent algorithm. The
algorithm description uses equations and terminology written in [13] and resumed in [9]. Given
the data set X , chose the number of clusters c , between Nc <<1 , N is the number of training
data objects, the weighting exponent 1>m , the termination tolerance 0>ε and the norm-inducing
matrix A , if IA = gives the standard Euclidean norm as stated in [14].
The matrix U is the fuzzy partition matrix and represents the membership of the data samples in
the clusters. The weight ikµ represents the degree of membership of an object in a cluster, and is
contained in the kth column of U . An object belongs in some degree to the different clusters, and
each cluster has a centroid iv , if the number of iterations is l , the first step of the algorithm is to
compute the cluster centroids:
ci
x
vN
k
mlik
N
k
kml
ik
li ≤≤=
∑
∑
=
−
=
−
1,
)(
)(
1
1
1
1
)(
µ
µ
(1)
The second step computes the distances:
),()()()(2 l
ikTl
ikikA vxAvxd −−= (2)
Nkci ≤≤≤≤ 1,1
The third step updates the partition matrix elements:
If 0>ikAd
for ci ≤≤1
, ,1 Nk ≤≤
∑=
−
=c
j
mjkAikA
lik
dd1
)1(2
)(
)(
1µ
(3)
Otherwise 0)(
=l
ikµ if 0=ikAd
and [ ]1,0
)(∈
likµ
with ∑
=
=c
i
lik
1
1µ .
The algorithm lasts a fixed number of iterations or until is reached the condition
ε<−− )1()( ll
UU .
2.2. Validity Indexes in Fuzzy Clustering
The cluster validity as stated in [15] can be used to search for the optimal number of clusters if
the number of clusters is not known. The formulation followed in this subsection took as a
reference the work developed in [15]. The validity indexes used for this paper are the following
and derived from [16]:
The Partition Coefficient (PC) is defined as follows:
∑∑
= =
=c
i
n
j
ijun
PC1 1
21
(4)

International Journal of Computer Science & Information Technology (IJCSIT) Vol 7, No 3, June 2015
17
The Partition Entropy (PE):
∑∑
= =
=c
i
n
j
ijij uun
PE1 1
2log
1
(5)
The partition index (SC) given by the equation:
∑∑
∑
=
=
=
−
−
=c
iij
c
k
miji
ij
N
j
mij
vxuN
vxu
SC1
2
1
2
1
)(
)(
(6)
The Separation index (S) on the contrary of SC uses a minimum-distance separation for validity
partition [10]:
2
,
1
2
1
min
)(
ikki
c
i
ij
N
j
m
ij
vvN
vxu
S−
−
=
∑∑= =
(7)
The Xie and Beni´s index defined in [17] as follows:
2
1
2
1
min jjji
c
i
jj
n
j
m
ij
vxN
vxu
XB
−
−
=
≠
= =
∑∑
(8)
3. PROPOSED ALGORITHM
Figure 1 depicts the algorithm flowchart, the algorithm will start using a median filter, as the first
step; the next step will be the application of a clustering technique for image segmentation based
in the Fuzzy C Means algorithm. One of the parameters that are necessary to specify for the FCM
is the number of clusters in which the image data will be divided, different cluster numbers were
tested for the algorithm, beginning with 2 clusters until a predefined number of clusters is
achieved (it was chosen 14 for the experiments in this paper). The different validity indexes that
were defined in the paper will evaluate the partitions created for the Fuzzy C Means algorithm in
every run of the algorithm, based on the analysis and the correlation of information provided for
the validity indexes an optimal number of clusters will be selected.
4. EXPERIMENTAL PLATFORM SETUP
4.1. The Matlab Image Processing Toolbox
For the experiments developed in this paper the matlab image processing toolbox will be
employed, this toolbox has a set of routines that let us handle a lot of computational vision
problems.
4.2. The Fuzzy Clustering Toolbox For the cluster validity was used the Fuzzy Clustering and Data Analysis Toolbox [18]. The
referred toolbox is a collection of Matlab functions with the purpose of dividing a given data set
into clusters.

International Journal of Computer Science & Information Technology (IJCSIT) Vol 7, No 3, June 2015
18
Figure 1. Proposed Algorithm Flowchart
5. EXPERIMENTAL RESULTS The different experiments were done with the proposed algorithm in this paper. The parameters
used for the clustering algorithm are: number of clusters = 4, maximum number of iterations =
100 ( l ), partition matrix exponent = 2 (m), amount of minimal improvement = 1e-6(ε ).
Figure 2 shows the classic figure of the cameraman, that is clustered using the method proposed
on the paper; figure 3 depicts the results obtained applying the validity indexes to the figure, the
partition coefficient (PC) has a monotonic decreasing starting in cluster number 4, also the
classification entropy (CE) has a monotonic increasing starting in cluster 4. Figure 4 shows that
the partition index (SC) and the separation index (S) decreases slowly from c = 4. Also the Xie
and Beni index reaches its local minimum in a region between c = 3 e c = 4. After an evaluation
the information deliver from SC and S are more useful in comparison with the other indexes with
the same c, it was chosen 4 as the optimal number of clusters.
In Table 1 appears the different values obtained for every cluster validity index adopted and its
variation through the different number of clusters tested. c is the clusters number and PC, CE, SC,
S and XB the initials of validity indexes.

International Journal of Computer Science & Information Technology (IJCSIT) Vol 7, No 3, June 2015
19
(a)
(b)
(c)
(d)
Figure. 2. Cameraman clustered image with FCM: a) original image; (b) 4 clusters; (c) 8 clusters; (d) 14
clusters
Figure 3. Values of Partition Coefficient and Classification Entropy with the clusters number for the
cameraman image.
Figure 4 Values of Partition Index, Separation Index, and Xie and Beni´s Index with the clusters number for
the cameraman image.

International Journal of Computer Science & Information Technology (IJCSIT) Vol 7, No 3, June 2015
20
Table 1 The Numerical Values of Validity Measures ( Cameraman)
C 2 3 4 5 6 7 8
PC 0.9271 0.8731 0.7926 0.8020 0.7939 0.7872 0.7832
CE 0.1348 0.2351 0.3839 0.3841 0.4114 0.4372 0.4557
SC 0.6546 0.5240 0.5314 0.4808 0.4544 0.4024 0.3809
S 0.0999 0.1195 0.1228 0.1109 0.1085 0.1111 0.1053
10-4
XB 622.39 32.7227 29.3341 117.1989 17.7296 61.406 97.276
C 9 10 11 12 13 14
PC 0.7808 0.7686 0.7586 0.7575 0.7480 0.7470
CE 0.4664 0.4968 0.5214 0.5295 0.5538 0.5626
SC 0.3376 0.3331 0.3111 0.3126 0.2968 0.2925
S 0.0927 0.0911 0.0843 0.0839 0.0800 0.0819
XB 50.509 29.6524 23.3215 15.9614 9.5482 146.39
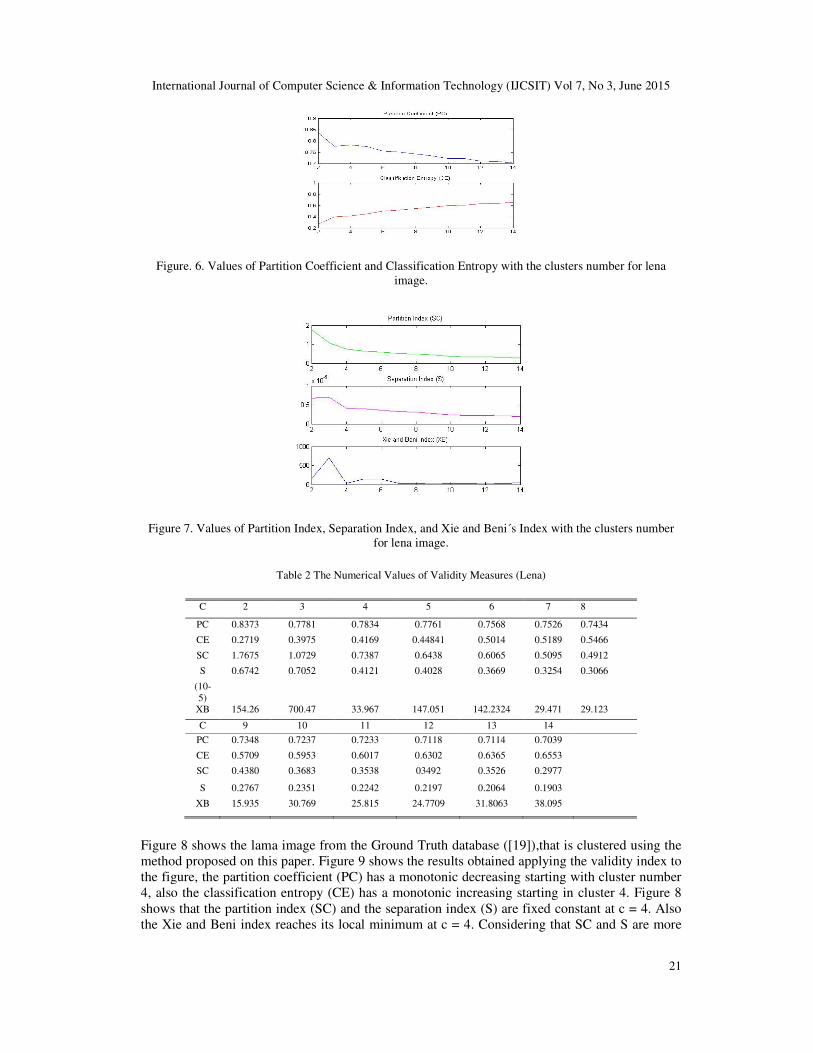
Figure 5 shows the classic figure of lena, that is clustered using the method proposed on the
paper; figure 6 illustrates the results obtained applying the validity indexes to the figure, the
partition coefficient (PC) has a monotonic decreasing starting in cluster number 3, also the
classification entropy (CE) has a monotonic increasing starting in cluster 3. Figure 7 shows that
the partition index (SC) and the separation index (S) decreases slowly from c = 3. Also the Xie
and Beni index reaches its local minimum at c= 3. After an evaluation of the information deliver
for SC and S for this case is more useful in comparison with the other indexes with the same c, it
was chosen 3 as the optimal number of clusters.
In table 2 are shown the different values obtained for every cluster validity indexes adopted and
its variation through the different number of clusters tested.
(a)
(b)
(c)
(d)
Figure 5. Lena clustered with FCM: a) original image; (b) 3 clusters; (c) 8 clusters; (d) 14 clusters
International Journal of Computer Science & Information Technology (IJCSIT) Vol 7, No 3, June 2015
21
Figure. 6. Values of Partition Coefficient and Classification Entropy with the clusters number for lena
image.
Figure 7. Values of Partition Index, Separation Index, and Xie and Beni´s Index with the clusters number
for lena image.
Table 2 The Numerical Values of Validity Measures (Lena)
C 2 3 4 5 6 7 8
PC 0.8373 0.7781 0.7834 0.7761 0.7568 0.7526 0.7434
CE 0.2719 0.3975 0.4169 0.44841 0.5014 0.5189 0.5466
SC 1.7675 1.0729 0.7387 0.6438 0.6065 0.5095 0.4912
S 0.6742 0.7052 0.4121 0.4028 0.3669 0.3254 0.3066
(10-
5)
XB 154.26 700.47 33.967 147.051 142.2324 29.471 29.123
C 9 10 11 12 13 14
PC 0.7348 0.7237 0.7233 0.7118 0.7114 0.7039
CE 0.5709 0.5953 0.6017 0.6302 0.6365 0.6553
SC 0.4380 0.3683 0.3538 03492 0.3526 0.2977
S 0.2767 0.2351 0.2242 0.2197 0.2064 0.1903
XB 15.935 30.769 25.815 24.7709 31.8063 38.095
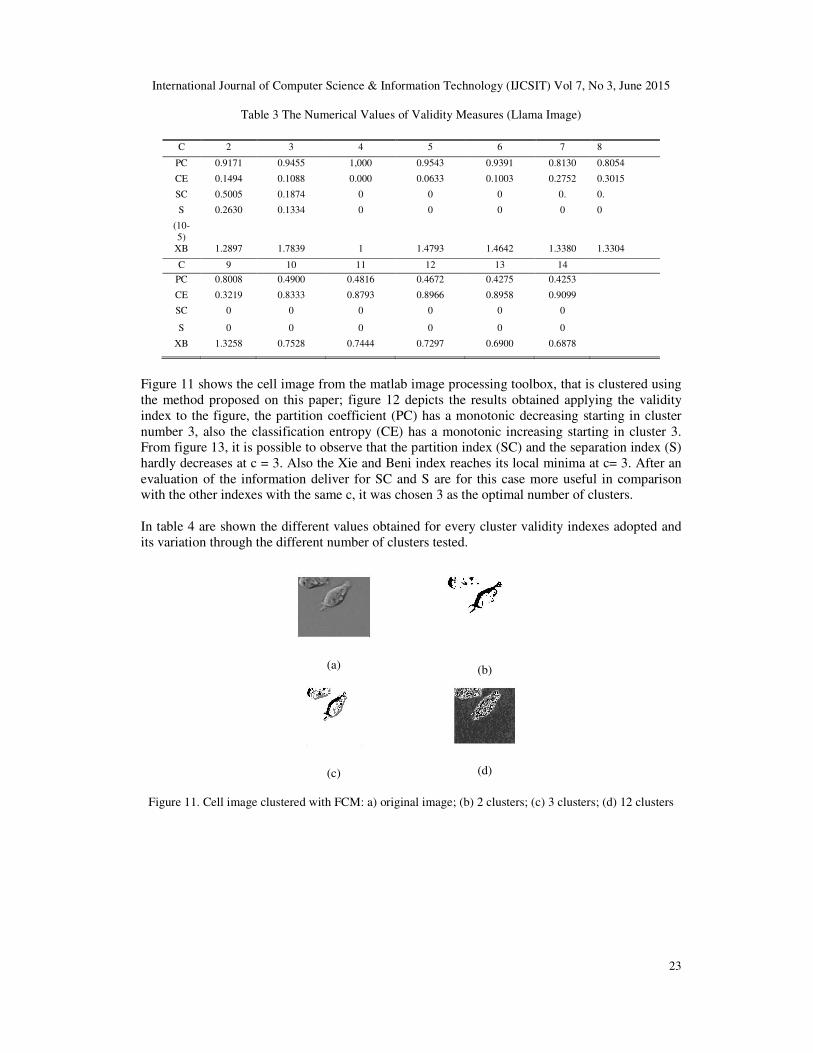
Figure 8 shows the lama image from the Ground Truth database ([19]),that is clustered using the
method proposed on this paper. Figure 9 shows the results obtained applying the validity index to
the figure, the partition coefficient (PC) has a monotonic decreasing starting with cluster number
4, also the classification entropy (CE) has a monotonic increasing starting in cluster 4. Figure 8
shows that the partition index (SC) and the separation index (S) are fixed constant at c = 4. Also
the Xie and Beni index reaches its local minimum at c = 4. Considering that SC and S are more

International Journal of Computer Science & Information Technology (IJCSIT) Vol 7, No 3, June 2015
22
useful, when comparing different clustering methods with the same c, it was chosen 4 as the
optimal number of clusters. Evidently, this figure contains four clusters and the algorithm proves
this fact.
In table 3 are shown the different values obtained for every cluster validity indexes adopted and
its variation through the different number of clusters tested.
(a)
(b)
(c)
(d)
Figure 8. Llama image clustered with FCM: a) original image; (b) 2 clusters; (c) 4 clusters; (d) 14 clusters.
Figure 9. Values of Partition Coefficient and Classification Entropy with the clusters number for lama
image.
Figure 10. Values of Partition Index, Separation Index, and Xie and Beni´s Index with the clusters number
for lama image.
International Journal of Computer Science & Information Technology (IJCSIT) Vol 7, No 3, June 2015
23
Table 3 The Numerical Values of Validity Measures (Llama Image)
C 2 3 4 5 6 7 8
PC 0.9171 0.9455 1,000 0.9543 0.9391 0.8130 0.8054
CE 0.1494 0.1088 0.000 0.0633 0.1003 0.2752 0.3015
SC 0.5005 0.1874 0 0 0 0. 0.
S 0.2630 0.1334 0 0 0 0 0
(10-
5)
XB 1.2897 1.7839 1 1.4793 1.4642 1.3380 1.3304
C 9 10 11 12 13 14
PC 0.8008 0.4900 0.4816 0.4672 0.4275 0.4253
CE 0.3219 0.8333 0.8793 0.8966 0.8958 0.9099
SC 0 0 0 0 0 0
S 0 0 0 0 0 0
XB 1.3258 0.7528 0.7444 0.7297 0.6900 0.6878
Figure 11 shows the cell image from the matlab image processing toolbox, that is clustered using
the method proposed on this paper; figure 12 depicts the results obtained applying the validity
index to the figure, the partition coefficient (PC) has a monotonic decreasing starting in cluster
number 3, also the classification entropy (CE) has a monotonic increasing starting in cluster 3.
From figure 13, it is possible to observe that the partition index (SC) and the separation index (S)
hardly decreases at c = 3. Also the Xie and Beni index reaches its local minima at c= 3. After an
evaluation of the information deliver for SC and S are for this case more useful in comparison
with the other indexes with the same c, it was chosen 3 as the optimal number of clusters.
In table 4 are shown the different values obtained for every cluster validity indexes adopted and
its variation through the different number of clusters tested.
(a)
(b)
(c)
(d)
Figure 11. Cell image clustered with FCM: a) original image; (b) 2 clusters; (c) 3 clusters; (d) 12 clusters

International Journal of Computer Science & Information Technology (IJCSIT) Vol 7, No 3, June 2015
24
Figure 12. Values of Partition Coefficient and Classification Entropy with the clusters number for the cell
image.
Figure 13. Values of Partition Index, Separation Index, and Xie and Beni´s Index with the clusters number
for the cell image.
Table 4 The Numerical Values of Validity Measures (Cell Image)
C 2 3 4 5 6 7 8
PC 0.9416 0.9449 0.9223 0.9154 0.8951 0.7787 0.7715
CE 0.1090 0.1085 0.1646 0.1841 0.2342 0.4140 0.4272
SC 8.0434 1.1791 1.3021 0.8921 0.8948 0.6984 0.5633
S 0.2649 0.0881 0.0797 0.0584 0.0546 0.0451 0.0374
(10-3)
XB 32.632 8.9606 11.9188 6.99 8.6761 4.7263 13.4435
C 9 10 11 12 13 14
PC 0.7703 0.7670 0.7658 0.7621 0.7424 0.7410
CE 0.4440 0.4566 0.4623 0.4694 0.5468 0.5573
SC 0.5812 0.5901 0.5073 0.4321 0.3905 0.4032
S 0.0369 0.0368 0.0322 0.0280 0.0257 0.0258
XB 13.569 41.9482 7.9208 20.5686 2.667 4.2716
6. CONCLUSIONS
The main discernible contribution of the paper is the correlation of the information provided from
different validity indexes in order to define a determined number of clusters. Another contribution

International Journal of Computer Science & Information Technology (IJCSIT) Vol 7, No 3, June 2015
25
of the paper is the guidance search provided by the algorithm to select the optimal number of
clusters in an unsupervised way. In principle, there is not a validity index that can be totally
accurate, so redundant data of the partitions embedded in the validity measures will let us a better
proposal of the optimal number of clusters of the image. Simulations and experiments are shown.
REFERENCES [1] H.Farrakhbakht, A. Masoumzadeh Tork, E. Yazdan Talab, H. Ramezanpour, G. Darmani, An
Adaptive Filter for Noise Cancelling in Mammography Images Based on Cellular Automata,
International Review on Modelling and Simulations, vol. 5(3), pp. 1322-1326, June, 2012.
[2] G.M., Rajathi, R., Rangarajan, A New Dual Tree Wavelet Based Image Denoising Using Fuzzy
Shrink and Lifting Scheme, International Review on Modelling and Simulations, vol. 6(2), pp. 1322-
1326, December, 2013.
[3] D.F.T. Gamarra, L.K. Pinpin, C. Laschi, P. Dario Forward Models Applied in Visual Servoing for a
Reaching in the iCub Humanoid Robot. In Applied Bionics and Biomechanics, vol. 6, pp. 345-354,
2009.
[4] D.F.T., Gamarra, Ballistic Reaching Using Visuomotor Maps in a Robot Manipulator for Starting a
Visually Guided Task, International FLINS Conference on Decision Making and Soft Computing,
2014, João Pessoa, Brazil.
[5] D.F.T., Gamarra, T.F., Bastos, M.F., Sarcinelli, Validity Guided Controling of Navigation of a Mobile
Robot in a corridor with Redundant Controllers, IEEE International Conference on Robotics and
Automation (ICRA), 2005, Barcelona, Spain.
[6] L.Lucchese, S.K. Mitra, Color Image Segmentation: A state of the art Survey, Image Processing,
Vision, and Pattern Recognition. In, Proceedings of the Indian National Science Academy (INSA-1),
New Delhi, India, vol. 67A(2), pp. 207-221, 2001.
[7] N.V., Lopes, P.A.M. do Couto, H. Bustince: Automatic Histogram Threshold Using Fuzzy Measures.
IEEE Transactions on Image Processing, vol 19 (1), pp. 199-204, 2010.
[8] H.D., Cheng, J.R., Chen, J. Li, Threshold Selection Based on Fuzzy c-Partition Entropy Approach.
Pattern Recognition, vol 31 (7), pp. 857-870, 1998.
[9] D.F.T., Gamarra, Forward Models with Cluster Validity Criteria Applied in Ballistic Reaching for
Visual Servoing, International Review on Modelling and Simulations, vol.(6), pp. 1939-1947,
December, 2013.
[10] A.M. Bensaid, L.O., Hall, J.C., Bezdek, L.P., Clarke, M. L., Silbiger, J.A., Arrington, R. F., Murtagh,
Validity-Guided (Re) Clustering with Applications to Image Segmentation. IEEE Transactions on
Fuzzy Systems, vol. 4(Issue 2):112-123, May, 1996.
[11] R.P., Velthuizen, Validity Guided Clustering for Brain Tumor Segmentation, IEEE 17th Annual
Conference Engineering in Medicine and Biology Society, pp. 413-414, 1995, Tampa, Florida, USA.
[12] Z., Wang, Comparison of Four Kinds of Fuzzy C-Means Clustering Methods. In: Symposium on
Informatics Processing ISIP, pp. 563-566, 2010.
[13] M., Setnes, and R. Babusca, A Fuzzy Relational Classifier Trained by Fuzzy Clustering. IEEE
Transactions on Systems, Man, and Cybernetics, Vol. 29(5), pp. 619-625, 1999.
[14] N., Jain, and S. Shukla Fuzzy Databses Using Extended Fuzzy C-Means Clustering. Journal of
engineering Research and Applications, vol. 2(3), pp. 1444-1451, 2012.
[15] K. .M., Tarek, and B. Forouk, Kohonen Maps Combined to Fuzzy C-Means, a Two Level Clustering
Approach. Application to Electricity Load Data. In Self Organizing Maps- Applications and Novel
Algorithm Design, 2011.
[16] J.C., Bezdek Pattern Recognition with Fuzzy Objective Function Algorithms, Plenum, N.Y., 1981.
[17] X.L., Xie, and G.A. Beni, Validity measure for fuzzy clustering, in IEEE Transactions on Pattern
Analysis and Machine Inteligence, 13(8), pp. 841-847, 1991.
[18] B.. Balasko, J. Abonyi, and B. Feil Fuzzy Clustering and Data Analysis Toolbox,
http://www.abonyilab.com/software-and-data/fclusttoolbox, 2005.
[19] http://research.microsoft.com/en
us/um/cambridge/projects/visionimagevideoediting/segmentation/grabcut.htm.

International Journal of Computer Science & Information Technology (IJCSIT) Vol 7, No 3, June 2015
26
Author
Daniel Fernando Tello Gamarra was born in Peru in 1976, received his BSc.
Degree in mechanical engineering from Universidad Nacional del Centro del Peru
(UNCP), in Huancayo, Peru, in 1999, and his MSc in electrical Engineering from
Universidade Federal do Espirito Santo (UFES), in Vitoria, Espirito Santo, Brazil, in
2004 and PhD degree in Biomedical Robotics from Scuola Superiore Santa Anna,
Pisa, Italy, 2009. He is Professor at the Universidade Federal de Santa Maria
(UFSM), in the Department of Control and Automation in Santa Maria, Rio Grande
do Sul, Brazil. His current research interest centers on robotics, computational vision
and machine learning.


![a, b,∗∗ arXiv:1602.06989v1 [stat.ML] 22 Feb 2016repository.essex.ac.uk/20364/1/1602.06989v1.pdf · 2017. 9. 15. · There are a number of cluster validity indexes (CVIs) that](https://static.fdocuments.in/doc/165x107/60b707beac93b2433b75e911/a-baa-arxiv160206989v1-statml-22-feb-2017-9-15-there-are-a-number.jpg)