
Multimodal Literacy - Reading & Viewing Multimodal Digital Texts in Prrimary

Fuzzy aggregation for multimodal remote sensingclassification
Kristen NockU.S. Naval Research Laboratory
Washington, DC, [email protected]
Elizabeth GilmourU.S. Naval Research Laboratory
Washington, DC, [email protected]
Abstract—This paper investigates methods of fusing hyperspec-tral imagery (HSI) and LiDAR data for urban land use andland cover classification. A variety of fusion methods includingcombination rules, deep neural networks, and fuzzy aggregationare compared against using any single modality for classification.The experimental results demonstrate that the two fuzzy aggrega-tion methods, the linear order statistic neuron (LOSN) and theChoquet integral (ChI), achieved the best overall and averageclassification accuracy, respectively. We further discuss how thefuzzy aggregation methods provides advantages with difficultsamples and the opportunity to gain network explainability.
Index Terms—hyperspectral imagery, LiDAR, Choquet inte-gral, fuzzy aggregation, remote sensing
I. INTRODUCTION
Remote sensing data collected by airplanes flying over thesurface of the earth has uses ranging from agriculture to urbanplanning to disaster response, but the interpretation of remotesensing images is necessary to extract useful information.Remote sensing data provide rich information about land useand other natural phenomena through various sensor types.Hyperspectral imagery (HSI) and LiDAR are two remotesensing data types that will be examined in this paper. Eachof the data types provides vital but incomplete informationfor land use classification. HSI provides information aboutmaterial characteristics, so it can distinguish between parkinglots and fields; however, it cannot be used to differentiatebetween objects where the same materials occur at differentheights [1]. LiDAR, in contrast, can detect surface propertieslike height and roughness. For example, LiDAR cannot beused to differentiate between objects with the same elevationand surface roughness that are made of different materials[1], like artificial and natural grass, but can easily distinguishbetween the height of a parking garage and the height of aparking lot.
Intuitively, the fusion of information from both HSI andLiDAR would combine complementary information from the
The authors would like to thank the National Center for Airborne LaserMapping and the Hyperspectral Image Analysis Laboratory at the Universityof Houston for acquiring and providing the data used in this study, and theIEEE GRSS Image Analysis and Data Fusion Technical Committee. Thisresearch was sponsored by the Naval Research Laboratory’s Base Program,and the Office of Naval Research. The views and conclusions containedherein are those of the authors and should not be interpreted as necessarilyrepresenting the official policies or endorsements, either expressed or implied,of the U.S. Government.
Fig. 1. (A) The hyperspectral data (HSI) covering a 380-1050 nm spectralrange with 48 bands at a 1m ground sampling distance. (B) The multispectralLiDAR point cloud data, composed of intensity raster and digital surface mod-els with a resolution of 0.5m ground sampling distance. (C) Correspondingground truth data containing 20 urban land use and land cover classes.
two sensor modalities to make a more informed decision [2].This sort of sensor fusion can be thought of as consulting ex-perts with different specialties and considering their opinions.However, developing frameworks to combine the sensor inputsand decisions remains a challenge.
Previously, fuzzy aggregation has been used for fusingpredictions from different network architectures in ensemblemodels in remote sensing studies [3]. However, this studyis the first application of fuzzy aggregation, in the form ofthe linear order statistic neuron (LOSN) and the Choquetintegral (ChI), to perform multimodal sensor fusion of HSIand LiDAR data. Further, this study compares the accuracyof these fuzzy aggregation methods to the use of combinationrules and fusion within a deep neural network.
II. BACKGROUND
LiDAR is a type of data recorded from pulsed lasersreflected off the earth’s surface. The returning light is col-lected, and the phase changes, wavelengths, and angles ofthe returning light are used to create an image. LiDARprovides information about terrain and vegetation that cannotbe obtained from optical sensors. LiDAR has important usesin topography, such as flood plain analysis, and it is also usedin urban planning as it provides detailed information aboutstructures and building footprints.
U.S. Government work not protected by U.S. copyright

Hyperspectral remote sensing uses spectroscopy to obtainmaterial characteristics. Objects absorb light from the sun andthen emit light at different frequencies, depending on theirmaterial characteristics. The hyperspectral imaging cameraacquires the emitted light in frequencies ranging from theinfrared to the visible light, producing a type of imagery withthe capability to distinguish physical materials. HSI has avariety of uses, including use in precision agriculture to studycrop health, in ecology to study land use changes, and inmilitary applications for target detection [4].
HSI produces a data cube with spatial dimensions related tothe area covered and a depth that represents the many spectralchannels collected. The data is difficult to visually interpret,so it is typically classified through segmentation in which theclass of each pixel is predicted. The classes represent differentmaterials or land use types. Numerous types of supervisedclassification models have been used on HSI, including simplelook-up tables, decision trees [5], random forests [6], andsupport vector machines [7]. In recent years, deep learningframeworks have become important for classification becauseof their powerful feature extraction [8].
Deep learning classification of HSI has typically focusedeither on the spectral features or the spatial features. Spatialfeature networks, which use deep neural networks to extractspatial features of HSI, can provide good classification accu-racy even though they ignore the important spectral features[8]. Spectral feature networks are neural networks that use themany spectral bands of HSI. These spectral characteristics arearguably the most important characteristic of HSI, and can beused to perform pixel-wise classification. Each pixel of the HSIis represented as a spectral vector which contain the numberof spectral bands, or the depth of the hyperspectral imagecube. Due to the challenging and redundant information inthe spectral data, spectral feature networks do not necessarilymaximize classification accuracy [8]. Additionally, as morebands are added to the HSI, the classes become more separablebut more training data is needed to accurately classify them[4]. The Geoscience and Remote Sensing Society (GRSS)sponsors data fusion contests, challenging teams to developfusion frameworks for HSI and LiDAR. In a 2013 datafusion contest, GRSS provided co-registered HSI and LiDARthat was collected over the University of Houston campus[9]. Winning teams developed frameworks that included su-pervised and unsupervised methods as well as handcraftedfeature extraction. While the end result is automated land useclassification, the process involves custom model techniquesthat do not generalize well.
In 2018, the GRSS data fusion contest was repeated withan updated dataset collected over the University of Houston.This multimodal dataset of urban land use acquired from anarea of downtown Houston was released as part of the 2018GRSS Data Fusion Contest [10]. The dataset, grss dfc 2018[11], includes co-registered LiDAR and HSI, as well as high-resolution imagery (Fig. 1). The hyperspectral data includes 48bands covering a spectral range of 380-1050 nm with a 1mground sampling distance [10]. The LiDAR data is composed
of intensity raster and digital surface models with 0.5m groundsampling distance. The dataset has 20 classes related to urbanobjects and land use. In the contest, the majority of the scenewas used for training, and a portion was held aside for testing.
In contrast to the sparse ground truth dataset used for 2013contest, the 2018 data was dense to promote the advancementof deep learning-based approaches. In 2018, deep learning-based approaches overwhelmingly occupied the leaderboard.Most of the top-ranked teams used several different neuralnetworks trained together. However, the best performing ap-proaches were based on deep neural networks along withpost processing and object detection [10]. Post-processing,including hard-coded rather than learned methods, was neededto correct systematic errors in the deep learning classifications.
While fuzzy multiple classifier systems for HSI and LiDARdata have been used in the past [12], we further hypothesizethat fuzzy set theory in the form of the LOSN and the ChIcan reduce the dependence on hand-crafted post-processingin multimodal sensor fusion of HSI and LiDAR. Instead ofa one size fits all operator (e.g., average, max, etc.), data-driven fuzzy aggregation can intelligently learn contextualcombination logic, deciding a unique and appropriate operatorfor each of the classes present. This study builds off of deepneural networks developed by others, but combines them in anovel framework and tests different methods for aggregatingtheir decisions. It should be noted that this study did not haveaccess to the 2018 GRSS contest test data, so the results cannotbe directly compared.
III. TECHNICAL APPROACH
To classify the co-registered HSI and LiDAR, we testdifferent types of neural networks and different aggregationmethods to combine the decisions of the neural networks.These methods include single sensor networks, unified net-works, combination rules, and fuzzy aggregation. All methodswe tested are built on three neural networks, the convolu-tional neural network (CNN), multi-scale convolutional neuralnetwork (MSCNN), and long short-term memory (LSTM).The spatial networks, the CNN and MSCNN, are trainedwith patches of nine pixel by nine pixel imagery where thecentral pixel determines the class label. In contrast, the LSTMis trained using all spectral bands for a single pixel. Thethree neural networks and the fusion framework are shownin Fig 2. For all models, a methodical manual search wasperformed over ranges of hyperparameters to optimize modelperformance.
A. Convolutional neural network
An important deep learning model, the convolutional neuralnetwork (CNN), is inspired by the structure of the humanvisual system. The structure of the CNN consists of a stack ofalternating convolutional layers and pooling layers followedby fully connected (FC) layers. This structure creates a con-volutional feature map and makes use of location connectionsto extract contextual 2-D spatial features. In the convolutionlayers, images are convolved with a set of learned filters.

Fig. 2. Three separate neural network feeds are fused to make predictions. The spatial feature network (top) is multi-scale convolutional neural network(MSCNN) that is trained on nine pixel by nine pixel patches of hyperspectral imagery (HSI). The spectral feature network (middle) is an LSTM that is trainedon single pixel vectors of HSI. The LiDAR network (bottom) is a CNN that is trained on nine pixel by nine pixel patches of LiDAR. These three neuralnetworks are combined using different fusion methods to predict the class of training samples.
Pooling layers are used to reduce redundant information, andthe FC layers are used to flatten the feature maps into n-dimensional vectors to predict the labels. We split the datainto patches to perform patch-based classification. Nine pixelby nine pixel patches of LiDAR were classified with a CNN.
B. Spatial feature networkIn traditional CNNs, the final FC layers are used to make
the final predictions. In contrast, the multi-scale convolutionalneural network (MSCNN), introduced by Xu et al. in 2018[13], learns hierarchical spatial features from patches of HSIdata at many layers. The MSCNN is trained with HSI patcheswhere the central pixel determines the class label. The FClayers after each convolutional layer are concatenated, and thiscombined layer is used for the final feature vector. As a result,this network uses features from multiple spatial scales to makepredictions. This improves upon many other spatial feature
neural networks for HSI classification as it can use severaldifferent spatial scales to predict the class.
C. Spectral feature network
Developed for time series predictions, long short-term mem-ory (LSTM) is a type of recurrent neural network that has alsoshown success classifying hyperspectral imagery [13]. Eachpixel of the HSI is represented as a vector of length N whereN is the number of spectral bands. The spectral vectors havea sequence-like data structure, so even though the spectralvectors do not contain time series data, the LSTM model canalso be used to analyze this data type [13]–[15].
D. Fusion methods
This paper proposes a new fusion architecture where threeseparate neural networks are combined using decision levelfusion to classify the data. The decisions of the MSCNN

Fig. 3. This diagram shows the fuzzy aggregation operators used. The linear order statistic neuron (LOSN) is a generalization of the ordered weighted average(OWA) operator. Mathematically, the LOSN is the sum of a bias, and dot product of a sorted input and weights selected based on a aggregation method.The Choquet integral (ChI) acts as a generalized expectation operator. There will be N number of non-monotonic fuzzy measures µ used in this parametricnon-linear aggregation function.
as the HSI spatial feature network, the LSTM as the HSIspectral feature network, and a CNN for the LiDAR arefused. The two data types each have strengths and weaknessesfor a classification problem, so combining them efficientlycan increase classification accuracy. We test three differentmethods to find the best way to combine the classifiers andperform data fusion.
a) Combination rules: Combination rules are simplealgebraic rules for deciding which prediction to trust. They arebased on the predictions of the classifiers and the confidenceof each classifier’s prediction. Simple voting looks at thepredictions from each of the classifiers, and chooses theprediction that the majority of classifiers picked [2], [3]. Letd(t,j)(x) ∈ [0, 1] be the decision of classifier t for class jrelative to data point/input x. The chosen class (w∗) is
w∗ = mode( argmaxj=1,. . . ,C
d(1,j)(x), ..., argmaxj=1,. . . ,C
d(T,j)(x)) (1)
where T is the number of classifiers and C is the number ofclasses. In other words, the mode (the class prediction thatappears most often) is used.
Maximum fusion is based on the confidence of the predic-tions. The prediction with the highest confidence among all ofthe networks is chosen [2], [3]. Let
z∗j = argmaxt=1,. . . ,T
d(t,j)(x) (2)
be which classifier has the highest confidence for class j. Weselect w∗ via
w∗ = argmaxj=1,. . . ,C
z∗j . (3)
Sum fusion is based on adding the support from each clas-sifier. The confidence from each classifier for each predictionis added, and the prediction with the highest total is chosen.Let
s∗j =∑
t=1,. . . ,T
d(t,j)(x) (4)
be the aggregate confidence in class j across all classifiers.Accordingly, w∗ is determined via
w∗ = argmaxj=1,. . . ,C
s∗j . (5)
b) Fuzzy aggregation: Fuzzy set theory includes a widerange of computational methods for fusing different types ofinformation. One such operator is the fuzzy integral [16].An advantage of the fuzzy integral, over other operators, isthat it is a generator function and it produces many of thewell-known crisp and fuzzy operators, e.g., ordered weightedaveraging (OWA). The specific operator that the fuzzy integralis, depends on selection of the fuzzy measure (g). Herein, weexplore the fuzzy integral to subsume and improve on theaforementioned operators. The discrete ChI is
Cjg(d) =
T∑t=1
d((t),j)(x)[g(At)− g(At−1)], (6)
where Cjg(d) is the integral for class j and fuzzy measure g,
the inputs are sorted in decreasing order (d((1),j)(x) ≥ . . . ≥d((T ),j)(x)), and At is the set of inputs from (1) to (t). Herein,like sum fusion, we use the ChI to fuse our classifier inputs perclass, then the highest confident class is selected. Specifically,the ChI is learned using the quadratic programming-basedconvex optimization algorithm proposed in [17].

However, the fuzzy integral, for T inputs, has 2T numberof parameters (the fuzzy measure). This exponential numberof parameters can grow quickly. In contexts like data-drivenlearning, this can be a limiting factor. The reader can referto [17] and [18] for recent work on combating low varietydatasets relative to the fuzzy integral and machine learning.Herein, we also explore the OWA, a subset of the ChI, asa tradeoff (performance versus simplicity). The OWA onlyhas T parameters (the OWA weights). Specifically, we usea data driven and extended version of the OWA, called thelinear order statistic neuron (LOSN) [19]. The reader can referto [19] for full details about gradient descent-based LOSNoptimization. Like the ChI, we use the LOSN to fuse acrossclassifiers and the winning class is the one with the largestLOSN aggregate value. Diagrams for both the LOSN and ChIare shown in Fig. 3.
c) Unified networks: We also experiment with traininga unified classifier where the feature vectors of the differ-ent classifiers are fused within the neural network training.Through the training process, the trainable parameters of thefusion network should be modified to accurately predict theclasses. We test the fusion networks to compare their resultsto the other fusion methods and see if combination rules orfuzzy aggregation can improve upon the unified network. Thespectral-spatial unified network (SSUN) combines the spectralLSTM and the spatial MSCNN to make predictions basedonly on HSI. For the SSUN, the combined framework istrained together, including concatenating the feature vectorsof the two classifiers. We also test a second fusion network,the multimodal unified network (MUN) which combines theMSCNN and the LSTM that are trained on HSI along with theCNN that is trained on LiDAR. Each of the last FC layers fromthe CNN, LSTM, and MSCNN networks are concatenated intoone FC layer and a single classifier is trained to accomplishmultimodal classification.
IV. EXPERIMENTS AND RESULTS
Experiments were performed with the LiDAR and HSI from2018 GRSS dataset. As we did not have access to the test setfrom the contest, we used a random subset of the training datafor testing. We subsequently split a portion of grss dfc 2018into training and validation data. The division and number oftrain and test samples is shown in Table 1. The entire subset ofdata used spatially separated the training and testing samples.We adopted 5-fold cross-validation, where the original datasetis partitioned into five equal size subsamples. For each run,one of the five subsamples is retained as the validation set totest the trained models, and four subsamples are used as thetraining data. We repeat this process of training the models fivetimes, where each of the subsample sets are used as validationexactly once. We then average their results to produce a singleestimation, shown in Table 2. The HSI had a ground samplingdistance (GSD) of 1m while the LiDAR and correspondinglabeled ground truth had a GSD of 0.5m, so we up-sampledthe HSI to match the GSD. The HSI was processed for thespectral LSTM by band grouping to reduce the number of
TABLE ISUBSET SAMPLES FROM GRSS DFC 2018
Class Train TestUnclassified 0 0Healthy grass 9505 2394Stressed grass 31189 7782Artificial turf 656 153Evergreen trees 13110 3223Deciduous trees 4775 1220Bare earth 4380 1017Water 264 69Residential buildings 37921 9487Non-residential buildings 213994 53691Roads 44397 11041Sidewalks 32708 8080Crosswalks 1518 356Major thoroughfares 44722 11260Highways 9283 2330Railways 6673 1612Paved parking lots 10983 2803Unpaved parking lots 129 29Cars 6415 1606Trains 5174 1307Stadium seats 6517 1619Total: 484313 121079
bands from 48 to five. For the spatial processing of the HSI andLiDAR, the data was divided into nine by nine pixel squareswhere the class of the center pixel determined the class label.The different methods were quantitatively compared throughthe overall accuracy, Cohen’s kappa, and average accuracy.The overall accuracy depicts which portion of samples areclassified correctly, and the average accuracy tells us theaverage accuracy per class. This average accuracy is the sum ofeach accuracy for each class predicted divided by the numberof classes. This average accuracy value gives more emphasisto classes with fewer samples. Cohen’s kappa is used as arobust statistic to test interrater or intrarater reliability. Notethat a kappa value less than perfect (1.0) is a measure of boththe agreement and disagreement among the raters.
A. Single classifier experiments
Each single-sensor based classifier was tested to give base-line results without any fusion. The MSCNN was tested onall training data, and had an overall classification accuracy of96.610%. The LSTM achieved an overall classification accu-racy of 95.922%. The LiDAR CNN had the worst performanceamong the single classifiers, with an overall classificationaccuracy of 80.536%. These are the base classifiers thatare used for the combination rules, and fuzzy aggregationframeworks.
B. Unified Networks
Testing the unified networks required training a singleframework that connects the final layers of multiple classifierson different data types together. The SSUN, which is madeup of the LSTM and MSCNN to combine spatial and spectralfeatures of HSI, achieved an overall classification accuracyof 96.773%. The MUN, which also incorporates LiDAR, per-formed slightly better with an overall classification accuracy of
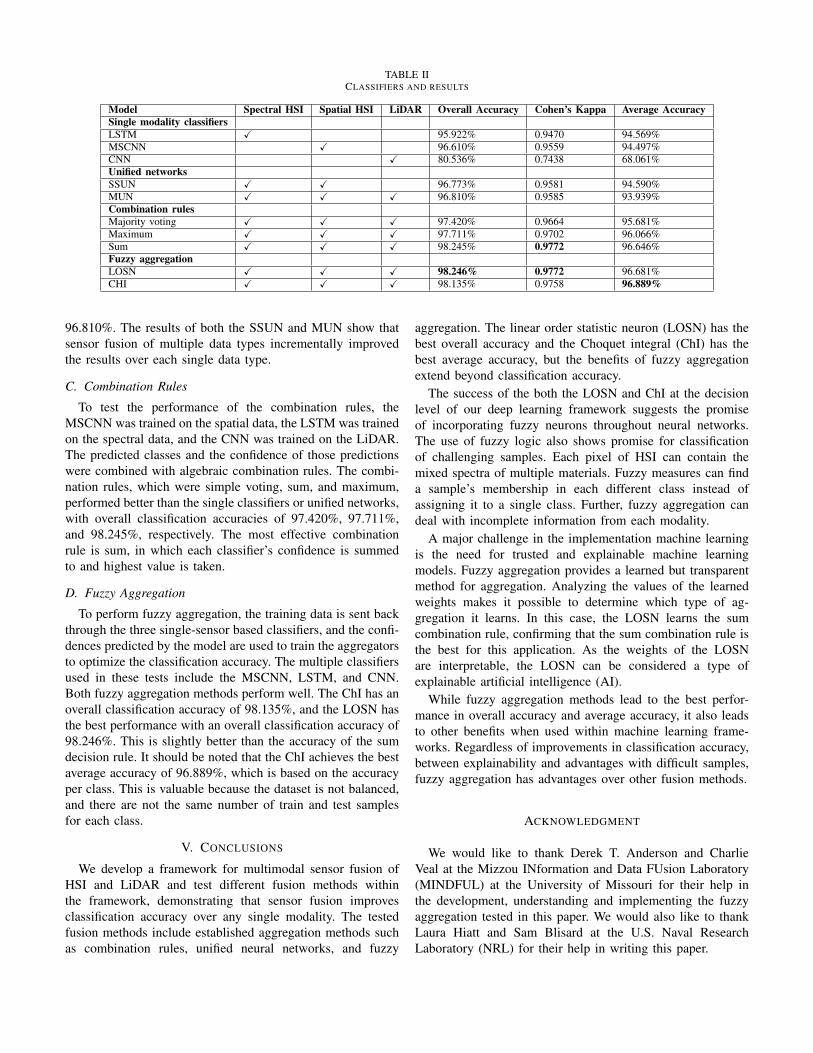
TABLE IICLASSIFIERS AND RESULTS
Model Spectral HSI Spatial HSI LiDAR Overall Accuracy Cohen’s Kappa Average AccuracySingle modality classifiersLSTM X 95.922% 0.9470 94.569%MSCNN X 96.610% 0.9559 94.497%CNN X 80.536% 0.7438 68.061%Unified networksSSUN X X 96.773% 0.9581 94.590%MUN X X X 96.810% 0.9585 93.939%Combination rulesMajority voting X X X 97.420% 0.9664 95.681%Maximum X X X 97.711% 0.9702 96.066%Sum X X X 98.245% 0.9772 96.646%Fuzzy aggregationLOSN X X X 98.246% 0.9772 96.681%CHI X X X 98.135% 0.9758 96.889%
96.810%. The results of both the SSUN and MUN show thatsensor fusion of multiple data types incrementally improvedthe results over each single data type.
C. Combination Rules
To test the performance of the combination rules, theMSCNN was trained on the spatial data, the LSTM was trainedon the spectral data, and the CNN was trained on the LiDAR.The predicted classes and the confidence of those predictionswere combined with algebraic combination rules. The combi-nation rules, which were simple voting, sum, and maximum,performed better than the single classifiers or unified networks,with overall classification accuracies of 97.420%, 97.711%,and 98.245%, respectively. The most effective combinationrule is sum, in which each classifier’s confidence is summedto and highest value is taken.
D. Fuzzy Aggregation
To perform fuzzy aggregation, the training data is sent backthrough the three single-sensor based classifiers, and the confi-dences predicted by the model are used to train the aggregatorsto optimize the classification accuracy. The multiple classifiersused in these tests include the MSCNN, LSTM, and CNN.Both fuzzy aggregation methods perform well. The ChI has anoverall classification accuracy of 98.135%, and the LOSN hasthe best performance with an overall classification accuracy of98.246%. This is slightly better than the accuracy of the sumdecision rule. It should be noted that the ChI achieves the bestaverage accuracy of 96.889%, which is based on the accuracyper class. This is valuable because the dataset is not balanced,and there are not the same number of train and test samplesfor each class.
V. CONCLUSIONS
We develop a framework for multimodal sensor fusion ofHSI and LiDAR and test different fusion methods withinthe framework, demonstrating that sensor fusion improvesclassification accuracy over any single modality. The testedfusion methods include established aggregation methods suchas combination rules, unified neural networks, and fuzzy
aggregation. The linear order statistic neuron (LOSN) has thebest overall accuracy and the Choquet integral (ChI) has thebest average accuracy, but the benefits of fuzzy aggregationextend beyond classification accuracy.
The success of the both the LOSN and ChI at the decisionlevel of our deep learning framework suggests the promiseof incorporating fuzzy neurons throughout neural networks.The use of fuzzy logic also shows promise for classificationof challenging samples. Each pixel of HSI can contain themixed spectra of multiple materials. Fuzzy measures can finda sample’s membership in each different class instead ofassigning it to a single class. Further, fuzzy aggregation candeal with incomplete information from each modality.
A major challenge in the implementation machine learningis the need for trusted and explainable machine learningmodels. Fuzzy aggregation provides a learned but transparentmethod for aggregation. Analyzing the values of the learnedweights makes it possible to determine which type of ag-gregation it learns. In this case, the LOSN learns the sumcombination rule, confirming that the sum combination rule isthe best for this application. As the weights of the LOSNare interpretable, the LOSN can be considered a type ofexplainable artificial intelligence (AI).
While fuzzy aggregation methods lead to the best perfor-mance in overall accuracy and average accuracy, it also leadsto other benefits when used within machine learning frame-works. Regardless of improvements in classification accuracy,between explainability and advantages with difficult samples,fuzzy aggregation has advantages over other fusion methods.
ACKNOWLEDGMENT
We would like to thank Derek T. Anderson and CharlieVeal at the Mizzou INformation and Data FUsion Laboratory(MINDFUL) at the University of Missouri for their help inthe development, understanding and implementing the fuzzyaggregation tested in this paper. We would also like to thankLaura Hiatt and Sam Blisard at the U.S. Naval ResearchLaboratory (NRL) for their help in writing this paper.

REFERENCES
[1] D. Lahat, T. Adali, and C. Jutten, “Multimodal data fusion: an overviewof methods, challenges, and prospects,” Proceedings of the IEEE, vol.103, no. 9, pp. 1449–1477, 2015.
[2] R. Polikar, ”Ensemble based systems in decision making,” in IEEECircuits and Systems Magazine, vol. 6, no. 3, pp. 21-45, Third Quarter2006.
[3] G. J. Scott, R. A. Marcum, C. H. Davis and T. W. Nivin, ”Fusion ofDeep Convolutional Neural Networks for Land Cover Classification ofHigh-Resolution Imagery,” in IEEE Geoscience and Remote SensingLetters, vol. 14, no. 9, pp. 1638-1642, Sept. 2017.
[4] J. A. Benediktsson and P. Ghamisi, Spectral-spatial classification ofhyperspectral remote sensing images. Boston: Artech House, 2015.
[5] P. Goel, S. Prasher, R. Patel, J. Landry, R. Bonnell, and A. Viau,“Classification of hyperspectral data by decision trees and artificialneural networks to identify weed stress and nitrogen status of corn,”Computers and Electronics in Agriculture, vol. 39, no. 2, pp. 67–93,2003.
[6] M. Belgiu and L. Dragut, “Random forest in remote sensing: A reviewof applications and future directions,” ISPRS Journal of Photogrammetryand Remote Sensing, vol. 114, pp. 24–31, 2016.
[7] G. Camps-Valls, and L. Bruzzone, “Kernel-based methods for hyper-spectral image classification.” IEEE Transactions on Geoscience andRemote Sensing 43.6 (2005): 1351-1362.
[8] S. Li, W. Song, L. Fang, Y. Chen, P. Ghamisi and J. A. Benediktsson,”Deep Learning for Hyperspectral Image Classification: An Overview,”in IEEE Transactions on Geoscience and Remote Sensing, vol. 57, no.9, pp. 6690-6709, Sept. 2019.
[9] C. Debes et al., ”Hyperspectral and LiDAR Data Fusion: Outcome of the2013 GRSS Data Fusion Contest,” in IEEE Journal of Selected Topicsin Applied Earth Observations and Remote Sensing, vol. 7, no. 6, pp.2405-2418, June 2014.
[10] Y. Xu, B. Du, L. Zhang, D. Cerra, M. Pato, E. Carmona, S. Prasad, N.Yokoya, R. Hansch, and B. L. Saux, “Advanced Multi-Sensor OpticalRemote Sensing for Urban Land Use and Land Cover Classification:Outcome of the 2018 IEEE GRSS Data Fusion Contest,” IEEE Journalof Selected Topics in Applied Earth Observations and Remote Sensing,vol. 12, no. 6, pp. 1709–1724, 2019
[11] 2018 IEEE GRSS Data Fusion Contest. Online: http://www.grss-ieee.org/community/technical-committees/data-fusion”.
[12] B. Bigdeli, F. Samadzadegan, and P. Reinartz, “Fusion of hyperspectraland LIDAR data using decision template-based fuzzy multiple classifiersystem,” International Journal of Applied Earth Observation and Geoin-formation, vol. 38, pp. 309–320, 2015.
[13] Y. Xu, L. Zhang, B. Du and F. Zhang, ”Spectral–Spatial UnifiedNetworks for Hyperspectral Image Classification,” in IEEE Transactionson Geoscience and Remote Sensing, vol. 56, no. 10, pp. 5893-5909, Oct.2018.
[14] L. Mou, P. Ghamisi and X. X. Zhu, ”Deep Recurrent Neural Networksfor Hyperspectral Image Classification,” in IEEE Transactions on Geo-science and Remote Sensing, vol. 55, no. 7, pp. 3639-3655, July 2017.
[15] H. Luo, ”Shorten Spatial-spectral RNN with Parallel-GRU for Hy-perspectral Image Classification,” arXiv.org, 2018. [Online]. Available:https://arxiv.org/abs/1810.12563.
[16] J. M. Keller, D. B. Fogel, and D. Liu, Fundamentals of computationalintelligence: neural networks, fuzzy systems and evolutionary computa-tion. Hoboken: John Wiley & Sons, 2016.
[17] M. A. Islam, D. T. Anderson, A. J. Pinar, and T. C. Havens, “Data-Driven Compression and Efficient Learning of the Choquet Integral,”IEEE Transactions on Fuzzy Systems, vol. 26, no. 4, pp. 1908–1922,2018.
[18] M. A. Islam, D. T. Anderson, A. Pinar, T. C. Havens, G. Scott, and J.M. Keller, “Enabling Explainable Fusion in Deep Learning with FuzzyIntegral Neural Networks,” IEEE Transactions on Fuzzy Systems, pp.1–1, 2019.
[19] C. Veal et al., ”Linear Order Statistic Neuron,” 2019 IEEE InternationalConference on Fuzzy Systems (FUZZ-IEEE), New Orleans, LA, USA,2019, pp. 1-6.


![Monitoria multimodal cerebral multimodal monitoring[2]](https://static.fdocuments.in/doc/165x107/552957004a79599a158b46fd/monitoria-multimodal-cerebral-multimodal-monitoring2.jpg)


![arXiv:1708.02099v1 [cs.CL] 7 Aug 2017 · 2017. 8. 8. · Multimodal Classification for Analysing Social Media Chi Thang Duong, Remi Lebret, and Karl Aberer Ecole Polytechnique F´](https://static.fdocuments.in/doc/165x107/5fdd3e13750acd342414f083/arxiv170802099v1-cscl-7-aug-2017-2017-8-8-multimodal-classiication-for.jpg)