Future Trends in Rotating Equipment Analysis€¦ · Current Trends in Rotating Equipment Analysis:...
12
Future Trends in Rotating Equipment Analysis Tony Keller, Spectral Dynamics, Inc. Abstract: Great strides have been made in monitoring vibration and combustion performance of gas turbine engines. Challenges still remain in the areas of engine overhaul and design/manufacturing of new turbine/generator systems. This paper discusses some elements of current and future efforts to understand what is happening in Real-Time as new engines are run up for the first time after assembly, overhaul or reconfiguration. Examples of Acquisition, Processing, Reprocessing, Data Storage and on line Data Review with respect to RB211 engines and derivatives will be examined. Tony Keller began his professional career as a Test Engineer at the White Sands Proving Ground in New Mexico after receiving a BEE degree from Manhattan College in New York City. Before joining Spectral Dynamics in 1965, he obtained an MSEE from New Mexico State University. With Spectral Dynamics, he has been involved in the development and introduction of dozens of products in the areas of Vibration Testing, Dynamic Analysis and Rotating Machinery studies. He has published many papers in the area of dynamics and conducted technical seminars the world over. He is currently International Sales Manager for Spectral Dynamics. Introduction: More than 45 years ago the concept of measuring vibration and noise on motors, pumps, gears and blowers was just a bit more than a gleam in the eye of several rotating equipment and instrumentation manufacturers. At the time, the FFT had not yet been formulated and distributed. There were some forms of Real-Time (Time Compression) Analyzers evolving, but most analysis was being done using swept filters and manually tuned devices. Overall measurements were the norm and constant percentage analyzers such as 1/3 Octave band analyzers were used quite often. Solar Turbines in San Diego, in the early 60’s, mounted a dedicated Velocity transducer with an adjustable “Trip” level on each new Gas Turbine Engine. This was one of the earliest “Vibration Analyzer” products produced by Spectral Dynamics, Inc. The use of a narrowband swept analyzer, often the most popular approach, required quite a bit of patience in those days, as the tradeoff between Filter Bandwidth (Hz) and Sweep Rate (Hz/sec.) could result in sweep times of 2 to 10 minutes. In one particular application, a customer was running a machine at a nominal speed of 10,200 RPM. An SD Applications Engineer named Jim Shott was performing a demonstration of a linearly swept filter analysis and was greatly anticipating the 1/Rev signal at 170 Hz. Unfortunately, just as the analog analyzer was approaching 170 Hz, the machine suddenly slowed down a bit and the 1/Rev component was missed completely. As a result of this experience, it became obvious that the spectrum analysis being produced needed to take into account the actual machine speed so that the resulting spectrum could be more rigorously tied to the machine’s performance. Thus the concept of “Signature Ratio”, which uses a Tachometer signal to synchronize sweep characteristics (analog) or sampling properties (digital) was born in an analog form in 1966. It has since been implemented many times in Real-Time and digital systems.
Transcript of Future Trends in Rotating Equipment Analysis€¦ · Current Trends in Rotating Equipment Analysis:...
Future Trends in Rotating Equipment Analysis
Tony Keller, Spectral Dynamics, Inc.
Abstract: Great strides have been made in monitoring vibration and combustion performance of gas turbine engines. Challenges still remain in the areas of engine overhaul and design/manufacturing of new turbine/generator systems. This paper discusses some elements of current and future efforts to understand what is happening in Real-Time as new engines are run up for the first time after assembly, overhaul or reconfiguration. Examples of Acquisition, Processing, Reprocessing, Data Storage and on line Data Review with respect to RB211 engines and derivatives will be examined. Tony Keller began his professional career as a Test Engineer at the White Sands Proving Ground in New Mexico after receiving a BEE degree from Manhattan College in New York City. Before joining Spectral Dynamics in 1965, he obtained an MSEE from New Mexico State University. With Spectral Dynamics, he has been involved in the development and introduction of dozens of products in the areas of Vibration Testing, Dynamic Analysis and Rotating Machinery studies. He has published many papers in the area of dynamics and conducted technical seminars the world over. He is currently International Sales Manager for Spectral Dynamics. Introduction: More than 45 years ago the concept of measuring vibration and noise on motors, pumps, gears and blowers was just a bit more than a gleam in the eye of several rotating equipment and instrumentation manufacturers. At the time, the FFT had not yet been formulated and distributed. There were some forms of Real-Time (Time Compression) Analyzers evolving, but most analysis was being done using swept filters and manually tuned devices. Overall measurements were the norm and constant percentage analyzers such as 1/3 Octave band analyzers were used quite often. Solar Turbines in San Diego, in the early 60’s, mounted a dedicated Velocity transducer with an adjustable “Trip” level on each new Gas Turbine Engine. This was one of the earliest “Vibration Analyzer” products produced by Spectral Dynamics, Inc. The use of a narrowband swept analyzer, often the most popular approach, required quite a bit of patience in those days, as the tradeoff between Filter Bandwidth (Hz) and Sweep Rate (Hz/sec.) could result in sweep times of 2 to 10 minutes. In one particular application, a customer was running a machine at a nominal speed of 10,200 RPM. An SD Applications Engineer named Jim Shott was performing a demonstration of a linearly swept filter analysis and was greatly anticipating the 1/Rev signal at 170 Hz. Unfortunately, just as the analog analyzer was approaching 170 Hz, the machine suddenly slowed down a bit and the 1/Rev component was missed completely. As a result of this experience, it became obvious that the spectrum analysis being produced needed to take into account the actual machine speed so that the resulting spectrum could be more rigorously tied to the machine’s performance. Thus the concept of “Signature Ratio”, which uses a Tachometer signal to synchronize sweep characteristics (analog) or sampling properties (digital) was born in an analog form in 1966. It has since been implemented many times in Real-Time and digital systems.

Current Trends in Rotating Equipment Analysis: There are at least 2 ways of looking at how rotating equipment is analyzed today. In a very simplistic sense, the measurement and analysis may be performed as part of an Engineering design or redesign, or it may be part of a Condition Monitoring program. The approach taken in these 2 cases is typically quite different. A. For a fixed plant installation, continuous monitoring may be preferred, based on a safely enclosed Control Room. This has often been done using hardwired cabling from each critical machine to the central monitoring facility. However, as it became obvious that one of the most expensive aspects of continuous plant monitoring was the cost of installing and maintaining cables, an alternative approach was developed and introduced. This involves the use of a portable “Data Logger” which was used by a Maintenance Engineer on a preprogrammed “Route” in the refinery, for example. An example of an SKF Microlog is shown in figure 1.
Fig. 1; SKF Microlog, advanced data logger
Data from the Microlog, or its equivalent, is downloaded to the plant computer at the end
of each route. The primary purpose of taking this data is for trending purposes to be able to predict as accurately as possible whether or not a piece of Rotating Equipment is beginning to show signs of wear and if it is, how much time is left before an orderly shutdown should be planned for repair or replacement. Although some analysis capability is present with this approach, detailed Engineering analysis is typically secondary to the trending requirements and, if necessary, is often performed by a different crew with different analysis tools.

Fig. 2; Typical Maintenance Data Logging sequence
For Engineering and “Test Cell” work, more detailed information is usually required and generated. This is one of the areas where Rolls-Royce Engineers and Designers have become expert at measuring and interpreting test cell data. But, more about this later.
B. In Engineering and Test Cell work today many ways of measuring and displaying Pressure, Strain and Acceleration are employed. They all pretty much depend on the acquisition of a very, very good speed signal or Tachometer pulses. An example of a fiberoptic tachometer signal is shown in figure 3.
Fig. 3; Fiberoptic Tacho signal taken at about 3,600 RPM
The importance of a good speed signal cannot be overstressed. In a piece of Rotating Equipment virtually all measured dynamic responses relate back to some multiple of the speed of one of the rotating elements of the equipment. Sometimes there will be multiple tachometer signals representing different stages of a turbine, such as in the case of the RB211. These must be measured with great precision in order to correctly relate dynamic responses to correct potential causes. Over the past 30 years of measuring speed, strain, sound and vibration signals from Rotating Equipment, one thing has become quite obvious. As tempting as it might be as a simple solution, it is not sufficient to use a standard data channel to acquire the Tacho signal when dealing with high speed turbomachinery. Very precise speed information, sometimes to the 1/100th of an RPM, is often very necessary when dealing with complex machines. Thus the standard multiples of 2.56 or 5.12, often used when performing an FFT analysis of dynamic data is grossly inadequate for precisely determining true machine speed, especially in the presence of rapid speed variations which create slewed data sets. For this reason some instrumentation companies employ special high speed channels for Tacho signal acquisition and conditioning, with sample rates up to 100 Megasamples per second! Typically, 4 such Tacho channels are supplied to accommodate the case of multiple Tacho inputs.
Rotating Equipment
Gather Data in
Data Logger
Download to System Database
Calculate Trends &
Recommended Action
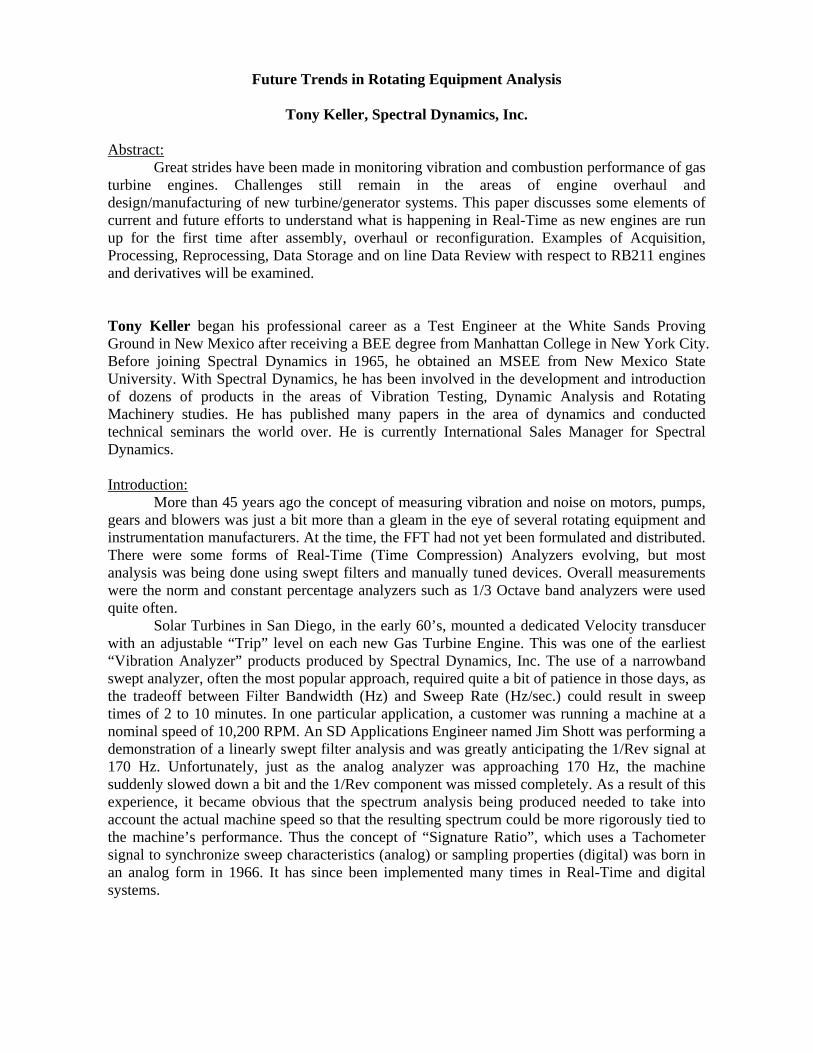
Such a high acquisition rate, together with bipolar detection and decimation, assure that the required interpolation necessary for precise speed determination, even in the presence of rapid speed changes, is accomplished with the best possible accuracy. This becomes of paramount importance in those cases where REAL-TIME signal processing and display is critical. More on this later. In some cases, where post-processing is the analysis of choice, or if for some reason no Tacho signal is available, determination of machine speed may be attempted directly from a data channel. This can sometimes, but not always, be feasible. The following figure shows two data channels, measured simultaneously, only one of which would qualify as a candidate for determining speed straight from a data signal.
Fig. 4; Vibration data from 2 bearings measured at 6,900 RPM
Figure 4 shows the Time traces and Linear Spectra from accelerometers mounted on 2 bearings of a small rotor kit running at 6,900 RPM. The data from Bearing #2, Channel 3, shows a clear preponderance of the running speed (115 Hz) or 1/Rev component. Unfortunately, the data from Bearing #1, Channel 2, shows almost no running speed component with a signal at 160 Hz 4 times that of the 1/Rev and the 3rd order of running speed nearly that high as well. Assuming that a good speed signal is available and correct signal conditioning with good anti-aliasing protection has been utilized, there are many ways to present spectrum information. What we choose to look at will depend on several things:
1. Is there an important structural resonance involved, in which case I am very interested in absolute frequencies?
2. Are most of the important vibration signals related to “Speed-Driven” excitation, in which case harmonic Orders of rotational speed are of primary importance?
3. Or is there important Order related information but at the same time some critical structural resonances present which may require a single, special display?
Let’s examine each of these cases separately.

A. The case where a fixed sampling rate is used for acquiring the data and the data is to be presented as a spectrum of g (or another Engineering Unit) vs. Hz. An example of this, for one specific machine speed, is shown in figure 5.
Fig. 5; Spectrum of 2 bearing accelerometers taken at 6,918.47 RPM, shown vs. Frequency
In this example, the vibration is shown as g (log value) vs. frequency up to 1,000 Hz with the data from 2 bearings overlaid. A fixed sampling rate of 2,560 samples per second was used and the Real-Time machine speed is shown superimposed on the graph.
B. The case where a fixed sampling rate is used for acquiring the data but the presentation, for the case of a single machine speed, is normalized by Speed to display g vs. “Machine Orders of 1/Rev”.
Fig. 6; Spectrum of 2 bearing accelerometers taken at 6,918.47 RPM, shown vs. Order
In the example of figure 6, a fixed sampling rate of 2560 samples per second was used with a fixed anti-aliasing filter effectively set at 1,000 Hz. The machine speed was 6918.47 RPM which places the 1/Rev component at 115.31 Hz. By normalizing the 1,000 Hz full scale range to “Orders”, a maximum order of 8.674 can be displayed. This brings us to choice C.

C. The case where the Tacho is used to create automatic “Tracking Sampling” with full, tracking anti-aliasing protection. An example is:
Fig. 7; Order related Vibration Spectrum with Tracking Sampling
In the example of figure 7 with a machine speed of 9,966 RPM (166.1 Hz), in order to analyze up to 10 orders in Real-Time, requires analysis to 1,661 Hz full scale. A discussion of how to do this and why to do this is warranted.
Synchronous (Tracking) Sampling:
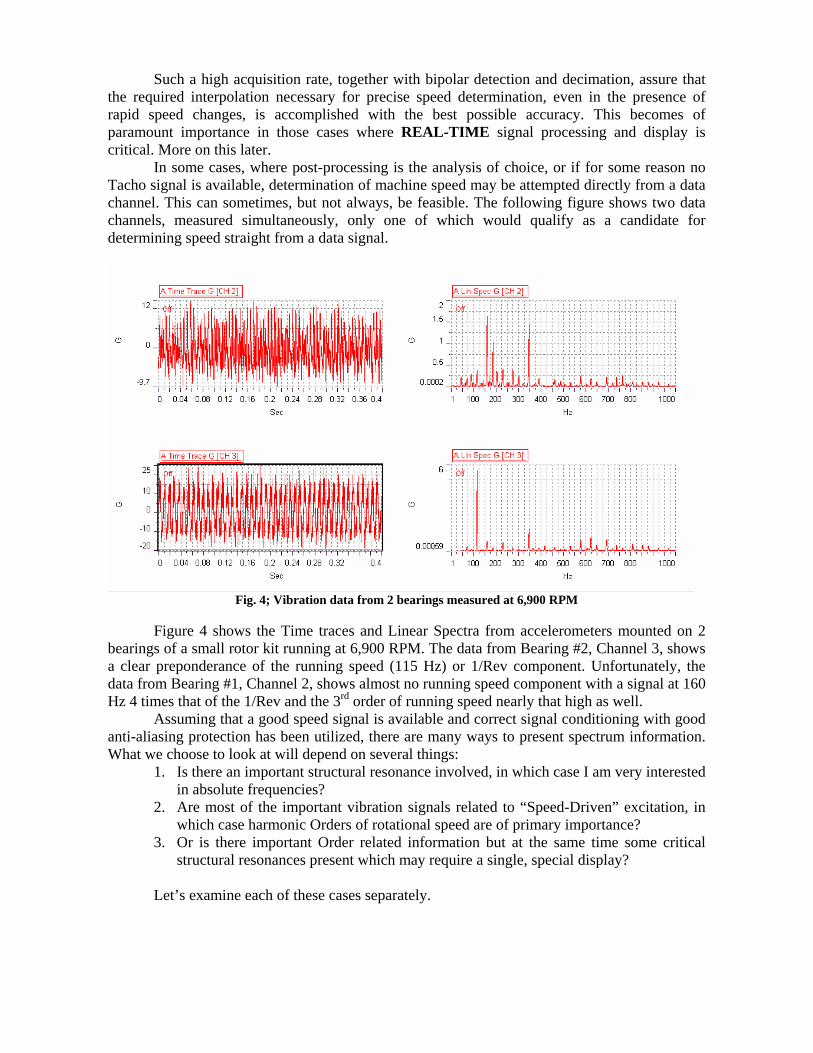
One of the challenges facing an Engineer who is trying to analyze rotating machinery vibration with an FFT, is to relate the measured vibration to specific machine properties, thus perhaps to particular machine components and possibly to gain an edge in predicting incipient machine failure. One of the best ways to do this is to move from the traditional fixed sampling FFT domain to the “machine speed” domain. If done correctly, this will eliminate many of the problems which occur when trying to determine precise machine/vibration relationships on a moving target. To do this requires several things including a good Tachometer or speed reference and a thorough and precise way of performing sampling and signal processing using this speed information. Synchronous or Tracked sampling requires that the sampling rate, and thus the low pass anti-aliasing filter cutoff points, be adjusted continuously with respect to machine RPM changes. As the machine RPM changes, so do the sampling rate and low pass filter cutoff change to maintain a synchronous relationship between the data samples and the fundamental machine speed. In the implementation described here, the sampling time increment is continuously modified from data point to data point. Instead of using a fixed delta time increment, the synchronous data domain is often referred to as the Angle or Order domain. In this domain, true Order related events are completely synchronous with the reference RPM and do not display the typical smearing observed by fixed sampling rate processing. The ability to accurately observe Order related events often requires that the sample rate be constantly adjustable to maintain the proper digitizing perspective. For Tracking
Sampling, since the delta time increment is constantly changing, the data frame (block) time value is also constantly changing. The user typically specifies the desired maximum Order and the software selects the proper tracking ratios to be utilized during the sampling rate/filter tracking process. Tracking sampling is also useful for fixed machine speed cases where accuracy of Order extraction is important since there is no “smearing” of the Order data due to slight fundamental speed variations or drift. Of particular importance is the fact that both the sampling rate and associated low pass filter cutoffs are continuously modified thus maintaining alias-free data at all times. The same characteristics can also be applied to 3-dimensional displays.
Fig. 8; 3-D display of g vs. frequency vs. Record No. for Channel 2
Fig. 9; 3-D display of g vs. frequency vs. RPM for Channel 2

The Waterfall displays shown in figures 8 and 9 are of the same data set. Figure 8 shows Record Number as the third axis whereas figure 9 shows true RPM on the third axis. Note that when the 1/Rev component and its multiples are drawn vs. Record Number or vs. Time, there can be some strange visual effects, even though the spacing between spectra is perfectly even in the third dimension. By using true RPM as the third axis the Order lines now line up perfectly. This greatly simplifies data interpretation. However, there is another special data display which can be even more revealing. Campbell Diagrams: More than 50 years ago, Dr. Joseph Campbell working in the Rotor Dynamics Laboratory of the General Electric Steam Turbine facility in Schenectady, New York, was looking for a way to present information about turbine blade resonances during critical startups of large steam turbines. He needed to evaluate the performance of a rotating turbine blade (or bucket) during runup or coast down since the reliability of these blades is critical to successful turbine operation. A turbine blade for use in steam or gas turbines is one of the few structures in Engineering which is purposely designed to have extremely low damping. These blades experience fluctuating forces when they pass through non-uniform fluid flow from stationary vanes (or nozzles). The result can be a series of modal excitations including forward and backward whirl modes, gyroscopic effects and structural resonances. Depending on the type and location of transducers during runup, many different responses can be seen. Dr. Campbell determined that a display of response frequency vs. excitation RPM would be optimum and decided on the use of circles whose diameter would give a direct indication of the level of strain, vibration or other measured parameters.
Fig. 10; Channel 3 acceleration shown as True Campbell Diagram
Figure 10 shows a “true” Campbell Diagram with analysis from 2,000 to 7,000 RPM, from 10 Hz to 1,100 Hz and with a calibration circle shown for a 20g response. This is a faithful reproduction of the diagram first described by Dr. Campbell and can now be created in Real-Time during a machine runup or a coast down. The display shown covers the first 20 rotational orders of vibration.

Current displays: Some current displays popular in Engineering development and Test Cell operations include:
Fig. 11; Spectral Intensity display showing Modulation sidebands as turbine speed increases
Fig. 12; Waterfall display of Spectrum vs. Record # for Turbine Acceleration
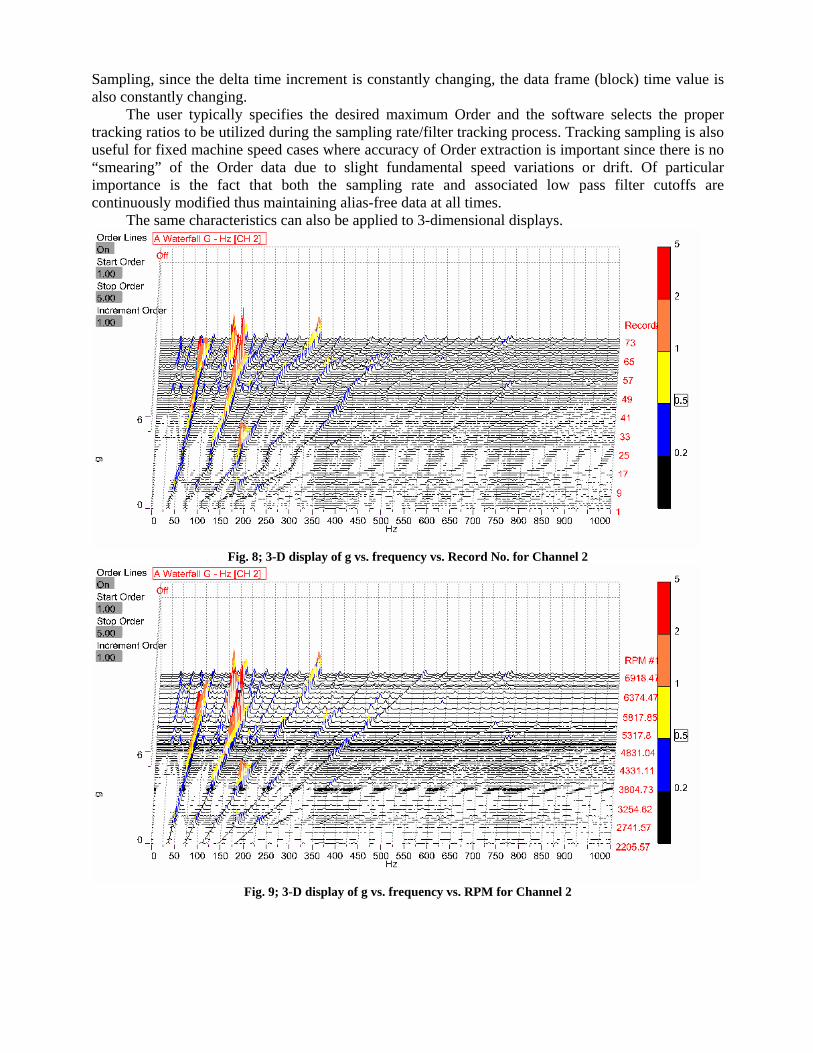
Fig. 13; Composite Plot showing 4 very useful images on some common axes
The “Composite” display, originally developed by Cranfield University in the UK, is a very revealing way of looking at vibration data from many aspects, all at the same time during a machine runup or coast down. An Intensity graph (upper left) gives an overall picture of spectrum content vs. record number and a Peak Hold spectrum (upper right) on the same frequency axis gives an instantaneous look at maximum spectrum contributions. A min/max enveloped Time history (center left) gives a quick look at the highest transducer values over the run and the “Freqogram” (lower left) reveals the highest spectrum contributions by frequency band for each record. All of this can be displayed in Real-Time or during stored data playback. Trending towards the Future: Some very interesting aspects are driving the direction in which Rotating Equipment Analysis is trending, especially for gas-turbine engines and systems derived from these engines. As is often the case, these trends seem to derive from 2 important considerations. The first of these, of course, is what customers really perceive as their upcoming requirements and directions. But the second consideration is often just as heavily weighted as the perceived need. And that is “What is available today or what will be available in the next year?” In other words, what will my hardware and software Vendors be offering very soon? The very practical nature of what really can be accomplished, not just promised, should not be taken lightly. With this in mind, some of the items now available, now coming on line or just over the horizon include:
1. Recording all data channels, in an easily accessible format which can be transferred to many post processing programs;
2. Providing Real-Time processing and display of all incoming channels; 3. Providing “Tracked” Sampling which follows Tacho speed to give truly locked
Order displays in Real-Time; 4. Providing a powerful PC-based analysis tool which can accept the recorded
data from Item 1 above, over the local network or Internet, and easily perform post test data analysis on many stations immediately following the test;

5. Using a networked PC to take data from an on-line test and display this Live data with the same channels and displays as those in the Test Cell Control room or with different channels/displays;
6. Gathering acceleration data from mounted transducers during a runup or coast down and importing this processed data into a Modal Analysis Program to show Operating Deflection Shapes as a function of Time or Tacho speed or another selected variable.
Fig. 14; Concept of flexible data gathering and transmission together with
Real-Time Analysis and display of all data channels
Discussion: There is an incredible amount of good Rotating Equipment data and analysis available to Engineers today. By using this kind of dynamic data over the years, Engineers have developed great skills at recognizing potential vibration/combustion problems in their specialized rotating systems. What is becoming apparent, as machinery developments march forward and time to market for new derivatives shrink, is the absolute need for timely dynamic data NOW. Because of the costs and technology involved, many instrumentation companies long ago gave up on emphasizing Real-Time results, in favor of recording everything in sight (hopefully fast enough) and doing almost all analyses as Post-Processing. Is this good enough? A recent anecdote may shed some light. One popular application for gas turbine jet engines, in addition to flight propulsion, is to be coupled with a generator and used for energy generation. Rolls-Royce has supported applications in Power Generation, Distributed Generation, Offshore Power Generation, Battlefield Generation and other Naval applications. By continually investigating means to reduce fossil fuel emissions, R-R has also developed Dry Low Emissions (DLE) combustion technology. This guarantees greatly reduced NOx and CO levels. Retrofitting this technology to existing field units can involve the necessity of changing out up to 9 combustion chambers on a single RB211 unit. After one such recent conversion the modified unit was being started up for the first time and all of the normal Combustion, Strain and Vibration data was
Rotating Equipment
Gather Dynamic Data and up to 4 Tachos in Real-
Time
Process and
display all gathered Data in
Real-Time
Use 1 or more PC’s on the
local Network or the Internet
to display Real-Time
data which is the same as or different from the live Test Cell displays
Store raw Time data to independent Throughput
Data Disk(s) at up to 7.4 MB/sec.
Bring processed data into a Modal Analysis
Program to display Operating Deflection Shapes in Real-Time
Transfer data streams in a convenient file format,
over a Network, to a portable Analysis
program running in multiple PC’s
simultaneously

being recorded for post-processing. But several Real-Time channels were also being observed during this initial runup. One of those channels was an acceleration signal being observed as a Real-Time Waterfall display such as the graph in the upper left in figure 15. An experienced operator was quick to notice an emerging danger situation from the Real-Time display and immediately asked for an orderly shutdown. Sure enough a slight problem having to do with reinstalled Combustion Chambers was determined and quickly rectified. Potential saving? Over $500,000.
Fig. 15; Example of 9 different displays being shown in Real-Time during a machine runup including Vibration and
Tacho signals
Conclusions: As rotating equipment gets faster and more capable, testing of this equipment becomes more important than ever. The ability to make Engineering decisions based on the availability of critical data on-line is more important now than it has ever been. Accurate signal conditioning, gap-free data sampling and storage of all dynamic channels and rapid system-wide access to this data immediately following the test is crucial. But it is no longer enough. Without the ability to see an emerging problem in Real-Time, the event described above could have ended with a Post-Test Analysis of recorded data showing a very expensive engine on the way to self-destruction. When doing dynamic testing, there is simply no substitute for REAL-TIME information.