FUTURE SEAFOOD - International Groundfish...
22
FUTURE SEAFOOD pascal @ surimi.us - tel +33 6 76 20 59 15 SURIMI MARKET UPDATE OCTOBER 2016 FUTURE SEAFOOD Pascal GUENNEUGUES
Transcript of FUTURE SEAFOOD - International Groundfish...

FUTURE SEAFOODpascal @ surimi.us - tel +33 6 76 20 59 15
SURIMI MARKET UPDATE
OCTOBER 2016
FUTURE SEAFOODPascal GUENNEUGUES
FUTURE SEAFOOD
Surimi Supply From Around The World
Specialist of Tropical Fish Surimi

SURIMI SUPPLY
Global surimi production: 800,000 MT in 2015
260,000 MT Cold water fish surimi:Alaskan pollock, PW, SBW, Hoki, NBW
500,000 MT Tropical fish surimi: Itoyori, Eso, Flying Fish, Sea Bream, Ribbon Fish, etc
25,000 MT fresh water fish : Silver carp (Aquaculture, China)
10,000 MT other : Sardine, Mackerel, etc

Tropical Fish
(Itoyori, etc)
500,000 MTThailand, Vietnam, India, China,
Indonesia, Malaysia,
Pakistan, Myanmar …
WORLD SURIMI PRODUCTION
800,000 MT (2014/2015)
Alaska
Pollock
200,000 MT
USA
Pacific
Whiting
25,000 MT
USA
North Blue
Whiting
3,200 MT
France
China
Silver Carp
25,000 MT
Japan
Pollock
30,000
MT
Southern Blue Whiting & Hoki
6,000 MT
Argentina/Chile

SURIMI SUPPLY 2014-2015
Supply and demand stable around 800,000 MT/year
Alaskan pollock surimi production increase by 30,000 MTdecreased production in Japan 20,000 MT and PW 10,000 MT
Tropical fish surimi stable : decrease in Thailand, increase in Vietnam
0
200.000
400.000
600.000
800.000
1.000.000 Other
Tropical Fish
Other cold water
Pollock
GLOBAL SURIMI PRODUCTION 2005-2015 (MT)

2006 2007 2008 2009 2010 2011 2012 2013 2014 20152016 est
Pollock USA 178000 161000 126000 86000 105000 148000 167000 170000 183000 202000 210000
Pollock Japan 41000 35000 42000 46000 55000 60000 64000 52000 37000 34000 30000
Pollock Russia 0 0 0 150 900 800 100 2000 0 0 0
Total Pollock 219000 196000 168000 132000 160000 208000 231000 224000 220000 236000 240000
Alaska Pollock quota:USA 1.53 million MT, Russia : 1.84 million MT
Pollock surimi production in 2016 expected to remainaround 230,000-240,000 MT
0
50000
100000
150000
200000
2500002
005
200
6
200
7
200
8
200
9
201
0
201
1
201
2
201
3
201
4
201
5
201
6 (
est)
Pollock Russia
Pollock Japan
Pollock USA
POLLOCK SURIMI 2005-2016exp (MT)

Pacific Whiting TAC and Catch (MT)2005 to 2015
0
100.000
200.000
300.000
400.000
500.000
2005 2006 2007 2008 2009 2010 2011 2012 2013 2014 2015
TAC
Catch
2015: Decreased Catch by 100,000 MT due to no catch in fall (fish is spread out and vessels cannot catch) -> Decreased surimi production by 10,000 MT
2016: Quota increased 15% (367,000 MT); Factory vessels increase their catch in Spring and Fall Season -> PW surimi production increase 10,000-15,000 MT (?)
Other Cold Water Surimi
Northern Blue Whiting Surimi : stable around 3,200 MT
Southern Blue Whiting and Hoki : increase from 6,000 MT to 10,000 MT due to increased production by San Arawa in Argentina

TROPICAL FISH surimi production slightly deceasing in historical processing countries in 2016 (-20,000 MT?) due to reduction of illegal fishing and lower demand due to supply of pollock surimi
THAILAND : 55,000 MT (-10,000 MT)VIETNAM : 150,000 (-10,000 MT)INDIA : 55,000 MT (stable)CHINA : 200,000 MT (-10,000 MT)
Production slowly increasing in other countries in South East Asia
INDONESIA : 40,000 MTMALAYSIA : 20,000 MT PAKISTAN : 5,000 MTMYANMAR : 3,000 MT
0
200.000
400.000
600.000
2005 2006 2007 2008 2009 2010 2011 2012 2013 2014 2015 2016(est)
Vietnam
China
India
Thailand
TROPICAL FISH SURIMI 2005-2016 est. (MT)

0
50000
100000
150000
2005
2006
2007
2008
2009
2010
2011
2012
2013
2014
2015
20
16
est
Thailand Surimi Production 2005-2016 (MT)
0
20000
40000
60000
India Surimi Production 2005-2016 (MT)
0
40000
80000
120000
160000
2005
2006
2007
2008
2009
2010
2011
2012
2013
2014
2015
2016
est
Vietnam Surimi Production 2005-2016 (MT)
0
50.000
100.000
150.000
200.000
250.000
China Surimi production 2005-2016 (MT)
TROPICAL FISH SURIMI 2005-2016

0
200.000
400.000
600.000
800.000
1.000.000
200
5
200
6
200
7
200
8
200
9
201
0
201
1
201
2
201
3
201
4
201
5
201
6…
Other
Tropical Fish
Other cold water
Pollock
GLOBAL SURIMI PRODUCTION 2005-2016 est. (MT)
Global surimi production is stable around 800,000 – 810,000 MT since 20132016 production similar to 2015
Market is stable, slightly decreasing in 2016
Import Volume in Japan, Europe, Thailand, China decreasing in 1st half of 2016 reflecting economic recession and reduced inventory of surimi seafood processors
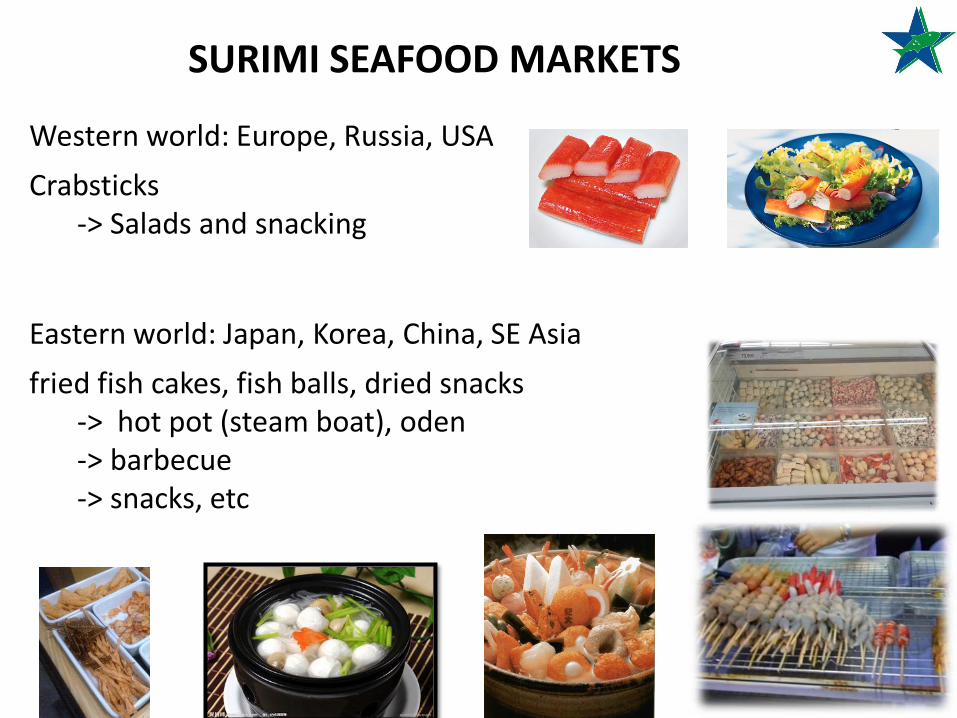
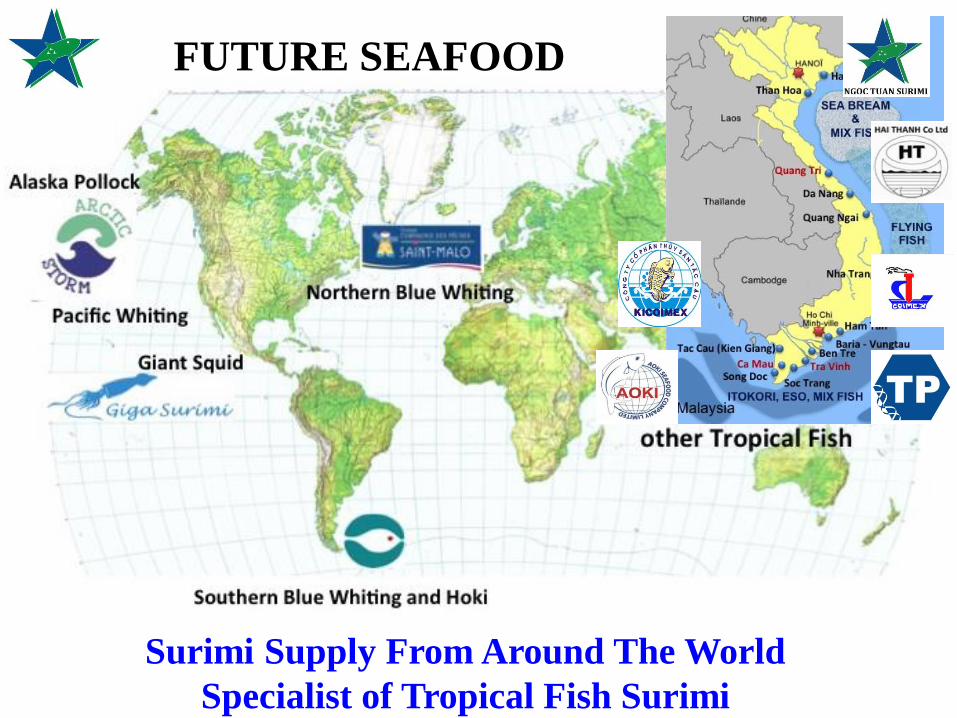
SURIMI SEAFOOD MARKETS
Western world: Europe, Russia, USA
Crabsticks-> Salads and snacking
Eastern world: Japan, Korea, China, SE Asia
fried fish cakes, fish balls, dried snacks-> hot pot (steam boat), oden-> barbecue-> snacks, etc

SOUTH AMERICA1,000 MT
(5,000 MT)
JAPAN300,000
MT
(600,000 MT)
WORLD SURIMI MARKET: 800,000 MT-> Surimi Products: 2.7 million MT (2015)
SOUTH EAST ASIA70,000 MT
(200,000 MT)
CHINA220,000 MT
(1,200,000 MT)
KOREA120,000 MT
(350,000 MT)
EAST EUROPE20,000 MT
(60,000 MT)E.U.45,000 MT
(150,000 MT)
USA30,000 MT
(90,000 MT)
Surimi Market Raw Material -> (Finished products)

MARKET UPDATE SURIMI CONSUMPTION TREND 2015-2016
Japan: surimi consumption decreased in 2015 by 2-3% as a result of increased prices
and a mild winter. Same trend continues in the first half of 2016.
Korea: market stable ; recovers in 2016 after slight decrease in 2015
South-East Asia: market keeps growing around 10% per year in Thailand, Malaysia,
Indonesia, etc
China: market slow in 2015. Concentration : large processors take-over the domestic
market while the government closes down small processors with poor sanitaryconditions.
Europe: surimi seafood market stable, decreasing in France, growing in Spain and
Italy.
Russia: surimi seafood market keeps decreasing by 15-20% in 2016
USA: market slowly growing 2-3% per year after years to stagnation
Overall the world surimi demand is stable; surimi seafood processors tend to decrease inventory of raw material due to healthy supply of pollock surimi.

JAPAN SURIMI MARKETDecreased consumption 2-3% in 2015 due to increased prices of finished products (+15/20% in 2 years) and a mild winter.
Total Import Stable around 250,000 MTIncreased Imports of Alaskan Pollock : + 8,000 MT in 2015

JAPAN SURIMI INVENTORYAfter increasing from 50,000 to 60,000 MT in 2015 due to decreasedmarket, Japan inventory is lower in 2016 as imports decreased
40.000
45.000
50.000
55.000
60.000
65.000
70.000
75.000
JAN FEB MAR APR MAY JUN JUL AUG SEP OCT NOV DEC
Surimi Inventory In Japan (MT)
2012
2013
2014
2015
2016
JPY / USD exchange rate back to 100, same level as 2014 -> reduced purchase price for pollock surimi in Japan should have a positive impact on the price of finished products and surimi consumption in Japan in the coming months.

0
50000
100000
150000
Jan-Dec'13 Jan-Dec'14 Jan-Dec'15
Other
Indonesia
India
Thailand
Vietnam
China
USA
Korea surimi imports 2013-2015 (MT)
KOREA SURIMI IMPORTS
0
20000
40000
60000
80000
Jan-Aug'14 Jan-Aug'15 Jan-Aug'16
Other
Indonesia
India
Thailand
Vietnam
China
Argentina
USA
Korea surimi imports Jan-Aug 2014-2016 (MT)
Korea Surimi Imports mainly low grade surimi from China and Vietnam for fried fish cakes. Some higher grade is used for crabstickand high end products
After a slight decrease in 2015, the Korean market recovered in 2016. Imports of medium quality surimi increase in relation to the rapiddevelopment of the market for high quality fish croquettes in Korea.
0
10.000
20.000
30.000
40.000
Jan-Dec'13 Jan-Dec'14 Jan-Dec'15
Indonesia
China+HK+TW
USA
Vietnam
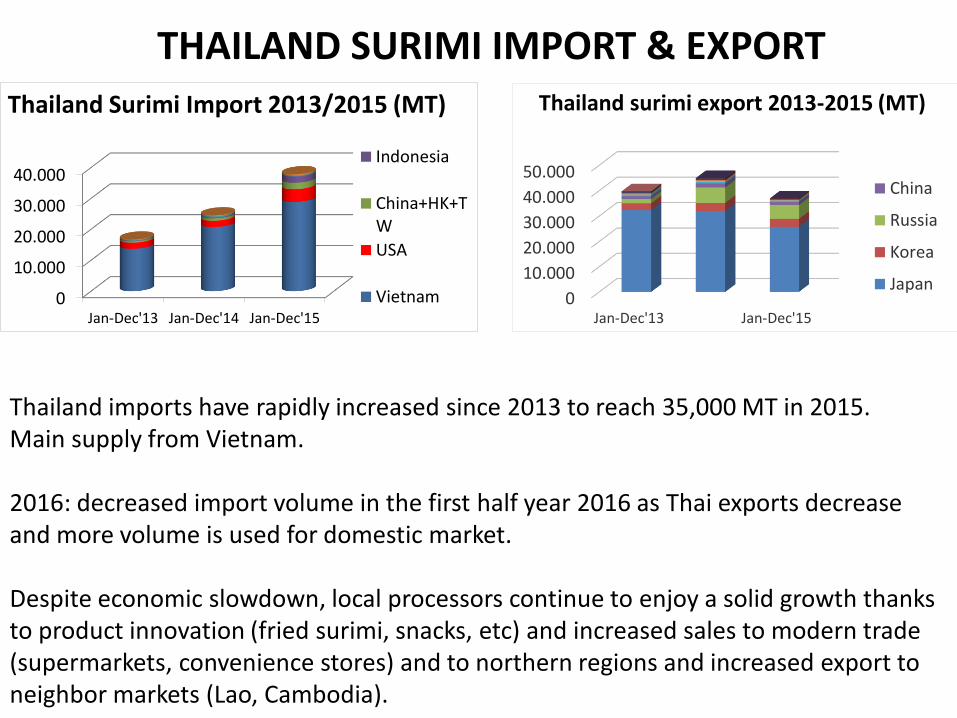
Thailand Surimi Import 2013/2015 (MT)
0
10.000
20.000
30.000
40.000
50.000
Jan-Dec'13 Jan-Dec'15
China
Russia
Korea
Japan
Thailand surimi export 2013-2015 (MT)
THAILAND SURIMI IMPORT & EXPORT
Thailand imports have rapidly increased since 2013 to reach 35,000 MT in 2015. Main supply from Vietnam.
2016: decreased import volume in the first half year 2016 as Thai exports decreaseand more volume is used for domestic market.
Despite economic slowdown, local processors continue to enjoy a solid growth thanksto product innovation (fried surimi, snacks, etc) and increased sales to modern trade(supermarkets, convenience stores) and to northern regions and increased export to neighbor markets (Lao, Cambodia).

0
20.000
40.000
60.000
Jan-Dec'13 Jan-Dec'15
US PollockUS HakeHoki+SBWVietnamIndiaThailand
EU surimi imports 2013-2015 (MT)EU SURIMI MARKET
The EU market stable in the past years.
French market decreased 5% in 2015 and again 10-15% in 2016 while othermarkets like Spain and Italy keepgrowing with chilled products.
0
10.000
20.000
30.000
Jan-Jul'14 Jan-Jul'15 Jan-Jul'16
Hake
Pollock
EU surimi imports from USA
US surimi dominates the exports to EU.
Pacific Whiting surimi imports increased in 2014 and 2015 to represent nearlythe same volume as pollock surimi … but it will be lower in 2016 due to no production in the fall season of 2015.
France 54,000 t
Spain 44,000 t
UK 10,000 t
Sandinavia 4,000 t
Italy 13,500 t
Benelux / Germany
10,000 t

0
5000
10000
15000
Jan
Feb
Mar
Ap
r
May Jun
Jul
Au
g
2015
2016
Russia Surimi imports Jan-August 2015/2016 (MT)
0
5.000
10.000
15.000
20.000
25.000
Jan-Dec'13 Jan-Dec'14 Jan-Dec'15
Pollock &PWTropical fish
Other
EAST EUROPE SURIMI MARKET
Russia Surimi Imports 2013-2015 (MT)
As a result of the economic situation East Europe surimi market keeps declining : after a decrease of 20% in 2015, the market has decreased by another 20% in the first half of 2016.

CHINA SURIMI MARKET
China market is over 1.2 million MT Estim. consumption ~220,000 MT of surimi raw material.
China surimi seafood market has been suffering 2 years of depression:- High competition for low-end market- Increased cost of raw material (incl.chicken meat, pork fat)
-> low/no margin products
Market stagnant in 2015 : economic recession, mild winter.
Processors try to shift from low-end fish balls to higher quality products.
New season starting in China may shape the surimi market for the end of this year.

What to expect for the surimi market in 2016
Surimi production has been stable in 2016 (similar to 2015).
Raw material prices remain high in SE Asia, surimi production costtends to increase but the price of surimi cannot follow due to the abundance of pollock in the market.
Low oil prices favorable for the fishing industry but it does not translate into lower prices for raw material.
-> problem of competitivity for tropical fish against alaskan pollock-> tropical fish surimi producers suffer from low market prices
The pollock resource should remain abundant in 2017 and the marketis expected to remain relatively stable in the coming months and year.

FUTURE SEAFOOD
pascal @ surimi.us - tel +33 6 76 20 59 15
FUTURE SEAFOODPascal GUENNEUGUES
THANK YOU