Future ProoFing Cities - gov.uk€¦ · Future proofing cities is an approach that sums up what is...
188
Atkins in partnership with FUTURE PROOFING CITIES Risks and opportunities for inclusive urban growth in developing countries
Transcript of Future ProoFing Cities - gov.uk€¦ · Future proofing cities is an approach that sums up what is...

Atkins in partnership with
Future ProoFing
Citiesrisks and opportunities for inclusive urban growth in developing countries

Acknowledgements Research and Editorial TeamThis report was led by Atkins in partnership with The Department for International Development (DFID) and University College London (UCL).
DFID � Simon Ratcliffe, Energy Adviser
� Shailaja Annamraju, Regional Climate Change Adviser
Atkins � Elspeth Finch, Director
� Roger Savage, Associate Director
� Nick Godfrey, Principal Economist and Lead Author
� Winnie Rogers, Graphic Design
� Supported by: Martin Tedder, Edward Demetry and Simon Hunt
UCL, Development Planning Unit � Prof. Caren Levy, DPU Director
� Dr. Adriana Allen, Director Environmental Justice, Urbanisation and Resilience programme
� Dr. Vanessa Castan Broto, Lecturer
� Linda Westman, Researcher
This report would not have been possible without support from across a wide range of organisations.
Special thanks to the expert advisory group who provided invaluable advice and input throughout the course of the project: Dr. Diane Archer (IIED), Gable Bennett (Faithful+Gould), John Box (Atkins), Dr. Geoff Darch (Atkins), Dr. David Dodman (IIED, UCL), Steven Fraser (Atkins), Arif Hasan (Urban Resource Centre, Karachi), Colin Hagans (Southern Africa International Youth Foundation), Rob McSweeney (Atkins), Mohan Rao (Indian Institute for Human Settlements), Prof. Yvonne Rydin (UCL), Prof. Neil Strachan (UCL), Dr. Cecilia Tacoli (IIED), Dr. Robert Whitcombe (Atkins), and Bruno Vedor (Mozambique Architcture and Planning).
Distinguished experts outside Atkins provided invaluable insights and advice. We would particularly like to thank Alice Balbo (ICLEI), Anthony Bigio (World Bank), Sam Bickerseth (CDKN), Andrew Boraine (Cape Town Partnership), Billy Cobbett (Cities Alliance), Cristina Rumbaitis Del Rio (Rockefeller Foundation), John Elkington (Volans), Dan Hoornweg (World Bank), Vijay Jagannathan (World Resources Institute), Charmian Love (Volans), Aldrin Plaza (Asian Development Bank), Andrew Steer (World Resources Institute), Florian Steinburg (Asian Development Bank), Hiroaki Suzuki (World Bank), and Konrad Otto-Zimmermann (ICLEI).
We are also grateful for the contributions and support of numerous Atkins colleagues including: Richard Alvey, Jitesh Brahmkshatriya, Andrew Buckley, Darron Cox, Tony Chan, Claire Danby, Tom Evans, Zoe Green, Lindsay Farmer, Paul Fraser, Neil Fraser, Mark Harrison, Susana Halliday, Sara Lipscombe, Janet Miller, Emma Newman, Sarah Richards, Nick Roberts, Praveen Sridharan, Neil Thomas, David Tonkin, Andy Winstanley, and Mike Woolgar.
This project was financed by the UK Department for International Development (DFID). However, the views presented in this paper are those of the authors and do not necessarily represent the views of DFID or the project steering group. The authors wish to thank DFID and other stakeholders who were consulted in the preparation of this report for their comments, suggestions and insights. The authors take full responsibility for any errors or omissions contained in the report.
This report contributes to Atkins’ mission to help support our partners develop the cities of the future. Our work in this field is led by Atkins’ Futures Director, Elspeth Finch and Cities Director, Richard Alvey.

Future ProoFing
Citiesrisks and opportunities for inclusive urban growth in developing countries

ii | Future Proofing Cities
Atkins in partnership with

About the project partners
the Department for international Development (DFiD)The Department for International Development (DFID) leads the UK government’s fight against world poverty. Through its network of offices throughout the world, DFID works with governments of developing countries, charities, non government organisations, businesses and international organisations, like the United Nations, European Commission and the World Bank, to eliminate global poverty and its causes. DFID’s work forms part of a global promise, the eight UN Millennium Development Goals, for tackling elements of global poverty by 2015. DFID’s Climate and Environment Department (CED) is helping to establish DFID as a world leader in demonstrating results, impact and value for money from supporting developing countries to tackle climate change. CED’s goal is to demonstrate that low-carbon, climate resilient and sustainable development is necessary and achievable.
AtkinsAtkins is one of the world’s leading infrastructure and design companies, with the depth and breadth of technical expertise to respond to the world’s most complex infrastructure and environmental challenges. These include responding to the increasing rate of urbanisation and the urgent transition to a low carbon economy. Atkins works with municipal authorities, national and regional government, development agencies, private sector companies, and other stakeholders to develop and implement strategic plans and investment projects to shape and manage the future growth of cities. With over 17,000 employees worldwide, Atkins is able to bring together its technical knowledge across a wide range of disciplines such as transport, water, energy, design, architecture, climate science, ecology, planning, and economics to help cities and those investing in them to act upon the long term opportunities and challenges of resource use and a changing climate. Our international work spans Africa, Asia, Europe, the Middle East and North America. Through our ‘Carbon Critical’ initiative Atkins has developed a range of bespoke tools to reduce the carbon emissions associated with major urban infrastructure programmes including a low carbon Masterplanning tool to reduce city carbon footprints.
university College London: Development Planning unitUCL is one of only three UK universities in the top 20 in the 2011 Shanghai Jiao Tong world rankings, and in the latest research assessment exercise UCL was rated third overall in the UK after Oxford and Cambridge. The Barlett Development Planning Unit (DPU) is internationally recognised for its academic and professional contributions in relation to city development in the developing world in active collaboration with partner institutions and researchers in the Global South. It is concerned with promoting sustainable forms of development, understanding rapid urbanisation and encouraging innovation in the policy, planning and management responses to the economic, social and environmental development of urban areas, giving emphasis to social justice, participatory local governance and poverty reduction. The key distinctive features of the DPU are its commitment to action research and its focus on rapidly urbanising areas in the developing world. The DPU maintains a wide network of partner organisations in Latin America and the Caribbean, Africa and South and Southeast Asia working on sustainable cities.
The project was led by Atkins in partnership with the Development Planning Unit (DPU) at University College London and the Department for International Development (DFID).


Contents
00 Forewords iii
Executive Summary ix
Introduction to report xviii
01 Why Future ProoF Cities? What do we mean by Future Proofing Cities? 01
Now is the time to act 04
Why future proof? 08
Summary 09
02 the DiFFerent risks FACing Cities Introduction 13
The environmental risks relevant to cities 14
Five urban types 20
Tracking risks over time 42
Summary 43
03 VuLnerAbiLity AnD CAPACity oF Cities to resPonD to risks Introduction 47
Moving from risk to impact and opportunity 49
Urban vulnerability 50
Ability of cities to act 58
Summary 71
04 oPPortunities For urbAn Future ProoFing Introduction 75
An integrated approach for responding to risks 76
Policies applicable to different urban types 78
Targeting vulnerabilities and supporting economic development 93
The capacity required to implement solutions 96
Maximising impact and value for money 100
Creating integrated policy portfolios 104
Future development pathways 107
Progress to date and other barriers to action 108
Summary 109
05 MAin MessAges AnD reCoMMenDAtions 113
06 bibLiogrAPhy 123
07 APPenDix: teChniCAL notes 135

ii | Future Proofing Cities
Atkins in partnership with

Future Proofing Cities | iii
Atkins in partnership with
Forewords
We have now crossed the threshold where more than half of the world’s people live in cities. Rapid urbanisation in Africa and Asia will expand existing cities and see the emergence of new ones. This will place strains on infrastructure and potentially create social and environmental problems putting many people at risk.
The Future Proofing Cities report makes a powerful case for acting now to take advantage of the opportunities that come from cities. By recognising the risks, cities can avoid some of the mistakes that have been made in many developed countries and respond to the challenges of the future.
This report contains not just analysis but practical and pragmatic ways forward for city decision-makers as they build urban environments that improve the lives of the poor.
Cities are complex and they need integrated responses to the challenges and risks they face. The growing number of urban poor is a concern for the Department for International Development and we have a range of programmes that will contribute to the efforts to improve the lives of people in urban areas. This report will help us to keep on improving on what we do and makes clear that “future proofing” has significant social and economic co-benefits.
I am pleased that DFID has supported the production of this report and I am confident that it will help us to deepen our dialogue with decision-makers as they manage, plan and “future proof” the cities of tomorrow.
Justine Greening MPSecretary of State for International Development
From the project partners

iv | Future Proofing Cities
Atkins in partnership with
Shakespeare wrote ‘What is the city, but the people?’ As engineers and designers the challenge is irresistible and immediate to work with cities around the world to support them in meeting the future needs of all of their people.
By 2050, 75 per cent of the world’s population is expected to live in cities, with 95 per cent of that expansion in developing countries. These are challenging statistics alone, but when combined with the huge environmental, social and economic changes underway they signal a pressing urgency to act to ensure that the appropriate infrastructure is in place.
Future proofing cities is an approach that sums up what is needed. For many developing cities a strategy based on ‘grow first, tackle environmental risks later’ is not an option. However, if a city can assess the range of risks it faces and respond appropriately it can catalyse development that benefits everyone. By investing in the most relevant policies from the outset to suit its unique needs a city can generate economic, social and environmental returns.
The future growth and identity of a city is intimately bound up with meeting the changing needs of its population. Coherent and holistic planning and design of core infrastructure such as roads and rail, water, waste water and power supplies is vital. Consider a city as a complex living organism and the transport system as its bones. If that is well planned and designed for future needs it is possible to shape cities which are more efficient, competitive, and resilient.
They can be shaped to be less energy intensive and low carbon in nature, to withstand the trauma of flood and drought; water and food scarcities, and to protect the natural assets on which their future depends. Cities have always adapted and evolved to survive. This report shows a way for cities to plan and shape their own destiny.
Through our work with cities across the world we have identified many examples of effective future proofing activities. Good examples are low carbon urban planning in Mysore in India and the creation of a vibrant new business district in the heart of Zhuhai, China. Underpinned by a modern public transport system, these cities will be attractive places in which to live, work and visit with open green spaces, landmark new buildings while also preserving their heritage. All this is being achieved through carbon critical design. Our work on the London 2012 Games showed that even in an established city like London it was possible to revitalise polluted brownfield land and turn it into valuable green space. First, as a fitting venue for Olympic excellence and then as lasting parkland for all to enjoy.
As one of the world’s largest infrastructure and design companies, we are committed to working in partnership with all those who share our aims - cities, regional and national governments, development agencies, academic institutions, think-tanks, and private sector investors to create cities of the future which are environmentally, socially, and economically prosperous.
Dr Uwe KruegerChief Executive Officer, Atkins

Future Proofing Cities | v
Atkins in partnership with
In recent years, UCL has drawn on the breadth of its expertise to address problems of global significance. We seek to develop and help to implement solutions in partnership with external agencies, governments, business and communities.
The UCL Grand Challenge of Sustainable Cities – like its sister programmes addressing the Grand Challenges of Global Health, Intercultural Interaction and Human Wellbeing – transcends the boundaries between disciplines and brings our collective expertise to bear on otherwise intractable problems.
The UCL Development Planning Unit has been at the forefront of many of our Sustainable Cities collaborative projects, because its members bring a deep understanding of the complex and inter-connected issues threatening urban areas. They also share and inspire our commitment to generating novel and equitable solutions.
UCL is pleased to have contributed expertise to this report. Complexity, and thus the need to develop site-specific solutions, is a central theme running through Future Proofing Cities. This is particularly important in less developed countries whose cities are growing rapidly, often lacking the resources and infrastructure to support a growing population. In this context, addressing the needs of the urban poor requires an integrated approach to the assessment of environmental risks and solutions that generate environmental, social and economic benefits.
The report reveals significant gaps in our data, knowledge and evidence, highlighting the need for high quality research on the governance of urban environmental risks and the enrolment of multiple actors in planning and decision-making. Yet the report also speaks to the amount of positive change that is within our grasp to bring about; more sustainable, fairer and safer cities in less developed countries. This kind of change will be better achieved through the effective engagement of international development agencies with academics, policymakers, practitioners and citizens.
UCL, London’s global university, is keen to build on the expert research and effective engagement it has conducted thus far.
Dr Uwe KruegerChief Executive Officer, Atkins
Professor David PriceUCL Vice-Provost (Research)

vi | Future Proofing Cities
Atkins in partnership with
In addition to being home to more than half the world’s population, cities are our most important tool to reduce poverty and move us toward sustainable development. Cities by their nature, and often by design, are however fragile and vulnerable to the vagaries of disasters and major disruptions. We should anticipate that disasters will strengthen and increase in frequency this century.
This report provides a useful review on how cities need to prepare for the future – especially cities in low-income countries and fast-growing cities in middle-income countries. We need to build cities for an additional 2.5 billion residents within the next forty years, and if this were not a Herculean enough challenge on its own, we have to build these cities in a time of greater uncertainty and a warming climate. The risks are growing, but as this report highlights much can be done today by city leaders and managers to ‘future proof’ urban areas and the largely beneficial process of urbanization. Reports like this will help with the task at-hand.
The 21st century is already proving to be a time of great dynamism, with volatility and uncertainty competing with progress on many fronts. Nowhere is this truer, arguably, than in the cities of low- and middle-income countries, which will swell to accommodate 1.4 billion new inhabitants by 2050. At the same time these cities face a plethora of aggravating risks, such as climate change and its impacts on lifeline systems, frayed ecological support systems, and crippling poverty, which limit the capacity of people and institutions to adapt to changing conditions and curtails their abilities to take advantage of opportunities.
To address the interconnected challenges of urban growth, climate change, and poverty in growing second tier cities, the Rockefeller Foundation launched the Asian Cities Climate Change Resilience Network (ACCCRN) in late 2007. This marked the first systematic effort to develop both a conceptual approach and a base of practice on building resilience to climate change across a range of urban contexts. ACCCRN initially prioritized action in 10 cities across Vietnam, Thailand, India and Indonesia, and is now scaling up to support cities in Bangladesh, the Philippines and elsewhere.
Future Proofing Cities makes an important contribution to the emerging field of urban resilience by highlighting the complex set of interconnected challenges that cities in developing country will face, building an urban risk database for 129 cities, and developing an approach to assess urban vulnerability and capacity. More than one hundred potential solutions are identified and examined in the context of affordability, governance and planning requirements, ease of implementation, and potential impact. Cities are clustered into five distinct types to guide the development of integrated policy solutions. This forms an important analytical framework and evidence base that we sincerely hope will catalyze scaled up investment and action to build equitable and resilient cities of the future.
We congratulate the UK Department for International Development, Atkins, and the University College of London for this report, and their individual efforts to build more resilient cities globally.
other organisations
heather grady Vice President, Foundation Initiatives Rockefeller Foundation
Dan hoornweg Lead Urban Specialist, Cities and Climate ChangeWorld Bank

Future Proofing Cities | vii
Atkins in partnership with

© h
oan
g D
inh
nam
/get
ty im
ages
hanoi, Vietnam

Future Proofing Cities | ix
Atkins in partnership with
Executive Summary
One of the defining challenges of our time is how to reconcile the need for rapid growth and poverty alleviation in many parts of the world with the need to avoid irreversible and costly environmental damage. This is a challenge that will be played out in the world’s cities.
More than half of the world’s population already live in cities and this is expected to reach 75 per cent by 2050. Cities occupy only two per cent of the earth’s land, yet account for 60 to 80 per cent of energy consumption and 75 per cent of carbon emissions. Natural hazards such as flooding and drought, temperature extremes, and tropical cyclone activity already impact cities and these will be exacerbated by climate change. Flooding recently cost Bangkok’s economy US$39 billion and five million people there could be at risk of flooding by 2070.
The growth of cities puts additional pressure on resources and environmental assets such as forests, water, and air that support the needs of their inhabitants. People living in cities are particularly at risk from changes in the price of and disruption in the flow of resources such as energy, water, and food. Around 44 million people – many located in urban areas – were pushed into poverty by food price increases in 2010, and risks to food security are likely to intensify with population pressures, water scarcity, and climate change.
Given that 95 per cent of this urban expansion is projected to take place in the developing world, it is cities in developing countries which will be at the front line of managing this challenge. Over the next 20 years, the urban populations of South Asia and Sub-Saharan Africa are expected to double to over 3.5 billion people.
Cities in the developing world are particularly vulnerable to environmental risks. Our estimates suggest that just in India alone, nearly 70 million people still live in multi-dimensional poverty within the 59 cities with populations in excess of 750,000. This leaves a significant number of people highly vulnerable to the stresses and shocks associated with climate hazards, resource scarcities, and degradation of ecosystems such as forests. These risks will ultimately damage the future economic growth potential of cities and impact on their ability to reduce urban poverty.
Future proofing is about utilising and developing the capabilities of cities to respond to the risks associated with climate change, resource scarcities, and damage to ecosystems in a way that catalyses inclusive urban development.
The central message of this report is that the earlier cities in developing countries take steps to future proof their urban development, the better. There is an important – but closing – window of opportunity for many cities to act now before they are locked into unsustainable and unsuitable development pathways.
Moreover, a strategy based on ‘grow first, tackle environmental risks later’ is unlikely to be effective given the risks to economic growth and the urban poor from depletion of natural resources, climate change, and global population pressures. We are already witnessing the brake that environmental constraints are having on growth with environmental degradation costing countries as diverse as Pakistan, Nigeria, and Ghana up to 10 per cent of their GDP, and the costs of congestion alone in cities such as Dakar (Senegal) already in excess of three per cent of GDP.
The good news is that city level policies developed to respond to environmental risks can generate wider economic and social benefits as well as environmental ones. Many cities have a degree of autonomy which allows city policymakers to act more nimbly than national policymakers in delivering integrated responses to environmental risks. They can also work closely with regional and national policymakers to create the right policy frameworks for action.
Cities in developing countries are also in a unique position to act to future proof their development. Cities are natural magnets for driving the sort of innovations required to respond to environmental challenges derived from a concentration of people and economic activity which generates a fertile environment for new ideas, technologies, and processes.

x | Future Proofing Cities
Atkins in partnership with
Climate change projected to have significant impacts on energy, w
ater, transport, and health systems as well as buildings
Citie
s are
susce
ptible to social unrest from shortages and price spikes of key commodities
An ‘urban
divid
e’ h
as e
mer
ged
in m
any
citi
es in
the
dev
elop
ing
wor
ld
Ecological footprint of major cities such as Lagos, Bangkok, and Guayaquil already g
reatly
exce
eds t
heir
terr
itory
Rapid increase in share of global carbon emissions from cities in the G
lobal South
Sust
aine
d hi
gh e
nerg
y pr
ices
will
hav
e pr
ofou
nd
implica
tions fo
r cities; real oil prices are forecasted to nearly double over the next decade
High dependence on food produced outside o
f citi
es m
ake
them
vul
nera
ble
to d
roug
hts,
flood
ing,
and
oth
er e
xtre
me wea
ther events
Climate change w
ill alter the range, lifecycle, and rate of transmission of infectious diseases in cities, including M
alaria
5 millionNumber of people in Bangkok that could be at risk of flooding by 2070.
$418 millionCost per year of replacing the ecosystem services (e.g. water provision, flood prevention) provided by Durban’s network of green open space, 38% of the city’s total budget.
$39 billionEconomic loss from recent flooding in Bangkok through damage of more than a million buildings and impacts on commerce and industry.
44 millionNumber of people pushed into poverty by increases in food prices in the second half of 2010, many located in urban areas.
17%Estimated area of Mombasa that could be lost from a 0.3m sea level rise causing the loss of hotels, cultural monuments, and beaches that draw tourists.
20%Percentage of repairs due to climate change to the Konkan railway network in western India that facilitates trade and energy services between Mumbai and Mangalore.
PERFECT STORM OF RISKS
FACING CITIES
$39 billionEconomic loss from recent flooding in Bangkok through damage of more than a million buildings and impacts on commerce and industry.
44 millionNumber of people pushed into poverty by increases in food prices in the second half of 2010, many located in urban areas.
20%Percentage of repairs due to climate change to the Konkan railway network in western India that facilitates trade and energy services between Mumbai and Mangalore.
85%Percentage of Dhaka submerged by recent flooding. 1.9 million
Number of people affected by recent flooding in Manila.
85%Percentage of Dhaka submerged by recent flooding.

Future Proofing Cities | xi
Atkins in partnership with
This report is aimed at any organisation or individual with a role in helping shape the cities of the future:
� National and regional government and development agencies need to understand the environmental risks to growth and poverty reduction in cities to target investment and support at those urban areas in greatest need.
� Likewise, national and multinational companies may need to pay further attention to the risks to their investments in cities. This is to better protect and enhance core urban infrastructure assets such as water, energy, and transport systems and to identify new markets for investment.
� Those living and working in cities need to be able to identify the risks facing them and develop solutions which can respond effectively to those risks over the long term.
this report
Atkins and UCL’s Development Planning Unit in partnership with the UK’s Department for International Development (DFID), have built on our collective work on urban areas and the environment to explore how cities in the developing world might better assess – in a holistic way – the environmental risks relevant to them and the combinations of policies likely to be most effective in promoting inclusive urban development.
This report outlines a five stage future proofing approach to help cities develop programmes of investment which meet their multiple objectives and utilise and build on the institutional capacities they have available.
The foundation for the work has been an integrated assessment of the risks, vulnerabilities, and capacities of 129 cities across 20 countries spanning Asia and Africa, and the development of five urban typologies to group these cities based on the most significant environmental risks they face. This covers cities from across DFID’s extensive country footprint with: (i) populations in excess of 750,000 people to allow for collection of available population data from relevant international agencies; and (ii) availability of other comparable data.
This work is intended as a pilot, but to our knowledge it is the first time that typologies have been developed for a significant sample of cities in developing countries, while adopting a holistic approach. These typologies are used to help point the way towards the universe of policy solutions likely to be applicable to different types of cities.
The work was developed to begin to address a number of gaps in our knowledge which are making it more difficult for cities in the developing world to act on the environmental risks relevant to them and to target finance at the interventions likely to have the greatest impact. In particular, there are few integrated assessments of the environmental risks and solutions relevant to cities (especially in the world’s poorest countries). The majority of studies focus on measures to address one or two risks such as carbon emissions or flood risks, and provide insufficient attention to issues such as potential resource scarcities in energy, water, and food, and the need to safeguard natural habitats and biodiversity. The overwhelming focus tends to be on risks rather than giving equal attention to identifying opportunities and solutions.
Most policy guidance is also inadequately tailored to the specific challenges facing cities with different characteristics. The guidance that exists typically provides policies to, for example, green a city, without considering their relevance to different cities based on the risks they face and their vulnerability and capacity to respond to risks. Additional attention is also needed to identify which solutions can generate social and economic benefits, alongside environmental ones; this is crucial if cities are to build support among communities and city stakeholders for sustained programmes of action.
A list of over 100 policy options for future proofing are therefore presented. This identifies which policies are likely to be most relevant to different city types. It also identifies how these policies might be integrated, the extent to which they deliver wider social and economic benefits, and how challenging they are to implement given their governance, planning, finance, and delivery requirements. The analysis shows there are a significant number of policies which can balance environmental, social, and economic objectives and can be implemented by most cities. These policies can form the heart of any urban development strategy.
As part of this process, Atkins developed an urban risk database. This allows us to better understand the multiple and interconnected risks facing cities from climate hazards, resource scarcities, and damage to ecosystems. This is combined with metrics capturing the vulnerability of cities to risks and their capacity to respond to risks. It also provides an overview of urban scale and dynamics in terms of city size and ecological impacts, climate and physical geography, and urban form.

xii | Future Proofing Cities
Atkins in partnership with
the interconnected risks facing cities: five urban typologies
Cities in developing countries face significant risks from climate hazards, resource scarcities, and damage to vital ecosystems. These risks cannot be looked at in isolation: they are multiple, interlinked, and they are growing. The risks relevant to cities also operate at different levels from the global to the regional and local levels.
We have identified five types of cities based on the most significant environmental risks they face:
1. Energy intensive cities with significant carbon footprints
2. Cities with major climate hazards
3. Cities with risks to regional support systems (such as water and food systems, and risks to natural habitat)
4. Cities facing multiple risks
5. Cities with a low current risk profile.
Urban types can be a useful way to identify and compare groups of cities with common risk characteristics spanning different geographies. This can facilitate the identification of solutions likely to be applicable to different types of cities. The analysis can also help to pinpoint groups of cities that face the most significant environmental risks and where these risks may intensify over time.
Our analysis found that the most significant group of cities are those that drive or are impacted by multiple environmental risks. This group faces risks across multiple risk categories. These cities are characterised by high energy use and carbon footprints, risks from climate hazards such as flooding and cyclones, and risks to regional support systems such as water, food, and natural ecosystems. This group spans some of the world’s largest cities such as Bangkok, Jakarta, Delhi, and Mumbai, to smaller cities such as Guwahati and Bareilly in India. These cities are likely to require action to address risks across a broad front.
For cities with a risk profile focused around one cluster of risks – such as climate hazards or high energy use and carbon emissions – their priority will be to take focused action to tackle those risks. Bangalore, for example, has a high energy and carbon footprint driven by new high rise glass façade developments. Karachi faces significant risks to its water and food systems due to drought and the limited availability of agricultural land in its catchments. And Maputo faces significant risks from flooding due to its geographical location and other factors.
Few cities have a low risk profile. These are often cities that are currently small, but with significant growth prospects. These cities have a window of opportunity to pursue a development path that supports planned expansion but in a way that minimises the environmental risks to long term prosperity and poverty reduction.
From risk to opportunity: matching policy solutions to different urban types
The report defines policies which can be combined into a portfolio to address the challenges facing different types of cities. A broad set of over 100 policies are outlined to demonstrate the range of solutions that can be used for future proofing.
Cities can make the greatest gains by focusing effort on solutions which address their challenges:
1. energy intensive cities with significant carbon footprints. Particular attention is needed by these cities on policies in the transport, energy, and building sectors to promote the move to a lower carbon, less energy intensive future to save both cost and carbon. For many cities, carbon emissions from transport can account for a significant percentage of carbon emissions and energy use. A greater focus is often needed by these cities on strategic planning to manage their growth and the effective planning of mass transit options such as Bus Rapid Transit and demand management schemes, and many cities could do more to consider the potential for renewable energy generation within their boundaries, and delivering lower carbon buildings.
CARb
ON EMISSIONS ANd ENERGy USE
ClIM
ATE R
ISKS RESOURCE ANd
ECOSySTEM
RISKS
The environmental risks relevant to cities

Future Proofing Cities | xiii
Atkins in partnership with
2. Cities with major climate hazards. As well as specific hard infrastructure investments to manage risks such as flooding, attention is needed by these cities to manage climate risks at the strategic level. For example, greater attention to diversifying the urban economy away from climate sensitive sectors, effective management of land in climate vulnerable areas, and public health measures and hazard planning in the event of climate related disasters. Attention should also be given to greening policies and green infrastructure programmes which can be used to tackle climate risks as well as other risks such as carbon emissions.
3. Cities with risks to regional support systems. These cities can draw on a wide range of solutions for future proofing as almost all measures which tackle carbon emissions and climate hazards can also respond to resource and ecosystem risks. These include policies as diverse as urban agriculture and building simple latrines. Particular attention should be paid to managing environmental risks in the wider regional catchment of these cities and peri-urban areas, including risks to water and food security, and to biodiverse natural habitats.
4. Cities facing multiple risks. Taking action across multiple sectors, harmonising policy responses, as well as striking the balance between long term measures and those focused on immediate disaster risk reduction will be particularly important for these cities, but will be challenging. Cities in this type can look to places such as Bangkok which has experienced the governance, planning, finance, and delivery challenges involved in addressing multiple risks through solutions such as the use of public-private partnerships to promote shifts in behaviours.
5. Cities with a low current risk profile. These cities have an opportunity to do things differently by avoiding locking themselves into long lived, poorly adapted development pathways.
Some of the risks cities face, such as climate change, are highly uncertain. This requires cities to use a range of plausible scenarios to assess the uncertainties they face. They can also identify ‘low regrets’ measures which make sense to do anyway because they deliver wider environmental, economic, and social benefits, and focus on measures which have design flexibility or are not irreversible (e.g. flood defence systems which are portable, flexible, or can be extended as more information on flood risks become available).
Maximising benefits and building momentum for action
identifying responses with multiple environmental benefits To maximise the benefit of opportunities for future proofing, cities should look to focus on policies which can respond to multiple environmental risks. Our analysis of policy options shows that a wide range of policies can respond to multiple environmental risks by: (1) reducing carbon emissions and energy use; (2) responding to climate hazards, and (3) helping protect or manage water and food systems and natural habitats. These can be thought of as ‘triple-win’ or ‘win-win’ policies in addressing environmental risks. These policies could form part of a core package of policies for all urban types, and can be especially useful for city types facing multiple risks. These can also support cities to address uncertain future risks or secondary risks which might be of less immediate relevance.
The analysis shows that many of these policies are an extension of sound integrated urban planning and infrastructure investment. This includes policies such as mixed use zoning, use of greenbelts, developing mass transit, pedestrian and bike orientated development plans, and prudent land management. This provides an opportunity for cities to build on existing initiatives and good practice in urban planning and combine these with more specific ‘triple-win’ and ‘win-win’ policies such as urban greening and tree planting programmes which are often overlooked.
The built environment – especially new development – represents a particularly significant entry point to deliver ‘triple-win’ benefits, as are policies to improve efficiency of water and waste. Cities such as Bangalore are starting to show how to unlock opportunities in the built environment by combining measures which incorporate rainwater harvesting and grey water reuse, recycling, pollution control, and solar power systems to generate ‘triple-win’ and ‘win-win’ benefits. These examples can be instructive for other cities facing similar risks. Other policy solutions in the built environment such as the implementation of solar orientated neighbourhoods and designing slum upgrade programmes to minimise resource use are less widespread and there is significant scope for wider uptake of these approaches in cities which are rapidly growing.
identifying vulnerability to risk It is also important that cities look to identify solutions which can address their specific vulnerabilities to environmental risk. Although various groups of cities face common environmental risks, they usually differ markedly in their vulnerability to those risks based on their levels of poverty and inequality, strength of basic services, and urban form.

xiv | Future Proofing Cities
Atkins in partnership with
Our analysis shows that within urban types, the vulnerability of the cities assessed as part of this report to risks varies markedly. In cities facing significant climate hazards (Type 2), for example, cities with a high proportion of people living in poverty and in informal settlements are expected to be hit first and hardest by climate hazards; their residents do not have the assets to protect themselves against the stresses and shocks associated with large scale flooding or cyclones, and poor residents tend to be located in the most vulnerable areas and in poor quality housing. Similarly, in energy and carbon intensive (Type 1) cities with high levels of vulnerability, rising energy prices will have a significant impact on livelihoods of the urban poor who already spend a significant proportion of their income on energy for heating and lighting and in many countries, national policies subsidising energy are unlikely to be sustainable in the medium to long term.
Despite the economic rise of India, our findings demonstrate that several cities such as Jaipur and Patna continue to remain particularly vulnerable to environmental risks, as do many cities across the Democratic Republic of Congo, Nigeria, Sudan, and Malawi such as Kinshasa, Kano, and Khartoum. These cities tend to have high proportions of people living in multi-dimensional poverty and informal settlements with poor access to energy, water, and sanitation, and are likely to be impacted greatest by environmental risks such as flooding, cyclones or rises in the price of energy. Across 59 cities assessed in India, over 48 per cent of the population on average live in multi-dimensional poverty. With a 36 per cent projected increase in population in these Indian cities by 2025, this is likely to increase the proportion of people vulnerable to environmental risks.
In contrast, our analysis shows that cities across countries such as Indonesia, Vietnam, and Ghana such as Jakarta, Ha Noi, and Accra tend to have lower relative levels of aggregate vulnerability to environmental risks. The average proportion of people living in multi-dimensional poverty in the cities of these countries, for example, is only 17 per cent, compared to the 41 per cent across the 129 cities featured in this report. With both lower rates of vulnerability and generally slower projected growth rates it is likely that the impacts of environmental risks could be more easily managed. Cities with the highest numbers of vulnerable people continue to remain in the largest cities in South Asia such as Kolkata, Mumbai, Karachi, and Dhaka. In these four cities alone, over 32 million people live in multi-dimensional poverty which highlights the scale of the challenge.
the capacity of cities to respond to risksIn addition to responding to vulnerabilities, cities should look to solutions which can be realistically implemented with the capacities they have available. These provide an opportunity to help cities build capacity over time by boosting economic development, unlocking resources for investment, and create a focus for capacity building efforts. As with vulnerability, the capacity of cities within urban types varies considerably. The capacity of cities to respond to environmental risks is shaped by a range of ‘urban enablers’ including the strength of their urban economies and their governance, planning, finance, and delivery systems.
Strong and effective planning systems, for instance, will be critical to the success of cities in responding to current and future challenges given their central role in shaping urban development. Unfortunately, many cities exhibit systemic weaknesses in their integrated and participatory planning capacities. Karachi’s planning system, for example, has often been singled out as contributing towards uncontrolled urban sprawl, haphazard development, uneven infrastructure provision, and a polluted urban environment, with little room for citizen engagement.
To respond to environmental risks will require cities to work closely with national and regional government to strengthen their urban governance, planning, finance, and delivery capabilities.
reducing vulnerability, boosting development, and building capacity By assessing vulnerability and capacity to act together this can help cities design an appropriate response to the specific challenges they face. For cities such as Maputo with high numbers or people living in multi-dimensional poverty and low levels of capacity, for example, the focus may naturally be on policies which benefit the urban poor, boost basic service delivery and economic growth, and are cheap, simple, and cost effective. Other cities with lower levels of vulnerability and greater capacities to respond to risks may be able to focus on more complex, costly, and capital intensive solutions. Some cities in India and other South Asian countries, for instance, are expected to almost triple their per capita income by 2025, with growth rapidly outstripping population pressures; this is likely to give them greater headroom to respond to environmental risks and infrastructure gaps than cities with weaker growth prospects which may require additional finance to help them plug financing gaps.

Future Proofing Cities | xv
Atkins in partnership with
There are numerous future proofing policies with significant potential to directly reduce urban poverty and boost short to medium term economic growth. For example, Bus Rapid Transit and improvements to walking and cycling infrastructure provides affordable transport to those on more limited incomes and boosts capital spending, creates jobs, and reduces the cost and efficiency of transport. These policies can help all cities – but especially those with high vulnerabilities and weak urban economies – to build momentum behind future proofing programmes of investment.
There are also a range of future proofing policies that are relatively easy to implement. These include policy solutions such as urban agriculture, micro-generation, improvements to public transport information, and introduction of enhanced bus services. These policies are relatively affordable, do not have substantial governance or planning requirements, and are relatively straightforward to deliver.
The range of measures which are relatively easy to implement is good news for capacity constrained cities. However, capacity constraints should not prevent cities from being ambitious and focusing on more challenging interventions; capacity can be built through the process of policy implementation itself, providing a focus for capacity building efforts.
An agenda for action: recommendations and conclusions
Future proofing should not be seen as an end state, but as a continuous process of better understanding the risks facing cities, the vulnerability and capacity of cities to respond to those risks, and the solutions which will derive economically, socially, and environmentally desirable outcomes.
This report calls for leadership by city stakeholders, regional and national government, international funding agencies, philanthropics, academia, and private sector companies to plan for the long term by acting now to support cities to future proof their development. This will require skills to be leveraged from across the infrastructure, engineering, environment, planning, design, economics, and social science professions to help cities develop solutions at the nexus between urban planning, transport, water, energy, waste, agriculture, ecosystems, and design and architecture.
A significant number of cities in the developing world have already embarked on projects and initiatives aligned with a future proofing approach. Bangalore (India) is introducing a new metro system which has the potential to reduce its energy use and carbon emissions as well as improve mobility, and Karachi (Pakistan) is taking a wide range of steps to reduce its risks to water and food scarcities through measures such as groundwater conservation.
Nevertheless there is still a significant way to go for many cities as the collection of initiatives and projects often miss the impact and potential offered by a more integrated programme and approach to future proofing.
This report has seven overarching recommendations to build on the findings of this report. These are complemented by the more specific findings and recommendations interlaced throughout the report’s main chapters.
1. Developing future proofed urban strategies More needs to be done to support cities to develop future proofed urban strategies i.e. strategies which look to address in an integrated way environmental, social, and economic objectives. Building on sound diagnostic work, more cities should be supported and encouraged to develop integrated strategies and programmes of investment which are future proofed.
A good starting point would be to focus initially on opportunities which generate multiple environmental, social, and economic benefits which tend to be an extension of sound integrated urban planning and infrastructure investment.
Greater use of the future proofing approach outlined in this report could help cities to develop policy portfolios which maximise environmental, social, and economic benefits and which can be implemented given institutional capacities.
2. unlocking and aligning finance – including climate finance – for future proofing There is a need to scale up and make finance more easily available to cities, including small and medium sized cities. This needs to be combined with efforts to overcome the market and governance failures which often deter investment in future proofing through the use of financial and non-financial instruments such as feed-in-tariffs to encourage investment into renewable energy generation.

xvi | Future Proofing Cities
Atkins in partnership with
Many cities in the developing world do not have the financial resources to respond to the challenges they face. Karachi, for example, had a 200 per cent gap between revenue and expenditure in 2006. Many cities are therefore dependent on transfers from national government and many cities do not have projects and programmes which meet private sector investment criteria.
International climate finance could play a particularly important catalytic role in helping cities to unlock and implement integrated urban programmes to, for instance, reduce carbon emissions. This could be combined with new funding mechanisms such as dedicated city-focused infrastructure or urban development funds and municipal bonds to raise finance for bankable investment projects. For example, international financing for forest protection (REDD+) could support cities already located in the heart of rainforest basins to develop in a way which prevents the destruction of their forest assets.
Some action is already taking place. The World Bank has committed to making finance – including international climate finance – more easily available to cities. The Asian Development Bank has recently called for a greater focus on the integrated planning and financing of targeted interventions in specific urban regions. In addition, other funding agencies such as the Clinton and Rockefeller Foundations as well as bilateral donor agencies are scaling up their support to cities in the developing world to address environmental risks. These efforts should be welcomed and be given additional focus and attention, with a focus on ensuring finance provided to cities is long term, multi-sector, and aligned with city-owned future proofed strategies.
International development agencies should also consider reviewing the criteria they use in commissioning urban infrastructure to ensure investments are future proofed.
3. undertaking urban risk diagnosticsTo help plan for the future, cities need to undertake detailed diagnostics of the environmental risks they face. These diagnostics need to include an assessment of vulnerability to risks, capacity to act, as well as an analysis of scale, projected pace of change, and physical geography.
More support is likely to be required to help cities undertake integrated urban risk diagnostics which can be used to mobilise city stakeholders to develop programmes for future proofing. This should build on existing tools and approaches which are being piloted in many cities across the developing world supported by international funding agencies.
4. strengthening the capacity of urban governance, planning, and delivery systems Many cities need support to strengthen their capacity to respond to these environmental risks. This project has highlighted the importance of strong governance, planning, and delivery systems in shaping the ability of cities to respond to risks. However, many cities have systemic institutional challenges in these areas, particularly surrounding their ability to mobilise and engage with local communities to inform decision making and the development of solutions.
Whilst progress is being made to reform governance, planning, and delivery systems in some cities more attention should be given to these issues in the context of escalating environmental risks. This may require cities to explore different governance, planning, and delivery models, such as the use of people-public-private partnerships to overcome constraints in government capacity. The good news is that capacity can be built through the process of developing and implementing future proofing strategies.
5. improving the data and evidence underpinning city decision making High quality data is needed to support accurate assessments of environmental risks. Unfortunately, there is a general lack of comparable data on cities, particularly in developing countries, which impacts all stakeholders from municipal authorities to development agencies.
Greater investment is needed by the international agencies to gather data on the risks facing cities, including at a spatially disaggregated level. This should build on existing efforts by the United Nations, World Bank, and other global institutions. Particular attention should be given to gathering data for small and medium sized cities. This data collection effort should be complemented by the development of growth projections which take full account of the impact that environmental risks, including binding resource constraints, may have on future growth.
For cities, greater efforts to track their performance in managing risks such as congestion and air pollution can help them to position themselves as more attractive places to do business.

Future Proofing Cities | xvii
Atkins in partnership with
6. Additional research and improved guidance In addition to improved data and evidence, additional research and guidance is needed to improve global knowledge of the range of environmental risks relevant to cities in developing countries and what can be done about them. For example, there is little information available on what environmental assets exist and what condition they are in at an urban level. Existing research efforts looking at the environmental challenges facing cities in the developing world should therefore be given renewed vigour and attention.
There is also a need for improved guidance to cities on how they can navigate the complex myriad of information on identifying and managing complex environmental risks. For instance, there is currently limited accessible guidance to help cities identify appropriate indicators of risk, and how to distinguish between the supply and demand of environmental assets, the production and consumption activities impacting environmental risks, ecosystem processes and final ecosystem goods and services, and environmental stocks and flows.
7. identifying risks to existing and planned investment portfolios Owners and managers of assets in cities need to pay attention to the risks to their investment portfolios and operations. The risks facing some of the world’s fastest growing cities identified in this report could have potentially profound implications for the management and maintenance of core urban infrastructure assets such as water and energy systems, food systems in urban catchments, and transport infrastructure.
Responding to these risks may require steps by asset owners to review existing and planned investment portfolios in light of these risks, embedding different risk metrics in traditional approaches to measuring risk, and investing to future proof infrastructure in cities.
This report has shown that cities in the developing world urgently need to take steps to future proof their development by tackling the environmental risks to their long term prosperity. There is an important – but closing – window of opportunity for cities to take action. This report has shown that cities can take steps to future proof themselves. Not only can they act, but acting will support the creation of cities of the future which are more environmentally, socially, and economically prosperous.

xviii | Future Proofing Cities
Atkins in partnership with
Introduction to report
These knowledge gaps are making it more difficult for cities in the developing world to act on the environmental risks relevant to them and to target finance at the interventions likely to have the greatest impact.
This project was designed to help respond to these gaps by exploring how cities in the developing world might: (i) better holistically assess the environmental risks relevant to them; and (ii) identify the combinations of policies likely to be most effective in responding to risks whilst promoting inclusive urban development i.e. development which provides services and opportunities for all, as well as driving economic growth now and into the future.
This project was intended as a pilot to explore the complex set of issues surrounding environmental risks and future urban growth in the developing world. The work is only a starting point. It raises many questions and makes a number of recommendations for future research and action.
What’s in the report?
The foundation for this report is an integrated assessment of the risks, vulnerabilities, and capacities of 129 cities across 20 countries spanning Asia and Africa, and the development of five urban typologies to group these cities based on the most significant environmental risks they face.
This is combined with a new integrated framework for identifying policy solutions likely to be applicable to different types of cities which can also generate wider social and economic benefits. The report concludes with a summary of its findings and recommendations for future action.
To our knowledge this is the first time that typologies have been developed for a significant sample of cities in developing countries, while adopting a holistic approach. These are used to help point the way towards the universe of integrated solutions likely to be applicable to different types of cities. A list of over 100 policy options are presented with an overview of which are likely to be most relevant to different city types and how these policies might be integrated.
This report is the result of a nine month research partnership between Atkins and the Development Planning Unit (DPU) at University College London (UCL) in close collaboration with the UK Department for International Development (DFID). Our combined aspiration is to improve knowledge of the environmental risks and solutions relevant to cities in developing countries, and to better identify the opportunities to support sustainable urban development in the face of environmental challenges such as climate change.
Why is this work important?
This work was initiated following a review of the existing global evidence and literature which suggested a number of important knowledge gaps. Four areas stood out in particular:
1. Few comprehensive assessments of environmental risks and integrated solutions relevant to cities: most studies focus on measures to address one or two risks such as carbon emissions or flood risks and provide insufficient attention to issues such as potential resource scarcities in energy, water, and food, and the need to safeguard natural habitats and biodiversity.
2. Poor coverage of the issues facing cities in developing countries: even the most comprehensive global studies and urban indexes only cover a small proportion of cities in the developing world, with a focus on the largest cities.
3. A ‘one size fits all’ approach to policy guidance. There is a need to tailor guidance to the specific challenges facing cities with different characteristics. Existing best practice guidance typically provides long lists of policies to, for example, green a city, without considering the appropriateness of policies to different cities based on their vulnerability and capacity to respond to risks.
4. Inadequate attention to identifying policy solutions which can generate social and economic benefits, alongside environmental ones: this is crucial to ensure successful implementation and build momentum for action.

Future Proofing Cities | xix
Atkins in partnership with
Who is it for?
The report is intended for organisations or individuals with a role in helping to shape the cities of the future:
� National and regional level decision-makers and development agencies looking at portfolios of cities in developing countries.
� National and multinational companies working in, or investing in cities in developing countries.
� City authorities, urban planners and community groups working in these regions.
� Academic institutions and think-tanks.
The report covers the following:
� An overview of the future proofing cities approach.
� The interconnected risks facing cities and the development of urban types.
� The vulnerability and capacity of cities to respond to risks.
� Solutions to urban future proofing.
� Main findings and recommended next steps.

xx | Future Proofing Cities
Atkins in partnership with

Future Proofing Cities | xxi
Atkins in partnership with
Why Future ProoF Cities?
01

xxii | Future Proofing Cities
Atkins in partnership with

Future Proofing Cities | 01
Atkins in partnership with
developing world are changing provides an important window of opportunity for cities to grow in ways which minimise the future economic impact associated with different environmental risks.
The interconnected risks facing cities requires an integrated approach to developing solutions to maximise environmental, social, and economic benefits.
Future proofing is about cities looking in an integrated way at the risks they face and developing solutions which can catalyse inclusive urban development, maximise value for money, and provide a foundation for broader urban transformation.
The focus of future proofing is on cities finding and shaping their own vision of the future by providing them with the tools and approaches to identify solutions which respond to their unique set of risks, vulnerabilities, and capacities. Empowering cities to overcome challenges in relation to urban governance, planning, finance, and delivery systems is of particular importance.
At its heart, future proofing cities is about developing a proactive approach to managing the long term risks to the economic and social health of cities associated with complex environmental change.
Future proofing should not be seen as an end state, but as a continuous process of better understanding the risks facing cities, the vulnerability and capacity of cities to respond to those risks, and the solutions which will derive economically, socially, and environmentally desirable outcomes.
What do we mean by Future Proofing Cities?
6.1bn (2050)
3.5bn (2012)
5.6bn (2030)
half of the world’spopulation – 3.5billion people – nowlive in cities and thiswill reach 60% by 2030, and 75% by 2050
half of the world’spopulation – 3.5billion people – nowlive in cities and thiswill reach 60% by 2030, and 75% by 2050
Globally we face the enormous challenge of reconciling the urgent need for rapid growth and poverty alleviation in many parts of the world with the need to avoid irreversible and costly environmental damage.
We already live in an urban world with over half’s the population living in cities. This is expected to reach 75 per cent by 2050. With 95 per cent of the urban expansion projected to take place in the developing world, cities in developing countries will be at the front line of managing this challenge.
Cities face significant risks from climate change, resource scarcities, and damage to vital ecosystems. These risks cannot be looked at in isolation; they are multiple, interlinked, and they are growing.
People living in cities in the developing world are particularly vulnerable to these risks due to the number of people living in poverty and without access to basic services, many in informal settlements.
These risks will ultimately damage the future growth of cities, impact on their ability to reduce urban poverty, and could even reverse projected future urbanisation dynamics.
The earlier cities take action the better. A strategy based on ‘grow first, tackle environmental risks later’ is unlikely to be effective for cities in the developing world given the risks to growth from depletion of natural resources, climate change, and global population pressures.
Much of the urban infrastructure in the developing world is also yet to be built. The scale and pace at which cities in the
Future proofing cities is about utilising and developing the capabilities of cities to respond to the risks associated with climate change, resource scarcities, and damage to ecosystems in a way that catalyses inclusive urban development.
PeoPLe LiVing in Cities

02 | Future Proofing Cities
Atkins in partnership with
In particular, the risks from climate change, resource scarcities, and damage to fragile ecosystems continue to grow. Carbon dioxide emissions are accumulating in the atmosphere approaching a level that will make it impossible to maintain the global mean temperature increase within two degrees of the preindustrial average. The era of cheap low cost fossil fuel energy may be coming to an end, potentially severing a major historic driving force for growth.4 And we know that a significant percentage of the world’s ecosystems are already degraded or used unsustainably.5
In short, we are finding that the economy, people, and environmental resources are not separate but are inextricably linked and mutually dependent.
the growth and environmental challenge
Economic growth has brought prosperity to millions of people. Over the past 20 years alone growth has lifted more than 660 million people out of poverty and has raised the income levels of millions more.1
But despite the gains, growth has not been inclusive enough i.e. it has not translated into providing services and opportunities for all. There are 1.3 billion people who still do not have access to electricity, 2.6 billion people who have no access to sanitation, and 900 million who lack safe, clean drinking water.2
And this growth is at risk. There is an increasing recognition that growth-as-usual is unsustainable i.e. it will undermine future economic growth due to the pressure it places on critical natural resources and ecosystems. As the World Bank has recently found, the failure to account for the true costs of resource depletion is “now threatening the long term sustainability of growth and progress made on social welfare.”3
of the world’s population already live in areas with
high threat to water security
of food production is highly dependent
on oil
of the world’s ecosystems are already either
degraded or used unsustainably
of the world’s remaining natural areas could be lost
by 2050
“economic growthover the past two centuries has brought remarkable progress but also remarkable risk. humanity has inadvertently pushed against the planet’s safe boundaries regarding greenhouse gas emissions, land use changes, pollution, and human-induced threats to biodiversity and public health. Cities will be at the center of this unique and unprecedented challenge.”
Prof. Jeffrey D. sachs, Director, the earth institute and special Advisor to un secretary general ban ki-Moon on the Millennium Development goals, 2011
“economic growthover the past two centuries has brought remarkable progress but also remarkable risk. humanity has inadvertently pushed against the planet’s safe boundaries regarding greenhouse gas emissions, land use changes, pollution, and human-induced threats to biodiversity and public health. Cities will be at the centre of this unique and unprecedented challenge.”
80%
95%
11%
60%
Source: The Economics of Ecosystems and Biodiversity (TEEB) (2010), ‘Prevailing patterns of threat to human water security and biodiversity,’ Nature (2010), Millennium Ecosystem Assessment (2005), Chris Skrebowski, ‘Joining the Dots,’ Energy Institute Conference (2004)

1 World Bank – From Growth to inclusive Green Growth: The economics of sustainable development (2012)
2 Ibid3 World Bank (2012), pg xi4 McKinsey (2011), IIER (2011) 5 Millennium Ecosystem Assessment (2005)6 UN World Urbanisation Prospects7 Ibid
Future Proofing Cities | 03
Atkins in partnership with
the urban challenge
At the nexus of this global challenge is the city. The population living in urban areas is expected to grow from 3.6 billion in 2011 to 6.3 billion by 2050. By mid-century the world’s urban population is likely to be the same size as the world’s total population was in 2002.6
But it is cities in the developing world which will face the steepest challenge. Over the next 20 years, the urban population of South Asia and Sub-Saharan Africa is expected to double. By 2030, all developing regions will have more people living in urban than rural areas.
This growth will not only be confined to ‘megacities’ such as Dhaka (Bangladesh), Lagos (Nigeria), and Kinshasa (DRC): small to medium sized cities with populations of up to five million people will account for a large proportion of urbanisation.7
Given the tendency of cities to lock themselves early on into a specific urban form, the sooner cities invest in urban infrastructure which can respond to environmental risks, the greater the window of opportunity to transform urban development paths.
Asia’s urban population by 20503.3 billion
Africa’s urban population by 20501.3 billion
0.4bn
0.8bn
1.9bn
0.7bn
0.9bn
2.7bn
1.3bn
1bn
3.3bn
Africa Asia Europe and North America
2011
2030
2030
2030
2050
2050
2050
2011
2011
David satterthwaite, international institute for environment and Development (iieD)
“Population growthis becoming largely anurban phenomenonconcentrated in thedeveloping world”
Source: United Nations World Urbanisation Prospects
“Population growthis becoming largely anurban phenomenonconcentrated in thedeveloping world”

04 | Future Proofing Cities
Atkins in partnership with
Now is the time to act
Compounding these challenges are stronger links emerging between risks. Traditional energy production results in increased carbon emissions and climate change which contributes to water scarcity and extreme climatic events such as flooding and droughts. Changes in rainfall patterns and greater water use will have a significant impact on cities which receive a significant proportion of their energy from hydropower. The deterioration in vital ecosystems along with climate change appears to be increasing the vulnerability of resource supply systems. And the energy intensity of water has been rising due to the lowering of the groundwater table, potentially affecting the price of water services delivered to urban residents.
Vulnerability to risks
Many cities in the developing world are already unable to deliver basic standards of living to their populations despite rapid expansion of economic activity.10 Africa, for instance, has the most unequal cities in the world, whilst income inequalities are widening in Asia. And the number of people living in informal settlements is expected to reach 889 million people by 2020.11 This leaves significant numbers of people highly vulnerable to the stresses and shocks associated with climate change, resource scarcities, and degradation of vital ecosystems.
Cities are also significant hubs of interchange for goods, services, and natural capital, thus creating many interdependencies which need to be maintained and strengthened in the face of systemic and changing stresses and shocks. Whilst urban areas face ever-greater risks, there is the prospect of rapid contagion of risks through increasingly connected urban systems which threatens disastrous impacts if cities do not take action.
environmental risks
The world’s cities occupy just two per cent of the Earth’s land, but account for 60-80 per cent of energy consumption and 75 per cent of carbon emissions.8 The Triumph of the City9 has paradoxically placed over half of the world’s population at risk from climate hazards with climate change predicted to have significant impacts on cities due to increased flooding and drought, temperature extremes and heat waves, and increased incidence of tropical cyclone activity and extreme high seas. Cities also deplete natural ecosystems such as forests, water, and air to provide for the consumption needs of their inhabitants. And cities are particularly at risk from changes in the price of and disruption in the flow of critical natural resources such as energy, water, and food.
Cities are highly vulnerable to a perfect storm of interconnected environmental risks. The sooner they act, the easier it will be to shift development paths and manage the stresses and shocks to their prosperity.
8 United nations- ‘Cities are key to global energy and climate challenges’ (2011)
9 This is a phrase popularised by Edward Glaeser (2011) 10 HPEC, Report on Indian urban infrastructure and services
(2011)11 UN-HABITAT, State of the World’s Cities (2011)
PERFECT STORM OF RISKS
FACING CITIES
Source: United Nations (2011)
Millions of people living in informal settlementsThese people are particularly vulnerable to environmental risks such as flooding or cyclones
“Climate change posesserious threats to urban infrastructure, quality of life, and entire urban systems.”
World bank, 2010 Cities and Climate Change
AsiaSub-Saharan Africa
506m
428m
103m
199m
1990
1990
2010
2010
“Climate change posesserious threats to urban infrastructure, quality of life, and entire urban systems.”

Future Proofing Cities | 05
Atkins in partnership with
Climate change projected to have significant impacts on energy, w
ater, transport, and health systems as well as buildings
Citie
s are
susce
ptible to social unrest from shortages and price spikes of key commodities
An ‘urban
divid
e’ h
as e
mer
ged
in m
any
citi
es in
the
dev
elop
ing
wor
ld
Ecological footprint of major cities such as Lagos, Bangkok, and Guayaquil already g
reatly
exce
eds t
heir
terr
itory
Rapid increase in share of global carbon emissions from cities in the G
lobal South
Sust
aine
d hi
gh e
nerg
y pr
ices
will
hav
e pr
ofou
nd
implica
tions fo
r cities; real oil prices are forecasted to nearly double over the next decade
High dependence on food produced outside o
f citi
es m
ake
them
vul
nera
ble
to d
roug
hts,
flood
ing,
and
oth
er e
xtre
me wea
ther events
Climate change w
ill alter the range, lifecycle, and rate of transmission of infectious diseases in cities, including M
alaria
5 millionNumber of people in Bangkok that could be at risk of flooding by 2070.
$418 millionCost per year of replacing the ecosystem services (e.g. water provision, flood prevention) provided by Durban’s network of green open space, 38 per cent of the city’s total budget.
$39 billionEconomic loss from recent flooding in Bangkok through damage of more than a million buildings and impacts on commerce and industry.
44 millionNumber of people pushed into poverty by increases in food prices in the second half of 2010, many located in urban areas.
17%Estimated area of Mombasa that could be lost from a 0.3 m sea level rise causing the loss of hotels, cultural monuments, and beaches that draw tourists.
20%Percentage of repairs due to climate change to the Konkan railway network in western India that facilitates trade and energy services between Mumbai and Mangalore.
PERFECT STORM OF RISKS
FACING CITIES
$39 billionEconomic loss from recent flooding in Bangkok through damage of more than a million buildings and impacts on commerce and industry.
44 millionNumber of people pushed into poverty by increases in food prices in the second half of 2010, many located in urban areas.
20%Percentage of repairs due to climate change to the Konkan railway network in western India that facilitates trade and energy services between Mumbai and Mangalore.
85%Percentage of Dhaka submerged by recent flooding. 1.9 million
Number of people affected by recent flooding in Manila.
85%Percentage of Dhaka submerged by recent flooding.

Source: Atkins Urban Risk Database
06 | Future Proofing Cities
Atkins in partnership with
Capacity of cities to respond to risks
Many cities in the developing world have limited capacities to respond to environmental risks. Wealthier cities - to some extent - may be able to afford to take a more reactive approach to risks given their greater ability to ‘spend themselves out of trouble.’ Cities in developing countries cannot afford that luxury. London, for example, has a per capita GDP of nearly $70,000 and Singapore over $55,000. This contrasts with just $3,300 for Kampala (Uganda), $6,400 for Khartoum (Sudan), and $8,800 for Delhi (India), with economically weaker cities markedly less able to provide a financial buffer against environmental stresses and shocks. Some cities such as Kampala and Lilongwe (Malawi) are expecting their populations to more than double over the next 15 years, placing additional pressures on the ability of their economies to deliver higher living standards and job opportunities in the face of complex environmental risks.
“For centuries, cities have helped foster some of mankind’s greatest ideas. it is no stretch of the imagination to believe that cities will now take the lead in addressing climate change.”
C40 Cities, Climate Leadership group
The capabilities of residents and institutions are also fundamental to shaping the capacity of cities to respond to environmental risks. In particular, cities face significant challenges in relation to municipal governance, planning, finance, and delivery systems. Frequently, apparently sound city-level plans are not implemented due to weak governance, poor delivery, and the impact of inward migration. Traditional urban governance and planning structures in many low income and emerging countries have generally proven inadequate to respond to environmental challenges in the face of rapid urbanisation. For example, poor planning in Jakarta has resulted in a vast increase in the urbanised area giving rise to large-scale infrastructure and environmental problems. Even progressive and higher capacity cities such as Durban (South Africa) have struggled with coordinating climate change policy effectively, leading to them not fully realising identified emissions reductions.12
Cities in the developing world are growing rapidly and the majority of their urban infrastructure has yet to be built: This provides an important window of opportunity for future proofing
Bangkok - Thailand
Kolkata (Calcutta) - India
GDP in 2010
Delhi - India
Projected GDP in 2025
$194.7 bn$694.7 bn
Projected GDP in 2025
Mumbai (Bombay) - India
GDP in 2010
$200.8 bn$671.1bn
Jakarta - Indonesia
GDP in 2010
Projected GDP in 2025
$193.3bn$524bn
GDP in 2010
Projected GDP in 2025
$177.2bn
$330.6bn
GDP in 2010
Projected GDP in 2025
$311.1bn
$92.3bn
Ho Chi Minh City - Vietnam
Chennai (Madras) - India
Ahmadabad - India
Dhaka - Bangladesh
Bangalore - India
$44.2bn
$146.1bn
GDP in 2010
Projected GDP in 2025
$156.9bn
$49.1bn
GDP in 2010
Projected GDP in 2025
$188.2bn
$50.5bn
GDP in 2010
Projected GDP in 2025
$225.8bn
$82.5bn
GDP in 2010
Projected GDP in 2025
$255.0bn
$69.3bn
GDP in 2010
Projected GDP in 2025
12 UN-HABITAT, Global Report on Human Settlements (2011) 13 Clark, ‘Transport maker and breaker of cities’ (1958)14 World Bank (2010)
“For centuries, cities have helped foster some of mankind’s greatest ideas. it is no stretch of the imagination to believe that cities will now take the lead in addressing climate change.”

Future Proofing Cities | 07
Atkins in partnership with
the opportunity: creating a new development path
Despite these challenges, cities are in a unique position to respond to environmental risks. They are natural units for driving innovation, derived from a concentration of people and economic activity that generates a fertile environment for the innovation in ideas, technologies and processes required to respond to the enormity of the environmental challenge. City authorities also often have a high degree of self governance and closer relationships with their businesses, residents and institutions than state and national governments which allows them to act quickly and more decisively to address environmental challenges.
Much of the urban infrastructure in the developing world is also yet to be built. Cities have a tendency to lock themselves into the form that they grow into. In particular, the transportation system largely defines the final shape of the city. Roads and public transit lines are the bones of a city, with water, wastewater and power services fleshing out the
Traditional urban development paths have typically seen the management of environmental risks as an issue to be tackled later on in the urban transition: There is an opportunity for cities in the developing world to address environmental risks to growth earlier in their transitions
Time
eConoMiC trAnsition
eConoMiC trAnsition
urbAn trAnsition
urbAn trAnsition
Transition path
nation of villages
enVironMentAL trAnsition
enVironMentAL trAnsition
AgriCuLturAL eConoMy
inDustriALisAtion ADVAnCeD inDustry eConoMy
DigitAL eConoMy
industrial City� Urban growth� Zoning
Pollution Management� Addressing local
environmental problems
improved regulations and technical processes
Post industrial city� Sub urbanisation� Comprehensive development plan
eco-city� Re-urbanisation� Globalisation
� Mixed use development
energy and climate change
environmental security and risk management
city.13 Initial development of buildings and energy infrastructure typically occurs around transportation and service nodes. Once this infrastructure is in place, this sets the spatial structure of the city which is then difficult to change, especially given that it often leads to embedded travel behaviors.14
Today’s cities in higher income countries have typically followed a traditional urban development path characterised by tackling environmental risks later on in their development trajectory. This has led to growth in carbon emissions and resource impacts. However, cities in developing countries have an opportunity to do things differently. Given the pace at which cities in developing countries are growing, there is currently an important - but closing - window of opportunity for them to avoid locking themselves into traditional development paths with the associated environmental challenges this brings. Hence, the earlier cities in the developing world start to take action, the better.
Source: Atkins. Note that not all cities following a traditional development trajectory are necessarily undergoing the three transition paths outlined above in such a linear way.
This may also be more feasible than we previously realised. There are an increasing number of cities in earlier stages of urban development which have at least partially squared the circle of managing growth and its broader environmental impacts. Curitiba (Brazil), for example, has been able to absorb a population increase from 361,000 (in 1960) to 1,797,000 (in 2007) on an initially limited budget whilst delivering the lowest rates of urban air pollution in Brazil through integrated urban planning and investing in public transport measures.
There is growing awareness by national governments, Multilateral Development Banks, and bilateral development agencies that urban expansion can be planned more efficiently by taking a more integrated approach to the planning and delivery of urban infrastructure rather than through a sector by sector approach which has often contributed to urban sprawl, traffic congestion, and wider environmental impacts. This is an encouraging start.

08 | Future Proofing Cities
Atkins in partnership with
Future proofing can deliver tangible social and economic benefits in the short and longer term. A recent major study by the World Bank concluded that green policies are not only necessary, but efficient and affordable. The study finds that many green policies pay for themselves in the long run and can create jobs, and others make economic sense once externalities are priced and ecosystem services are valued. Another study finds that $900 million to $1.7 billion of green investments in land, water, and energy could yield economic returns of at least $3 trillion.15
The evidence also suggests that future proofing solutions bring greater economic and social benefits than previously realised. Recent work has shown numerous opportunities to save money by boosting resource productivity in sectors such as building efficiency, reducing food waste, reducing water leakage, urban densification, and transport fuel efficiency.16
Less sprawled cities with lower carbon footprints can also lead to agglomeration economies which help to lower per unit infrastructure and operating costs. Other benefits include reduced congestion which brings significant health benefits from improved air quality. Less sprawled cities also have a lower ecological footprint. A
Why future proof?
recent study of Delhi shows that a low carbon urban trajectory could save over 12,000 lives per annum by 2030.17 The costs of congestion in Dakar, Buenos Aires, and Mexico city are close to or greater than 3 per cent18 of GDP, and even higher in cities such as Cairo.19 In Leeds, UK a city with an economy worth over $70 billion a year – a new study suggests that a $1.5 billion investment in low carbon options would generate $300 million of energy cost savings per annum. This would pay back the initial investment in just over four years, as well as create 1,000 new jobs and wider economic benefits of $75 million a year.20 Studies on climate change adaptation have also identified multiple cost effective adaptation measures which can safeguard most of the value at risk from climate hazards.21
At a national level, we are already seeing the brake that environmental constraints are having on growth. Environmental degradation is already costing countries as diverse as Pakistan, Nigeria, and Ghana up to 10 per cent of GDP.22
There is also a wide range of solutions at the city-level which can respond to several environmental risks simultaneously. Policies to promote urban greening from green belts to open space, for instance, can help to sequester carbon as well reduce climate hazard risks by reducing urban heat island effects. Solar orientated neighbourhoods which can heat and cool buildings without the need for fossil fuels have the potential to simultaneously reduce energy use and carbon emissions, and reduce the impacts of climate change. The potential of these policies to generate multiple environmental benefits, and to amplify economic, social, and broader environmental impacts, are significant but have barely been explored in the literature.
In short, not only are alternative urban pathways feasible, but they are necessary, efficient, and affordable. Source: World Bank (2011)
8.2%
9.1%
9.8%
Nepal
bangladesh
Egypt
Pakistan
Nigeria
Central African Republic
Average
China
Ghana
4%
4.8%
5.2%
6.2%
7.9%
8%
Cost of environmental degradation as % GDP equivalent
Economic costs of environmental damage
Cities should take steps to future proof because it makes environmental, social, and economic sense. Acting can bring significant local benefits as well as contributing to global challenges.
15 McKinsey (2011), ‘Resource Revolution’ 16 Ibid 17 Woodcock et al (2009), ‘Public Health Benefits of Strategies
to Reduce Green-House Gas Emissions,’ The Lancet 18 World Bank (2002)19 World Bank (2010), Cairo Traffic Congestion Study20 Centre for Low Carbon Futures (2011), A Mini-Stern Review
for Leeds 21 See Report of the Economics of Adaptation Working Group
(2009), ‘Shaping Climate-Resilient Development’ 22 World Bank (2012)
the economic costs of traffic congestion in Cairo are already as high as 4% of gDP per annum.
the economic costs of traffic congestion in Cairo are already as high as 4% of gDP per annum.

Future Proofing Cities | 09
Atkins in partnership with
� Cities in the developing world face significant risks to growth and poverty reduction from climate change, resource scarcities, and damage to ecosystems.
� Cities need to look in an integrated way at the risks they face - they are multiple, interlinked, and they are growing.
� The traditional focus on linear infrastructure and reducing urban poverty is no longer enough – environmental risks also need to be managed.
� The earlier cities take action the better: there is an important - but closing - window of opportunity for cities to avoid locking themselves into unsustainable development pathways. Environmental limits act as a break on growth and acting can deliver environmental, social, and economic benefits.
� Cities can act and are in a unique position to act given their role as centres of innovation and ability to respond in a more agile way than national government.
� Future proofing involves cities looking in an integrated way at the risks they face and developing solutions which can generate social and economic benefits, maximise value for money, and provide a foundation for broader urban transformation.
Summary

10 | Future Proofing Cities
Atkins in partnership with

Future Proofing Cities | 11
Atkins in partnership with
the DiFFerentrisks FACing Cities
02

12 | Future Proofing Cities
Atkins in partnership with

Future Proofing Cities | 13
Atkins in partnership with
The scale of projected economic and population growth in these cities also highlights the need to take action now to manage these environmental risks. The collective GDP of these cities is projected to grow from $2.5 trillion to $7.1 trillion by 2025. These cities are also expected to add another 150 million people over the next 15 years alone, potentially exacerbating and accelerating environmental risks.
The 129 cities were selected based on cities from across DFID’s extensive country footprint with: (i) populations in excess of 750,000 people to allow for collection of available population data from relevant international agencies and (ii) availability of other comparable data.
This assessment has enabled us to develop five city typologies based on the most significant risks relevant to different groups of cities. Grouping cities into different types can provide a starting point by which to compare the environmental risks facing groups of cities and to identify the policy responses likely to be most applicable to different urban types.
This chapter provides a detailed integrated look at the environmental risks facing cities in the developing world, the scale of these issues, and potential future impact. By considering the risks together, linked risks can be identified and better understood, helping cities to act in an integrated way to those risks relevant to them.
Every city in the developing world faces a range of environmental risks. We have assessed 129 cities across 20 countries to understand in further detail the environmental risks these cities face.
These cities represent a significant sample of the world’s urban population. The assessment covers over 350 million people in close to 100 million households: together these represent around 5 per cent of the total global population. It includes some of the world’s mega cities such as Delhi, Mumbai, Karachi, Dhaka, and Lagos, as well as numerous small and medium sized cities with populations greater than 750,000.
Collectively these cities drive and are impacted by numerous environmental risks. Together their global carbon impact equates to 527 million metric tonnes (mega tonnes) of carbon dioxide - equivalent to the emissions from 10 New York Cities. These cities are also highly vulnerable to the impacts of climate change with around two thirds of their total built up area at risk of flooding. Moreover, 30 per cent of their wider catchments are at significant risk of drought.
Introduction
NEw yORK CITy
129 cITIES ASSESSED TOTAL cARBON IMPAcT 10 X =
Cities face a wide range of environmental risks that have significant potential to impact their economic and social futures. These include climate hazards such as flooding and cyclones, rising energy and carbon footprints, and risks to water security and natural habitats. It is important to look holistically at the full range of risks so that cities can act in an integrated way to those relevant to them.

14 | Future Proofing Cities
Atkins in partnership with
taking a holistic approach to environmental risk
Cities both contribute to and are impacted by environmental risks. Traditional energy production, for example, results in increased carbon emissions and climate change which contributes to water scarcity and extreme climatic events such as flooding and droughts. Similarly, changes in rainfall patterns and greater water use will have a significant impact on cities which receive a significant proportion of their energy from hydropower. This makes it important to define the environmental risks relevant to cities broadly. The risks relevant to cities also operate on different levels, are interconnected, and can be uncertain. In addition, cities - through their production and consumption activities - have other environmental impacts well outside their boundaries through their exports, supply chains, and movements of urban residents.1
The environmental risks relevant to cities
the different levels at which risks operate
The risks relevant to cities operate on different levels from the global to the local level. This can make tackling certain risks easier to influence at the city scale. For example:
� The impacts of growing carbon emissions, are felt globally, regionally, and locally and the benefits of action to reduce emissions are dispersed in place and time (although many cities are increasingly aware of the role they will need to play in contributing towards reducing global carbon emissions).
� Shocks to short or long term energy supply or prices can have impact at the national, regional, and city level (as seen by the power outages in India on 31 July 2012 affecting 20 of the 28 States and 600 million people).
� Risks to cities from water and food scarcities or damage to other vital habitats such as forests are felt within the urban catchment on a regional basis. The benefits of protecting biodiverse habitats also has a global impact (e.g. forests sequester carbon and have biodiversity value).
� Climate change hazard risks such as flooding or cyclones tend to be felt more at a city or more localised level.
The figure on the facing page illustrates the different levels at which the environmental risks relevant to cities tend to operate.
Cities both contribute to and are impacted by environmental risks. These risks operate at different levels from the global to local levels, are interconnected, and can be uncertain.
1 These wider impacts are not dealt with in detail in this report due to a lack of availability of data. This area should be a priority for future research.
We define risk broadly as the potential that the ‘activities’ of cities which drive carbon emissions and pressure on critical natural resources and ‘events’ in the form of climate hazards and external pressures on resources used by cities will have an undesirable impact. Given that cities both contribute to and are impacted by environmental risks it is difficult to disentangle cause and effect. Hence, no attempt is made to delineate between stresses or risk drivers (e.g. carbon emissions) and shocks (e.g. rises in the price of energy, climate hazards).
defining environmental risk

Source: Atkins
Future Proofing Cities | 15
Atkins in partnership with
CITY TO HOUSEHOLD LEVEL IMPACTS
Damag
e to co
mpetitiveness of energy and carbon intensive sectors, impacting growth and jobs
Dispersed climate change impacts across multiple urban centres
Impa
cts on liv
elihoods due to disruptions to supply and/or price rises of household energy sources
Health impacts of air pollution
Impacts
on livelihoods due to poor access to safe drinking water
Impa
ct o
f poo
r nut
rition
al intake on health of vulnerable groups, including risks of fatalities and increased poverty
Regional conflict e.g. water wars
Social unrest e.g. food riots
Impa
ct o
f hab
itat d
estru
ction on su
pply of provisioning and regulating ecosystem services e.g. fuel wood for heating
Risk
s to
long
term
viab
ility o
f agricu
ltural production e.g. due to disruptions to water systems and soil nutrientsWid
espr
ea
d dam
age to buildings, infrastructure, industry and agriculture
Injuries and fatalities
Stresse
s to basic services e.g. health systemsSpread of infectious diseases
GLOBAL TO CITY LEVEL IMPACTS
REGIONAL TO CITY LEVEL (URBAN CATCHMENT) IMPACTS
HOUSEHOLD/PEOPLE
The environmental risks relevant to cities operate at different levels
Global to local risks� High carbon emissions – carbon price risk associated
with regulation and/or market mechanisms for pricing carbon
� High energy use – vulnerability to limited availability and/or rising prices of traditional energy sources
Regional to local risks� Risks to water security from drought
� Risks to food security – limited availability and/or rising prices of basic food stuffs
� Risks from urban expansion and broader pressures to biodiverse natural habitat
local risks� Flood risks
� Cyclone risks
� Sea level rise
� Temperature extremes
� Landslide risks

16 | Future Proofing Cities
Atkins in partnership with
the interconnected nature of environmental risks
The environmental risks relevant to cities are also interconnected. For instance, high carbon emissions and energy use per capita are strongly correlated. Risks to water and food systems as well as other vital ecosystems such as biodiverse natural habitats are linked via a series of complex biophysical relationships. Equally, there are well known interconnections between hydrological climate hazard risks such as flood, cyclone, and landslide risks.
The risks that cities face are also impacted by one another. Deforestation of slopes to accommodate new housing, for example,
Interconnected environmental risks This risk map illustrates the network of interconnections between the global environmental risks relevant to cities and their interface with social and economic risks. The strongest connections between risks are highlighted with a dark grey line.
Food Security
Flooding
biodiversity loss
Urban Heat Island
Air Pollution
Chronic and Infectious Diseases
Climate Change
Storms and Cyclones
Energy Price Rises and Volatility
Population Growth
Urban Greenhouse Gas Emissions
Migration
Conflict
Poverty & Inequality
water Scarcity
Fragile States
Economic Fragility
Source: Atkins: Adapted from WEF Global Risk Map (2011)
Energy and carbon risks
Risks to regional support systems
Risks from climate hazards
Economic and social risks
Higher perceived interconnection
combined with increased rainfall from climate change can impact on the risk of landslides and flooding. Feedback effects are also common; for example, flooding impacts the ability of farmers to sell food when roads and other transport links are affected.
The environmental risks relevant to cities not only interface with each other but also interface with social and economic risks, and are impacted by a city’s urban form and wider dynamics as outlined in the diagram below and box on the left.
The design of city infrastructure has a direct impact on its environment. Sprawled cities tend to have higher levels of carbon emissions. Compact cities with mixed land-use and higher population density can provide more energy efficient transport infrastructure, reducing carbon and importantly energy costs; this then needs to be balanced against the increased risks to vulnerable populations from climate change hazards such as flooding due to a greater concentration of people.
Alongside density, the scale of population and economic activity affects the pressure a city places on its surrounding ecosystems and resources. Climate conditions and physical geography influence energy use through heating or cooling requirements as well as the severity of climate hazards such as flooding or droughts. Natural resource endowments (e.g. oil or coal) help to determine the availability of material inputs such as traditional energy sources and incentives to diversify supply (e.g. Lagos in Nigeria has access to relatively cheap supplies of oil which can reduce incentives to introduce low carbon energy sources).
The impact of urban form, geography & urban dynamics on environmental risks

Future Proofing Cities | 17
Atkins in partnership with
Dealing with uncertainty
Over time the risks that cities contribute to and face will change. Technology, climate change, economic pressures, population growth, and regulations designed to tackle environmental risks are likely to both individually, and in combination change the nature of the environmental risks facing cities.
In particular, a number of environmental risks such as climate change are highly uncertain. Unfortunately, data and projections of climate change at the regional or city level, particularly in the developing world, are limited. For example, whilst cities such as Bangalore are not currently at risk of drought, water consumption is growing and the city is reliant on drawing water from the Cauvery River 100 km away: water scarcity issues may well be an issue in the future as climate change interacts with the growing demand for water.
Identifying uncertainties
2 For one of many studies, see IMF Working Paper. , Benes et al (2012), ‘The Future of Oil: Geology versus Technology.’ This suggests a near doubling of the real price of oil over the next decade even with new sources of supply.
Similar uncertainties exist in relation to how developments in the global energy market might impact long term energy prices, although most evidence points to long run trend increases.2
When thinking through responses to environmental risks, it is therefore important for cities to identify current risks but also to plan for and manage uncertain potential future risks.
Uncertainty in environmental risks should not be an excuse for inaction. For example, although data gaps exist in relation to climate change projections, cities can use a range of plausible scenarios to assess uncertainty and identify ‘no/low regrets’ measures which deliver wider economic, social, and other environmental benefits (see Chapter 4). Cities can also focus on
The DPSIR framework (Driving-Force-Pressure-State-Impact-Response) has, since the 1980s been used by policymakers to consider the inter-linkages and dynamics between socio-economic and environmental systems which combine to influence transmission of environmental risks.
measures which have design flexibility or are not irreversible (e.g. flood defence systems which are portable, flexible, or can be extended as more information on flood risks become available).
The challenge is to understand the dynamic and interlinked nature of the drivers of risk and how these risks may change over time. With the projected increases in the incidence of extreme weather events, cyclones, droughts and storms, it will be crucial to cities to focus on monitoring environmental trends and to take an adaptive approach to the design of cities which enables them to respond to and accommodate change.
The conceptual framework is useful in highlighting gaps in knowledge and processes and linkages between human and environmental systems which determine the scale and impact of environmental risks. There are four key areas where uncertainty can influence environmental risk.
driving Forces affecting transmission of environmental pressuresEconomic and social change interacting with technology, regulatory frameworks influence both the dynamics and ways in which urban development takes place and its effect on the environmental stocks and flows.
There is uncertainty relating to how specific driving forces combine and exert pressure on environmental systems which are locally specific. The other major external pressure to regional and city environmental systems is the local effect of global climate change.
Uncertain effects on environmental stocks and flowsThe links between pressures and their effect on environmental stocks can often be informed by scientific knowledge. However, the local outcomes on hydrological and ecological systems cannot always be anticipated due to uncertain interaction effects with the socioeconomic environment and between linked environmental systems.
Uncertainty on the impact or significance of the effectThe extent to which a change in one variable or system will be significant or lead to a threshold being crossed causing a regime shift or cumulative or consequential effects is another area of uncertainty.
Nature and type of responseThe extent to which environmental impacts lead to a change in policy response or management is strongly influenced by contextual factors and the governance framework.
and nitrogen cycle, energy & carbon
cycle, nat resources, biodiversity)
social and natural env
ironm
ent)
environmental stocks)
State (condition of
Pressure (e.g. water, cycle, food,
Impact (signifi c
ant e
ffects
on
regu
latio
n, in
cent
ives
, mar
kets,
)
Resp
onse
(e.g
. gov
erna
nce,
polic
y,
Driving forces (e.g. urbanisation factors and human needs, global climate change

The cities assessment framework
18 | Future Proofing Cities
Atkins in partnership with
The interconnected environmental risks relevant to cities and regions
This diagram outlines the framework used in the project to assess the range of environmental risks relevant to cities in developing countries. This was developed based on a review of the international literature with input from the projects expert reference group.
Data for a range of indicators capturing the most critical environmental risks relevant to 129 cities across the developing world were collected based on a review of a long list of available international data sources. Risks were then grouped into three broad categories or clusters based on the different levels at which risks operate and a detailed statistical analysis of their interrelationships.
A summary of the approach used is set out below and a full methodology and overview of its theoretical underpinnings is provided in Appendix 1.
For certain cities, seismic and volcanic risks can be significant, accounting for a large proportion of damage costs alongside climate hazards. These risks have not been a focus for this report. The interaction between climate risks and other natural hazards could be a focus for future research, and should be accounted for in more detailed city level diagnostics.
CARb
ON EMISSIONS ANd ENERGy USE
ClIM
ATE R
ISKS RESOURCE ANd
ECOSySTEM
RISKS
Resource and ecosystem risks (regional impacts)The city catchment is the most relevant metric for capturing resource and ecosystem risks. We have defined this is a zone of 100 km in radius from the city centre. A number of core measures can be used to understand city resource risks as well as risks to natural habitat and biodiversity.
� water scarcity: % of city catchment at significant risk of drought
� Food scarcity: % of city catchment which is crop and pasture land
� Natural habitat: % of city catchment defined as biodiverse natural habitat (forests and wild areas)
The food security indicator assumes that the greater the availability of crop and pastureland within the city catchment, the greater the ability of the city to draw on food sources in the event of changes in the price and availability of current food supplies (either imported or grown in other parts of the country). Other considerations such as the ability of cities in coastal areas to draw on seafood and the strength of regional food distribution and logistics systems are other important indicators of food security but could not be included in this comparative analysis due to data availability.
The natural habitat measure captures the potential threats from urban expansion to habitats with particularly high levels of biodiversity and important species. Damage to these assets will also impact on urban development given their role in the provision of ecosystem services to cities or on sectors such as eco-tourism.
Climate risks – hydrological (local impacts)Flood risk, cyclone risk, and landslide risk are well known climate risks capturing the hazards associated with sea rise, flooding associated with river overflow, and extreme events.
� Flood risk: % of city extent at risk of significant flood hazard
� Cyclone risk: % of city extent at risk of significant cyclone hazard
� landslide risk: % of city extent at risk of significant landslide hazard
Alongside drought risk, these indicators link to the priority impacts on urban areas identified by the IPCC (2007) and ARC3 (2011). Drought risk is covered under resource and ecosystem risks. Data for risk of heat extremes are not available on a consistent basis for the cities covered in this report.
Carbon emissions and energy use (global impacts)Carbon emissions and energy use per capita are well known measures for capturing urban carbon and energy use (primarily drawing on traditional energy sources). Urban sprawl is a good supporting indicator as it acts as a proxy for the carbon and energy intensity and the ease of implementing measures to reduce carbon or energy dependency.
� Carbon emissions: Carbon emissions per capita
� Energy use: Energy use (kg of oil equivalent per capita)
� Urban Sprawl: Population density (people per km2)3
3 The use of urban density as an indicator needs to be considered carefully. Within this study it was found that when considering issues at a metropolitan scale, density was an appropriate indicator for a range of other factors linked to urban structure and form which influence both energy intensity linked to sprawl and climate risk impacts. In designing effective policies to address the issues, a more fine grained assessment considering additional factors beyond density is needed.

Future Proofing Cities | 19
Atkins in partnership with
Atkins’ urban risk databaseFor the assessment of the cities featured in this report, Atkins developed an urban risk database of 129 medium to large scale cities in 20 low income countries. This was supplemented by 12 benchmark cities from middle and high income countries.
Data was collected on the basis of seven key criteria (i) data availability and coverage; (ii) sound theoretical basis; (iii) consistent and comparable over time; (iv) easily understood; (v) transparent; (vi) useful in differentiating between types of cities; and (vii) ability to act as proxies for other closely correlated indicators.
The database allows us to better understand the multiple and interconnected risks facing cities from climate change, resource scarcities, and damage to ecosystems. It also provides an understanding of the vulnerability of cities to risks, the capacity of cities to respond to risks, as well as an overview of urban scale and dynamics in terms of city size and ecological impacts, climate and physical geography, and urban form.
The database can form a starting point for helping answer a range of questions relevant for the decisions that policymakers and companies need to make: which cities are facing significant risks from flooding? Which cities face significant risks to water and food security in their urban catchments? Which cities have the greatest ecological impact? Which
cities are likely to place significant future pressures on the environment due to their size and/or rapid growth? How do complex environmental risks differ within and between countries and regions?
To our knowledge, the database is unique in that it takes a holistic approach by looking at issues such as carbon emissions and climate risk hazards together rather than in isolation. The data provides the ability to undertake a comparative analysis across different regions and geographies, making use of geospatial risk data from CIESEN at the Earth Institute (Columbia University) as well as more typical point data from international organisations such as the UN and World Bank. The assessment framework and indicators used were informed by the latest thinking on the relationship between urban growth, spatial dynamics and environmental impacts including that on systems thinking and urban metabolism, as well as by the projects expert reference group.
For each city, the database includes bespoke and comparative data for the latest years available on carbon emissions, energy use, water scarcity, food security, natural habitat, and hydrological climate hazard risks including flood, cyclone, and landslide risk. It also includes indicators on the percentage and numbers of people living in multi-dimensional poverty, inequality, urban informality, and access to electricity, water, and
sanitation. Data is included on current and projected GDP per capita and population growth out to 2025. The human impact on ecosystems is captured via the Human Influence Index. Information on climate and geography includes the climate zone and physical geography. Aspects of urban form such as population density are also included.
Dedicated metrics for the spatial extent of the city and city catchment (defined at 100 km in radius) were constructed to provide a common unit of measurement for spatial data. Regional and national proxies were used where city level data was unavailable.
Collecting data for cities in some of the world’s poorest countries on a comparable basis has proved challenging given limitations in the data in terms of scope and time series available. Collecting comparable data on carbon emissions and energy use is particularly challenging for cities in developing countries. Indicators for risks to regional support systems at the catchment level are not available, and bespoke indicators were generated to capture these risks.
See the Appendix for more detail on the data sources and methodology.
Confidential – not for wider circulationConfidential – not for wider circulation

20 | Future Proofing Cities
Atkins in partnership with
Typologies are helpful to identify and compare groups of cities with common risk characteristics spanning different geographies. This can facilitate the identification of the universe of solutions likely to be applicable to different types of cities.
We have identified five broad city typologies based on a comparative assessment of the different environmental risks facing 129 cities in 20 low income countries. As above, this covers cities from across DFID’s extensive country footprint with: (i) populations in excess of 750,000 people to allow for collection of available population data from relevant international agencies and (ii) availability of other comparable data.
To our knowledge this is the first time that typologies have been developed for a significant sample of cities in developing countries based on the different environmental risks they face. These typologies have been developed through an in depth analysis of the characteristics of cities in developing countries.
Five urban types
Developing urban types: methodology
The diagram on the previous page outlines the framework of indicators used to assess the range of environmental risks relevant to the 129 cities reviewed as part of this report. The box on the previous page provides further details of the urban risk database developed as part of this project.
To develop the urban types, the three clusters of core risk indicators were used to rank cities based on the severity of the environmental risks they face using a range of different thresholds (low-high risk). These risk thresholds were determined by drawing on input from the project’s expert group, common benchmarks, and analysis of the distribution of data to eliminate anomalies and outliers distorting the results. An aggregate risk index was constructed for each of the three core indicator groups using a mixture of equal and differential weightings of the individual risk indicators.
Cities were then mapped and clustered based on which cities had medium to high risks in one or several of the three categories. For example, all cities with major climate hazards have medium-high levels of aggregate risk in relation to climate hazards, with low current risks in the other two risk categories. Sub-indicators were then used to refine these groups further, particularly in relation to cities facing complex risks to their regional support systems.
These groups were then validated and refined using correlations between indicators. For further detail of the indicators, criteria used for ranking cities, and methodology for developing the typologies see Appendix 1.
Cities can be grouped into five broad urban types based on the most significant environmental risks they face. Grouping cities into urban types can be a useful way for national or regional level decision-makers, development agencies, companies, and municipal authorities to pin-point common areas for action, innovation, or investment.
The environmental challenges facing cities in the developing world are different from those in the developed world. For example, cities in the developing world have much lower carbon emissions per capita in comparison to those in more developed countries. As such, the five typologies developed here may not be equally applicable to cities in more developed countries. There are however, many common risks facing cities globally. Cities such as New York and Singapore face significant risks from flooding within their catchments, but they differ significantly in their vulnerability to these risks vis-a-vis cities in the developing world (see Chapter 3).
Environmental challenges facing cities in low, middle, and high income countries
urban typologiescan help us to better understand the most significant risks relevant to groups of cities and facilitate identification of policies most applicable to them
urban typologiescan help us to better understand the most significant risks relevant to groups of cities and facilitate identification of policies most applicable to them

Future Proofing Cities | 21
Atkins in partnership with
Together these cities:
million metric tonnes(mega tonnes) of carbon dioxide per annum
Emit
527
billion kilos of oil per annum
Consume the equivalent of 243
of their collective built-up urban area at significant risk of flooding
of biodiverse forests and wilderness within their urban catchments.
of their wider urban catchments at significant risk of drought.
Have
Have
2/3
30%
Have over 100,000 sq.km
The 129 cities assessed as part of this report and which were used to develop the urban types together:Cover 350 million people in close to 100 million households and are expected to add another 150 million people by 2025 to reach over 6 per cent of the global population.
Have a collective GDP of $2.5 trillion: this is expected to grow to $7.1 trillion by 2025.
Includes some of world’s mega cities: Delhi, Mumbai, Kolkata, Karachi, Dhaka, and Lagos. These cities alone house nearly 100 million people and are expected to add another 30 million people in less than 15 years.
This map shows the 129 cities in 20 countries assessed as part of this report. The cities are grouped into five types based on the most significant environmental risks relevant to them. These cities represent a significant sample of the world’s urban population and are significant in economic terms.
Five urban types
4 These cities have one or more medium to high risks across water security, food security, and risk of damage to natural habitats , with low aggregate risk in the other two broad risk categories
5 These cities have one or less medium to high risks across all risk indicators
Example:Bangalore (India) Cape Town (South Africa)
Energy intensive, sprawled cities with significant carbon footprints
CARb
ON EMISSIONS ANd ENERGy USE
ClIM
ATE R
ISKS RESOURCE ANd
ECOSySTEM
RISKS
These cities which can be characterised as sprawled cities with high carbon emissions and high energy intensity.
CARb
ON EMISSIONS ANd ENERGy USE
ClIM
ATE R
ISKS RESOURCE ANd
ECOSySTEM
RISKS
Example:Blantyre-Limbe (Malawi)Lilongwe (Malawi)
Cities with a low current risk profile
A limited number of cities have a relatively low current risk profile, although this could change over time as factors such as population pressures and climate change intensify.5
Unknown risk profile
There are a significant number of cities that have an unknown risk type due to a lack of data on climate hazards. Some of these cities have significant risks in the other two risk categories, others have a low risk profile across all three categories. These cities are highlighted throughout the chapter.
CARb
ON EMISSIONS ANd ENERGy USE
ClIM
ATE R
ISKS RESOURCE ANd
ECOSySTEM
RISKS
Example:Jakarta (Indonesia) Bangkok (Thailand)
Cities with multiple risks: energy, carbon, climate hazards, and regional support systems
These cities are both at risk from major climate hazards and have relatively high carbon emissions and high energy intensity. Some of these cities also face significant risks to either their water security, food security, or biodiverse natural habitats.4
CARb
ON EMISSIONS ANd ENERGy USE
ClIM
ATE R
ISKS RESOURCE ANd
ECOSySTEM
RISKS
Example:Dhaka (Bangladesh) Kampala (Uganda)
Cities with major climate hazards
These cities face major climate hazard risks – predominantly from flooding - which are likely to intensify over time.
CARb
ON EMISSIONS ANd ENERGy USE
ClIM
ATE R
ISKS RESOURCE ANd
ECOSySTEM
RISKS
Example:Karachi (Pakistan) Da Nang (Vietnam)
Cities with regional support system(s) at risk (water, food, biodiversity)
These cities face significant risks within their urban catchment affecting either their water security, food security, or risks to biodiverse natural habitats and ecosystems (for example virgin rainforest areas or wetlands).

legend
Type 1 Cities – Energy intensive sprawled cities with high carbon footprints
Type 2 Cities – Cities with major climate hazards
Type 3 Cities – Cities with risks to regional support system(s)
Type 4 Cities – Cities with multiple risks
Type 5 Cities – Cities with low current risk profile
Unknown risk type – Cities with unknown climate risks due to data availability
22 | Future Proofing Cities

City types can be used by:
� National and regional level decision-makers and development agencies looking at portfolios of cities to support by highlighting the most significant risks different types of cities face and possible solutions.
� National and multinational companies by helping them identify and manage potential risks to service provision or to identify common urban markets for investment (e.g. to develop and target innovative products or services for reducing carbon emissions).
� City authorities as a starting point for identifying priorities for further diagnostic work.
These typologies highlight the dominant and most significant risks facing cities i.e. the primary risks which require the most immediate attention. This does not mean that cities in a particular type do not face other risks. Each city has secondary risks which whilst not appearing to be significant at the city level in relation to other cities are still present and may be more significant at a more localised level. It is possible to expand the approach to develop sub-typologies to provide a more granular view of specific environmental risks facing groups of cities.
As with any classification system there is inevitably some overlap between the types. Within some types there are outliers which have a distinctive profile which may differ from others in the typology on the basis of, for example, their geographic and climatic particularities. Looking at outliers can be useful to examine where policies may have responded to reflect extreme environmental challenges. These outliers are highlighted throughout the remainder of this chapter.
This is a comparative assessment at metropolitan scale of the risks facing cities. All cities ultimately require a bespoke diagnostic of the risks they face reflecting the spatial variation of risks within the city and to make use of any more granulated data available at the local level.
Using and interpreting the typologies
Future Proofing Cities | 23

24 | Future Proofing Cities
Atkins in partnership with
These cities tend to consist of fast growing cities concentrated in India, Nigeria, and Vietnam, characterised by medium to high energy intensity and carbon footprints per capita and significant levels of urban sprawl. Although some of the cities within this group such as Indore, Jabalpur, and Mysore do not currently have significant carbon footprints, high levels of sprawl and medium to high levels of energy intensity indicate the risk of these cities locking themselves into high carbon pathways.
risks and opportunities
� Considerable risk of locking into energy and carbon intensive growth pathways. With the exception of Bangalore and Cape Town, the populations are expected to grow by between one - third and a half by 2025 and economic activity even
faster, albeit from different starting points; in some cities GDP is expected to at least triple by 2025. High existing levels of urban sprawl could exacerbate existing emissions and energy use.
� Significant risks from potential rises in the long term price of energy, carbon price risks associated with potential future climate change legislation, and ancillary health costs and productivity losses associated with air pollution and congestion.
� Risks to the global community and to national government e.g. to the Government of India’s objective of cutting India’s carbon intensity by 20-25 per cent by 2020.
� Given dynamic economic forecasts, there are opportunities to leapfrog the traditional development paths.
energy intensive, sprawled cities with significant carbon footprints
� 14 cities
� High energy and carbon footprints
� Significant levels of urban sprawl due to low urban density
� Dynamic, fast growing economies
� Diverse in physical geographies and climate conditions
Key characteristics
TyPE
1
Carbon emissions per capita
1.7Type 1 cities
13benchmark cities in middle and high income countries
16benchmark cities in high income countries
Relative to cities in middle and high income countries the energy and carbon intensity of cities in low income countries remains low. Cities in middle and high income countries have also been producing significant carbon emissions for a greater period of time and have greater historic responsibility for reducing them. This principle of common but differentiated responsibilities in global efforts to reduce carbon emissions between countries is enshrined in the United Nations Framework Convention on Climate Change (UNFCCC).
The energy and carbon intensity of cities in low, middle, and high income countries
Type 2,3 cities 0.6
1.7Type 4 cities
Source: Atkins’ Urban Risk Database

Future Proofing Cities | 25
Atkins in partnership with
Bangalore’s main environmental risks are related to energy use, carbon emissions and urban sprawl. Research by the Indian Institute of Science (IIS) suggests that Bangalore has the third highest carbon footprint in India and a rapidly rising energy use.6 Bangalore’s carbon profile is to a large extent due to electricity consumption relating to buildings. Inefficient older buildings and newly built developments are estimated to contribute 59 per cent of emissions owing to their air-conditioning needs.7 Hydropower constitutes a significant share of the energy supply in the state of Karnataka, but the share has decreased since the 1980’s with the expansion of fossil fuel generated energy.8
bangaloreGdP per capita (2010): US$ 9,604 (PPP)
Population (2010): 7.22 million
Carbon emissions per capita: 1.53 tonnes
Population density: 3644 persons per sq.km
Percentage of the city catchment urbanised: 15.9%
One of Bangalore’s most significant challenges is unplanned urban sprawl. Transport networks in the city are heavily congested and most travel is by motorised modes. In addition sprawl is threatening its green spaces on the outskirts of the city. Bangalore - known as the garden city - has traditionally had a good network of green and blue infrastructure, but it is now rapidly deteriorating as the remaining lakes in the region are becoming increasingly contaminated and wetland habitats are threatened by urban development.
Bangalore is growing mainly through two parallel processes; one being the real estate development that expands through technological
parks and the city’s IT corridor. The other is through quasi-legal low-cost housing, sold by developers directly to residents in an unplanned manner. The current patterns of development in Bangalore suggest major risks of carbon lock-ins. The population and the economy are growing rapidly, suggesting that investment will be made into new construction, which will likely lead to land grabbing and eviction of residents in the least secure settlements for the construction of new infrastructures and high-energy consuming buildings.
6 Subhash (2012)
7 TERI (2010) & Subramanian (2012)
8 d’Sa & Murthy (2002)
energy intensive sprawled cities with high carbon footprints
This map, and chart below show the size and balance of the three risk drivers relevant to Type 1 cities: carbon emissions per capita, energy use per capita, and urban sprawl (proxied by low levels of population density per km2). All these cities pass critical thresholds in relation to these risks (see Appendix 1).
Haipong and Jodhpur are distinct in having energy intensity as a more prominent risk driver than some other cities. Haipong is an industrialised port city and the geographic location of Jodhpur in the Thar Desert could explain higher levels of energy intensity than for other Indian cities with a similar economic profile and role such as Jaipur or Chandigarh.
Cities with the highest energy and carbon footprints tend to have higher levels of GDP per capita.9
Larger more developed cities tend to have multiple drivers of energy use such as Bangalore, Cape Town, Jaipur.
Cities which are less industrialised or service sector focused tend to have urban sprawl as the prominent driver of emissions (e.g. Jos, Mysore, and Indore)
TyPE
1
bangalore
IndIa
9 Based on pairwise correlations of indicators within our sample of cities at 1 per cent significance level.
©Ja
n A
lexa
nd
er e
rnst
/get
ty im
ages
bangalore, india at night
Kaduna – Nigeria
Jos - Nigeria
Mysore - India
Jabalpur - India
Indore - India
Hai Phòng - Viet Nam
Jodhpur - India
Solapur - India
Jaipur - India
Hubli-Dharwad - India
Bangalore - India
Aurangabad - India
Chandigarh - India
Cape Town - South Africa
CARb
ON
EM
ISSI
ON
S PE
R CA
PITA
ENER
Gy
USE
PER
CA
PITA
URb
AN
dEN
SITy
(lO
w)
INCREASING lEVElS OF RISK

Energy and carbon intensive cities
base map: The base map provides a map of population density which acts as an indicator for the level of urban sprawl. This complements measures of carbon emissions and energy use as cities with high levels of urban sprawl tend to find it harder to implement measures to reduce carbon or energy dependency. For example, cities which are less compact tend to find it more difficult to introduce public transport systems which are cost effective and residents tend to rely more on private modes of transport with high carbon emissions and energy use per capita.
Source: Adapted from CIESEN.
TyPE
1
High urban sprawl (low population density)
low urban sprawl (high population density)
legend
Type 1 Cities – Energy intensive sprawled cities with high carbon footprints
Type 2 Cities – Cities with major climate hazards
Type 3 Cities – Cities with risks to regional support system(s)
Type 5 Cities – Cities with low current risk profile
Unknown risk type – Cities with unknown climate risks due to data availability
Type 4 Cities – Cities with multiple risks
26 | Future Proofing Cities

Future Proofing Cities | 27

28 | Future Proofing Cities
Atkins in partnership with
These cities face major climate hazard risks, primarily from flooding. This is a diverse group of cities located across multiple countries, climate zones, and physical geographies. These cities are also diverse economically and in population terms ranging from megacities such as Dhaka to smaller cities such as Kathmandu in Nepal. Many cities within this group have already been significantly impacted by flooding. Dhaka has experienced four major floods in the past two decades.
Within our sample, cities with high flood, cyclone, and landslide risks do not tend to be the same cities as those suffering risks to their water security due to drought as they tend to be located in less drought prone climate zones or on the coast with lower drought risk, although this dynamic could change rapidly with climate change. The cities with significant risks to their water security due to drought are covered under Type 3.
risks and opportunities
� Flooding likely to significantly impact infrastructure and economies.
� These risks are likely to intensify over time as climate change hazards intensify. This could potentially cause considerable damage to coastal cities due to tidal flooding associated with sea level rise. Increasingly severe flood conditions associated with the increased incidence of extreme precipitation likely to be a major risk for cities located inland.
� Opportunities to boost their resilience to climate impacts though cost effective solutions to prevent potential future damage costs (see Chapter 4).
Cities with major climate hazards
� 22 cities
� High risk of flooding
� Diverse in location, climate zones, physical geography, and population and economic size
Key characteristics
Climate change projections for urban areas
Climate change is likely to intensify the incidence of climate hazards for urban areas. Higher temperatures and an increase in intense rainfall events are likely to increase the risks of flooding, heatwaves, and public health issues. The risk of flash floods is exacerbated in urban areas because of a greater proportion of impermeable surfaces, increasing surface run-off. Flooding in urban areas can also have serious consequences for public health through infectious disease outbreaks, particularly where sewerage systems and waste collection are insufficient or entirely absent.
Urban areas have particular challenges with regard to climate change, with coastal flooding a principal concern. Around 360 million people – 13 per cent of the world’s urban population – reside in urban coastal areas that are less than 10 metres above sea level, including almost two-thirds of cities with over five million inhabitants (Satterthwaite, 2008). Less developed nations are likely to have nearly twice the proportion of their urban population in these areas than developed nations (ibid). With sea level rise, increased storm activity and larger storm surges, these low-lying urban areas are likely to be at an increasing risk of coastal flooding.
Another impact of climate change that may disproportionately affect urban areas is that of heat waves. Although comparable data has not been available
for the cities covered in this report on temperature extremes, urban areas are usually found to experience higher air temperatures than surrounding rural areas, an effect known as the ‘Urban Heat Island’. This can be attributed to a range of factors, including heat retention of buildings, a low surface albedo of roads and building roofs, and the impact of low level air pollution, such as aerosols. As buildings tend to store heat during the day and release it at night, the difference between the temperature in an urban area and its surroundings is often greatest at night. Very hot conditions, particularly in areas of high humidity, have implications for air quality, which is already poor in many cities, particularly in Latin America and Asia.
Currently climate modelling capability is unable to model specifically the impacts for urban areas. General Circulation Models (GCMs), for example, are not of a sufficient resolution to differentiate urban areas on the land surface. While Regional Climate Models (RCMs) can, they tend to model land surface as a uniform area in each grid box, and do not include specifics such as the day-night storage-release pattern of heat from buildings. As a result, for example, climate change projections are likely to underestimate temperature increases for localised urban areas. Climate change is likely to result in higher daily maximums (and corresponding milder daily minimums) for urban areas than the mean changes projected by GCMs.
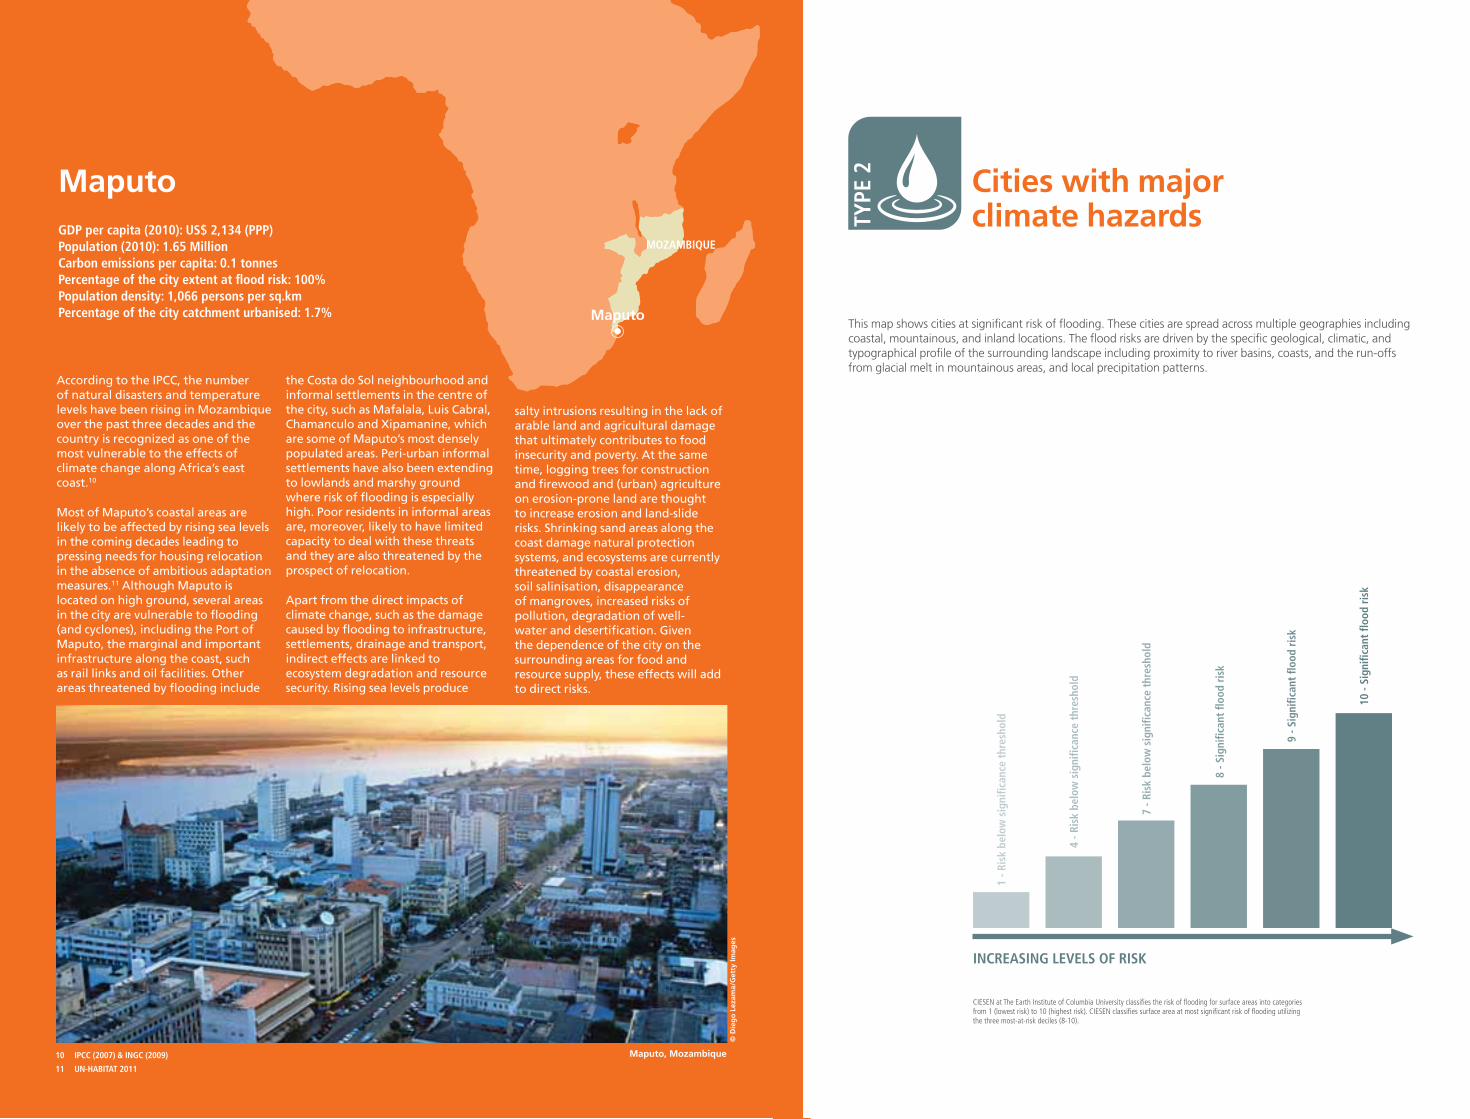
Future Proofing Cities | 29
Atkins in partnership with
According to the IPCC, the number of natural disasters and temperature levels have been rising in Mozambique over the past three decades and the country is recognized as one of the most vulnerable to the effects of climate change along Africa’s east coast.10
Most of Maputo’s coastal areas are likely to be affected by rising sea levels in the coming decades leading to pressing needs for housing relocation in the absence of ambitious adaptation measures.11 Although Maputo is located on high ground, several areas in the city are vulnerable to flooding (and cyclones), including the Port of Maputo, the marginal and important infrastructure along the coast, such as rail links and oil facilities. Other areas threatened by flooding include
Maputo
MaputoGdP per capita (2010): US$ 2,134 (PPP)Population (2010): 1.65 MillionCarbon emissions per capita: 0.1 tonnesPercentage of the city extent at flood risk: 100%Population density: 1,066 persons per sq.km Percentage of the city catchment urbanised: 1.7%
the Costa do Sol neighbourhood and informal settlements in the centre of the city, such as Mafalala, Luis Cabral, Chamanculo and Xipamanine, which are some of Maputo’s most densely populated areas. Peri-urban informal settlements have also been extending to lowlands and marshy ground where risk of flooding is especially high. Poor residents in informal areas are, moreover, likely to have limited capacity to deal with these threats and they are also threatened by the prospect of relocation.
Apart from the direct impacts of climate change, such as the damage caused by flooding to infrastructure, settlements, drainage and transport, indirect effects are linked to ecosystem degradation and resource security. Rising sea levels produce
10 IPCC (2007) & INGC (2009)
11 UN-HAbITAT 2011
Cities with major climate hazards
This map shows cities at significant risk of flooding. These cities are spread across multiple geographies including coastal, mountainous, and inland locations. The flood risks are driven by the specific geological, climatic, and typographical profile of the surrounding landscape including proximity to river basins, coasts, and the run-offs from glacial melt in mountainous areas, and local precipitation patterns.
INCREASING lEVElS OF RISK
1 - R
isk
belo
w s
igni
fican
ce t
hres
hold
4 - R
isk
belo
w s
igni
fican
ce t
hres
hold
7 - R
isk
belo
w s
igni
fican
ce t
hres
hold
8 - S
igni
fican
t flo
od r
isk
9 - S
igni
fican
t flo
od r
isk
10 -
Sign
ifica
nt fl
ood
risk
CIESEN at The Earth Institute of Columbia University classifies the risk of flooding for surface areas into categories from 1 (lowest risk) to 10 (highest risk). CIESEN classifies surface area at most significant risk of flooding utilizing the three most-at-risk deciles (8-10).
mozambique
salty intrusions resulting in the lack of arable land and agricultural damage that ultimately contributes to food insecurity and poverty. At the same time, logging trees for construction and firewood and (urban) agriculture on erosion-prone land are thought to increase erosion and land-slide risks. Shrinking sand areas along the coast damage natural protection systems, and ecosystems are currently threatened by coastal erosion, soil salinisation, disappearance of mangroves, increased risks of pollution, degradation of well-water and desertification. Given the dependence of the city on the surrounding areas for food and resource supply, these effects will add to direct risks.
© D
ieg
o L
ezam
a/g
etty
imag
es
Maputo, Mozambique

Cities with major climate change hazards
legend
Type 1 Cities – Energy intensive sprawled cities with high carbon footprints
Type 2 Cities – Cities with major climate hazards
Type 3 Cities – Cities with risks to regional support system(s)
Type 5 Cities – Cities with low current risk profile
Unknown risk type – Cities with unknown climate risks due to data availability
Type 4 Cities – Cities with multiple risks
Mombasa (Kenya): Mombasa is the largest seaport in East Africa. The city has a history of disasters related to climate extremes including floods, which cause serious damage nearly every year and, often, loss of life. The floods in October 2006 were particularly serious, affecting some 60,000 people in the city and the wider province. Around 17 per cent Mombasa’s area could be submerged by a sea-level rise of 0.3 metres, with a larger area rendered uninhabitable or unusable for agriculture because of water logging and salt stress.
Maputo (Mozambique): 100 per cent of Maputo’s urban area is at risk of flooding. Mozambique has suffered from an uninterrupted succession of floods with damaging consequences for social and economic development. Floods were observed in 1977-1978, 1985, 1988, 1999-2000 and more recently in 2007-2008.
base map: The base map provides a map of flood risk.
Source: Adapted from CIESEN.
High flood risk low flood riskCoastal cities: Some cities such as Chittagong and Mombasa are located on the coast and suffer from coastal flooding when normally dry, low-lying land is flooded by sea water. The extent of coastal flooding is a function of the topography of the coastal land exposed to flooding.
Mountainous cities: Flooding in cities located in mountain regions such as Kathmandu (Nepal) cause significant losses in terms of property and life. Floods are triggered by a range of different mechanisms: continuous rainfall, glacial lake outbursts, landslide dam outbursts, sheet flooding or inundation as a result of excessive rain, bank overflow, or obstruction to flows of water from infrastructure development.
Inland cities: Many cities located inland close to rivers suffer from fluvial (river) flooding. Multan in Pakistan for example is located on the banks of the Chenab River. Given the local climate conditions, the land close to the Chenab is usually flooded in the monsoon season. Similarly, Khartoum in Sudan is located at the confluence of the White Nile which often overflows its banks to cause flooding. Heavy rainfall also often affects the city.
30 | Future Proofing Cities

bangkok (Thailand): Bangkok is well known for suffering serious flooding due to heavy rainfall, land subsidence, and sea level rise. However, Bangkok also drives and is impacted by other environmental risks and is therefore categorised under Type 4.
dhaka and Khulna (bangladesh): These cities are located in the low-lying Ganges River Delta and tend to have higher coastal flood risk as a result of their low elevations and they experience significant (natural and anthropogenic) subsidence. Most parts of Bangladesh are less than 12 m above the sea level, and some studies estimate that about 10 per cent of the land would be flooded if the sea level were to rise by one metre. In September 1998, Bangladesh saw the most severe flooding in modern history. 1,000 people were killed and 30 million more were made homeless.
Future Proofing Cities | 31

32 | Future Proofing Cities
Atkins in partnership with
Cities with risks to regional support system(s)
These cities face significant risks to natural support systems within their wider urban catchments. This includes risks to water security, food security, or to biodiverse natural habitats such as virgin rainforests. This is also a diverse group of cities located across multiple countries, climate zones, and physical geographies. They are also diverse in size economically and in population terms ranging from megacities such as Karachi, large Indian cities such as Chennai, to smaller cities such as Zaria in Nigeria.
risks and opportunities
� Risks to water and/or food supply systems within catchments could potentially endanger their ability to deliver basic services and affordable food to their residents.
� For cities close to important natural habitats, urban expansion and consumption patterns will need to be
managed carefully to avoid destruction of important fauna and flora, as well as natural systems which regulate the local biosphere and delivery of ecosystems.
� The protection and management of natural habitats will need to be considered alongside strategies for boosting food production within the urban catchment to ensure that the clearing of land for agriculture does not undermine objectives to protect fragile habitats.
� Given the natural constraints facing these cities, opportunities exist to innovate by finding ways to conserve and improve efficiency in the use of water, boost agriculture yields or promote urban agriculture, and treat natural habitats as assets to boost long term urban prosperity, for example, by promoting eco-urban-tourism.
� 15 cities
� Risks to water, food security, or natural habitats
� Diverse in location, climate zones, physical geography, and population and economic size
Key characteristics
Human Influence Index:Type 3 cities with the most significant human influence on ecosystems
Chennai (Madras) - India Faisalabad - Pakistan Ahmadabad - India Kota - IndiaZaria - Nigeria
27.4
huMAn inFLuen
Ce in
Dex
27.4
huMAn inFLu
enC
e inD
ex
25.9
huMAn inFLu
enC
e inD
ex
24.9
huMAn inFLu
enC
e inD
ex
25.6
huMAn inFLu
enC
e inD
ex
Karachi - Pakistan Hyderabad - Pakistan Nagpur - India Bhopal - IndiaVisakhapatnam - India
huMAn inFLu
enC
e inD
ex
huMAn inFLu
enC
e inD
ex
24.1
huMAn inFLu
enC
e inD
ex
23.8 23.4 22.4
huMAn inFLu
enC
e inD
ex
23.3
huMAn inFLu
enC
e inD
ex
The Human Influence Index (HII) is a measure of the direct current human influence on terrestrial ecosystems based on data sets such as the impact of human settlement (population density, built-up areas) and access to ecosystems (roads, railroads, navigable rivers, coastline). Scores range from 0 (min) to 64 (max). This indicator has not been used for comparative purposes in the typology assessment as it is heavily correlated with the size of a city.

Future Proofing Cities | 33
Atkins in partnership with
karachi
Karachi has high risks from water and food scarcity. Food production in its urban catchment is limited by arid conditions. The rural parts of the Karachi region contain a number of agricultural zones where vegetables, fruit and animal fodder are produced, but production is constrained by shortage of groundwater. Also, herding rather than agriculture has been the main activity of the rural population.
During the 2000s, agricultural activity expanded in the areas around Kathore and Shah Murad-Gadap but the main agricultural areas around the Malir Oasis and the Lyari Belt contracted as a result of urban expansion and severe shortage of groundwater. Today, much
karachiGdP per capita (2010): US$ 4,975 (PPP)Population (2010): 13.12 millionPercentage of the city catchment at drought risk: 100%Percentage of city catchment available for agriculture: 32% Population density: 5,234 persons per sq.km Percentage of the city catchment urbanised: 4.4%
of the vegetables and animal fodder cultivated in the municipal region is instead produced using raw sewage. Nationally, food imports for Pakistan as a percentage of total exports are very high versus the benchmark average of our sample of 129 cities (20.3 per cent vs 10.3 per cent).
Located in a desert area, Karachi suffers from chronic water shortages and constantly struggles to make supply meet demand. Most water is drawn from two sources, the Indus River at a 100 km distance and the Hub dam located about 35 km away. In order to meet needs, water drawn from these sources may have to increase considerably in coming years. However, drawing water from
greater distances will be more costly and also impact adversely on the city’s energy profile. Karachi already has a relatively high-energy use and is under the threat of energy scarcity. There has been no addition in electricity generation since 1998 and demand now outweighs supply, making it necessary to resort to load shedding during peak hours. Both water and power shortages have on a number of occasions led to violent protests and riots in the city.12
12 CdGK (2007)
This map shows the size and balance of the three risk drivers relevant to Type 3 cities: water scarcity, food security, and risks to natural habitat. All these cities pass critical thresholds in relation to these risks (see Appendix 1).
water-Food Nexus: This sub-group of cities in Pakistan and parts of India have high risks from water and food scarcity due to their arid and semi-arid conditions. Karachi has high risks from water and food scarcity with 100 per cent of its urban catchment at risk of drought and only 32 per cent of its catchment available for agriculture due to arid conditions. Recently experts have warned of the threat of famine in Pakistan in the future because irrigated lands are being reduced due to shortage of water. This could impact Hyderabad, Karachi, Quetta, and Faisalabad.
water security: This sub-group of cities have significant risks to water security due to drought. For example, Bhopal, and Nagpur have over 60 per cent of their urban catchments at significant risk of drought. Drought has recently hit Nagpur and the government has sanctioned water conservation measures. This has also impacted some agricultural crops such as the orange crop.
The Forest-Food Nexus: This sub-group of cities have high percentages of bio-diverse virgin rainforest within their catchments as well as limited land available for agriculture posing risks to their food security.
The food risk profile for coastal cities needs to be interpreted with care as the catchment includes marine areas which may be rich in seafood. Coastal cities are also often hubs for regional food distribution and logistics systems (e.g. Danang, Chennai, Visakhapatnam).This issue is not included in this analysis due to data availability.
Profile of cities with risks to regional support system(s)
Pakistan
© r
aja
isla
m/g
etty
imag
es
Woman carrying wooden logs on outskirts of karachi INCREASING lEVElS OF RISK
Quetta - Pakistan
Karachi – Pakistan
Hyderabad - Pakistan
Zaria - Nigeria
Visakhapatnam - India
Kota - India
Faisalabad - Pakistan
Rajkot - India
Nagpur - India
Aurangabad - India
Bhopal - India
Chennai (Madras) - India
Lubumbashi - DRC
Kananga - DRC
Da Nang - CP - Viet Nam
RISK
TO
wAT
ER S
ECU
RITy
RISK
TO
FO
Od
SEC
URI
Ty
RISK
TO
NAT
URA
l H
AbI
TAT

Cities with regional support system(s) at risk (food, water, natural habitat)
Zaria (Nigeria): Northern Nigeria is a climatic and ecologically fragile zone and has historically suffered from episodes of drought and famine.
Cape Town (South Africa): Cape Town is an outlier city as it not only has a relatively high energy and carbon footprint but is also at significant risk of drought. In 2010, for example, the southern Western Cape in South Africa was in the grips of the worst drought for 150 years. Over the past six decades, there has been a drought cycle every six to seven years in Cape Town which can bring in water restrictions.
There is a sub-group of cities located inland in the forest regions of the Congo and Vietnam with high percentages of biodiverse virgin rainforest within their catchments. These include Kananga and Lumbashi in the Democratic Republic of Congo and Da Nang in Vietnam. This acts as a crucial asset by providing carbon sequestration services as well as supporting local livelihoods and ecosystem services. As a result of their geography these cities paradoxically often have limited land available for agriculture posing risks to their food security. These cities risk damaging their forests if urban expansion, the clearing of land for agriculture, and the consumption patterns of forest products are not managed carefully (including at national level). The cities tend to be located in the tropics with exceptionally high rainfall and as such do not experience water scarcity issues. Da Nang is an outlier in the urban typologies because of its specific geographic location. The city has close to a million people and is located close to a tract of virgin rainforest rich in biodiversity which limits its ability to expand the surrounding area for food production without damaging important habitats. But unlike many other cities it is also close to the coast and is at significant risk of flooding and cyclone activity.
Exploring options for accessing global funds currently being channelled at national level for protecting forests (so-called schemes to Reduce Emissions from Deforestation and Degradation or REDD+) may be an option these cities find worth exploring.
The populations of Kisangani and Lumbashi in the Congo Basin are expected to almost double by 2025, placing pressure on the surrounding virgin rainforest
Lubumbashi - DRCKananga - DRC
Forest cities: The Forests-Food Nexus and REdd+ financing
0.5
1.0
1.5
2.0
2.5
3.0
2025
2025
20102010
Mill
ions
34 | Future Proofing Cities

Visakhapatnam (India): Visakhapatnam in India has significant risks to its water and food security with 93 per cent of its urban catchment at risk from drought and only 44 per cent of its catchment available for agriculture. However, the city is also an outlier in the type classification as it also has relatively high carbon emissions at 2.25 tonnes per capita and a high level of urban sprawl. Density, for example, is very low at just over 1,600 people per square km.
legend
Type 1 Cities – Energy intensive sprawled cities with high carbon footprints
Type 2 Cities – Cities with major climate hazards
Type 3 Cities – Cities with risks to regional support system(s)
Type 5 Cities – Cities with low current risk profile
Unknown risk type – Cities with unknown climate risks due to data availability
Type 4 Cities – Cities with multiple risks
base map: This shows the anthropological biomes, which describes the terrestrial biosphere in its contemporary, human-altered form using global ecosystem units defined by global patterns of sustained direct human interaction with ecosystems.
Source: Adapted from CIESEN.
Croplands Rangelands
Forest wilderness Urban
Village agriculture
Future Proofing Cities | 35

36 | Future Proofing Cities
Atkins in partnership with
Mainly concentrated in Thailand, India, Pakistan, and Indonesia, these cities are both at risk from major climate hazards and have relatively high energy and carbon intensities. A significant number of these cities also face risks to their water security, food security, or natural habitats. This is a diverse group of cities containing several megacities such as Delhi, Mumbai, Kolkata, emerging megacities such as Jakarta, and medium to smaller cities such as Peshawar in Pakistan.
risks and opportunities
� Multiple risks from climate change combined with energy and carbon intensity patterns of development, exacerbated by urban sprawl.
� As for Type 2 cities, risks from climate change are likely to grow over time. As with Type 1 cities many have locked or risk locking themselves into energy and carbon intensive patterns of urban development.
� Some cities within this group have risks to their regional support systems which could endanger their ability to deliver basic services and affordable food to their residents.
� Opportunities to find innovative ‘win-win’ or ‘triple-win’ solutions to reduce energy and carbon intensity, boost climate resilience, and protect natural support systems within their urban catchments (see Chapter 4).
� 39 cities
� High energy and carbon footprints, and significant levels of urban sprawl due to low urban density and high risk of flooding
� A wide range of cities within this type also face significant additional risks from cyclones and landslides, risks to water, food security, or natural habitats
� Diverse in location, climate zones, physical geography, and population and economic size
Key characteristics
Cities with multiple risks
© E
d Pr
itcha
rd/G
etty
Imag
es
Bangkok, Thailand

Future Proofing Cities | 37
Atkins in partnership with
sec
The metropolitan area of Bangkok produces almost 30 million tons of CO2 emissions per year. The city has 6.8 million cars and some estimates suggest that the transport sector consumes an equivalent of 21 million tons of CO2 annually. Bangkok also has a high level of electricity consumption - mostly due to lighting and air-conditioning. A large amount of energy is also consumed in the industrial zones outside of the city.13
Energy use is exacerbated by the city’s tendency towards urban sprawl. Since the old city centre on Rattanakosin Island holds the Grand Palace, temples, government buildings and large public spaces, construction there is subject to strict rules and expansion is limited. However, outside the historic centre the city is growing, with most expansion taking place in the metropolitan outskirts. Bangkok is growing particularly rapidly on
bangkok
bangkokGdP per Capita (2010): $25,395 Population (2010): 6.98 millionCarbon emissions per capita: 4.19 tonnesPercentage of the city extent at flood risk: 62% Percentage of the city catchment at drought risk: 19.9%Population density: 1,066 persons per sq.km Percentage of the city catchment urbanised: 10.4%Human Influence Index: 33.0
its fringes, with housing stock in the period 1997-2007 increasing by 2 per cent annually (mainly in the east and north); urbanisation is already spilling over into neighbouring provinces. Current patterns of urbanisation have contributed to a worsening energy profile, rising levels of pollution and congestion through increased car travel and problems of inadequate infrastructure provision.14
Urban expansion has also led to increasing settlement in flood-prone plains, elimination of surrounding rural farmland and plantations, replacement of agrarian ecologies with housing and industry and the diminishing of traditional water-based settlements.
Bangkok also faces significant challenges from climate change, in terms of rain, floods and increased temperatures. Bangkok is located in a flat region in the Chao Phraya River Basin delta, where increases in rainfall
and rising sea levels in combination with land subsidence put the city at risk of flooding. Floods in the Bangkok municipal area are caused both by upstream runoff, heavy rainfall and a tidal effect and they repeatedly affect the urban region. In 2007, it was estimated that around 900,000 people in Bangkok were at risk of flooding and that this could increase to over 5 million by 2070. The corresponding economic loss has been calculated to $39 billion, or a tremendous $1.1 trillion by 2070.15 This loss is mainly created through damage of more than a million buildings and impacts on commerce and industry through loss of income.
Flooding may lead to increased risk of injury and disease borne by mosquitoes as well as water-spread illnesses such as diarrhoea, dengue fever, pneumonia, tuberculosis, typhoid and measles. Effects of flooding also include coastal erosion; the shoreline of Bang Khun Thian district has eroded by over 760 m, impacting severely on local livelihoods. Ecosystem threats include the natural and anthropogenic degradation of mangrove forests in the coastal area. Apart from losses in biodiversity and capacity to act as stock for fisheries, the buffer function originally played by the mangrove strip has largely been lost. Climate change in the form of altered atmospheric temperatures may also have an effect on growth of crops, which could lead to impacts on food-security or on the macro-economy.
13 bMA (2007)
14 world bank (2009)
15 UNEP (2009)
Cities with multiple risks
This map and the chart shows the size and balance of the nine risk drivers relevant to Type 4 cities. These cities pass critical thresholds in relation to these risks (see Appendix 1).
High carbon and energy footprints combined with a significant risk of flooding are the primary risk drivers for all of these cities. A significant number of these cities also face other risks. For example, Hanoi has significant risk of cyclones, Bogor and Bandung landslides, and Pekan Baru risks to its virgin rainforests. A significant number of Indian cities have risks to water security, and many cities within this group have risks to food security due to limited pasture and farmland within their urban catchments.
Many smaller cities have risk profiles with higher levels of severity than the larger megacities. 32 out of the 39 cities within this type have a population of fewer than five million people.
INCREASING LEVELS OF RISK
legend
Carbon emissions
Energy use
Level of urban sprawl
Flood risk
Landslide risk
Cyclone risk
Risk of water scarcity
Risk to food security
Risk to natural habitat
Thailand
© J
erem
y W
oo
dh
ou
se/g
etty
imag
es
bangkok, thailand – skyline
Delhi - India
Hyderabad - India
Mumbai (Bombay) - India
Kolkata (Calcutta) - India
Ludhiana - India
Asansol - India
Vijayawada - India
Jalandhar - India
Islamabad - Pakistan
Jakarta - Indonesia
Ho Chi Minh City - Vietnam
Vadodara - India
Meerut - India
Peshawar - Pakistan
Amritsar - India
Ranchi - India
Gwalior - India
Aligarh - India
Varanasi (Benares) - India
Allahabad - India
Malang - Indonesia
Srinagar - India
Gujranwala - Pakistan
Surabaya - Indonesia
Medan - Indonesia
Jamshedpur - India
Dhanbad - India
Semarang - Indonesia
Bhiwandi - India
Jammu - India
Bangkok - Thailand
Hà Noi - Vietnam
Bandung - Indonesia
Moradabad - India
Pekan Baru - Indonesia
Bareilly - India
Bogor - Indonesia
Guwahati (Gauhati) - India
Durban - South Africa

legend
Type 1 Cities – Energy intensive sprawled cities with high carbon footprints
Type 2 Cities – Cities with major climate hazards
Type 3 Cities – Cities with risks to regional support system(s)
Type 5 Cities – Cities with low current risk profile
Unknown risk type – Cities with unknown climate risks due to data availability
Type 4 Cities – Cities with multiple risks
Southern Indian Cities: A number of cities in the more southerly part of India including Mumbai, Hyderabad, Vijayawada, and Bhiwandi have their entire urban area at significant risk of flooding. In 2011, heavy rainfall left parts of Mumbai underwater, flooding homes, closing schools and badly affecting train services. Drought conditions have also recently hit the area surrounding Mumbai.
Cities with multiple risks
durban (South Africa): Durban has high levels of energy use at nearly 3,000 kg of oil per capita and carbon emissions at nearly nine tonnes per person. Low levels of population density indicate significant levels of urban sprawl. Due to its climate conditions, Durban is also at significant risk of flooding during the wet season. In the run-up to the UN climate conference in South Africa in 2011, Durban was deluged in torrential rainfall causing widespread flooding which destroyed 700 houses, and left thousands homeless along the east coast.
38 | Future Proofing Cities

Indonesian Cities: There are a significant number of cities across Indonesia facing multiple environmental risks. All these cities have relatively high energy use, carbon emissions, and levels of urban sprawl. They are also at significant risk of flooding, with Bandung and Bogor at risk from landslides. Constraints on land available for agriculture within the urban catchment is an issue for many of these cities given the high population density of the main Indonesia island of Java where 60 per cent of Indonesia’s population of nearly 250 million people live. Land available for agriculture is particularly challenging for Pekan Baru on Sumatra which is situated in a region of virgin rainforest.
Northern Indian and Pakistani Cities: Many cities across the Northern belt of India and Pakistan from Kolkata to Peshawar have relatively high energy use, carbon emissions, and levels of urban sprawl. These cities also have significant risk of flooding. Some of these cities suffer from risks to water and food security due to drought.
Cities in Upper Uttar Pradesh (India): Due to their specific climate conditions, many cities in parts of Upper Uttar Pradesh in India such as Moradabad, Bareilly, and Meerut have recently suffered from drought conditions due to the delay of Monsoon rains. However, they also suffer from flooding due to heavy rainfall when the Monsoon comes as major rivers in close proximity burst their banks.
Vietnamese Cities: Hanoi and Ho Chi Minh City in Vietnam are at significant risk of flooding and Ha Noi often suffers from cyclone activity. In 2012 scores of people were killed as typhoon Kai-Tak swept across Northern provinces of Vietnam.
Future Proofing Cities | 39

40 | Future Proofing Cities
Atkins in partnership with
Cities with a low risk profile
A small number of cities - Lilongwe and Blantyre Limbe in Malawi - currently have a relatively low risk profile, although this could rapidly change as population pressure and climate change intensify (see graph below).
Low current risks are no reason for inaction. These cities have an opportunity to do things differently by developing in a way which avoids locking themselves into long lived, poorly adapted development pathways.
� Low current risk profile which could rapidly change over time
Key characteristics
Many of the cities with a low risk profile – including those with uncertain climate risks – are projected to see rapid growth in their populations
20252010
Growth in Population 2010-2025
106%lilongwe - Malawi
106%blantyre-limbe - Malawi
85%dar es Salaam - Tanzania
53%Aba - Nigeria
53%Ilorin - Nigeria
53%benin City - Nigeria
53%Ogbomosho - Nigeria
53%Maiduguri - Nigeria
52%Port Harcourt - Nigeria
50%Kumasi - Ghana
49%lagos - Nigeria
49%Ibadan - Nigeria
Kochi (Cochin) - India 36%
Madurai - India 36%
Thiruvananthapuram - India 37%
33%Pune (Poona) - India
62%Addis Ababa - Ethiopia
unknown risk type
There are 37 cities with an unknown risk type due to a lack of comparable data on climate hazards. These include cities across some areas of South Africa, India, DRC, Ethiopia, Indonesia, Nigeria, Tanzania, Zambia, and Ghana. Some of these cities may have data available at the local level. Greater efforts should be made to collect data to inform decision-making.
However, as with low current risk cities, the absence of data and uncertainties in the incidence of climate hazards should not be an excuse for inaction. Some of these cities have significant risks in the other risk categories. For example, there are 19 cities with unknown climate risks which have significant energy and carbon footprints and high levels of urban sprawl including cities such as Johannesburg, Pretoria, Abuja, and Lusaka. There are three cities located in the Democratic Republic of Congo which have unknown climate risks but significant risks to regional support systems within their urban catchments. These include Kinshasa, Kisangani, and Mbuji-Mayi.
As outlined in further detail in Chapter 4 there are a wide range of ‘no/low’ regrets measures which can respond to climate hazards but make sense to do anyway as they respond to other environmental risks, and generate wider economic and social benefits.
Fifteen cities have relatively low energy and carbon footprints and sprawl and low risks to regional support systems including cities such as Addis Ababa, Ibadan, and Dar es Salaam. However, this situation could rapidly change as population pressures intensify.
Source: Atkins’ Urban Risk Database drawing on data from the United Nations Population Division

Future Proofing Cities | 41
Atkins in partnership with
In aggregate terms, Lilongwe in land-locked Malawi has a relatively low risk profile, partly due to its current climate conditions and partly due to historic challenges in catalysing urban expansion which has kept carbon emissions and energy use relatively low. However, risks are growing over time.
growing risks over time Economic growth projections for Lilongwe out to 2025 are modest vis-a-vis other cities in the Southern and East African region, but its population is expected to more than double by 2025. This could place pressure on carbon emissions and energy intensity, and water systems. Lilongwe also has a relatively low population density which could make the planning of mass transit options more difficult.
Food security, water security, and climate change Although Lilongwe is currently at low risk of flooding and drought, climate change projections for Malawi show an intensification of rainfall is likely across the different seasons – i.e. a wetter wet season and a drier dry season – and increasing temperatures.16
Malawi’s water is predominantly in surface water sources, which are at a greater risk from climate change than groundwater sources. Despite a relatively large surface water resource, this is concentrated in the catchment of the River Shire downstream of Lake Malawi. Availability of water across Malawi as a whole can be very low in the dry season and the country has suffered from major droughts in recent years.
LilongweGdP per capita (2010): $2051 Population (2010): 865,000Carbon emissions per capita: 0.09 tonnesPercentage of the city catchment at drought risk: 0%Percentage of city at risk of flooding: 0% Population density: 1,605 persons per sq.km
Lilongwe
A serious drought in the early months of 2005, for example, resulted in a 30 per cent drop in maize harvests compared to the previous (already poor) year. With food availability falling 20 per cent short of the expected need, President Mutharika declared a national disaster across the entire nation.17
Lilongwe has just under 40 per cent of its wider catchment available for agriculture which is relatively low compared to many other cities. This can make it more difficult to draw on food sources in the event of changes in the price and availability of food supplies which are either imported or grown in other parts of the country.
Malawi as a whole is heavily reliant on agriculture, particularly as a source of food but also for export revenues. Periodic droughts and flooding can therefore affect food security and stifle economic development. A
recent study showed that, on average, Malawi loses 1.7 per cent of its GDP each year as a direct result of droughts and flooding – equivalent to over $20 million at 2005 prices.18 Food shortages cause increases in food prices, and therefore the impact of poor harvests is felt across the country in both rural and urban areas.
With a projected increase in wet season rainfall, there is likely to be an increased risk of flooding. As well as causing damage to homes and infrastructure, it is also a major public health risk. Flooding is associated with incidence of diarrhoeal diseases, such as cholera, typhoid and dysentery, which accounts for over 20,000 deaths per year19, and mosquito-borne diseases, such as malaria, as mosquitoes breed in the standing water that forms after heavy rain.
malawi
© t
om
Co
ckre
m/g
etty
imag
es
16 McSweeney et al. (2008) 17 IdA (2009) 18 Pauw et al. (2010)19 wHO, (2009)
Lilongwe, the old town

42 | Future Proofing Cities
Atkins in partnership with
Urban typologies provide a useful snapshot of the current environmental risks facing cities on a comparable basis. This provides a starting point for identifying and prioritising packages of policy solutions and interventions to address environmental risks.
Over time the risks that these cities contribute to and face will change. It is important therefore to view environmental challenges as dynamic which can change spatially and temporally.
The urban typologies set out in this report are unlikely to change in the immediate term. However many of the factors driving change at the city level can be expected to change markedly over a 5-10 year time horizon. For example, of the 129 cities assessed as part of this project, 58 of those have seen their economies more than double in the last decade alone, placing pressure on energy and carbon footprints.
Combined with looking at urban dynamics such as projected population and economic growth rates it is therefore possible to understand better how factors such as a city’s energy, carbon, and ecological footprints might develop over time under business as usual scenarios.
It is important that cities continue to track and monitor their urban risk dynamics over time. As outlined in Chapter 1 future proofing should not be seen as an end state, but as a continuous process of better understanding the risks facing cities, the vulnerability and capacity of cities to respond to those risks, and the solutions which will derive economically, socially, and environmentally desirable outcomes.
Tracking risks over time
Illustrative urban trajectories: Current vs future risks
Over time the environmental risks that cities contribute to and face will change. It is important that cities monitor and track their urban typologies as risks change over time.
time
Changes in... Climate • Growth of economy • Growth of population • Resource discoveries • Policy (including national)
Changes in... Climate • Growth of economy • Growth of population • Resource discoveries • Policy (including national)
Energy intensive cities with significant carbon footprints
Energy intensive cities with significant
carbon footprints
Cities with a low risk profile
Cities with a low risk profile
Cities with major climate change hazards
Cities with major climate change hazards
Cities with regional support system(s) at risk
Cities with regional support system(s) at risk
Cities with multiple risks Cities with multiple risks
Futu
rePresen
t

Future Proofing Cities | 43
Atkins in partnership with
Summary
Main messages
� A wide range of environmental risks are relevant to cities in the developing world.
� The environmental risks operate on different levels from the global to the local levels.
� Regional risks such as risks to water and food security, and natural ecosystems are particularly important but are often neglected.
� Some risks such as climate change are also uncertain, but this does not mean that cities cannot act: cities can, for example, identify ‘low regrets’ solutions that deliver wider environmental, social, and economic benefits, and build in design flexibility.
� Identifying a city’s urban type – and therefore the main risks it faces – provides a good starting point for identifying the policy responses most relevant to them.
� This needs to be an ongoing process as risks change over time and cities develop.
Findings from cities assessment and typologies
� The most significant group of cities are those that drive or are impacted by multiple environmental risks: these cities will need to take action across a broad front.
� Few cities have a low risk profile: these cities have a window of opportunity to explore an alternative development path which minimises environmental risks.
� For cities with a risk profile focused around one cluster of risks – such as climate hazards - their priority will be to take focused action to tackle those risks.

44 | Future Proofing Cities
Atkins in partnership with

Atkins in partnership with
Future Proofing Cities | 45
VuLnerAbiLity AnD CAPACity oF Cities to resPonD to risks
03

46 | Future Proofing Cities
Atkins in partnership with

Atkins in partnership with
Future Proofing Cities | 47
This chapter maps the urban vulnerabilities and the capacity of the 129 cities featured in Chapter 2 to respond to environmental risks. This focuses on the vulnerability of the urban poor, and the role that urban governance, planning, finance, and delivery structures and institutions play in shaping the capacity of cities to respond to risks and how these can be strengthened.
Understanding the vulnerability and capacity of cities to respond to environmental risks is important when identifying and prioritising which actions to take. This is crucial to ensure interventions reduce vulnerability to risks, can be realistically implemented, and that they help to build capacity over time by unlocking economic development and providing a focus for capacity building efforts.
IntroductionCities in the developing world differ markedly in their vulnerability and capacity to respond to environmental risks depending on their physical, social, economic, and institutional attributes.
The five urban types outlined in Chapter 2 show that cities face different environmental risks. But cities differ markedly in their vulnerability and ability to respond to risks.
A city’s vulnerability to environmental risks is shaped by a combination of their geography, infrastructure, economy and society. Each city is different in their income, assets, and location of their residents, the strength of their basic infrastructure and services, and the structure of their economies. They also differ in the absolute scale of their vulnerability and the pace at which they are changing.
Likewise, the capacity of cities or districts to manage and respond to current and potential future risks varies greatly. This depends upon their economy, institutions, skills, and resources.
the vulnerability ofcities to environmental risks and their capacity to respond to these risks is shaped by their geography, economy, society, infrastructure, institutions, and resources
the vulnerability ofcities to environmental risks and their capacity to respond to these risks is shaped by their geography, economy, society, infrastructure, institutions, and resources
An Indian girl assists her mother to collect cow dung - to be used as cooking fuel - outside a construction site at ‘New Town’ on the outskirts of Kolkata on February 26, 2010.
© D
ESH
AK
ALY
AN
CH
OW
DH
URY
/AFP
/Get
ty Im
ages

48 | Future Proofing Cities
Atkins in partnership with
Sanitation workers use a raft to help collect litter from a river in Jakarta on July 14, 2014. Many rivers in Indonesia, especially in urban areas, are polluted by household and industrial waste.©
OSC
AR
SIA
GIA
N/A
FP/G
etty
Imag
es

Atkins in partnership with
Future Proofing Cities | 49
Moving from risk to impact and opportunityUnderstanding environmental risks, vulnerability, and the capacity of cities to respond to risks can help to determine the likely impact of adverse shocks and stresses and helps identify and prioritise policy responses.
risk: as outlined in Chapter 2, we define risk broadly as the potential that the ‘activities’ of cities which drive carbon emissions and pressure on critical natural resources and ‘events’ in the form of climate hazards and external pressures on the resources used by cities will have an undesirable impact.
Vulnerability: the degree to which a city and its inhabitants are susceptible to and are likely to be detrimentally impacted by the stresses and shocks associated with climate change, resource scarcities, and damage to vital ecosystems. At the heart of all definitions of vulnerability is the notion of ‘lack of means to cope’ with the adverse impacts associated with shocks and stresses.
CAPACITy TO ACTVUlNERAbIlITy
+ +RISK
POlICy ACTION SPACE
Capacity to respond: a city’s capacity and willingness to respond positively to environmental risks. This is shaped by the economic and institutional attributes of a city and its actors, which determine the degree of its capability to respond to risks.1
1 Here it is important to draw the distinction with ‘resilience’ which the IPCC Working Group II has defined as the “amount of change a system can undergo without changing state.” In contrast, capacity to act does not assume a steady state, but focuses on a city’s ability and willingness to respond positively to risks.

There are significant differences in vulnerabilities between cities
Multi-dimensional Poverty
Urban Informality
Energy Poverty
water Poverty
Sanitation Poverty
70%
60%
50%
40%
0%
10%
20%
30%
Kano
- N
iger
ia
Mum
bai -
Indi
a
Mum
bai -
Indi
a
Mum
bai -
Indi
a
Mum
bai -
Indi
a
Jaka
rta
- Ind
ones
ia
Jaka
rta
- Ind
ones
ia
Jaka
rta
- Ind
ones
ia
Jaka
rta
- Ind
ones
ia
Mum
bai -
Indi
a
Kano
- N
iger
ia
Kano
- N
iger
ia
Kano
- N
iger
ia
Kano
- N
iger
ia
50 | Future Proofing Cities
Atkins in partnership with
Together the 129 cities assessed as part of this report have a significant number of people who are vulnerable to environmental risks. The cities have between them:
� 150 million people living in multi-dimensional poverty
� 70 million people living in energy poverty
� 30 million people water deprived
� 100 million people with poor access to sanitation.
However, not all cities are the same; cities have different vulnerabilities to environmental risks. This depends on a city’s social, economic, and physical attributes.
A focus on cities
As outlined in Chapter 1, cities are particularly vulnerable to environmental risks. As interconnected systems of infrastructure and people the functioning of cities and their prosperity are dependent on the smooth flow of critical natural resources (such as low cost energy, water, and food). The provision of basic infrastructure and services to people living in cities can be especially vulnerable to disruptions in the price and availability of these resources. And these challenges are often exacerbated by cities being located in areas vulnerable to climate change hazard risks and by stronger links emerging between environmental risks.
Urban vulnerabilityEnvironmental risks have different impacts on the urban poor depending on the vulnerability of cities to risks. Vulnerability interacts with environment risk to determine the impact on the urban poor.
2 Factors such as the non assembly of land at a local level often forces the poorest to live in informal settlements with poor access to basic services. Parallel markets for water, energy, and food can arise in these circumstances. This creates its own risks for the poorest as slum lords and organised gangs step into the vacuum created by the lack of formal markets for these goods and services.
“in the decades tocome, climate changemay make hundreds ofmillions of urbanresidents – and inparticular the poorestand most marginalized– increasinglyvulnerable to floods,landslides, extreme weather eventsand other naturaldisasters.”
ban ki-moon, united nations secretary-general, 2011
“in the decades tocome, climate changemay make hundreds ofmillions of urbanresidents – and inparticular the poorestand most marginalized– increasinglyvulnerable to floods,landslides, extreme weather eventsand other naturaldisasters.”

Atkins in partnership with
Future Proofing Cities | 51
Measuring urban vulnerabilityThere are numerous factors that can be used to assess urban vulnerability. Three core factors were used to assess the vulnerability of the cities featured in this report:
“the poor are particularly vulnerable to climate change andnatural hazards due to where they live within cities, and the lack of reliable basic services.”
World bank, 2011, Climate Change, Disaster risk, and the urban Poor
“the poor are particularly vulnerable to climate change andnatural hazards due to where they live within cities, and the lack of reliable basic services.”
The proportion of people living in Multi-Dimensional Poverty (MDP) and levels of inequality has a significant bearing on the vulnerability of people to environmental shocks and stresses. Rising resource prices hit the urban poor disproportionately because they spend a larger share of their income on energy, water, and food. The urban poor are also expected to be hit first and hardest by the effects of climate change – they do not have the assets to protect themselves against stresses and shocks and poor residents tend to be located in the most vulnerable areas and in poor quality housing.
High levels of inequality often indicates large swathes of population prevented or restricted from the fulfilment of their basic needs as reflected in inequalities in space, economic opportunities, and health and education across different gender, age, and ethnic groups. Shocks and stresses exacerbate these existing inequalities.
Poverty and inequality were measured by creating an aggregate poverty and inequality index using a weighted average of multi-dimensional poverty and income inequality. Multi-dimensional poverty is a metric which is designed to measure acute poverty by measuring the proportion of people suffering multiple deprivations in living standards, health, and education. Inequality is captured using the well known gini co-efficient which measures inequalities in income.
Poor existing provision of basic infrastructure and services, including electricity, water, and sanitation, are well known indicators of urban vulnerability. Cities not able to deliver basic infrastructure and services to large segments of their populations will be particularly vulnerable to stresses and shocks to the flows of critical resource supplies. The proportion of people living in informal settlements is also a good proxy for the proportion of people without access to basic infrastructure and services.2
Weakness of basic services was measured by creating an aggregate access to basic services index using a weighted average of the percentage of the population living in urban settlements, the percentage of the population deprived of access to electricity, the percentage of the population deprived of access to water, and the percentage of the population deprived of access to sanitation.
Whilst the concentration of urban dwellers can have benefits for efficient service delivery and the workability of solutions to reduce carbon emissions, in combination with high levels of urban poverty and urban informality, density can act as a double edged sword by making significant numbers of people vulnerable to systemic stresses and shocks.
Urban form was measured by ranking cities based on their population density (people per km2). It is assumed that the denser the city, the greater the vulnerability, particularly to climate and resource risks, but this factor is not accorded the same weighting in assessing urban vulnerability as one and two given the complex role density can play in determining vulnerability to diverse stresses and shocks (see Appendix 1).
other factors
As outlined in further detail in Chapter 2 these factors were identified based on a review of the literature on urban vulnerability and a range of criteria including data availability.
Other factors such as the structure of urban economies and the extent to which their competitiveness is reliant on the availability of low cost energy, water, and food inputs, as well as the location of people, infrastructure assets, and existing strategic hazard defences (such as flood defences) are also key but are covered in less detail in this report due to the availability of comparable high quality data.
1: Poverty and inequality
2: basic infrastructure and services
3: Urban form

Source: Atkins
How risk and vulnerability interact
The potential impact of environmental risks is a combination of the risks cities face and their level of vulnerability.
The table below provides a snapshot of some of the ways the environmental risks facing different types of cities intersect with existing vulnerabilities to impact the urban poor.
Urban poor spend high percentage of income on energy – intermittency in supply and rising energy prices has significant impacts on livelihoods.
In cities with significant levels of sprawl, the urban poor are often housed in low cost locations around the urban fringe at greater distances from employment centres. The range of transport choices available and their cost often means that employment opportunities are not easily accessible to the poorest.
The urban poor have limited assets and ability to withstand climate related shocks.
Poorer groups are often employed in agriculture or low paid jobs in industries that can be impacted by flooding.
Poorer groups normally have more limited access to health care – climate hazards can result in widespread outbreak of diseases.
The urban poor often have to rely on informal systems of water supply (which are high cost) or water resources which are poor quality.
The urban poor spend high percentage of income on food and water – intermittency in supply and rising prices has significant impacts.
Poor often rely on natural ecosystems the most e.g. for fuel and food – leading to degradation or collapse which can impact livelihoods.
The above issues may be less immediately relevant, but will become more pertinent if risks grow over time.
A mixture of the above depending on the most significant environmental risks.
High levels of poverty and inequality
Energy and carbon intensive cities
Cities with major climate change hazards
Cities with regional support system(s) at risk (food, water, natural habitat)
Cities with multiple risks
Cities with a low risk profile
The Impact of environmental risks:
52 | Future Proofing Cities

*Data on multi-dimensional poverty and inequality is unavailable for Khartoum. The other indicators are used to provide an overall assessment of aggregate vulnerability.
The above issues may be less immediately relevant, but will become more pertinent if risks grow over time.
The above issues may be less immediately relevant, but will become more pertinent if risks grow over time.
Intermittency in supply and rising energy prices compounds existing weaknesses in the supply and distribution network.
Informality and insecure tenure means that dwellings are not energy efficient and rely on sources of supply which are not clean or reliable.
Poor access to electricity grid can lead to development of informal markets with poor citizens forced to pay higher energy prices – this is exacerbated by intermittency in supply and rising energy prices.
Informal settlements are often located on land on marginal areas such as slopes or on river flood plains, which increases their vulnerability to climate change hazards.
Poor water supply and sanitation systems obstruct the drainage needed to respond to climate related disasters such as flooding – this fosters the spread of diseases.
Storm surges in coastal areas can lead to saltwater intrusion – this can significantly reduce the productivity of agricultural land, impacting the livelihoods of poor agricultural labourers.
Poor access to water and sanitation already impacts the livelihoods of the urban poor - this is exacerbated by intermittency in the supply and rising prices of water with potentially significant health impacts.
The impacts of drought on agriculture are amplified by inefficient irrigation systems which do not conserve water use.
A mixture of the above depending on the most significant environmental risks.
Disruptions to energy supply impacts large numbers of the urban poor when they are concentrated in high density pockets of the city with poor reliability of existing energy supply.
In contrast, sprawled cities are less able to support a viable public transport system due to dispersed population: this impacts on the extent to which the poor can access low cost transport options to reach employment opportunities.
Climate hazard risks such as localised flooding potentially impact large numbers of urban poor living in close proximity to each other if unprepared, especially in informal settlements.
Concentration of impacts in dense settlements with inadequate supply or at unaffordable levels can lead to civil unrest and rising poverty.
Disruptions to water, food, or other critical supplies potentially impacts large numbers of urban poor living in close proximity to each other.
A mixture of the above depending on the most significant environmental risks.
Urban form and structurePoor basic infrastructure and services
the vulnerability of cities in the developing world to environmental risks
Whilst the five urban types have common environmental risks, they face very different vulnerabilities to those risks. Risk combined with vulnerability helps determine the impact that environmental risks are likely to have on these cities.
This graph maps the vulnerability of cities in the developing world to environmental risks. This shows the size and balance of the three factors driving overall vulnerability: poverty and inequality, strength of basic infrastructure and services, and urban form.
This analysis is useful for determining the cities most vulnerable to environmental risks and may require targeted support to reducing vulnerabilities. For cities with high levels of vulnerability to environmental risks a premium should be placed on responses which not only target the risks they face but also benefit the urban poor, strengthen basic services, and reach large numbers of deprived people. Cities with lower levels of aggregate vulnerability may be able to focus on responses which target wider liveability and residents from broader socio-economic groups.
Future Proofing Cities | 53
legend
Inequality and poverty index
Access to basic services index
Density
Bangkok - ThailandSurabaya - Indonesia
Semarang - IndonesiaMedan - IndonesiaMalang - Indonesia
Bogor - IndonesiaTiruchirappalli - India
Chandigarh - IndiaHo Chi Minh City - Viet Nam
Hà Noi - Viet NamKampala - Uganda
Nairobi - KenyaUjung Pandang - Indonesia
Pekan Baru - IndonesiaPalembang - Indonesia
Jakarta - IndonesiaBandung - Indonesia
Bandar Lampung - IndonesiaTiruppur - India
Thiruvananthapuram - IndiaSalem - India
Madurai - IndiaLudhiana - India
Kozhikode (Calicut) - IndiaKochi (Cochin) - India
Jalandhar - IndiaCoimbatore - India
Amritsar - IndiaKumasi - Ghana
Accra - GhanaHai Phòng - Viet Nam
Da Nang - CP - Viet NamDelhi - India
Chennai (Madras) - IndiaVereeniging - South Africa
Pretoria - South AfricaPort Elizabeth - South AfricaJohannesburg - South Africa
Ekurhuleni (East Rand) - South AfricaDurban - South Africa
Cape Town - South AfricaPeshawar - Pakistan
Islamabad - PakistanGujranwala - Pakistan
Visakhapatnam - IndiaVijayawada - India
Surat - IndiaMysore - IndiaJammu - India
Bhiwandi - IndiaMultan - Pakistan
Faisalabad - PakistanIlorin - Nigeria
Vadodara - IndiaSrinagar - IndiaSolapur - IndiaRajkot - India
Pune (Poona) - IndiaNashik - IndiaNagpur - India
Hubli-Dharwad - IndiaBangalore - India
Aurangabad - IndiaAhmadabad - India
Rawalpindi - PakistanLahore - Pakistan
Karachi - PakistanHyderabad – PakistanOgbomosho - Nigeria
Lagos - NigeriaIbadan - Nigeria
Maputo - MozambiqueMumbai (Bombay) - India
Hyderabad - IndiaAddis Ababa - Ethiopia
Kinshasa - DRCLusaka - Zambia
Quetta - PakistanKathmandu - Nepal
Blantyre-Limbe - MalawiGuwahati (Gauhati) - India
Asansol - IndiaBenin City - Nigeria
Mombasa - KenyaRajshahi - Bangladesh
Khulna - BangladeshDar es Salaam - Tanzania
Kigali - RwandaPort Harcourt - Nigeria
Aba - NigeriaMatola - Mozambique
Kolkata (Calcutta) - IndiaDhaka - Bangladesh
Chittagong - BangladeshKaduna - Nigeria
Jos - NigeriaAbuja - Nigeria
Varanasi (Benares) - IndiaRaipur - India
Kota - IndiaJamshedpur - India
Jabalpur - IndiaIndore - India
Gwalior - IndiaDurg-Bhilainagar - India
Dhanbad - IndiaBhubaneswar - India
Bareilly - IndiaAllahabad - India
Zaria - NigeriaRanchi - IndiaPatna - India
Moradabad - IndiaMeerut - India
Lucknow - IndiaKanpur - IndiaJaipur - India
Bhopal - IndiaAligarh - India
Agra - IndiaKano - NigeriaJodhpur - India
Lubumbashi - DRCKananga - DRC
Lilongwe - MalawiMaiduguri - Nigeria
Mbuji-Mayi - DRCKisangani - DRC
Khartoum - Sudan*
INCREASING lEVElS OF VUlNERAbIlITy

Across the 5 cities assessed in the democratic Republic of Congo, on average over 63% of people live in multi-dimensional poverty.
Cities and Multi-Dimensional PovertyThe proportion of people living in Multi-Dimensional Poverty (MDP) has a significant bearing on the vulnerability of people to environmental shocks and stresses. This map shows the percentage of people living in multi-dimensional poverty. The size of the bubble relates to the percentage of people living in multi-dimensional poverty.
54 | Future Proofing Cities

Across the 6 cities assessed in Indonesia, on average 20% of people live in multi-dimensional poverty.
Across the 59 cities assessed in India, on average over 48% of the population live in multi-dimensional poverty.
legend
Proportion of the population living in multi-dimensional poverty
Number of people living in multi-dimensional poverty
Source: Atkins Urban Risk Database
Cities with the greatest numbers of vulnerable people
Some of the largest cities in South Asia still have the most significant numbers of people vulnerable to environmental risks. In contrast to the proportion of people living in poverty, this map shows the numbers of people living in multi-dimensional poverty. In Kolkata, Mumbai, Karachi, and Dhaka alone, 32 million people live in multi-dimensional poverty.
Hyderabad (Pakistan)
lahoredelhi
Karachi
bangalore
Mumbai
Hyderabad (India)
dhaka
Kolkata
Future Proofing Cities | 55

56 | Future Proofing Cities
Atkins in partnership with
Multi-dimensional Poverty
These examples from Maputo, Karachi, Bangalore, and Bangkok illustrate how environmental risks interact with vulnerability to impact the urban poor. The radial diagrams show the percentage of the urban population living in multi-dimensional poverty, informal settlements, and are deprived of access to a range of basic services.
10%
20%
30%
40%
50%
60%
70%
80%
90%
100%
Maputo (Mozambique)
10%
20%
30%
40%
50%
60%
70%
80%
90%
100%
bangalore (India)
Energy Poverty
Water Poverty
Sanitation Poverty
Urban Informality
Multi-dimensional Poverty
Energy Poverty
Water Poverty
Sanitation Poverty
Urban Informality
3 CED (2011) 4 Kinuthia, Njenga & Blanco (2009)
Informal settlements continue to make up a significant proportion of the populations of cities in the developing world. In Maputo 70-80 per cent of the urban population live in informal settlements with limited access to water, sanitation and health facilities. Many informal settlements are located in vulnerable areas, such as on flood plains, slopes, river valleys and areas close to sewers and landfills. Although Maputo is located on high ground, several areas in the city are vulnerable to flooding, including informal settlements in the centre of the city, such as Mafalala, Luis Cabral, Chamanculo and Xipamanine, which are some of Maputo’s most densely populated areas.
Peri-urban informal settlements have also been extending to lowlands and marshy ground where risk of flooding is especially high. Poor residents in informal areas are, moreover, likely to have limited capacity to deal with these threats and they are also threatened by the prospect of relocation.
Poor infrastructure systems increase the vulnerability of slums to climate change impacts. For example, the lack of appropriate sanitation infrastructure worsens the effects of flooding, both in terms of obstructing drainages and fostering the spread of diseases, as does poor waste management which leads waste to be spread throughout the cities during flooding, increasing the risk of spread of diseases.
In informal settlements, a very high percentage of children hospital admissions are usually related to diarrhoea, which is a problem that may be exacerbated by flooding. In Maputo the rains and cyclones of 2000 that affected up to one million people caused outbreaks of dysentery and cholera, as well as increased vulnerabilities to vector-borne diseases such as malaria. In addition, climate migrants from other parts of Mozambique to the city are likely to settle in already dense slums, which would exacerbate the already extreme spatial inequality.4
Maputo – The vulnerability of slum dwellers to climate hazards
Comparatively Bangalore is less vulnerable than many cities to environmental risks, but relatively high levels of inequality – driven by rising incomes in certain sectors (notably the IT industry and outsourcing) and stagnation in traditional sectors – has left a growing proportion of people living in informal areas, rising from 23 per cent in 2001 to 30-40 per cent in 2010. These settlements are affected by deficiencies in housing and service provision. Failure of authorities to provide services have led to formal and informal markets catering to different groups of residents, with poor citizens often forced to pay higher rates for basic services.
High levels of informality and inequality is creating vulnerabilities to disruptions in the supply and rises in the price of critical resources such as energy with demand exacerbated by the growing consumption of high-income groups set against the urban poor suffering from poor energy access. Energy supply in Bangalore is already both expensive and scarce, and hydropower-generated electricity tends to be affected by episodic growth and weather events, such as irregular rainfalls and monsoon cycles, leading the city to periodically suffer from shortages and power cuts.3
bangalore – The impact of inequality in exacerbating vulnerability to energy prices
The impact of environmental risks on the urban poor – selected examples

Atkins in partnership with
Future Proofing Cities | 57
10%
20%
30%
40%
50%
60%
70%
80%
90%
100%
10%
20%
30%
40%
50%
60%
70%
80%
90%
100%
Karachi (Pakistan)
bangkok (Thailand)
Multi-dimensional Poverty
Energy Poverty
Water Poverty
Sanitation Poverty
Urban Informality
Multi-dimensional Poverty
Energy Poverty
Water Poverty
Sanitation Poverty
Urban Informality
5 Hakeem (2003) 6 Ahmed & Sohail (2003) 7 UN-HABITAT (2008) 8 UN-HABITAT (2008)
Karachi has risks to its food and water security. Karachi’s vulnerability to these risks is heavily influenced by relatively high levels of multi-dimensional poverty (56 per cent), significant numbers of people living in informal areas (47 per cent), and a high population density (at over 5,200 people per square km).
In recent years food prices, especially of wheat and rice, have been fluctuating widely. As a result, food insecurity has become widespread among very low-income and low-income households. In 2003, as much as 83 per cent and 51 per cent of families in these income groups were suffering from food insecurity and among very low income groups, and hunger as a result of lack of money was experienced by 37 per cent.5
Although a relatively small proportion of the population are currently water deprived vis-a-vis other cites (10.3 per cent versus an average of 14.4 per cent), Karachi’s water transmission system is about forty years old with corroded pipes that
prevent effective distribution. Out of the supplied amount around 35 per cent is lost through leakage and friction.
Water theft at legal and illegal hydrants, where water is diverted from settlements and illegally supplied through tankers, has also been identified as a main source of water shortages in the city. Water quality in distribution tends to be low; a survey from the early 2000’s indicated that over 75 per cent of samples from the system were below WHO standards. As much as 38 per cent of the population do not have access to sanitation and alternative water access includes private water hydrants, boreholes or pushcart vendors.6
Poor infrastructure adds further vulnerability to the risk of water scarcity, as it makes citizens more severely affected by supply shortages. Even for the proportion of residents that have access to water, supply is disrupted and is often only available a number of hours per day.
Karachi – The vulnerability of the urban poor to food and water scarcities
Women’s vulnerability to shocks and stresses
Across the developing world, women tend to be more vulnerable to the impacts from environmental risks in particular resulting from: higher unemployment rates, lower rates of education, more limited access to health information and higher vulnerability to disease (an example of this is HIV/AIDS, where women in some age groups suffer from over three times the infection rates of men).8
bangkok – The vulnerability to climate hazards
In cities such as Bangkok, which is comparatively less vulnerable to environmental risks than many other cities due to its higher income levels, low levels of poverty, and strong basic service infrastructure, there can be an apparent paradox of vulnerability; wealthier cities might often have lower human vulnerability but they do have significant economic assets which are vulnerable to environmental risks. In 2011 many of Bangkok’s industrial areas were flooded, causing factories to cease operations for months, which left people without jobs and led to economic insecurity. However, on a closer look, many of the factory workers are poor immigrants from Cambodia, Laos and Burma, who often live outside the social security system and tend to be especially vulnerable to such impacts.
the vulnerability of agricultural workers living in cities
For some cities as many as 80 per cent of the population can be involved in agriculture, and from the total agricultural population significant percentages of people rely on it for subsistence, making them particularly vulnerable to natural disasters.7 In addition, many peri-urban settlements are located on land on slopes or near rivers, which increases their vulnerability to disasters. Shocks to agricultural production caused by floods or hikes in world prices, thus, have a major impact on food security and urban livelihoods.
Alongside the challenges faced by cities or districts, there are vulnerable groups.

58 | Future Proofing Cities
Atkins in partnership with
Cities also have quite different capacities to respond to environmental risks. In particular, cities have very different urban economies and population dynamics which help to determine their capacity to respond to current and future challenges. Other crucial factors include the strength and legitimacy of a city’s institutions and its actors in the public, private, and third sectors.
Here we focus on four cross-cutting and interrelated issues: the strength of the urban economy, urban governance, urban planning, urban finance and delivery. These issues overlap and interact
Ability of cities to actCities in the developing world have quite different capacities to respond to risks. In particular, the strength of governance, planning, finance, and delivery systems differ markedly. Weaknesses in these ‘urban enablers’ can become significant blockers to action but capacity can be built through the process of policy implementation itself.
in complex ways to help shape a city’s capacity to respond to environmental risks.
urban enablers
economy: The strength of a city’s economy has a significant bearing on its ability to respond to current and potential future environmental risks. Given the rapidity of change in cities in developing countries, assessing the projected future economic health of a city vis-a-vis population dynamics is especially important. This will depend to some extent on the structure of the urban economy and whether it is well positioned
CAPACITy TO ACT
FINANCE ANd dElIVERy
GOVERNANCE
ECONOMy PlANNING
There are significant challenges in measuring vulnerability at the urban level. For example, city level data to capture the extent of poverty, inequality, and access to basic services on a comparable basis is patchy. However, measuring capacity to act is the most difficult issue to capture. In particular, there are few globally comparable datasets available which assess the strength of urban governance, planning systems, budgetary and finance systems, and delivery capabilities. UN Habitat is developing an Urban Governance Index but this currently plans to cover only a limited selection of cities.
Challenges in measuring vulnerability & capacity to act

Atkins in partnership with
Future Proofing Cities | 59
Finance and delivery: The ability of a city to marshal finance from the public, private, and third sectors combining a variety of financial instruments will be crucial for cities to fund investments which can respond to current and future environmental risks. Whilst many future proofing urban investments can be expected to have negative lifecycle costs and positive economic, social, and environmental benefits, many investments are likely to require up-front or catalytic financing to overcome market failures and non-price barriers limiting private investment into specific sectors.
Cities will also need to implement and experiment with innovative delivery models to deliver infrastructure and services that are robust in the face of complex and uncertain environmental risks. The delivery of infrastructure and services which respond to environmental risks potentially requires changes in the way that these are commissioned, designed, built, and maintained.
We have collected quantitative information on the strength of the urban economies of the 129 cities assessed as part of this report. However, there are well known limitations in measuring the strength of urban governance, planning, budgetary and finance systems, and delivery capabilities (see box on the left hand side). Qualitative and case study evidence has therefore been used to highlight the most prevalent issues.
A number of other factors, largely outside the control of municipal authorities, also impact on the ability of cities to respond to environmental risks. These are not reviewed in detail here but include the skills available in the workforce and available to municipal authorities which is usually shaped at national level, and issues shaped by global economic dynamics such as access to global financial markets as well as the global governance of environmental issues. In addition, a variety of factors shape a city’s ‘incentive to act’ such as its natural resource endowments.
in growing or new market sectors, as well as underlying demographics. Population growth can provide a boost to economic growth by injecting fresh talent into the workforce but can also place significant pressure on basic services and youth unemployment.
We used two measures to quantitatively measure the strength of the urban economy: the current strength of the economy (as measured by GDP per capita) and the projected economic health of the city. The economic health of the city is measured by using the ratio of projected GDP growth 2010-2025 to projected population growth 2010-2025. The greater the value, the greater the economic growth projected in comparison to the growth of the city’s population; this implies a greater ability to invest in responding to future challenges.
It is important to remember that expanding levels of economic activity can be a double edged sword: it provides cities with the potential to invest in responding to future challenges, but if economic growth is pursued without taking into consideration how to manage long term environmental risks, ‘growth-as-usual’ is likely to undermine ‘growth-as-usual.’
governance: The strength of urban governance is one of the biggest issues affecting the ability of cities to respond to major environmental challenges. There are two different aspects of multi-level governance: (1) ‘vertical governance’ which refers to the strength of coordination across multiple levels of government at national, regional and city levels; and (2) ‘horizontal governance’ referring to the coordination of activities across different sectors of society, from local governments to the private sector, civil society and grassroots organisations.
Planning: Effective urban planning by strong, empowered city governments is critical to the success of cities in responding to current and future challenges given its central role in the coordination of actors which shape urban development. Planning plays a direct role in shaping and controlling land use, urban form, and infrastructure and service delivery.
the strength of a city’s institutions - particularly its governance and planning capabilities - will be crucial in shaping its ability to respond to environmental risks
the strength of a city’s institutions - particularly its governance and planning capabilities - will be crucial in shaping its ability to respond to environmental risks

Source: Atkins’ Urban Risk Database. The benchmark cities include 12 cities in middle and high income countries (see Appendix 1).
60 | Future Proofing Cities
Atkins in partnership with
Many of the cities with poor growth prospects are also those projected to face the greatest increases in population. For example, Khartoum’s projected population growth is due to outstrip economic growth. In contrast, economic growth in cities such as Bangalore and Medan are expected to outstrip population growth many times over. The graph below shows the different levels of GDP per capita of the cities featured in this report and the ratio of GDP growth to population growth projected out to 2025.
urban enabler 1: economy
Cities in the developing world differ significantly in the strength of their urban economies. Per capita GDP in our sample of 129 cities varies from just over $200 per capita in Kisangani (DRC) to over $20,000 in cities such as Jakarta (Indonesia) and Bangkok (Thailand).
Cities also differ widely in their future growth prospects. While cities in the developing world are projected to grow far more rapidly than cities in middle and high income countries, there are some cities such as Lilongwe, Karachi, Kathmandu, and Khartoum which have weak growth prospects.
The different income levels and projected economic growth of cities versus population dynamics of cities across the developing world: There is a range of cities such as Khartoum, Lilongwe, Kathmandu and Kampala where economic growth is unlikely to outstrip population growth by much: this will place pressure on the headroom available for investments outside meeting the demand for basic services
lIlONGwE
KATHMANdU
KAMPAlA
1
2
3
4
5
6
7
8
9
10 35,000
30,000
25,000
20,000
15,000
10,000
5,000
00.00
0.00
0.00
0.00
0.00
0.01
0.01
0.01
0.01
0.01
0.01
Kisa
ngan
i - D
RC
Mbu
ji-M
ayi -
DRC
Kana
nga
- DRC
Lubu
mba
shi -
DRC
Kins
hasa
- DR
C
Kano
- N
iger
ia
Mai
dugu
ri - N
iger
ia
Blan
tyre
-Lim
be -
Mal
awi
Mat
ola
- Moz
ambi
que
Ilorin
- N
iger
ia
Lilo
ngw
e - M
alaw
i
Mul
tan
- Pak
ista
n
Kadu
na -
Nig
eria
Zaria
- N
iger
ia
Map
uto
- Moz
ambi
que
Jos
- Nig
eria
Jaba
lpur
- In
dia
Que
tta
- Pak
ista
n
Bhop
al -
Indi
a
Kanp
ur -
Indi
a
Pesh
awar
- Pa
kist
an
Gw
alio
r - In
dia
Addi
s Ab
aba
- Eth
iopi
a
Indo
re -
Indi
a
Patn
a - I
ndia
Kiga
li - R
wan
da
Abuj
a - N
iger
ia
Kath
man
du -
Nep
al
Vara
nasi
(Ben
ares
) - In
dia
Fais
alab
ad -
Paki
stan
Nai
robi
- Ke
nya
Dhan
bad
- Ind
ia
Ogb
omos
ho -
Nig
eria
Ibad
an -
Nig
eria
Kam
pala
- U
gand
a
Lusa
ka -
Zam
bia
Agra
- In
dia
Dar e
s Sa
laam
- Ta
nzan
ia
Lago
s - N
iger
ia
Guj
ranw
ala
- Pak
ista
n
Jodh
pur -
Indi
a
Jaip
ur -
Indi
a
Alla
haba
d - I
ndia
Luck
now
- In
dia
Mor
adab
ad -
Indi
a
Bare
illy
- Ind
ia
Alig
arh
- Ind
ia
Mom
basa
- Ke
nya
Raw
alpi
ndi -
Pak
ista
n
Band
ar L
ampu
ng -
Indo
nesi
a
Kota
- In
dia
Laho
re -
Paki
stan
Kum
asi -
Gha
na
Hai P
hòng
- Vi
et N
am
Med
an -
Indo
nesi
a
Vado
dara
- In
dia
Mee
rut -
Indi
a
Srin
agar
- In
dia
Jam
mu
- Ind
ia
Raip
ur -
Indi
a
Kara
chi -
Pak
ista
n
Aba
- Nig
eria
Dhar
wad
– In
dia
0
5
10
15
20
25
30
35
0
5
10
15
20
25
30
35
Ranc
hi -
Indi
a
Accr
a - G
hana
Durg
-Bhi
lain
agar
- In
dia
Tiru
chira
ppal
li - I
ndia
Bhub
anes
war
- In
dia
Hà N
oi -
Viet
Nam
Beni
n Ci
ty -
Nig
eria
Pale
mba
ng -
Indo
nesi
a
Dhak
a - B
angl
ades
h
Jam
shed
pur -
Indi
a
Isla
mab
ad -
Paki
stan
Hyde
raba
d –
Indi
a
Hyde
raba
d - P
akis
tan
Aura
ngab
ad -
Indi
a
Mad
urai
- In
dia
Kolk
ata
(Cal
cutt
a) -
Indi
a
Da N
ang
- CP
- Vie
t Nam
Sale
m -
Indi
a
Sura
t - In
dia
Guw
ahat
i (G
auha
ti) -
Indi
a
Sola
pur -
Indi
a
Khar
toum
- Su
dan
Amrit
sar -
Indi
a
Mys
ore
- Ind
ia
Chen
nai (
Mad
ras)
- In
dia
Asan
sol -
Indi
a
Nas
hik
- Ind
ia
Band
ung
- Ind
ones
ia
Mal
ang
- Ind
ones
ia
Ho C
hi M
inh
City
- Vi
et N
am
Vija
yaw
ada
- Ind
ia
Coim
bato
re -
Indi
a
Tiru
ppur
- In
dia
Bhiw
andi
- In
dia
Jala
ndha
r - In
dia
Sem
aran
g - I
ndon
esia
Port
Har
cour
t - N
iger
ia
Nag
pur -
Indi
a
Pune
(Poo
na) -
Indi
a
Kozh
ikod
e (C
alic
ut) -
Indi
a
Rajk
ot -
Indi
a
Ludh
iana
- In
dia
Visa
khap
atna
m -
Indi
a
Delh
i - I
ndia
Ahm
adab
ad -
Indi
a
Koch
i (Co
chin
) - In
dia
Thiru
vana
ntha
pura
m -
Indi
a
Bang
alor
e - I
ndia
Chitt
agon
g - B
angl
ades
h
Mum
bai (
Bom
bay)
- In
dia
Durb
an -
Sout
h Af
rica
Sura
baya
- In
done
sia
Port
Eliz
abet
h - S
outh
Afri
ca
Peka
n Ba
ru -
Indo
nesi
a
Ekur
hule
ni (E
ast R
and)
- So
uth
Afric
a
Khul
na -
Bang
lade
sh
Chan
diga
rh -
Indi
a
Cape
Tow
n - S
outh
Afri
ca
Joha
nnes
burg
- So
uth
Afric
a
Jaka
rta
- Ind
ones
ia
Bang
kok
- Tha
iland
Rajs
hahi
- Ba
ngla
desh
Pret
oria
- So
uth
Afric
a
Benc
hmar
k ci
ties

Source: Atkins’ Urban Risk Database
Many cities in India are expected to almost triple their per capita income by 2025. Raipur’s GDP per capita, for example, is projected to rise from just under $5,000 to nearly $14,000 by 2025. This should place these cities in a strong position to invest in infrastructure and public services such as health and education as the economy grows.
Current economic wealth and the projected future economic health of a city appear to be positively correlated.9 Although there are significant outliers, this suggests that cities with a strong urban economy have stronger future growth prospects and indicates that these cities may be in a stronger position to invest in responses to environmental risks.
Rising incomes in cities mean that households are able to reduce the proportion of their income spent on food and daily needs. The increasing formal employment opportunities which often accompany growth enables improvement to housing conditions, access to education and disposable incomes which can sustain growth.
However, existing growth projections are riddled with uncertainties. In particular, existing growth projections take no account of the impact that environmental risks including binding resource constraints may have on future growth. This is also true of traditional national macroeconomic models. As such, unless high growth cities take action to tackle the environmental risks to growth, they risk a potential reversal in their fortunes (see more on this later).
GDP per capita, 2010 in ‘000s (constant $2005) (thousands)
KHARTOUM
Ratio of GDP growth to population growth 2010-2025
the dynamics of cities in the developing world
The map shows the population dynamics of the cities assessed in this report showing their diversity of size and projected population growth rates. The quadrant diagram below maps projected economic growth versus population growth for the cities assessed: this shows the diverse economic and demographic circumstances facing the 129 cities featured in this report.
Population growth can provide a boost to economic growth by injecting fresh talent into the workforce but can also place significant pressure on basic services and youth unemployment.
Cities with significant population pressures often find it challenging to focus attention on measures past the short term imperative of catalysing economic growth and delivering basic services at any cost; measures which have greater medium to long term economic and social benefits and wider environmental benefits are often given little attention.
Many cities in indiaare expected to triple their per capita incomesby 2025
Many cities in indiaare expected to triple their per capita incomesby 2025
0.00
0.00
0.00
0.00
0.00
0.01
0.01
0.01
0.01
0.01
0.01
Kisa
ngan
i - D
RC
Mbu
ji-M
ayi -
DRC
Kana
nga
- DRC
Lubu
mba
shi -
DRC
Kins
hasa
- DR
C
Kano
- N
iger
ia
Mai
dugu
ri - N
iger
ia
Blan
tyre
-Lim
be -
Mal
awi
Mat
ola
- Moz
ambi
que
Ilorin
- N
iger
ia
Lilo
ngw
e - M
alaw
i
Mul
tan
- Pak
ista
n
Kadu
na -
Nig
eria
Zaria
- N
iger
ia
Map
uto
- Moz
ambi
que
Jos
- Nig
eria
Jaba
lpur
- In
dia
Que
tta
- Pak
ista
n
Bhop
al -
Indi
a
Kanp
ur -
Indi
a
Pesh
awar
- Pa
kist
an
Gw
alio
r - In
dia
Addi
s Ab
aba
- Eth
iopi
a
Indo
re -
Indi
a
Patn
a - I
ndia
Kiga
li - R
wan
da
Abuj
a - N
iger
ia
Kath
man
du -
Nep
al
Vara
nasi
(Ben
ares
) - In
dia
Fais
alab
ad -
Paki
stan
Nai
robi
- Ke
nya
Dhan
bad
- Ind
ia
Ogb
omos
ho -
Nig
eria
Ibad
an -
Nig
eria
Kam
pala
- U
gand
a
Lusa
ka -
Zam
bia
Agra
- In
dia
Dar e
s Sa
laam
- Ta
nzan
ia
Lago
s - N
iger
ia
Guj
ranw
ala
- Pak
ista
n
Jodh
pur -
Indi
a
Jaip
ur -
Indi
a
Alla
haba
d - I
ndia
Luck
now
- In
dia
Mor
adab
ad -
Indi
a
Bare
illy
- Ind
ia
Alig
arh
- Ind
ia
Mom
basa
- Ke
nya
Raw
alpi
ndi -
Pak
ista
n
Band
ar L
ampu
ng -
Indo
nesi
a
Kota
- In
dia
Laho
re -
Paki
stan
Kum
asi -
Gha
na
Hai P
hòng
- Vi
et N
am
Med
an -
Indo
nesi
a
Vado
dara
- In
dia
Mee
rut -
Indi
a
Srin
agar
- In
dia
Jam
mu
- Ind
ia
Raip
ur -
Indi
a
Kara
chi -
Pak
ista
n
Aba
- Nig
eria
Dhar
wad
– In
dia
0
5
10
15
20
25
30
35
0
5
10
15
20
25
30
35
Ranc
hi -
Indi
a
Accr
a - G
hana
Durg
-Bhi
lain
agar
- In
dia
Tiru
chira
ppal
li - I
ndia
Bhub
anes
war
- In
dia
Hà N
oi -
Viet
Nam
Beni
n Ci
ty -
Nig
eria
Pale
mba
ng -
Indo
nesi
a
Dhak
a - B
angl
ades
h
Jam
shed
pur -
Indi
a
Isla
mab
ad -
Paki
stan
Hyde
raba
d –
Indi
a
Hyde
raba
d - P
akis
tan
Aura
ngab
ad -
Indi
a
Mad
urai
- In
dia
Kolk
ata
(Cal
cutt
a) -
Indi
a
Da N
ang
- CP
- Vie
t Nam
Sale
m -
Indi
a
Sura
t - In
dia
Guw
ahat
i (G
auha
ti) -
Indi
a
Sola
pur -
Indi
a
Khar
toum
- Su
dan
Amrit
sar -
Indi
a
Mys
ore
- Ind
ia
Chen
nai (
Mad
ras)
- In
dia
Asan
sol -
Indi
a
Nas
hik
- Ind
ia
Band
ung
- Ind
ones
ia
Mal
ang
- Ind
ones
ia
Ho C
hi M
inh
City
- Vi
et N
am
Vija
yaw
ada
- Ind
ia
Coim
bato
re -
Indi
a
Tiru
ppur
- In
dia
Bhiw
andi
- In
dia
Jala
ndha
r - In
dia
Sem
aran
g - I
ndon
esia
Port
Har
cour
t - N
iger
ia
Nag
pur -
Indi
a
Pune
(Poo
na) -
Indi
a
Kozh
ikod
e (C
alic
ut) -
Indi
a
Rajk
ot -
Indi
a
Ludh
iana
- In
dia
Visa
khap
atna
m -
Indi
a
Delh
i - I
ndia
Ahm
adab
ad -
Indi
a
Koch
i (Co
chin
) - In
dia
Thiru
vana
ntha
pura
m -
Indi
a
Bang
alor
e - I
ndia
Chitt
agon
g - B
angl
ades
h
Mum
bai (
Bom
bay)
- In
dia
Durb
an -
Sout
h Af
rica
Sura
baya
- In
done
sia
Port
Eliz
abet
h - S
outh
Afri
ca
Peka
n Ba
ru -
Indo
nesi
a
Ekur
hule
ni (E
ast R
and)
- So
uth
Afric
a
Khul
na -
Bang
lade
sh
Chan
diga
rh -
Indi
a
Cape
Tow
n - S
outh
Afri
ca
Joha
nnes
burg
- So
uth
Afric
a
Jaka
rta
- Ind
ones
ia
Bang
kok
- Tha
iland
Rajs
hahi
- Ba
ngla
desh
Pret
oria
- So
uth
Afric
a
Benc
hmar
k ci
ties
Cities across the developing world can be split into four broad groups
� Highly dynamic cities with growing middle class: these are dominated by Indian cities such as Hyderabad, Kolkata, and Delhi.
� Cities with fast growing economies and populations: these are dominated by African cities starting from a lower level of economic development such as Lagos, Kampala, Kinshasa, and Maputo.
� Stagnating cities: this is a diverse group of cities from across Pakistan, Bangladesh, Sudan, and Malawi such as Khartoum, Lilongwe, and Islamabad.
� More mature cities with slowing economies and population growth: this consists mainly of cities across South Africa, Indonesia, and Thailand as well as some cities in Pakistan and Bangladesh such as Cape Town, Bangkok, and Lahore.
Projected economic growth versus population dynamics Cities differ markedly in the extent to which economic growth is likely to outstrip population pressures.
Growth in population: High population growth is defined as projected growth in population of 50% or greater over the period 2010-2025, equivalent to average annual growth of 3% +
Growth in GdP: High growth in GDP is defined as projected growth in GDP of 150% or greater over the period 2010-2025, equivalent to average annual growth of 6%+
Popu
lati
on g
row
th 2
010-
2025
GdP Growth 2012-2025
Khartoum
Kampala
Hanoi
Jakarta
Cape Town
300%
100%
0%
Stagnating citieS
mature citiesdynamic
cities
population exploding cities
Future Proofing Cities | 61
9 Based on pairwise correlations of indicators within our sample of cities at 1% significance level.

Population dynamics of cities Population growth can provide a boost to economic growth by injecting fresh talent into the workforce but can also place significant pressure on basic services and youth unemployment. Cities with significant population pressures often find it challenging to focus attention on measures to manage the environmental risks to growth and poverty reduction. This map shows the population dynamics of the cities assessed as part of this report showing their diversity of size and population growth rates from 2010-2025.
62 | Future Proofing Cities
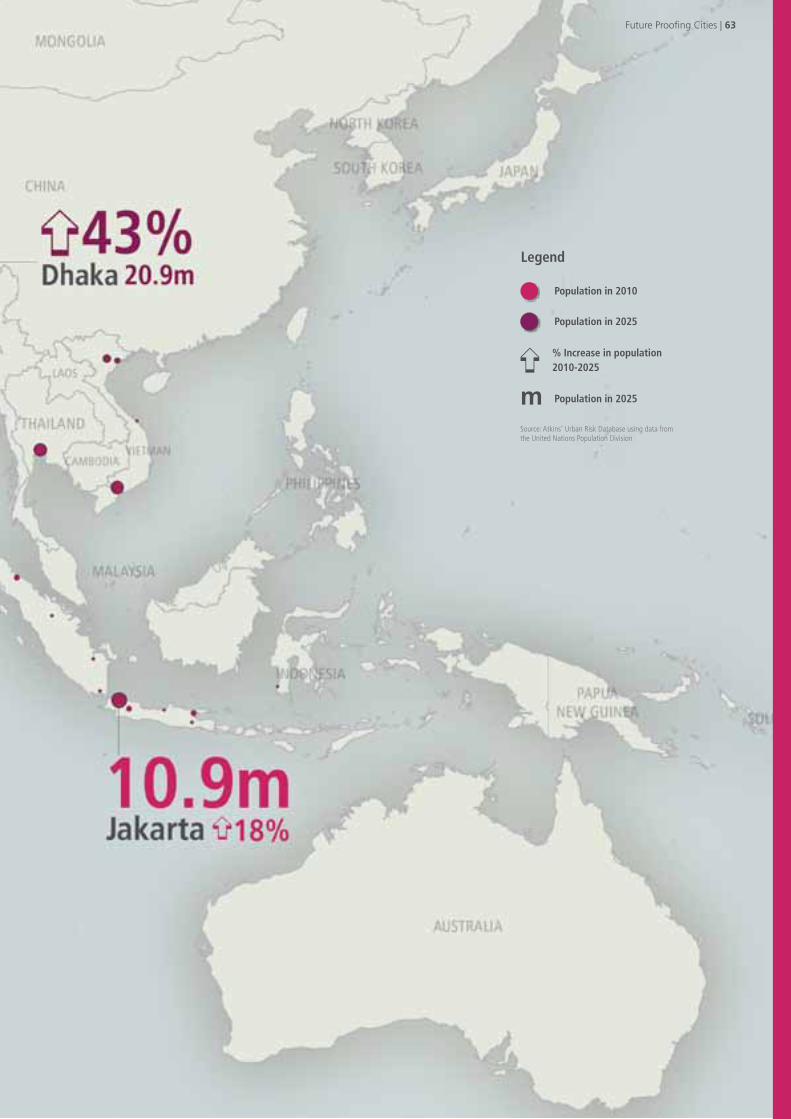
legend
Population in 2010
Population in 2025
% Increase in population 2010-2025 �
Population in 2025mSource: Atkins’ Urban Risk Database using data from the United Nations Population Division
Future Proofing Cities | 63

64 | Future Proofing Cities
Atkins in partnership with
urban enabler 2 : governance
Effective urban governance is one of the most important factors shaping the ability and willingness of cities to respond to environmental risks. The strength of urban governance varies widely across cities in the developing world. For example, despite a raft of reforms to devolve more power and bolster the capacity of Karachi’s Metropolitan Corporation, the ability to implement and coordinate measures to respond to environmental risks in Karachi remains limited. This trend is repeated across many cities in the developing world. Wealth is also no guarantee of strong urban governance. Bangkok, for example, illustrates the challenges of responding to complex environmental risks in wealthier cities (see the facing page).
As cities grow their ability to effectively respond to interconnected environmental risks will require them to coordinate and marshal the capabilities of an increasingly diverse range of actors. These range from intergovernmental organisations and development agencies, multi national companies (e.g. energy companies), semi-autonomous public or private sector institutions (e.g. commissions for water management), state authorities and regional industrial federations, and local businesses, environmental and consumer organisations, and universities.
For many cities traditional institutional structures have proven ineffective at governing this diverse range of actors. Municipal authorities, for example, often lack the jurisdiction needed to tackle environmental challenges and decision making is often fragmented and overlapping. Local service providers are usually dependent on national or regional government. And there is often an absence of effective mechanisms for citizen involvement in decision making and rights to land can be captured by privileged individuals reducing the room of authorities for manoeuvre in responding to challenges.
However, cities exhibit considerable diversity in their models for governance and many cities are demonstrating how creative partnerships between the public, private, and third sectors can play an important role in responding to environmental challenges. Nairobi, for example, is showing how partnerships between communities, government, and research institutions can help respond to environmental risks. Bangalore is showing how the private sector and civil society can step in when the authority and capacity of local government is limited. And the Cape Town Partnership is demonstrating how collaboration between the public and private sectors can help to develop, promote and manage Cape Town as a place for all citizens.
One lesson we do know is that leadership by the public, private, and third sectors matters. So does collaboration between these different stakeholders. There are good examples of how this is emerging. Maputo has recently taken steps to strengthen urban governance with city elections in 1998 and appointment of a city Mayor, strengthening of the Maputo Municipal Council, and increasing collaboration between government, the private sector and civil society in responding to environmental challenges.
Our understanding of how to reform urban governance is also growing. There is now an improved understanding of how (often imported) urban governance structures can be reconfigured and reformed in line with national and local political circumstances to be more effective in responding to future challenges. There is also greater appreciation of how community-led action can help lead or reinforce government efforts to respond to environmental stresses and shocks.
Lessons have also been learnt about how the private sector, operating through partnerships, might deliver effective action when working under publicly accountable rules, and how new autonomous administrative bodies can play a useful role in integrating policy.
10 See Nourishing the Planet (2012) 11 Ghosh (2006) 12 IDS (2007) 13 APN (2010)

Atkins in partnership with
Future Proofing Cities | 65
Vertical Governance challenges in bangkok (Thailand) Bangkok Municipal Authority (BMA) is the main authority governing Bangkok made up of the elected governor’s office and the BMA Council. Despite greater technical capabilities than many cities, Bangkok experiences challenges in both vertical and horizontal governance. For example, the BMA is responsible for city planning, construction and maintenance of infrastructure and services, disaster management and upgrading of informal areas, but the national government has authority over public and social services such as water, transportation, and electricity, and considerable influence over waste management.12 Whilst a wide range of actors are involved in flood protection, BMA has limited means to develop its own flood protection plans due to lack of its own funding sources and lack of influence over issues in the urban catchment such as water management upstream or the construction of the Suvarnabhumi airport which is causing obstructions to natural water drainage.13
This system has often led to failure to implement strategies to reduce pollution and manage flooding. However, this is now starting to change with enhanced cooperation from local authorities and national government in shaping and enforcing climate change strategies, and partnerships with local communities and actors such as the National Union of Low Income Community Organisations (NULICO).
Nairobi (Kenya) – Creative partnerships to respond to food security In Nairobi the Nairobi and Environs Food Security, Agriculture, and Livestock Forum (NEFSALF), a consortium of farmers, policymakers, researchers and research institutions, (and other civil society partnerships such as those initiated by the Italian organization Cooperazione Internazionale (COOPI) and the Mazingira Institute) work to create awareness about the benefits of urban agriculture (including how to grow crops in informal settlements with limited space), train farmers and link them to policymakers. 10
bangalore (India) – The role of the private sector, academia, and civil society in overcoming local government constraints The Bangalore Development Authority (BDA), the paraestatal body responsible for urban development in Bangalore, is comparatively understaffed, with limited political support and financial resources.11 This has limited the government’s ability to deal with risks such as urban sprawl and tackling the escalating intensity of energy use. However, the private sector and various creative partnerships have stepped into this vacuum. For example, teams of developers have acted as forerunners in pioneering new approaches to constructing green buildings, and academic institutions, research councils, and think-tanks, such as the Karnataka State Council for Science and Technology (KSCST) and Centre for the Study of Science, Technology and Policy (CSTEP) are taking a lead in promoting city level improvements to energy efficiency and rainwater harvesting (limited space), train farmers and help link them to policymakers.
Cities in the developing world exhibit considerable diversity in governance models for tackling environmental risksThere is no one sized fits all approach to the effective governance of environmental risks. Cities are experimenting with a diversity of models to improve their ability to respond to environmental risks.
© E
ngel
& G
iele
n/G
etty
Imag
es
© B
loom
berg
via
Get
ty Im
ages
© A
FP/G
etty
Imag
es
Tea pickers, Nairobi, Kenya, Africa
Flood defences protecting Bangkok, Thailand
Airport road in Bangalore
Confidential – not for wider circulation

66 | Future Proofing Cities
Atkins in partnership with
Effective integrated urban planning by strong, empowered city governments will be critical to the success of cities in responding to environmental risks given its central role in the coordination of actors which shape urban development. Planning systems play a direct role in shaping and controlling land use and urban form, and ensuring delivery of adequate infrastructure which all influence the transmission of environmental risks. The effective planning of strategic transport infrastructure is particularly important.
For many cities in the developing world, traditional planning mechanisms have failed to respond to and keep up with dynamics of urban change. Many cities continue to have urban planning systems based on traditional “blue print” masterplan approaches (which have proven too inflexible to respond to the complex challenges facing rapidly urbanising cities and many systems have not evolved since the 1960s).15 Market pressures and corruption, land tenure issues and weak or inappropriate regulation are common issues.
urban enabler 3: planning
Whilst there are some strong urban planning capabilities in cities across the developing world, the majority of cities exhibit systemic weaknesses in their planning capacities. Poor urban planning in Jakarta, for example has left the legacy of an urban environment now highly vulnerable to climate change. Karachi’s planning system has often been singled out as contributing towards uncontrolled urban sprawl, haphazard development, uneven infrastructure provision, and a polluted urban environment, with little room for citizen engagement. Since 1923, five masterplans have been developed for Karachi but none effectively implemented. The results of Karachi’s new Strategic Development Plans (KSDP) 2020 are still unknown.
As with urban governance, even wealthier cities such as Bangkok experience difficulties with congestion and inadequate attention has been paid to green infrastructure planning. Whilst flood protection has long been part of city-level planning in Bangkok with protected zones for environmental damage and “green diagonal” zoning, in practice these codes and building restrictions have not been adequately enforced.14
Asian Development bank, 2011
“there is a need forgreater focus onintegrated planning oftargeted interventionsin specific urban regions, wheresignificantenvironmental andsocial issues needto be addressed andthere is demonstrablecommitment toeffective, integratedimplementation.”
“there is a need forgreater focus onintegrated planning oftargeted interventionsin specific urban regions, wheresignificantenvironmental andsocial issues needto be addressed andthere is demonstrablecommitment toeffective, integratedimplementation.”
© Andrea Pistolesi /Getty Images
Construction work on the western Calcutta outskirts. The first pillars of the future Calcutta ring-road.

Atkins in partnership with
Future Proofing Cities | 67
A lack of input to the planning processes by the urban poor has also often resulted in plans which do not take into consideration how to integrate the rapid expansion of unplanned slum areas. There has also been poor attention to the cross cutting issues including how to plan together for economic development, housing, infrastructure and public services, ecosystem health, climate change, and resource resilience. The separation of land use and transport planning has often lead to urban sprawl, social marginalisation and high demand for hydrocarbon fuels.
The challenges of integrated planning have been compounded by the provision of support by international development agencies on a sector by sector basis rather than via holistic packages of support aligned to a strategic approach to managing urban growth and responding to future challenges. This issue is increasingly recognised. For example, the Asian Development Bank’s new Urban Operational Plan has called for a greater focus on integrated planning to address environmental and social issues.
Integrated urban planning is improving in some cities. For example, Nairobi has just introduced Vision 2030 to guide its long term development with attention given to responding to environmental risks (see box below). Likewise, cities such as Curitiba, Bogáta and Ahmedabad have taken action to promote more integrated approaches to planning urban development in the context of environmental risks by retrofitting public transport systems to tackle congestion issues and unlocking
opportunities for more sustainable patterns of urban form e.g decentralised employment centres reducing pressure on urban centres, and mixed use medium and higher density communities linked to Bus Rapid Transit.
A small number of cities are also beginning to experiment with new approaches to urban planning to respond to major future challenges, including greater use of participatory approaches. This includes greater use of strategic spatial plans to promote more compact cities focused around accessibility and public transport, new land regularisation approaches, participatory partnerships to involve the urban poor in planning processes, assessment and decision support tools such as Sustainability Appraisal, SEA and multi-criteria analysis, and new climate resilient coastal zone management techniques. In addition, there is growing awareness about how to respond to urban poverty in the context of planning for future challenges.16
There is also a growing movement calling for a more flexible approach to the strategic planning of cities in low income countries.17 This would be based on identifying simple paradigms that encapsulate a broader strategy to building economically, socially, and environmentally sustainable cities such as improvements in density, public transport, and walkability and then to implement these principles through strategic interventions that have multiplier effects.
Nairobi’s new Vision 2030
Nairobi (Kenya) adopted its first urban plan in 1926 and first masterplan in 1948 but until recently no major efforts were made to create an integrated planning strategy. Nairobi has now developed and adopted Vision 2030 to guide urban planning in Nairobi18 focused on transforming Nairobi into a “world-class metropolis”, supporting a strong economy and improving the city’s infrastructure while pursuing environmentally sustainable urban development. One of the projects – Tatu City – an urban area of 62,000 residents is designed to preserve wetlands and forests and
be self-sufficient in terms of water energy use and waste treatment. In 2012, the Nairobi Draft Spatial Plan was approved based on Vision 2030 focused on developing new public transport systems with industrial activities centred in sub-regional areas in order to reorganize the city towards a polycentric structure. Whilst generally well received, some groups have suggested a need to improve citizen inclusion in decision-making and open up opportunities for collective mechanisms to cope with climate hazard risks.
global report in human settlements 2009, un-hAbitAt
“urban planning systemsin many parts of theworld are not equippedto deal with social andspatial marginalisationand other urbanchallenges of thetwenty-first centuryand, as such, need to bereformed”
“urban planning systemsin many parts of theworld are not equippedto deal with social andspatial marginalisationand other urbanchallenges of thetwenty-first centuryand, as such, need to bereformed.”
14 APN (2010) 15 UN-HABITAT (2009), Global report on Human Settlements16 World Bank (2010), World Development Report 17 See for example, WWF (2011), Alternative Urban Futures
Report 18 MoNMD (2008)

68 | Future Proofing Cities
Atkins in partnership with
financial markets. This has been reinforced in many parts of the developing world by decentralisation reforms that have often entailed a dispersal of central government functions, without any transfer of resources and power to autonomous lower level authorities. Layered on top of this has been the competitive pressure to offer tax concessions in order to attract potential foreign and domestic investors. Most municipal authorities rely on property taxes, vehicle taxes, land rents, and service delivery charges for their income, with significant shortfalls emerging between revenue and responsibilities. Karachi, for example, had a 200 per cent gap between revenue and expenditure in 2006.
To overcome barriers to the financing of investments cities will need to build stronger mechanisms to raise and channel capital. There are a wide range of potential sources of public and private financing available to cities. The table below provides a summary.
urban enabler 4: finance and delivery
Many cities in the developing world have significant barriers to their ability to raise and mobilise sufficient capital for future proofing investments. Indian cities, for example, require an estimated $724.7 billion of additional investment in urban infrastructure and services to meet projected demand by 2030.19 Whilst many future proofing urban investments can be expected to have a negative lifecycle costs and positive economic, social, and environmental benefits, many investments are likely to require up-front or catalytic financing to overcome market failures and non-price barriers limiting private investment into specific sectors (see also Chapter 4).
These barriers mean cities in the developing world allocate the majority of expenditure to recurring costs rather than investments in new infrastructure. This is also often because national fiscal policy restricts cities from raising enough capital both locally and on international
The past years have seen an increase in delivery models such as public-private partnerships (PPPs). For example, when construction of the Bangkok Transit System (BTS) was proposed by the city’s governor in the early 1990’s, the central government was not willing to provide funding. Instead, a public-private initiative was formed between the BMA and private investors to fund the project, which is now used by over 400,000 inhabitants every day. For energy use, the BMA has formed a partnership with the national petroleum company (PTT) aimed at developing and operating natural gas stations and the Thai Oil Public Company is buying waste and turning it into gas, which is transformed into electricity. In an initiative to prevent illegal dumping of waste, the Industrial Works Department has financed two private enterprises to develop a GPS system for the tracking of garbage trucks, through which false reporting and illegal dumping can be prohibited and monitored. Another innovative partnership is the BMA’s cooperation with the media in issuing a publication on “50 designs for home decoration to combat global warming”.
bangkok (Thailand): Public-Private Partnerships
“Financial resources need to be made more directly available to local players....for climate change adaptation in vulnerable cities, for investment in a portfolio of alternative energy options, and in mitigation partnerships between local governments and local private sector organizations “
global report on human settlements 2011, un-hAbitAt
“Financial resources need to be made more directly available to local players....for climate change adaptation in vulnerable cities, for investment in a portfolio of alternative energy options, and in mitigation partnerships between local governments and local private sector organisations.“
Bangkok, Thailand, Silom District, Sky Train
© B
uena
Vis
ta Im
ages
/Get
ty Im
ages
19 Government of India High Powered Expert Committee Report on Urban Infrastructure and Services (2011). Note that this estimate excludes housing.

Atkins in partnership with
Future Proofing Cities | 69
Evidence suggests that these sources of finance require municipal authorities to gain a detailed understanding of their financial positions, initiate partnerships with local businesses and community organisations to help leverage private-sector capital, develop networks for cross-municipal cooperation, and work with grassroots organisations to support their incremental but substantial investments in improving housing and service provision.
A range of cities in India are showing how to access new dedicated sources of government funding for cities. Cities such as Bangkok also provide good examples of how to creatively raise and mobilise capital for infrastructure investments and service improvements without crowding out the private sector.
City level sources of urban finance international sources
of urban finance
Regional and national government funds, including dedicated infrastructure funds
ODA e.g. World Bank, ADB, DFID, GIZ
New taxes (e.g. local taxes and service charges)
Dedicated climate finance (via ODA currently) e.g. Climate Investment Funds
Cost recovery (e.g. user fees for municipal services to help support the development of green alternatives)
Urban CDM
Land value capturing e.g. financing public transport based on integrated ‘property’ development models
Development Finance Institutions (e.g. IFC, KfW)
Micro-funding (e.g. recycling initiatives) Urban and green infrastructure funds
Profit making public companies e.g. cities hold shares in utilities to promote longer term investments
Private equity and theme based mutual funds (e.g. infrastructure)
Purchasing pool (e.g. cities can aggregate their purchasing of new transport technologies)
Public-private partnerships
Collective community savings
Selected financing instruments available to municipal authorities for future proofing cities
For poorer cities, domestic finance to tackle environmental risks is unlikely to be sufficient and support from the international community can be useful. In the case of climate change, for example, the Copenhagen Accord proposes generating US$100 billion per year by 2020 in support of climate change mitigation and adaptation. International financial institutions have already committed to making financial resources more directly available to cities. For example, the World Bank recently agreed to set up a single, dedicated entry point for cities to access World Bank climate change-related capacity building and technical assistance programs, and climate finance initiatives. Still more needs to be done to ease bureaucratic burdens. Methodologies are also being developed to make it easier to access private climate finance sources. The Clean Development Mechanism (CDM) has already supported a range of green city projects in Bogáta, Sao Paulo, Delhi, and Dhaka, and enhanced efforts should be made to develop consistent approaches to aggregating CDM projects at the city level (so-called ‘urban CDM’) by building on existing embryonic approaches.
The role of international climate finance
Cities will need to explore new delivery models to commission, design, and maintain infrastructure and services that are robust in the face of complex environmental risks. As urban infrastructure assets have long operational lifetimes, they are sensitive not only, for example, to the existing climate at the time of their construction, but also to climate variations over the lifetime of their use. These environmental risks in the context of constrained finance and limited capacities will require cities to look for new ways to commission, design, and maintain urban infrastructure as well as looking at ways to integrate and bolster capacity via the co-delivery of services.

70 | Future Proofing Cities
Atkins in partnership with
Source: Atkins
and contribute to unleashing economic dynamism and the generation of other development co-benefits.
In parallel, efforts should be made to strengthen governance, planning, finance and delivery systems to relieve these blockers to action.
That said, weaknesses in capacity should not prevent cities from being ambitious and focusing on more challenging interventions. Capacity can be built through the process of policy implementation itself and can provide a focus for capacity building efforts.
using capacity to inform the focus for action
The capacity of cities to respond to environmental risks is city specific. The diagram below provides a snapshot of how varying capabilities can help inform the identification of policy choices for future proofing.
As with assessing vulnerability, analysis of urban capabilities is useful for determining the cities likely to have the most difficulty in responding to environmental risks and may require targeted support.
For cities with lower capacity across each of these areas the focus should initially be on future proofing policies which are cheap, simple, and cost effective,
The interaction of environmental risks and capacity to act
High Capacity
High Capacity
ECONOMy GOVERNANCE PlANNING FINANCE ANd dElIVERy
Focus on cheap, cost effective investments with significant short-medium term economic co-benefits e.g. no/low regret options
Focus on investments requiring relatively limited governance capabilities and that rely more on private sector capital and entrepreneurship with limited need for government support
Focus on investments which can be planned on sector or bi/ tri-sector basis without the need for participatory and integrated planning
Focus on financing and delivering easily understandable investments that do not require wide and deep financial sectors, and can simply blend public, private, and catalytic development financing
Greater ability to invest in more costly, capital intensive solutions with longer pay-back periods e.g. higher regrets options
Greater ability to mobilise and coordinate investments requiring broad based support from stakeholders at vertical and horizontal levels
Greater ability to invest in strategic responses requiring participatory and integrated planning with a broad distribution of responses across government and civil society
Greater ability to finance and deliver complex investment programmes/projects mobilising capital and expertise from multiple sources
low Capacity
low Capacity

Atkins in partnership with
Future Proofing Cities | 71
Summary
Main messages
� Cities in the developing world are particularly vulnerable to environmental risks and often have limited capacities to respond to risks.
� Vulnerability and capacity to act varies markedly between cities.
� Vulnerability to environmental risks is shaped by a range of factors including levels of poverty and inequality, the strength of basic infrastructure and services, and urban form.
� The strength of a city’s economy and its population dynamics has a significant bearing on its capacity to respond to environmental risks: institutional factors such as the strength of urban governance, planning, finance, and delivery systems are also critical.
� Looking at risks, vulnerability to risks, the capacity to act, and the scale and pace of change interacting with climate and geography together can help cities to determine appropriate responses to environmental risks.
Findings from assessment of vulnerability and capacity to act
� Despite the economic rise of India, several cities such as Jaipur and Patna continue to remain particularly vulnerable to environmental risks, as do many cities across the Democratic Republic of Congo, Nigeria, Sudan, and Malawi such as Kinshasa, Kano, and Khartoum.
� In contrast, cities across countries such as Indonesia, Vietnam, and Ghana such as Jakarta, Ha Noi, and Accra tend to have lower relative levels of aggregate vulnerability to environmental risks.
� Cities with the highest numbers of vulnerable people continue to remain in the largest cities in South Asia such as Kolkata, Mumbai, Karachi, and Dhaka.
� As with vulnerability, the capacity of cities to respond to environmental risks varies considerably.

72 | Future Proofing Cities
Atkins in partnership with

Future Proofing Cities | 73
Atkins in partnership with
oPPortunities For urbAn Future ProoFing
04

74 | Future Proofing Cities
Atkins in partnership with

Future Proofing Cities | 75
Atkins in partnership with
It concludes with suggesting how cities can combine these stages together to forge mutually reinforcing integrated packages of policy measures which generate environmental, social, and economic benefits.
Cities will need to define their own specific response tailored to city specific challenges but the broad approach outlined in this chapter can help point the way. Moreover, the framework outlined in this chapter can help to act as a decision-support tool to help cities shape more detailed technical work.
This chapter presents a framework to guide policy and decision makers in the initial identification and prioritisation of policy options for future proofing.
Using the types outlined in Chapter 2 and the analysis of vulnerabilities and capacities to act in Chapter 3 this chapter provides guidance on the broad universe of solutions likely to be most applicable to different types of cities, and the solutions more relevant to cities with different vulnerabilities and capacities.
IntroductionBy identifying environmental risks, vulnerability, and capacity to respond, cities can start to identify and prioritise opportunities for action. Many cities in the developing world could benefit from a framework to help guide them in the initial identification and prioritisation of opportunities for future proofing.
by identifying the most significant risks relevant to them, as well as their vulnerability and capacity to respond to risks, cities can start to identify the policy solutions to respond to the risks they face whilst targeting key vulnerabilities and boosting economic growth
by identifying the most significant risks relevant to them, as well as their vulnerability and capacity to respond to risks, cities can start to identify the policy solutions to respond to the risks they face whilst targeting key vulnerabilities and boosting economic growth
Tiruchirappalli, aerial view, Tamil Nadu, India © Image Source/Getty Images

76 | Future Proofing Cities
Atkins in partnership with
This chapter outlines a five stage - multi-criteria - approach to identifying and prioritising policies for future proofing:
1. identifying solutions relevant to city types: how the policy solution can manage one or more environmental risks and how this relates to the current (and potential future) risks facing the city.
2. identifying vulnerabilities addressed and economic development benefits: certain solutions are better at responding to the needs of the urban poor and unleashing economic dynamism, others at promoting wider urban liveability and consolidating existing economic progress.
3. identifying the capacity required for implementation: some measures require substantial governance, planning, financing, and delivery capabilities whereas others are easier to implement.
4. Assessing impact and cost effectiveness: how to maximise the impact and value for money of solutions. Solutions differ widely in their impact and cost effectiveness in addressing environmental risks, reducing poverty, and in their economic development and wider co-benefits (e.g. health impacts). Once options have been short-listed, more detailed quantitative appraisal methods can be used to better capture the size of costs and benefits and relative cost effectiveness.
Based on an integrated diagnostic of the risks relevant to them, their vulnerability and capacity to respond to risks, cities can start to identify and prioritise the universe of policies likely to be appropriate for future proofing.
As outlined in Chapter 2, approaches to supporting the growth and development of cities to date have focused largely on the provision of infrastructure and reducing urban poverty, with less of a focus on managing environmental risks. Likewise, approaches to tackling environmental risks have often remained unimplemented as they have ignored the need to respond to more immediate development priorities or have relied on imported solutions without adequate consideration of the capacity of cities to act.
Identifying and prioritising solutions for future proofing is therefore about identifying solutions capable of responding to environmental risks in a way which catalyses broader economic and social development and can be implemented given the specific capabilities of that city.
Multi-criteria analysis can be a useful way for cities in developing countries to quickly identify and prioritise policy solutions for future proofing. It can act as a way of identifying (qualitatively) policies which can potentially address current and potential future risks, can respond to urban vulnerabilities and more immediate development priorities, and are likely to be implementable given available capacities. This analysis can then be complemented by more detailed standard quantitative appraisal of the costs and benefits of short-listed options and additional technical work.
An integrated approach for responding to risks
Multi-criteria analysisis emerging as anincreasingly importantand flexible approachto dealing with thecomplexity of issuesaround environmentalchange to complementstandard monetisedapproaches.it can help aid decisionmaking and identify the multiple impacts and synergies associated with policyoptions. it is beingincreasingly used when consideringmitigation, adaptation,and ecology basedpolicy analysis.
Multi-criteria analysisis emerging as anincreasingly importantand flexible approachto dealing with thecomplexity of issuesaround environmentalchange to complementstandard monetisedapproaches.it can help aid decisionmaking and identify the multiple impacts and synergies associated with policyoptions. it is beingincreasingly used when consideringmitigation, adaptation,and ecology basedpolicy analysis.
To future proof effectively, cities require an integrated assessment of environmental risks, vulnerabilities, and capacities as a foundation for identifying solutions that can simultaneously deliver environmental, social, and economic benefits.

Future Proofing Cities | 77
Atkins in partnership with
Policy Framework: decision-Support Tool
Based on an integrated diagnostic of their urban type, vulnerabilities, and capacity to act, cities can start to develop a programme for future proofing through a five stage process. First, identifying the environmental risks solutions can address (i.e. climate change mitigation, adaptation, resource efficiency). Second, their potential to address vulnerabilities and deliver wider economic development benefits. Third, the capacity required for implementation. Fourth, assessing in further detail their impact and cost effectiveness in delivering environmental, social, and economic benefits. Fifth, bringing these elements together to assemble policy portfolios.
4. IMPACT & COST EFFECTIVENESS
IdENTIFICATION & APPRAISAl OF POTENTIAl SOlUTIONS
URbAN dIAGNOSTIC
CAPACITy TO ACT
� Economy � Governance� Planning
� Finance and delivery
VUlNERAbIlITy
� Level of poverty and inequality
� Strength of basic infrastructure and services
� Urban form
RISK: URbAN TyPE
1. RISKS AddRESSEd
3. CAPACITy REQUIREd TO IMPlEMENT SOlUTIONS
2. AbIlITy TO TARGET VUlNERAbIlITIES ANd CATAlySE ECONOMIC
GROwTH� Urban poor
� Basic service delivery
� Jobs, capital stock, growth, competitiveness
� Carbon emissions and energy use
� Climate change hazard risks
� Resource use and ecosystems (water, food, land
use/agriculture, materials, natural habitat)
� Affordability (up-front and lifecycle costs)
� Strength and legitimacy of governance required
� Planning capacity required
� Deliverability
5. ASSEMblE POlICy PORTFOlIO � Policy complementarity and conflicts
� Balance of transformational, transition, and resilience measures
� Sequencing
5. Assembling policy portfolios. Bringing all of these considerations together, including thinking about how to exploit synergies and manage trade-offs between solutions and their sequencing, can help cities to develop integrated policy portfolios for urban future proofing.
Alongside these considerations, it is also important to consider other factors which will have a significant impact on the feasibility of policy implementation and detailed policy design such as city size, urban dynamics, and climate and geography. A city’s size and its urban dynamics, for example, affect the feasibility of solutions which require a critical mass of people or size of economic activity such as metro or BRT systems. Likewise, physical geography may hinder the feasibility and design of certain solutions.

78 | Future Proofing Cities
Atkins in partnership with
Based on an extensive review of the literature and input from the project’s expert reference group, a broad set of over 100 policies have been identified to demonstrate the range of solutions that can be used for future proofing. Three broad categories of policy solutions have been identified:
1. government & regional policies: Policies generally set at national or regional levels and likely to be outside the direct control of urban authorities. These tend to support broader economic and human development.
2. City & local policies: Policy options usually driven at the city or local level and which cover multiple sectors (such as the integration of land use, transport, and infrastructure)
3. sector specific policies: These policies mainly sit with urban authorities and focus on one specific sector or focus area.
This list covers a representative set of policies that are of current and future relevance to demonstrate the types of policies that can be used for future proofing and approaches to assessing their impact. A number of the policies such as slum upgrading and provision of affordable housing for the poor can address typical urban development challenges but their implementation offer important opportunities - if designed in the right way - to respond positively to environmental risks.
The list is by no means exhaustive but instead focuses on issue breadth and depth, as well as options with feasible deployment potential within the next 10-20 years. For example, solutions such as urban Carbon Capture and Storage are excluded. Appendix 2 provides a detailed description of the policy options.
Policies applicable to different urban types
The policy solutions outlined on the next page have each been assessed based on the environmental risks they address. This framework helps to identify where single or multiple environmental benefits can be achieved through a single policy, or set of policies. Prioritising the most appropriate policies to review in further detail will depend on local conditions and needs.
Multiple risk management: ‘triple-win’ and ‘win-win’ solutions
Thirty of the policy options assessed address some level of all three major environmental risk categories: (1) reducing carbon emissions and energy use (‘mitigation’); (2) bolstering climate resilience (‘adaptation’); and (3) improving resource productivity (water, food/land) and reducing pressure on ecosystems.
These policies yield ‘triple-win’ benefits and are potentially relevant to all types of cities and could form part of a core package of policies. For example, greening policies whether it is greenbelt boundaries, greenspace zoning, or street level greening policies – if designed in the right way - can help to sequester carbon emissions, enhance or protect natural habitats, and help cities adapt to climate hazard risks such as the increased incidence of temperature extremes or flooding.
There are also many examples of policies with the potential for ‘win-wins.’ Protection of coastal and marine ecosystems, for example, such as mangrove swamps can help to sustain ecologically important natural habitats, as well as provide natural protection to cities from climate hazards such as flooding.
At the level of the city, many policies for future proofing can respond to multiple risks. These can be mapped to identify the policies likely to be most relevant to different urban types.
Whilst measures toreduce carbonemissions,adapt to the impactsof climate change,improve efficiency ofresource use, or protectecosystems are usuallytreated separately, atthe level of the citythese issues often cometogether and there arelikely to be significantopportunities forexploiting synergies
Whilst measures toreduce carbonemissions,adapt to the impactsof climate change,improve efficiency ofresource use, or protectecosystems are usuallytreated separately, atthe level of the citythese issues often cometogether and there arelikely to be significantopportunities forexploiting synergies

Future Proofing Cities | 79
Atkins in partnership with
Policies relevant to different urban types
By looking at the risks that different policy options can address, it is possible to determine which policies are likely to be most immediately relevant to different urban types. For example, for energy intensive, sprawling cities with high carbon footprints, the framework identifies the range of options which can reduce carbon emissions and energy use. For cities facing multiple risks, the framework identifies the range of policy options which can respond to climate hazards, risks to regional support systems, as well as tackle carbon emissions and energy use. These options can also be helpful to cities which face secondary risks in other risk categories.
Dealing with uncertainty
An approach which focuses on exploiting synergies between issues may help cities to plan for and manage the uncertainties associated with unidentified or potential
future risks. For example, cities with high energy and carbon footprints could promote the development of solar orientated neighbourhoods: this approach could not only dramatically reduce carbon emissions and energy use but could also help protect these cities from the uncertain future impacts of climate change.
identifying Policy Clusters
It is also possible to identify packages of mutually supportive policy clusters likely to be relevant to cities facing different environmental risks. For energy intensive, sprawling cities with significant carbon footprints, measures in the transport sector such as introducing Bus Rapid Transit systems and measures to improve cycling and walking routes can work together to reduce aggregate energy use and carbon emissions versus business as usual. Equally, for cities with significant climate change hazard risks there are a significant number of measures which can work together to bolster climate resilience.
Many urban policies can tackle multiple environmental risks to generate ‘win-win’ or ‘triple-win’ environmental benefits. these solutions can help cities to manage the uncertainties associated with potential future risks.
Many urban policies can tackle multiple environmental risks to generate ‘win-win’ or ‘triple-win’ environmental benefits. these solutions can help cities to manage the uncertainties associated with potential future risks.
Indian construction labourers work on a housing project in Kolkata on July 12, 2012.
© A
FP/g
etty
imag
es

80 | Future Proofing Cities
Atkins in partnership with
Policies relevant to urban types
Gov
ernm
ent
and
Regi
onal
Diversification of energy sources and distribution
Reform pricing of energy e.g. reviewing energy subsidies
Adaptive social protection programmes (e.g. combining DRR and CCA)
Programmes to improve social cohesion e.g. gender and race relations
Insurance programs (targeting the poor e.g. microinsurance)
Public health programmes and hazard planning to tackle vector borne diseases and climate related risks
Diversification of agriculture away from climate and resource sensitive areas
Implementation of sustainable tourism policies
Economic diversification of urban economy
Reform water pricing
Use of less fossil fuel intensive food sources within supply chains
Upgrade skills of labour force to promote labour flexibility and innovation in responding to climate related and resource shocks
Policies to support low carbon, resource efficient, and climate resilient innovation and deployment
Reduce barriers of entry for small and micro businesses to help adjustment and innovation in responding to climate related and resource shocks
Schemes to encourage intra-country or FDI into low carbon, resource efficient, and climate sensitive technologies/sectors
Land management policies and property rights
City
and
loc
al
Mixed use zoning
Mass Transit Orientated Development Plans
Pedestrian and Bike Orientated Development Plans
Increased density incentives/standards
Infill and brownfield incentives
Transit orientated nodes
Air quality management
Restricted development on vulnerable land
Relocation of development from vulnerable areas
Strategic planning of key infrastructure in lower risk locations and buffer zones
Greenbelt/Growth boundaries
Greenspace zoning
Sect
or: T
rans
port
BRT
Park and Ride
Low Emissions Zones
Metro and urban rail systems
Standard bus services
Improvements in public transport information
Public transport lanes
Managed/Regulated para-transit e.g. minibuses
Fleet replacement with low carbon, energy efficient vehicles (e.g. car scrappage schemes)
Fuel switching in transport fleet
Driving and parking management and calming measures (demand reduction) (e.g. parking restrictions)
Parking privileges for low carbon vehicles
Car clubs/pooling
Hybrid and electric vehicles incentive programme
Tougher minimum emissions/fuel economy standards
High quality walking and cycling infrastructure
Intelligent Transport Systems
Vehicle quota systems
Public transport temperature/other tolerance standards
Sect
or: b
uild
ings
SMART work centres (inc internet development)
Energy efficient street lighting
Use of local and resource efficient materials in building construction e.g. procurement modalities
Off grid energy and water supply
Construction waste management
Solar orientation for new build neighbourhoods / cities
Retrofit to address natural hazards/ climate risks
Storm and flood resilient new build
Implementation of building codes or design/appliance principles for new build (minimum energy and water use performance, 'passive heating or cooling', ground clearance, flood compatible uses on ground floors)
Retrofit existing buildings to improve resource efficiency and thermal performance
Fully integrated Eco-villages/Neighbourhood schemes
Demand management schemes targeting built environment
1
2
3
4
5
6
7
8
9
10
11
12
16
17
18
19
20
21
22
23
24
25
26
27
28
29
30
31
32
33
34
35
36
37
38
39
40
41
42
43
44
45
46
47
48
49
50
51
52
53
54
55
56
57
58
59
15
14
13
Cities with significant carbon
footprints
Cities with major climate change
hazards
Cities with regional support system(s)
at risk
Cities with multiple risks

Future Proofing Cities | 81
Atkins in partnership with
This matrix illustrates the policies likely to be most immediately relevant to different urban types given the most important existing identified risks.
For cities with a low risk profile, cities will need to take steps to identify in further detail emerging risks. These cities will continue to grow and develop and should look for opportunities to combine measures from across the different categories to future proof their development and avoid locking themselves into long lived, maladapted development paths.
* Desalination plants often have a significant trade-off between climate change mitigation and adaptation benefits (see later)
Sect
or: E
nerg
y
Micro generation
Sustainable use of biofuels
CHP/District Heating or Cooling
Smart Grids
Large scale renewable generation at city scale
Smart metering
Improved energy access (renewable) to unserved communities
Energy from waste (e.g. landfill gas capture)
Sect
or:
Indu
stry
Improved industrial processes e.g. energy, water efficiency
Sect
or: w
ater
Protection of groundwater resources
Desalinisation plants*
Sustainable Urban Drainage Schemes
Exploration and development of alternative water sources
Building simple latrines
Protection of water catchment areas
Greywater harvesting
Improved provision, management and maintenance of water and sanitation systems (including waste water treatment plants)
Climate resilient / water efficient landscaping
Demand management e.g. leakage management, metering, volume charging
Watershed reforestation/restoration
Sect
or:
was
te Waste collection and solid waste management
City/neighbourhood recycling/composting/green exchange schemes
Sect
or: F
lood
and
St
orm
Sur
ge d
efen
ces
Coastal and fluvial (river) defences (hard infrastructure)
Riverbank stabilisation
Flood resilience or resistant infrastructure design
Reforestation in flood buffer areas
Sect
or: d
isast
er
Prep
ared
ness Emergency evacuation plans/disaster response (e.g. heat waves/public buildings)
Early warning systems
Sect
or: F
ood
and
Fibr
e
Improve irrigation systems
Anticipatory planning processes and mechanisms for responding to food price volatility (inc in relation to urban climate impacts)
Urban agriculture and local markets
Urban agroforestry to improve forest goods and services
Sect
or: N
atur
al H
abit
at a
nd G
reen
Sp
aces
Creation, enhancement, management, and monitoring of habitats and important species
Erosion control e.g. wind breaks and strip farming
Soil fertility maintenance
Protection and enhancement of aquatic, coastal and marine ecosystems
Restrictions on pesticides/chemicals
Tree planting programmes/reforestation
Measures to avoid deforestation in catchment
Mitigation of Urban Heat through greening (inc. heat tolerance measures)
Sect
or: I
nfor
mal
Se
ttle
men
ts Low cost enhanced efficiency stoves
Slum upgrade, including innovative high sufficiency unit design
Sustainable and affordable houses for the poor
60
61
62
63
67
68
69
70
71
72
73
74
75
79
80
86
87
88
89
90
91
92
93
94
95
99
100
101
102
98
97
96
81
82
83
84
85
78
77
76
66
65
64
Cities with significant carbon
footprints
Cities with major climate change
hazards
Cities with regional support system(s)
at risk
Cities with multiple risks

82 | Future Proofing Cities
Atkins in partnership with
‘Triple-win’ and ‘win-win’ environmental solutions at the city level
At the level of the city, there are numerous policy options which can respond to individual risks but also multiple risks.
Clim
ate R
isks
Carb
on Emissions and EnErgy UsE
ResouRce and
ecosystem
Risks
53
69 70 71
72 88 89 93
94 95
7
27 28 56 57 58
59 74 75 76 77 78
79 80 81 85 90 91 97
98 101 10299
9
10
13 14 15 16
1211
61
45 46 48
49 60
38
33
34 35 36 37
44
39 40
41 42 43
321 2 29 30 31
62 63 64 65 66
9273
63 4 5
4724 25 26
8354 55 82
84 86 87
19
23
67
18
22
52
17
21
51
8
20
50
1009668
80 97
90‘win-wins’– urban agriculture: Havana
In Havana (Cuba), 90 per cent of the city’s fresh produce comes from local urban farms and gardens. In 2003, more than 200,000 Cubans worked in the expanding urban agriculture sector.3 These types of initiatives can improve self-sufficiency, reduce pressure on carbon and energy footprints by reducing the need for transporting food long distances, and reduce urban heat island effects exacerbated through climate change hazards.
‘win-wins’ and ‘triple-win’– solutions simultaneously addressing mitigation and adaptation: bangkok
There are a number of examples of cities which are implementing measures to simultaneously reduce carbon emissions and energy use and improve resilience to climate change hazard risks. Bangkok in Thailand, for example, is rehabilitating its mangroves along the coast, which will contribute to blocking further coastal erosion along the coast as well as restoring the ecosystem’s ability to absorb carbon. Planting of trees in the city has the same positive twin effect. The amount of green spaces in Bangkok is currently very low (3.3 m2 per person), but through the action plan the BMA has planted three million trees, aims to plant an additional three million by 2012 and to support other organisations in planting an additional 24 million trees by 2012.1 Another example is rainwater harvesting, which can help to mitigate land subsidence issues through decreased dependence on pumping and at the same time reduce the flooding of the rainy season.
Bangkok’s highly successful Baan Mankong (secure housing) programme where communities themselves plan the upgrading of housing and services through cooperation with local government, NGOs, professionals and universities, has also provided opportunities to combine adaptation and mitigation measures through urban greening and energy saving models.
‘Triple-wins’ – integrated waste management: Panjim
Panjim in Goa (India) successfully implemented a decentralized, low-cost waste recycling programme which has reduced dry waste by 85 per cent.2 Eighty-five composting units have been constructed and courts have started to ask other cities in Goa to follow the capital’s example. Jakarta’s community composting project – established in 1990 – has also been relatively successful owing to government support, extensive worker and community education, and establishing a distributor for the final product long before construction began.
‘Triple-wins’ – forest protection and enhancement: Mumbai
Reforestation of the Dharavi Slum Wastelands in Mumbai (India) has led to the transformation of a waste dumping ground, near the largest slum in Asia, into a national park, supporting local biodiversity, sequestering carbon, and dampening urban heat island effects.
97
9575
102

Future Proofing Cities | 83
Atkins in partnership with
23
56
‘win-wins’ – managing air quality: Sao Paulo
Sao Paulo has introduced several mechanisms to manage air quality. For example, buses and taxis run on natural gas, restrictions apply to car traffic once a week, environmental parameters exist in public transportation fleets, and attractive financing is offered to low pollution public transportation systems. The city’s Vehicle Air pollution Control Program (Proconve) was initiated in 1986 has led to a 94 per cent reduction in vehicular emissions despite a rising number of vehicles.4 These policies have reduced carbon emissions and energy use, as well as reduced pressure on land within the urban catchment.
Measures in the built environment have significant potential to reduce carbon emissions and energy use, bolster climate resilience, and respond to risks impacting regional support systems such as water supply. However, the built environment is generally neglected in discussions on solutions for responding to environmental risks. Whilst there are few examples yet of exemplar schemes in the developing world which look to generate ‘triple-win’ environmental benefits, there are examples which are starting to point the way by taking a more integrated approach.
For example, over the last few decades, Bangalore (India) has seen the emergence of a range of progressive measures and projects related to energy conservation and sustainable resource use in construction and housing development, both in newly built and retrofitting, which have advanced new technologies and innovative service delivery models with a notable participation of the private sector.5 One pioneer has been the architect Chitra Viswanath who develops single family houses with local materials which minimise their impact on the surrounding environment, incorporating rainwater harvesting systems and helping to develop the skills of local builders.
These experiences have influenced the thinking of some large developers as well. For example, Samskruti
Builders, a company that builds green communities in Bangalore, has designed eco-villages that incorporate rainwater harvesting, grey-water reuse, bio-waste recycling, pollution control technologies and solar power systems. Another company - Biodiversity Conservation India Limited (BCIL) - is currently leading several developments in strategic areas in the outskirts of Bangalore. Their pioneering pilot project was a green community in the east of the city known as T-ZED (towards zero carbon development). The community, which consists of 75 flats and 16 houses, incorporates designs and green technologies to conserve energy and water. T-ZED is designed to consume only 60 per cent of the energy demand compared to benchmark houses and residents pay about 30 per cent less in energy bills.
Pioneering initiatives such as the ones mentioned above demonstrate the feasibility of retrofitting sustainable technologies such as rainwater harvesting (RWH). In the light of inadequate distribution and supply of water, the Bangalore Strategic Masterplan includes adoption of a mandatory requirement for plots above 240 m2 to adopt RWH. An organisation that has been advancing the implementation of RWH methods is the KSCST, which has installed RWH for demonstration in landmark buildings and exhibition plots and undertaken an ambitious programme of training, technical support and awareness-raising in order to spread the adoption
of RWH in the Bangalore metropolitan region and wider province. The training programmes aim to instruct planners, architects, engineers, plumbers and builders in RWH retrofits that may be carried out simultaneously with repair or construction. As a result, construction of RWH has become widely adopted in both private and public buildings across the region. This initiative illustrates not only how a simple technology may contribute to large-scale adaption of future proofing policy in the urban region, but also how local authorities may rely on a parastatal unit to delegate realisation of a program to the private sector.
Other examples of exemplars from across India include the CII-Godrej Centre of Excellence in Mumbai which is one of the first Platinum rated buildings in India. It has plants that process waste, an air cooling chimney, grass roof, natural lighting, low energy recycled building materials, architecture that supports natural cooling and ventilation, and is an educational hub for green architecture.
Projects such as this demonstrate the potential for future proofing development in the built environment but do not currently challenge the unsustainable patterns of urban development within Indian cities.
‘Triple-wins’: Future Proofing in the built environment: bangalore
1 BMA (2007)2 Annepu (2012) Solid Waste Management in India, Columbia
University 3 See Rural Urban Synthesis Society (2011) 4 See http://egs.apec.org/uploads/docs/BrazilAPC.pdf5 See Castan Broto & Bulkeley (2011)

84 | Future Proofing Cities
Atkins in partnership with
Some cities are already making progress in implementing sectoral policies which make a contribution towards reducing energy intensity and CO2 emissions. However a future proofing approach can accelerate progress.
Reviewing the effectiveness and mix of policies in place can increase energy efficiency and carbon reduction gains. In many cities sectoral policies may not be specifically formulated with reduced energy intensity or carbon reduction as a primary objective (for example transport policies may be geared towards reducing congestion).
A focus on new development can achieve significant gains. Opportunities to reduce the energy intensity of new development can be most easily achieved through shaping the configuration of new development to reduce energy intensity and carbon emissions. Integrated land use-transport planning with complementary transport sector policies has a major impact on transport emissions (the fastest growing driver of CO2 emissions in many cities). Improving building regulations and utilising building ratings systems can drive down demand and resource use in residential and commercial activities.
Many cities do not consider the potential for energy generation within their boundaries. Often the responsibility for energy generation is left to national or state level power companies or the private sector. Cities can seize the economic opportunity to increase renewable energy generation and drive energy efficiency from within city boundaries.
Few cities engage and involve energy consumers to scale existing gains. In many cities the impetus and thrust of policies centres around government action and focuses on measures for which the government has direct responsibility for implementing. Once easy win measures are implemented the next stage is to incentivise and mobilise businesses, households and civil society groups to extend the range of savings which can be realised.
The Clean Development Mechanism (CDM) has sometimes driven sector specific interventions at city level (e.g street lighting) but other transformational opportunities are often overlooked. Cities often own, or can assemble land which represents a potential to make use of renewable energy resources working with partners to create a portfolio of investible
projects. Opportunities linked to energy from waste and improving the efficiency of water supply and sanitation (often the responsibility of municipalities) can make a significant contribution. Green procurement can ensure that housing and public sector building programmes have high performance standards in terms of energy and resource efficiency. Building resilience in energy supply will make cities less vulnerable to price or supply shocks and assist progress towards addressing infrastructure deficits.
‘Triple-win’ and ‘win-win’ opportunities can sometimes be overlooked and could provide opportunities for energy and carbon intensive cities to reduce energy use and carbon emissions as well as protect themselves from uncertain future risks. This includes a suite of policies from greening policies to forest protection and enhancement, densification policies (to reduce pressure on natural habitats), and broader economic, infrastructure, and human development strategies. Cities can also look to innovative solutions such as the development of solar orientated neighbourhoods which provide opportunities to reduce carbon emissions and energy use as well as to help protect cities from the uncertain future impacts of climate change.
energy intensive, sprawled cities with significant carbon footprintsTy
PE 1
Clim
ate R
isks
Carb
on Emissions and EnErgy UsE
ResouRce and
ecosystem
Risks
53
69 70 71
72 88 89 93
94 95
7
27 28 56 57 58
59 74 75 76 77 78
79 80 81 85 90 91 97
98 101 10299
9
10
13 14 15 16
1211
61
45 46 48
49 60
38
33
34 35 36 37
44
39 40
41 42 43
321 2 29 30 31
62 63 64 65 66
9273
63 4 5
4724 25 26
8354 55 82
84 86 87
19
23
67
18
22
52
17
21
51
8
20
50
1009668

Future Proofing Cities | 85
Atkins in partnership with
Bangalore is implementing a range of policies in the transport sector such as a new metro system which is likely to be beneficial in reducing its energy use and carbon emissions versus business as usual. In addition, it is focusing on a range of policies in the built environmental sector, waste, and water sectors which have the potential to deliver ‘triple-win’ benefits.
However, preliminary analysis suggests that there is significant scope for Bangalore to do more. For example, there are a wide range of policies across the transport sector which could receive more attention and complement existing measures such as the parallel introduction alongside its new metro of extended bus services, a BRT system, and measures to promote walking and cycling. Equally, in the energy sector, there appears significant scope to do more by, for example, looking at ways to revamp renewable power in the urban catchment (the share of hydropower in Karnataka has steadily decreased since the 1980s).
There also appears to be a significant number of ‘triple-win’ measures which could tackle energy use and carbon emissions as well as help protect Bangalore against the uncertain future impacts of climate change and resource scarcities. Bangalore’s green spaces, for example, have diminished in recent years and there is significant scope for policies at the city and more local area level to promote greening.
The rapid urban growth of the metropolitan area is also threatening the city’s valuable water resources. For example, there has been a dramatic decrease in the number of lakes in the city’s urban catchment. This is likely to place a premium on Bangalore exploring and developing alternative water sources in the coming years.
bangalore
bangalore
IndIa
Current urban type Energy intensive, sprawled city with significant carbon footprint
Vulnerability Low
Capacity to act High
Policies in place � New metro system
� Progressive private sector investment in low carbon buildings
� Congestion reduction system (B-Trac)
� Measures to improve air quality e.g. monitoring and publishing information on pollution
� Regulation for auto-rickshaws to run on liquid petroleum gas and petrol
� India’s first e-recycling plant within urban catchment
� Water meters
� Grey-water recycling
Policies under consideration
� Tax on industrial and commercial power
� Regional plans for green construction and low carbon technologies (PV, LED, rainwater harvesting and eco-friendly materials)
Policies in place - selected highlights:
3823 56 75 78 8132
© D
avid
h. W
ells
/get
ty im
ages

86 | Future Proofing Cities
Atkins in partnership with
Some cities are already incorporating measures aimed at reducing climate risk in sector and area based programmes. There are a significant number of policy clusters and individual policies which can bolster climate resilience including:
� Restricting and/or relocating development and strategic planning of infrastructure in vulnerable areas and buffer zones.
� Retrofitting buildings in flood/other disaster prone areas and storm/flood resilient new build.
� Bolstering flood and storm surge defences and infrastructure resilience.
� Disaster preparedness.
Implementation of integrated approaches at the strategic level to address climate risk are less common. Broader economic, infrastructure, and human development strategies can be effective in bolstering
climate resilience. Social protection and cohesion programmes, public health and hazard planning, and diversification of agriculture in areas away from climate sensitive areas are measures which have impact over time and achieve wider benefits.
Greening policies and green infrastructure programmes can be used to tackle multiple risks – including climate risk - but are not often designed to secure double and ‘triple-win’ benefits. There are numerous ‘triple-win’ and ‘win-win’ opportunities available which can help cities facing climate risks guard against the potential future risks of high carbon lock-in and resource/ecosystem degradation or depletion. Little attention is paid to land providing ecosystem services to cities and which can bolster resilience to climate change hazards, and the multifunctional role of land is often not reflected in policies. For example,
measures such as growth management policies and green belts, planning of green corridors, afforestation and urban greening programmes, conservation and enhancement of biodiversity, protection of ground water resources and implementation of sustainable urban drainage systems are often looked at in isolation rather than a constituent role as part of a city’s green infrastructure network.
Lack of effective land use management policies can stymie efforts to address climate risks. Development often takes place in urban areas vulnerable to flooding and other climate risks with little adequate infrastructure provided. It is therefore important that cities better define and recognise land rights and management of land ownership records but also their enforcement.
Cities with major climate hazards
Clim
ate R
isks
Carb
on Emissions and EnErgy UsE
ResouRce and
ecosystem
Risks
53
69 70 71
72 88 89 93
94 95
7
27 28 56 57 58
59 74 75 76 77 78
79 80 81 85 90 91 97
98 101 10299
9
10
13 14 15 16
1211
61
45 46 48
49 60
38
33
34 35 36 37
44
39 40
41 42 43
321 2 29 30 31
62 63 64 65 66
9273
63 4 5
4724 25 26
8354 55 82
84 86 87
19
23
67
18
22
52
17
21
51
8
20
50
1009668

Future Proofing Cities | 87
Atkins in partnership with
Maputo
Maputo
mozambique
Maputo has put in place a range of policies to respond to the significant climate hazard risks it faces, as well as to respond to other environmental risks. Ensuring that these policies are implemented will be even more crucial in the coming years as rapid population growth increases pressures on infrastructure, services and housing, and potentially leads to more people being vulnerable to climate change impacts.
Whilst measures have been identified to strengthen flood defences, upgrade informal areas to reduce vulnerability to flooding, and introduce early warning systems, more attention is likely to be needed at national, regional, and city level to ensure that Maputo’s residents are adequately protected from the health risks associated with climate hazards and that future economic growth (including infrastructure provision) is not concentrated in climate sensitive sectors and vulnerable locations.
There also appears to be significant opportunities for Maputo to look
at ‘win-win’ and ‘triple-win’ policies spanning a wide range of sectors from the built environment and efficient waste water management to urban greening which could help the city not only protect itself from climate change hazards but also prevent being locked into resource intensive,
higher carbon pathways. In particular, it will be important for Maputo to place adequate attention on the management and protection of its water resources which are already under strain, especially in times of drought.
© A
FP/g
etty
imag
es
Current urban type City with major climate change hazards
Vulnerability Medium
Capacity to act Low
Policies in place � Coastal defence infrastructure works
� Upgrading of infrastructure to improve adaptation capacities of informal areas
� Formation of climate partnerships with affected communities
� People-centred disaster warning system
� Tree-planting campaign in schools
� City Waste Management Strategy
� Natural gas driven buses
Policies under consideration
� Mangrove rehabilitation
� New waste disposal system
Policies in place - selected highlights:
38 82 8780 97 101

88 | Future Proofing Cities
Atkins in partnership with
Cities with risks to regional support system(s)
© R
aja
Isla
m/G
etty
Imag
es
Almost all of the policy solutions which relate to resource and ecosystem risks (water, food/land, natural habitats) can also play a role in addressing carbon emissions and energy use and responding to climate change risks.
In considering how the future growth of cities can be managed recognition of the resource constraints facing cities and urban-rural linkages is rare. Protecting the food supply, for example, via improved irrigation and the promotion of urban agriculture, and investment in measures to respond to water scarcity requires a whole catchment approach. Protecting other natural ecosystems important to food security including safeguarding agriculture through erosion control, soil fertility maintenance and protection of high value terrestrial and coastal marine habitats often ignores the pressures exerted by urbanisation.
Water resources management is the sector where policies are most often implemented. However, wider transformational and demand side policies to secure and protect critical resources and relieve pressure on ecosystems are usually afforded less attention. These include measures such as exploring alternative sources of water supply and protection of groundwater.
Some measures have specific benefits for efficiency in the use and disposal of water and waste, and protection of natural habitats. Examples include installation of simple latrines and monitoring and protection of habitats and important species.
Clim
ate R
isks
Carb
on Emissions and EnErgy UsE
ResouRce and
ecosystem
Risks
53
69 70 71
72 88 89 93
94 95
7
27 28 56 57 58
59 74 75 76 77 78
79 80 81 85 90 91 97
98 101 10299
9
10
13 14 15 16
1211
61
45 46 48
49 60
38
33
34 35 36 37
44
39 40
41 42 43
321 2 29 30 31
62 63 64 65 66
9273
63 4 5
4724 25 26
8354 55 82
84 86 87
19
23
67
18
22
52
17
21
51
8
20
50
1009668

Future Proofing Cities | 89
Atkins in partnership with
karachi karachiPakistan
Current urban type City with regional support systems at risk (water and food)
Vulnerability Medium
Capacity to act Low
Policies in place � Efficient land use through truck farming, dairy and poultry farming and salinity resistant agriculture
� Groundwater conservation measures
� Greater Karachi Water Supply project to improve water supply
� Replace tube-well fed irrigation with sprinkler and drip irrigation
� Improve water distribution network to prevent leakage
� Greater Karachi Sewage Treatment Project
� Introduction of alternative fuels such as CNG, LPG, Electric, Hybrid and Bio Diesel
� Minimum energy efficiency standards for households
� Densification strategies
� Construction of alternative energy projects
Policies under consideration
� Long term plan for water supply
� Comprehensive groundwater development program
� Energy supply through nuclear generation in event of hydropower shortfalls
� Extending the Karachi Circular Railway, Bus Transit-way System, or Light Rail system
� No-vehicle zones and rationalized parking in the CBD
Policies in place - selected highlights:
38 64 69 8820 56 76 78
© sM rafiq Photography/getty images
Karachi is taking a wide range of steps to reduce its risks to water and food scarcities, as well as placing some focus on efforts to address other environmental risks. Ensuring effective implementation will be crucial.
However, preliminary analysis also suggests significant opportunities for Karachi to do more to future proof its development. There are a wide range of ‘triple-win’ and ‘win-win’ policies which do not appear to have received much attention to date. For example, an enhanced focus on developing urban agriculture and local markets could help Karachi to boost its food supply, greywater harvesting could help to retain water supplies in times of drought, and an enhanced focus on mixed use zoning and mass transit, bike, and pedestrian development plans could reduce pressure on land-use within the urban catchment.

90 | Future Proofing Cities
Atkins in partnership with
A significant number of cities experience multiple risks. A focus on a programme and portfolio of policies which together addresses these risks, can best achieve a multi-dimensional response. These cities have numerous ‘triple-win’ policy clusters available which can help them guard against the risk of high carbon lock-in, climate change hazards, and improve resource productivity and/or protect vital habitats.
The presence of multi-dimensional risks does not necessarily mean that the policy response needs to be shaped in a significantly different way to other cities. However, a key challenge remains the capacity at city level to take action across multiple sectors and effective harmonisation of policy responses, placing a premium on identifying and implementing policies with ‘triple-win’ and ‘win-win’ benefits and avoiding policy conflicts (see later).
A better appreciation and measurement of the spatial distribution of risk and vulnerability within these cities could be a useful first step in informing integrated policy responses.
In cities with multiple risks striking a balance between policies which can achieve a long term urban transformation and those focused on immediate disaster risk reduction will be an important consideration.
Clim
ate R
isks
Carb
on Emissions and EnErgy UsE
ResouRce and
ecosystem
Risks
53
69 70 71
72 88 89 93
94 95
7
27 28 56 57 58
59 74 75 76 77 78
79 80 81 85 90 91 97
98 101 10299
9
10
13 14 15 16
1211
61
45 46 48
49 60
3834 35 36 37
44
39 40
41 42 43
62 63 64 65 66
9273
63 4 5
4724 25 26
8354 55 82
84 86 87
19
23
67
18
22
52
17
21
51
8
20
50
1009668
Cities with multiple risks
© 2
009
J Ta
nsiri
mas
/Get
ty Im
ages

Future Proofing Cities | 91
Atkins in partnership with
bangkok
Bangkok has implemented a wide range of policies across various sectors which respond to multiple environmental risks from flood defence measures to mass transit options. However there appears to be a range of areas in which Bangkok could pay more attention. For example, a greater attention to urban greening policies (the amount of green space in Bangkok remains low) could simultaneously reduce carbon emissions as well as build resilience to climate change hazards and encourage reduced urban sprawl. Greater attention could also be given to policies in the built environment to encourage future proofed new build, as well as at national and regional levels to promote economic diversification of the urban economy away from sectors and locations vulnerable to flooding.
Current urban type City facing multiple risks
Vulnerability Low
Capacity to act High
Policies in place � Bangkok Action Plan: comprehensive set of policies to deal with rising energy use and impacts of climate change
� Comprehensive flood defence measures including drainage and pumping
� Forecasting and flood warning system
� Bangkok Skytrain, MRT subway, and Bus Rapid Transit System
� LED traffic lights and traffic flow management systems
� Tax rebates for alternative-fuel vehicles
� Land use plan to reduce sprawl
� Campaigns for efficient use of electrical appliances and air-conditioning and efficiency labelling
� Housing upgrading programme
� Energy Efficiency Building Retrofit Program
� Reduce/Reuse/Recycle Campaign
� Rehabilitation of mangrove growth along the coast
� Tree planting programme
� Rainwater harvesting
Policies under consideration
� Introduction of congestion charges
� Small-scale biomass power plants
� Large storage dam to protect the city from flooding
� Erosion control structures
Policies in place - selected highlights:
4229 32
82
56
87 95
17
97
57
75 81
bangkokThailand
© Macduff everton/getty images
102

92 | Future Proofing Cities
Atkins in partnership with
© yawar nazir/getty images
A young girl carries a jar filled with water towards her makeshift house in a slum area on February 13, 2012 in Jammu, the winter capital of Indian administered Kashmir. Slums are generally found on the outskirts of cities and lack basic facilities like electricity and clean water.

Future Proofing Cities | 93
Atkins in partnership with
to be the main driver for action as cities in the developing world look to create jobs for young workforces, enhance their capital stocks, generate economic growth, and maintain and enhance competitiveness in a globalised world. Broader development co-benefits such as the health related benefits associated with reduced pollution are also important to consider carefully.
The diagram on the opposite page provides a qualitative assessment of the extent to which policy options to tackle environmental risks have potential to directly impact on basic services or the living standards of the urban poor, as well as to generate short-medium term economic benefits (employment, enhancement of the capital stock, economic growth, and improved competitiveness).
This assessment is indicative of ‘potential’ impact as ‘actual’ impact will be determined by the way city specific policies or those within the control of national/regional jurisdictions are designed and implemented.
For cities with high levels of vulnerability, there are a wide range of policy clusters as well as individual policies with significant potential to directly reduce urban poverty and boost basic service delivery. Other policies are better suited to promoting wider urban liveability and are likely to be more applicable to cities who have largely dealt with the challenge of reducing ‘absolute’ urban poverty.
In addition, for cities with weak urban economies there are a wide range of policies which can directly catalyse economic growth. Indeed, for any city, focusing on the short-medium term economic and broader development benefits of policy solutions will be crucial to build sustained momentum behind future proofing programmes (i.e. cities will look to future proof existing growth plans rather than develop future proofed growth plans). In many cases this is likely
Targeting vulnerabilities and supporting economic development Cities should prioritise policies which reduce their urban vulnerabilities and support wider economic development. The good news is that there are a wide variety of policies with significant potential to reduce urban poverty, boost basic service delivery, and deliver economic development benefits.
there are a wide rangeof future proofing policy solutions with the potential to deliver social and economic benefits.
there are a wide rangeof future proofing policy solutions with the potential to deliver social and economic benefits.

94 | Future Proofing Cities
Atkins in partnership with
targeting urban vulnerabilities and catalysing economic development: identifying synergies and managing trade-offs
The radial diagram on the facing page shows that there are a wide range of policy clusters – some of which are self-reinforcing – as well as individual policies with significant potential to directly reduce urban poverty and boost basic service delivery as well as having short to medium term economic development benefits.
These include policies at the government and regional level such as public health programmes and hazard planning to tackle vector-borne diseases and climate related risks, transport sector policies such as Bus Rapid Transit and walking and cycling infrastructure, water policies such as improved provision, management and maintenance of water and sanitation systems, waste collection and solid waste management, and future proofing policies to promote slum upgrading and affordable housing for the poor.
There are also a range of policies which can be effective at addressing environmental risks such as carbon emissions and energy use but do not have significant poverty reduction or more immediate short-medium term economic development benefits: these are likely to prove more difficult to implement.
Good examples include reforming energy subsidies and water pricing which helps to explain why these national and regional level reforms have proven so difficult in many developing countries alongside the presence of strong vested interests. Many policies in the transport sector which help to reduce carbon emissions also have a limited impact on poverty reduction and short-medium term economic development such as Park and Ride schemes, vehicle quota systems, and Low Emission Zones.
There can also be significant trade-offs between poverty reduction objectives and short-medium term economic development objectives. For example, restricting or relocating development away from vulnerable land can have significant poverty reduction benefits (given the poor are often located in poor housing in hazard prone areas), but this may have a detrimental impact on economic growth in the shorter term. The same trade-off applies to early warning systems or systems to respond to food price volatility. This puts a premium on cities thinking over the longer term.
responses ranging from public health programmes to tackle the increased incidence of malaria in flood prone areas to transport sector policies such as bus rapid transit and enhancing walking and cycling infrastructure to reduce emissions can have a significant impact in alleviating poverty.
responses ranging from public health programmes to tackle the increased incidence of malaria in flood prone areas to transport sector policies such as bus rapid transit and enhancing walking and cycling infrastructure to reduce emissions can have a significant impact in alleviating poverty.

Source: Atkins: The radial diagram demonstrates potential policy impact based on a qualitative assessment of the policies drawing on input from the project’s expert group
Future Proofing Cities | 95
Atkins in partnership with
Direct Impact on Basic Services or Living Standards of the Urban Poor
Short to Medium Term Economic Development Benefits
NATURAL H
ABITAT & GREEN SPACES
FOOD &
FI
BRE
DISASTER PREPAREDNESS
FLO
OD
& S
TORM
SUR
GE
DEFE
NCES
WA
STE
WAT
ER
ENERGY
BUILDINGS
TRANSPORT
CITY AND
LOCA
L
GOVERNMENT AND REGIONAL
INDUSTRY
SETTLEMENTSINFORMAL
21 3 4 56
78
910
11
12
13
14
15
16
17
18
19
20
21
22
23
24
25
26
27
28
29
30
31
32
33
34
35
36
37
38
39
40
41
42
4344
4546
4748
4950515253545556
5758
5960
61
62
63
64
65
66
67
68
69
70
71
72
73
74
75
76
77
78
79
80
81
82
83
84
85
86
87
88
89
90
91
92
93
9495
9697
9899
101 102100
Direct Impact on Basic Services or Living Standards of the Urban Poor
Short to Medium Term Economic Development Benefits
21 3 4 56
78
910
11
12
13
14
15
16
17
18
19
20
21
22
23
24
25
26
27
28
29
30
31
32
33
34
35
36
37
38
39
40
41
42
4344
4546
4748
4950515253545556
5758
5960
61
62
63
64
65
66
67
68
69
70
71
72
73
74
75
76
77
78
79
80
81
82
83
84
85
86
87
88
89
90
91
92
93
9495
9697
9899
101 102100
10
24
Restricting or relocating development away from vulnerable land can have significant poverty reduction benefits (given the poor are often located in poor housing in hazard prone areas), but this may have a detrimental impact on economic growth in the shorter term.
25
Certain transport policies such as Bus Rapid Transit and improvements to walking and cycling infrastructure have a direct impact on the urban poor as these are transport modes most often used by those on more limited incomes. These investments also help to boost capital spending, create jobs, and reduce the cost and improve the efficiency of transport.
44
29
There are a significant number of policies which can directly reduce urban poverty and deliver economic development benefits
Public health programmes and hazard planning to tackle vector borne diseases and climate related risks have a direct impact on the urban poor as well as wider economic development benefits. The poor – particularly those living in informal settlements – are impacted most by outbreaks of malaria, dysentery, and cholera associated with flooding. Public health programmes also help to enhance the productivity of the workforce and create jobs.
6
2
Other policies such as reducing energy subsidies or reforming water pricing to more accurately reflect its true societal cost can disproportionately impact the poor - who spend a significant percentage of their income on energy and water - without adequate transition mechanisms. Whilst reforms to subsidies can act as a short term break on economic growth and competitiveness as businesses adjust to higher prices for energy and water use, they are unlikely to be sustainable in the medium to long run.
HIgH IMPAcT
MEDIuM IMPAcT
LOw IMPAcT

96 | Future Proofing Cities
Atkins in partnership with
As outlined in Chapter 3 cities have quite different capacities to respond to risks. In particular, cities have very different urban economies, as well as different strengths in terms of their governance, planning, finance, and delivery systems. Cities with lower levels of income, for example, are more likely to focus initially on the most affordable interventions. Cities with weak governance capacities within their municipal authorities may have to rely more heavily on the private sector to plug gaps in capabilities. Cities with limited planning capacity may find it challenging to focus initially on solutions which require participatory and integrated planning capacities.
The capacity required to implement solutions
For each policy solution, there is a minimum capacity that needs to be in place for successful implementation. The diagrams on the facing page provide qualitative assessments of future proofing policy solutions mapped across four key dimensions: affordability, strength and legitimacy of governance required, planning requirements, and deliverability.
It is important that cities consider carefully the minimum capacities that need to be in place or strengthened for policy implementation. Cities have a significant number of future proofing policy options open to them that are relatively easy to implement.
For lower capacity cities, policy options such as introducing standard bus services and improving public transport information can be a relatively easy first step to reduce carbon emissions before they move onto more costly and complex solutions.
For lower capacity cities, policy options such as introducing standard bus services and improving public transport information can be a relatively easy first step to reduce carbon emissions before they move onto more costly and complex solutions.
© D
ream
Pict
ure
s/g
etty
imag
es
Mumbai, India

Source: Atkins: The radial diagrams demonstrate the capacity typically required to implement various policy measures based on a qualitative assessment of the policies drawing on input from the project’s expert group
Future Proofing Cities | 97
Atkins in partnership with
Policies for future proofing differ markedly in the capacity required for successful implementation: cities can use this assessment to identify the policies most relevant to them and to identify the capacities they want to strengthen
INDUSTRY
SETTLEMENTSINFORMAL
NATURAL H
ABITAT & GREEN SPACESFO
OD & FI
BRE
DISASTER PREPAREDNESS
FLO
OD
& S
TORM
SUR
GE
DEFE
NCES
WA
STE
WAT
ER
ENERGY
BUILDINGS
TRANSPORT
CITY AND
LOCA
L
GOVERNMENT AND REGIONAL
21 3 4 56
78
910
11
12
13
14
15
16
17
18
19
20
21
22
23
24
25
26
27
28
29
30
31
32
33
34
35
36
37
38
39
40
41
42
4344
4546
4748
4950515253545556
5758
5960
61
62
63
64
65
66
67
68
69
70
71
72
73
74
75
76
77
78
79
80
81
82
83
84
85
86
87
88
89
90
91
92
93
9495
9697
9899
101 102100
Affordability
Measures such as improving standard bus services and public transport information, introducing parking privileges for low emissions vehicles and introducing density standards are relatively low cost measures.
Cities with lower levels of GDP per capita, future growth prospects, and limited tax revenues are more likely to focus initially on the most affordable interventions in terms of up-front capital intensity and lifecycle costs. Other cities may be able to focus on more capital intensive interventions with higher operational costs.
Affordability
NATURAL H
ABITAT & GREEN SPACES
FOOD &
FI
BRE
DISASTER PREPAREDNESS
FLO
OD
& S
TORM
SUR
GE
DEFE
NCES
WA
STE
WAT
ER
ENERGY
BUILDINGS
TRANSPORT
CITY AND
LOCA
L
GOVERNMENT AND REGIONAL
INDUSTRY
SETTLEMENTSINFORMAL
Strength and legitimacy of governamce required
21 3 4 56
78
910
11
12
13
14
15
16
17
18
19
20
21
22
23
24
25
26
27
28
29
30
31
32
33
34
35
36
37
38
39
40
41
42
4344
4546
4748
4950515253545556
5758
5960
61
62
63
64
65
66
67
68
69
70
71
72
73
74
75
76
77
78
79
80
81
82
83
84
85
86
87
88
89
90
91
92
93
9495
9697
9899
101 102100
Strength and legitimacy of governance required
low - High: Denotes minimum governance capacities which need to be in place for effective implementation
The minimum governance requirements
The affordability of different solutions
Some policies require broad-based support across a wide range of stakeholders at the vertical and horizontal levels for implementation, others significant institutional support from government, and some can be led almost exclusively by the private sector with enabling support from government.
26
25
57
Policies such as the relocation of development from areas vulnerable to climate change and the planning of key infrastructure in less vulnerable locations require strong governance and broad-based support across a wide range of stakeholders for successful implementation.
In contrast other policies such as many across the built environment from construction waste management to retrofitting existing buildings to improve resource efficiency and thermal performance can be led almost exclusively by the private sector with enabling support from government.
50
32
4558
20
31
33
40
77
LOw gOvERNANcE
REquIREMENTS
LOw cOST
HIgH gOvERNANcE
REquIREMENTS
HIgH cOST
Introducing metro systems, intelligent transport systems, and developing fully integrated eco village schemes are capital intensive and/or have significant lifecycle costs.

Source: Atkins: The radial diagrams demonstrate the capacity typically required to implement various policy measures based on a qualitative assessment of the policies drawing on input from the project’s expert group
98 | Future Proofing Cities
Atkins in partnership with
low - High: Denotes minimum distribution of planning capacity required for effective implementation
The minimum planning requirements
NATURAL H
ABITAT & GREEN SPACES
FOOD &
FI
BRE
DISASTER PREPAREDNESS
FLO
OD
& S
TORM
SUR
GE
DEFE
NCES
WA
STE
WAT
ER
ENERGY
BUILDINGS
TRANSPORT
CITY AND
LOCA
L
GOVERNMENT AND REGIONAL
INDUSTRY
SETTLEMENTSINFORMAL
Planning Capacity Required
21 3 4 56
78
910
11
12
13
14
15
16
17
18
19
20
21
22
23
24
25
26
27
28
29
30
31
32
33
34
35
36
37
38
39
40
41
42
4344
4546
4748
4950515253545556
5758
5960
61
62
63
64
65
66
67
68
69
70
71
72
73
74
75
76
77
78
79
80
81
82
83
84
85
86
87
88
89
90
91
92
93
9495
9697
9899
101 102100
Certain policies require participatory and integrated planning systems, including the broad distribution of responsibilities across government and civil society plus expert and lay knowledge. Others have less demanding requirements and can take a multi-sectoral approach with the distribution of responsibilities across several governmental departments and/or other agencies e.g. special task forces. Some policies can take a sector based approach, relying more on the capacity within one department.
Planning Capacity Required
NATURAL H
ABITAT & GREEN SPACES
FOOD &
FI
BRE
DISASTER PREPAREDNESS
FLO
OD
& S
TORM
SUR
GE
DEFE
NCES
WA
STE
WAT
ER
ENERGY
BUILDINGS
TRANSPORT
CITY AND
LOCA
L
GOVERNMENT AND REGIONAL
INDUSTRY
SETTLEMENTSINFORMAL
Deliverability
21 3 4 56
78
910
11
12
13
14
15
16
17
18
19
20
21
22
23
24
25
26
27
28
29
30
31
32
33
34
35
36
37
38
39
40
41
42
4344
4546
4748
4950515253545556
5758
5960
61
62
63
64
65
66
67
68
69
70
71
72
73
74
75
76
77
78
79
80
81
82
83
84
85
86
87
88
89
90
91
92
93
9495
9697
9899
101 102100
Deliverability
The deliverability of solutions Some interventions are difficult to deliver due to their complexity and financing requirements, the number of stakeholders involved, the newness of the solution, the strength of vested interests, weak political incentives to invest, or split incentives and behavioural barriers.
Other solutions including improving renewable energy access to unserved communities, introducing metro systems, and introducing Combined Heat and Power at district level can be complex and challenging to finance and deliver.
Many policies in the transport sector can often be taken forward on a sector or multi-sector basis, requiring less broadly distributed planning capacities.
42
29
31
33
34
35
36
37
38
39
32
41
4344
40
30
4746
45
25
26
RELATIvELy EASy
MODERATELy cHALLENgINg
cHALLENgINg
Policies for future proofing differ markedly in the capacity required for successful implementation: cities can use this assessment to identify the policies most relevant to them and to identify the capacities they want to strengthen
77
75
73
71
Certain solutions like those in the water sector such as the introduction of simple latrines, SUDS, and greywater harvesting, and water efficient landscaping are relatively easy to deliver.
As well as strong governance and broad based support, policies such as the relocation of development from areas vulnerable to climate change and the planning of key infrastructure in less vulnerable locations also require strong participatory and integrated urban planning capabilities across multiple layers of government and civil society.
66
62
32
LOw PLANNINg REquIREMENTS
HIgH PLANNINg REquIREMENTS

Source: Atkins
Future Proofing Cities | 99
Atkins in partnership with
Economic diversification of urban economy
Relocation of development from vulnerable areas
Diversification of agriculture away from climate and resource sensitive areas
Fully integrated Eco-villages/Neighbourhood schemes
Improved energy access (renewable) to unserved communities
Diversification of energy sources and distribution
Adaptive social protection programmes (e.g. combining DRR and CCA)
Programmes to improve social cohesion e.g. gender and race relations
Insurance programs (targeting the poor e.g. microinsurance)
Public health programmes and hazard planning to tackle vector borne diseases and climate related risks
9
25
7
58
66
1
3
4
5
6
Affordability
Strength and legitimacy of governance
required
Planning capacity required
deliverability
deliverability
Cluster 2: Challenging to implementThere are also a range of policy solutions which are relatively expensive, have substantial governance or planning requirements, and are complex to deliver. These include a diverse range of policies from relocating development away from vulnerable areas and implementing social protection programmes to policies to support innovation. The planning and implementation of these policies is likely to require significant and sustained investments and efforts to bolster urban capacities.
Metro and urban rail systems
Vehicle quota systems
Smart Grids
Desalinisation plants*
Creation, enhancement, management, and monitoring of habitats and important species
Reform pricing of energy e.g. reviewing energy subsidies
Upgrade skills of labour force to promote labour flexibility and innovation in responding to climate related and resource shocks
Schemes to encourage intra-country or FDI into low carbon, resource efficient, and climate sensitive technologies/sectors
Mixed use zoning
Increased density incentives/standards
32
46
63
70
82
2
12
15
17
20
Affordability
Strength and legitimacy of governance
required
Planning capacity required
Cluster 3: Trade-offs between affordability, governance and planning requirements, and deliverabilityCertain policies have substantial trade-offs between affordability, governance and planning requirements, and deliverability. For example, developing and implementing an underground metro system might not require the same levels of broad based societal support or participatory and integrated planning approaches that the relocation of existing development from flood risk areas might require but it is capital intensive and has high operational costs, as well as being complex to deliver. Another good example is reforming energy subsidies. This is likely to be affordable given the significant costs often borne to maintain subsidies, but will be challenging to govern, plan, and deliver, aside from the significant impacts likely to be felt by the urban poor without transition mechanisms.
Improvements in public transport information
Building simple latrines
Urban agriculture and local markets
Standard bus services
Managed/Regulated para-transit e.g. minibuses
Micro generation
Climate resilient / water efficient landscaping
Restrictions on pesticides/chemicals
Low cost enhanced efficiency stoves
Greenbelt/Growth boundaries
34
73
90
33
36
60
77
96
100
27
Affordability
Strength and legitimacy of governance
required
Planning capacity required
deliverability
Cluster 1: Easy to implementThere are a range of policy solutions that are relatively affordable, do not have substantial governance or planning requirements, and are relatively easy to deliver. These range across sectors including urban agriculture, building simple latrines, bringing in standard bus services, and improvements in public transport information.
Overall ease of implementation
Low affordability, high minimum governance and planning requirements, and very challenging to finance and deliver.
Medium affordability, medium minimum governance and planning requirements, and moderately challenging to finance and deliver.
High affordability, low minimum governance and planning requirements, and relatively easy to finance and deliver.

100 | Future Proofing Cities
Atkins in partnership with
Certain solutions, for example, Metrosystems may have the potential to generate significant reductions in carbon emissions but may be more costly per tonne of emissions avoided than Bus Rapid Transit (BRT); a combination of BRT with other walking and cycling infrastructure to encourage a switch in modalities away from car use may well represent a more cost effective solution.
Equally, policies such as flood defences have the potential to avoid substantial damage costs but can be ‘high regrets’ options in the face of uncertain climate change projections i.e. the investment is not reversible, presents a significant investment cost, and would not be economically justifiable under current climatic conditions. Focusing on so-called ‘no or low regrets’ or flexible policy solutions may prove a more effective strategy (e.g. designing flood defences so that they can be adjusted).
There are a range of well known and emerging approaches for quantitatively assessing the impacts of policies in addressing environmental risks and uncertain future risks. These include looking individually at carbon abatement potential, averted climate change damage costs, total resource efficiency benefits, and the biodiversity value of the ecosystem services provided.
The diagrams outlined in this section provide an illustrative mapping of the impact and cost effectiveness of policies addressing different environmental risks. This was based on a high level integrated assessment of the environmental, social, and economic impacts of policies for future proofing as background to this report to illustrate the different lenses that cities can look through to help them prioritise policies for implementation.
Maximising impact and value for moneyCities should focus on solutions which maximise returns on investment. Cities should quantitatively assess - where possible - the costs and benefits of future proofing options in terms of their environmental, social, and economic impact.
Maximising value for money from urban interventions is crucial if cities are to build momentum for a sustained programme of future proofing.
Maximising value for money from urban interventions is crucial if cities are to build momentum for a sustained programme of future proofing.

Impact and cost effectiveness of mitigation policies:Size of carbon abatement vs cost of abatement
Source: Atkins
Source: Atkins
Future Proofing Cities | 101
Atkins in partnership with
Impact and cost effectiveness of adaptation policies: Averted damage cost vs cost effectiveness
Low High
High Regrets
No/LowRegrets
AVERTEd dAMAGE COST
1. High averted damage cost, high regrets (look to build in design flexibility to deal with
climate uncertainties )
2. High averted damage cost, no/low regrets (high cost benefit ratio in tackling climate risks)
3. Low averted damage cost, no/low regrets
4. Low averted damage cost, high regrets (low cost benefit ratio in
tackling climate risks)
Illustrative
Low High
High
Low
CARbON AbATEMENT
1. High carbon abatement, high cost solutions
2. High carbon abatement, low cost solutions (high cost benefit ratio in addressing
emissions)
3. Low carbon abatement, low cost solutions
4. Low carbon abatement, high cost solutions (low cost-benefit ratio in
addressing emissions)
Illustrative
16
28
77
Other options such as public health programmes or protection of groundwater resources are no/low regrets options i.e. they make sense to do even without climate change.
4
81
90
91
97
98
5
9
12
13
1425
4754
55
56
57
70
72
7882
83
84
85
87
88
89101
93
95
99
Building enhanced flood defences to cope with future climate change is a high regrets option i.e. it is a relatively high cost and its benefits only materialise if climate change is realised.
10
1628
40
41
46
31
34
49
5975
78
79
80
90
91
97
100
76
Transport solutions such as Metro and public transport lanes can have a significant impact in reducing emissions versus business as usual but can sometimes be quite costly per tonne of CO2 avoided.
2
8
11
12
13
14
15
17
18
19
20
21
22
27
29
30
32
33
36
37
39
43
44
45
48
50
51
52
53
56
57
58
61
62
63
64
66
67
68
74
81
85
101
102
96
98
99
35
Other solutions such as fuel switching in the public transport fleet could yield high carbon abatement at relatively low cost.
1
9
23
42
38
60
65
COST
PER
TO
NN
E O
F CO
2 AV
OId
Ed
Policies for future proofing differ markedly in their cost effectiveness in addressing environmental risks: there can be significant trade-offs between absolute impact and affordability
102
37
1011
15
24
26
27
53
58
59
69
71
74
75
76
86
9479
806

Source: Atkins
102 | Future Proofing Cities
Atkins in partnership with
looking at environmental, social, and economic benefits together
It is also important for cities to estimate - where possible - the potential size of social and economic impacts. This can help cities determine the policies that could act as initial entry points to build momentum behind a future proofing programme. Developing fully integrated eco-villages or neighbourhood schemes, for example, can (provided they are designed in the right way with local communities) help cities address multiple environmental risks as well helping underpin economic development.
These can then be complemented by policies with less significant immediate social and economic impacts but higher environmental benefits over time. For example, water pricing reform can help cities address multiple environmental risks but can act as a short term break on economic growth and competitiveness as businesses adjust to higher prices for water use.
By looking at all these dimensions together cities can determine the impact of policies in addressing environmental risks, as well as those that generate short-medium term social and economic benefits.
However, accurate quantitative assessments of environmental, social, and economic costs and benefits can only be undertaken at the city level. Cities, for example, have very different business as usual emission trajectories and human and economic assets at risk from climate change hazard risks. See the box below for an example at the city level of looking at the environmental, social, and economic benefits of future proofing policies together.
Moreover, cities will have different priorities in terms of the weight they accord to different policies along three key dimensions:
� Environmental versus social versus economic impacts
� Absolute impact versus cost effectiveness
� Impact versus ease of implementation
The advantage of using the multi-criteria framework outlined in this report as a framework for decision-making is that it helps encourage cities look for policies which maximise synergies and minimise the trade-offs.
Madurai is an example of a city in India looking at ways to shift its urban development path to one which reduces carbon emissions. Atkins has applied its Carbon Critical masterplanning tool to look at the benefits of a range of alternative low carbon scenarios.
Based on a range of global carbon price scenarios this work showed that a low carbon base case scenario could generate carbon savings for Madurai (in terms of avoided damage costs) worth between $951 million and $2.12 billion cumulatively over 20 years primarily from shifts in transport modes and savings from embodied and operational carbon in buildings.
Madurai will also benefit from substantial savings in its energy consumption. Savings in energy bills could reach $40 million per annum by 2020 and over $100 million per annum by 2030. This equates to saving over $1 billion over a twenty year period. The low carbon option will also help Madurai improve its resilience to long run trend increases in the price of traditional energy sources by helping diversify its energy mix into on-site renewables.
The low carbon option includes provision for 825 hectares of green open space by 2030. Based on the amenity value derived from a range of ecosystems services this could be worth an additional $25 million per annum by 2030 and $164 million in present value terms over the next 20 years.
The low carbon option will also generate significant health benefits for Madurai, mainly from the shift in transport modes. For example, the low carbon option could save around 50,000 lives over the next twenty
years, or around 2000 lives per annum, mainly from improvements in air quality.
In addition, low carbon cities can generate jobs including in public transport, renewable energy, waste
management and recycling, urban and peri-urban agriculture, and green construction. In Mumbai, for example, 160,000 jobs are dependent on public transport alone.
Atkins planning proposals for the future growth of Madurai 2031

Source: Atkins
Future Proofing Cities | 103
Atkins in partnership with
The aggregate ‘future proofing’ impact of adaptation policiesAverted damage costs vs cumulative impact
AVERTEd dAMAGE COST
1. ‘Win-wins’ or ‘triple-win’ benefits:Significant impact in addressing identified risk
and unidentified/potential future risks
2. Significant trade-offs between impact in addressing identified risk and unidentified/
potential future risks
3. Low impact in addressing identified risk and unidentified/
potential future risks
4. Significant trade-offs between impact in addressing identified risk
and unidentified/potential future risks
CUM
UlA
TIVE
IMPA
CT
Illustrative
1314
15
7
56
85
9
11
10
12
27
5758
69 74
76101
102
99
281690
91
97
98
773
5
6
24
25
26
47
53
54
55
59
70
717275
82
84
86
87
88
89
93
94
9578
79 80
4
81Neighbourhood recycling schemes have some impact in averting the damage costs associated with climate hazards by reducing the amount of waste that can obstruct drainage systems during times of flooding, but these schemes have a greater impact in reducing material resource use and carbon emissions, as well as energy consumption.
Riverbank stabilisation can avert significant damage costs from flooding and other climate related hazards but do not have significant other ancillary benefits.
83
Assessing the aggregate future proofing’ benefit of polices
Integrated approaches to assessing the ‘cumulative’ impact and cost-effectiveness of policies which address multiple environmental risks is a particularly interesting lens. The figure below provides an illustrative example of the cumulative impact of policies which respond to climate change hazards (‘adaptation policies’) when their additional co-benefits in terms of carbon abatement and total resource efficiency benefits are also taken into account.
This can be thought of as the aggregate ‘future proofing’ benefit of polices. Additional research is required to determine how approaches to estimating individual benefits (e.g. carbon abatement) can better be brought together.
Crowded Makola Market in central Accra.©
to
m C
ock
rem
/get
ty im
ages

104 | Future Proofing Cities
Atkins in partnership with
measures to encourage reduced use of private transport modes. On the other hand, some measures address one risk, whilst exacerbating other risks. For example, climate change induced energy-intensive adaptation such as air conditioning or desalination plants to provide additional water. Other options are dependent on other measures being in place for them to be effective. Here systems thinking is needed. Recent work by the OECD provides new guidance in this area.6
Some policies are simply about safeguarding more immediate economic gains, whereas others are about promoting a broader transition or wider transformation to a new urban development pathway which may be more resilient in the long run.
The diagram on the facing page summarises the average environmental, social, and economic impact of future proofing solutions combined with their ease of implementation i.e. the capacity required to implement. This type of analysis can help cities to understand better which policies will have maximum impact based on their specific policy objectives and are feasible to implement given their respective capacities. Annex 2 provides further detail of the integrated assessment of the various policy options highlighted throughout this chapter.
When developing portfolios of solutions it is particularly important for cities to focus on policy measures which complement and reinforce other solutions. Measures to boost the availability of public transport options, for example, complement
Creating integrated policy portfolios
Synergies and conflicts between mitigation and adaptation options
In assessing the environmental, social, and economic impacts of future proofing policies, the synergies and trade-offs between them, and their ease of implementation, cities can start to assemble integrated policy portfolios to future proof urban development.
Increases GHG Emissions
Complementary Objectives
Conflicting Objectives
Conflicting Objectives
Reduces GHG Emissions
Very high urban density
Small hydro (where water scarcity issues)
Urban greenery
Building insulation
Water efficiency
Renewable energy
Air conditioning
Desalination of water
boos
ts C
limat
e
Resi
lienc
e
Redu
ces
Clim
ate
Re
silie
nce
6 OECD (2010). Cities and Climate Change

Source: Atkins: The radial diagram demonstrates potential policy impact based on a qualitative assessment of the policies drawing on input from the project’s expert group
Future Proofing Cities | 105
Atkins in partnership with
NATURAL H
ABITAT & GREEN SPACES
FOOD &
FI
BRE
DISASTER PREPAREDNESS
FLO
OD
& S
TORM
SUR
GE
DEFE
NCES
WA
STE
WAT
ER
ENERGY
BUILDINGS
TRANSPORT
CITY AND
LOCA
L
GOVERNMENT AND REGIONAL
INDUSTRY
SETTLEMENTSINFORMAL
21 3 4 56
78
910
11
12
13
14
15
16
17
18
19
20
21
22
23
24
25
26
27
28
29
30
31
32
33
34
35
36
37
38
39
40
41
42
4344
4546
4748
4950515253545556
5758
5960
61
62
63
64
65
66
67
68
69
70
71
72
73
74
75
76
77
78
79
80
81
82
83
84
85
86
87
88
89
90
91
92
93
9495
9697
9899
101 102100
Ease of implementation (Average)
Impact (Average)
21 3 4 56
78
910
11
12
13
14
15
16
17
18
19
20
21
22
23
24
25
26
27
28
29
30
31
32
33
34
35
36
37
38
39
40
41
42
4344
4546
4748
4950515253545556
5758
5960
61
62
63
64
65
66
67
68
69
70
71
72
73
74
75
76
77
78
79
80
81
82
83
84
85
86
87
88
89
90
91
92
93
9495
9697
9899
101 102100
If designed in the right way, sector solutions such as providing affordable houses for the poor, implementation of design principles for new build, improving water and sanitation systems, efficient waste collection and solid waste management, and transport solutions such as Bus Rapid Transit have potential to generate environmental, social, and economic benefits and can be relatively easily implemented.
Certain policies in the transport sector such as improvements in public transport information may have relatively low aggregate environmental, social, and economic benefits but can be ‘low hanging fruit’ given their ease of implementation.
Large scale renewable generation at the city scale, and introducing new metro systems can have significant environmental, social, and economic benefits but can be challenging to implement.
By looking at the average environmental, social, and economic impact of future proofing solutions combined with their ease of implementation cities can better understand which policies will have maximum impact based on their specific policy objectives and can be implemented given their specific capacities.
HIgH
LOw
Ease of implementation (Average)
Impact (Average Environmental, Social, and Economic Impact)
64
58
17
76
20
18
19
15
31
34
80
56
102
Policies at the national and regional levels such as the targeted promotion - and attraction of domestic investment and FDI - into new less energy and carbon intensive sectors can drive growth and job creation.
Complementary policies such as the use of mixed use zoning, mass transit, bike, and pedestrian orientated development planning, and incentives to promote density should be at the core of any urban development strategy as they have potential to generate environmental, social, and economic benefits and can be relatively easily implemented.
29

106 | Future Proofing Cities
Atkins in partnership with
© M
arti
n h
arve
y/g
etty
imag
es
Cape town, south Africa, aerial view

Future Proofing Cities | 107
Atkins in partnership with
Source: Atkins
Cities are highly dynamic systems and changes to their vulnerabilities and capacities, interacting with environmental risks, can be rapid. These changes can be caused by a wide range of external (e.g. climate change, national policy changes) and internal factors (e.g. city driven policy actions), including growing environmental risks.
Given the rapidity of changes facing them cities would benefit from taking a proactive response to the growing risks they face. There are a number of examples from history which show how cities which fail to act quickly in relation to emerging risks have faced the consequences in the form of slowing or contracting economic growth and broader development.
Future development pathways
On the other hand, a proactive response anchored in anticipating and planning to meet future needs has potential to support cities to leapfrog traditional development paths. These approaches can help cities to bolster their resilience to risks, and potentially promote a transition or transformation to an alternative development path.
The figure below shows how a future proofing approach can catalyse urban development which reduces risks and boost returns in terms of falling vulnerabilities and a greater ability to respond to future challenges.
As outlined in Chapter 1, a growing body of evidence suggests that alternative development paths may be more feasible than previously realised. The extent to which leapfrogging is possible, for example, via disruptive innovations or transformations to urban systems should be a priority for future research.
low
low
High
High
Risk
low carbon, climate and resource resilient cities Cities facing multiple
risks with lower levels of vulnerability and greater
capacity
Urban Future Proofing
Conventional Approach
Cities facing multiple risks with high vulnerability and
low capacity
Return
‘Future Proofing’ urban transitions
Cities in the developing world should take action now to future proof urban development pathways; this can help them tackle vulnerabilities, boost their capacities, and reduce the risks to growth and poverty reduction.

108 | Future Proofing Cities
Atkins in partnership with
However, there are a multitude of policy instruments at the disposal of national, regional, and municipal governments which can start to overcome these challenges. The introduction of market prices for carbon, water, and land, for example, may well become a reality in some regions of the developing world over the next decade. National, regional, and municipal authorities in the developing world are also beginning to explore other financial and fiscal instruments such as feed-in tariffs, fuel duty increases, and purchasing pools for more efficient public transport fleets. Investments in education and building awareness is crucial, such as public awareness raising of the long term benefits of new technologies, better information on climate scenarios, and peer to peer learning. However, more research is required to look at how cities in the developing world can better overcome market and non-market barriers to future proofing.
Whilst risks such as rising energy and water prices will encourage governments and businesses to naturally start to invest more into future proofing, as outlined in Chapter 1, cities in the developing world can ill afford to take a reactive approach. This is likely to undermine economic prosperity, poverty gains, and leave many cities fighting for their survival as environmental stresses and shocks ripple through increasingly interconnected urban systems.
Progress is being made by many cities to future proof their development but more needs to be done. This will require greater efforts to overcome the wide range of market failures, coordination problems, and governance failures that often deter investments in future proofing in cities.
If a wide range of solutions can generate environmental, social, and economic development benefits, it poses the question: why are many cities still not following more future focused development paths? Part of the answer to this question is that they are starting. A recent report by the C40, for example, suggests that many cities in the developing world are starting to take action to reduce carbon emissions.7 This report has also demonstrated the progress being made by cities facing different risks and at different stages on their development trajectories such as Bangalore, Maputo, Nairobi, Karachi, and Bangkok. It is not easy, but progress is being made.
The other part of the answer is that market failures, coordination problems, governance failures, and uncertainties often deter investments in future proofing. A wide range of future proofing solutions, for example, typically suffer from market failures which lead to underinvestment by the private sector. These include: (i) insufficient access to capital (ii) long pay-back periods (iii) lower current returns versus alternative solutions (iv) split incentives e.g. energy efficiency savings accrue to a different party to that financing the investment; and (v) information gaps in relation to new technologies. Many urban infrastructure investments are also public or quasi-public goods which naturally require public finance to overcome market failures.
Progress to date and other barriers to action
7 C40 Cities and Arup (2011), Climate Leadership in Cities
“the work that the C40 Cities has already accomplished has beencritical for reducing carbon emissions worldwide, but there is far more to be done.“
“the work that the C40 Cities has already accomplished has beencritical for reducing carbon emissions worldwide, but there is far more to be done.“
Michael r. bloomberg, Mayor, new york City and Chair of C40 Climate Leadership group

Future Proofing Cities | 109
Atkins in partnership with
Summary
Main messages � To respond effectively to environmental risks requires a multi-dimensional response,
tailored to the specific risks, vulnerabilities, and capacities of different cities.
� A multi-criteria approach can be used to identify policies which maximise environmental, social, and economic benefits and can be implemented given institutional capacities.
� This process begins with a diagnostic of a city’s urban type, vulnerabilities, and capacity to act.
� The next steps are to identify policy solutions which respond to relevant environmental risks, target vulnerabilities and deliver wider economic development benefits, and can be implemented given the capacities available.
� Combined with an assessment of impact and cost effectiveness, these elements can be brought together to form integrated policy portfolios for future proofing.
Findings from assessment of policies for future proofing � Numerous policies can respond to multiple risks to generate ‘win-win’ or ‘triple-win’
environmental benefits; these can help all types of cities to future proof.
� Many of these policies are an extension of sound integrated urban planning and policy implementation.
� The built environment, water, and waste represent particularly significant entry points to deliver ‘triple-win’ benefits.
� There are numerous future proofing policies with significant potential to directly reduce urban poverty and boost short to medium term economic growth; a focus on these policies will be especially relevant to cities with high vulnerabilities and weak urban economies.
� A wide variety of policies are relatively easy to implement as they are relatively affordable, do not have substantial governance or planning requirements, and are relatively easy to deliver; similarly, these policies will be especially relevant to cities with capacity constraints.

110 | Future Proofing Cities
Atkins in partnership with

Future Proofing Cities | 111
Atkins in partnership with
MAin MessAges AnD reCoM-MenDAtions
05

112 | Future Proofing Cities
Atkins in partnership with

Future Proofing Cities | 113
Atkins in partnership with
Key messages 1. Cities in developing countries need to act now to future proof their urban development
Cities face significant risks to growth and poverty reduction from climate change, resource scarcities, and damage to vital ecosystems. The world’s cities occupy just 2 per cent of the earth’s land, but account for 60-80 per cent of energy consumption and 75 per cent of carbon emissions. Natural hazards such as flooding and drought, temperature extremes and heat waves, and tropical cyclone activity and extreme high seas already impact cities and these are expected to be exacerbated by climate change. Cities put pressure on environmental assets such as forests, water, and air to provide for the needs of their inhabitants. People living in cities are also particularly at risk from changes in the price of and disruption in the flow of critical resources such as energy, water, and food.
Cities in the developing world will be at the frontline of managing this challenge. With 75 per cent of the world’s population expected to live in cities by 2050 and 95 per cent of the urban expansion projected to take place in the developing world, cities in developing countries will be at the front line of managing this challenge. Over the next 20 years the urban populations of South Asia and Sub-Saharan Africa are expected to double to over 3.5 billion people.
Cities in the developing world - which still have significant numbers of people living in poverty - are particularly vulnerable to these risks. The number of people living in informal settlements is expected to reach nearly 900 million by 2020, leaving a significant number of people highly vulnerable to the stresses and shocks associated with climate hazards, resource scarcities, and degradation of ecosystems such as forests. These risks will ultimately damage the future economic growth potential of cities and impact on their ability to reduce urban poverty.
This section of the report outlines the key insights we have derived from the project. We believe that these seven points are important messages for anyone with an interest in, or working with cities in the developing world.
These points are targeted at national and regional level decision-makers and development agencies looking at the challenges facing portfolios of cities in developing countries. They are also relevant to cities themselves and national and multinational companies working in or investing in cities. This group includes the owners and managers of assets dependent on environmental services and critical resources in the water and energy sectors, agriculture, real estate and housing, financial sector, tourism, industry, and logistics and distribution. The messages will also be of interest to academic institutions and think-tanks.
The section concludes with a set of seven core recommendations to build on the findings of this report.
Main messages and recommendations

114 | Future Proofing Cities
Atkins in partnership with
2. Cities are in a unique position to act and the earlier they do so, the better
Cities can act and are in a unique position to respond to risks. Cities are natural units for driving innovation, derived from a concentration of people and economic activity that generate a fertile environment for the innovation in ideas, technologies and processes required to respond to the enormity of the environmental challenge. Institutions within cities also have a degree of self governance which allows city policymakers to mobilise action to deliver integrated policy responses to address environmental challenges.
the earlier cities act the better. A strategy based on grow first, tackle environmental risks later is unlikely to be available to cities in the developing world given the risks to growth from depletion of natural resources, climate change, and global population pressures. At the national level we are already seeing the brake that environmental constraints are having on growth with environmental degradation costing countries as diverse as Pakistan, Nigeria, and Ghana up to 10 per cent of their GDP, and the costs of congestion alone in cities such as Dakar already in excess of 3 per cent of GDP. In tackling infrastructure needs and future proofing urban development cities have the potential to grow in ways which minimise the future economic impact associated with different environmental risks. Many policies to respond to environmental risks can also generate wider social and economic benefits.
3. Cities need to think and act in an integrated way when responding to environmental risks
Multiple and interconnected risks require integrated thinking about potential solutions. The environmental risks relevant to cities cannot be looked at in isolation; they are multiple, interlinked, and they are growing. Changes in rainfall patterns and greater water use, for example, will have a significant impact on cities which receive a significant proportion of their energy from hydropower. Clearing land for agriculture in the urban fringe to improve food security can have a significant impact on biodiverse forests and other natural habitats. The risks relevant to cities also operate at different levels from the global to the regional and local levels, and many risks are uncertain. Given that cities are complex systems for the exchange of goods and services which are dependent on the smooth flow of resources such as water and low-cost energy, this leads to the prospect of rapid contagion of risks through increasingly connected urban systems. Cities therefore need to think holistically by identifying policy solutions which can respond to multiple, interlinked risks.
Cities also need to think about solutions capable of generating wider economic and social benefits. Only by balancing environmental, social, and economic objectives will cities be able to build support from communities and city stakeholders for sustained programmes of action.
by thinking holistically cities can act more confidently in the face of uncertain risks. Over time the risks that cities face will change with technology, climate change, economic pressures, and population growth. Some risks, such as climate change, are highly uncertain. However, uncertainty is no excuse for inaction. Cities can use a range of plausible scenarios to assess uncertainty and identify ‘low regrets’ measures which make sense to do anyway because they deliver other environmental benefits and wider economic and social benefits. Cities can also focus on measures which have design flexibility or are not irreversible (e.g. flood defence systems which are portable, flexible, or can be extended as more information on flood risks become available).
4. Characterising cities using urban types based on the most significant risks they face can help to identify the most relevant policy options for future proofing
Despite variations in their characteristics and location, it is possible to group cities in developing countries into urban typologies based on the most significant risks they face. Based on a unique comparative assessment of the risks relevant to 129 cities across 20 countries in Asia and Africa, this report found that cities can be grouped into five urban typologies based on the most significant environmental risks they face including carbon emissions and energy use, climate hazards, and risks to regional support systems. This helps pinpoint the groups of cities that have the most significant risks and where risks may intensify over time.
the most significant group of cities are those that drive or are impacted by multiple environmental risks. These cities are characterised by high energy use and carbon footprints, climate hazards such as flooding and cyclones, and risks to regional support systems such as water, food, and natural ecosystems. This group spans some of the world’s largest cities such as Bangkok, Jakarta, Delhi, and Mumbai, to smaller cities such as Guwahati and Bareilly in India. These cities are likely to require action to address risks across a broad front.

Future Proofing Cities | 115
Atkins in partnership with
For cities with a risk profile focused around one cluster of risks, their priority will be to take focused action to tackle those risks. Bangalore, for example, has a high energy and carbon footprint driven by new high rise glass facade developments. Karachi faces significant risks to its water and food systems due to drought and the limited availability of agricultural land catchments. And Maputo faces significant risks from flooding due to its geographical location and other factors.
Few cities have a low risk profile. These are often cities that are currently small, but with significant growth prospects. These cities have a window of opportunity to pursue a development path that supports planned expansion but in way that minimises the environmental risks to long term prosperity and poverty reduction.
the report defines policies which can be combined into a portfolio to address the challenges facing different types of cities. A broad set of over 100 policies are outlined to demonstrate the range of solutions that can be used for future proofing. These span a broad range of strategic and sector polices, from those focused on physical infrastructure such as Bus Rapid Transit and metro systems, to strategic level policies such as diversifying the urban economy away from areas of high flood risk. Cities can make the greatest gains by focusing effort on solutions which address their challenges:
� type 1: energy intensive cities with significant carbon footprints. Particular attention is needed by these cities on policies in the transport, energy, and buildings sectors to promote the move to a lower carbon, less energy intensive future. For many cities, carbon emissions from transport can account for a significant percentage of carbon emissions and energy use. More attention is often needed by these cities on strategic planning to manage their growth and the effective planning of mass transit options such as Bus Rapid Transit and demand management schemes, and many cities could do more to consider the potential for renewable energy generation within their boundaries, and delivering lower carbon buildings.
� type 2: Cities with major climate hazards. As well as specific hard infrastructure investments to manage risks such as flooding, attention is needed by these cities to manage climate risks at the strategic level. For example, insufficient attention is generally given to diversifying the urban economy away from climate sensitive sectors, effective land management policies in climate vulnerable areas, and public health measures and hazard planning in the event of climate related disasters. Attention should also be given to greening policies and green infrastructure programmes which can be used to tackle climate risks as well as other risks such as carbon emissions.
� type 3: Cities with risks to regional support systems (such as water and food systems). These cities can draw on a wide range of solutions for future proofing as almost all measures which tackle carbon emissions and climate hazards can also respond to resource and ecosystem risks. These include policies as diverse as urban agriculture and building simple latrines. Particular attention should be paid to managing environmental risks in the wider regional catchment of these cities and peri-urban areas, including risks to water and food security, and to biodiverse natural habitats.
� type 4: Cities facing multiple risks. Taking action across multiple sectors, harmonising policy responses, as well as striking the balance between long term measures and those focused on immediate disaster risk reduction will be particularly important for these cities, but will be challenging. Many low capacity cities in this type can look to cities such as Bangkok which have experienced the governance, planning, finance, and delivery challenges involved in addressing multiple risks through creative solutions such as the use of public-private partnerships to promote shifts in behaviours.
� type 5: Cities with a low current risk profile. These cities will continue to grow and develop and should look for opportunities to avoid locking themselves into long-lived maladapted development paths. In short, a low current risk profile is no reason for inaction.
5. some city-level policies can generate multiple environmental benefits; these can provide a foundation for cities to build a programme of mutually reinforcing future proofing investments
numerous policies can respond to multiple environmental risks by (1) reducing carbon emissions and energy use; (2) responding to climate hazards; and (3) helping protect or manage water and food systems and natural habitats. These can be thought of as ‘triple-win’ or ‘win-win’ policies in addressing environmental risks. These policies could form part of a core package of policies for all urban types, and can be especially useful for city types facing multiple risks. These can also support cities to address uncertain future risks.
Many of these policies are an extension of sound integrated urban planning and infrastructure investment. This includes policies such as mixed use zoning, use of greenbelts, developing mass transit, pedestrian, and bike orientated development plans, and prudent land management. This provides an opportunity for cities to build on existing initiatives and good practice in urban planning and combine these with more specific ‘triple-win’ and ‘win-win’ policies such as

116 | Future Proofing Cities
Atkins in partnership with
urban greening and tree planting programmes which are often overlooked. Cities in emerging economies such as Curitiba, Bogáta and Ahmedabad provide good examples of the power of integrated approaches to planning urban development to tackle issues such as congestion issues and using transport systems to unlock opportunities for more sustainable patterns of urban growth.
the built environment - especially new development – represents a particularly significant entry point to deliver ‘triple-win’ benefits, as are policies to improve efficiency of water and waste. Cities such as Bangalore are starting to show how to unlock opportunities in the built environment by combining measures which incorporate rainwater harvesting and grey water reuse, recycling, pollution control, and solar power systems to generate ‘triple-win’ and ‘win-win’ benefits. These examples can be instructive for other cities facing similar risks. Other policy solutions in the built environment such as the implementation of solar orientated neighbourhoods and designing slum upgrade programmes to minimise resource use are less widespread and there is significant scope for wider uptake of these approaches in cities which are rapidly growing.
6. A focus on policies which can deliver wider social and economic benefits as well as environmental ones will be particularly important for cities with high vulnerability and lower capacity to respond to risks
Within urban types, the vulnerability of cities to environmental risks varies markedly. In cities facing significant climate hazards, for example, cities with a proportion of people living in poverty and in informal settlements are expected to be hit first and hardest by environmental risks such as climate hazards: their residents do not have the assets to protect themselves against stresses and shocks and poor residents tend to be located in the most vulnerable areas and in poor quality housing. Similarly, in energy and carbon intensive cities with high levels of vulnerability, rising energy prices will have a significant impact on livelihoods of the urban poor who already spend a significant proportion of their income on energy for heating and lighting, and in many countries, national policies subsidising energy are unlikely to be sustainable in the medium to long term.
Despite the economic rise of india, several cities such as Jaipur and Patna continue to remain particularly vulnerable to environmental risks, as do many cities across the Democratic republic of Congo, nigeria, sudan, and Malawi such as kinshasa, kano, and khartoum. These cities tend to have high proportions of people living in multi-dimensional poverty and informal settlements with poor access to energy, water, and sanitation, and are likely to be impacted greatest by environmental risks such as flooding, cyclones or rises in the price of energy. Across 59 cities assessed in India, over 48 per cent of the population live in multi-dimensional poverty. With a 36 per cent projected increase in population in these Indian cities by 2025, this is likely to increase the proportion of people vulnerable to environmental risks.
in contrast, cities across countries such as indonesia, Vietnam, and ghana such as Jakarta, ha noi, and Accra tend to have lower relative levels of aggregate vulnerability to environmental risks. The average proportion of people living in multi-dimensional poverty in the cities of these countries, for example, is only 17 per cent, compared to the 41 per cent across the 129 cities featured in this report. With both lower rates of vulnerability and generally slower projected growth rates it is likely that the impacts of environmental risks could be more easily managed. Cities with the highest numbers of vulnerable people continue to remain in the largest cities in South Asia such as Kolkata, Mumbai, Karachi, and Dhaka. In these four cities alone, over 32 million people live in multi-dimensional poverty which highlights the scale of the challenge.
As with vulnerability, the capacity of cities within urban types also varies considerably. This is shaped by the strength of their urban economies, governance, planning, finance, and delivery systems. Effective planning systems, for example, will be critical to the success of cities in responding to current and future challenges given their central role in shaping urban development; however, many cities exhibit systemic weaknesses in their integrated and participatory planning capacities.
Assessing vulnerability and capacity to act is important to help cities design an appropriate response to the specific challenges they face. For cities such as Maputo with high numbers or people living in multi-dimensional poverty and systemic weaknesses in capacity, for example, the focus may naturally be on policies which benefit the urban poor, boost basic service delivery, and are cheap, simple, and cost effective. Other cities with lower levels of vulnerability and greater capacities to respond to risks may be able to focus on more complex, costly, and capital intensive solutions. Some cities in India and other South Asian

Future Proofing Cities | 117
Atkins in partnership with
countries, for example, are expected to almost triple their per capita income by 2025, with growth rapidly outstripping population pressures; this is likely to give them greater headroom to respond to environmental risks and infrastructure gaps than cities with weaker growth prospects which may require additional finance to help them plug financing gaps.
there are numerous future proofing policies with significant potential to directly reduce urban poverty and boost short to medium term economic growth. For example, Bus Rapid Transit and improvements to walking and cycling infrastructure provides affordable transport to those on more limited incomes and boosts capital spending, creates jobs, and reduces the cost and efficiency of transport. These policies can help all cities - but especially those with high vulnerabilities and weak urban economies - to build momentum behind future proofing programmes of investment.
there are also a range of future proofing policies that are relatively easy to implement. These include policy solutions such as urban agriculture, micro-generation, improvements to public transport information, and introduction of enhanced bus services. These policies are relatively affordable, do not have substantial governance or planning requirements, and are relatively straightforward to deliver. These policies are particularly relevant to cities with capacity constraints.
7. by following the future proofing approach cities can develop tailored programmes of investment to meet their multiple objectives
to future proof effectively, cities require an integrated assessment of environmental risks, vulnerabilities, and capacities as a foundation for identifying potential solutions. By bringing this urban diagnostic together with assessing the environmental, social, and economic impacts of future proofing policies, the synergies and trade-offs between them, and their ease of implementation, cities can start to assemble integrated policy portfolios which respond to the risks they face, deliver wider social and economic benefits, and can be implemented given capacities available.
Many of the policies outlined in this report can provide a good starting point for cities looking to initiate a process of future proofing. The assessment of policies featured in this report shows that there are a wide range of policies which can balance environmental, social, and economic objectives and can be implemented by most cities, even those with limited governance, planning, finance, and delivery capabilities. These policies can form the heart of any urban development strategy.
An Agenda for Action: Key Recommendations This report calls for leadership by city stakeholders, regional and national government, international funding agencies, philanthropics, academia, and private sector companies to plan for the long term by acting now to support cities to future proof their development. This will require skills to be leveraged from across the infrastructure, engineering, environment, planning, design, economics, and social science professions to help cities develop solutions at the nexus between urban planning, transport, water, energy, waste, agriculture, ecosystems, and design and architecture.
A significant number of cities in the developing world have already embarked on projects and initiatives aligned with a future proofing approach. Bangalore (India) is implementing a range of policies in the transport sector including a new metro system which has the potential to reduce its energy use and carbon emissions as well as improve mobility, and Karachi (Pakistan) is taking a wide range of steps to reduce its risks to water and food scarcities through measures such as groundwater conservation.
Nevertheless there is still a significant way to go for many cities as the collection of initiatives and projects often miss the impact and potential offered by a more integrated programme and approach to future proofing.
This report has seven overarching recommendations to build on the findings of this report. These are complemented by the more specific findings and recommendations interlaced throughout the report’s main chapters.
1. Developing future proofed urban strategies More needs to be done to support cities to develop future proofed urban strategies i.e. strategies which look to address in an integrated way environmental, social, and economic objectives. Building on sound diagnostic work, more cities should be supported and encouraged to develop integrated strategies and programmes of investment which are future proofed.
A good starting point would be to focus initially on opportunities which generate multiple environmental, social, and economic benefits which tend to be an extension of sound integrated urban planning and infrastructure investment.
Greater use of the future proofing approach outlined in this report could help cities to develop policy portfolios which maximise environmental, social, and economic benefits and which can be implemented given institutional capacities.

118 | Future Proofing Cities
Atkins in partnership with
2. unlocking and aligning finance – including climate finance - for future proofing There is a need to scale up and make finance more easily available to cities, including small and medium sized cities. This needs to be combined with efforts to overcome the market and governance failures which often deter investment in future proofing through the use of financial and non-financial instruments such as feed-in-tariffs to encourage investment into renewable energy generation.
Many cities in the developing world do not have the financial resources to respond to the challenges they face. Karachi, for example, had a 200 per cent gap between revenue and expenditure in 2006. Many cities are therefore dependent on transfers from national government and many cities do not have projects and programmes which meet private sector investment criteria.
International climate finance could play a particularly important catalytic role in helping cities to unlock and implement integrated urban programmes to, for instance, reduce carbon emissions. This could be combined with new funding mechanisms such as dedicated city-focused infrastructure or urban development funds and municipal bonds to raise finance for bankable investment projects. For example, international financing for forest protection (REDD+) could support cities already located in the heart of rainforest basins to develop in a way which prevents the destruction of their forest assets.
Some action is already taking place. The World Bank has committed to making finance - including international climate finance - more easily available to cities. The Asian Development Bank has recently called for a greater focus on the integrated planning and financing of targeted interventions in specific urban regions. In addition, other funding agencies such as the Clinton and Rockefeller Foundations as well as bilateral donor agencies are scaling up their support to cities in the developing world to address environmental risks. These efforts should be welcomed and be given additional focus and attention, with a focus on ensuring finance provided to cities is long term, multi-sector, and aligned with city-owned future proofed strategies.
International development agencies should also consider reviewing the criteria they use in commissioning urban infrastructure to ensure investments are future proofed.
3. undertaking urban risk diagnosticsTo inform the evidence base underpinning future proofed urban strategies, cities need to undertake detailed diagnostics of the environmental risks they face. These diagnostics need to also include an assessment of vulnerability to risks, capacity to act, as well as an analysis of scale, projected pace of change, and physical geography. The background research for this project
has shown that not enough cities across the developing world are undertaking comprehensive assessments of the environmental risks to their future prosperity nor do many cities understand how to use these to develop future proofed urban strategies.
Further support is needed for cities in the developing world to help them undertake integrated urban risk diagnostics which can be used to mobilise city stakeholders to develop programmes of investment for future proofing. This should build on existing tools and approaches which are being piloted in many cities across the developing world supported by international funding agencies.
4. strengthening the capacity of urban governance, planning, and delivery systems Cities need support to strengthen their capacity to respond to environmental risks. This project has highlighted the importance of strong governance, planning, and delivery systems in shaping the ability of cities to respond to risks. Many cities have systemic institutional challenges in these areas, particularly surrounding their ability to mobilise and engage with local communities to inform decision making and the development of solutions.
Whilst progress is being made to reform governance, planning, and delivery systems in some cities, more attention should be given to these issues in the context of escalating environmental risks. This may require cities to explore different governance, planning, and delivery models, such as the use of people-public-private partnerships to overcome constraints in government capacity. Examples from cities as diverse as Nairobi and Bangkok can be instructive in this regard. As outlined above, the good news is that capacity can be built through the process of developing and implementing future proofing strategies, providing a focus for capacity building efforts.
5. improving the data and evidence underpinning city decision making Cities, national and regional government, funding agencies, and companies operating in developing countries need access to high quality data to inform their responses to environmental risks. Unfortunately, there is a general lack of comparable data on cities, particularly in developing countries.
Through the process of developing the urban risk database used as the basis for this report, this project has found there is a need for more attention to be given to the collection of comparable level data on the current and projected environmental risks, vulnerabilities and capacities of cities in the poorest countries. For example, of the 129 cities assessed as part of this report, 37 cities have limited comparative data on climate hazards.

Future Proofing Cities | 119
Atkins in partnership with
How to take the approach forward: Urban diagnostics and developing future proofed urban strategies
Potential components required to implement future proofing at city level.
Source: Atkins. Examples of existing tools include the Global Environment and National Information Evaluation Systems for Urban Impact Analysis (GENIES) recently developed by the Asian Development Bank (ADB), RACE by the Clean Air Initiative for Asian Cities (CAI), and the World Bank’s Urban Risk Assessment.
Many cities will need support to take forward the approach outlined in this report. Developing a robust future proofing strategy starts with an in-depth integrated and bespoke urban diagnostic of the risks, vulnerabilities, and capacities facing a city reflecting the spatial variation and differences within the city. Additional data and evidence gathering may be necessary as a first step. In some cities issues can vary as much within the city as between different cities. This can be used to then help identify and appraise potential solutions and opportunities for future proofing, both by updating existing plans and identifying new programmes of investment for future proofing.
Other key components include engagement between city level stakeholders to develop a shared vision of the future and exploring the role that all stakeholders can play in delivering that vision. Every city is different and has a unique political economy: a drivers of change analysis can therefore be instructive in helping to identify ways to promote change. Assessing governance and planning options, as well as financing and delivery modalities is also crucial.
To avoid long shopping lists of unachievable interventions, it is important for cities to bring this work together to determine which strategic investments to prioritise to bolster their resilience, and promote a broader urban transition or transformation to a new development path (and to phase
interventions appropriately). It is also important that cities put in place a robust monitoring and evaluation system to track key performance metrics over time: this can be crucial to helping cities to demonstrate progress in managing environmental risks (and reforming key institutions) which can then form a useful basis for attracting additional financing.
The urban risk database developed as part of this project has provided an initial metropolitan scale profile of urban dynamics and the environmental risks facing cities across the developing world. The city typologies and indicators featured in this report can be used to determine which areas merit additional analysis via an urban diagnostic to unpack the issues.
There are already various tools and resources to assist city authorities in assessing risks and vulnerabilities but to date these have been applied to a limited number of cities in low income countries and it is therefore difficult to assess their effectiveness at this stage. Many focus on one or two major risks.
Moving forward it will be important to build on existing approaches by continuing to pilot these tools in cities in the developing world to determine those most effective in different contexts with a longer term view to moving towards more integrated approaches to urban risk diagnostics.
Stakeholder engagement to
identify governance and planning
options
Urban diagnostic: risks, vulnerabilities,
capacities
Identification and appraisal of
potential solutions
CITy lEVEl FUTURE
PROOFING
City visioning and growth scenarios
Updates to future proof urban development and
infrastructure plans
Preparation of future proofed
programmes and projects
Financing and delivery options to
support future proofing
Framework for monitoring and review of performance

120 | Future Proofing Cities
Atkins in partnership with
Greater investment is needed by the international agencies to gather data on the risks facing cities – including at a spatially disaggregated level - building on existing efforts by the United Nations, World Bank, and other global institutions. Particular attention should be given to gathering data for small and medium sized cities. This data collection effort should be complemented by the development of growth projections which take full account of the impact that environmental risks including binding resource constraints may have on future growth.
Greater efforts to collect data could also be made by cities themselves, supported by national and regional government; this not only helps inform strategy but also help cities to track their performance in tackling risks such as congestion and air pollution over time. This can help cities to position themselves as more attractive places to do business.
6. Additional research and improved guidance In addition to improved data and evidence, additional research and guidance is needed to improve global knowledge of the range of environmental risks relevant to cities in developing countries and what can be done about them. For example, there is little information available on what environmental assets exist and what condition they are in at an urban level. Existing research efforts looking at the environmental challenges facing cities in the developing world should therefore be given renewed vigour and attention.
There is also a need for improved guidance to cities on how they can navigate the complex myriad of information on identifying and managing complex environmental risks. For instance, there is currently a dearth of accessible guidance to help cities identify appropriate indicators of risk, and how to distinguish between the supply and demand of environmental assets, the production and consumption activities impacting environmental risks, ecosystem processes and final ecosystem goods and services, and environmental stocks and flows.
7. identifying risks to existing and planned investment portfolios Owners and managers of assets in cities – including the banking community – may need to pay further attention to the risks to their investment portfolios and operations. The risks facing some of the world’s fastest growing cities identified in this report could have potentially profound implications for the management and maintenance of core urban infrastructure assets such water and energy systems, food systems in urban catchments, and transport infrastructure.
Responding to these risks may require steps by asset owners to review existing and planned investment portfolios in light of these risks, embedding different risk metrics in traditional approaches to measuring risk, and investing to future proof infrastructure in cities.
This report has shown that cities in the developing world urgently need to take steps to future proof their development by tackling the environmental risks to their long term prosperity. There is an important – but closing – window of opportunity for cities to take action. This report has shown that cities can take steps to future proof themselves. Not only can they act, but acting will also create cities of the future which are more environmentally, socially, and economically prosperous.

Future Proofing Cities | 121
Atkins in partnership with
bibLiogrAPhy
06

122 | Future Proofing Cities
Atkins in partnership with

Future Proofing Cities | 123
Atkins in partnership with
3iNetwork. (2009). India Infrastructure Report.
ACCCRN. (2008). Asian Cities Climate Change Resilience Network.
Allen, A & You (eds) (2002), Sustainable Urbanisation, Bridging the Green and Brown Agendas, DFID-UN-Habitat, London
Allen, A. (2009), “Sustainable cities or sustainable urbanisation?”, UCL Journal of Sustainable Cities, London
Andy Gouldson, Niall Kerr, Corrado Topi, Ellie Dawkins, Johan Kuylenstierna, Richard Pearce. (2012). The Economics of Low Carbon Cities: A Mini-Stern Review for the Leeds City Region. Leeds.
Barles, S. (2010), “Society, energy and materials: the contribution of urban metabolism studies to sustainable urban development issues”, Journal, Vol. 53, Issue 4
Bourdieu P. (1985), The Forms of Capital. In Richardson J.G., (Ed), Handbook of Theory and
Research for the Sociology of Education, pp.241-258
Bulkeley, H. (2010), “Cities and the Governing of Climate Change”, Annual Review of Environment and Resources, Vol. 35, Pp. 229-253
CDKN. (2010). Defining climate compatible development.
Centre for Low Carbon Futures. (2011), “A mini-Stern review for Leeds.”
Clark C, 1958, ``Transport maker and breaker of cities’’ The Town Planning Review 28 237 - 250
Clark, C. (1958), “Transport – Maker and Breaker of Cities” Town Planning Review Vol. xxviii, No. 4.
Columbia University. (2011). Climate change and cities - 1st assessment report of the urban climate change research network Columbia University.
C40 and ARUP. (2011). Climate action in megacities
Department for communities and local government. (2009). Multi - Criteria analysis.
Dobman, D. (2011). Climate Change and African Cities: vulnerability, poverty and the role of community community-based adaptation. Cape Town: IIED.
Dodman, D. (2009) “Blaming cities for climate change? An analysis of urban greenhouse gas emissions inventories”, Environment and Urbanisation, Vol. 2, No. 1, Pp. 185-201
Elzen, B. & Geels, F.W. & Green, K. (2004), System Innovation and the Transition to Sustainability, Edward Elgar, Cheltenham
European Future Energy Forum. (2010). Sustainable Cities: European Green city index.
Forum for the Future. (2010). Megacities on the move (guide to sustainable urban mobility in 2040). London.
Forum for the Future. (2010). The sustainable cities index.
Bibliography
general Friel, S., Dangour, A.D., Garnett, T., Lock, K., Chalabi, Z., Roberts, I. et al. (2009). Public health benefits of strategies to reduce greenhouse-gas emissions: food and agriculture The Lancet, 374 (9706), pp. 2016-2025.
Germanwatch. (2012). The Climate Change Performance Index.
Glaeser, E. (2008). The Economic Approach to Cities. Harvard Institute of Economic Research.
Glaeser, E (2011). “Triumph of the City,” Penguin Press
Graham, S. & Marvin, S. (2001), Splintering urbanism: networked infrastructures, technological mobilities and the urban condition, New York, Routledge
Global Adaptation Institute. (2011). Global Adaptation Index - measuring what matters.
Heynen, N. &Kaika, M. & Swyngedouw, E. (2006), In the Nature of Cities: Urban Political Ecology and the Politics of Urban Metabolism, Routledge, London
HMT. (2009). Accounting for the effects of climate change.
Hodson, M. & Marin, S. (2009), “Urban Ecological Security’: A New Urban Paradigm?”,International Journal of Urban and Regional Research, Vol. 33, Issue 1, Pp. 193–215
HPEC. (2011). Report on Indian urban infrastructure and services.
Hunt, & Watkiss. (2011). Climate change impacts and adaptation in cities: a review of the literature.
ICLEI. (2011). Financing the resilient city.
IDA. 2009. Dealing with the drought in Malawi. Available at http://web.worldbank.org/WBSITE/EXTERNAL/EXTABOUTUS/IDA/0,,contentMDK:22229775~menuPK:4754051~pagePK:51236175~piPK:437394~theSitePK:73154,00.html [Accessed 23/8/12].
IDFC. (2011). Urban infrastructure financing.
IDS. (2008). Climate change and cities.
IIED. (2010). Adapting to climate change in urban areas - the possibilities and constraints in low and middle income countries. IIED.
IIED. (2009). Climate change and the urban poor: risk and resilience in 15 of the world’s most vulnerable cities.
Institute for Integrated Economic Research (IIER). (2011), “Low Carbon and Economic Growth – Key Challenges”
IPCC Fourth Assessment Report: Climate Change. (2007)
Jitendra Jitu Shah. (2011). GENIES - Global Environment and National Information Evaluation System for urban analysis. Manila: ADB.
Kebede, A. S. (2009). Impact of climate change and sea level rise: a case study of Mombasa, Kenya. Southampton: University of Southampton.
Levy, C. (2009), Sustainable cities or sustainable urbanisation?, UCL, London

124 | Future Proofing Cities
Atkins in partnership with
Linquiti, & Vonortas, N. (2011). Real option analysis as a tool for valuing investments in adaptation to climate change.
McKinsey & Company. (2009). Environmental and Energy sustainability: An Approach for India. Mumbai: McKinsey & Company, Inc.
McKinsey & Company. (2010). Pathways to a Low-Carbon economy for brazil. Sao Paulo: McKinsey&Company.
McKinsey&Company. (2011). Resource Revolution: Meeting the world’s energy, materials, food and water needs. London: McKinsey & Company 2011.
McSweeney, C.F., New, M. and Lizcano, G. 2008. UNDP climate change country profiles: Malawi, Available at http://country-profiles.geog.ox.ac.uk/index.html?country=Malawi&d1=Reports [Accessed 23/8/12].
Millennium Ecosystem Assessment. (2005)
Minx, J. Et al. (2010), Developing a Pragmatic Approach to Assess Urban Metabolism in Europe, A Report to the European Environment Agency, Stockholm Environment Institute and Technische Universität Berlin
Mishra, A. (2006). Eco-Efficient Cities: Quality of life for all at least cost for the globe. ICLEI.
Moonen, T., & Clark, G. (2011). The Business of Cities - City Indexes in 2011. Greg Clark.
Nicola Ranger, Stéphane Hallegatte, Sumana Bhattacharya, Murthy Bachu, Satya Priya, K. Dhore, Farhat Rafique, P. Mathur, Nicolas Naville, Fanny Henriet, Celine Herweijer, Sanjib Pohit, Jan Corfee-Morlot. (2010). An assessment of the potential impact of climate change on flood risk in Mumbai. Climatic Change , 139-167.
OECD. (2010). Cities and Climate Change.
OECD. (2009). Cities, Climate Change and Multi level Governance.
OECD. (2009). Competitive Cities and Climate Change. OECD.
OECD. (2008). Economics of climate change impacts and policy benefits at city scale.
OECD. (2008). The economics of climate change impacts and policy benefits at city scale.
Pauw, K., Thurlow, J. and van Seventer, D. 2010. Droughts and floods in Malawi: Assessing the economy-wide effects. International Food Policy Research Institute, Washington, US, 34pp.
Peñalosa, E. (2008). Bogotá’s Experience in Sustainable City Development. Knowledge Showcase.
Putnam, Robert. (1993) Making Democracy Work. Civic Traditions in Modern Italy. Princeton University Press
PWC. (2011). Counting the cost of carbon: Low carbon economy index.
Revi, A. (2008). Climate change risk: an adaptation and mitigation agenda for Indian cities. Environment and Urbanisation , 207-229.
Rip, A. &Kemp R. (1998) “Technological change’’, in Human Choice and Climate Change, Vol. 2, Resources and technology, (Eds) Rayner, S & Malone, E., Battelle Press, Washington
SEI. (2011). New Climate Economics: Methodological choices and recommendations.
Swyngedouw, E. (2006), “Circulations and metabolisms: (Hybrid) Natures and (Cyborg) cities”, Science as Culture, Volume 15, Issue 2, Pp. 105-121
TEEB. (2010). Ecosystem services in cities and public management.
The British Council. (2004). A briefing on climate change and cities. Tyndall Centre.
The Climate Group. (2011). Smart 2020: Enabling the low carbon economy in the information age. The Climate Group.
UNEP. (2008). Green Jobs - Towards decent work in a sustainable low carbon world.
UN-HABITAT. (2011). Are we building competitive and liveable cities?
UN-HABITAT. (2011). Cities and climate change: global report on human settlement. UN.
UN-HABITAT. (2011). Cities and Climate Change: Policy Directions.
UN-HABITAT. (2011). State of the World’s cities - bridging the urban divide.
UN-HABITAT. (2010). The State of African Cities 2010: Governance, Inequalities and Urban Land Markets. UNEP.
UN-HABITAT. (2011). What does the green economy mean for sustainable urban development.
WHO, 2009. Disease and injury country estimates, Available to download at http://www.who.int/healthinfo/global_burden_disease/estimates_country/en/index.html [Accessed 23/8/2012].
World Bank. (2010). Cities and Climate change: and urgent agenda.
World Bank. (2010). Climate risks in Asian Coastal Megacities.
World Bank. (2010). ECO2 Cities - Ecological Cities as Economic Cities.
World Bank. (2011), Climate Change, Disaster Risk, and the Urban Poor
WWF. (2010). The alternative urban futures report - urbanisation and sustainability in India WWF. New Delhi.
Young, O.R & Berkhout, B. & Gallopin, G.C & Janssen, M.A & Ostrom, E. & van deer Leeuw, S. (2006), “The globalization of socio-ecological systems: An agenda for scientific research”, Global Environmental Change, Vol. 16, Issue 3, Pp. 304–316
A number of the maps included in this report draw on data distributed by the Socioeconomic Data and Applications Center (SEDAC), located at the Center for International Earth Science Information Network (CIESIN) of Columbia University, NY. http://sedac.ciesin.columbia.edu

Future Proofing Cities | 125
Atkins in partnership with
Benjamin, S. (2000), “Governance, economic settings and poverty in Bangalore”, Environment and Urbanization, Vol. 12, Issue 1, Pp. 35-56
Castán Broto, V. & Bulkeley, H. (2011), “Sustainable housing for high income professionals in Bangalore: the case of T-ZED (Towards zero carbon development)”, Urban Transitions and Climate Change, University of Durham
CED (2011), Vulnerability Assessment of Urban Marginalised Communities: A Pilot study in Bangalore slum areas, Centre For Education & Documentation(CED) (with support from Indian Network on Ethics and Climate Change (INECC)), East Point Colony
CIVIC (2008), Pilot Slum and Urban Homelessness Study. Bengaluru, Bruhath Bengaluru Mahanagara Palike (BBMP), Bangalore
D’Sa, A. &Murthy, K.V.N. (2002), Karnataka’s Power Sector & Suggested Ways Forward,International Energy Initiative, Bangalore
Ghosh, A. (2005), “Public-Private or a Private Public? Promised Partnership of the Bangalore Agenda Task Force”, Economic and Political Weekly, Vol. 40, No. 47, Pp. 4921-4922
Ghosh, A. (2006), “Banking on the Bangalore Dream”, Economic & Political Weekly, Vol. 91, Issue 8, Pp. 689-692
GOI (2008), National Action Plan On Climate Change, Government of India, India
GOK (2007), Revised Master Plan 2015, Bangalore Development Authority, Bangalore
Harriss, J. (2010). “‘Participation’ and Contestation in the Governance of Indian Cities”,Simons Papers in Security and Development, No.3/2010, Vancouver, School for International Studies, Simon Fraser University
Idiculla, M. P. (2010), “A guide to Bangalore’s civic agencies”, Citizen Matters, Bangalore
IIS (2011), Climate variability and climate change projections - Karnataka Region, Indian Institute of Science, Bangalore
Khandekar, S. (Aug. 05, 2008), “Power cuts temporarily on hold, says BESCOM”, Citizen Matters in Bangalore, Bangalore Available at:http://bangalore.citizenmatters.in/articles/view/309-power-cuts-bescom
Mathur, O.P. & Ray, S. (2003), Financing municipal services, Reaching out to capital markets, National Institute Of Public Finance And Policy, New Delhi
Nair, J. (2000), “Singapore Is Not Bangalore’s Destiny”, Economic and Political Weekly, Vol. 35, No. 18, Pp. 1512-1514
Pani, N. (2009), “Resource cities across phases of globalization: Evidence from Bangalore”, Habitat International, Vol. 33, Pp. 114–119
Raju, K.V. et al. (2008), emerging ground water crisis in urban areas –
A case study of ward no. 39, Bangalore city, Working Paper 196, Institute for Social and Economic Change, Bangalore
Ranganathan, M.et. al. (2009), “Piped Water Supply to Greater Bangalore:Putting the Cart before the Horse?” Economic & Political Weekly, Vol. XLIV, No. 33
Sekhar, S and S Bidarkar (1999), “Municipal Budgets in India: Comparison across Five Cities”, Economic and Political Weekly, Vol. 34(20), Pp. 1202-1208
Case studies – bangalore
Siemens (2011), Bengaluru_India, Asian Green City Index, ref no. soaxx201106-01
Available at: http://www.siemens.com/press/en/presspicture/?press=/en/presspicture/2011/corporate_communication/2011-02-asia/soaxx201106-01.htm
Solomon, B. (2000), “Governance, economic settings and poverty in Bangalore”, Environment and Urbanization, Vol. 12, No. 35
Solomon, B. (2004), “Urban land transformation for pro-poor economies”, Geoforum, Vol. 35, No. 2
Subhash, C. (2011), “Bangalore’s carbon footprint shoots up”, Deccan Herald, BangaloreSubramanian, A. (2012), “Bangalore green cover down from 71% to 12%”, Daily News and Analysis, Bangalore
Sudhira, H. & Ramachandra, T. & Subrahmanya, B. (2007), Bangalore: City profile, Cities, Vol. 24, No. 5, Pp. 379-390
TERI (2009), Report on Current Environment. Analysis of Bangalore Metropolitan City, Development of Building Regulations and Guidelines for Energy Efficiency, The Energy and Resources Institute, Bangalore City (Project Report No. 2009BS03)
TERI, (2010), Report on Implementation Methodologies & Incentives for the Developed Energy Efficiency Guidelines for Bangalore city, Development of Building Regulations and Guidelines for Energy Efficiency, The Energy and Resources Institute, Bangalore City, [Project Report No. 2009BS03]
WIPRO (2011), Sustainability report 2010/11, WIPRO, Bangalore
World Bank (2004), An Assessment of the Impact of Bangalore Citizen Report Cards on the Performance of Public Agencies, Evaluation Capacity Development Ecd Working Paper Series - No. 12, The World Bank Operations Evaluation Department, Washington, D.C.
World Bank (2006), India Water Supply And Sanitation: Bridging The Gap Between Infrastructure and Service, Background Paper Urban Water Supply and Sanitation, India Country Team-Energy and Infrastructure Department South Asia Region
World Bank (2007), Public sector governance and accountability series, Participatory Budgeting, Washington, D.C.A
electronic resources
BBMP (2012), Bruhat Bengaluru Mahanagara Palike> Home. Available at: http://bbmp.gov.in/
BCIL (2012), Biodiversity Conservation India Limited> ZED. Available at: http://www.zed.in/
BCTP (2011), Bangalore City Traffic Police> Bangalore Traffic, Available at:http://www.bangaloretrafficpolice.gov.in/index.php?option=com_content&view=article&id=45&btp=45
BDA (2012), Bangalore Development Authority> Town Planning, Available at: http://www.bdabangalore.org/townplanning.html
BMLT (2012), Bangalore Metropolitan Land Transport > PROJECTS, Available at: http://www.bmlta.org/bmlta/projects
BMRCL (2012), Bangalore Metro Rail Corporation Limited> About us, Available at: http://bmrc.co.in/about_us.htm
BWSSB (2012), Bangalore Water Supply and Sewerage Board> Conserve Water, Available at: http://bwssb.org/?p=290
CIVIC (2011), Citizens Voluntary Initiative for the City> What we do. Available at: http://www.civicspace.in/about-civic

126 | Future Proofing Cities
Atkins in partnership with
CSTEP (2012), Centre for Study of Science, Technology and Policy> Home. Available at: http://www.cstep.in/
EIA (2012), Policys and Measures Database:http://www.iea.org/textbase/pm/?mode=pm&id=4162&action=detail
India Today (2011), India Today > India > South >Story> “Bangalore Metro misses deadline for 4th time, minister sets Sept 26 as next date”, India Today, Available at: http://indiatoday.intoday.in/story/bangalore-metro-misses-deadline/1/151477.html
KSCST (2011), Karnataka Stata Council for Science and Technology > Ongoing Projects. Available at: http://kscst.org.in/ongoing.html
KSCST (2011), Karnataka Stata Council for Science and Technology > Rainwater Harvesting. Available at: http://kscst.iisc.ernet.in/rwh_files/rwh_initiate.html
MITRA (2012), MITRA Foundation> About us. Available at: http://mitrafoundation.org/about.php
PARASPARA (2012), PARASPARA> Home. Available at: http://www.paraspara.org/
SAMSKRUTI (2012), SAMSKRUTI> About us. Available at: http://www.samskruti.in/home.html
UN-Water (2012), Water for Life Decade>’Water for Life’ UN-Water Best Practices Award, At: http://www.un.org/waterforlifedecade/winners2012.shtml
UN-Water (2012), Statistics> Drinking water and sanitation, Available at: http://www.unwater.org/statistics_san.html
Campbell, D. (2005), “Maputo: an African ‘success story’ but 80 per cent still live in slums”, The Guardian, Available at: http://www.guardian.co.uk/world/2005/feb/02/hearafrica05.development4
Chilaule R. (Head of the Environmental Department of MMC) (2011), Maputo improving resilience by implementing Cities and Climate Change Initiative, Presented at Local Climate Solutions for Africa, CTICC, Cape Town
Douglas, I. &Alam, K. & Maghenda, M. &Mcdonnell, Y. & Mclean, L. &Campbell, J. (2008), “Unjust waters: climate change, flooding and the urban poor in Africa”, Environment and Urbanization, Vol. 20, P. 187
IIED (2004), Capacity strengthening in the least developed countries (LDCS) for adaptation to climate change (CLACC), adverse impacts of climate change and development challenges: integrating adaptation in policy and development in Mozambique, Zero regional Environment Organization, Harare
IISD (2007), Early Lessons from Implementation of Climate Change Adaptation Projects in South-eastern Africa, Regional Workshop in Maputo, Maputo
INGC (2009),INGC Climate Change Report: Study on the impact of climate change on disaster risk in Mozambique, National Disaster Management Institute, Maputo
IPCC (2007), Contribution of Working Groups I, II and III to the Fourth Assessment Report of the Intergovernmental Panel on Climate Change, IPCC, Geneva, Switzerland
Jenkins, P. (2000), City Profile: Maputo, Cities, Vol. 17, No. 3, pp. 207–218
Kruks Wisner, G. (2006), “After the flood : crisis, voice and innovation in Maputo’s solid waste management sector”, Massachusetts Institute of Technology, Massachusetts
MICOA (2003), Mozambique initial national communication to the UNFCCC, Ministry of Coordination of Environmental Affairs, Maputo, Available at: http://unfccc.int/resource/docs/natc/moznc1.pdf
MICOA (2007, National Adaptation Programme of Action (NAPA) (Approved by the Council of Ministers at its 32nd Session, December), MICOA, Maputo, Available at: http://unfccc.int/resource/docs/napa/moz01.pdf
Ruby, J. & Canhanga, S. &Cossa, O. (2008), Assessment of the Impacts of Climate Changes to Sea Level Rise at Costa do Sol Beach in Maputo –Mozambique, National Institute of Hydrography and Navigation, Maputo (prepared for UNEP)
UN-Habitat (2008), MOZAMBIQUE URBAN SECTOR PROFILE, Rapid Urban Sector Profiling for Sustainability (RUSPS), United Nations Human Settlements Programme, Regional Office for Africa and the Arab States, Nairobi
UN-Habitat (2009), MAPUTO_Mozambique(Flyer), UN-Habitat, Nairobi
UN-Habitat (2010), Initiative: Adaptation to and Mitigation of Climate Change in the City of Maputo: Preliminary Assessment, UN-Habitat, Nairobi
UN-Habitat (2011), CLIMATE CHANGE ASSESSMENT FOR MAPUTO; MOZAMBIQUE: A SUMMARY, UN-Habitat, Nairobi
World Bank (2008), Mainstreaming Climate Adaptation into Development Assistance in Mozambique: Institutional Barriers and Opportunities, Policy Research Working Paper 4711, The World Bank Development Research Group, Sustainable Rural and Urban Development Team
Case studies – Maputo

Future Proofing Cities | 127
Atkins in partnership with
World Bank (2009), Municipal Development in Mozambique- Lessons from the First Decade, Urban and Water Country Department, Africa Region
World Bank (2012), IMPLEMENTATION COMPLETION AND RESULTS REPORT
(IDA-42570 TF-92459), Urban and Water Unit, Country Department AFCS2, Africa Region
Siemens (2010), Maputo_Mozambique, African Green City Index, Available at: http://www.siemens.com/press/pool/de/events/2011/corporate/2011-11-african/african-gci-report-e.pdf
electronic sources
ACCID (2009), “Maputo mayor calls for action on climate change”, Africa-wide Civil-Society Climate Change Initiative for Policy Dialogues> Newsfeed, Available At: http://www.africaclimatesolution.org/news.php?id=5813
CDKN (2011), Climate and development Knowledge Network> A ‘Public Private People Partnership’ for climate compatible development in Maputo. Available at: http://cdkn.org/project/a-public-private-people-partnership-for-climate-compatible-development-in-maputo/
Castan Broto, V.& Boyd, E.& Ensor, J.& Seventine, C. (2011) Development of a Public Private People Partnership for Climate Compatible Development in Maputo, Mozambique, UCL Development Planning Unit, London. Available at: http://www.bartlett.ucl.ac.uk/dpu/4pccd
GTZ (2002), “Waste management in the Maputo metropolitan area”, Deutsche Gesellschaft für Internationale Zusammenarbei, Available, at: http://www.gtz.de/en/weltweit/afrika/mosambik/28430.htm
Transparency International (2011), Corruption by Country> Territory. Available at: http://www.transparency.org/country#MOZ
Case studies – nairobi ActionAid (2006), Climate change, urban flooding and the rights of the urban poor in Africa Key findings from six African cities, ActionAid International Emergencies and Conflict Team, London
African Development Bank (2007), Appraisal report: Nairobi- Thika Highway Improvement Project, African Development Bank, Nairobi
APHRC (2002), Population and health dynamics in Nairobi’s Informal Settlements, African Population and Health Research Centre, Nairobi
COHRE (2007), Kenya – Rights to Housing and Water, Centre on Housing Rights and Evictions, Submission to the United Nations Committee on Economic, Social and Culture Rights, 22-26
Faye, O. et. al (2010), Hunger and Food Insecurity in Nairobi’s Slums: An assessment using IRT models, Centre d’Etudes de Populations, de Pauvreté et de Politiques Socio-économiques (CEPS/INSTEAD), Luxembourg, Available at: http://www.ceps.lu/pdf/11/art1572.pdf
Foeken, D &Mwangi, A.M. (2000), “The Impact of Urban Agriculture on the Household and Local Economies”, in Growing Cities, Growing Food: Urban Agriculture on the Policy Agenda – A Reader on Urban Agriculture, eds. N. Bakker, M. Dubbeling, S. Gundel, U. Sabel-Koschella, H. de Zeeuw, RUAF Foundation, Feldafing, Germany
GoK (2007), City of Nairobi Environment Outlook , Republic of Kenya Nairobi City Council, Nairobi, Available at: http://www.unep.org/geo/pdfs/NCEO_Report_FF_New_Text.pdf
Hagans, C. (2011), Public Transport for Development - Development for Whom? Opportunities for Poverty Reduction and Risks of Splintering Urbanism in Nairobi, Development Planning Unit, University College London, London
Hendricks, B. (2010), ”City-wide Governance Networks in Nairobi: Towards Contributions to Political Rights, Influence and Service Delivery for Poor and Middle-class Citizens?” Habitat International 34, 72-75.
Howe, J. &Bryceson, D. (2000), Poverty and Urban Transport in East Africa; Review of Research and Dutch Donor Experience, World Bank, Washington
IPCC (2010), The IPCC Special Report on Managing the Risks of Extreme Events and Disasters to Advance Climate Change Adaptation, Intergovernmental Panel on Climate Change, Available at: http://www.ipcc.ch/news_and_events/docs/srex/SREX_slide_deck.pdf
K’Akumu, O.A. & Olima, W.H.A. (2007), “The Dynamics and Implications of Residential Segregation in Nairobi”, Habitat International, Vol. 31, 95
Kinuthia Njenga, C. & Kim Blanco, P (2009),Climate Change and Migration in Nairobi, Environmental Migration and its Urban Manifestation at the Local Scale, World Bank, Nairobi
Klopp, J. (2011), “Towards a Political Economy of Transportation Policy and Practise in Nairobi”, Urban Forum, Vol. 7
Linehan, D. (2008), “Re-ordering the Urban Archipelago: Kenya Vision 2030, Street Trade and the Battle for Nairobi City Centre”, Aurora Journal 2, 32
Matu, K. (2011), “Kenya- Nairobi’s Dilemma- Growing a Metropolis While Guarding Threatened ecosystem”, Nairobi Star
Manda, D. K. &Sen, K. (2004),“The Labour Market Effects of Globalization in Kenya”, Journal of International Development, Vol. 16, 29-43

128 | Future Proofing Cities
Atkins in partnership with
Medard, M. (2010), “City Planning in Nairobi: The Stakes, the People, the Sidetracking”, in Nairobi Today: The Paradox of a Fragmented City, eds. Helene Charton-Bigot, Deyssi Rodriguez-Torres, Mkuki na Nyota Publisher, Dar es Salaam, 43
Winnie V. Mittulah, W.V. (2010), “Local Political System of Nairobi”, in Nairobi Today: The Paradox of a Fragmented City, eds. Hélène Charton-Bigot, Deyssi Rodriguez-Torres (Mkuki na Nyota Publishers: Dar es Salaam, p. 329
MoNMD (2008), Nairobi Metro 2030, Building a World Class African Metropolis, Ministry of Nairobi Metropolitan Development
Mundia, C.N. &Aniya, M. (2006), “Dynamics of landuse/cover changes and degradation of Nairobi City, Kenya”,Land Degradation & Development, Vol. 17, Issue 1, Pp. 97–108
Mundia, C.N. &Aniya, M. (2007), “Analysis of land use/cover changes and urban expansion of Nairobi city using remote sensing and GIS”, International Journal of Remote Sensing ,Vol. 26, Issue 13
Okoth, D. (2011), “Kenya Loses Opportunity to Save Billions in Slum Upgrading”, The Standard, Nairobi
Olima, W.H.A. (2001), Dynamics and Implications of Sustaining Urban Spatial Segregation In Kenya- Experiences from Nairobi Metropolis, presented at the International Seminar on Segregation in the City, 25-28 July, Cambridge
Omenya, A. &Huchzermeyer, M. (2006) “Slum Upgrading in the Complex Context of Policy Change: The Case of Nairobi”, in Informal Settlements: A Perpetual Challenge, eds. Marie Huchzermeyer and AlyKarem, UCT Press, Cape Town, 297
Opiyo, R. (2009), METROPOLITAN PLANNING AND CLIMATE CHANGE IN NAIROBI: HOW MUCH ROOM TO MANOUVRE?, University of Nairobi, Available at: http://siteresources.worldbank.org/INTURBANDEVELOPMENT/ esources/336387-1256566800920/ 6505269-1268260567624/Opiyo.pdf
Scalar, E. (2009), “Engaging complexity, a prologue for creating effective urban transport and land use planning for Metropolitan Nairobi”, Presented at the fourth international conference on the future of urban transport: Access and Mobility for the Cities of Tomorrow, Gothenburg, Sweden
Siemens (2011), Nairobi_Kenya, African Green City Index, Available at: http://www.siemens.com/press/pool/de/events/2011/corporate/2011-11-african/african-gci-report-e.pdf
Sohail, M. (2004), “Sustaining Livelihoods by Improving Urban Public Transport”, Engineering Sustainability 158, Issue ESI
Lee Smith, D. et. al (2011), URBAN AGRICULTURE & FOOD SECURITY IN NAIROBI, Mazingira Institute, Nairobi
Orengo, P. &Ojwang, A. (2012), “Kenya: Death and destruction as floods rage”, The Standard, Nairobi, Available at: http://in2eastafrica.net/kenya-death-and-destruction-as-floods-rage/
Otiso, K.M. &Owusu, G. (2008), “Comparative urbanization in Ghana and Kenya in time and space”, Geojournal, Vol. 71, 148
RoK, Kenya Economic Survey 2009, Republic of Kenya, Kenya National Bureau of Statistics, Nairobi
Salon, D. &Gulyani, s. (2010), “Mobility, Poverty, and Gender: Travel ‘Choices’ of SlumResidents in Nairobi, Kenya”, Transport Reviews, Vol. 30, No. 5, Pp. 641-657
Society for International Development (2010), Kenya’s Vision 2030: An Audit from an Income and Gender Inequalities Perspective, SID Regional Office, Nairobi
UN-Habitat (2003), Global Report on Human Settlements 2003, The Challenge of Slums, Part IV: ‘Summary of City Case Studies’, Earthscan, London
World Bank (2006), Kenya – Inside Informality: Poverty, Jobs, Housing and Services in Nairobi’s Slums, World Bank, Washington D.C, p 31
World Bank (2009), Poverty, Living Conditions, and Infrastructure Access A COMPARISON OF SLUMS IN DAKAR, JOHANNESBURG, AND NAIROBI, Africa Infrastructure County Diagnostic, World Bank, Washington, Available at: http://www.infrastructureafrica.org/system/files/WP10_Slums%20in%203_cities_1.pdf
World Bank (2012), PROJECT INFORMATION DOCUMENT (PID) APPRAISAL STAGE, Report No.: AB6933, World Bank, Available at: http://www-wds.worldbank.org/external/default/WDSContentServer/WDSP/IB/2012/02/28/000003596_20120228145854/Rendered/PDF/NaMSIP0Apprais0e0PID00Feb.024002012.pdf
World Bank (2012), Draft Environmental and Social Management Framework for Nairobi Metropolitan Services Improvement Project, Ministry of Nairobi Metropolitan Development, Nairobi
http://www-wds.worldbank.org/external/default/WDSContentServer/WDSP/IB/2012/01/13/000356161_20120113005704/Rendered/PDF/663730BR0P10730C0disclosed010110120.pdf
electronic sources
MacKenzie, D. (2010), Resource Centre on Urban Agriculture & Food Security> Home> Nairobi’s slum farms, Available at: http://www.ruaf.org/node/2193
Nierenberg, D. (2011), “Mazingira Institute and NEFSALF: Training a New Breed of Farmers”, Nourishing the Planet, Available at: http://blogs.worldwatch.org/nourishingtheplanet/mazingira-institute-and-nefsalf-training-a-new-breed-of-farmers-africa-agriculture-farmers-hunger-kenya-mazingira-institute-environs-food-security-agriculture-and-livestock-forum-nefsalf-urban-harvest/
Peacebuilding Portal (2012), Home>Nairobi Central Business District Association (NCBDA), Available at: http://www.peacebuildingportal.org/index.asp?pgid=9&org=3409
UNCTAD (2012), United Nations Conference on Trade and Development, UNCTADstat, Available at: http://unctadstat.unctad.org
UN-Habitat (2011), Sustran>Goals and Objectives, Strategy and Activities, Available at: http://www.UN-HABITAT.org/content.asp?typeid=19&catid=666&cid=9493#GoalsAndObjectives
UNEP (2012), UNEP>KENYA: Share the Road’s First Pilot Country and First Success, Available at: http://www.unep.org/transport/sharetheroad/Countrypages/kenya.asp
WambuiNjogo, E (2008), Household Food Security Among Urban Farmers in Nairobi, Kenya, International Development Research Centre>Publicaciones>Libros>Todo nuestros libros>AGRICULTURE IN URBAN PLANNING. Available at: http://web.idrc.ca/es//ev-135123-201-1-DO_TOPIC.html
World Bank (2011), World Bank> Home> Projects> Project Details, Kenya Informal Settlements Improvement Project (KISIP), Available at: http://web.worldbank.org/external/projects/main?Projectid=P113542&theSitePK=40941&piPK=73230&pagePK=64283627&menuPK=228424

Future Proofing Cities | 129
Atkins in partnership with
ADB (2005), Karachi Mega Cities Preparation Project, Final Report, Asian Development Bank
Ahmed, N. &Sohail, M (2003), “Alternate water supply arrangements in peri-urban localities: awami(people’s) tanks in Orangi township, Karachi”, Environment and Urbanization, Vol. 15, Issue 33
Aslam, G. &Yilmaz, S. (2011), “Impact of decentralization reforms in Pakistan on service delivery- an empirical study”, Public Administration Development, Vol. 31, Pp.159–171
CDGK (2007), Karachi Strategic Development Plan 2020, Master Plan Group of Offices, City District Government of Karachi, Available at: http://www.scribd.com/doc/6788059/Karachi-Master-Plan-2020
Checkbiotech (2010), “Karachi U. Biotechnologists seek drought, stress tolerant crops”, Checkbiotech,The Connors Group, Inc. Available at: http://greenbio.checkbiotech.org/news/karachi_u_biotechnologists_seek_drought_stress_tolerant_crops
FAO (2011), Food Security Information for Decision Making, Price Monitoring and Analysis Country Brief Pakistan, Available at: http://www.fao.org/docrep/014/am568e/am568e00.pdf
Hakeem R.&Asar F, &Shaikh AH.(2003), Food insecurity in metropolis of the developing world--observations from central district of Karachi, Pakistan, Department of Food and Nutrition, RLAK Government College of Home Economics, Gulshan-e-Iqbal Campus, Karachi
Hasan, A. (2002), The Unplanned Revolution: Observations on the Process of Socio-Economic Change in Pakistan, City Press, Karachi
Hasan, A. (2011), Local Government Reform in Pakistan: Some Issues,The Express Tribune, Available at: http://tribune.com.pk/story/232835/local-government-reform-in-pakistan-some-issues/
Hasan, A. (2012), Sindh Local Government: The Real Issues, The Express Tribune, Available at: http://tribune.com.pk/story/319333/sindh-local-government-the-real-issues/
Hasan, A. &Raza, M. (2011), Motorbike Transit,Muhammad Ali Society, Karachi
Hasan, A. &Raza, M. (2011),“Alternative energy and governance issues”, The Express Tribune, Available on: http://tribune.com.pk/story/117540/alternative-energy-and-governance-issues/
Herald Tribune (2011), “The death of governance in Karachi”, The International Herald Tribune, Available at: http://tribune.com.pk/story/206034/the-death-of-governance-in-karachi/
Khan, M. (October 20th, 2011), State of Food Insecurity in Pakistan, Pakistan news, Available at: http://www.newspakistan.pk/2011/10/20/state-of-food-insecurity-in-pakistan/
Linden, J. (2002), “The limited impact of some ‘major determinants’ of the land market: Supply of land for housing in Lahore and Karachi, Pakistan”, Cities, Vol. 11, Issue 4, Pp. 240–246
OPP (2012), ORANGI PILOT PROJECT- Institutions and Programs- 128th QUARTERLY REPORT, Orangi Pilot Project, Karachi
Pak Tribune (Jan 24 2006), SEVERAL DEVELOPMENT PROJECTS TO BE ABANDONED, Karachi, Available at: http://www.paktribune.com/news/print.php?id=132505
Pakistan Today (2012), “2012 starts with a bad omen for Karachi… tremors”, Pakistan Today, Available at: http://www.pakistantoday.com.pk/2012/01/03/city/karachi/2012-starts-with-a-bad-omen-for-karachi%E2%80%A6-tremors/
Case studies – karachi
Reed, R. & Vines, M. (1992), Reduced CostSewerage in Orangi, Karachi, Pakistan,WEDC, Loughborough, University of Technology
Root, H. (2005), MAKING INFRASTRUCTURE WORK FOR THE POOR, A Concept Paper On Infrastructure and Governance, United Nations Development Programme, Available at: http://66.147.244.232/~lifeats1/hroot/pdfs/published_articles/Making%20Infrastructure%20Work%20for%20the%20Poor.pdf
Siemens (2011), Karachi_Pakistan, Asian Green City Index
UN-Habitat (2011), The State of Asian Cities 2010/2011, Case Studies, Urban Governance, GOOD PARTICIPATORY PRACTICE FROM KARACHI, Asia-Pacific Regional Section
WaterAid (2011), Component sharing Technical and social guidelines for a low-cost urban sanitation model,WaterAid, Available at: http://www.wateraid.org/documents/plugin_documents/component_sharing_manual_1.pdf
World Bank (2009), Eco2 Cities – Ecological Cities as Economic Cities, The World bank, Washington
Zaidi, A. (2001), From the Lane to the City: The Impact of the Orangi Pilot Project’s Low Cost Sanitation Model, Water Aid, London
electronic sources
GOK (2012), Official Web Portal of City District Government of Karachi, Available at: http://www.karachicity.gov.pk/
Hisaar Foundation (2011) Hisar Foundation> Background, Available at: http://www.hisaar.org/background.html
HOPE (2012), Health Oriented Preventive Education> Home. Available at: http://www.hope-ngo.com/
IEA (2009), International Energy Agency, Energy Balance for Pakista,. Available at:http://www.iea.org/stats/balancetable.asp?COUNTRY_CODE=PK
Libcom.org (2011), Libcom>Home>Blogs>Samotnaf’s blog> “Riots, strikes, sabotage and sit ins in Karachi”, Available at: http://libcom.org/news/riots-strikes-sabotage-sit-ins-karachi-12052011
OPP (2012), Orangi Pilot Project- Research and training Institute > Brief Situation Analysis, Available at:http://www.oppinstitutions.org/
URC (2010), Urban Resource Centre> Facts and Figures> “Tap Water for All”, Available at:http://www.urckarachi.org/Facts%20&%20Fgures%20APRIL%202010.HTM
Zeenews (2009), Zeenews, “Power riots in Karachi; Rain related deaths rises to 42”, Available at:
http://zeenews.india.com/news/south-asia/power-riots-in-karachi-rain-related-deaths-rises-to-42_548961.html

130 | Future Proofing Cities
Atkins in partnership with
ACHR (2008), A conversation about upgrading at Bang Bua, Asian Coalition for Housing Rights, Bangkok
ADB (2009), BANGKOK: The Economics of Climate Change in Southeast Asia: A Regional Review
ADB (2010), Climate Risks and Adaptation in Asian Coastal Megacities, ADB/JICA/World Bank Washington, Available at:
http://siteresources.worldbank.org/EASTASIAPACIFICEXT/Resources/226300-1287600424406/coastal_megacities_fullreport.pdf
Archer, D (2010), Empowering the urban poor through community-based slum upgrading: the case of Bangkok, Thailand, 46th ISOCARP Congress, Available at: http://www.isocarp.net/Data/case_studies/1648.pdf
APN (2010), Enhancing Adaptation to Climate Change by Integrating Climate Risk into Long-Term Development Plans and Disaster Management, Asia-Pacific Network for Global Change Research, Available at: http://www.apn-gcr.org/resources/archive/files/06516ed9ac5850386cdd0d5d73f7033f.pdf
ATRANS (2010), Integrating Congestion Charging Schemes and Mass Transit Systems in Bangkok, Asian Transportation Research Society, Bangkok
Bangkok Post, (2011), “Floods: Losses to Thailand’s economy?”,Bangkok Post, Bangkok, Available at: http://www.bangkokpost.com/learning/learning-from-news/264786/floods-losses-to-thailand-economy
Bangkok Post (2012), Bangkok traffic expected to worsen, Bangkok Post, Bangkok, Available online:http://www.bangkokpost.com/news/local/273433/bangkok-traffic-expected-to-worsen
Bristol, G. (2007), Strategies for survival: security of tenure in Bangkok, Case study prepared for Enhancing Urban Safety and Security: Global Report on Human Settlements 2007, UN-Habitat, Available at: http://www.UN-HABITAT.org/grhs/2007
BMA (2007), Action Plan on Global Warming Mitigation 2007 – 2012, Bangkok Metropolitan Administration, Bangkok, Available at: http://office.bangkok.go.th/environment/pdf/plan-en.pdf
Boonyabancha, S (2009),Land for housing the poor — by the poor: experiences from the Baan Mankong nationwide slum upgrading programme in Thailand, Asian Coalition for Housing Rights (ACHR), Bangkok
Boonyabancha, S (2005),Baan Mankong: going to scale with “slum” and squatter upgrading in Thailand,Asian Coalition for Housing Rights (ACHR), Bangkok
Castan Broto, V & Johnson, C & Allen, A (2010), “Can compact planning help the urban poor?”, Urban World, Vol. 4, Issue 3
Chambers, V. (1998), Bangkok: Are Industries Generating a SustainableCity?, Human Settlement Development, Vol. 1, Bangkok
Chotichanathawewong, Q &Thongplew, N. (2012), Development Trajectories, Emission Profile and Policy Actions: Thailand ADBI Working Paper 352, Asian Development Bank, Tokyo, Available at: http://www.scribd.com/doc/89174911/Development-Trajectories-Emission-Profile-and-Policy-Actions-Thailand
Denpaiboon, C &Kanegae, H (2007), COMPACT CITY STRATEGY OF BANGKOK MEGA-CITY, Ritsumeikan University, Kyoto
Case studies – bangkok
Fraser, E (2002), “Urban Ecology in Bangkok, Thailand: Community Participation, Urban Agriculture and Forestry”, Environments, Vol. 30, No. 1
Moor, M. & Rees, C (2000), “Bangkok Mass Transit Development Zones”, in Compact cities: sustainable urban forms for developing countries, Eds. Jenks, M. & Jenks, M. & Burgess, R. Spon Press, London
NHA (2002), Housing development program for slum and urban poor for national economic and social development plan IX (2002–2006), National Housing Authority, Bangkok
Nicholls, R.J. & Hanson, S. &Herweijer, C. & Patmore, N. &Hallegatte, S. &Corfee Morlot, J & Chateau, J.& Muir-Wood, R. (2008), Ranking Port Cities with High Exposure and Vulnerability to Climate Extremes, OECD Environment Working Papers No. 1, Available at: http://dx.doi.org/10.1787/011766488208
IDS (2007), Governance Screening for Urban Climate Change Resilience-building and Adaptation strategies in Asia, Assessment of Bangkok City, Thailand, Institute of Development Studies, Climate Change and Disasters Group, University of Sussex, Brighton
Polprasert, C. (2007), “Water Environment Issues of Bangkok City, Thailand: Options for Sustainable Management”, ScienceAsia, Vol. 33 Supplement 1, Pp.57-58
Pittungnapoo, W (2011), The urban sprawl of Bangkok Metropolitan Region and its impacts, Faculty of Architecture, Naresuan University, Available at: http://www.urbanhybridization.net/WitiyaPittungnapoo.htm
Rawadee, J &Areeya, M (2008), “Adaptation Strategies for Coastal Erosion/Flooding: A Case Study of Two Communities in Bang KhunThian District, Bangkok”, TDRI Quarterly Review, Vol. 23 No. 1
Sajor, E. &Rutmanee, O. (2007), “Mixed Land Use and Equity in Water Governance in Peri-Urban Bangkok”, International Journal of Urban and Regional Research, Vol. 31.4, Pp. 782–801
Sheng, Y.K. & de Wandeler, K. (2009), “Self-help housing in Bangkok”, Habitat International, Vol. 34, Issue 3, Pp. 332-341
Siemens (2011), Bangkok, Thailand, Asian Green City Index. Available at: http://www.siemens.com/press/pool/de/events/2011/corporate/2011-02-asia/asian-gci-report-e.pdf
Sintusingha, S. (2006), “Sustainability and urban sprawl: Alternative scenarios for a Bangkok superblock”, URBAN DESIGN International, Vol. 11, Pp. 151–172
The Nation (2007), “Bangkok city plan needs a rethink” (Editorial), The Nation, Bangkok
UNEP (2009), Bangkok Assessment Report on Climate Change, Green Leaf Foundation (GLF), Bangkok
Usavagovitwong, N. & Prayong, P. (2005), “Urban poor housing development on Bangkok’s waterfront: securing tenure, supporting community processes”, Environment and Urbanization, 18: 523
Vagneron, I. (2007), “Economic appraisal of profitability and sustainability of peri-urban agriculture in Bangkok”, Ecological Economics, Vol. 61, Issues 2–3, Pp. 516-529
Viratkapan, V & Perera, R (2005), “Slum relocation projects in Bangkok: what has contributed to their success or failure?”, Habitat International, Vol. 30, Issue 1, Pp. 157-174
Warnitchai, P. &Sangarayakul, C. & Ashford, S.A. (2000),SEISMIC HAZARD IN BANGKOK DUE TO LONG-DISTANCE EARTHQUAKES, 12WCEE, Available at: http://www.iitk.ac.in/nicee/wcee/article/2145.pdf

Future Proofing Cities | 131
Atkins in partnership with
Webster, D. (2000), Financing City-Building: The Bangkok Case, Shorenstein APARC (published as part of the Urban Dynamics of East Asia project)
Webster, D. (2009), “Bangkok”, City: analysis of urban trends, culture, theory, policy, action, 13:1, 80-86
World Bank (2009), CLIMATE CHANGE IMPACT AND ADAPTATION STUDY FOR BANGKOK METROPOLITAN REGION, Panya Consultancy, Bangkok
electronic sources
BMA (2002), Department of City Planning >The Bangkok Comprehensive Plan (1st Revised Edition) in 1999, Available at: http://cpd.bangkok.go.th/cpd/eng-map2.html
BMA (checked 2012), Bangkok Metropolitan Administration, Policy and Planning Department, Bangkok, Available at: www.gef.or.jp/20club/E/bangkok.htm
CODI (2011), “Bang Bua Canal Community Network in Bangkok: the redevelopment of 12 canal-side communities along Klong Bang Bua(a Baan Mankong project involving the in-situ upgrading of 12 communities along the Bang Bua Canal, in Bangkok’s Bang Khen District and Laksi District)”, Available at: http://www.codi.or.th/webcodi/downloads/english/Baanmankong/Canal_side/Bang%20Bua%20Story%20March%202006.pdf
CODI (checked 2012), CODI>Baan Mankong Collective Housing, Available at: http://www.codi.or.th/housing/aboutBaanmankong.html
GCP (Global Carbon Project) (2011), Urban and Regional Carbon Management> City Based Climate Change Action Plans>Thailand, At: http://www.gcp-urcm.org/Resources/CityActionPlans#Asia
Green World Foundation (checked 2012), Green World Foundation>About us. Available at: http://www.greenworld.or.th/about-en
IIED (2011), IIED> News and Blogs> Thailand’s floods: complex political and geographical factors behind the crisis, Available at: http://www.iied.org/thailand-s-floods-complex-political-geographical-factors-behind-crisis
JICA (2012),JICA >Home>Countries>Asia>Thailand>Topics & Events> JICA and the Bangkok Global
Warming Mitigation Action Plan 2007-2012, Available at: http://www.jica.go.jp/thailand/english/office/topics/events120426.html
Kisner, C. (2008), “Climate Change in Thailand: Impacts and Adaptation Strategies”, Climate Institute, Available at: http://www.climate.org/topics/international-action/thailand.htm
MLIT (2012) Ministry of Land, Infrastructure, Transport and Tourism, Japan > An Overview of Spatial Policy in Asian and European Countries, Available at: http://www.mlit.go.jp/kokudokeikaku/international/spw/general/thailand/index_e.html
TEI (2012), Thailand Environment Institute> About Foundation. Available at: http://www.tei.or.th/about/index.htm
UCL (2011), DE-CODI-NG BAAN MANKONG SPACES OF COMMUNITY FOR TRANSFORMATION,
UCL Development Planning Unit, Available at: http://www.scribd.com/doc/59522633/Decoding-Baan-Mankong-Bangkok-Thailand

132 | Future Proofing Cities
Atkins in partnership with

Future Proofing Cities | 133
Atkins in partnership with
APPenDix: teChniCAL notes
07

134 | Future Proofing Cities
Atkins in partnership with

Future Proofing Cities | 135
Atkins in partnership with
These technical notes provide details of the definitions and methodologies that we have employed in this report. We address the following topics:
Appendix 1: Compiling the Atkins urban risk database of cities and developing urban types
Appendix 2: Future proofing policy solutions
Appendix 3: Glossary of terms.
Appendix: Technical notes

136 | Future Proofing Cities
Atkins in partnership with

Future Proofing Cities | 137
Atkins in partnership with
Appendix 1: Compiling the Atkins urban risk database of cities and developing urban types The cities assessment and development of the typologies used in this report followed six iterative steps. These steps also informed the development of the policy framework.
step 1: Country and city1 short list One hundred and twenty nine cities were short-listed. These cities were combined with 12 commonly used benchmark cities2.The 129 cities were selected based on cities from across DFID’s extensive country footprint with: (i) populations in excess of 750,000 people to allow for collection of available population data from relevant international agencies and (ii) availability of other comparable data.
step 2: Literature review and theoretical underpinnings In recent years a range of city level indexes have been developed to help cities benchmark and assess their vulnerability to future challenges and assess their performance vis-à-vis other cities in responding to them. These provide an aggregation of different indicator buckets of city performance. We reviewed a wide range of city level indexes to provide a better understanding of the factors current approaches deem as most important for urban development and managing environmental risks. Whilst we found these indexes to be a useful resource to cities we found that coverage for cities in low income countries (and middle income countries) is poor and that few indexes provide a comprehensive picture of the full range of environmental risks facing cities in low income countries or are insufficiently grounded in a strong understanding of the links between the urban metabolism of a city and how it performs in terms of resource use.
In addition to city level indexes there are a wide range of good practice guidance reports/notes and case studies looking at different aspects of the future proofing agenda. We found that in general most guidance and case studies:
� Provide inadequate attention to cities in low income countries
� Focus on only one or two elements of future proofing (e.g carbon emissions) without considering the synergies and co-benefits between different issues
� Are not tailored to cities with different characteristics – guidance notes or reports typically provides a long list of policies to, for example, green a city, without considering the appropriateness of policies to different types of cities based on, for example, their vulnerability and, as well as ease of implementation in cities with similar characteristic
� Have poor coverage of issues concerning resource scarcity (energy, water, and food security) and ecosystem protection, with an overwhelming focus on carbon emissions and flood risks
� Make inadequate links between environmental risks and their impacts on vulnerable groups, key infrastructure, and access to basic services
� Provide inadequate attention to the challenges of responding to environmental risks, particularly in relation to urban planning, finance, and delivery.
We also undertook a review of the academic and theoretical literature on the environmental risks facing cities and their key drivers to inform the development of an improved framework of indicators of environmental risk, and looked at available national indicators of environmental risk, vulnerability, and capacity to act from sources such as the Stockholm Environmental Institute, ARC3, TEEB, MEA, and the Expert Workshop on Ecosystem Service Indicators (UNEP, IUCN, WRI], as well a light touch review of the new Climate Investment Fund (CIF) Monitoring and Evaluation indicators developed by the World Bank.
and core indicators
cities assessment framework
Step 4: developing the
Ranking the citiesStep 5:
Step 1: developing thelist of cities
Step 2: Reviewing gaps in the
literature (guidance, case
studies & existing city level indexes)
indicators
and
revi
ewin
g th
e da
ta
list of
futu
re p
roofi
ng
Step 3: dev
elopi
ng a
long
Step
6: d
evel
oping
the
typo
logi
es
1 This report has defined the ‘city’ in a number of ways. The units for analysis overlap but are not entirely contiguous. The main units of analysis are: (i) city population - UN Population Division. World Urbanisation Prospects 2011 Revision; (ii) city boundaries – GRUMP (Global Urban Rural Mapping Project) CIESIN reflects raster 1 sq.km areas which are substantially urbanised; and (iii) city catchment for regional support systems - 100 km radius from the centre of the city.
2 Curitiba, Portland, Bogotá, Havana, Chongqing, Beijing, Johannesburg, Singapore, London, New York, Abu Dhabi, and Los Angeles

138 | Future Proofing Cities
Atkins in partnership with
step 3: Development of long list of indicators and review of the dataBased on the literature review we developed a long list of indicators to capture the full range of complex environmental risks facing cities, their vulnerabilities to those risks, and capacity to respond to risks, as well as other factors considered important in the literature such as the scale and pace of change of cities, and their climate and geography. This list was then assessed against available data for the 129 cities: as outlined in the main body of this report this showed substantial gaps in the data across all indicator categories.
Challenges in developing a comprehensive list of indicators organised into easily understandable groups included the fact that many indicators cut across multiple issues, and that it is difficult to distinguish between (i) the supply of and demand for environmental assets (ii) production and consumption activities (iii) risks to environmental assets and the vulnerability of human and economic assets dependent on those environmental assets, (iv) ecosystem processes and final ecosystem goods and services [provisioning, regulating, habitats, and cultural services], and (v) stocks and flows. It is also difficult to capture inter-temporal issues.
step 4: Developing the cities assessment framework and core indicators Based on the results of Step 3 a more pragmatic assessment framework and set of core indicators were developed. Data and indicators were based on seven key criteria:
� Data availability and coverage
� Sound theoretical basis
� Consistent and comparable over time
� Easily understood
� Transparent
� Useful in differentiating between types of cities
� Ability to act as proxies for other closely correlated indicators.
Data was drawn primarily from six sources (see further details below). Spatial data was drawn from the Centre for International Earth Science Information Network (CIESIN) at Columbia University. Tabular data was drawn from UN-HABITAT, UN World Urbanisation Prospects, the World Bank, C-GIDD, and Oxford Poverty and Human Development Initiative (OPHI). These datasets were reviewed and tested to ensure robustness and relevance.
Although some of the data for some of the indicators collected is imperfect in terms of city and year coverage for the purposes of developing urban typologies it is the relative rankings between the cities which is the most important consideration. Data for a range of ‘secondary’ indicators was also collected to support interpretation of the core indicators.
By looking at the different levels at which risks operate (see Chapter 2) and a detailed analysis of their interrelationships risks were grouped into three broad groups of interconnected risks:
1. Carbon emissions and energy use (including the extent of urban sprawl)
2. Risks to water, food, and natural habitat
3. Climate risks (hydrological)
This was complemented by three additional groups:
4. The vulnerability of each city to these future risk factors which varies by a city’s social and physical attributes such as its density, topography, and the percentage of its population in poverty.
5. The ability of each city to act which varies based on factors such as the presence of effective governance structures.
6. The scale and urgency of the challenge which varies depending on factors such as the size of emissions population size, and size of the vulnerable population.
A city’s topography and geography (physical geography and climate zone) impact on all of the above factors and was included as an independent group to aid ease of interpretation. The above groups of factors provide clues into the incentive of each city to act on each future risk factor which varies based on factors such as the city’s dependency on imports of food or fossil fuels and risk of high carbon lock-in based on factors such as the newness of the existing service infrastructure and existing use of mass transit infrastructure vis-a-vis alternative modes of travel.
step 5: ranking cities The above indicators were ranked on a scale of 1 to 3 (low to high) to give the relative ranking of the city on each indicator. Different criteria (boundary values) were used to determine low, medium, and high rankings as indicated in Table 1 based on input from the projects expert group. Each core indicator group was then given an aggregate index score for the seven main groups of issues. The indicator framework was continually refined and re-tested throughout this process.
step 6: Developing the typologies Cities were then mapped and clustered based on which cities had medium to high risks in one or several of the three risk categories. Sub-indicators were then used to refine these groups further. These groups were then validated and refined using correlations between indicators. For example, there is strong positive correlation at 1 per cent significance level between emissions per capita and energy use per capita, and a negative correlation at 1 per cent significance level between density and emissions per capita i.e. high density cities tend to have lower emissions per capita. There is also a strong negative correlation at 1 per cent significance level between flood, cyclone, and landslide risk and drought risk – whilst there are some notable exceptions, flood risk cities tend to be in tropical climates or on the coast with lower drought risk. It is also possible to identify smaller sub-typologies or clusters within these broad groups.

Future Proofing Cities | 139
Atkins in partnership with
index 1: Carbon emissions, energy use, and urban sprawl
An index of carbon emissions, energy use, and urban sprawl was developed for each city applying a 40% weighting to the level of carbon emissions, 40% to energy use, and 20% to the extent of urban sprawl.
� Carbon emissions per capita was used as the basic measure of relative city carbon emissions. Information on carbon emissions per capita is not currently collected in a consistent manner for individual cities. As such data compiled by ICLEI was used for city level CO2 emissions across a wide range of cities in India, Bangladesh, and Nepal. Where city level data was not available, a national proxy was used to provide an accurate relative ranking.
� Energy use per capita: Data on energy use is not currently collected in a consistent manner for individual cities. A national proxy was used and reviewed to ensure an accurate relative ranking.
� Population density (people per Km2) was calculated using the spatial extent of the city data from CIESEN (see below) and population data from the UN.
Sources:
� ICLEI Asian Cities CO2 data (city): Year: 2008
� World Development Indicators (national): Year: 2009
� See below for further details of density indicator (city level)
index 2: Water, food, and natural habitat Three core measures were used to understand city resource dependence and availability covering water and food, as well as risks to natural habitat and biodiversity:
� For water availability, spatial drought risk data for the most severe risks (8-10) was used from CIESEN (Weighted Anomaly of Standardized Precipitation (50% below normal precipitation for a three-month period, 1980-2000). This spatial data was aggregated and used in tandem with CIESEN’s spatial extent dataset to provide a measure of the percentage (%) of the city catchment (assumed at 100km) at risk of drought.
� For food availability, spatial data on crop and pasture land is available from CIESEN. This spatial data was aggregated and used in tandem with CIESEN’s spatial extent dataset to provide a measure of the % of the city catchment (assumed at 100 km) available for use as crop and pastureland – this assumes that the greater availability of crop and pastureland within the city catchment, the greater ability of the city to draw on food sources in the event of changes in the price and availability of current food supplies (either imported or grown in other parts of the country).
� The risk to natural habitats (forest and wilderness) was measured by using CIESEN data to calculate the % of the city catchment (assumed at 100 km radial buffer) which remains as forests or wilderness [defining forests and wilderness as categories ‘51: Populated forests’, ‘52: Remote forests’, ‘61: Wild forests’, ‘62: Sparse trees’ and ‘63: Barren’ from CIESEN’s Anthropogenic Biomes of the World, Version 1 dataset]. This measure captures natural habitat with particularly high levels of biodiversity and important species.
indicators and data sources
Sources:
� Global Drought Hazard Frequency and Distribution, v 1, Source: Socioeconomic Data and Applications Center (SEDAC), Columbia University.Year: 1980-2000
� Global Agricultural Lands: Pastures: Source: Socioeconomic Data and Applications Center (SEDAC), Columbia University. Year: 2000
� Global Agricultural Lands: Croplands, 2000, Source: Socioeconomic Data and Applications Center (SEDAC), Columbia University. Year: 2000
� Urban Extents Grid Source - Global Rural-Urban Mapping Project, Version 1 (GRUMPv1): Center for International Earth Science Information Network (CIESIN), International Food Policy Research Institute (IPFRI), The World Bank, Centro Internacional de Agricultura Tropical (CIAT) Year: 2000
� Anthropogenic Biomes of the World, Version 1, Source: Socioeconomic Data and Applications Center (SEDAC), Columbia University Year: 2008
index 3: Climate hazard risks (hydrological)
Spatial climate risk hazard data for the most severe climate risks (8-10) is available from CIESEN. The vulnerability of the city to climatic impacts has been looked at in three dimensions:
� Risk of the city to flooding (counts of extreme flood events, 1985-2003)
� Risk of landslides due to changing weather patterns (index of landslide and snow avalanche hazard)
� Cyclone risk (frequency by wind strength, 1980-2000)
This spatial data was aggregated and used in tandem with CIESEN’s spatial extent dataset to provide a measure of the percentage of the city extent at risk of climate hazards in each category. These three indicators were then aggregated into a climate risk index using a 50% weighting for flooding, 25% for landslides, and 25% for cyclones. For four cities for which climate risk data was not available, regional benchmark cities were used as proxies. It was found that proximity to coasts and rivers was a poor proxy measure of climate risk. The flood risk indicator includes risk of tidal flooding. Data on temperature extremes is generally unavailable on a comparable basis for cities in the developing world.
Climate change projections (e.g. to capture projected sea level rise and the increased incidence of temperature extremes) are generally unavailable on a comparable basis for cities in the developing world.
Sources:
� Global Multihazard Frequency and Distribution, Source: Center for Hazards and Risk Research (CHRR); Center for International Earth Science Information Network (CIESIN), Columbia University; International Bank for Reconstruction and Development/The World Bank. Urban extent grids used as above. Year: 1980-2003

140 | Future Proofing Cities
Atkins in partnership with
index 4: City vulnerability Three core measures were used to measure city vulnerability:
� Poverty and inequality: Measured by taking the percentage of the population living in multiple dimensional poverty (MDP) (as defined by the innovative recent work of the Oxford Poverty and Human Development Initiative (OPHI)) and the GINI-coefficient. These were added together to provide an aggregate index of poverty and inequality. Regional data for multi-dimensional poverty was used as a city level proxy taken from the Oxford Poverty and Human Development Initiative. National data was used for the GINI co-efficient as a city level proxy – this was found to be highly correlated with city level data for a limited sample of cities for which GINI co-efficient data is available.
� Access to basic services: Defined by giving an equal weighting to the percentage of the population living in slum areas (informality), the percentage of people living in MDP and deprived of access to electricity, the percentage of people living in MDP and deprived of access to water, and the percentage of people living in MDP and deprived access to sanitation.
� Density: Defined as above with an inverse ranking to indicate that greater density suggests greater vulnerability to risk factors such as flooding.
An aggregate index was constructed to ease comparisons between cities: poverty and inequality and access to basic services were given weightings of 40%, and density 20%. For cities across South Africa, Thailand, and Sudan national level proxies had to be used for certain indicators using data from the World Bank.
Sources:
� Oxford Poverty and Human Development Initiative (OPHI): Years: various 2004-2010. Alkire, S. Roche, JM. Santos, ME. and Seth, S (November 2011) http://ophi.qeh.ox.ac.uk.
� UN World Urbanisation Prospects: various 2004-2011
index 5: Ability to Act Two core measures were used to measure a cities ability to respond to future risks:
� GDP per capita, 2010
� The economic health of the city: Measured by using projected GDP growth 2010-2025 as a percentage of projected population growth 2010-2025. The greater the value, the greater the economic growth projected in comparison to the growth of the city’s population; this implies a greater ability to invest in responding to future challenges. GDP data for 2010-2015 as estimated by C-GIDD were projected forward to 2025 assuming the same rate of growth.
We tested using national level CPIA data as a proxy for urban governance – this proved a poor proxy given the diversity of governance between cities within the same country.
Sources:
� UN World Urbanisation Prospects: Years: 2010-2025
� C-GIDD: Years 2010-2015
index 6: size and impact
A number of absolute measures were used to supplement the relative measures used above to provide a separate assessment of the scale of the challenges facing cities. This includes the:
� Absolute size of carbon emissions (calculated from national or regional carbon per capita using city level population data). Energy was not used due to its close correlation with carbon emissions.
� Future economic pressure using:
- Projected GDP in 2025 as a measure of (projected, as above, from C-GIDD data – also a proxy for likely scale of emissions and energy use in 2025 under BAU)
- The absolute growth in GDP 2010-2025
� Future human pressure using:
- Projected population in 2025.
- The absolute growth in population 2010-2025.
� Size of the vulnerable population using the current absolute numbers of people living in multi-dimensional poverty (calculated using city level population data).
� The Human Influence Index provided by CIESEN which is a measure of direct current human influence on terrestrial ecosystems using best available data sets on human settlement (population density, built-up areas), access (roads, railroads, navigable rivers, coastline), landscape.
An aggregate index was constructed to ease comparisons between cities: equal weightings were used to create an aggregate index score.
Sources:
� UN World Urbanisation Prospects: Years: 2010-2025
� Oxford Poverty and Human Development Initiative (OPHI): Years: various 2004-2010
� C-GIDD: Years 2010-2015
� Last of the Wild Project, Version 2, 2005 (LWP-2): Global Human Influence Index (HII) Dataset (IGHP), Source: Wildlife Conservation Society (WCS), Center for International Earth Science Information Network (CIESIN), Columbia University Year: 2005
� See above for carbon data.
index 7: Pace of change
Two indicators were used to measure pace of change in cities:
� % growth in GDP 2010-2025
� % growth in population 2010-2025
Sources:
� UN World Urbanisation Prospects: Years: 2010-2025
� C-GIDD: Years 2010-2015

Future Proofing Cities | 141
Atkins in partnership with
index 8: Climate and geography
� The climatic zone for each city was determined using data from PLACE II Climate Zone Mapping data from CIESEN.
� The geographical position of each city (i.e whether it was coastal, inland, or mountainous) was taken from [PLACE II Elevation Zone and Coastal Proximity Mapping]. Coastal cities were assumed to be [within 100 km from the coast]. Mountainous cities were assumed to [be in the over 1,500m elevation zone]. And inland cities were assumed to [be those further than 20 km from the coast]. [City spatial extents that extended outside of the 100 km buffer were trimmed back to edge of 100 km and any city spatial extents that were combined as one area due to close proximity were separated to distinguish them].
Sources:
� Population, Landscape, and Climate Estimates data set (PLACE II), Source: Socioeconomic Data and Applications Center (SEDAC) Years: 2006

142 | Future Proofing Cities
Atkins in partnership with
table 1: threshold values for determining city rankings
Index Indicator Threshold values year
Index 1.1 Carbon EmissionsCO2 emissions per capita (metric tons per capita)
< 1.5 tonnes = 1, 1.5 - 5 tonnes = 2, > 5 tonnes = 3 (MIC average)
2008
Index 1.2 Energy UseEnergy use (kg of oil equivalent per capita)
<500 = 1, 500 - 1500 = 2 (LIC average 2005), > 1500 = 3 (MIC average 2005)
2009
Index 1.3 level of Urban Sprawl
Population density (people per km2) < 2000 = 3, 2000-4000 = 2, > 4000 = 1
2005
Index 2.1 Risk of water Scarcity
% of city catchment (100 km buffer) with risks 8-10
33rd and 66th percentile by value 2000
Index 2.2 Risk to Food Supply
% of city catchment (100 km buffer) pasture and cropland
33rd and 66th percentile by value 2000
Index 2.3 Risk to Natural Habitat (forests and wilderness)
% of city catchment (100 km buffer) <10% = 1, 10% - 30% = 2, > 30% = 3 2000
Index 3.1 Flood risk % area with risks 8-10 in city extent 33rd and 66th percentile by value 2000
Index 3.2 landslide risk % area with risks 8-10 in city extent 33rd and 66th percentile by value 2000
Index 3.3 Cyclone risk % area with risks 8-10 in city extent 33rd and 66th percentile by value 2000
Index 4.1 Inequality & Poverty
50% GINI, 50% MPI 33rd and 66th percentile by value2004-2010 (MPI), 2006-2011 (gini)
Index 4.2 Access to basic Services
Equal weighting to each sub-indicator
33rd and 66th percentile by value2005-2007 urban informality, Others 2004-2010
Index 4.3 density Population density (people per km2) <2000 = 1, 2000-4000 = 2, 4000 > = 3 2005
Index 5.1: GdP per capita GDP per capita 33rd and 66th percentile by value 2010
Index 5.2: Economic v.s. City Growth 2010-2025
Growth GDP (2010-2025)/ Growth City (2010/2025)
33rd and 66th percentile by value 2010-2025
Index 6.1 Size of carbon emissions
Carbon emissions (metric tonnes)25th percentile = 1, Mean = 2, 75th percentile = 3
2009
Index 6.2 Size economy in 2025
GDP (PPP in 2005 constant $)25th percentile = 1, Mean = 2, 75% percentile = 3
2025
Index 6.3 Size of population in 2025
Number of people (millions) < 5 million =1, 5 - 10 million = 2, > 10 million = 3
2025
Index 6.4: Scale of poverty challenge
Numbers living in MPI (millions) < 1 million = 1, 1 - 5 million = 2, > 5 million = 3
2004-2010
Index 6.5 Current Human Influence
Human Influence Index 33rd and 66th percentile by value 2005
Index 6.6: Growth in economy 2010-2025
Absolute growth in economy (GDP PPP in 2005 constant $)
25% percentile = 1, Mean = 2, 3 = 75% percentile = 3
2010-2025
Index 6.7: Additional population 2010-2025
Absolute growth in population<1 million = 1, 1 - 3 million = 2, > 3 million = 3
2010-2025
Index 7.1: % growth in GdP % growth in GDP 2010-2025 33rd and 66th percentile by value 2010-2025
Index 7.2: % growth in population
% growth in population 2010-2025 33rd and 66th percentile by value 2010-2025

Future Proofing Cities | 143
Atkins in partnership with
Developing typologies and gaps in city level data As outlined in Chapter 5 of the main report, the cities assessment work has shown that there are significant gaps in the data on the environmental risks facing cities, especially those located in the developing world, both in terms of scope and the time series available. This makes it difficult to provide fully accurate quantitative assessments of the individual risks currently facing cities in the developing world and highlights the need for the international community to step up data collection efforts. More detailed assessments at city level may be required as a first step towards taking action.
However, for the purposes of developing urban typologies it is the relative ranking of the data between cities in terms of their primary environmental risk drivers which is the most important consideration. The secondary data gathered for this report provides a reasonable guide and assessment of the relative ranking of the primary risk drivers between cities. For example, although some of the climate hazard risk data used is not as current as one would ideally like, climate hazard risks remain relatively slow moving and the estimates used provide a strong picture of the relative strength of the climate hazard risks between the cities assessed.
Typologies and city level indicators of environmental risk are necessarily a simplification and representation of issues and challenges facing the city and reflect available comparative data between cities. The limitations of the approach are well known and care is required when interpreting the results of this study. The benefit of the approach is in crystallising and bringing to the fore the most significant issues manifesting themselves at metropolitan scale to inform the debate among stakeholders on how to address the issues identified.
A thorough understanding of the interlinkages between risks, vulnerability, capacity to act and other indicators of urban dynamics is required to design policies and interventions which can be effective in future proofing.
Based on the assessment of the 129 cities featured in this report some notable trends stand out3:
� Wealthier cities in terms of GDP per capita tend to have higher emissions and energy use per capita
� Larger and wealthier cities have a greater human influence on ecosystems
� GDP, poverty, and inequality are linked in complex ways. Wealthier cities tend to have slightly higher levels of inequality and lower levels of poverty, although higher average per capita does not guarantee lower levels of poverty.
� Climate risk factors and resource/natural habitat risks do not appear to be correlated with GDP per capita: there is no evidence to suggest, for example, that cities located in drought prone areas are any less likely to be successful in growing their economies i.e. urban economies do not appear to be inhibited by ‘geographical destiny.’
3 Based on pairwise correlations of relevant indicators from the Atkins Urban Risk database at 1% significance level
Exploring links between risks, vulnerability, and capacity to act

144 | Future Proofing Cities
Atkins in partnership with
VUlNERAbIlITy10. Inequality & poverty11. Access to basic services12. Density of urban population
CAPACITy TO ACT13. GDP per capita14. Economic v.s. population growth 2010-2025
Size of city: 6204 km2
Population size: 6.98 million1
2
3
4
5
67
8
9
10
1112
13
14
15
16
1718
19
20
21
22
ENVIRONMENTAL RISKS
VULNERABILITYCAPACILY TO ACT
SCA
LE O
F CH
ALL
ENG
E
PACE OF CHANGEHigh
Low
Clim
ate
and
Geo
grap
hy Climate zone Tropical
Geography Inland
Levels of forests and natural habitat within catchment
Low
Region EAP
Carb
on
emis
sion
s an
d en
ergy
use
CO2 emissions per capita (metric tonnes) 4.19
Energy use (kg of oil equivalent per capita) 1504
Level of urban sprawl (people per km2) 1066
Reso
urce
and
ec
osys
tem
risk
s (w
ithi
n th
e ur
ban
catc
hmen
t) Risk of water scarcity (% catchment at significant risk of drought)
20%
Risk to food security (% catchment pasture and crop land)
43%
Risks to natural habitat (% catchment forests and wilderness)
0%
Clim
ate
risk
s (%
cit
y ex
tent
at
hig
h ri
sk) Flood risk (% city extent at significant risk) 62%
Landslide risk (% city extent at significant risk) 0%
Cyclone risk (% city extent at significant risk) 0%
Vuln
erab
ility
to
risk
s
Inequality and Poverty Index 0.24
Access to Basic Services Index 0.13
Density of urban population 1066
Capa
city
to
act
GDP per capita 2010 (PPP in constant 2005 $) 25395
Ratio of GDP growth to population growth (2010-2025)
4.05
Scal
e of
cha
lleng
e
Carbon emissions (tonnes) 29199713
Projected size of economy in 2025 ($ billion) 330.61
Projected growth in economy 2010-2025 ($ billion) 153.44
Projected size of population in 2025 (million) 8.47
Projected additional population 2010-2025 (million) 1.49
Scale of poverty challenge (millions in multi-dimensional poverty)
0.002
Current Human Influence (Human Influence Index) 33.0
Pace
of
Chan
ge
Projected growth in GDP 2010-2025 87%
Projected growth in population 2010-2025 21%
BangkokthAiLAnD
ENVIRONMENTAl RISKS1. Carbon emissions2. Energy use3. Level of urban sprawl4. Risk of water scarcity5. Risks to food supply6. Risks to natural habitat (forests and wilderness)7. Flood risk8. Landslide risk9. Cyclone risk
PACE OF CHANGE21. Growth in GDP 2010-202522. Growth in Population 2010-2025
SCAlE OF CHAllENGE15. Size of economy in 202516. Growth in economy 2010-202517. Size of population in 202518. Additional population 2010-202519. Scale of poverty challenge20. Current Human Influence
Selected statistics

Future Proofing Cities | 145
Atkins in partnership with
VUlNERAbIlITy10. Inequality & poverty11. Access to basic services12. Density of urban population
CAPACITy TO ACT13. GDP per capita14. Economic v.s. population growth 2010-2025
PERCENTAGE OF CATCHMENT AT SIGNIFICANT RISK OF DROUGHT
PEOPLE PER KM2
PASTURE AND CROPLAND AVAILABILITY WITHIN
CATCHMENT
PERCENTAGE OF URBAN ExTENT AT SIGNIFICANT
RISK OF FLOODING
INLAND
6,204 km2
SIzE Of THE cITy
WATER SCARCITY
20%
$25,395GDP PER CAPITA (2010)
SIZE OF ECONOMY IN 2025
$331bn
ACCESS TO BASIC SERVICES INDEx0.13
INEquALITy & POvERTy
INDEX
0.24 FOOD SECURITY
43%
TROPIcAL
SPRAwLED
62%FLOOD RISK
LEVEL OF FORESTS AND NATURAL HABITAT
WITHIN CATCHMENT
LOw
1504ENERGY USE
(KG OF OIL PER CAPITA)
1066DENSITY
CO2
4.19METRIC TONNES
87%GROwTH IN GdP2010-2025

146 | Future Proofing Cities
Atkins in partnership with
The table below provides a more detailed description of the policy options for future proofing outlined in Chapter 4.
No. Policy category General description
1 Diversification of energy sources and distribution
Shifting energy sources away from a high dependence on fossil fuel towards renewable energy sources.
2 Reform pricing of energy e.g. reviewing energy subsidies
Reform of subsidies programmes which artificially reduce fossil fuel prices versus market rates and encourage greater use.
3 Adaptive social protection programmes (e.g. combining DRR and CCA)
An interlinked approach that combines key elements of social protection (SP), disaster risk reduction (DDR) and climate change adaptation (CR). The approach tackles unsafe living conditions, seeks to address the underlying causes of vulnerability, and promote people’s ability to adapt to a changing climate.
4 Programmes to improve social cohesion e.g. gender and race relations
Programmes to improve social cohesion can directly or indirectly assist in building resilience and adaptive capacity to respond to climate and environmental risks. For example, measures to strengthen social cohesion can support communities to respond quickly and in a unified way to climate related disasters.
5 Insurance programs (targeting the poor e.g. micro insurance)
Micro insurance schemes are risk-pooling tools that spread the risk of a disaster among many people. Insurance programmes provide safety nets for the urban poor by reducing their reliance on humanitarian aid in the event of a climate-related disaster.
6 Public health programmes and hazard planning to tackle vector borne diseases and climate related risks
Measures to strengthen public health programmes. These could include developing climate proofing plans, policies and strategies and strengthening public health infrastructure including disaster and emergency preparedness. Highly climate-sensitive diseases, such as vector borne diseases (malaria, dengue) are expected to worsen as the climate changes.
7 Diversification of agriculture away from climate and resource sensitive areas
Measures to diversify agriculture away from climate and resource sensitive areas. This could include adopting production systems that are resilient to land and water modifications e.g. crop rotations, agroforestry, crop-livestock associations, and crop-fish systems. Agricultural productivity can be seriously impeded by climate change (e.g. higher temperatures and decreased rainfall) and damage to natural ecosystems (e.g. water).
8 Implementation of sustainable tourism policies
Tourism which aims to make a positive impact on the environment as well as economic and social development. Policies can relate to the husbandry of natural resources, management of pressures on infrastructure, energy, water and waste, and optimising the presence of tourism to benefit local communities.
9 Economic diversification of urban economy
Reducing overall dependency over time on sectors of the economy such as commodities and fossil fuels which are non-renewable resources as well as sectors in geographical areas that are more likely to be affected by climate risks such as agriculture and tourism.
10 Reform water pricing Setting tariffs/user prices that more accurately reflect the consumption and treatment costs of water. For example, a cost recovery approach can help to conserve water resources and encourage greater water efficiency among agricultural, industrial, commercial and domestic consumers.
11 Use of less fossil fuel intensive food sources within supply chains
Reducing the food sector's dependence on the high and fluctuating prices of fossil fuels through methods which reduce transport related food miles through improved distribution networks and supply chains which reduce transport related emissions and wastage. In addition, agricultural production techniques which are less dependent on oil based fertilisers or non-renewable energy resources which may be needed for heating/cooling.
Appendix 2: Future Proofing policy options

Future Proofing Cities | 147
Atkins in partnership with
No. Policy category General description
12 Upgrade skills of labour force to promote labour flexibility and innovation in responding to climate related and resource shocks
Policies which enhance the skills and education of the workforce have the effect of improving adaptive capacity and resilience. This means that communities can more easily adapt to changing circumstances linked to, for example, climate change. Higher skilled populations have a greater capacity to transition to new sectors which can provide economic and employment growth.
13 Policies to support low carbon, resource efficient, and climate resilient innovation and deployment
Policies to support R&D and innovation in sectors related to the green economy can assist in catalysing development which is more energy and water efficient. The development of new clean technologies can serve to reduce material consumption and environmental impacts across the product lifecycle. Process innovation can reduce the embodied and operational energy related to economic activity.
14 Reduce barriers of entry for small and micro businesses to help adjustment and innovation in responding to climate related and resource shocks
The encouragement of business start ups and a regulatory framework which is supportive of Small and Medium Sized Enterprises (SMEs) can help build innovative capacity within the economy. New entrants to the market can provide a disruptive force catalysing new economic activity in the economy.
15 Schemes to encourage intra-country or FDI into low carbon, resource efficient, and climate sensitive technologies/sectors
Leveraging Foreign Direct Investment (FDI) can be an efficient mechanism for diffusion of modern and more energy and water efficient technologies. Schemes such as the Joint Initiatives linked to the Clean Development Mechanism (CDM) for example, can speed up the transfer of knowledge and skills to support developing countries adopt resource-efficient production technologies.
16 Land management policies and property rights
Land management policies relate to the ownership, use, protection and husbandry of land. A system of defined property rights is an important foundation to enable effective environmental protection and management of climate risk in cities. Property rights and defined ownership of land cadastrals is a first step towards managing land effectively. Land use policies can be used to promote or restrict activities which may take place on land. Policies and schemes to promote particular management regimes can be used to maintain ecosystem service functions relating to land which may be important in reducing exposure to climate risk (e.g flooding, landslides, and soil erosion).
17 Mixed use zoning Allowing a variety of land uses together in one area e.g. residential, commercial, and community uses. Zoning and other land use laws can be used to encourage compact, mixed use and walkable development.
18 Mass transit orientated development plans
A mixed use area that is relatively high density and is designed to have good access to public transport. Higher density mixed use development at public transport nodes seeks to reduce car dependency and encourages use of public transport by locating trip-generating activities near one another and by supporting a network of mixed use centres to accommodate these activities, people can avoid unnecessary travel.
19 Pedestrian and bike orientated development plans
A pedestrian and bike friendly area that combines land design practices e.g. compact development, mixed use, traffic calming, and pedestrian/public transit-orientated development. Getting more people cycling, both for their daily commute and for recreational purposes can be achieved through local cycle networks employed through a combination of land design practices including compact development, mixed use, traffic calming, and pedestrian and public transit-orientation.
20 Increased density incentives/standards Promoting medium and higher density development can be an effective tool in reducing the energy intensity of development and make efficient use of land. More compact forms of development can have lower energy requirements. Higher density more compact urban form can underpin the viability of public transport networks and decentralised energy networks. Compact development with a mix of uses reduces the need to travel and increases opportunities to utilise non motorised modes for short distance trips. Minimum density zoning is a regulatory tool that can encourage more compact development. It should be noted that higher density can concentrate exposure to environmental risk. High density development tends to be less able to be adapted without recourse to redevelopment.

148 | Future Proofing Cities
Atkins in partnership with
No. Policy category General description
21 Infill and brownfield incentives Re-using previously developed and infill development reduces pressure on undeveloped areas and makes efficient use of land. The redevelopment of vacant, underutilised infill and brownfield sites can be encouraged through economic incentives, reformed zoning, land use restrictions, and permit streamlining to encourage development of empty or underutilised industrial facilities and derelict properties.
22 Transit orientated nodes Major transport interchanges, such as train stations and/or bus stations that are designed and planned within a community to encourage people to walk to them and not rely on use of cars to access them.
23 Air quality management Sets objectives and standards to secure improvement in air quality (e.g. encouraging lower car emissions). Air quality in compact areas can be improved through actions, such as promoting low-carbon vehicles, clean and renewable sources of energy that do not involve combustion, and management of industrial emissions.
24 Restricted development on vulnerable land
Limiting development and redevelopment on vulnerable land to low density/low intensity uses (such as open space). Vulnerable land is an area that is vulnerable to hazards such as flooding, cyclones, and sea level rise.
25 Relocation of development from vulnerable areas
Completely prohibiting development on land that is vulnerable to hazards such as flooding, cyclones, and sea level rise and relocating it to safer locations e.g. on land that is higher above sea level.
26 Strategic planning of key infrastructure in lower risk locations and buffer zones
Coastal roads, railways and airports are vulnerable to sea level rise, therefore such infrastructure could be relocated or rerouted around hazard-prone areas.
27 Greenbelt/growth boundaries Defining growth management boundaries such as greenbelts and green wedges can protect areas from inappropriate development. Policies can be used to grow the urban structure and form of the city in ways which reduce energy intensity of transport patterns. Boundaries can also be used to safeguard sensitive land uses and protect areas from development which are subject to climate risks. Growth boundaries can be used to concentrate development and facilitate regeneration and renewal of existing urban areas.
28 Greenspace zoning Pro-active planning of greenspace and green infrastructure is necessary to provide healthy living environments and support ecosystem service functions to the cities. Polices can be used to support provision of parks and open spaces, active planting, and proper maintenance and preservation of trees and vegetation. Urban greening of streets and buildings can provide shading and help to alleviate the urban heat island effect through cooling. Networks can be planned to support multiple functions such as recreation, drainage, wildlife corridors, flood mitigation etc.
29 BRT A public transit mode that uses buses to provide a light rail quality of service that is more efficient than regular bus systems. In cities this can encourage the modal shift from more private vehicles towards public transportation that can bring a range of benefits, including reduced congestion and air pollution.
30 Park and ride Car parks located on the edges of metropolitan areas/cities with connections to public transport that allows people to travel into the centre. Park and ride can assist in reducing traffic congestion by encouraging people to use public transport in an urban area and be strengthened with restrictions in parking capacity in the urban centre.
31 Low Emissions Zones To drive a catchment zone without paying a daily charge, heavy diesel polluting vehicles (larger vans, minibuses, lorries, and coaches) must meet certain emissions standards that limit the amount of particulate matter (a type of pollution) coming from their exhausts.

Future Proofing Cities | 149
Atkins in partnership with
No. Policy category General description
32 Metro systems A metro system is a rapid transit system that provides a high capacity and frequency service for passengers. These passenger transport systems are grade separated from other traffic (underground or elevated) and has the added benefit of less land use, less environmental impact, and a lower cost.
33 Standard bus services Standard bus services are road vehicles that are designed to carry passengers that operate on fixed or flexible routes and schedules.
34 Improvements in public transport information
Public transport information provides details about a public transport service. Improvements to public transport information could include, up-to-date timetables at all bus stops, verbal and electronic updates at bus and train stations for those with visual and hearing difficulties and an out-of-hours telephone line for timetable information.
35 Public transport lanes Dedicated lanes that segregate public transport from other traffic and can improve the operational speed of public transport as they encounter major traffic congestion. This can lead to improved public transport service quality, reliability, and energy consumption.
36 Managed/regulated paratransit e.g. minibuses
Paratransit systems are operated by individuals and small business. Services can vary from taxi or small bus services (operating along a route that can stop to pick up or discharge passengers at request) to a fully demand responsive transport system (offering on-demand call-up door-to-door service from any origin to any destination in a service area.)
37 Fleet replacement with low carbon, energy efficient vehicles
Replacing older, less efficient vehicle fleets with modern buses that are more fuel efficient than standard diesel buses, which can lead to reduced greenhouse gas emissions.
38 Fuel switching in transport fleet The process of changing the regular diesel fuel used in public transport services to alternative fuel sources (e.g. biodiesel fuel). Switching fuels has economical/environmental benefits including prolonging engine life and reduced pollution emissions.
39 Driving and parking restrictions and calming measures (demand reduction)
Driving and parking restrictions to reduce the number of vehicles on the roads. Traffic calming measures can be used to control the speed of vehicles so that they adopt slower and uniform speeds. These measures (e.g. reducing car parking spaces) can also be used to influence driver behaviour towards using public transport over cars.
40 Parking privileges for low carbon vehicles
Parking privileges, such as parking permits allow drivers access to a specific parking space. The provision of preferential car parking spaces for low carbon vehicles can encourage use over regular vehicles.
41 Car clubs/pooling Vehicles (usually cars and vans) are provided to members on a pay-as-you-drive basis. Clubs can be organised on a community basis or by private businesses with 'car stations' located in an area that is easily walkable for a large cluster of members.
42 Hybrid and electric vehicles incentive programme
Financial incentives for consumers to purchase a plug-in electric vehicle where the Government provides a subsidy that reduces the up-front cost of eligible cars.
43 Tougher minimum emissions/fuel economy standards
Setting minimum fuel economy standards for all new cars through legislation.
44 High quality walking and cycling infrastructure
High quality on and off-road walking and cycling routes are pathways that have good lighting, signposting, and are segregated from other forms of traffic. Improving infrastructure to support walking and cycling encourages the widespread uptake of these activities.

150 | Future Proofing Cities
Atkins in partnership with
No. Policy category General description
45 Intelligent Transport Systems Advanced applications that aim to provide innovative services relating to different modes of transport and traffic management that enables various users to be better informed and make safer, more coordinated, and 'smarter' use of transport networks.
46 Vehicle quota systems Systems that allow authorities to control the amount of cars on the road. Quotas are usually reviewed on a regular basis.
47 Public transport temperature/other tolerance standards
Incorporates new design standards to strengthen resilience to climate hazards and other environmental risks, which could include the alignment of routes, elevation of routes, major drainage improvements, and improvements to ventilation of underground routes
48 SMART work centres (inc internet development)
Provision of a physical flexible workspace close to their residences can result in reduced transportation demands and increased productivity of the workforce.
49 Energy efficient street lighting Street lighting (e.g. LED) that is more energy efficient than incandescent bulbs of the same luminance, which can lower power consumption and provide a longer and more predictable product lifetime.
50 Use of local and resource efficient materials in building construction e.g. procurement modalities
Use of materials in development that can be found locally from sustainable sources. Using these materials in new developments can save a significant amount of energy that would be used in transportation of materials sourced further away. Local materials can also strengthen the local economy and reinforce local identity through new building design.
51 Off grid energy and water supply Off-grid energy and water supply serves locations that do not have access to national/major energy/water supply grids. Off-grid developments are autonomous and do not rely on municipal services for water or energy supplies. Off-grid developments can utilise renewable energy sources to improve efficiency e.g. solar power.
52 Construction waste management The removal, separating, and recycling of waste materials that are accumulated on development sites. Disposal of construction waste needs to be carefully managed for possible hazards. There are also opportunities for recovery (flooring/door panels) and the possibility of reusing materials (rubble) elsewhere on a development site.
53 Solar orientation for new build neighbourhoods / cities
Passive solar design integrates a combination of building features to reduce the need to use energy to cool, heat or light a building. New developments will optimise cooling during hotter months (e.g. shading, natural cooling) while maximising heating (e.g. insulation, south-facing windows) during the colder months. The concept can extend to whole neighbourhoods or cities.
54 Retrofit to address natural hazards/ climate risks
Retrofitting an existing development so that it is more resistant to natural hazards/climate risks. Adapting existing buildings to cope with the stresses that the structure may be subject to from particular hazards or hazard scenarios. Examples of retrofitting include adding bracing to stiffen walls, reinforcing pillars, adding steel ties between walls and roofs, installing shutters on windows, and improving the protection of important facilities and equipment.
55 Storm and flood resilient new build New development structures that are more resistant to the impact of storms and floods. A precautionary approach should be taken to ensure that future buildings are able to cope with climate change by designing roofs to withstand higher wind speeds etc.
56 Implementation of building codes or design/appliance principles for new build (minimum energy and water use performance, 'passive heating or cooling', ground clearance, flood compatible uses on ground floors)
A set of standards that are established and enforced by the local government for the structural safety and performance of buildings. Standards relating to the design and construction of new buildings can include standards relating to energy efficiency and building fabric performance, standards relating to energy and water efficient fixtures and fittings and use of materials. Building codes can also specify standards to respond to environmental risk such as floods, earthquakes and other natural hazards to ensure that buildings can be resilient to future risks.

Future Proofing Cities | 151
Atkins in partnership with
No. Policy category General description
57 Retrofit existing buildings to improve resource efficiency and thermal performance
Retrofitting an existing development to improve its resource and energy efficiency. Retrofitting and introducing energy conservation measures can result in higher performance buildings that reduce energy consumption and the cost of heating, cooling, and lighting of buildings.
58 Fully integrated eco-villages/neighbourhood schemes
The establishment of new communities or retrofit of existing communities incorporating a wide range of sustainability measures across different sectors such as buildings, energy, waste, water, transport, greening, food production, community services, and social and economic needs. Some countries such as India and China have set specific standards and codes for the development of green eco-townships or eco-cities.
59 Demand management schemes targeting built environment
Demand reduction approaches, include the introduction of 'hard' measures that reduce energy demand, such as cavity wall insulation, double glazing etc. In addition, 'soft' measures, which focus on the management and control of various end-use devices can lower energy consumption e.g. through the adoption of new demand management and pricing schemes.
60 Micro generation Small-scale generation of heat and electric power by individuals, small businesses and communities to meet their own needs, as alternatives or supplements to traditional centralised grid-connected power. This approach is useful for places that suffer from unreliable grid power or are located a long distance from the electrical grid.
61 Sustainable use of biofuels Biofuel feedstock can provide a supply of an alternative source of renewable energy which can reduce dependency on fossil fuels. A sustainable source of feedstock is required which does not compromise other environmental, social and economic objectives. It is also important to consider the energy intensity of transportation and associated emissions which could remain dependent on fossil fuels.
62 CHP/district heating or cooling Instead of supplying heat or power via national transmission and distribution networks, decentralised systems distribute heat/cooling within localised networks for residential and commercial heating and cooling. Depending on the source of feedstock, systems may also generate electricity which can be fed to the grid. Systems are an efficient source of heat and power generation, as losses from transmission and distribution can be minimised.
63 Smart grids An electrical grid that uses information and communications technology to gather and act on information. These intelligent systems can generate a good improvement in energy efficiency in electricity networks (power plants / wind farms) and energy usage in residential and commercial uses.
64 Large scale renewable generation at city scale
Renewable and low carbon energy installations that support cities or metropolitan areas. Some cities are increasing the amount of renewable energy available to its residents. By making urban power grids smarter and more flexible, the share of renewable energy generation in the energy balance can be increased.
65 Smart metering Use of electrical or gas meters that records consumption of electric energy or gas and communicates that information at least daily back to the utility for monitoring and billing purposes. Smart energy monitoring enables users to see how much energy they are using and the related costs that will help them in controlling and managing their energy use.
66 Improved energy access (renewable) to unserved communities
Promoting the development of affordable, reliable, and clean energy services for the poor, unserved communities through support services, such as financing programmes and subsidy policies, monitoring regimes and regulation.
67 Energy from waste (e.g. landfill gas capture)
The process of generating clean energy from gas captured from landfill waste.

152 | Future Proofing Cities
Atkins in partnership with
No. Policy category General description
68 Improved industrial processes e.g. energy, water efficiency
Improving the energy and water efficiency of industry in urban areas. Efficient energy use can be achieved through improved technologies and processes e.g. recycling and reusing waste streams.
69 Protection of groundwater resources Approaches to protect groundwater resources held underground in aquifers. Many aquifers include sources of freshwater which have accumulated over an extended period of time. The extraction and use of water from ground water needs to be carefully managed to avoid over-exploitation. Licencing of wells can be used as a tool to manage water resources sustainably. Groundwater recharge schemes can be used as a mechanism to replenish groundwater stocks over time. In coastal areas over abstraction of groundwater can lead to seawater intrusion reducing the agricultural productivity of land and food security.
70 Desalinisation plants* Desalinisation is the process of removing salt and other minerals from saline water. Setting up desalinisation plants can allow a drinking water source to be produced where traditional freshwater sources are limited.
71 Sustainable urban drainage schemes Sustainable urban drainage systems (SUDS) seek to avoid some of the problems of flooding, pollution and damage to the environment associated with much existing urban drainage.
72 Exploration and development of alternative water sources
The development and use of alternative water sources, such as recycled water (including sewer mining), treated stormwater or seawater.
73 Building simple latrines The most simple approach to improved sanitation; an inexpensive option where waste and wastewater collection systems are absent. If sited correctly, latrines prevent contamination of localised water sources with waste and help prevent associated adverse impacts on public health.
74 Protection of water catchment areas A catchment (or drainage basin or watershed) refers to an area of land where surface water will converge or drain to the same point. The quality of the water at that point is therefore dependent on activities and water use in the catchment, and can be improved through various methods such as land use controls, pollution controls and limits on vegetation clearance.
75 Greywater harvesting Collecting wastewater produced from domestic activities in buildings (other than toilets); for example, clothes washing, showers, bathtubs, and dish washing. Greywater recycling systems collect this water, treat it and re-use it for purposes that do not require drinking water quality.
76 Improved provision, management and maintenance of water and sanitation systems (including wastewater treatment plants)
Process of removing contaminants from wastewater with a purpose of producing an environmentally safe fluid waste stream (or treated effluent) and a solid waste (or treated sludge) suitable for disposal or reuse. Advanced technology can now be used to re-use sewage effluent for drinking water.
77 Climate resilient / water efficient landscaping
Landscaping with low water needs. Use of landscaping strategy and planting suited to local conditions can lead to the creation of a self-sustaining landscape that requires minimal supplemental water and provides other environmental benefits e.g. maintaining local biodiversity.
78 Demand management e.g. leakage management, metering, volume charging
Reducing the demand for water/energy through measures that improve the efficiency of the end uses of water/energy and through measures that can encourage behavioural change. A combination of communication and education programs, incentives, regulation and internal water efficiency improvements that encourage users to manage their water usage more efficiently.
79 Watershed reforestation/restoration A watershed (or catchment or drainage basin) refers to an area of land where surface water will converge or drain to the same point. Reforesting watersheds can lead to reduced soil loss, keep sediment out of streams, reduce the speed of stormwater runoff and increase biodiversity.

Future Proofing Cities | 153
Atkins in partnership with
No. Policy category General description
80 Waste collection and solid waste management
The collection, transport, processing, management and monitoring of waste materials. Managing and treating solid waste rather than direct disposal onto land or into water courses reduces pollution risks and impacts on water quality. Collection and management rather than burning means that carbon emissions and pollution from combustion can be reduced. Several waste treatment technologies are available which enable re-use and recycling of materials in ways which result in lower emissions than disposal to landfill which generates methane, a greenhouse gas. Some technologies use waste as a renewable feedstock to produce electricity.
81 City/neighbourhood recycling/composting/green exchange schemes
Community or neighbourhood waste collection and management schemes involve decentralised sorting of waste materials and composting of organic waste. Separation of materials enables them to be re-used or recycled to prevent waste of potentially useful materials.
82 Coastal defences (hard infrastructure) Man made coastal defence structures (e.g. sea walls) to provide protection from the action of wind, waves, and tidal flows.
83 Riverbank stabilisation Measures to maintain, stabilise, and repair the banks of rivers (e.g. through vegetation, sacks and blocks, and retaining walls). This river edge is important as it holds soil and prevents property from washing away due to climate hazards and other environmental risks.
84 Flood resilience or resistant infrastructure design
Flood resistance involves designing an infrastructure asset, or adapting an existing infrastructure asset so that floodwater is excluded during flood events and infrastructure can function normally without disruption.
85 Reforestation in flood buffer areas Reforestation and efficient methods of soil management (e.g. crop rotation) are measures that can improve flood control in an area. Forest removal, either partial or total, results in increased stream flows and higher groundwater levels.
86 Emergency evacuation plans/disaster response (e.g. heat waves/public buildings)
Systems that aim to ensure continued functioning in emergency situations. These plans are often multi-layered to address a range of issues e.g. flood and cyclones. They also set out evacuation procedures and arrangements for temporary housing, food, and medical care.
87 Early warning systems A system deployed by an individual or group to inform of a future hazard e.g. flooding and cyclones. Its purpose is to enable the deployed of the warning system to prepare for the danger and act accordingly to mitigate or avoid it.
88 Improve irrigation systems Improving the application of water to agricultural areas in urban catchments. Water-saving technologies (e.g. drip irrigation) can save water, increase yields of produce and reduce the rate of salinisation.
89 Anticipatory planning processes and mechanisms for responding to food price volatility (inc in relation to urban climate impacts)
Food price volatility is the continual fluctuation in the cost of food reflecting imbalances in the demand and supply of food. Food production is impacted by weather events and climatic factors every year. Food distribution and supply chains affect the price of food experienced in a local area. Authorities can anticipate volatility by maintaining buffer stocks of key food staples which can be utilised during times of higher food prices. Localisation of food production and distribution networks can be an option which provides alternative sources of supply when international prices are high. Agricultural methods which lead to sustainable increases in productivity (e.g water efficient irrigation systems) can also be used to build resilience to climate events. Some countries and urban areas have the opportunity to increase the area under cultivation to meet the needs of their population.
90 Urban agriculture and local markets The practice of cultivating, processing, and distributing food in or around urban areas which may include community smallholdings and allotments. Producing food in or in close proximity to existing urban areas reduces transport costs and emissions and harnesses labour and other resources available in urban areas. Bio-intensive production methods can be used to yield a diversity of crops and livestock.

154 | Future Proofing Cities
Atkins in partnership with
No. Policy category General description
91 Urban agroforestry to improve forest goods and services
Integrated approach to the retention and planting of trees and shrubs with crops and/or livestock to create more sustainable land use systems. The trees can ameliorate the effects of climate change by helping to stabilise erosion, improving water and soil quality and providing higher yields of produce.
92 Monitoring and protection of habitats and important species
The identification and monitoring of habitats and biodiversity is important as a first step in identifying priorities for protection. Habitats which are of international, national or local significance should be formally designated for protection from development. Some habitats may require restoration or management to enhance their ecological value.
93 Erosion control e.g. wind breaks and strip farming
Erosion control measures can include growing rows of plantation of trees to provide shelter from high winds and other climate hazards and to protect soil from erosion. At a broader scale, strategic planting can ensure that soils and land for agricultural cultivation in urban catchments are protected from erosion.
94 Soil fertility maintenance Maintaining the capacity of soil to provide plants with enough nutrients and moisture to produce crops. Soil plays an integral role in the global climate, indirectly through supporting vegetation and performs an important carbon regulating role. Soil also influences the microclimate close to the ground through heat storage which is affected by surface soil conditions, organic matter and moisture content. A range of techniques and solutions are available which can be used to improve soil fertility.
95 Protection and enhancement of coastal and marine ecosystems
Measures to protect coastal and marine ecosystems including the coastal zone and shoreline as well as near shore waters and the wider ocean. These areas contain a range of sensitive environments and natural habitats. Coastal and marine ecosystems accommodate a wide range of ecosystem service functions. Coastal wetlands such as mangroves, marshes, and seagrass meadows for example are significant carbon sinks and provide habitats for many species of fish and shellfish which can be sustainably managed as a food resource. Coastal environments also provide protection from storms, tidal surges, and other extreme events, and maintain water quality, provide a habitat for biodiversity, and provide a recreation resource which has both amenity and cultural value.
96 Restrictions on pesticides/chemicals Restrictions on chemicals used for managing insects or other organisms harmful to cultivated plants or to animals. Certain types of pesticides can reduce biodiversity and damage ecosystems by, for example, reducing the prevalence of weeds and insects and hence the food species of other animals. Alternatives which may be appropriate in certain circumstances include 'smart' pesticides, resistant crop varieties, and ecological methods of pest control (IPM).
97 Tree planting programmes/reforestation Replanting an area with forest cover. Trees can help to mitigate climate change by sequestering carbon dioxide as they grow. In addition, trees and vegetation can help to mitigate the effect of climate impacts (e.g. flooding), as well as enhancing biodiversity and providing a wide range of other ecosystem services.
98 Measures to avoid deforestation in catchment
Measures to avoid the clearance or clearing of a forest or stand of trees. The retention of trees provides multidimensional benefits at the local, national and international levels.
99 Mitigation of urban heat through greening (inc. heat tolerance measures)
An urban heat island (UHI) is a metropolitan area which is significantly warmer than the prevailing climatic conditions. The UHI magnifies climate risk (e.g. extreme heat and heatwave events). The urban heat island can be reduced by increasing tree and vegetative cover, creating green roofs (also called "rooftop gardens" or "eco-roofs"), installing cool/reflective roofs and using cool pavements. The planning and design of buildings subject to local topography can be used to promote through breezes and natural cooling.

Future Proofing Cities | 155
Atkins in partnership with
No. Policy category General description
100 Low cost enhanced efficiency stoves Introducing new apparatus for cooking into households that use fuels from sustainable sources can significantly lower energy use in comparison to older appliances and are often safer in design (e.g reducing indoor air pollution with significant health benefits).
101 Slum upgrade, including innovative high sufficiency unit design
Upgrading of informal settlement areas can include a range of measures to address the basic needs of the community. Measures included within programmes relate to provision of water, sanitation, and electricity, measures to protect against environmental hazards, improvements and upgrading of housing, and improved provision of local social facilities and access to employment opportunities. The upgrading of informal settlement areas can lead to improved living standards and encourage greater energy efficiency through upgrading of housing. Projects can also enable access to safer drinking water, sanitation, wastewater, and solid waste management.
102 Sustainable and affordable houses for the poor
Improving access to affordable housing for the urban poor can provide a secure basis for households to reside within the city. Energy and water efficient construction can help households manage these costs allowing income to be used on other things. Programmes can also result in health benefits. Units can be constructed to have a lower lifetime building cost and reduced maintenance requirements.

156 | Future Proofing Cities
Atkins in partnership with
Policy Assessment
For the analysis featured in Chapter 4 of this report. The policies were qualitatively assessed – for illustrative purposes - on a scale of 1-3 (low-high) based on their impact and cost effectiveness in addressing environmental risks informed by a wide range of international sources. Policies were assessed based on six criteria:
1. Carbon Abatement: The extent to which each policy measure acts to reduce carbon emissions (and associated non-renewable energy footprints) against business as usual (BAU).
2. Cost per tonne of Co2 avoided: The relative cost of a chosen policy measured against the quantity of Co2 abated
3. Averted damage cost: The value of the damage that is potentially avoided due to climate hazard risks through adoption of a certain policy.
4. Cost Benefit Ratio (no/low/med/high regrets): An assessment of whether measures to tackle climate hazards are worthwhile adopting in the face of associated uncertainties over future climate change classified as either:
� No-Regrets: Adaptive measures that deliver net socio-economic benefits regardless of future climate change.
� Low-Regrets: Adaptive measures for which the costs are relatively low and for which the benefits, although primarily realised under the projected future climate change, may be relatively large.
� Medium/High regret options: Large scale adaptive developments that are not reversible, present a significant investment cost and are not justifiable under current climatic conditions.
5. Total resource efficiency benefit/reduced pressure on natural habitats: Captures the efficiency of transformation of resources into productive inputs (e.g. yields per hectare), the increased economic value achievable from a given volume of resources (e.g. improved water efficiency), excluding behavioural changes, the reduced pressure on non-renewable natural habitats (e.g. slow growing tropical forests and natural habitats) or the boost in the supply of substitute resources (e.g. afforestation/reforestation). The resources covered included: land-use and agriculture, water, materials (e.g. steel), and natural habitat (e.g. forests, other biodiverse habitats). Given the close correlation between carbon emissions and traditional energy use, energy is assumed to be covered under the qualitative assessment of carbon abatement.
6. Cost efficiency of investment: The cost benefit ratio of policies in terms of their impact on the conservation of key resources.
This was complemented by qualitative assessments of their impact in tackling poverty and boosting service delivery, and on short-medium term economic growth and broader development (employment, enhancement of the capital stock, economic growth, improved competitiveness).

Future Proofing Cities | 157
Atkins in partnership with
Adaptation to climate change: Adjustment in natural or human systems (e.g. cities) in response to actual or expected climate hazards or their effects. It moderates harm or exploits beneficial opportunities of climate change. Various types of adaptation can be distinguished, including anticipatory, autonomous and planned adaptation.
Agglomeration economies: Relates to the benefits firms obtain when locating near each other or ‘agglomerating’. This concept is related to economies of scale and network effects. As more firms cluster together they usually take advantage of declining production costs, more suppliers and more customers. Cities and specifically urbanisation promote economies of agglomeration.
Capacity to act: There a wide range of definitions according to the specific context. We define this as a city’s capacity and willingness to respond positively to environmental risks. This is shaped by the economic and institutional attributes of a city and its actors, which determine the degree of its capability to respond to risks.
Carbon capture and storage (CCs): Technology that attempts to capture carbon dioxide originating from fossil fuel use (power generation and other industries) and then pump underground into secure storage in rock formations.
Catalytic Financing: The process whereby official financing from an agency (often the government) encourages further financing (often from the private sector).
Climate hazards: Refers to the risks posed by natural climatic processes and are often exacerbated by climate change. For example: flooding, cyclones and landslides.
Clean Development Mechanism (CDM): A flexible mechanism that provides for emissions reduction projects which generate Certified Emission Reduction units which may be traded in emissions trading schemes.
Climate change: The United Nations Framework Convention on Climate Change (UNFCCC) defines climate change as ‘a change of climate which is attributed directly or indirectly to human activity that alters the composition of the global atmosphere and which is in addition to natural climate variability observed over comparable time periods’.
Compact City: A high density urban settlement with mixed land uses and access to an efficient public transports system. The efficient urban layout encourages walking and cycling, low energy consumption and reduced pollution.
Driving force-Pressure-state-impact-response (DPsir): This is a conceptual framework for considering the interactions between society and the environment that is used to highlight gaps in knowledge, processes and linkages between human and environmental systems.
ecosystem services: The benefits people receive from ecosystems including products like clean drinking water and processes such as the decomposition of wastes.
externalities: An economic term describing a cost or benefit that is not transmitted through the price of an action and is incurred by a party who was not involved as either a buyer or a seller of the action causing the cost or benefit. An example would a non-car user suffering from the pollution caused by car users.
geospatial: A term describing the analysis of data using a geographical base.
greenhouse gas emissions: Emissions from the burning of fossil fuels and the manufacture of cement and include carbon dioxide produced during the consumption of solid, liquid, and gas fuels and gas flaring.
green infrastructure: Refers to an interconnected network of natural and green man-made features, such as forests, extensive grasslands, wetlands, but in cities also parks, gardens, cemeteries, trees at streets, green walls and roofs.
gini Co-efficient: the extent to which the distribution of income or assets (such as land) among individuals or households within an economy deviates from a perfectly equal distribution.
groundwater table: The level of the water located beneath the earth’s surface. Often depleted by wells, irrigation and poor water management.
informal settlements: Term often used to describe a slum or shanty town. Often areas where groups of housing units have been constructed on land that the occupants have no legal claim to or occupy illegally. They are often unplanned where the housing is not in compliance with current planning and building regulations.
Lock-in: An escalating commitment to an ineffective course of action that is extremely difficult or impossible to deviate from.
Low carbon urban trajectory: An alternative development pathway that reduces carbon emissions versus a business-as-usual trajectory.
Mitigation (to climate change): An anthropogenic intervention to reduce the anthropogenic forcing of the climate system. It includes strategies to reduce greenhouse gas sources and emissions and enhancing greenhouse gas sinks.
Multi-dimensional poverty (MDP): Measure that aggregates a range of indicators (e.g. health, education, income) of human wellbeing to capture the complexity of poverty.
Appendix 3: glossary of terms

158 | Future Proofing Cities
Atkins in partnership with
natural resources: Naturally occurring resources used by humans. Natural resources can include, amongst others, air, water, wood and fossil fuels.
Peri-urban: Land that is immediately adjoining an urban area.
resilience: The ability of a social or ecological system to absorb disturbances while retaining the same basic structure and ways of functioning, the capacity for self-organisation and the capacity to adapt to stress and change.
risk: There are a wide range of definitions of risk depending on the context reflecting the very different approaches to risk management taken in different fields. In the context of this report, we refer to risk broadly as the potential that the ‘activities’ of cities which drive carbon emissions and pressure on natural resources and ‘events’ in the form of climate hazards and external pressures on the resources used by cities will have an undesirable impact.
the global south: A generic term generally used to describe countries with a medium or low Human Development Index score, which is a comparative measure of life expectancy, literacy, education, standards of living, and quality of life for countries worldwide.
‘triple-Win’ solutions: In the context of this report, policies and programmes that deliver multiple environmental benefits by (1) reducing carbon emissions and energy use; (2) responding to climate hazards; and (3) reducing pressures on regional support systems such as water and food systems and natural habitat.
urban: Used as a collective term to fit with the different country specific definitions of cities and towns.
urban Catchment: Area surrounding a city that supplies water, food, and other ecosystem services.
urban Densification: Is a term used to describe the number of people living within an urbanised area. Often measured in the number of people in a given area. Concept closely linked to urban sustainability in theories such as New Urbanism, Transit-orientated development and smart growth.
urbanisation: Is the physical growth of urban areas as a result of rural migration and even suburban concentration into cities. Often linked with modernisation, development and industrialisation.
urban heat island (uhi) effect: The increased temperature of the urban air compared to its rural surroundings. The difference is particularly stark at night.
urban sprawl: The outward spreading of a city through the expansion of low-density development that increases car usage.
Vulnerability: A variety of definitions exist according to the specific context. In the context of this report we define vulnerability as the degree to which a city and its inhabitants are susceptible to and are likely to be detrimentally impacted by the stresses and shocks associated with climate change, resource scarcities, and damage to vital ecosystems. The United Nations International Strategy for Disaster Reduction defines vulnerability as the characteristics and circumstances of a community, system or asset that make it susceptible to the damaging effects of a hazard. The Intergovernmental Panel on Climate Change defines vulnerability to climate change as the degree to which a system is susceptible to, and unable to cope with, adverse effects of climate change, including climate variability and extremes.
‘Win-win’ solutions: In the context of this report, policies and programmes that deliver multiple environmental benefits by contributing to two of three out of the following objectives: (1) reducing carbon emissions and energy use; (2) responding to climate hazards; and (3) reducing pressures on regional support systems such as water and food systems and natural habitat.

For more information please contact: Nick Godfrey and Roger Savage (Lead Authors)
tel: +44 (0) 207 121 2264
email: [email protected]
For business enquires:Richard Alvey
tel: +44 (0) 207 121 2264
email: [email protected]
registered office: Atkins, Woodcote Grove, Ashley Road, Epsom Surrey KT18 5BW United Kingdom
enquiries: tel: +44 (0)1372 72 6140
Fax: +44 (0)1372 74 0055
email: [email protected]
www.atkinsglobal.com
Date of publication: November 2012

The Atkins logo, ‘Carbon Critical Design’ and the strapline ‘Plan Design Enable’ are trademarks of Atkins Ltd.© Atkins Ltd except where stated otherwise.
www.atkinsglobal.com