FUTURE PROOF PLAN
15
FUTURE PROOF PLAN
-
Upload
dinhnguyet -
Category
Documents
-
view
220 -
download
0
Transcript of FUTURE PROOF PLAN

FUTURE PROOF PLAN

33
AbOUT Us
We are Dentsu Aegis Network (DAN).
We help our clients communicate and build relationships with consumers around their products and brands. From identifying who those consumers are, to how they make their decisions, we make the best use of today’s media mix to bring to life the right communication strategy and deliver the best results for clients.
We offer the following services: • Branding solutions• Media planning & buying• Integrated, cross media solutions• Marketing & creative solutions• Content marketing• Entertainment marketing• Sports marketing
We do this through our global brand portfolio of Dentsu, Carat, Vizeum, Posterscope, iProspect and isobar, supported by multi-market specialist brands 360i, mcgarrybowen, Mitchell Communications Group, D2D, Amnet, Amplifi and pslive.
For more information: www.dentsuaegisnetwork.com
A note on definitions
We define our environmental, community and economic impacts beyond our core business as “corporate
social responsibility” or “CSR”.
• Event marketing• Sales promotion• Online & direct marketing• Out-of-home media • Corporate responsibility marketing• Marketing consulting• Public relations

54
Changing attitudes towards our planetNo business or individual has been left untouched by climate change. Growing resource scarcity and unpredictable weather occurrences create the need to prevent further climate change. We recognise that as our organization spans the globe we have a responsibility to take action on our own carbon footprint in every country we operate.
But we can’t save the planet on our own. Our largest environmental impact comes from both ends of our value chain: from our suppliers through to media partners. To tackle this, we need to our relationships with our clients, publishers and suppliers to reduce the carbon footprint of the media and marketing supply chain.
The impact of media convergenceAdvertising and media are changing. The proliferation of new and digital commu-nication technologies has created new ways to engage consumers. At the same time, consumer attitudes and behaviour towards advertising is changing too. This means advertising and content are converging.
We need to respond to this convergence by being open and transparent about new advertising practices. We need to look at the values inherent in advertising, create responsible and diverse content, and take into account vulnerable audi-ences. We can do this through working with industry partners to educate our people and external stakeholders on the latest developments.
Encouraging sustainable lifestylesThe single largest impact of advertising is the influence on consumers’ atti-tudes and behaviour – what brands and products they like and buy. This means advertising and marketing plays a large role in the economic life of our planet – influencing demand on a daily basis. This is prompting increasing critical scrutiny of advertising.
It is important that we highlight the value that advertising brings to wider societal and economic development, including our impact on supply and demand. We can do this through using advertising as a force for good – not only for our clients but to promote more sustainable life-styles for consumers.
Building a more cohesive societyThere is a growing gap between those who have and those that do not. The tension and unrest that result from this gap have a profound impact on social and economic stability. Because we (but also our clients and media partners) rely on a healthy consumer economy we feel the impact of this instability immediately.
Therefore we need to address some of the most pressing community chal-lenges where we operate. We need to invest to strengthen civil society through promoting human rights and diversity. We can do this through improving the communications capacity of the local charity sector.
ThE biggER PicTURE

76
ThE bUsiNEss cAsEhOw TAkiNg ThE LEAd ON csR Adds bUsiNEss vALUE
Creating the best place to workOur business relies on the expertise, crea-tivity and insight our people bring to their work. There is fierce competition for talent in many of our markets. It’s also important to provide continuous opportunities for growth and development for our people, as any level of turnover increases costs, reduces innovation and weakens collabo-ration. Underpinning all of this is a healthy, dynamic place to work, free from discrimi-nation and with equal opportunities.
CSR makes DAN the best place to work in the industry. It creates a positive employer brand in the market to attract the best people. In addition, embedding CSR human resources provides our people with opportunities to develop themselves. But above all CSR creates a stronger engagement and commitment to our agency, reducing turnover.
Sparking innovationWe are known as an entrepreneurial and innovative company, with a history of firsts. As we grow bigger it becomes both more important and more difficult to encourage collaboration and innovation – both crucial ingredients to achieve our corporate mission of reinventing the way brands are built.
Our CSR work can gives us an opportu-nity to try out new advertising methods, new methods of consumer insight and new analytics to showcase their effect to clients. Pro bono campaigns are fertile testing grounds of new technologies and delivery models.
Enhancing our corporate reputationOur corporate reputation rests on our track record of success and on our promise of innovation. This means standing out in a crowded market place of competing holding companies and start-up consultancies. And just like our clients are using CSR as a way to differ-entiate themselves, we can also use our green and community profile to enhance our reputation.
Stories on innovation and success for charity work or green initiatives help build a positive brand reputation for our company and provide marketing material. But it also creates an opportunity to link into clients and client teams and bring us closer together with our partners in the industry.
Making the operating model come aliveWhen our brands work together, we deliver the most seamless marketing and advertising services in the industry. Through working on one P&L in every market we encourage brands to collabo-rate and innovate together. Together with our liquid talent and shared resources, this is our unique operating model.
In practice, not every client gives us an opportunity to collaborate widely across the network. But we can use CSR to make the operating model come alive – enhancing collaboration and innovation. Through our pro bono work for charities we bring people from all brands together and get an opportunity to create consist-ency across markets and brands. This is a perfect opportunity to build trust, collaboration and spark innovation.
98
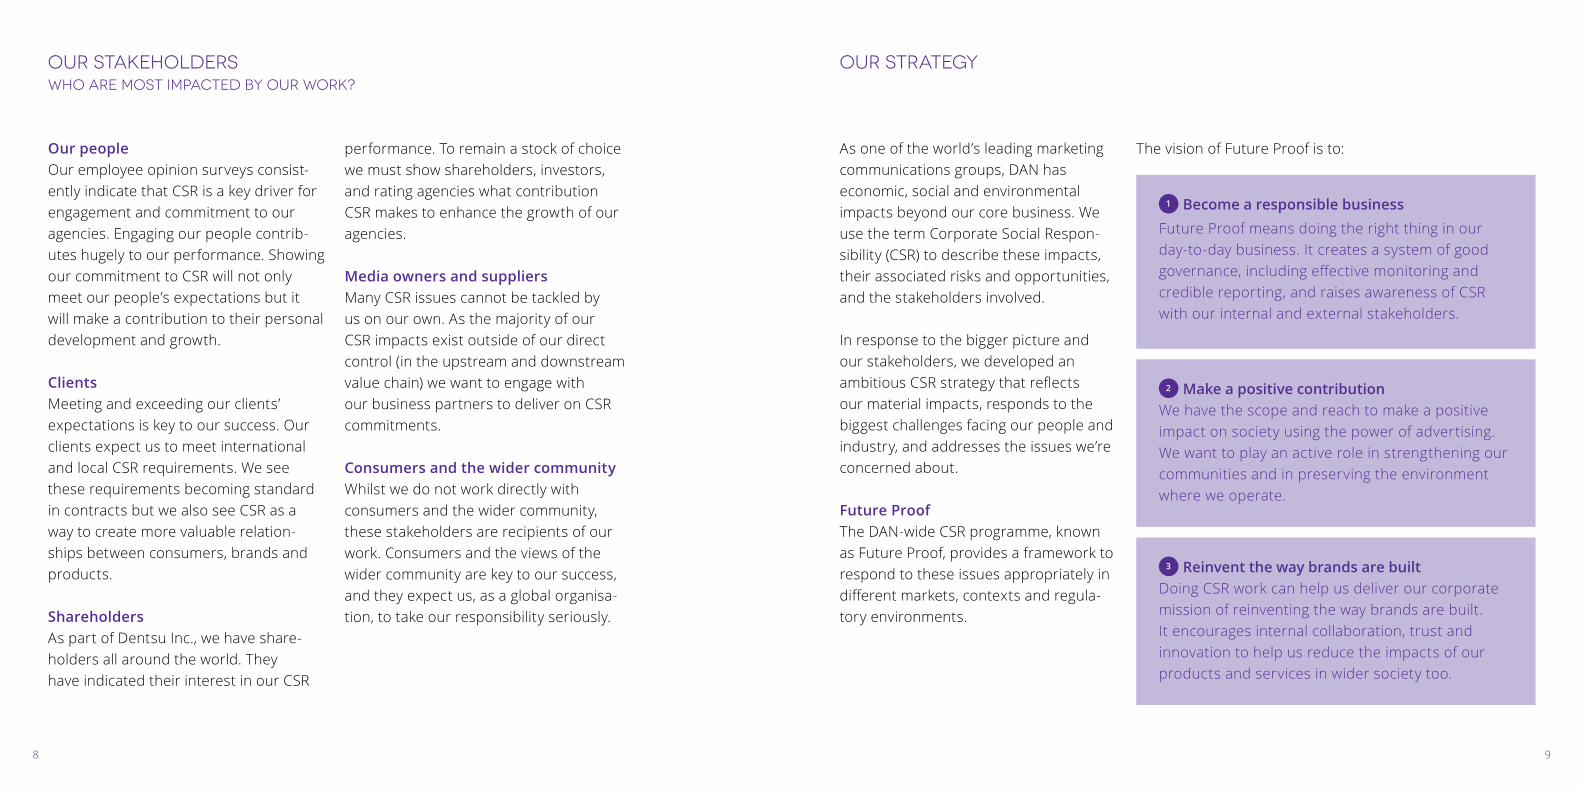
As one of the world’s leading marketing communications groups, DAN has economic, social and environmental impacts beyond our core business. We use the term Corporate Social Respon-sibility (CSR) to describe these impacts, their associated risks and opportunities, and the stakeholders involved.
In response to the bigger picture and our stakeholders, we developed an ambitious CSR strategy that reflects our material impacts, responds to the biggest challenges facing our people and industry, and addresses the issues we’re concerned about.
Future ProofThe DAN-wide CSR programme, known as Future Proof, provides a framework to respond to these issues appropriately in different markets, contexts and regula-tory environments.
The vision of Future Proof is to:
1 Become a responsible businessFuture Proof means doing the right thing in our day-to-day business. It creates a system of good governance, including effective monitoring and credible reporting, and raises awareness of CSR with our internal and external stakeholders.
2 Make a positive contributionWe have the scope and reach to make a positive impact on society using the power of advertising. We want to play an active role in strengthening our communities and in preserving the environment where we operate.
3 Reinvent the way brands are builtDoing CSR work can help us deliver our corporate mission of reinventing the way brands are built. It encourages internal collaboration, trust and innovation to help us reduce the impacts of our products and services in wider society too.
OUR sTRATEgy
Our peopleOur employee opinion surveys consist-ently indicate that CSR is a key driver for engagement and commitment to our agencies. Engaging our people contrib-utes hugely to our performance. Showing our commitment to CSR will not only meet our people’s expectations but it will make a contribution to their personal development and growth.
ClientsMeeting and exceeding our clients’ expectations is key to our success. Our clients expect us to meet international and local CSR requirements. We see these requirements becoming standard in contracts but we also see CSR as a way to create more valuable relation-ships between consumers, brands and products.
ShareholdersAs part of Dentsu Inc., we have share-holders all around the world. They have indicated their interest in our CSR
performance. To remain a stock of choice we must show shareholders, investors, and rating agencies what contribution CSR makes to enhance the growth of our agencies.
Media owners and suppliersMany CSR issues cannot be tackled by us on our own. As the majority of our CSR impacts exist outside of our direct control (in the upstream and downstream value chain) we want to engage with our business partners to deliver on CSR commitments.
Consumers and the wider communityWhilst we do not work directly with consumers and the wider community, these stakeholders are recipients of our work. Consumers and the views of the wider community are key to our success, and they expect us, as a global organisa-tion, to take our responsibility seriously.
OUR sTAkEhOLdERswhO ARE mOsT imPAcTEd by OUR wORk?
1110
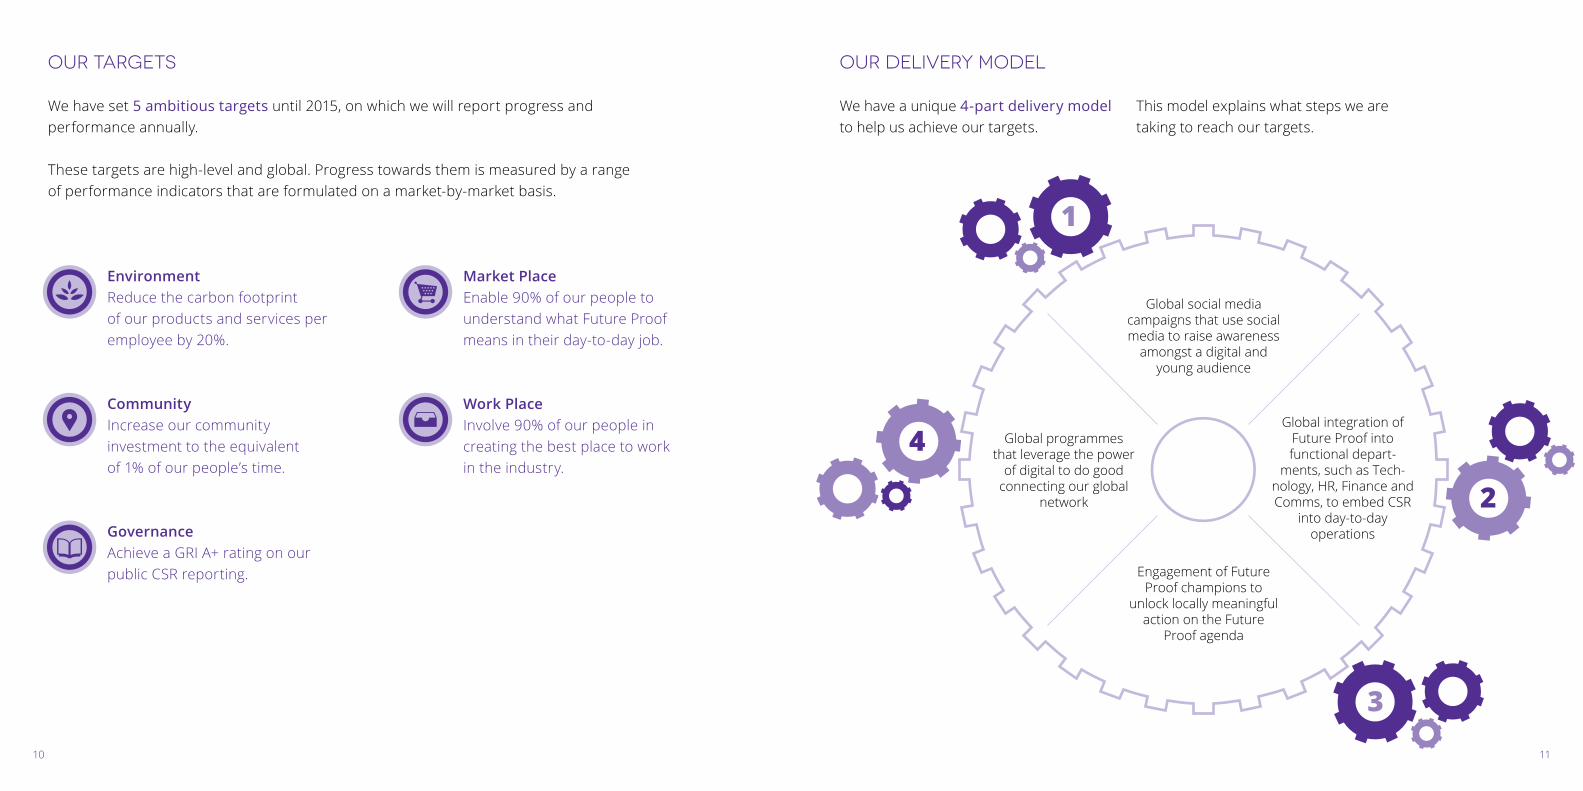
OUR dELivERy mOdEL
We have set 5 ambitious targets until 2015, on which we will report progress and performance annually.
These targets are high-level and global. Progress towards them is measured by a range of performance indicators that are formulated on a market-by-market basis.
OUR TARgETs
Global integration of Future Proof into functional depart-
ments, such as Tech-nology, HR, Finance and Comms, to embed CSR
into day-to-dayoperations
Global programmes that leverage the power
of digital to do good connecting our global
network
Global social media campaigns that use social media to raise awareness
amongst a digital and young audience
Engagement of Future Proof champions to
unlock locally meaningful action on the Future
Proof agenda
EnvironmentReduce the carbon footprint of our products and services per employee by 20%.
CommunityIncrease our community investment to the equivalent of 1% of our people’s time.
GovernanceAchieve a GRI A+ rating on our public CSR reporting.
Market PlaceEnable 90% of our people to understand what Future Proof means in their day-to-day job.
Work PlaceInvolve 90% of our people in creating the best place to work in the industry.
We have a unique 4-part delivery model to help us achieve our targets.
This model explains what steps we are taking to reach our targets.

1312
The riskNo business or individual has been left untouched by climate change. Growing resource scarcity and unpredictable weather occurrences create the need to prevent further climate change. As an organisation that spans the globe we are increasingly exposed to climate change risk, generated by our own operations or those in the wider marketing value chain.
The opportunityReducing our carbon footprint helps reduce cost and increase business resil-ience. It is also an opportunity to work with our clients and media partners to tackle climate change, something which can foster a better corporate reputation and employer brand.
Our approachWe set environmental strategy and policy at a global level, covering energy, waste, water, business travel and commute. We focus purely on reducing our footprint and do not allow our operating compa-nies to off-set carbon emissions.
Our environmental strategy is imple-mented through our delivery model:1. Global implementation of campaigns,
programmes and functional integration on a country-by-country basis;
2. Local initiatives that respond to the most important environmental impacts for offices and brands.
Our metricWe use a range of metrics to measure our environmental performance, but the most important one is greenhouse gas (GHG) emissions associated with users of our products and services: metric tonnes of CO2 per employee.
Our footprintUsing this metric, we set a 2010 baseline for our direct emissions at 2.60 tonnes of CO2 per employee.
Our targetBy 2015 reduce the carbon footprint of our products and services by 20% per average employee.
Key performance indicatorsReducing our own environmental impacts• Direct and indirect energy consumption
per employee in kWh• Direct and indirect GHG emissions from
energy per employee in CO2e• Renewable energy use as % of total
energy use• Indirect GHG emissions from business
travel per employee in CO2e• Annual tonnes of waste and recycling • Recycling as % of total waste production• Indirect GHG emissions from waste per
employee in CO2e• Water consumption m3/employee
annually• Indirect GHG emissions from water
consumption per employee in CO2e• Indirect GHG emissions from employees’
home-work commute in CO2e
Future challengesFurther insight is needed in our indirect
emissions from the wider marketing supply chain:
Reducing our supply chain emissions• Indirect GHG emissions from
outsourced IT in CO2e• Indirect GHG emissions from creative
agency suppliers in CO2e• Indirect GHG emissions from stationery
& office supplies including sustainable paper in CO2e
• Paper consumption per employee in reams
• Indirect GHG emissions from the supply of other office materials in CO2e
Reducing product-related emissions• Indirect GHG emissions from media
campaigns in CO2e• Indirect GHG emissions from consumers’
consumption of media in CO2e• Indirect GHG emissions through
consumer use & disposal of sold media and products in CO2e
GRI indicatorsGRI indicators EN1, EN3, EN4, EN5, EN7, EN8, EN16, EN18, EN22, EN26 and EN29 apply to this target.
ENviRONmENT

1514
The riskThere is a growing gap between those who have and those that do not. The tension and unrest that result from this gap have a profound impact on social and economic stability. Because we (but also our clients and media partners) rely on a healthy consumer economy we are increasingly exposed to the risk of global inequality and instability.
The opportunityStrengthening civil society through local charities will enable us to make a positive contribution to social cohesion. Commu-nity investment will also help secure our talent pipeline, with the right skills and knowledge to work in our company, and enhance our employer brand.
and impacts but the overall metric is the monetary equivalent of all financial, in-kind, time and pro bono donations from our people.
Our footprintUsing these metrics, we set a 2010 baseline for community investment at £2.6 million. This equated to 0.1% of our people’s time.
Our targetBy 2015 increase community investment to the equivalent of 1% of our people’s time.
Key performance indicatorsInputs• Equivalent monetary value our financial,
in-kind, time and pro bono donations • Number of employees involved in
community investment • Number of hours committed by
employees in working hours • Overall donations equivalent % of
people’s time
Our approachWe set community strategy and policy at a global level, covering financial, in-kind, time and pro bono donations. We focus purely on encouraging the sharing of time, expertise and skills through pro bono volunteering, and leave operating companies free to decide their own level of financial and in-kind donations. In addition, we do not focus on any specific themes or causes, but instead aim to help small- and medium-sized charities develop.
Our community strategy is implemented through our delivery model:1. Global implementation of campaigns,
programmes and functional integration on a country-by-country basis;
2. Local initiatives that respond to the most important community issues for offices and brands.
Our metricWe use a range of metrics that meas-ures our community inputs, outputs
Outputs• Number of beneficiaries • Number of charities supported• Main impact on beneficiaries• Main impact on charities supported• The monetary value of leverage in
employee contributions and partner contributions.
Impacts• The skills improved amongst employees
involved in community work• The positive impact on the business
such as corporate reputation and retention.
Future challengesThe pressure on DAN to focus on a partic-ular theme or issue for social investment is increasing. In the future it may become necessary to support a specific cause.
GRI indicatorsGRI indicators HR2, HR3, HR4, HR5, HR6, HR7, LA2, LA10 and LA11 apply to this target.
cOmmUNiTy

1716
The riskFundamentally changing advertising practices are causing public concern around issues such as data, privacy, content and vulnerable audiences. In addition, there is growing scrutiny of the role that advertising plays influencing consumers’ attitudes and behaviour – whether it is making a contribution to the wider sustainability of our world. We are at risk of losing stakeholder trust in and for advertising.
The opportunityShowing the value that advertising adds to the economy – from employment and innovation to keeping certain services free – will help build stakeholder trust. Educating the public on new advertising practices will enhance effectiveness and build resilience in our business model.
Our metricWe use a range of metrics that measures our market place performance, but the key one is the % of people that feels they have the ability to integrate CSR into their day-to-day work for clients.
Our footprintUsing these metrics, we set a 2010 base-line for market place performance at 50% awareness amongst our people.
Our targetBy 2015 ensure 90% of our people under-stand what Future Proof means in their day-to-day job.
Key performance indicators• % of people that understand what Future
Proof means in their day-to-day job • Number and % of employees trained in
The Comms Lab• Number and % of employees sensitised
on CSR such as data, privacy, content• Number of pitches/audits responded to • Number of client meetings contributed to
Our approachWe set our market place strategy and policy at a global level, covering in-house training and tools. We focus on enhancing the awareness and understanding of our people of the impact of advertising, tackling issues such as data protection, privacy, content influence, vulnerable audiences in training.
Our market place strategy is imple-mented through our delivery model:1. Global implementation of campaigns,
programmes and functional integration on a country-by-country basis;
2. Local initiatives that respond to the most important market place issues for offices and brands.
Future challengesThe issues identified as part of market place are constantly changing and not very tangible. As a result it remains a struggle to pin down a quantitative metric. It may be necessary in future to update the metric and/or the strategy, including adding in an external element.
GRI indicatorsGRI indicators SO1 and EC1 apply to this target.
mARkET PLAcE

1918
The riskOur business relies on the expertise, creativity and insight our people bring to their work. The younger generation, including Generation Y and Millennials, are increasingly conscious of their work/life balance and the role of CSR in their work. We are increasingly at risk of losing these generations (and their native digital skills) for our company.
The opportunity Bringing in Generation Y and Millenials can help us tap into the skills of the generation that grew up in the digital world. CSR creates a better employer brand and matches the work/life expec-tations of these people. We also have an opportunity to decrease employee turn-over, saving money and creating stable client relationships.
Our metricWe use a range of metrics that measures our work place performance, but the key one the key one is the % of people that feel we have the best work place in the industry.
Our footprintUsing these metrics, we set a 2010 base-line for work place performance at 47%.
Our targetBy 2015 ensure 90% of our people are involved in creating the best place to work in the industry.
Key performance indicators• Minority and diversity• Human rights and labour rights• Discrimination• Learning & development investment
Our approachWe set our work place strategy and policy at a global level, covering in-house training and tools. We focus on enhancing the diversity of our work place, safeguard health & safety, and improve wellbeing.
Our work place strategy is implemented through our delivery model:1. Global implementation of campaigns,
programmes and functional integration on a country-by-country basis;
2. Local initiatives that respond to the most important work place issues for offices and brands.
Future challengesOne of the areas of future develop-ment is the involvement of our supply chain around human and labour right standards.
GRI indicatorsGRI indicators PR5, PR6, PR7, PR8, M2, M5 and M6 apply to this target.
wORk PLAcE

2120
gOvERNANcE
The riskAs a publicly listed company, we are scru-tinised by a range of internal and external stakeholders on our performance. Not only are we expected to meet our disclo-sure requirements, it is also important that this information is credible and accurate. We are at risk of losing cred-ibility and trust from our stakeholders if we do not.
The opportunitySharing our progress and performance as a company internally and externally in an engaging way helps us to build a strong employer and corporate brand. Credible reporting enhances trust in the ability of our business and management team to continue growth.
Our metricWe use a range of metrics that measures our work place performance, but the key one is the ranking system employed by the Global Reporting Initiative (GRI).
Our footprintUsing these metrics, we set a 2010 base-line of no ranking in the GRI.
Our targetBy 2015 achieve an A+ for our public CSR disclosure in the GRI.
Key performance indicators• Level of GRI self-assessment • Limited assurance and verification on
GHG data• % of employees trained in organisation’s
anti-corruption policies and procedures• % and total number of BUs analysed for
risks related to corruption• Visibility and stakeholder research
amongst external communications• Deliver clear communications to inves-
tors and other groups
Our approachWe set our governance strategy and policy at a global level, covering measure-ment, reporting and disclosure. We focus on creating a transparent and credible governance structure around CSR that helps feed all stakeholders’ inputs into the strategy and subsequently into action.
Our governance strategy is implemented through: 1. A CSR Steering Group at a global
level with key brand and functional representatives, and a Future Proof Board with champions, who oversee the progress and performance of Future Proof;
2. Detailed measurement, reporting and disclosure systems and structures to deliver credible and accurate data.
3. Constant publication of Future Proof activities in social media, internally and externally, and regular updates to internal and external stakeholders.
• Involvement in stakeholder panels of stakeholders
Future challengesOne of the areas of future development is the frequency of public disclosure, and how to manage disclosure on a client-by-client, and brand-by-brand basis.
GRI indicatorsNo GRI indicators apply to this target.

2322
We believe the initiatives in Future Proof will make a valuable contribution to our business strategy.
Promoting growth We believe that the initiatives as part of Future Proof will enhance our client inti-macy, help us gain additional clients and deliver new revenue via CSR-influenced campaigns. Our commitment to help clients deliver their marketing and their CSR goals will position DAN as a market leader.
Minimise costsThe environmental initiatives as part of Future Proof will ensure that as we grow in size across the world, the impact of growing energy costs will be mitigated through more energy efficient behaviour from all people. We believe costs related to employee recruitment and retention will also decrease.
Enhance reputationFuture Proof can position DAN as an industry leader when it comes to our CSR commitments. This will have the ongoing benefit of attracting and retaining the best people and working with the best clients.
Yield deeper insightOur Future Proof activities facilitate interaction with all stakeholders around issues of CSR. This exposure yields deeper insights about consumers, which help brands improve their understanding of changing consumer and societal attitudes around products, services and lifestyles.
Driving the operating modelFuture Proof makes a positive contribu-tion to DAN’s corporate strategy. Our CSR activities will develop the key skills – such as collaboration and innovation – and promote our values that drive our oper-ating model.
REiNvENTiNg ThE wAy bRANds ARE bUiLT
News and updatesInternal Siren & Spectrum newsletters Find us on Neon Local and brand newsletters
External Follow the Future Proof twitter on:
@AM_Futureproof Join our Facebook Page Aegis Media
Future Proof: https://www.facebook.com/AegisFutureProof
Check the monthly Siren newsletter for sustainability updates and news
Find more information on: www.aemedia.com/responsibility
Reporting Future Proof Report Future Proof Fast Facts
whERE TO LOOk FOR UPdATEs

2524
gRi iNdEx
Economic performance
EC1 Direct economic value generated and distributed, including revenues, operating costs, employee compensation, donations and other community investments, retained earnings, and payments to capital providers and governments.
EC2 Financial implications and other risks and opportunities for the organization’s activities due to climate change.
EC5 Range of ratios of standard entry level wage compared to local minimum wage at significant locations of operation.
ENvIRONMENTal
Materials EN1 Materials used by weight or volume.
Energy EN3 Direct energy consumption by primary energy source.
EN4 Indirect energy consumption by primary source.
EN5 Energy saved due to conservation and efficiency improvements.
EN6 Initiatives to provide energy-efficient or renewable energy based products and services, and reductions in energy requirements as a result of these initiatives.
EN7 Initiatives to reduce indirect energy consumption and reductions achieved.
Water EN8 Total water withdrawal by source.
Emissions, effluents and waste
EN16 Total direct and indirect greenhouse gas emissions by weight.
EN18 Initiatives to reduce greenhouse gas emissions and reductions achieved.
EN22 Total weight of waste by type and disposal method.
Products and services
EN26 Initiatives to mitigate environmental impacts of products and services, and extent of impact mitigation.
Transport EN29 Significant environmental impacts of transporting products and other goods and materials used for the organization’s operations, and transporting members of the workforce.
SOCIal: laBOR PRaCTICES aND DECENT WORK
Employment la1 Total workforce by employment type, employment contract, and region.
Training and education
la10 Average hours of training per year per employee by employee category.
Diversity and equal opportunity
la13 Composition of governance bodies and breakdown of employees per category according to gender, age group, minority group membership, and other indicators of diversity.
SOCIal: HuMaN RIGHTS
Investment and procurement practices
HR1 Percentage and total number of significant investment agreements that include human rights clauses or that have undergone human rights screening.
HR2 Percentage of significant suppliers and contractors that have undergone screening on human rights and actions taken.
HR3 Total hours of employee training on policies and procedures concerning aspects of human rights that are relevant to operations, including the percentage of employees trained.
Non- discrimination
HR4 Total number of incidents of discrimination and actions taken.
Freedom of association and collective bargaining
HR5 Operations identified in which the right to exercise freedom of association and collective bargaining may be at significant risk, and actions taken to support these rights.
Child labor HR6 Operations identified as having significant risk for incidents of child labor, and measures taken to contribute to the elimination of child labor.
Forced and compulsory labor
HR7 Operations identified as having significant risk for incidents of forced or compulsory labor, and measures to contribute to the elimination of forced or compulsory labor.

26
SOCIal: SOCIETY
Community SO1 Nature, scope, and effectiveness of any programs and practices that assess and manage the impacts of operations on communities, including entering, operating, and exiting.
Corruption SO2 Percentage and total number of business units analyzed for risks related to corruption.
SO3 Percentage of employees trained in organization’s anti-corruption policies and procedures.
SO4 Actions taken in response to incidents of corruption.
SOCIal: PRODuCT RESPONSIBIlITY
Marketing communications
PR6 Programs for adherence to laws, standards, and voluntary codes related to marketing communications, including advertising, promotion, and sponsorship.
PR7 Total number of incidents of non-compliance with regulations and voluntary codes concerning marketing communications, including advertising, promotion, and sponsorship by type of outcomes.
Customer privacy PR8 Total number of substantiated complaints regarding breaches of customer privacy and losses of customer data.