The City of Stockholm, Sweden Climate Change target: Fossil Fuel Free 2050

DEMOGRAPHIC REPORTS
The future populationof Sweden 2006–2050

Cover illustration:
The graph also occurs in the publication and shows the number of girls aged 6–15 from 1950 to 2005 and alternative projections for the period 2006–2050.

Statstics Sweden2008
DEMOGRAPHIC REPORTS
The future population of Sweden 2006–2050

Demographic reports
The future population of Sweden2006–2050Official Statistics of SwedenStatistics Sweden2008
Producer Statistics Sweden, Forecasting Institute Box 24300, 104 51 Stockholm +46 8 506 940 00 [email protected]
Inquiries Hans Lundström +46 8 506 943 70 [email protected] Karin Lundström +46 8 506 941 87 [email protected]
Official statistics of Sweden – free to quoteThis publication is a part of the official statistics of Sweden (SOS). It may be used freely and quoted. When quoting, please state the source as follows: Source: Statistics Sweden, Demographic Reports, The future population of Sweden 2006–2050.
Use of the particular SOS logotype is prohibited when further processing the statistics.
Cover: Ateljén, SCB
ISSN 1654-1510 (online)URN:NBN:SE:SCB-2008-BE51BR0602ENG_pdf (pdf)
This publication is only available electronically at www.scb.se.
The future population of Sweden 2006–2050 Foreword
Statistics Sweden
Foreword This report presents a projection of the population of Sweden for the period 2006-2050. In addition to a main alternative, a number of sensitivity analyses showing population trends given lower or higher future fertility than that assumed in the main alternative are presented. Similarly, the consequences of deviations in mortality trends as well as of higher or lower levels of foreign migration are also shown.
Statistics Sweden presents reports of this kind every third year. The last such report came out in spring 2003. In the intervening years, population projections are updated and presented in the Statistical Report series, in Sweden's Statistical Databases and on Statistic Sweden's website (www.scb.se).
Several people have contributed to this report. The section on fertility was prepared by Gun Alm Stenflo and Lotta Persson. The section on migration was prepared by Marie Berlin, Ann-Zofie Duvander, Ann-Christin Jans and Peter Lundquist. Lastly, the mortality section was prepared by Hans Lundström, Karin Lundström and Jan Qvist. The working group has obtained valuable advice and opinions from reference groups for each of the three components: fertility, mortality and migration. Statistics Sweden is responsible for the final assessments and suppositions made in the forecast. Hans Lundström was responsible for compiling the work on population projections while Ingrid Florén and Lotta Persson were responsible for the layout.
Statistics Sweden, May 2006
Anna Wilén
Allan Nordin

The future population of Sweden 2006–2050 Contents
Statistics Sweden 5
Contents Foreword..........................................................................................3
Summary.........................................................................................9 Population over the next 10 years ....................................................9 Seen from a 50 year perspective....................................................10
An ageing population...........................................................................10
1 Introduction ...............................................................................13
2 Forecast - the main alternative.................................................15 Developments in the next ten years ...............................................16 Developments after 2016 ...............................................................18
Increasing birth surplus .......................................................................19 A shrinking population without immigration..................................20
The ageing of the population..........................................................21 Children and young people.............................................................22
More preschool children ......................................................................23 The large number of children born around 1990 leave their mark on trends ......................................................................................24 More young people and the need for higher education places within the next 10 years .......................................................................25
The population of 20-64 year olds ..................................................26 Weak rise in the population of working age.....................................26 The age distribution of the working age population.......................27
Senior citizens................................................................................30 Old-age pensioners ...............................................................................30 People aged 65-79..................................................................................30 The "older elderly" (80 years and older) ............................................31
A greater “burden of support” .........................................................32
3 Assumptions .............................................................................35 Fertility ...........................................................................................35
Fertility trends .......................................................................................36 Fertility assumptions ............................................................................38 Alternative scenarios ............................................................................41 Assumptions on childlessness ............................................................44 International comparisons...................................................................50
Mortality .........................................................................................52 Average life expectancy .......................................................................52 Mortality trends for middle-aged and elderly people, 1950–2005 .........................................................................................................56 Causes of declining mortality after 1980 ...........................................57 Future mortality trends ........................................................................59

Contents The future population of Sweden 2006–2050
Statistics Sweden 6
Calculation of future mortality trends............................................... 63 Assumptions on mortality trends in selected countries ................. 69 Alternative assumptions...................................................................... 71
Migration ........................................................................................72 Forecasting migration .......................................................................... 74 Regional breakdown ............................................................................ 75 Swedish-born people............................................................................ 77 Foreign-born people in Sweden ......................................................... 81
4 Alternative projections .............................................................95 Introduction ....................................................................................95
Alternative assumptions on the future fertility rate, mortality and foreign migration .......................................................................... 96
Total population change under different scenarios.........................96 Number of children aged 0-5 years according to the different alternatives.....................................................................................97 Number of children of school age, 6-15 years, according to the different alternatives.......................................................................98 Young people aged 16-19 years ....................................................99 Population in the younger labour force aged 20–39 years...........100 Population in the older labour force aged 40–64 years ...............101 People aged 65-79 years .............................................................102 People aged 80 years and older...................................................103
5 Tables.......................................................................................105 Assumptions in the main alternative.............................................105 Population projection – main alternative.......................................119 Alternative projections..................................................................141
Facts about the statistics ..........................................................159 Scope of the statistics ..................................................................159 Definitions and explanations ........................................................159 How the statistics are produced ...................................................160
Model.................................................................................................... 160 Fertility forecasts................................................................................. 162 Mortality forecasts .............................................................................. 165 Migration forecasts............................................................................. 172
Accuracy of the statistics..............................................................179
References..................................................................................181
Annex ........................................................................................1815 List of representatives in the reference group ..............................185
Reference group for fertility.............................................................. 185 Reference group for migration ......................................................... 185 Reference group for mortality........................................................... 185

The future population of Sweden 2006–2050 Contents
Statistics Sweden 7
List of tables Overview of assumptions about fertility, mortality and migration ..............................................................................................105 Number of children born per 1000 women by age at end of the year .................................................................................................107 Death risks 2006 by sex and age at the end of the year. Number per 1000.................................................................................108 Yearly reduction of death risks 2007–2050. Percent.......................109 Age distribution of Swedish and foreign born immigrants by age at end of year 2006. Number per 10 000..............................111 Sex ratio of immigrants (proportion women) 2006–2050..............114 Number of immigrants 2006–2050....................................................115 Number of emigrants 2006–2050 ......................................................116 Emigration risks for Swedish born persons by sex and age at the end of year 2006. Number per 10 000 ........................................117 Emigration risks for foreign born persons by sex and age at the end of year 2006. Number per 10 000 ........................................118 Population and population changes 1990–2005 and projection 2006–2050. Thousands .....................................................119 Population by age 1950–2005 and projection 2006–2050. Thousands............................................................................................121 Male population by age 1950–2005 and projection 2006–2050. Thousands ............................................................................................133 Population by age 1950–2005 and projection 2006–2050. Thousands............................................................................................139 Share of population by age 1950–2005 and projection 2006–2050. Percent ........................................................................................140 Population according to different alternative assumptions and discrepancy to the main alternative. Thousands and percent ..................................................................................................141 Female population according to different alternative assumptions and discrepancy to the main alternative. Thousands and percent ......................................................................142 Male population according to different alternative assumptions and discrepancy to the main alternative. Thousands and percent ......................................................................143 Number of girls aged 0–5 according to different alternative assumptions and discrepancy to the main alternative. Thousands and percent ......................................................................144 Number of boys aged 0–5 according to different alternative assumptions and discrepancy to the main alternative. Thousands and percent ......................................................................145
The future population of Sweden 2006–2050
Statistics Sweden 8
Number of girls aged 6–15 according to different alternative assumptions and discrepancy to the main alternative. Thousands and percent...................................................................... 146 Number of boys aged 6–15 according to different alternative assumptions and discrepancy to the main alternative. Thousands and percent...................................................................... 147 Number of women aged 16–19 according to different alternative assumptions and discrepancy to the main alternative. Thousands and percent................................................ 148 Number of men aged 16–19 according to different alternative assumptions and discrepancy to the main alternative. Thousands and percent................................................. 149 Number of women aged 20–39 according to different alternative assumptions and discrepancy to the main alternative. Thousands and percent................................................ 150 Number of men aged 20–39 according to different alternative assumptions and discrepancy to the main alternative. Thousands and percent................................................. 151 Number of women aged 40–64 according to different alternative assumptions and discrepancy to the main alternative. Thousands and percent................................................ 152 Number of men aged 40–64 according to different alternative assumptions and discrepancy to the main alternative. Thousands and percent................................................. 153 Number of women aged 65–79 according to different alternative assumptions and discrepancy to the main alternative. Thousands and percent................................................ 154 Number of men aged 65–79 according to different alternative assumptions and discrepancy to the main alternative. Thousands and percent................................................. 155 Number of women aged 80 and older according to different alternative assumptions and discrepancy to the main alternative. Thousands and percent................................................ 156 Number of men aged 80 and older according to different alternative assumptions and discrepancy to the main alternative. Thousands and percent................................................ 157
The future population of Sweden 2006–2050 Summary
Statistics Sweden 9
Summary Sweden's population continues to increase. From 1995 to 2005 the population increased by nearly 211 000 people. During the ten year period 2006-2015 the population is expected to grow by slightly more than 410 000 people. The more rapid growth in population for the coming period is primarily due to an increased birth rate coupled with a higher immigration surplus. According to this year's forecast, the population will increase from 9.1 million in 2005 to 9.5 million in 2015. In 2050 the population is expected to reach 10.5 million.
The life expectancy for women is predicted to rise from 82.8 years in 2005 to 86.3 years in 2050. For men, the corresponding expected increase in life expectancy for the same period is from 78.4 to 83.6 years. Fertility is expected to rise from today's 1.77 children per woman to 1.85 children per woman in 2015. Thereafter, fertility is expected to remain at the same level until 2050.
At the turn of the century in 1900, less than one percent of the Swedish population was born abroad. By 2000, that figure had risen to slightly over 11 percent. The number of foreign-born people, according to the forecast's main alternative, will rise to around 18 percent in 2050. Net immigration is currently high but is expected to fall slightly to 23 600 by the end of the forecast period. In 2006 immigration will be unusually high due to the temporary asylum law.
Population over the next 10 years In the coming 10 years, demographic pressure on the major items in the system of transfer payments will likely fall somewhat. A larger proportion of the population aged 20-64 will be under the age of 50 and a reduction in the number of people on long-term sick leave and in early retirement is thus expected for demographic reasons. The number of people aged 20-64 is expected to increase from 5.3 million in 2005 to 5.4 million in 2015. The number of people of working age (20-64 years) will thus increase although the percentage of the total population that this age group represents will fall. This drop in percentage despite an increase in numbers is mainly due to the fact that the number of people aged 64 and over increases much more than the number of people in other age groups.

Summary The future population of Sweden 2006–2050
Statistics Sweden 10
The ageing population will result in an increase in the demand for healthcare and nursing services although probably only to a limited extent over the next 10 years. Many pensioners will still be 65 to 70 years old during the period. For these ages, the need for healthcare and nursing services is relatively small. The need for such services increases primarily after 80 years of age.
When those born in the 1940s retire, we will see a generation change on the labour market. Due to the large number of people reaching retirement age, there will likely be increased demand in the labour market. If supply and demand matches, these demographic forces will lead to a reduction in unemployment. This does not mean, however, that other factors may not offset these demographic forces.
The large variations in the number of births over the last 15 years will have notable effects on the number of school-age children of various ages in the next few years. The number of preschool children has already increased in the last few years and this increase is expected to continue for several more years. The number of children in the first three years of compulsory school has dropped since the end of the 1990s but will increase again from 2007. These large fluctuations place great demands on the flexibility of the educational system.
The large group born around 1990 is about to start upper secondary school and in a few years many will likely begin higher education.
Seen from a 50 year perspective
An ageing population Up until 2050, Sweden's population is predicated to increase by about 1.5 million people. The number of people in the age groups 0-19 years and 20-64 years is expected to increase by 170 000 and 370 000 respectively. This is an increase of around 7 percent. By 2050, the group aged 65-79 years is expected to increase by 45 percent while the group aged 80 and over will increase by 87 percent. It is expected that slightly more than 900 000 more people than today will be aged 65 and over by 2050. Mortality is decreasing more for men than women. Consequently, more women will be able to keep their partners as they grow older.
The structure of the population in the initial year of the forecast determines a great deal of the changes in the population. Today we already know that the number of old-age pensioners will increase

The future population of Sweden 2006–2050 Summary
Statistics Sweden 11
sharply around 2010 when large numbers of those born in the 1940s reach the age of 65. Twenty years later, those born in the 1960s will reach the age of 65. Around the year 2020 we can expect a relatively large number of births when large cohorts born around 1990 reach childbearing age.
Number of people in different age groups 2005. Projection 2006-2050. Thousands
Year 0–19 years
20–64 years
65–79 years
80 and over Total
2005 2 159 5 323 1 078 487 9 048 2006 2 164 5 356 1 091 489 9 099 2007 2 163 5 370 1 116 489 9 139 2008 2 156 5 383 1 149 491 9 179 2009 2 145 5 390 1 192 490 9 217 2010 2 127 5 403 1 236 491 9 257 2011 2 111 5 414 1 281 491 9 296 2012 2 097 5 425 1 323 491 9 336 2013 2 089 5 432 1 366 488 9 376 2014 2 087 5 440 1 404 488 9 418 2015 2 094 5 443 1 435 488 9 460 2020 2 195 5 429 1 531 525 9 680 2030 2 288 5 457 1 540 763 10 048 2040 2 288 5 514 1 653 811 10 267 2050 2 329 5 696 1 566 912 10 502

Summary The future population of Sweden 2006–2050
Statistics Sweden 12

The future population of Sweden 2006–2050 Introduction
Statistics Sweden 13
1 Introduction In this report Statistics Sweden presents the results of the forecast on changes in Sweden's population for the period 2006-2050. The word forecast in this text is used in its broad sense. Given the perspective of almost 50 years, one cannot speak of forecasts in their true sense. Given a longer time perspective, a forecast is more of a projection or a scenario based on assumptions about the future rather than a prediction of what is most likely to occur.
Some general characteristics of population change can be predicted with relatively good precision while others remain more uncertain. The reliability of the results depends both on the time horizon and the age brackets being considered. For those who are young today, the forecast is relatively certain a long time ahead. Mortality is low up to high ages and the size of the group is mainly affected by immigration to and emigration from Sweden. Future fertility changes are however more uncertain and incorrect assumptions quickly grow in significance when used as a basis for determining the future number of children. Likewise, it is genuinely difficult to foresee the size of immigration and emigration even in the short-term. Immigration to and emigration from Sweden has varied greatly over the years and depends on, among other things, the globalisation of industry as well as the immigration policies of other countries.
Chapter 2 gives an account of population changes according to the forecast's main alternative. Chapter 3 describes the assumptions with respect to fertility, mortality and migration which form the basis of the forecast. In support of this study, advice has been gathered from reference groups for each of the three components: fertility, mortality and migration. A list of the members of the reference groups can be found in Appendix 1. In order to illustrate the sensitivity of the results to variations in future fertility, mortality and migration, concise calculations based on alternative assumptions are presented in Chapter 4. The result according to the main alternative is presented in an appended Table and is also accessible via Sweden's Statistical Databases. If not otherwise specified, the information source is Statistics Sweden's Population Statistics.

Introduction The future population of Sweden 2006–2050
Statistics Sweden 14

The future population of Sweden 2006–2050 Forecast – the main alternative
Statistics Sweden 15
2 Population forecast - the main alternative In 1900, at the turn of the century, less than 1 percent of the population of Sweden was born abroad. By 2000, this figure had risen to slightly over 11 percent. The proportion of foreign-born people will rise to about 18 percent by 2050, according to the forecast's main alternative. Net immigration is calculated to fall slightly in the foreseeable future from 25 000 at the beginning of the forecast period to 23 600 by the end of the period. This represents a small downward adjustment in comparison to the 2003 forecast.
The main alternative is based on the supposition that fertility will rise to 1.85 children per woman in the foreseeable future. In 2005, 1.77 children per woman were born. Women born in the 1900s have on average given birth to two children. A supposition of 1.85 children per woman means that one assumes that women born at the end of the century will give birth to fewer children than those born at the beginning of the century.
The life expectancy of women will increase from the current 82.8 years to 86.3 years by 2050. The life expectancy of men is currently 78.4 years and is expected to rise to 83.6 years by 2050. Mortality in men is falling more than mortality in women. This explains why the difference between the life expectancies of women and the life expectancies of men is getting smaller. The mortality assumptions made in this forecast are, in principle, the same as those made in 2003.
According to this year's forecast, the population will grow from 9.05 million in 2005 to 10.5 million by 2050. This result differs only marginally from the 2003 forecast.
During the last half of the 1900s, the population grew by 1.8 million. During the first half of the twenty-first century, the population is expected to grow by about the same amount: 1.7 million. The main reasons for fairly constant future population growth are our presumptions that fertility will remain relatively high and that Sweden will continue to be a land of immigration.

Forecast – the main alternative The future population of Sweden 2006–2050
Statistics Sweden 16
Figure 2.1 Population 1950–2005 and projection 2006–2050. Millions
0
2
4
6
8
10
12
1950 1960 1970 1980 1990 2000 2010 2020 2030 2040 2050
Number in millions
Year
Projection
Figures are found in table 5.11 in table appendix
The fact that we have fairly constant population growth does not mean that we have a constant age structure of the population. Due to sharp fluctuations in fertility with peaks in the birth rate during the 1940s, 1960s and 1990s, we have seen large variations in the number of people within the different age groups. For example, some 120 000 children were born around 1990 while some 90 000 children were born at the end of the 1990s. These kinds of fluctuations place very high demands on flexibility in the planning of schools, health and social care, community care services and housing. These changes in the number of births also leave their mark on the development during different periods of time.
Developments in the next ten years The population change over the next ten years will likely alleviate pressure on the major items, excluding pension payments1, within the system of transfer payments. A larger proportion of the population aged 20-64 will be under 50 years of age which means that a reduction in the number of people on long-term sick leave and in early retirement can be expected (Alm Stenflo, 2002). The ageing population will result in an increase in the demand for healthcare and nursing services over time, although probably only to a limited extent in the coming years since most pensioners will 1 Financing of pension payments are guaranteed in the new pension system.

The future population of Sweden 2006–2050 Forecast – the main alternative
Statistics Sweden 17
still be aged 60-70 years. For these ages, the need for healthcare and nursing services is relatively small. The need for such services increases primarily after 80 years of age. One can thus expect that the need for healthcare and nursing services will increase relatively slowly but surely over the next ten years (SCB, 2006a).
Figure 2.2 Population pyramids 2005 and 2016. Thousands
80 60 40 20 0 20 40 60 800
10
20
30
40
50
60
70
80
90
100
Men Women
AgeYear 2016
80 60 40 20 0 20 40 60 80
0
10
20
30
40
50
60
70
80
90
100
Men Women
Age Year 2005
Swedish-born
Foreign-born
When those born in the 1940s retire, vacancies will arise on the labour market which should lead to an increased demand for labour. If supply and demand match, these demographic forces will exert downward pressure on unemployment. This does not mean, however, that other factors may not offset this pressure.
The large variations in the number of births over the last 15 years will have notable effects on the number of school-age children of various ages in the recent years. The number of preschool children has already increased in the last few years. This increase is expected to continue. The number of children in the first three years of compulsory school has dropped since the end of the 1990s but will increase again as of 2007. This trend, with a three year shift, will be the same for the 10-12, 13-15 and 16-18 age groups. These large fluctuations place great demands on the flexibility of the educational system.
The large group born around 1990 is about to start upper secondary school and in a few years many will likely begin their higher education.

Forecast – the main alternative The future population of Sweden 2006–2050
Statistics Sweden 18
Developments after 2016 Demographic pressure on costs for healthcare and nursing will however increase significantly during the post-2016 decades. Between 2020 and 2030, the number of people aged 80 or more will rise by about 55 percent from around 209 000 people to around 325 000 people. During this period, the cohorts born during the 1940s will reach the age where the need for healthcare and nursing soars.
We do not know whether variations in fertility will continue to be as large as previously noted. Given the current parental insurance system however there is reason to suppose that future fertility will also vary with the upturns and downswings of the economy. The reason that the population pyramids for 2050 seem to be so smooth for those who are under the age of 45 is that the forecast is based on a mean value. Future variations in the birth rate and migration due to responses to economic upturns and downswings are thus not accounted for.
Figure 2.3 Population pyramids 2005 and 2050. Thousands
80 60 40 20 0 20 40 60 80
0
10
20
30
40
50
60
70
80
90
100Men Women
Age Year 2005
80 60 40 20 0 20 40 60 800
10
20
30
40
50
60
70
80
90
100Men Women
AgeYear 2050
Swedish-born
Foreign-born
In 2005 the proportion of women in the 65 and over age group was 56 percent. By 2050, it is calculated that this will have fallen to about 52 percent.
The mortality of men is decreasing more rapidly than that of women. We assume that this development will continue for several

The future population of Sweden 2006–2050 Forecast – the main alternative
Statistics Sweden 19
more years. For this reason, it is likely that an increasing number of older women will be able to keep their partners as they grow older.
Increasing birth surplus In the forecast we have assumed that fertility rises successively during the coming years and thereafter stabilises at an average level of about 1.85 children per woman. As a result of assumptions on fertility and the age structure of the population, it is calculated that the number of births will rise until some time around 2020. In 2020, the large number of people born around 1990 will have reached an age when it is common to have children and the number of births is then calculated to be relatively high.
Figure 2.4 Number of births and deaths 1950–2005 and projection 2006–2050. Thousands
0
20
40
60
80
100
120
140
1950 1960 1970 1980 1990 2000 2010 2020 2030 2040 2050
Thousands
Births
Deaths Projection
Year Experience reveals that changes in the number of births have occurred very rapidly and this will likely also be the case in the future. Occasionally there is talk of being in the midst of a baby boom. We cannot foresee these types of temporary changes over the longer term.
At the turn of the century in 2000, there were more deaths than births recorded over several years. The turning point came in 2002. The excess of births over deaths (the birth surplus) is expected to increase over the next 15 years. A few years after 2030, the pattern is expected to change again and there will be more deaths than births. Such long-term calculations are however highly uncertain. For

Forecast – the main alternative The future population of Sweden 2006–2050
Statistics Sweden 20
example, the people presumed to become parents during the last part of the 2030 decade are not even yet born.
Table 2.1 Births, deaths, net migration and population increase 1950–2005. Projection 2006–2050. Thousands
Year Births Deaths Birth- Net migration Population surplus increase
1950–54 110,2 69,4 40,8 10,0 49,7 1955–59 106,5 70,8 35,8 12,0 45,6 1960–64 109,9 75,7 34,2 14,0 46,5 1965–69 117,6 80,4 37,2 25,6 61,8 1970–74 111,3 83,8 27,5 7,6 34,5 1975–79 97,5 89,6 7,9 17,5 25,3 1980–84 93,9 91,2 2,8 5,1 7,9 1985–89 106,6 93,9 12,7 24,4 36,9 1990–94 120,2 94,8 25,4 32,5 57,9 1995–99 93,3 93,9 -0,6 9,8 9,0 2000–04 95,6 93,1 2,5 27,7 30,0 2005 101,3 91,7 9,6 27,1 36,4 Projection 2006–09 103,6 92,5 11,1 30,2 41,2 2010–14 106,4 92,1 14,3 25,8 40,1 2015–19 110,3 92,1 18,2 25,3 43,5 2020–24 112,9 94,8 18,1 24,6 42,7 2025–29 110,1 100,5 9,6 24,7 34,2 2030–34 107,5 107,8 -0,3 24,6 24,3 2035–39 109,4 112,9 -3,5 24,3 20,7 2040–44 113,0 114,6 -1,6 23,9 22,2 2045–49 115,8 115,2 0,6 23,6 24,2 2050 117,0 116,2 0,9 23,6 24,4
Note: Annual average in thousands. Population increase including transfers to and from the register of people without known residence for at least one year. Presented by year in the table appendix, table 5.10.
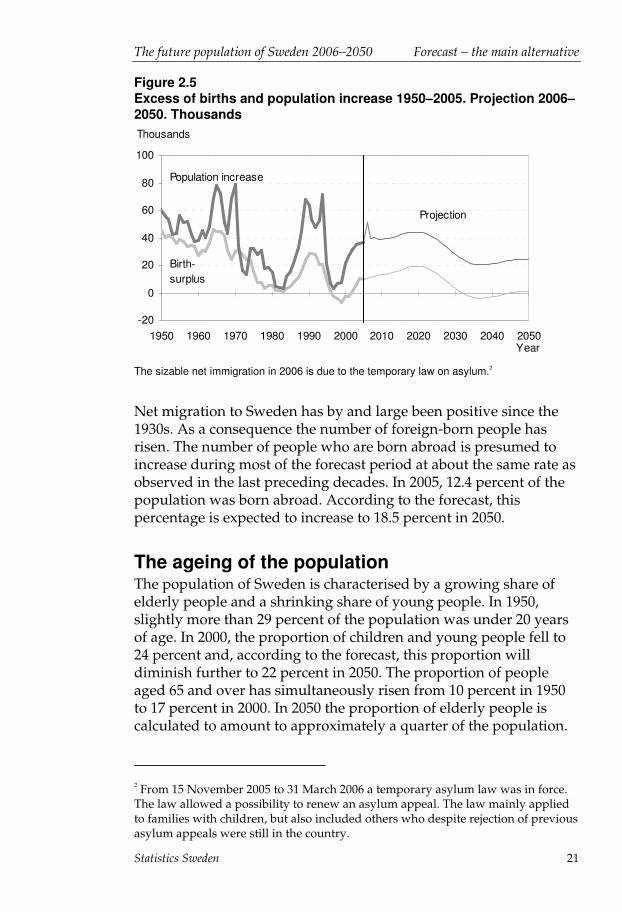
A shrinking population without immigration A large part of the population increase during the forecast period rests on assumptions of an annual net migration of some 23 000 people. Net migration, as illustrated in the figure below, is the difference between the population increase and the birth surplus. After 2030, it is the assumption of an immigration surplus which results in the continuing population increase.
The future population of Sweden 2006–2050 Forecast – the main alternative
Statistics Sweden 21
Figure 2.5 Excess of births and population increase 1950–2005. Projection 2006–2050. Thousands
-20
0
20
40
60
80
100
1950 1960 1970 1980 1990 2000 2010 2020 2030 2040 2050Year
Thousands
Projection
Population increase
Birth-surplus
The sizable net immigration in 2006 is due to the temporary law on asylum.2
Net migration to Sweden has by and large been positive since the 1930s. As a consequence the number of foreign-born people has risen. The number of people who are born abroad is presumed to increase during most of the forecast period at about the same rate as observed in the last preceding decades. In 2005, 12.4 percent of the population was born abroad. According to the forecast, this percentage is expected to increase to 18.5 percent in 2050.
The ageing of the population The population of Sweden is characterised by a growing share of elderly people and a shrinking share of young people. In 1950, slightly more than 29 percent of the population was under 20 years of age. In 2000, the proportion of children and young people fell to 24 percent and, according to the forecast, this proportion will diminish further to 22 percent in 2050. The proportion of people aged 65 and over has simultaneously risen from 10 percent in 1950 to 17 percent in 2000. In 2050 the proportion of elderly people is calculated to amount to approximately a quarter of the population.
2 From 15 November 2005 to 31 March 2006 a temporary asylum law was in force. The law allowed a possibility to renew an asylum appeal. The law mainly applied to families with children, but also included others who despite rejection of previous asylum appeals were still in the country.

Forecast – the main alternative The future population of Sweden 2006–2050
Statistics Sweden 22
The number of people of working age (20-64 years old) is rising (see Table 2.3), but the proportion of people of working age is shrinking. The cause of the shrinking proportion despite an increase in numbers, is mainly that the number of people aged 65 and over is increasing much more relative to other age groups.
Figure 2.6 Women and men in age groups 0–19, 20–64 and 65–, 1950–2050. Percent
0
10
20
30
40
50
60
70
1950 1970 1990 2010 2030 2050
Per cent
Year
Projection
20-64 år
0-19 years
65+ years
0
10
20
30
40
50
60
70
1950 1970 1990 2010 2030 2050
Per cent
Year
Projection
20-64 år
0-19 years
65+ years
Figures are found in table 5.13 b in table appendix.
This situation is not at all unique to Sweden. The very low fertility currently observed in several countries coupled with high life expectancies means that, within a few years, several countries will have a greater proportion of elderly people than Sweden. In certain countries as many as one out of three people will be aged 65 or over in 50 years. In 2050, for example, the proportion of people aged 65 or over is calculated to reach 36 percent in Japan, 34 percent in Italy and 32 percent in Greece.
Children and young people The number of people aged 0-19 years is expected to vary between 2.1 and 2.3 million during the entire forecast period. Despite the fact that the total number of children and young people is not expected to change very much, there are large variations in the number within the different age groups.
The future population of Sweden 2006–2050 Forecast – the main alternative
Statistics Sweden 23
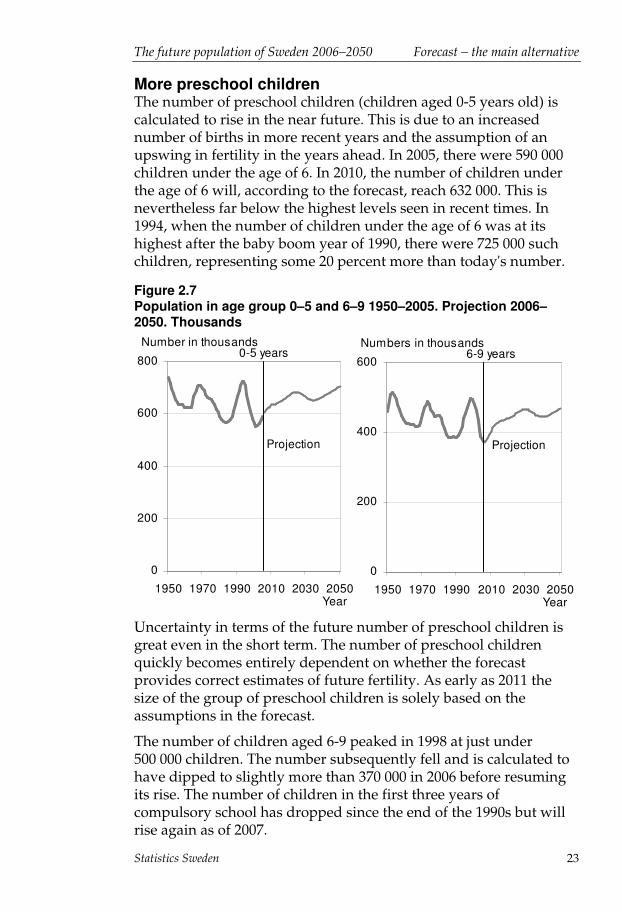
More preschool children The number of preschool children (children aged 0-5 years old) is calculated to rise in the near future. This is due to an increased number of births in more recent years and the assumption of an upswing in fertility in the years ahead. In 2005, there were 590 000 children under the age of 6. In 2010, the number of children under the age of 6 will, according to the forecast, reach 632 000. This is nevertheless far below the highest levels seen in recent times. In 1994, when the number of children under the age of 6 was at its highest after the baby boom year of 1990, there were 725 000 such children, representing some 20 percent more than today's number.
Figure 2.7 Population in age group 0–5 and 6–9 1950–2005. Projection 2006–2050. Thousands
0
200
400
600
800
1950 1970 1990 2010 2030 2050
Number in thousands
Year
Projection
0-5 years
0
200
400
600
1950 1970 1990 2010 2030 2050
Numbers in thousands
Year
Projection
6-9 years
Uncertainty in terms of the future number of preschool children is great even in the short term. The number of preschool children quickly becomes entirely dependent on whether the forecast provides correct estimates of future fertility. As early as 2011 the size of the group of preschool children is solely based on the assumptions in the forecast.
The number of children aged 6-9 peaked in 1998 at just under 500 000 children. The number subsequently fell and is calculated to have dipped to slightly more than 370 000 in 2006 before resuming its rise. The number of children in the first three years of compulsory school has dropped since the end of the 1990s but will rise again as of 2007.

Forecast – the main alternative The future population of Sweden 2006–2050
Statistics Sweden 24
Table 2.2 Population in age groups 0–5, 6–9, 10–12, 13–15, 16–18, 1950–2050. Thousands
Year Ages
0–5 Ages
6–9 Ages
10–12 Ages
13–15 Ages
16–18 Age
19 Ages 0–19
1950 741 460 278 254 247 87 2 067 1960 626 428 355 385 365 99 2 258 1970 700 451 315 324 330 114 2 233 1980 589 449 332 369 348 108 2 194 1985 571 387 327 337 345 124 2 091 1990 668 386 294 307 340 116 2 111 1994 725 438 297 303 302 109 2 175 1998 609 497 336 305 303 102 2 154 2000 562 482 367 326 302 101 2 139 2001 552 461 377 340 309 101 2 141 2002 555 435 381 353 320 100 2 146 2003 565 410 373 371 331 103 2 154 2004 577 389 360 381 344 108 2 160 2005 590 375 341 385 357 112 2 159 Projection 2006 604 373 321 377 375 114 2 164 2010 633 404 285 306 369 131 2 127 2020 673 440 330 329 322 102 2 195 2030 667 465 350 347 345 115 2 288 2040 668 444 341 352 362 122 2 288 2050 705 467 348 346 347 117 2 329
The table includes information from the years mentioned in the text.
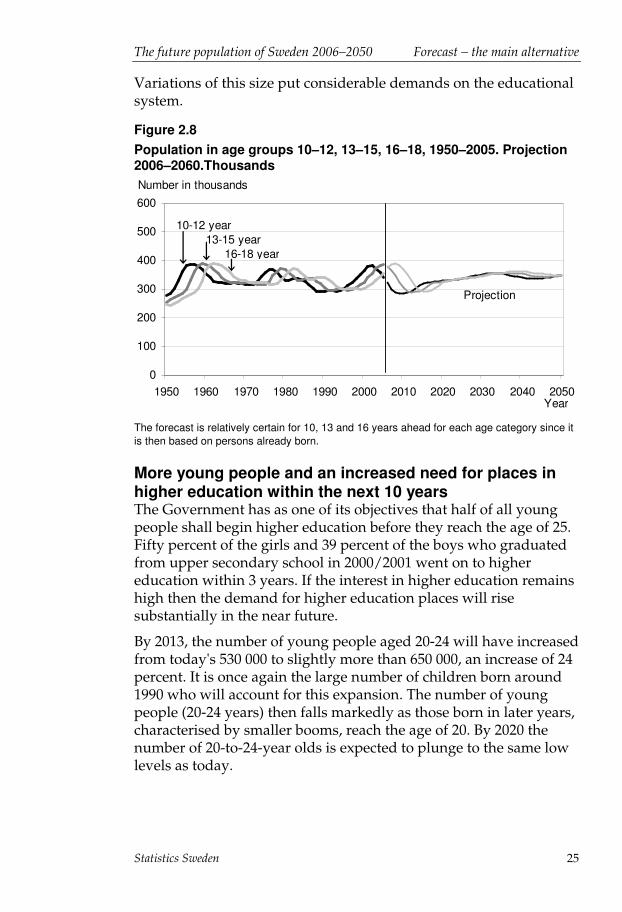
The large number of children born around 1990 leave their mark on trends One can clearly see how those born in the large baby boom which occurred between 1989 and 1993 have successively made their way through the different stages of schooling. The number of children in the 10-12, 13-15 and 16-18 age groups has followed the same pattern as the number of children in the first three years of compulsory school with a three year shift for each age group.
The number of students in their fourth to sixth year of compulsory school peaked in 2002 and then subsided. The number of students in the 13-15 - year old age group culminated in 2005 while the number of students in upper secondary school will peak in 2008 and subside one year later.
Within a decade, the number of students in a certain type of school changes substantially. The number of seniors in compulsory school (13-15 years old) rose by 28 percent between 1995 and 2005.
The future population of Sweden 2006–2050 Forecast – the main alternative
Statistics Sweden 25
Variations of this size put considerable demands on the educational system.
Figure 2.8 Population in age groups 10–12, 13–15, 16–18, 1950–2005. Projection 2006–2060.Thousands
0
100
200
300
400
500
600
1950 1960 1970 1980 1990 2000 2010 2020 2030 2040 2050
Number in thousands
Year
Projection
16-18 year
10-12 year13-15 year
The forecast is relatively certain for 10, 13 and 16 years ahead for each age category since it is then based on persons already born.
More young people and an increased need for places in higher education within the next 10 years The Government has as one of its objectives that half of all young people shall begin higher education before they reach the age of 25. Fifty percent of the girls and 39 percent of the boys who graduated from upper secondary school in 2000/2001 went on to higher education within 3 years. If the interest in higher education remains high then the demand for higher education places will rise substantially in the near future.
By 2013, the number of young people aged 20-24 will have increased from today's 530 000 to slightly more than 650 000, an increase of 24 percent. It is once again the large number of children born around 1990 who will account for this expansion. The number of young people (20-24 years) then falls markedly as those born in later years, characterised by smaller booms, reach the age of 20. By 2020 the number of 20-to-24-year olds is expected to plunge to the same low levels as today.

Forecast – the main alternative The future population of Sweden 2006–2050
Statistics Sweden 26
Figure 2.9 Population in age group 20–24, 1950–2005. Projection 2006–2050. Thousands
0
100
200
300
400
1950 1960 1970 1980 1990 2000 2010 2020 2030 2040 2050
Men
Women
Number in thousands
Year
Projection
Figures are found in tables 5.12a and 5.12b in table appendix.
The population of 20-64 year olds
Weak rise in the population of working age The number of people of working age (20-64 years) is expected to rise from 5.3 million in 2005 to 5.7 million in 2050.
Most people establish themselves on the labour market at some point between the ages of 20 and 30. We have chosen to define the working population as people in the 20-64 year old age group. There are, however, several reasons to consider revising this definition. Young people are establishing themselves increasingly later on the labour market. Studies and youth unemployment are such that many young people do not secure gainful employment until after the age of 25.
Until the beginning of the twenty-first century, many people left their working life before the age of 65. In recent years however the trend has turned and the proportion of people gainfully employed after the age of 60 has increased (Nygren, 2005).

The future population of Sweden 2006–2050 Forecast – the main alternative
Statistics Sweden 27
Figure 2.10 Yearly change of population in age group 20–64, 1950–2005. Projection 2006–2050. Thousands
-20
0
20
40
60
1950 1960 1970 1980 1990 2000 2010 2020 2030 2040 2050
Number in thousands
Year
Projection
Both the number of young people aged 20-24 and the number of people leaving their prime working years are expected to rise sharply over the next 10 year period. This is due to the large number of people from the often-mentioned 1940s baby boom who will retire and leave their prime working years. Despite these changes, the number of people of working age is expected to increase until some time around 2015 before levelling off (small deficit). When exactly this change is to take place depends greatly on the size of the future immigration surplus. After 2015 the number of people of working age (aged 20-64 years old) is expected to rise again for the remainder of the forecast period, with the exception of some brief period around 2030.
The age distribution of the working age population The number of people aged 55-64 years will decline between 2005 and 2016. The next decade however will see an increase in this age group and, by 2026, the population aged 55-64 years will be about the same size as it is today. There is a connection between age and health such that the burden on the health insurance system can be expected to diminish somewhat as the population aged 50-64 years falls (Alm Stenflo, 2002).

Forecast – the main alternative The future population of Sweden 2006–2050
Statistics Sweden 28
Figure 2.11 Comparison of the age distribution year 2006, with 2016 and with 2026. Thousands
0
25
50
75
100
125
150
20 30 40 50 60
Thousands
Age
2006 2016
0
25
50
75
100
125
150
20 30 40 50 60
Thousands
Age
2006 2026
If one combines age groups in 20 year classes (e.g., 0-19, 20-39, etc.) then a great deal of the variation disappears. This is because variations in the birth rate occur within a 20 year period or one generation.
The decline in the number of people aged 20-39 years began as early as the mid 1990s. The reduction is expected to continue for some years to come. A slight increase in the number of 20-39 year olds is expected over the next ten year period thereafter due to the rise in the number of births between 1985 and 1990. Towards to end of the forecast period the size of this group is expected to increase, although these figures are very uncertain since they are based on assumptions of a rising birth rate.
The number of people aged 40-64 years will increase for some years yet. This is because the large number of people born in the 1960s will exceed 40 years of age over the next few years. Thereafter, the growth will become relatively stable.

The future population of Sweden 2006–2050 Forecast – the main alternative
Statistics Sweden 29
Figure 2.12 Number of women and men in age group 20–39 and 40–64, 1950–2005 and projection 2006–2050. Thousands Women Men
0
400
800
1200
1600
2000
1950 1970 1990 2010 2030 2050
Thousands
40-64 year
20-39 year
Year
Projection
0
400
800
1200
1600
2000
1950 1970 1990 2010 2030 2050
Thousands
40-64 year
20-39 year
Year
Projection
Table 2.3 Population in age groups 20–39 and 40–64, 1950–2005 and projection 2006–2050. Thousands
Women Men
Year Ages
20–39 Ages
40–64 Ages
20–64 Ages
20–39 Ages
40–64 Ages
20–64 1950 1 031 1 108 2 139 1 051 1 069 2 120 1960 945 1 231 2 175 961 1 216 2 177 1970 1 082 1 258 2 340 1 145 1 249 2 394 1980 1 177 1 179 2 356 1 238 1 167 2 405 1990 1 160 1 282 2 441 1 219 1 293 2 512 2000 1 160 1 408 2 567 1 209 1 436 2 645 2005 1 138 1 485 2 623 1 182 1 519 2 700 Projection 2006 1 137 1 502 2 640 1 180 1 536 2 716 2010 1 159 1 508 2 667 1 199 1 537 2 736 2020 1 179 1 501 2 680 1 220 1 528 2 749 2030 1 177 1 519 2 696 1 219 1 543 2 761 2040 1 207 1 515 2 722 1 253 1 539 2 792 2050 1 254 1 557 2 811 1 301 1 584 2 885

Forecast – the main alternative The future population of Sweden 2006–2050
Statistics Sweden 30
Senior citizens
Old-age pensioners During the forty-year period 1950-1990, the number of people aged 65 and over doubled from 721 0000 to 1 526 000 people. Since 1990, however, the number of old-age pensioners has remained relatively unchanged at about 1.5 million. This is as a result of the relatively small number of people born in the 1930s reaching retirement age.
The next decade, when people born in the 1940s reach pensionable age, will lead to an increase of slightly more than 20 percent in the number of people aged 65 and over. The number will rise from 1.5 million in 2005 to 1.9 million in 2015. By 2015, all of those born in the 1940s will have reached pensionable age. Thereafter the increase will continue further until 2040 when the number of old-age pensioners is expected to total some 2.4 million.
People aged 65-79 The number of people aged 65-79 rose from 615 000 in 1950 to almost 1.2 million in 1988. The subsequent downturn can be explained by the small number of births in the 1920s and the 1930s. As those born in the baby boom years of the 1940s reach the age of 65, the number of people aged 65-79 will climb quickly. In 2005 they numbered 1.1 million and in 2015, people aged 65-79 will number slightly more than 1.4 million.
Figure 2.13 Women and men aged 65–79 and 80+ in 1950–2005. Projection 2006–2050. Thousands Women Men
0
200
400
600
800
1000
1950 1970 1990 2010 2030 2050
Tusental
Year
Projection
65-79 year
80 year and older
0
200
400
600
800
1000
1950 1970 1990 2010 2030 2050
Tusental
Year
Projection65-79 year
80 year and older

The future population of Sweden 2006–2050 Forecast – the main alternative
Statistics Sweden 31
At the beginning of the forecast period there were just over 75 000 more women than men aged 65-70, a surplus which is calculated to be approximately 20 000 by the end of the forecast period. The surplus of women of this age is diminishing as the mortality of men is falling more quickly than that of women.
The "older elderly" (80 years and older) The rapid decline in mortality has resulted in very fast increases in the number of people aged 80 and over (the older elderly) in the Swedish population. Since the 1950s their numbers have quadrupled. In 1950 this segment of the population numbered 107 000 and in 2005 they numbered 487 000.
Over the next ten years, the number of people aged 80 years and over will remain relatively constant. During the 2020s, growth will be dramatic. The number of people aged 80 years and over will grow by 45 percent over a mere 10 years. The number of "older elderly" will increase from some 525 000 to over 760 000.
Table 2.4 Population in age groups 65–79, 80–and 65–, 1950–2050. Thousands
Ages 65–79 Age 80 and older Age 65 and older Year
Women Men Total Women Men Total Women Men Total
1950 325 289 615 60 46 107 386 336 721
1960 403 344 747 79 62 141 482 406 888
1970 504 419 923 113 77 190 618 496 1 113
1980 603 496 1 099 168 95 263 771 591 1 362
1988 637 522 1 159 226 120 345 862 642 1 504
1990 636 521 1 157 241 129 370 877 650 1 526
2000 588 490 1 078 293 160 453 881 650 1 531
2005 576 502 1 078 311 176 487 887 679 1 565Projection
2006 580 511 1 091 312 177 489 892 688 1 580
2010 644 592 1 236 311 180 491 954 773 1 727
2015 725 679 1 404 304 183 488 1 029 862 1 891
2020 787 744 1 531 316 209 525 1 103 953 2 056
2030 784 755 1 540 438 325 763 1 222 1 080 2 303
2040 837 815 1 653 463 348 811 1 301 1 164 2 4642050 793 773 1 566 510 401 912 1 303 1 174 2 477
The table includes information from the years mentioned in the text.

Forecast – the main alternative The future population of Sweden 2006–2050
Statistics Sweden 32
It is again the large booms in the number of births in the 1940s which will influence this trend. Between 2030 and 2050, the number of people aged 80 and over will continue to grow at a slower pace to a total of more than 900 000 by 2050. At the beginning of the forecast period the surplus of women amounted to approximately 130 000. This surplus will shrink to approximately 90 000 by the end of the period.
The future number of people aged 80 and over depends greatly on developments in healthcare. The divergence between the actual number and the forecasted estimates can be considerable at the end of the forecast period.
A greater “dependency ratio” The relation between the number of people of working age and the sum of the population outside of this age interval (the sum of those aged under 20 and those aged 65 and over) can be seen as a measure of the population's burden of support. This measure is often used when assessing the economic consequences of population change. The most relevant measure is to set the number of employed people against the number of people with no job, but we are unable to do this in this case.
Figure 2.14 Dependency ratio, 1950–2005. Projection 2006–2050
0,0
0,2
0,4
0,6
0,8
1,0
1950 1960 1970 1980 1990 2000 2010 2020 2030 2040 2050
Ratio
Year
Projection
Total dependency ratio
From children and young people
From the older
The ratio calculated as the number of persons aged 0-19 (children and young people), persons age 65 and older (the older) and both groups together ("dependency ratio") per person aged 20-64.

The future population of Sweden 2006–2050 Forecast – the main alternative
Statistics Sweden 33
As illustrated in Figure 2.14, the burden of support will increase fairly soon. In addition to the total burden of support, the diagram also presents the part of the burden attributable to the support of children and young people under 20 years of age and the part of the burden attributable to old age pensioners. It is the expected increase in the number of people aged 65 and over which is behind the increase in the burden of support. This burden will reach its peak in some 35 years when, according to the forecast, there will be 0.86 people at either extreme of the working age population for every one person of working age. The corresponding value for the current burden of support is 0.70.
According to the forecast, within 30 years the number of people aged 65 and over will have a greater effect on the burden of support than children and young people under the age of 20. This is in strong contrast to the situation 50 years ago when the impact of children and young people on the burden of support was almost three times greater than that of people over 65 years of age. Despite successive increases in the number of elderly people, the burden of support has remained relatively constant during the period 1960-2002. This results from the fact that the number of children has to a large extent remained constant while the number of elderly people has increased at the same pace as the number of people aged 20-64.
Table 2.5 Number of persons in age groups 0–19 and 65– per person aged 20–64, 1950–2005. Projection 2006–2050. Thousands
Year Ages 0–19 65 years and older Total
1950 0,49 0,17 0,65 1960 0,52 0,20 0,72 1970 0,47 0,24 0,71 1980 0,46 0,29 0,75 1990 0,43 0,31 0,73 2000 0,41 0,29 0,70 2005 0,41 0,29 0,70 Projection 2006 0,40 0,29 0,70 2010 0,39 0,32 0,71 2020 0,40 0,38 0,78 2030 0,42 0,42 0,84 2040 0,42 0,45 0,86 2050 0,41 0,43 0,84

The future population of Sweden 2006–2050
Statistics Sweden 34

The future population of Sweden 2006–2050 Assumptions
Statistics Sweden 35
3 Assumptions The forecast assumptions have been worked out based on the analyses of the factors of population change: fertility, mortality and migration. The development of trends up until present day is an important part of this work. We have also tried to explain, to the greatest extent possible, the causal relations in development in order to substantiate our assessments when extrapolating trends.
Fertility In order to reach a situation in which the population fully replenishes itself, or when the replacement fertility rate is achieved, each woman must give birth to 2.1 children. In Sweden, the total fertility rate3 in 2005 was 1.77 children per woman which means that, without immigration, we would see a reduction in the population. Compared to many other countries, especially in Europe, Sweden nevertheless has high levels of fertility.
When speaking about the birth rate, we often refer to the total fertility rate for different periods. This is a measurement which is used to examine how fertility evolves from year to year. The total period fertility rate in Sweden has varied greatly over time.
There are several explanations for fluctuations in fertility over time. Participation in working life, education and the economic situation are some of the factors which have been shown to affect childbirth. External social factors such as family policies and the state of the economy also affect the inclination to have children. The total fertility rate is a good indicator of a population's reproductive state at the time of measurement. In this report the total fertility rate is also, for reasons of simplicity, referred to as the fertility rate.
Another way to study reproduction is through the analysis of the total cohort fertility rate. This involves the examination of reproduction by cohorts as the cohorts get older. The study of cohort fertility rates is advantageous in a forecasting context since the total cohort fertility rate evolves in a more stable way than the total period fertility rate.
3 The total fertility rate is a measure of the number of children a woman would have on average if fertility (the propensity to have children at different ages) was the same as during the year the calculation was made.

Assumptions The future population of Sweden 2006–2050
Statistics Sweden 36
The basis of the fertility forecast rests partly on an assumption about the percentage of childlessness per cohort and partly on an assumption about the distribution of the number of children per cohort. The distribution determines what percentages within a cohort will have one child, two children, etc... . The annual fertility rate resulting from these assumptions is then calculated.
The assessment of future childlessness is uncertain. The postponement of reproduction to later in life leads us to anticipate greater childlessness. However, there are several factors which affect childlessness and this year's forecast includes a deeper examination of the evolution of factors which may be considered important in the assessment of future childlessness.
The information used as the basis for this forecast was obtained from Statistics Sweden's Multi-Generation Register as well as historical databases. Fertility forecasts can be made on the basis of either females or males. However, information on fathers is slightly more often lacking than information on mothers and we have therefore, as in previous fertility forecasts, elected to start with females as the basis for this fertility forecast. Adopted children are not accounted for in the fertility assumptions. They are considered in the assumptions on immigration.
Fertility trends During the 1900s, reproduction (or childbirth) has varied greatly over time (see Figure 3.1). A large part of the annual variations can be explained by the fact that different generations have given birth at different ages. Women born around 1945 were the youngest first-time mothers at an average age of 24 years. The average age of first-time mothers has since increased and, in 2005, first-time mothers were on average 29 years old. The average age has likely never been higher. However if we look slightly further back in time, the average age of first-time mothers born in the 1800s was probably 27-28 years old, which is not so different from today. What distinguishes the 19th century woman from today's woman is that she continued to bear children until the end of her fertile period.
Despite the large variations in annual fertility, women born in the 1900s have generally given birth to an average of two children. Let us use the example of women born in 1965, i.e. women who turned 40 years of age in 2005 and who to a large extent came to the end of their fertile years. These women gave birth to an average of 1.93

The future population of Sweden 2006–2050 Assumptions
Statistics Sweden 37
children. Women born in 1919 had the highest number of children, slightly more than 2.1 children per woman.
Several studies show that there is a connection between the number of children born and upturns and downswings in the economy. It is mainly the start-up of the family-building process (the first child) which is affected by the state of the economy. Swedish parental insurance is such that it is more advantageous to give birth once a person is firmly anchored in the labour market. Childbirth is greatest among those who are employed and lowest among students and other young people who are not in the labour force.
Figure 3.1 Total fertility rate 1900–2005 and ultimate number of children per birth cohort 1870–1965. Number of children per woman
0
1
2
3
4
5
1900 1925 1950 1975 2000
Year
Number of children per w oman
Total fertility rate0
1
2
3
4
5
1875 1900 1925 1950
Birth year
Number of children per w oman
Ultimate number of children
During the 1990s, childbirth fell in Sweden. One reason for this was the economic downturn which led to reduced employment. The postponement of reproduction to later in life accelerated during this period. The recession resulted in, particularly for younger men and women, greater difficulties in establishing oneself on the labour market. An increasing number went on to higher education and therefore postponed having children. The high inclination to study has continued and the advent of parenthood was further displaced to later in life during the first year of the twenty-first century. Since 2003, increases in the average age of first-time parents have subsided somewhat.
The average age has risen the most for first-time mothers (see Figure 3.2). Between 1970 and 1990 the average age for first-time mothers increased by 2 years from around 24 to 26 years of age. Since 1990 the average age has risen by 3 more years to 29 years of age.

Assumptions The future population of Sweden 2006–2050
Statistics Sweden 38
First-time mothers in Sweden have the highest average age in the Nordic countries. However, in other European countries, the average age of first-time mothers is the same or older. Examples of such countries include the UK, Germany and Spain.
Figure 3.2 Mean age at birth of child by parity 1970–2005. Year
20
25
30
35
40
1970 1980 1990 2000
Year
First
Second
Third
Women
Fourth +
0
Age
20
25
30
35
40
1970 1980 1990 2000
Year
First
Second
Third
Fourth +
Men
0
Age
Fertility assumptions Fertility in Sweden is characterised by large upswings and downturns. Childbirth will surely continue to vary with the state of the economy, as it has previously, but it is impossible to foresee such variations in the longer term. Our assumptions ought to be interpreted as an average future level rather than as assumptions of the most likely level for a single calendar year.
We have attempted to take into consideration the impact of the state of the economy on childbirth over the first few years of the forecast period. We studied childbirth forecasts4 and analysed monthly statistics on the number of births in order to examine the development of trends.
When we make assumptions, we study the fertility for a cohort, or for women born in a certain year. The reason for this is that patterns in fertility are more stable for cohorts than the patterns in fertility from year to year. Based on the assumptions on the trends for women born in a certain year, we then calculate the yearly fertility resulting from these assumptions.
4 Forecasts for births in Stockholm county are available at www.lafa.nu

The future population of Sweden 2006–2050 Assumptions
Statistics Sweden 39
Fertility in the near future The forecast result for 2005 and the actual results observed corresponded to a great degree. There are no significant differences between the forecast and the actual results for any child order (whether the child was the first child, second child, etc.) for 2005.
Fertility has risen since 1999 when the fertility rate was at the lowest ever measured in Sweden (1.5 children per woman). In 2005 there were however signs of stagnation. No increase in the frequency of the birth of first-born children was observed. Yet childbirth seems to have regained momentum in 2006. Indications received to date for 2006 depict a rise in the birth of first-born children as well as a rise in the birth of second-born children. For 2006, our main alternative presumes fertility of about 1.81 children per woman and thereafter a continuing rise over the next few years to 1.85 children per woman. This rise is faster than that which was adopted in the previous year's forecast (Statistics Sweden, 2005c). We presume that the rise will occur largely among the older age groups but we also believe that a small rise in the birth of first-born children will be seen in the younger age groups.
Fertility in the longer term The forecast's main alternative is based on the supposition that fertility will rise to an average of 1.85 children per woman in the future. Women born in the period 1900-1960 gave birth to about 2 children on average. Our assumption thus yields a lower cohort fertility rate in the foreseeable future.
For forecast purposes, parity-specific fertility rates are calculated separately. By first summing these rates for each age and then summing the age-specific rates, the total fertility rate can be calculated. Our assumptions are based on the following supposed future distribution of the number of children:
0 children 1 child 2 children 3 children at least 4 children 16 % 14 % 47 % 15 % 8 %
We believe that the postponement of childbirth partly leads to a somewhat higher proportion of childlessness and partly to parents having fewer children. Those who have children at an earlier age have more children on average than those who start a family at a later age (Statistics Sweden, 2002). It may be difficult to manage a third or fourth child if people start to build their family in their thirties.
Assumptions The future population of Sweden 2006–2050
Statistics Sweden 40
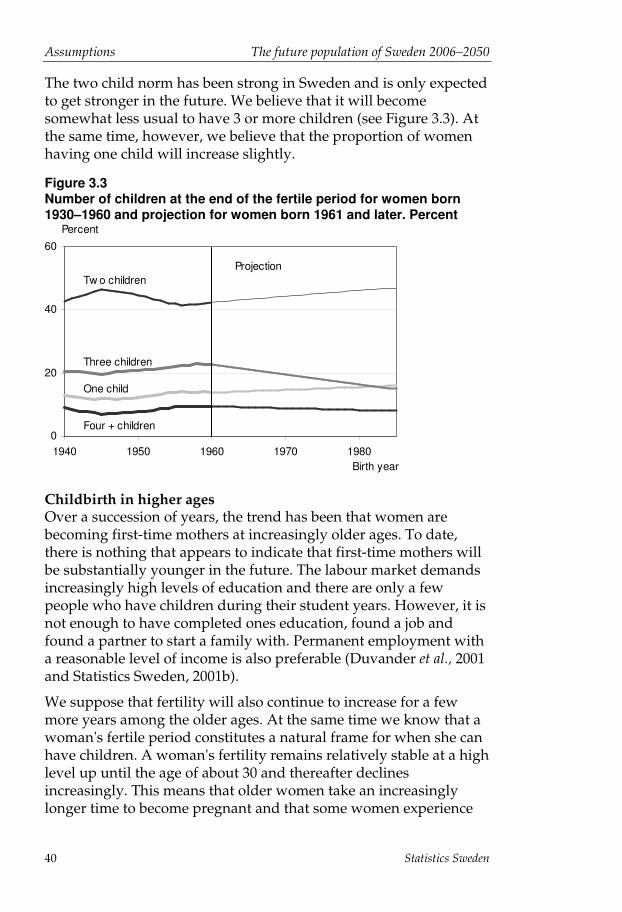
The two child norm has been strong in Sweden and is only expected to get stronger in the future. We believe that it will become somewhat less usual to have 3 or more children (see Figure 3.3). At the same time, however, we believe that the proportion of women having one child will increase slightly.
Figure 3.3 Number of children at the end of the fertile period for women born 1930–1960 and projection for women born 1961 and later. Percent
0
20
40
60
1940 1950 1960 1970 1980
ProjectionTw o children
Three children
One child
Four + children
Birth year
Percent
Childbirth in higher ages Over a succession of years, the trend has been that women are becoming first-time mothers at increasingly older ages. To date, there is nothing that appears to indicate that first-time mothers will be substantially younger in the future. The labour market demands increasingly high levels of education and there are only a few people who have children during their student years. However, it is not enough to have completed ones education, found a job and found a partner to start a family with. Permanent employment with a reasonable level of income is also preferable (Duvander et al., 2001 and Statistics Sweden, 2001b).
We suppose that fertility will also continue to increase for a few more years among the older ages. At the same time we know that a woman's fertile period constitutes a natural frame for when she can have children. A woman's fertility remains relatively stable at a high level up until the age of about 30 and thereafter declines increasingly. This means that older women take an increasingly longer time to become pregnant and that some women experience

The future population of Sweden 2006–2050 Assumptions
Statistics Sweden 41
great difficulty in becoming pregnant (Ministry of Health and Social Affairs, 2001).
Is it realistic to believe that fertility may rise among older women to the extent that we suppose? Figure 3.4 is a comparison of fertility patterns in different municipal groupings - metropolitan areas, suburban municipalities, larger cities and other parts of the country - with the assumed foreseeable national fertility according to our main alternative (1.85 children per woman). In spite of our supposition that fertility at older ages will rise, it will nevertheless lie below the levels attained by older women in metropolitan areas in 2005. We can therefore conclude that the supposition is reasonable within the foreseeable future.
Figure 3.4 Age specific fertility in municipality groups and in the complete country 2005 and age specific fertility according to Statistic Sweden’s projection for 2010–2050. Number of children per 1000 women
0
40
80
120
160
200
15 20 25 30 35 40 45 50
MetropolitanareasSuburbanmunicipalitiesLarger cities
Other parts ofthe countryTotal country
Projection forthe future
Number of children per 1000 w omen
Age For breakdown into municipality groups see SCB (2006a)
Alternative scenarios How fertility trends will evolve in the future is very uncertain. Incorrect assumptions in the forecast can quickly become very significant when used as a basis for determining the future number of children. In order to better understand how the future population is affected by the number of children born, two alternative scenarios to the main alternative are presented in Statistics Sweden's population forecast: one with low fertility and one with high fertility. The alternatives are presented in Table 3.1. The difference between the high and the low alternatives amounted to close to 24 000 children born per year.

Assumptions The future population of Sweden 2006–2050
Statistics Sweden 42
Table 3.1 Total fertility rates and number of children born the closest years according to the main assumption and according to alternative assumptions Year Alternative
Low fertility Main alternative High fertility
TFR Number of children born
TFR Number of children born
TFR Number of children born
2006 1,70 97 301 1,81 103 234 1,91 109 462 2007 1,70 96 709 1,82 103 585 1,95 111 061 2008 1,69 95 917 1,83 104 240 1,98 112 555 2009 1,68 95 380 1,84 104 803 2,00 113 796 2010 1,64 93 498 1,85 105 551 2,04 116 571 2020 1,65 101 071 1,85 113 154 2,04 124 808
TFR=total fertility rate, given in the number of children per woman.
Low fertility In the low fertility alternative, we have assumed that future fertility will settle at the same level as that of many other countries in Europe, that is, 1.65 children per woman. In comparison to the main alternative, the low fertility scenario involves women bearing slightly fewer children at younger ages and significantly fewer children at older ages. The fact that some people delay the start-up of their family will thus not, according to this scenario, contribute to a larger proportion of people bearing their first child later in life. In the low fertility assumption, we also presume that people will not compensate for the postponement of having children by bearing more children at an older age instead. Consequently, we presume that childlessness will rise to 18 percent. Our assumptions regarding low levels of fertility are based on the following supposed future distribution of the number of children:
0 children 1 child 2 children 3 children at least 4 children
18 % 23 % 40 % 14 % 5 %
High fertility In our high fertility scenario we have assumed that women will continue to bear slightly over 2 children on average. This scenario is plausible if the current fertility patterns are more stable than we believe and women continue to bear an average of about 2 children. This depiction of the future would be possible if more people bore children at a younger age and there was a substantial rise in childbearing among the older fertile ages. Such a development can be imagined if it were easier for young people to establish

The future population of Sweden 2006–2050 Assumptions
Statistics Sweden 43
themselves on the labour market. It is however difficult to say whether biological considerations would hinder a substantial increase in childbirth among the older fertile ages.
In the high fertility scenario, we presume total (or complete) compensation for 'postponed' childbirth. That is, any reduction in childbirth among the younger ages is compensated for by an increased in childbirth among the older fertile ages. This means that no increase in childlessness is considered in the high fertility scenario. Our assumptions regarding high levels of fertility are based on the following supposed future distribution of the number of children:
0 children 1 child 2 children 3 children at least 4 children
14 % 11 % 45 % 17 % 13 %
Assumptions The future population of Sweden 2006–2050
Statistics Sweden 44
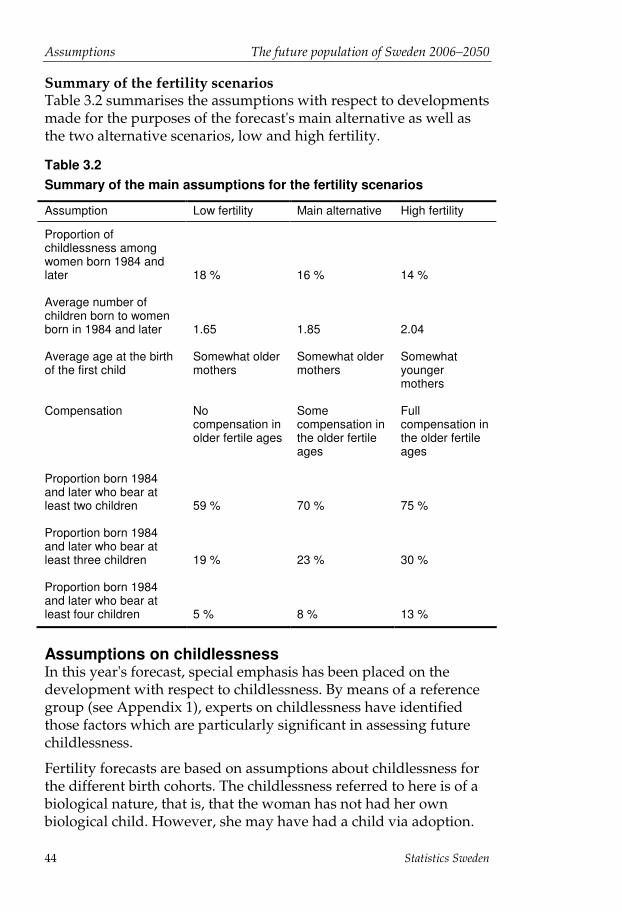
Summary of the fertility scenarios Table 3.2 summarises the assumptions with respect to developments made for the purposes of the forecast's main alternative as well as the two alternative scenarios, low and high fertility.
Table 3.2 Summary of the main assumptions for the fertility scenarios
Assumption Low fertility Main alternative High fertility
Proportion of childlessness among women born 1984 and later 18 % 16 % 14 % Average number of children born to women born in 1984 and later 1.65 1.85 2.04 Average age at the birth of the first child
Somewhat older mothers
Somewhat older mothers
Somewhat younger mothers
Compensation No
compensation in older fertile ages
Some compensation in the older fertile ages
Full compensation in the older fertile ages
Proportion born 1984 and later who bear at least two children 59 % 70 % 75 % Proportion born 1984 and later who bear at least three children 19 % 23 % 30 % Proportion born 1984 and later who bear at least four children 5 % 8 % 13 %
Assumptions on childlessness In this year's forecast, special emphasis has been placed on the development with respect to childlessness. By means of a reference group (see Appendix 1), experts on childlessness have identified those factors which are particularly significant in assessing future childlessness.
Fertility forecasts are based on assumptions about childlessness for the different birth cohorts. The childlessness referred to here is of a biological nature, that is, that the woman has not had her own biological child. However, she may have had a child via adoption.

The future population of Sweden 2006–2050 Assumptions
Statistics Sweden 45
The main assumption on future childlessness which we have had over the last few years and which we intend to maintain until further notice is that childlessness will climb to 16 percent in the foreseeable future. Among women who have just emerged from their fertile period, childlessness is around 14 percent.
In this section, we describe the development of childlessness over the last few years and present the factors which we believe may affect childlessness.
Childlessness trends and assumptions That more and more people have delayed the start-up of their families has in all likelihood resulted in an increase in the ultimate proportion of childless women. The proportion of childlessness was at its lowest among women born in the mid-1940s, which also comprised the generation which includes the youngest first-time mothers. The proportion of childlessness has since increased somewhat and, among women who have just emerged from their fertile period, the proportion of childlessness has been around 14 percent.
Figure 3.5 Share of childless women at the end of the fertile period for women born 1940–1960 and projection for women born 1961 and later. Percent
0
5
10
15
20
1940 1950 1960 1970 1980
Projection
Birth year
Percent
The postponement of childbirth began in the 1970s but accelerated in the 1990s. The postponement which took place in the 1990s was particularly evident among women born in 1968 and later. Hence, we presume that women born up to and including 1968 will have a total childlessness identical to that of women who have just concluded their fertile period. For women born between 1968 and

Assumptions The future population of Sweden 2006–2050
Statistics Sweden 46
1980, a successive increase in the proportion of ultimate childlessness per cohort is presumed. The increase is assumed to occur gradually from 14 percent among women born in 1968 to 16 percent among women born in 1980 and later.
Figure 3.6 clearly shows that the postponement of childbearing has yielded an increasing number of childless people as aging progresses. Among women born in 1950, slightly more than 20 percent were childless at the age of 30. In 2005, 45 percent (women born in 1975) were childless at the age of 30. If one compares the proportion of childless women at say, the age of 35, then the differences between the birth cohorts are not as great. More recently, childlessness has risen somewhat for women aged 27 to 34 years although it has remained constant for other age groups.
Figure 3.6 Share of childless women and men by age and year of birth 1950–1985. Percent Women Men
0
20
40
60
80
100
1950 1960 1970 1980
Birth year
2025
30
3540
45
Per cent
0
20
40
60
80
100
1950 1960 1970 1980
Birth year
20 25
35
30
40 45
Per cent
Historically, there has been a relatively large proportion of childless women in comparison to current childlessness. It is estimated that some 20 to 25 percent of women born in the 1800s remained childless (Alm Stenflo, 1989). This is also the case for many other countries (Sobotka, 2004). Among white women born in the USA at the beginning of the 1900s, 19 percent remained childless. The corresponding percentage among non-whites was 25 percent. Among women of the same age in France and Germany, every fourth woman remained childless.
Sobotka (2004) has forecast childlessness for 16 European countries as well as the USA using two different methods. In Sweden, these two methods resulted in a childlessness of 17.5 percent and 18.6
The future population of Sweden 2006–2050 Assumptions
Statistics Sweden 47
percent. The reason that we presume, in the population forecast, lower childlessness in Sweden (16 percent) than Sobotka did is that we assume greater childbirth in the older fertile ages.
Factors affecting childlessness We believe that several factors are particularly significant in the assessment of future childlessness. It will be important to monitor developments in these areas. Some factors evolve in such a way that they may result in increases in childlessness while other factors may lead to reductions in childlessness. The evolution of other factors such as voluntary childlessness remains unclear.
Involuntary childlessness Involuntary childlessness is considered to be the case when unprotected sexual relations with one partner of the opposite gender, over the course of one year or more, do not result in a pregnancy. Failure to become pregnant is a relatively common problem. It is estimated that between 10 and 15 percent of all couples are affected by involuntarily childlessness.
It can generally be said that involuntary childlessness can be classified as dependent on three different factors:
• Physiological factors. Age plays a decisive role here. One example of this is that the quality of a female's eggs deteriorates as the woman ages.
• Lifestyle factors. Drugs, sexually transmitted diseases, being overweight or underweight, stress and sexual problems are examples of lifestyle factors that may affect fertility negatively.
• Pathological factors. Certain diseases may cause infertility. Age and lifestyle factors both in turn affect illness-related infertility problems. Illness-related infertility which is not dependent on lifestyle factors or age has not increased.
Assisted reproduction About 5 percent of those who have children today have had help getting pregnant. Three percent have become pregnant via IVF (in vitro fertilisation) and 2 percent via other means. Today almost all forms of female infertility can be treated through the use of IVF. In 2002 some 11 000 IVF treatments were carried out in Sweden and about 25 percent of these led to a live birth (The National Board of Health and Welfare, 2005).
Assumptions The future population of Sweden 2006–2050
Statistics Sweden 48
The Nordic countries lead the world, with the exception of Israel, in the greatest number of IVF treatments performed per million inhabitants (Finnström et al., 2005). The demand for treatment exceeds the supply and long queues to county clinics are the norm. Assisted reproduction however can not compensate for the natural decline in fertility with age. Leridon (2004) has studied this and the results indicate that only half of the involuntary childlessness due to the postponement of childbirth from 30 to 35 years of age can be compensated for with assisted reproduction. Similarly, according to the calculations, less than 30 percent of the childlessness due to the postponement from 35 to 40 years of age can be compensated for given current technology. However the continued development of technology could translate into the ability to compensate for age to a greater extent. One example of such a development is egg donation which was approved in Sweden on 1 January 2003.
Attitudes toward childlessness In Statistics Sweden's latest opinion survey of young people on childbirth (2001a), few were found to never want a child. Among the childless men and women who were living together and aged 31 or below, less than 5 percent indicated that they will not or probably not have children (see Figure 3.7). It is not until the age of 35 that the proportion who believe they will not have children increases sharply. This likely includes a large proportion of the involuntarily childless (see Figure 3.8). Many couples report that the reason they have not yet had children is that they have not been successful in getting pregnant. Many singles report that it is because they do not have a partner.
According to the Eurobarometer 2001, a recurrent opinion survey within the EU, the average proportion of those who do not want children in the EU15 member states was 6 percent among women aged 18 to 34. In four of the countries (Germany, Austria, the Netherlands and Belgium), more than 10 percent did not want children. In other countries, the proportion was 5 percent or less (Fahey et al., 2004).
There are many who believe that voluntary childlessness will rise since there are more lifestyles to choose from today. We have not yet however seen any research which supports this though most surveys are beginning to be out of date. The latest opinion survey was conducted in 2001. It is important to monitor this development since changed attitudes can radically affect fertility. It is therefore very important that a new survey on attitudes toward childbirth be carried out as soon as possible.

The future population of Sweden 2006–2050 Assumptions
Statistics Sweden 49
Figure 3.7 Share of cohabitants and single women and men that think they will not or probably will not have children in the future. Percent
0
10
20
30
40
50
25 28 31 34 37
Cobahiting Single
MenPercent
0
10
20
30
40
50
23 26 29 32 35
Cohabiting Single
WomenPercent
Age Age
Figure 3.8 Reasons for not having children. Cohabiting and single women 35 years old and men 37 years old. Percent
0
20
40
60
80
100
Cohabiting Single
Women 35 year
Parförhåll. nytt
No partner
Not yet pregnanat
Do something else first
Else
Work/Economy Do something else first
Percent
Couple relationship
new0
20
40
60
80
100
Cohabiting Single
Men 37 year
Parförhåll. nytt
No partner
Not yet pregnanat
Do something else firstElse
Work/ Economy
Do something else f irst
Complete studies
Percent
Couple relat ionship
new
One study carried out among Swedish university students (Lampic et al, 2006) shows that both men and women have an all too optimistic perception of a woman's ability to get pregnant. They were not sufficiently aware of the natural decline in a woman's fertility in her thirties. One third of the men believed that female fertility first declines after the age of 45.
Couple relations A shrinking proportion of couples have children from their first couple relationship (Statistics Sweden, 1995). When men and

Assumptions The future population of Sweden 2006–2050
Statistics Sweden 50
women plan to start a family, the most important consideration is a stable couple relationship. As shown in Figure 3.6, the most important reason for childless singles to not yet have had children is that they did not have a partner. As a whole this points to the prolongation of the "search for a mate" process, that is, the time it takes to find a partner to build a family with.
International comparisons In Sweden, the fertility rate in 2005 was 1.77 children per woman. From a European perspective, this is a high rate (see Figure 3.2). All the Nordic countries have averages well above the European average. One explanation is deemed to be the generous family policies which make the combination of children and gainful employment possible for both men and women. In many countries within Europe, family policies have an entirely different form and can often be considered in connection with remarkably low fertility rates.
In Germany, fertility rates have remained under 1.5 children per woman since the beginning of the 1980s. Swedish policy has aimed to get more women into the work force while German policy has instead rather encouraged women to stay at home. One consequence of this is that well-educated German women have chosen to limit the number of children they have or remain childless (Hoem, 2005). Family policy in Germany however will face significant changes in the coming years.
In the EU's assumptions on future fertility, only Sweden and France are presumed to have a fertility of 1.85 children per women in the foreseeable future (see Figure 3.2). Right behind them are Denmark, Finland and Norway with about 1.8 children per woman and the UK with 1.75 children per woman. Fertility in Germany, Italy and Spain is presumed to remain on a level of about 1.4 children per woman.
The USA is generally considered an exception in the western world. Despite low levels of family support, the USA has high fertility rates. The fertility rate in 2004 was 2.05 children per woman, a level which has been constant throughout the 1990s. There are various explanations for the USA's relatively high fertility rate (Persson, 2006). One important factor is that childbirth generally occurs at a younger age. The population forecast for the USA assumes that future fertility will head towards 2 children per woman.
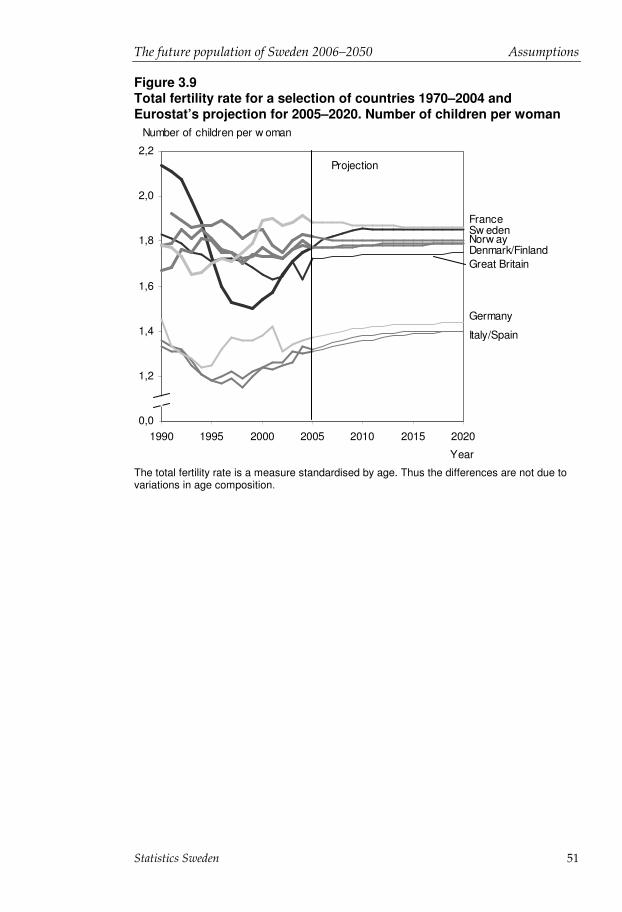
The future population of Sweden 2006–2050 Assumptions
Statistics Sweden 51
Figure 3.9 Total fertility rate for a selection of countries 1970–2004 and Eurostat’s projection for 2005–2020. Number of children per woman
1,0
1,2
1,4
1,6
1,8
2,0
2,2
1990 1995 2000 2005 2010 2015 2020
Year
0,0
Projection
FranceSw edenNorw ayDenmark/FinlandGreat Britain
Germany
Italy/Spain
Number of children per w oman
The total fertility rate is a measure standardised by age. Thus the differences are not due to variations in age composition.
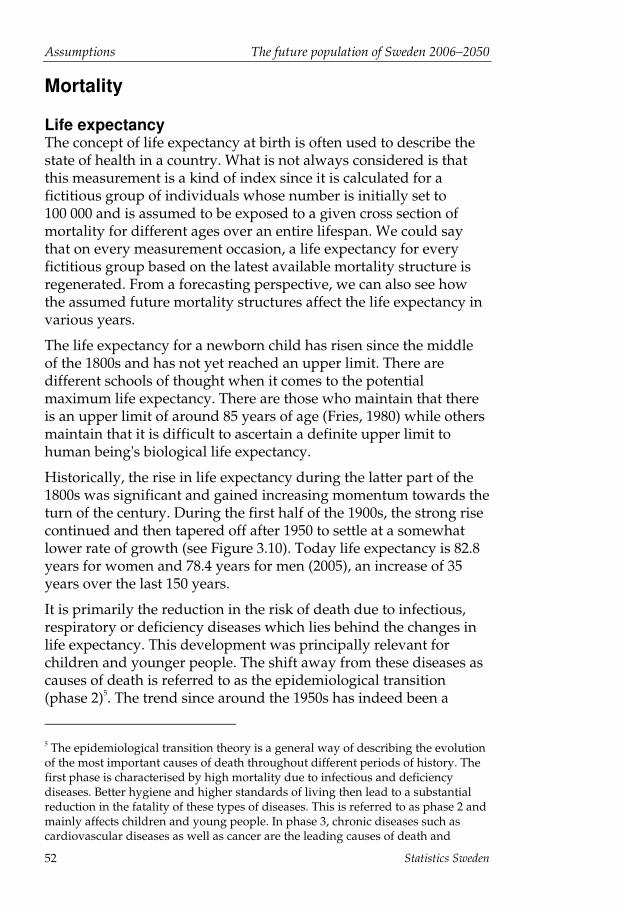
Assumptions The future population of Sweden 2006–2050
Statistics Sweden 52
Mortality
Life expectancy The concept of life expectancy at birth is often used to describe the state of health in a country. What is not always considered is that this measurement is a kind of index since it is calculated for a fictitious group of individuals whose number is initially set to 100 000 and is assumed to be exposed to a given cross section of mortality for different ages over an entire lifespan. We could say that on every measurement occasion, a life expectancy for every fictitious group based on the latest available mortality structure is regenerated. From a forecasting perspective, we can also see how the assumed future mortality structures affect the life expectancy in various years.
The life expectancy for a newborn child has risen since the middle of the 1800s and has not yet reached an upper limit. There are different schools of thought when it comes to the potential maximum life expectancy. There are those who maintain that there is an upper limit of around 85 years of age (Fries, 1980) while others maintain that it is difficult to ascertain a definite upper limit to human being's biological life expectancy.
Historically, the rise in life expectancy during the latter part of the 1800s was significant and gained increasing momentum towards the turn of the century. During the first half of the 1900s, the strong rise continued and then tapered off after 1950 to settle at a somewhat lower rate of growth (see Figure 3.10). Today life expectancy is 82.8 years for women and 78.4 years for men (2005), an increase of 35 years over the last 150 years.
It is primarily the reduction in the risk of death due to infectious, respiratory or deficiency diseases which lies behind the changes in life expectancy. This development was principally relevant for children and younger people. The shift away from these diseases as causes of death is referred to as the epidemiological transition (phase 2)5. The trend since around the 1950s has indeed been a
5 The epidemiological transition theory is a general way of describing the evolution of the most important causes of death throughout different periods of history. The first phase is characterised by high mortality due to infectious and deficiency diseases. Better hygiene and higher standards of living then lead to a substantial reduction in the fatality of these types of diseases. This is referred to as phase 2 and mainly affects children and young people. In phase 3, chronic diseases such as cardiovascular diseases as well as cancer are the leading causes of death and
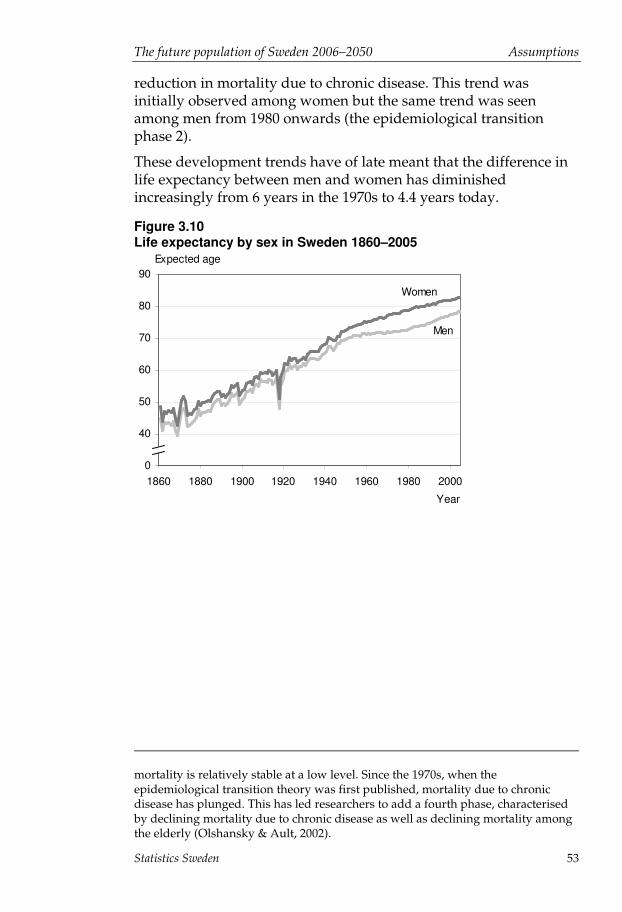
The future population of Sweden 2006–2050 Assumptions
Statistics Sweden 53
reduction in mortality due to chronic disease. This trend was initially observed among women but the same trend was seen among men from 1980 onwards (the epidemiological transition phase 2).
These development trends have of late meant that the difference in life expectancy between men and women has diminished increasingly from 6 years in the 1970s to 4.4 years today.
Figure 3.10 Life expectancy by sex in Sweden 1860–2005
30
40
50
60
70
80
90
1860 1880 1900 1920 1940 1960 1980 2000
Year
Expected age
0
Women
Men
mortality is relatively stable at a low level. Since the 1970s, when the epidemiological transition theory was first published, mortality due to chronic disease has plunged. This has led researchers to add a fourth phase, characterised by declining mortality due to chronic disease as well as declining mortality among the elderly (Olshansky & Ault, 2002).

Assumptions The future population of Sweden 2006–2050
Statistics Sweden 54
Figure 3.11 Remaining life expectancies at ages 50, 65, 75 and 85 years 1860–2005
0
10
20
30
40
1860 1880 1900 1920 1940 1960 1980 2000
Year
Remaining years of life
0
WomenMen
age 50
age 65
age 75
age 85
Figure 3.11 shows the remaining life expectancy for people who have reached certain ages. For those who have reached the age of 50, no significant changes were observed during the first half of the 1900s. It is during the latter part of the 1900s that substantial increases in average remaining life expectancy (declining mortality due to chronic diseases) were first seen. This is when we began to speak of an ageing population. Changes had previously mainly pertained to the survival of children and young people.
Gender differences in survival after middle age were not particularly large during the mid-1900s but thereafter grew significantly. This trend can be observed for women 30 years before it can be seen for men. Nevertheless many of the now known risk factors evolved in a similar way for both men and women. Differences in some lifestyle components have thus clearly been pivotal during this time. It is interesting to note that the reason that the current percentage of elderly women is so great relative to that of elderly men emanates mainly from this relatively modern trend. Today some two thirds of those aged 80 and above are women. The fact that it is a lifestyle factor which has changed means that men will also likely reach similar high levels of life expectancy in the future, especially in light of the fact that lifestyle changes for men have progressed in a clearly positive direction over the last few decades. The latest trend shows that the large difference in life expectancy previously noted between men and women is not absolutely predetermined. Environmental factors which affect health are probably of great significance.
The future population of Sweden 2006–2050 Assumptions
Statistics Sweden 55
Increased life expectancy, 1950-2005 When we speak of life expectancy we often mean life expectancy from birth. Changes in this life expectancy are of general interest and often referred to. Upon calculation of the future population, the mortality rates for those over the age of 50 are of notable significance. Mortality at a younger age is so low that changes have but a minor significance from a forecasting point-of-view. It can nevertheless be of interest to look at the relation between mortality trends and the average remaining life expectancy for a 0 year old during the latter part of the 1900s.
Developments in mortality from 1950 to 2005 have resulted in an increase in the life expectancy of men from 70 to 78 years, or by an average of 0.16 years per calendar year. For women, life expectancy rose from 72 to 83 years or by an average of 0.19 years per calendar year.
Table 3.3 shows what improvements with respect to mortality for different ages, between adjacent five-year periods, have meant in terms of life expectancy (for a 0 year old). The average total increase for every five-year time interval is indicated in the right-hand column. For women it is mainly developments among the elderly which account for the increase in life expectancy during the period 1951-2005. The increase for men has of late consisted mainly of improvements with respect to mortality among middle-aged men (20-64 years old) as well as among the elderly.

Assumptions The future population of Sweden 2006–2050
Statistics Sweden 56
Table 3.3 Changes in life expectancy at birth between different time periods. Total change and changes for different age groups (years)
Time period Change (in year) By age group Total 0–19 year 20–64 year 65– year
Women
1951–55 to 1956–60 0,3 0,6 0,4 1,2 1956–60 to 1961–65 0,2 0,3 0,5 1,0 1961–65 to 1966–70 0,3 0,2 0,5 0,9 1966–70 to 1971–75 0,2 0,2 0,7 1,1 1971–75 to 1976–80 0,2 0,1 0,5 0,9 1976–80 to 1981–85 0,1 0,3 0,6 1,0 1981–85 to 1986–90 0,1 0,1 0,5 0,7 1986–90 to 1991–95 0,1 0,2 0,5 0,8 1991–95 to 1996–00 0,0 0,4 0,5 0,9 1996–00 to 2001–05 0,0 0,2 0,3 0,6
Men 1951–55 to 1956–60 0,3 0,3 0,1 0,7 1956–60 to 1961–65 0,3 0,1 0,0 0,4 1961–65 to 1966–70 0,3 -0,1 0,1 0,3 1966–70 to 1971–75 0,3 -0,1 0,1 0,2 1971–75 to 1976–80 0,3 -0,0 0,1 0,4 1976–80 to 1981–85 0,2 0,5 0,4 1,1 1981–85 to 1986–90 0,0 0,4 0,4 0,8 1986–90 to 1991–95 0,2 0,6 0,5 1,2 1991–95 to 1996–00 0,0 0,7 0,5 1,3 1996–00 to 2001–05 0,1 0,4 0,7 1,1
Mortality trends for middle-aged and elderly people, 1950–2005 The risks of death for adult men changed relatively little during the years 1950-1980. One can even establish increased mortality for several ages, especially for middle-aged people. One explanation for this trend may be that the balance between nutrition and physical activity, which is crucial for good health, was negatively affected by the changes in the nature of working life and the subsequent move away from physically-demanding work to more sedentary work.
This caused forecasters to allow mortality trends for men to remain unchanged or even to rise in certain alternative scenarios. In hindsight, and given the subsequent large decreases in mortality, this future perspective may seem rather odd but, at the time, it was considered a conceivable evolutionary path for mortality (see, for

The future population of Sweden 2006–2050 Assumptions
Statistics Sweden 57
example, Carlsson et al., 1979). Around 1980, however, mortality among men began to fall sharply and has since fallen by an average of around 2 percent per year for men from middle age to about 80 years old (see Figure 3.15).
For women, mortality fell throughout the period 1950-2005. The annual rate of reduction has averaged between one and two percent. From a forecasting perspective, the different mortality trend for women was assumed to be of a temporary nature. It was assumed that declines in the mortality of women would subside and that the curves for men and women would then become closer. Gender differences have indeed diminished but this is because declines in mortality have been greater for men than women over the last 20 years.
Among those over 85 years of age, annual declines in mortality have been relatively low for both men and women. It may be added that, in recent years, significant fluctuations in mortality have been observed due to bouts of influenza. Over the last 2 years, however, the number of deaths has been very low among those aged 80 to 95. This has affected the life expectancy measured for these ages. This phenomenon will be addressed later in the new forecast assumption.
During the last 10 years the rate of decline in mortality for upper middle-aged women has subsided slightly.
Causes of declining mortality after 1980 The rising mortality observed for men up until the end of the 1970s was caused by an increase in mortality due to cardiovascular disease and cancer. This increase in mortality due to cardiovascular disease was not observed for women. However, a weak tendency towards an increase in mortality due to ischemic diseases among middle-aged women and a relatively substantial increase in mortality from lung cancer were observed. Total mortality nevertheless fell, albeit at a lower rate. Different dietary habits between men and women may account for the discrepancy in mortality trends observed during this period. A report from the Swedish National Food Administration (Becker et al., 1994) highlights differences between men and women's diets over several decades (1950-1990). The surveys indicate that women have, to a certain extent, had better eating habits than men. Another factor which is seldom mentioned is that urbanisation may have affected mortality trends. The migration from rural to urban areas has meant

Assumptions The future population of Sweden 2006–2050
Statistics Sweden 58
that women left regions with higher mortality to take up residence in regions with lower mortality (from the 1920s to the 1960s6). For men, the mortality relation was the inverse: men moved to regions with higher mortality (Demographic reports 1992:3).
Changing lifestyles contributed to breaking this trend in the 1980s and yielded a sharp decline in mortality for both men and women. A number of scientific studies of the different risk factors for cardiovascular disease contributed to a greater understanding of the importance of lifestyle for health. The information on risk factors which conveyed by public authorities and the mass media has likely been important. It is probable that, since the 1970s, the general public's knowledge of the different health risks has changed radically.
For men, the percentage of daily smokers has been falling since the late 1970s and this has had a significant effect on the development of both cardiovascular disease and cancer. Fat-reduced food and increased exercise have likely been significant in terms of diminished cardiovascular disease. The consumption of alcohol has also fallen during this period.
The causes of reduced mortality in women over the last 20 years have presumably been the same for men with one significant exception. The percentage of smokers has continued to successively increase among older women. This is because more women in the younger generations are smokers. Despite this, mortality due to cardiovascular disease has fallen but mortality from lung cancer, which is more specifically dependent on smoking habits, has continued to rise.
In conclusion, it is important to note that medical treatments for cardiovascular disease have improved greatly and that this has played a significant role in reducing the risk of death associated with these diseases. One simple indicator of this change is that mortality due to cardiovascular disease (heart attacks) has sunk at a far greater rate than the incidence of the disease. One study pertaining to the early 1980s showed that approximately 30 percent of the decline in mortality due to heart attacks could be attributed to medical improvements (Hammar et al. 1992). The study concerned middle-aged men in Stockholm county.
6 The merging of municipalities meant that sparsely populated areas were incorporated into urban areas during the 1960s. The concept of a city thus lost its meaning as a classification within statistics.

The future population of Sweden 2006–2050 Assumptions
Statistics Sweden 59
Figure 3.12 Number of daily smokers by age and sex, 1981–20031). Percent
0
10
20
30
40
1980 1985 1990 1995 2000
Percent Women
45-54 år55-64 år
65-74
75-84 år
Year
0
10
20
30
40
1980 1985 1990 1995 2000
Percent Women
35-44
25-34
16-24
Year
0
10
20
30
40
1980 1985 1990 1995 2000
Percent Men
45-54
55-64
65-74 år
75-84
0
10
20
30
40
1980 1985 1990 1995 2000
Percent Men
35-44
25-34
16-24
Year Year 1) Moving average (3 years) Source: Living Conditions Survey (LCS, Statistics Sweden)
Future mortality trends The improvements in both living conditions and medical treatments in a variety of areas has, as mentioned previously, been an underlying factor the downturn in mortality in recent decades. The assessment made in this forecast of future developments is roughly the same as in the previous forecast made three years ago, involving a continuing decline in mortality7.
There are several positive indications of future improvements in living conditions and lifestyle as well as continued improvements in medicine. General health awareness has increased in several areas in recent decades and we presume that this will continue into the future. We know, for example that fewer young people are taking 7 The forecasts for the intervening years, 2004-2050 and 2005-2050, have maintained the same risk of death as the 2003-2050 forecast. For purposes of this report, the previous forecast refers to the 2003-2050 forecast unless otherwise indicated (Demographic reports 2003:4).

Assumptions The future population of Sweden 2006–2050
Statistics Sweden 60
up smoking, the proportion of smokers among men is falling and more people are exercising regularly during their leisure time. These are all factors which are significant for health and life expectancy.
At the same time however there are lifestyle factors which are the cause of some concern. Although smoking is currently declining among young people, there is a large difference between the smoking habits of older and middle-aged women. Today relatively few older women smoke or have smoked. The number of women who have smoked or are smokers will increase somewhat during the forecast period for certain ages. Increasing proportions of overweight and obese people in the population have also been noted in recent years8.
In the last forecast, 2003-2050, (Demographic reports 2003:4), certain simple calculations related to the significance of changes in lifestyle factors such as smoking, exercise and the incidence of obesity were made with the help of data from Statistics Sweden's Living Conditions Survey (LCS). For men, the combination of a lower proportion of daily smokers and a greater number who exercise regularly yielded a positive effect, which was somewhat dampened by an increase in the proportion of overweight and obese people. For women, increased exercise offset some of the negative factors. The above observations on exercise, smoking and obesity apply primarily to middle-aged and older people.
Even if no further significant changes in lifestyle were to occur, those that have already taken place effect the evolution of mortality among younger generations over the remaining course of their lives, assuming that the changes of the 1980s and 1990s are lasting (better nutritional awareness, regular exercise, fewer daily smokers, etc.). A longitudinal effect on mortality can thus be derived for any given age.
There are also clearly negative factors which are mainly relevant for younger people. The increased stress of working life, particularly the kind which the individual has little or no chance to affect, may show itself to have serious health consequences in the future. Alcohol consumption has increased in recent years and this may
8 The increased proportion of overweight and obese people and the increase in regular exercise are somewhat contradictory; this alludes to differences in the evolution of trends across groups within society (for example, differences between socio-economic groups). There is also a tendency towards more sedentary activity in everyday life, particularly among children (computers, TV games, etc.).

The future population of Sweden 2006–2050 Assumptions
Statistics Sweden 61
over time have significance on alcohol-related mortality9. A better organisation of work with increased flexibility in how work is done along with improved health information may offset these factors.
Medical progress has led to reduced mortality. On the medical front, continuing positive developments are likely and this progress may contribute to both a better quality of life and increased life expectancy. Significant developments have taken place with respect to the treatment of cardiovascular diseases. Within the area of cardiac surgical procedures, the number of bypass operations as well as angioplasties has increased. Better treatment for sufferers of myocardial infarctions is also essential. General medical treatment within this area has improved through the use of blood pressure treatments and anti-cholesterol agents. In terms of cancer diseases, more and more lives are being saved through early detection and improved treatment methods. Such medical developments are assumed to continue into the future.
Another important area is genetics and biotechnology. We have yet but seen the beginning of the changes that these techniques will bring about. Drug manufacturing, diagnostics and treatments based on this area of research are increasing and will continue to rise.
Nevertheless, it must be acknowledged that the more serious diseases that are cured, the greater will be the proportion of elderly people with previously (although cured) vitality-reducing diseases. This can negatively affect mortality trends at the upper ages. It should be noted that Sweden has one of the oldest populations in the world, i.e. a population with one of the highest proportions of very old people. Influenza epidemics thus affect the number of deaths from year to year.
Mortality due to influenza Influenza usually emerges during the December to March period. Among older people with poorer immune defence systems, a bout of flu can have serious consequences. Excess mortality among the elderly during the six months of winter is largely due to influenza. Influenza can lead to complications such as pneumonia and stroke and it is mainly these complications which in turn lead to greater mortality among the elderly during flu epidemics.
9 The effect of the increase in drug abuse and other substance abuse may also be significant.
Assumptions The future population of Sweden 2006–2050
Statistics Sweden 62
The spread of influenza and the severity with which it afflicts the population varies from year to year. On occasion, influenza has been widespread and caused many deaths. The Spanish Flu - the influenza pandemic of 1918-1919 - is the most extreme example. The Hong Kong Flu and the Asian flu are examples of outbreaks occurring during more recent decades10. The beginning of the twenty-first century saw a number of significant influenza periods but outbreaks over the last 3 years have been less significant and have afflicted fewer people. The effects of influenza on mortality since 2003 have therefore been small. The number of annual deaths averages some 93 000. In 2004 and 2005, the number of deaths in Sweden totalled about 91 000 and 92 000 respectively.
Vaccination against influenza provides some protection against becoming ill and those who catch the flu despite vaccination have milder symptoms and fewer complications. Research on more effective vaccines for the elderly is ongoing. The effect of flu vaccinations on mortality is not entirely clear. Certain studies reveal very significant downturns in mortality, up to one half of the mortality among the elderly. Other studies show more modest effects (Simonsen, 2005).
In recent years the influenza vaccine has gained increasing attention and many county councils now subsidise vaccination of the elderly and members of other groups at risk. The Swedish Institute for Infectious Disease Control (SMI) recommends that the aforementioned groups are vaccinated. Today about half of those aged 65 and above in Sweden get vaccinated (Lindberg, 2005).
Summary of current development trends:
Positive factors: - Smaller proportion of smokers - Increased exercise levels - Better nutrition awareness - Cohort effects of previous positive lifestyle changes - Medical progress
Negative factors: - Greater proportion of smokers among older women - Increased stress - Increased alcohol consumption 10 Possible pandemics such as the Avian Flu and its effects on a population cannot be assessed in this context.

The future population of Sweden 2006–2050 Assumptions
Statistics Sweden 63
- Greater proportion of people suffering from obesity - Greater proportion of people who have had a severe disease
The factors which we have chosen to discuss here are assumed to be relevant and closely associated with health developments in Sweden. A number of other factors such as socio-economic factors or environmental factors could of course also have been chosen.
There are thus many development tendencies which affect mortality whether positively or negatively. The overall picture however is that mortality for the foreseeable future should fall in varying degrees for the different age groups. In terms of the negative factors, the future lifestyle choices made by young people will be important.
Calculation of future mortality trends With the help of the Lee-Carter model (refer to section on Facts about the statistics), we have estimated parameters for the decline in mortality for the most important ages (41 to 90 years). The estimated parameters with an increased number of observations were roughly consistent with the estimates obtained from the forecast 3 years ago. For this reason, we have retained the assumed, extrapolated changes in mortality from the previous round of forecasting. The 2004 and 2005 forecasts are also based on the same mortality trends for the relevant calendar years (Statistical Reports, Statistics Sweden). There is however one exception. The initial input death risks for the first forecast in 2006 have been adjusted for, among other things, the effects of the increased proportion of elderly vaccinated against influenza.
The relative downturn in mortality is consistent with the results of the Lee-Carter model for the years 2007 to 2015. In the longer term, the continuing reduction in death risks is assumed to be somewhat offset as a result of changes in the composition of causes of death, as was the case in the previous round of forecasting. We should consider that the reduction in mortality which we extrapolate is largely related to the decrease in deaths due to cardiovascular diseases. This cause of death category is therefore extinguished more quickly than other cause of death categories11. The other cause of death categories, which subside more slowly, thus gain in relative significance and result in a slower decrease in total mortality. In line with this de-escalation, we assume that the rate of decrease within
11 The cause of death categories which were studied include cancer, cardiovascular disease, accidents/suicides and other diseases (underlying cause of death).

Assumptions The future population of Sweden 2006–2050
Statistics Sweden 64
each cause of death category remains constant for the entire forecast period.
Forecast assumptions for the first year - 2006 As a starting point, the death risks applied to 2006 in the previous forecast are used as a basis for the assumptions on future mortality trends. These initial risks of death have, however, been adjusted somewhat for both men and women within the age interval 80 to 94 years. The adjustment involves a reduction in mortality of 2 percent for women and 1 percent for men within the age interval12. Adjusting the risks of death for the first year of the forecast means that the effects of the adjustment are implicit in the remaining years of the forecast. The reduction in mortality is justified since we assume that the expansion of the flu vaccination programme in recent years may have contributed to the above-mentioned calculated effect. We have observed a tendency towards lower mortality in these ages during 2004-2005. It must however be remembered that variations in the incidence of influenza yield large sudden changes in the number of deaths from year to year. It is thus very difficult to assess whether it is the influenza effects themselves or the vaccinations which are the cause of the observed effects. The reductions are based on the difference between observed and expected mortality in 2005 for the specified age interval; this difference is then reduced (50 percent) to allow for the possibility that this difference solely reflects the absence of influenza. If this was the case, no adjustment should have been made as influenza varies from year to year. There may of course be other factors to consider, such as improved general healthcare.
12 The de-escalation is 2% for women and 1% for men in the 80 to 94 year age interval. The adjustments are spread out across the front and back ends of the age interval. Declines of 0.5 percent, 1 percent and 1.5 percent in mortality are applied, respectively, to women aged 77, 78 and 79 years; corresponding re-escalations of 1.5 percent, 1 percent and 0.5 percent in mortality are applied, respectively, to women aged 95, 96 and 97 years. For men, the adjustment corresponds to a reduction in mortality of 0.5 percent at 79 years of age and a re-escalation in mortality of 0.5 percent at 95 years of age.
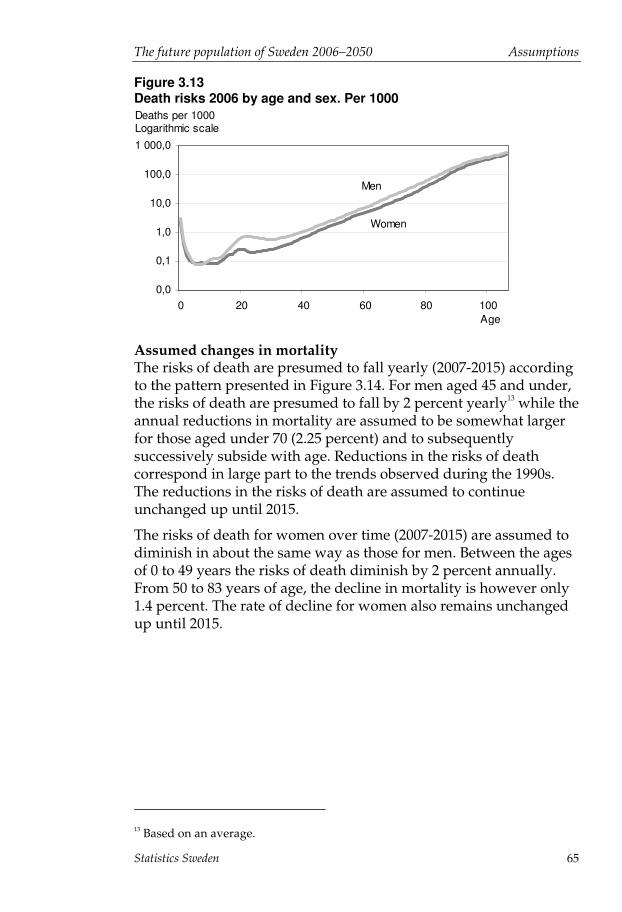
The future population of Sweden 2006–2050 Assumptions
Statistics Sweden 65
Figure 3.13 Death risks 2006 by age and sex. Per 1000
0,0
0,1
1,0
10,0
100,0
1 000,0
0 20 40 60 80 100
Deaths per 1000Logarithmic scale
Age
Women
Men
Assumed changes in mortality The risks of death are presumed to fall yearly (2007-2015) according to the pattern presented in Figure 3.14. For men aged 45 and under, the risks of death are presumed to fall by 2 percent yearly13 while the annual reductions in mortality are assumed to be somewhat larger for those aged under 70 (2.25 percent) and to subsequently successively subside with age. Reductions in the risks of death correspond in large part to the trends observed during the 1990s. The reductions in the risks of death are assumed to continue unchanged up until 2015.
The risks of death for women over time (2007-2015) are assumed to diminish in about the same way as those for men. Between the ages of 0 to 49 years the risks of death diminish by 2 percent annually. From 50 to 83 years of age, the decline in mortality is however only 1.4 percent. The rate of decline for women also remains unchanged up until 2015.
13 Based on an average.
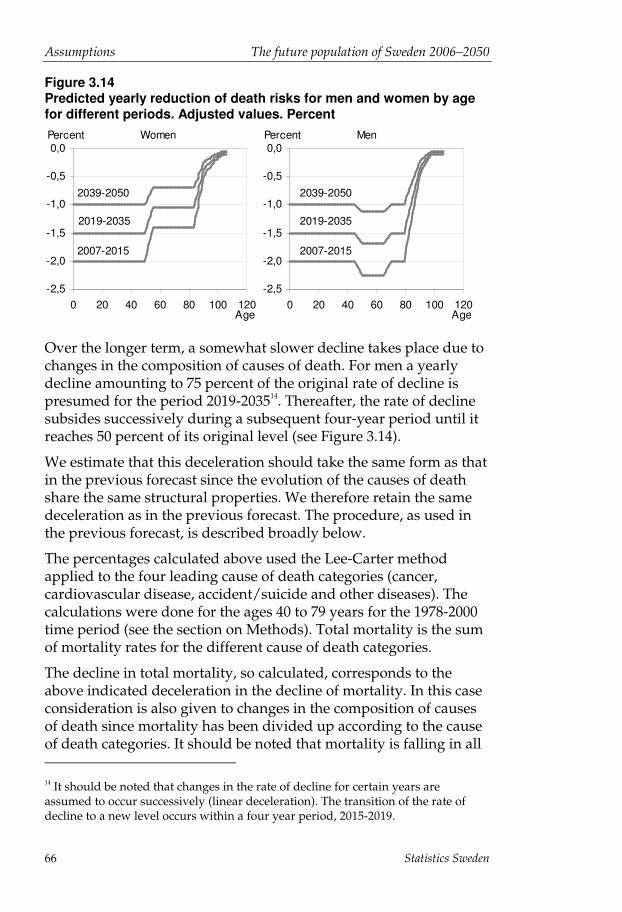
Assumptions The future population of Sweden 2006–2050
Statistics Sweden 66
Figure 3.14 Predicted yearly reduction of death risks for men and women by age for different periods. Adjusted values. Percent
-2,5
-2,0
-1,5
-1,0
-0,5
0,0
0 20 40 60 80 100 120
2007-2015
2019-2035
2039-2050
Percent
Age
Women
-2,5
-2,0
-1,5
-1,0
-0,5
0,0
0 20 40 60 80 100 120
2007-2015
2019-2035
2039-2050
Percent
Age
Men
Over the longer term, a somewhat slower decline takes place due to changes in the composition of causes of death. For men a yearly decline amounting to 75 percent of the original rate of decline is presumed for the period 2019-203514. Thereafter, the rate of decline subsides successively during a subsequent four-year period until it reaches 50 percent of its original level (see Figure 3.14).
We estimate that this deceleration should take the same form as that in the previous forecast since the evolution of the causes of death share the same structural properties. We therefore retain the same deceleration as in the previous forecast. The procedure, as used in the previous forecast, is described broadly below.
The percentages calculated above used the Lee-Carter method applied to the four leading cause of death categories (cancer, cardiovascular disease, accident/suicide and other diseases). The calculations were done for the ages 40 to 79 years for the 1978-2000 time period (see the section on Methods). Total mortality is the sum of mortality rates for the different cause of death categories.
The decline in total mortality, so calculated, corresponds to the above indicated deceleration in the decline of mortality. In this case consideration is also given to changes in the composition of causes of death since mortality has been divided up according to the cause of death categories. It should be noted that mortality is falling in all 14 It should be noted that changes in the rate of decline for certain years are assumed to occur successively (linear deceleration). The transition of the rate of decline to a new level occurs within a four year period, 2015-2019.

The future population of Sweden 2006–2050 Assumptions
Statistics Sweden 67
cause of death categories. For older people in the chosen age interval, the decline in mortality due to cancer and other diseases is nevertheless very small.
The underlying association with the decelerating decline in mortality is not as evident among younger people as it is among older people. Nevertheless, we have allowed younger people to be subject a weaker decline in mortality of the same proportions as older people. The exceptionally large declines observed in causes of death such as accidents and suicides for younger people during the 1990s are not expected to continue to the same extent throughout the entire forecast period.
Summary of mortality trends (1950-2050) The two diagrams below summarize mortality trends from 1950 onwards to 2050. A logarithmic scale has been used. The rate of changes in mortality can thus be compared for different ages. The same inclination of the curves illustrates that the percentage declines in the death risk has been the same.

Assumptions The future population of Sweden 2006–2050
Statistics Sweden 68
Figure 3.15 Mortality rates (deaths per 1000) by age and sex 1950–2005 and assumptions for 2006–2050
Logarithmic scale
0,1
1
10
100
1000
1950 2000 2050
Women
3020
40
50
60
70
80
90
0,1
1
10
100
1000
1950 2000 2050
3020
40
50
60
70
80
90
Men
Year
Higher life expectancy Given the assumed changes in mortality rates, the life expectancy for men is calculated to rise from 78.4 years in 2005 to 83.6 years in 2050 while the corresponding figures for women are, respectively, 82.8 years and 86.3 years. As can be seen from the diagrams below, the increase in life expectancy during the coming 50 years is expected to be slower than that observed during the last 50 years. This is particularly true for women. The remaining life expectancy at 65 years of age is expected to increase from 17.4 years to 20.8

The future population of Sweden 2006–2050 Assumptions
Statistics Sweden 69
years for men and from 20.6 years to 23.0 years for women during the period 2005-2050.
Figure 3.16 Life expectancy at birth 1950–2005 and projection for 2006–2050
60
65
70
75
80
85
90
1950 1970 1990 2010 2030 2050
Year
Expected age
0
Women
Men
Projection
Figure 3.17 Remaining life expectancy at age 65 1950–2005 and projection for 2006–2050
10
15
20
25
1950 1970 1990 2010 2030 2050
Year
Remaining age
0
Women
Men
Projection
Assumptions on mortality trends in selected countries In order to compare assumptions on future mortality trends across countries, the life expectancy according to population forecasts are reported below for a number of countries (Eurostat, 2005. Baseline Scenario). There are significant differences between countries in the

Assumptions The future population of Sweden 2006–2050
Statistics Sweden 70
estimated life expectancy for 2050. The five countries expected to have the greatest life expectancy for men in 2050 have on average estimated an increase of 6.2 years in life expectancy from 2005 to 2050. In Sweden, the life expectancy is expected to increase by 5 years. Sweden however had a very high life expectancy at the outset. The divergence in future mortality trends for women is also large. The increase in life expectancy for women in the five countries with the highest life expectancy in 2050 is 5.4 years. In Sweden, the life expectancy for women is expected to increase by 4 years.
Table 3.4 Life expectancy for women and men 2005 and 2050, projection
Women Men 2005 2050 2005 2050
France 83,6 89,1 Austria 76,4 83,6 Italy 83,3 88,8 Italy 77,5 83,6 Belgium 81,9 88,3 Sweden 78,3 83,3 Spain 83,6 87,9 Great Britain 76,6 82,9 Austria 82,3 87,7 France 76,4 82,7
Ireland 80,9 87,0 Ireland 75,7 82,4 Germany 81,9 86,9 Belgium 75,8 82,3 Luxembourg 81,6 86,7 Germany 76,3 82,0 Great Britain 81,1 86,6 Finland 75,5 81,9 Portugal 81,2 86,6 Cyprus 76,5 81,9
Sweden 82,5 86,5 Malta 76,5 81,8 Finland 82,0 86,5 Luxembourg 75,2 81,6 Slovenia 80,3 85,2 Spain 76,8 81,4 Greece 81,5 85,1 Denmark 75,4 80,9 Cyprus 80,9 85,1 Portugal 74,4 80,4
Malta 80,9 85,0 Greece 76,5 80,3 Poland 78,7 84,4 Netherlands 76,4 80,2 The Czech Republic 79,0 84,1 Slovenia 72,8 79,8 Lithuania 77,7 83,7 The Czech Republic 72,6 79,7 Denmark 79,7 83,7 Poland 70,7 79,1
Netherlands 80,9 83,6 Bulgaria 69,4 78,2 Hungary 77,0 83,4 Hungary 68,8 78,1 Slovakia 77,9 83,4 Slovakia 69,9 77,7 Estonia 77,0 83,1 Romania 68,5 77,6 Bulgaria 76,1 82,6 Lithuania 66,7 75,5
Latvia 76,3 82,5 Estonia 65,7 74,9 Romania 75,5 82,0 Latvia 65,0 74,3
Source: Eurostat. Baseline scenario 2005–2050
Statistics Sweden's forecast for Sweden 2006 2050 2050
Women 86,3 Men 83,6

The future population of Sweden 2006–2050 Assumptions
Statistics Sweden 71
Alternative assumptions Through the use of alternative assumptions we try, to some extent, to capture the uncertainty in the previously presented main alternative. All alternatives have the same mortality rate in 2006 as the main alternative.
In one alternative assumption with lower mortality, the 1990s trend of declining mortality is assumed to accelerate somewhat and then continue uninterrupted for the duration of forecast period. In addition, somewhat greater yearly reductions in mortality are expected among the most elderly.
Lifestyles, medical care and medical treatments must however be improved beyond the levels that are assumed in the main alternative.
In another alternative with greater mortality, no changes in mortality are assumed to occur in the future. Positive and negative lifestyle factors offset one another. This alternative depicts the base level and how assumptions regarding changes in mortality affect population, that is, a kind of sensitivity analysis.
Life expectancy in the first alternative increases from 78.5 years in 2006 to 87.4 years in 2050 for men and from 82.8 years to 89.8 years for women. In the second alternative, mortality remains constant throughout the period at the 2006 levels (also see Chapter 4).
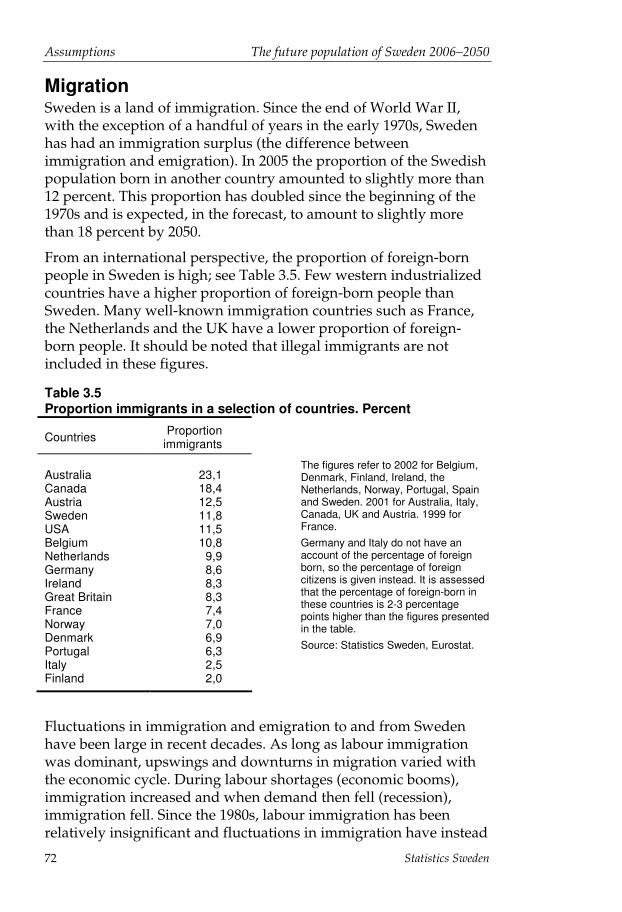
Assumptions The future population of Sweden 2006–2050
Statistics Sweden 72
Migration Sweden is a land of immigration. Since the end of World War II, with the exception of a handful of years in the early 1970s, Sweden has had an immigration surplus (the difference between immigration and emigration). In 2005 the proportion of the Swedish population born in another country amounted to slightly more than 12 percent. This proportion has doubled since the beginning of the 1970s and is expected, in the forecast, to amount to slightly more than 18 percent by 2050.
From an international perspective, the proportion of foreign-born people in Sweden is high; see Table 3.5. Few western industrialized countries have a higher proportion of foreign-born people than Sweden. Many well-known immigration countries such as France, the Netherlands and the UK have a lower proportion of foreign-born people. It should be noted that illegal immigrants are not included in these figures.
Table 3.5 Proportion immigrants in a selection of countries. Percent
Countries Proportion immigrants
Australia
23,1
Canada 18,4 Austria 12,5 Sweden 11,8 USA 11,5 Belgium 10,8 Netherlands 9,9 Germany 8,6 Ireland 8,3 Great Britain 8,3 France 7,4 Norway 7,0 Denmark 6,9 Portugal 6,3 Italy 2,5 Finland 2,0
Fluctuations in immigration and emigration to and from Sweden have been large in recent decades. As long as labour immigration was dominant, upswings and downturns in migration varied with the economic cycle. During labour shortages (economic booms), immigration increased and when demand then fell (recession), immigration fell. Since the 1980s, labour immigration has been relatively insignificant and fluctuations in immigration have instead
The figures refer to 2002 for Belgium, Denmark, Finland, Ireland, the Netherlands, Norway, Portugal, Spain and Sweden. 2001 for Australia, Italy, Canada, UK and Austria. 1999 for France. Germany and Italy do not have an account of the percentage of foreign born, so the percentage of foreign citizens is given instead. It is assessed that the percentage of foreign-born in these countries is 2-3 percentage points higher than the figures presented in the table. Source: Statistics Sweden, Eurostat.

The future population of Sweden 2006–2050 Assumptions
Statistics Sweden 73
come to be gradually dominated by changes in the migration of refugees and family members. The immigration of family members (to foreign-born and native Swedes) has been the cause of the upswing in immigration since the middle of the 1990s.
Figure 3.18 Immigration and emigration 1970–2005 and assumptions for the period up to 2050. Number in thousands
0
20
40
60
80
100
1970 1980 1990 2000 2010 2020 2030 2040 2050
Number in thousands
Immigration
Emigration
Immigration projection
Emigration projection
2005
Both immigration and emigration are assumed to increase in the near future based on increased opportunities for migration due to globalisation (see Figure 3.18). The peak in immigration in 2006 is due to temporary legislation which, according to the Swedish Migration Board's forecasts, will result in an increase of some 12 000 people in the number of residence permits issued during 2006.
Migration to and from Sweden depends on conditions within the country as well as conditions outside of the country. Troubles, war and economic scarcity in different parts of the world are what foremost affect immigration to Sweden today. Swedish migration policy also determines the number who will be allowed to immigrate. The temporary legislation related to appeals for residency (effective between November 2005 and March 2006) is an example of how regulatory changes may have a significant effect on future migration trends.
In the analysis of trends in migration and the projection of future migration a distinction is made between the emigration and the re-immigration of people born in Sweden and the immigration and re-

Assumptions The future population of Sweden 2006–2050
Statistics Sweden 74
emigration of people born outside of Sweden. The forecasting work also considers how immigration and emigration vary between men and women as well as between different age groups.
Forecasting migration Changes in migration are difficult to foresee and may occur without warning. The assumptions in the population forecast naturally reflect the current circumstances and thus serve to document our times. The reasoning outlined below refers to the coming 10 to 20 years. We refrain from speculating on developments thereafter. As previously indicated, migration may vary significantly over time. Assumptions should be considered as average values.
The assessment and making of assumptions related to future migration are indisputably uncertain. The evaluation of previous forecasts shows that assumptions based on long-term trends result in better projections than assumptions based on observations made over a couple of years. It is the observed immigration and emigration of Swedish-born and foreign-born people over the latest three decades which provides the basis for the assumptions made in this forecast.
Greater flows in and out Our assessment of future migration is that we are currently in the midst of an increasing trend in mobility and that an increased flow of both immigration and emigration to and from Sweden will follow. When emigration is proportional to immigration, net migration (the difference between immigration and emigration) is not affected to any high extent. However, we will soon experience a large immigration surplus due to the above-mentioned temporary law on immigration. Thereafter it is assumed that the immigration surplus will stabilise at around 24 000 immigrants per year, including both returning Swedish-born people and immigrating foreign-born people.
Statistics Sweden's historical databases have provided the basis for the forecasting work. It should be noted that there exists both over-coverage and under-coverage in the Population Register as a result of unreported moves to and from Sweden. Over-coverage means that the register includes people who no longer reside in the country. This occurs when people emigrate without reporting it. The opposite is under-coverage which means that the register includes people residing in the country but who are not registered here. For example, this is the case with hidden refugees. In the forecast we

The future population of Sweden 2006–2050 Assumptions
Statistics Sweden 75
disregard measurement errors of this type and the population forecast is thus a projection of the registered population.
If the population statistics improves in terms of moves to and from Sweden via reporting procedures or control routines, for example, then significant changes in the number of immigrants and emigrants may arise. Such potential changes have not been taken into consideration in the forecast work.
Another reservation in terms of Migration Statistics is that they are not entirely comparable across countries. This is because countries have different rules concerning the registration of immigration and emigration.
Regional breakdown A detailed analysis of migration could involve the separate study of the countries of origin of immigrants as well as lands of immigration. Immigration to Sweden however takes place from almost 200 different countries which makes it impossible to handle a country-based analysis. The countries of origin have therefore been divided up into groups: Sweden, the Nordic countries (excl. Sweden), EU (excl. the Nordic countries) and countries with high, medium and low Human Development Index (HDI).
The Nordic countries and EU countries Within the Nordic countries, mobility is free and citizens of these countries have the right to move within the Nordic area without a need for any special permission. EU citizens may be granted a residence permit if they show that they can support themselves. Today the EU consists of the 15 old EU countries as well as the 10 new member states. Sweden was one of the countries which did not introduce transitional regulations intended to limit immigration from the new member states in conjunction with the expansion of the EU.
Other countries Immigration from countries outside of the EU and the Nordic countries is strictly regulated. In principal, one can obtain a residence permit for Sweden by seeking asylum as a refugee or by being the relative of a person who already has a residence permit for Sweden. Regulations concerning who is to be considered a relative have however changed over time and will likely continue to do so in the future. In addition, a small number of people are granted residence permits for Sweden by virtue of the nature of
Assumptions The future population of Sweden 2006–2050
Statistics Sweden 76
their status, e.g., labour immigrants, visiting students or adopted children.
Human Development Index (HDI) In our assumptions concerning future immigration to Sweden from countries outside of the Nordic countries or the EU, we have used UN country divisions based on the Human Development Index (HDI). HDI measures the welfare level of different countries and is based on composite index on life expectancy of the population, Gross Domestic Product (GDP) per capita and educational levels.
Countries outside of the Nordic countries and the EU have been divided up into three groups: Highly-developed countries High Human Development, Medium-developed countries Medium Human Development and Less developed countries Low Human Development. The index is calculated and updated annually by the UN. How countries develop over time is also taken into account. Since HDI depends on the country's development over time, countries can change classification from one year to the next. This projection is based on the HDI for 2003. We opted to use the HDI for 2003 since we needed to compare our calculations to previous forecasts. The methods for calculating HDI are documented in Human Development Report 2002, published by the UN.
The HDI is used to divide countries into different groups because migration patterns are expected to be different based on the country's level of economic development. The migration assumption for the population projection is thus based on the classification of migrants into groups depending on the migrant's country of origin, see below.
In the forecasting model, migration is made-up of four flows: the emigration of Swedish-born people, the re-immigration of Swedish-born people, the immigration of foreign-born persons and the re-emigration of foreign-born persons. Assumptions regarding the immigration of foreign-born persons are presented separately for all groups of countries while assumptions regarding the re-emigration of foreign-born people are presented for the entire group of foreign-born persons. The re-emigration of foreign-born people is based on how the composition of the foreign-born population has changed over time. In general, people who have immigrated from the Nordic countries, EU countries or countries with a high HDI have been more inclined to re-emigrate than people from countries with medium or high HDIs. Since the inclination to re-emigrate depends

The future population of Sweden 2006–2050 Assumptions
Statistics Sweden 77
in part on where one has emigrated from, the population across the different groups of countries changes at different rates.
Country groupings
1. Swedish-born people
2. Nordic countries (excl. Swedish-born). Denmark, Finland, Iceland, Norway
3. EU citizens (excl. citizens of the Nordic countries). EU15 Belgium, France, Greece, Ireland, Italy, Luxembourg, the Netherlands, Portugal, Spain, Great Britain, Northern Ireland, Germany, Austria EU10: Cyprus, Estonia, Latvia, Lithuania, Malta, Poland, Slovakia, Slovenia, the Czech Republic, Czechoslovakia and Hungary
4. High HDI Andorra, Antigua and Barbuda, Argentina, Australia, Bahamas, Bahrain, Barbados, Bosnia-Herzegovina, Brunei Darussalam, Chile, Costa Rica, Gdansk, Hong Kong, Israel, Japan, Yugoslavia, Canada, North Korea, South Korea, Croatia, Kuwait, Liechtenstein, Monaco, New Zealand, Qatar, St. Kitts and Nevis, San Marino, Switzerland, Seychelles, Singapore, Taiwan, Trinidad and Tobago, United Arab Emirates (UAE), Uruguay, USA, Vatican City, Gibraltar, Bermuda, Serbia and Montenegro
5. Medium HDI Albania, Algeria, Armenia, Azerbaijan, Belarus, Belize, Bolivia, Botswana, Brazil, Bulgaria, Cambodia, Cameroon, Cape Verde, China, Columbia, the Comoros, Cuba, Dominica, Dominican Republic, East Timor, Ecuador, Egypt, Equatorial Guinea, El Salvador, Federation of Malaysia (no longer in existence), Fiji, Gabon, Gaza Strip, Georgia, Ghana, Grenada, Guatemala, Guyana, Honduras, India, Indonesia, Information missing, International territory, Iraq, Iran, Jamaica, Jordan, Kazakhstan, Kenya, Kyrgyzstan, Kiribati, Lesotho, Lebanon, Liberia, Libya, Macedonia, Malaysia, the Maldives, Mauritius, Mexico, Micronesia, Moldavia, Morocco, Mongolia, Myanmar, Namibia, Nauru, Nicaragua, Oman, Palau, Palestine, Panama, Papua New Guinea, Paraguay, Peru, the Philippines, Republic of Congo, Republic of Vietnam, Romania, Russia, St. Lucia, St. Vincent and the Grenadines, Solomon Islands, Samoa, Sao Tome and Principe, Saudi Arabia, Soviet Union, Sri Lanka, Stateless, Surinam, Swaziland, South Africa, Syria, Tajikistan, Thailand, Tunisia, Turkey, Turkmenistan, Tuvalu, Ukraine, Under investigation, Unknown, Uzbekistan, Vanuatu, Venezuela, Vietnam, Western Samoa, Zimbabwe and West Bank
6. Low HDI Afghanistan, Angola, Bangladesh, Benin, Bhutan, Burkina Faso, Burundi, Central African Republic, Chad, the Ivory Coast, Democratic Republic of Congo, Djibouti, Eritrea, Ethiopia, Gambia, Guinea, Guinea-Bissau, Haiti, Laos, Madagascar, Malawi, Mali, Mauritania, Mozambique, Nepal, the Niger, Nigeria, Pakistan, Rwanda, Senegal, Sierra Leone, Somalia, Sudan, South Yemen, Tanzania, Togo, Tonga, Uganda, Yemen, Zambia and Zanzibar
Swedish-born people During the 1990s, the number of Swedish emigrants doubled from some 10 000 people per year during the 1970s and 1980s to more
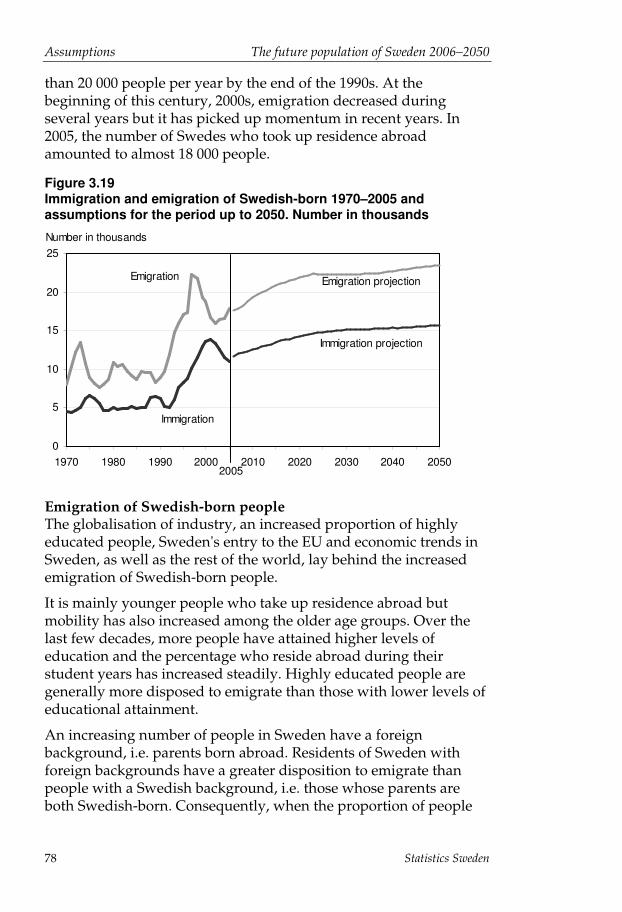
Assumptions The future population of Sweden 2006–2050
Statistics Sweden 78
than 20 000 people per year by the end of the 1990s. At the beginning of this century, 2000s, emigration decreased during several years but it has picked up momentum in recent years. In 2005, the number of Swedes who took up residence abroad amounted to almost 18 000 people.
Figure 3.19 Immigration and emigration of Swedish-born 1970–2005 and assumptions for the period up to 2050. Number in thousands
0
5
10
15
20
25
1970 1980 1990 2000 2010 2020 2030 2040 2050
Number in thousands
Emigration Emigration projection
Immigration
Immigration projection
2005
Emigration of Swedish-born people The globalisation of industry, an increased proportion of highly educated people, Sweden's entry to the EU and economic trends in Sweden, as well as the rest of the world, lay behind the increased emigration of Swedish-born people.
It is mainly younger people who take up residence abroad but mobility has also increased among the older age groups. Over the last few decades, more people have attained higher levels of education and the percentage who reside abroad during their student years has increased steadily. Highly educated people are generally more disposed to emigrate than those with lower levels of educational attainment.
An increasing number of people in Sweden have a foreign background, i.e. parents born abroad. Residents of Sweden with foreign backgrounds have a greater disposition to emigrate than people with a Swedish background, i.e. those whose parents are both Swedish-born. Consequently, when the proportion of people

The future population of Sweden 2006–2050 Assumptions
Statistics Sweden 79
with foreign backgrounds increases in the population then emigration may also be expected to increase.
The emigration of Swedish-born people varies to a great degree with economic trends within Sweden and the rest of the world. Emigration increases during economic recessions and decreases during booms.
Assumptions on the emigration of people born in Sweden Our assessment is that the emigration of people born in Sweden will increase in the future. Globalisation, the increased proportion of highly-educated people and the fact that more and more people choose to study and work abroad have lead to increased mobility. Sweden's membership in the EU will also likely lead to continued increased mobility, as will the growing number of Swedish-born people with foreign backgrounds.
For forecast purposes, we have assumed that the age-specific risks of emigration will rise by 2 percent per year up until and including 2010 and thereafter by 1 percent up until 2023.
Figure 3.20 Emigration rates for Swedish-born in the assumption for 2006. Proportion of women and men assumed to emigrate by age. Percent
0
0,1
0,2
0,3
0,4
0,5
0,6
0,7
0,8
0 10 20 30 40 50 60 70 80 90
Sw edish-bornw omenSw edish-born men
Percent
Age Figure 3.20 presents the age-specific risks of emigration on which the 2006 forecast for men and women born in Sweden is based. As indicated in the diagram, women are assumed to be more disposed to emigration when aged between 18 and 32 years while men are more disposed to emigration when older.

Assumptions The future population of Sweden 2006–2050
Statistics Sweden 80
The risks are based on emigration for the period 2001-2005. These risks have been calculated up by 2 percent for women and 8 percent for men. This corresponds to the emigration observed for 2005. The distribution can thus be said to be an average for the period 2001-2005 while the level corresponds to that observed in 2005.
Re-immigration of Swedish-born people The re-immigration of Swedish-born people depends largely on previous emigration. The proportion of Swedish-born people who gradually return to Sweden was previously around two-thirds. This pattern has changed given that emigration among Swedish-born people rose during the 1990s. Re-immigration now occurs at a faster rate. The proportion who return to Sweden within one to two years has increased sharply. Figure 3.21 shows that almost 60 percent of those who emigrated during the late 1990s re-immigrated within 5 years. Previously, this proportion was stable at around 40 percent.
Figure 3.21 Proportion return migration 3, 5, and 10 years after emigration. Women and men born in Sweden. Percent
0
20
40
60
80
1970 1975 1980 1985 1990 1995 2000 2005
Percent
Return after 3 years
Return after 5 years
Return after 10 years
Year of emigration This changed pattern in the re-immigration of Swedish-born people emerged during the late 1990s. It is not yet possible to determine whether this will have long-term effects on the proportion who re-immigrate. The fact that an increasing number of young people take up residence abroad and that it is now more common to spend a part of one's student years abroad seems to indicate that this may indeed represent a change in behaviour. It is also possible that in

The future population of Sweden 2006–2050 Assumptions
Statistics Sweden 81
recent years re-immigration has tended to more closely follow the economic cycle than previously.
Assumptions on the re-immigration of Swedish-born people With the increased globalisation of business, a rise in international student exchanges and a larger proportion of Swedish-born people having foreign backgrounds, it is likely that a greater number of people will take up residence abroad for shorter periods of time. In the forecast model, we have assumed that the re-immigration of Swedish-born people will occur at a faster pace than earlier based on the adoption of a pattern which fits that observed during the period 1990-2005.
Figure 3.22 Assumptions of age distribution among Swedish-born women and men who have return-migrated. Percent
0,0
0,5
1,0
1,5
2,0
2,5
3,0
3,5
0 10 20 30 40 50 60 70 80 90
Sw edish-born w omen
Sw edish-born men
Percent
Age
Foreign-born people in Sweden In 2005, people born in Poland, Denmark and Iraq accounted for the three largest groups of immigrants. For several years during the 1990s, there was a large wave of immigration as a result of the war in the former Yugoslavia. In the coming years, we will again see increased immigration, this time due to the temporary legislation introduced in 2005. We will also likely experience increased immigration from the new EU member states.

Assumptions The future population of Sweden 2006–2050
Statistics Sweden 82
The temporary legislation related to applications for residency On November 9th, the Riksdag (Swedish Parliament) passed a temporary law giving people previously denied residency a new chance of applying for residency. The law came into effect on 15 November 2005 and remained in effect until 30 March 2006.
The purpose of the law was to provide an opportunity for people whose residency had been denied but deportation not yet enforced, to stay in Sweden in cases of:
- long residence in Sweden or
- great difficulty in enforcing prior decisions due to the person's country of origin.
The law called attention to the need to give special consideration to the circumstances of children and families.
By 31 March 2006, the Swedish Migration Board had registered close to 30 000 such cases. Sixteen thousand cases had been handled and some 12 000 residence permits granted, mostly permanent residence permits.
The Swedish Migration Board estimates that this legislative change will result in some 14 000 to 16 000 people being granted residency. Moreover, according to the Swedish Migration Board, the granting of this large number of residence permits will further generate subsequent immigration and several thousand new related immigration cases.
From Statistics Sweden's perspective, the effect of the temporary law is a temporary increase in the number of immigrants in 2006 by 12 000 people and more moderate increases for a few years thereafter. The legislative changes also account for the increase in the number of immigrants in 2005. Source: 2005/06 SfU5 and the Swedish Migration Board, 2006).
While the immigration of foreign-born people has increased in recent decades, the number of those re-emigrating has remained relatively constant. Re-emigration has not increased at the same pace as immigration since current immigration consists mainly of refugees and their relatives. Those who immigrate as refugees or the relatives of refugees are naturally less inclined to re-emigrate than those who immigrate as labour immigrants or visiting students. The immigration surplus of foreign-born people has thus increased during the last decades.

The future population of Sweden 2006–2050 Assumptions
Statistics Sweden 83
Figure 3.23 Immigration and emigration of foreign-born 1970–2005 and assumptions for the period up to 2050. Number in thousands
0
10
20
30
40
50
60
70
80
1970 1980 1990 2000 2010 2020 2030 2040 2050
Number in thousands
Immigration
Emigration projection
Immigration projection
Emigration
2005
Immigration of foreign-born people Assumptions regarding the number of foreign-born people who will immigrate to Sweden in the future are determined exogenously, i.e., outside the scope of the model. On the basis of the monitoring of world events and reference group discussions, we have drawn up assumptions on how immigration from the different regions (country groupings) will develop over the next few years. The assumptions for the different country groupings are collated and an age and sex distribution for the entire population of foreign-born immigrants is then calculated.
The Nordic countries (excluding Sweden) From the post-war period until the end of the 1970s, the Swedish labour market was attractive and immigration to Sweden from the Nordic countries rose. The immigration of Nordic people then settled on a low level except for in 1988-1990 when a brief period of labour immigration was seen. The upswing noted in recent years is largely due to lower housing costs in Sweden than in neighbouring countries. Another contributing factor is the opening of the Oresund Bridge. Many Danish people have moved over the water from Copenhagen and its surrounding areas to Skåne county.

Assumptions The future population of Sweden 2006–2050
Statistics Sweden 84
Assumptions on immigration from the Nordic countries
It is likely that immigration from the other Nordic countries will reach a somewhat higher level than it did in the 1990s during the Swedish labour market crisis. Another reason for a somewhat higher level of immigration is the greater commuting opportunities between Denmark and Sweden offered by the Oresund Bridge. Immigration from the Nordic countries averaged slightly over 6 000 people per year during the 1990s and slightly over 9 000 per year for the 2000 to 2005 period. We presume that immigration will rise to 10 000 immigrants per year.
EU25 (excluding the Nordic countries) In 1995 Sweden became a member state of the EU and citizens of other EU countries were conferred greater opportunities to take up residence in Sweden. That same year, immigration from the EU15 countries totalled about 5 000 people per year. Immigration has since risen and reached just under 10 000 people in 2004. In 2005 there were just under 11 000 immigrants from the EU, an increase due to the expansion of the EU.
The new EU member states On 1 May 2004 the EU was enlarged with ten new countries: Cyprus, Estonia, Latvia, Lithuania, Malta, Poland, Slovakia, Slovenia, the Czech Republic and Hungary. Prior to the admission of these countries there were concerns that immigration from these countries would rise drastically and most member states therefore introduced transitional regulations for such immigration. Sweden, Ireland and the UK were the only countries not to introduce any transitional regulations.
The immigration surplus from EU10 countries to Sweden has risen since the inclusion of these countries in the EU but the increase has been smaller than expected and the initial levels were very low.
The new candidate member states At the time of the writing of this report, there were five candidate countries for EU membership15.
15 Bulgaria, Croatia, Macedonia, Romania and Turkey. Bulgaria and Romania have concluded their negotiations for EU membership and are to be admitted, in accordance with their Association Agreements. Croatia and Turkey began negotiating their candidacy for EU membership at the end of 2005. It has previously been made clear that Turkey may not be granted membership until 2014 or thereafter. Croatia applied for membership in 2003. Negotiations with respect to Croatia's membership were re-opened in October 2005. Macedonia applied for

The future population of Sweden 2006–2050 Assumptions
Statistics Sweden 85
The impact of the admission of these countries into the EU on Swedish migration flows is unclear. Immigration to Sweden from the former Yugoslavia has been large and those who immigrated during the war have for the most part stayed in Sweden. The fact that there is already a large population from the former Yugoslavia may mean that many people will strive to come to Sweden.
Assumptions on immigration from EU Member States In Statistics Sweden's 2003 forecast, it was assumed that Sweden would experience a quick increase in the number of EU immigrants as a result of the expansion of the EU. The observed increase was smaller than expected in the years right after the expansion but has gradually continued to grow. We assume here a continued temporary increase from the 2005 levels of 11 000 to 12 000 immigrants per year up to and including 2008. Immigration from the EU subsequently is expected to settle at a constant level of 10 000 immigrants per year.
High HDI The largest countries in this group are Serbia, the USA, Bosnia-Herzegovina and Chile. Disturbances in the Balkans at the beginning of the 1990s resulted in large waves of immigration during this period. Immigration then settled at between 5 000 and 9 000 immigrants per year.
Assumptions on immigration from countries with high HDI If regulations concerning labour immigration and the immigration of family members become more liberal then immigration from countries with high HDI will increase. It is also possible that more people from these countries may come to Sweden to study. The projection is based on the 2005 immigration level of 6 500 which is assumed to increase by 1 percent annually until 2015 and then remain constant at 7 500 per year.
Medium HDI This grouping represents the greatest number of foreign-born immigrants to Sweden. The largest countries in this group are Iraq, Thailand, China, Iran, Turkey, India and Russia. Immigration from these countries has been slightly more than 20 000 per year since 2000, a lower level than in the mid 1990s. The highest proportion of
membership in March 2004 and was granted candidate country status in November 2005.
Assumptions The future population of Sweden 2006–2050
Statistics Sweden 86
those who were granted residency under the temporary law is to be found in this grouping.
Troubles in Kosovo and Iraq are possible reasons for continuing flows of refugees. Labour immigration from these countries is also possible.
Assumptions on immigration from countries with medium HDI We assume that 10 000 immigrants will come to Sweden from this country grouping during 2006 as a result of the temporary law. Due to the potential for labour immigration, increased immigration of family members and no reduction in the flow of refugees, we assume a slow rise in immigration from these countries up until 2015, followed by an unchanged level for the rest of the forecast period. The growth in immigration occurs gradually with an assumed rate of growth and then rises from about 20 000 in 2006 (in addition to the 10 000 extra people who immigrated under the temporary law) to 23 000 in 2015.
Low HDI Immigration from countries with low HDI has been minimal but has increased steadily since the end of the 1990s. This immigration has now settled at around 5 000 people a year.
The largest countries with low HDI are Somalia, Pakistan, Afghanistan and Eritrea. The number of refugees from these countries will likely continue to be high in coming years.
Assumptions on immigration from countries with low HDI Due to the large flow of refugees, we assume a slow increase of 1 percent per year up until 2015. We assume the immigration of an additional 2 000 people in 2006, in addition to this, as a consequence of the temporary law. After 2015 we assume an unchanged level of immigration of 6 300 people per year from this grouping of countries.
Assumptions on age and sex distribution In conclusion, it can be said that we assume that the immigration of foreign-born people increases as a result of the same globalisation which leads to people born in Sweden moving away. The development will also be affected by EU expansion and the extent to which labour immigration will be a possibility in the future.
The ageing population means that we may in the future have a shortage of labour in Europe. It can however be expected that there will be hard competition for potential labour immigrants and it is
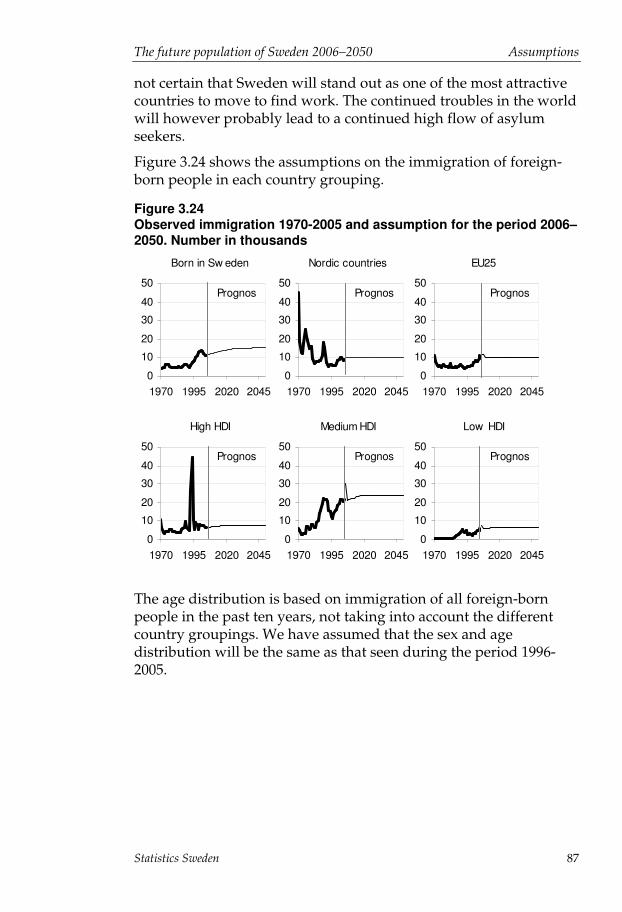
The future population of Sweden 2006–2050 Assumptions
Statistics Sweden 87
not certain that Sweden will stand out as one of the most attractive countries to move to find work. The continued troubles in the world will however probably lead to a continued high flow of asylum seekers.
Figure 3.24 shows the assumptions on the immigration of foreign-born people in each country grouping.
Figure 3.24 Observed immigration 1970-2005 and assumption for the period 2006–2050. Number in thousands
0
10
20
30
40
50
1970 1995 2020 2045
Prognos
Born in Sw eden
0
10
20
30
40
50
1970 1995 2020 2045
Prognos
Nordic countries
0
10
20
30
40
50
1970 1995 2020 2045
Prognos
EU25
0
10
20
30
40
50
1970 1995 2020 2045
Prognos
High HDI
0
10
20
30
40
50
1970 1995 2020 2045
Prognos
Medium HDI
0
10
20
30
40
50
1970 1995 2020 2045
Prognos
Low HDI
The age distribution is based on immigration of all foreign-born people in the past ten years, not taking into account the different country groupings. We have assumed that the sex and age distribution will be the same as that seen during the period 1996-2005.
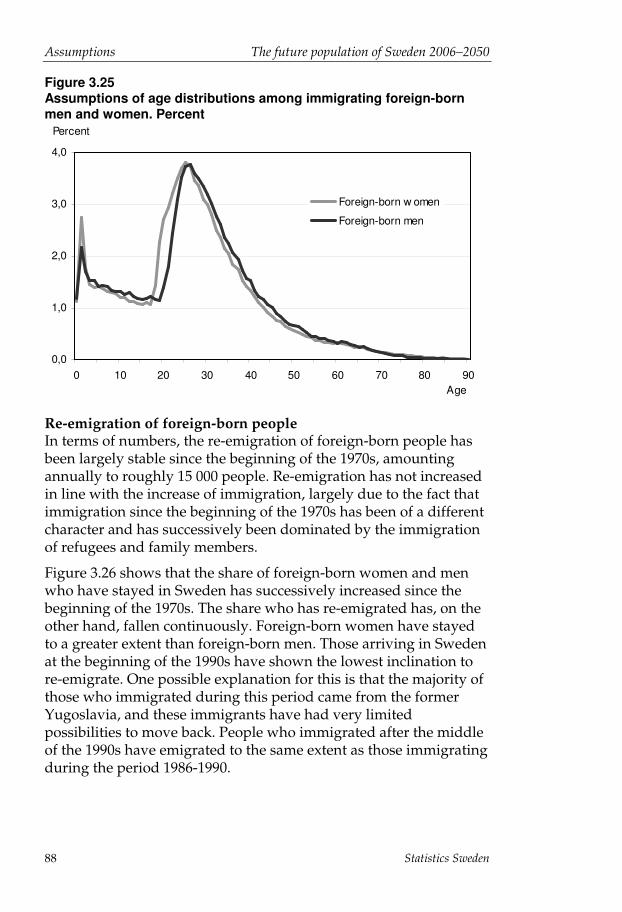
Assumptions The future population of Sweden 2006–2050
Statistics Sweden 88
Figure 3.25 Assumptions of age distributions among immigrating foreign-born men and women. Percent
0,0
1,0
2,0
3,0
4,0
0 10 20 30 40 50 60 70 80 90
Foreign-born w omen
Foreign-born men
Percent
Age
Re-emigration of foreign-born people In terms of numbers, the re-emigration of foreign-born people has been largely stable since the beginning of the 1970s, amounting annually to roughly 15 000 people. Re-emigration has not increased in line with the increase of immigration, largely due to the fact that immigration since the beginning of the 1970s has been of a different character and has successively been dominated by the immigration of refugees and family members.
Figure 3.26 shows that the share of foreign-born women and men who have stayed in Sweden has successively increased since the beginning of the 1970s. The share who has re-emigrated has, on the other hand, fallen continuously. Foreign-born women have stayed to a greater extent than foreign-born men. Those arriving in Sweden at the beginning of the 1990s have shown the lowest inclination to re-emigrate. One possible explanation for this is that the majority of those who immigrated during this period came from the former Yugoslavia, and these immigrants have had very limited possibilities to move back. People who immigrated after the middle of the 1990s have emigrated to the same extent as those immigrating during the period 1986-1990.

The future population of Sweden 2006–2050 Assumptions
Statistics Sweden 89
Figure 3.26 Proportion of foreign-born still living in Sweden. Men and women by year of immigration. Percent
30
40
50
60
70
80
90
100
0 5 10 15 20 25 30 35
1969-1975 1976-19801981-1985 1986-19901991-1995 1996-
Year in Sw eden
0
MenPercent
30
40
50
60
70
80
90
100
0 5 10 15 20 25 30 35
1969-1975 1976-19801981-1985 1986-19901991-1995 1996-
Year in Sw eden
0
WomenPercent
Immigration period:
It is likely that there are demographic explanations for why the re-emigration of foreign-born people has decreased. Refugees and their families are on average older than labour immigrants when arriving in Sweden. Because the inclination to re-emigrate decreases with age, it is likely that the higher age of refugees and family member immigrants has contributed to the fall in re-emigration.
The inclination to emigrate depends to a large extent on the reason for immigration. Individuals who have immigrated from the Nordic countries, EU member states and countries with a high HDI (mainly labour immigrants) have moved back to a higher degree than immigrants from countries with medium HDI and low HDI. Since the beginning of the 1970s, the majority of immigrants have come from countries with medium HDI (primarily refugees and family member immigrants).

Assumptions The future population of Sweden 2006–2050
Statistics Sweden 90
Figure 3.27 Age distribution among immigrating foreign-born women and men in 1970 and 2005. Percent
0,0
0,5
1,0
1,5
2,0
2,5
3,0
0 20 40 60 80 100
Age
Women
1970
2005
Percent
0,0
0,5
1,0
1,5
2,0
2,5
3,0
0 20 40 60 80 100
Age
Men
1970
2005
Percent
Assumptions on re-emigration of foreign-born people The forecast for 2006-2023 assumes that immigration from the Nordic countries, from the EU and from countries with a high HDI will increase slightly but that immigration will in the future be dominated by countries with medium HDI and low HDI. The migration assumptions mean that the composition of the foreign-born part of the population will in the future also largely consist of refugees and family member immigrants.
The age-specified risks of emigration for foreign-born women and men for 2006 are based on emigration during the period 2001-2005. To reach a level comparable to the observed emigration in 2005, the risks for foreign-born men have been calculated up by 2.8 percent while the risks of emigration for foreign-born women have remained unchanged.
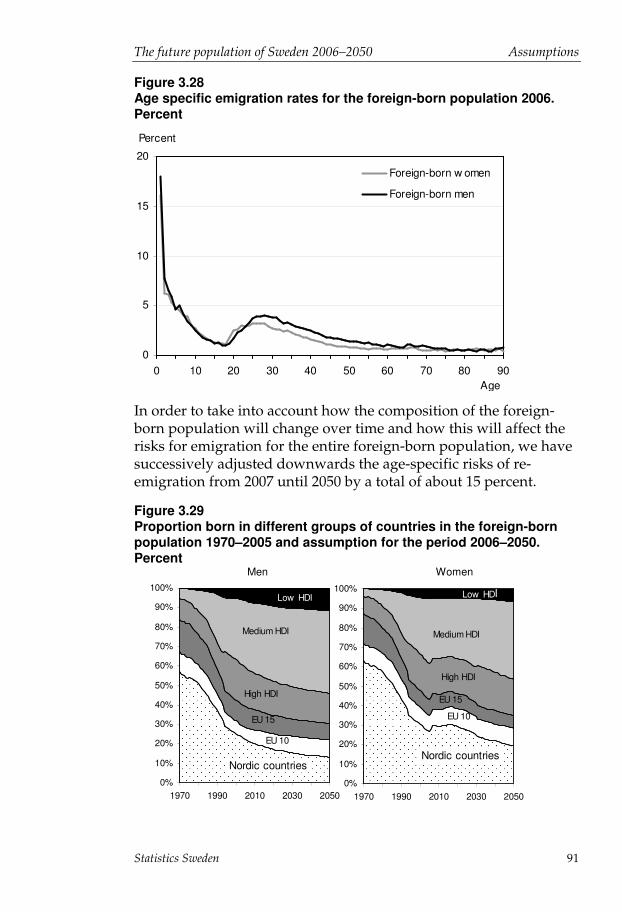
The future population of Sweden 2006–2050 Assumptions
Statistics Sweden 91
Figure 3.28 Age specific emigration rates for the foreign-born population 2006. Percent
0
5
10
15
20
0 10 20 30 40 50 60 70 80 90
Foreign-born w omen
Foreign-born men
Percentt
Age In order to take into account how the composition of the foreign-born population will change over time and how this will affect the risks for emigration for the entire foreign-born population, we have successively adjusted downwards the age-specific risks of re-emigration from 2007 until 2050 by a total of about 15 percent.
Figure 3.29 Proportion born in different groups of countries in the foreign-born population 1970–2005 and assumption for the period 2006–2050. Percent Men Women
0%
10%
20%
30%
40%
50%
60%
70%
80%
90%
100%
1970 1990 2010 2030 20500%
10%
20%
30%
40%
50%
60%
70%
80%
90%
100%
1970 1990 2010 2030 2050
EU 15
Low HDI
Medium HDI
High HDI
EU 10
Nordic countries
Low HDI
Medium HDI
High HDI
EU 15
EU 10
Nordic countries
Assumptions The future population of Sweden 2006–2050
Statistics Sweden 92
Alternative forecasts It is very possible that immigration and emigration will develop differently to how we have predicted. In order to gain an idea of how the future population will be affected by the size of migration flows, two alternatives to the main alternative in Statistics Sweden's population forecast are presented. These alternatives are named the low alternative and the high alternative. The low alternative has low net immigration (immigration minus emigration) and the high alternative has high annual net immigration. The alternatives are presented in Table 3.6.
Low alternative equals low immigration surplus In several countries, it has become much harder to receive a residence permit as a refugee or family member immigrant. If Sweden were to introduce a more restrictive immigration policy, it is reasonable to assume that immigration to Sweden from countries outside the Nordics and the EU would decrease. In the low alternative, we have assumed that immigration from the country groupings with low HDI and medium HDI would decrease from 67 000 to 63 000 in 2006. The differences between the main and the low alternative then increase successively.
In this alternative, we have kept immigration from country groups with high HDI, the Nordic countries and EU25 unchanged. This is because we assess that membership of the EU and the Nordic cooperation agreement will make it hard to limit immigration from these countries.
With a decrease in immigration also comes a decrease in re-emigration. Reduced refugee and family member immigration would however result in the composition of the foreign-born population changing over time from refugee and family member immigration to labour immigration, primarily from the Nordics and the EU25. As labour immigrants have a higher inclination to re-emigrate, re-emigration would increase in the long-term. In the low alternative, we have therefore assumed that the risks for emigration observed today will also apply in the future, in contrast to the main alternative in which the risks for re-emigration decrease.
In the low alternative, we have in addition assumed that emigration of Swedish-born people will continue to develop as in the main alternative. This is because it is possible that emigration will increase in the future, even if Sweden introduces a more restrictive immigration policy.
The future population of Sweden 2006–2050 Assumptions
Statistics Sweden 93
We have assumed in the low alternative that a slightly larger share will move back to Sweden than in the main alternative. The share that has moved back is 5 percent higher in this alternative, a figure based on the average inclination shown to re-emigrate during the period 1990-2005.
In total the assumptions in the low alternative result in a reduction of the immigration surplus from around 24 000 immigrants per year in the main alternative to around 13 000 immigrants per year.
High alternative implies high immigration surplus The high alternative can be seen as a scenario with successively increasing labour immigration from primarily the Nordic countries, the EU and countries with high HDI combined with a largely unchanged immigration from countries with medium and low HDI, compared to the main alternative. In the high alternative, it is assumed that an increase in labour immigration will occur over a longer time period than in the main and low alternatives. Immigration will increase up to 2030 and will thereafter remain at a constant level of around 75 400 people per year.
With an increase in immigration, also comes automatically an increase in emigration. The fact that labour immigrants are more inclined to re-emigrate than other immigrants will lead to the population of foreign-born people, as in the main alternative, becoming dominated over time by refugees and their families, although not to such a large extent as in the main alternative. The inclination to emigrate among the whole foreign-born population is therefore also assumed in this alternative to reduce at the same rate as the change in the composition of that population.
In this scenario, it is assumed that the emigration of Swedish-born people increases but at a lower rate than in the main alternative. The inclination to emigrate among Swedish-born people here increases by 1 percent annually until 2010 and then by 0.5 percent until 2023. It will thereafter remain constant at the 2023 level. The inclination to re-emigrate is assumed to be the same as in the main alternative. The immigration surplus will, in this alternative, amount in the long-term to roughly 36 000 people in total per year. Among foreign-born people, the immigration surplus will be higher, roughly 43 000 people per year.

Assumptions The future population of Sweden 2006–2050
Statistics Sweden 94
Table 3.6 Assumptions of migration in low-, high- and medium alternatives. Number in thousands
Year Immigration Emigration Net migration Low Medium High Low Medium High Low Medium High
Born in Sweden
2006 11,2 11,7 11,7 17,6 17,6 17,6 -6,4 -5,8 -5,8 2010 11,8 12,6 12,3 19,3 19,3 18,5 -7,4 -6,7 -6,3 2015 12,8 13,6 12,9 20,8 20,8 19,6 -8,0 -7,3 -6,7 2020 13,5 14,2 13,3 21,7 21,8 20,1 -8,2 -7,6 -6,9 2030 14,4 15,2 13,8 21,9 22,2 20,4 -7,6 -7,1 -6,5 2050 14,7 15,7 14,8 22,5 23,5 22,1 -7,8 -7,8 -7,4 Born abroad 2006 63,5 67,2 68,9 20,2 20,2 20,2 43,3 46,9 48,7 2010 46,3 54,8 60,6 21,7 22,2 22,5 24,5 32,6 38,2 2015 42,9 56,6 66,5 22,1 23,5 24,5 20,8 33,1 42,0 2020 42,9 56,6 71,4 22,0 24,2 26,3 20,9 32,5 45,1 2030 42,9 56,6 75,4 22,1 24,8 29,1 20,8 31,8 46,3 2050 42,9 56,6 75,4 22,2 25,3 32,1 20,7 31,3 43,2 Total 2006 74,7 78,8 80,7 37,8 37,8 37,8 36,9 41,0 42,9 2010 58,1 67,4 72,9 41,0 41,4 41,0 17,1 25,9 31,9 2015 55,7 70,1 79,4 42,8 44,3 44,1 12,8 25,8 35,3 2020 56,4 70,8 84,6 43,7 46,0 46,4 12,7 24,8 38,3 2030 57,3 71,8 89,2 44,0 47,0 49,5 13,3 24,7 39,7
2050 57,6 72,3 90,1 44,7 48,8 54,2 12,9 23,5 35,9

The future population of Sweden 2006–2050 Alternative projections
Statistics Sweden 95
4 Alternative projections
Introduction It is of course possible that fertility, mortality and migration develop differently to what we have assumed in the main alternative forecast. In this chapter, we therefore illustrate how Sweden's future population will be affected if development differs significantly from what we have previously assumed.
We show calculations below of the development of the future population with alternative assumptions for fertility, mortality and migration. For each component: fertility, mortality and migration, the main alternative has been supplemented with a low and a high alternative (the alternatives are described in more detail in Chapter 3). We have chosen to examine how the size of the population is affected when we vary one factor at a time. This means, for example, that we assume a high and low alternative for the future fertility rate, while the assumptions for mortality and foreign migration remain as in the main alternative.
The three factors, fertility, mortality and foreign migration, affect the age categories in different ways and at different points of time in the future. An adjusted fertility rate directly affects the number of children born although the number of older people is only affected by an adjusted fertility rate in the very long-term.
Different developments in mortality have, on the other hand, only a marginal significance for the future number of children and young people. This is because of the very low mortality risks in general of people of younger ages. In the long-term however a different mortality rate affects the number of people living.
Variations in the assumption on the size of foreign migration primarily affects the population aged between 20 and 40 years as those immigrating and emigrating are most commonly between these ages. The number of children born is successively affected and, in the long-term, also the number of elderly people.

Alternative projections The future population of Sweden 2006–2050
Statistics Sweden 96
Alternative assumptions on the future fertility rate, mortality and foreign migration A summary is given below of the different alternatives for fertility, mortality and foreign migration. The different alternatives are motivated under the relevant section in Chapter 3.
Table 4.1 Fertility (children per woman). Alternative assumption
Year Low fertility Main alternative High fertility
2006 1.70 1.81 1.91 2010 1.64 1.85 2.04 2020 1.65 1.85 2.04 2030 1.65 1.85 2.04 2040 1.65 1.85 2.04 2050 1.65 1.85 2.04
Table 4.2 Mortality (life expectancy in years). Alternative assumption
Year Low mortality Main alternative High mortality Women Men Women Men Women Men
2006 82.8 78.5 82.8 78.5 82.8 78.5 2010 83.5 79.4 83.3 79.2 82.8 78.5 2020 85.2 81.6 84.3 80.8 82.8 78.5 2030 86.9 83.7 85.1 82.0 82.8 78.5 2040 88.4 85.6 85.8 82.9 82.8 78.5 2050 89.8 87.4 86.3 83.6 82.8 78.5
Table 4.3 Net migration in thousands. Alternative assumption
Year Low net migration Main alternative High net migration Im. Em. Net Im. Em. Net Im. Em. Net
2006 74.7 37.8 36.9 78.8 37.8 41.0 80.7 37.8 42.9 2010 58.1 41.0 17.1 67.4 41.4 25.9 72.9 41.0 31.9 2020 56.4 43.7 12.7 70.8 46.0 24.8 84.6 46.4 38.3 2030 57.3 44.0 13.2 71.8 47.0 24.7 89.2 49.5 39.7 2040 57.4 44.2 13.2 72.0 47.9 24.1 89.5 52.2 37.3 2050 57.6 44.7 12.9 72.3 48.7 23.6 90.1 54.2 35.9
Total population change under different scenarios The difference in the total population between the main alternative and the other alternatives increases over time. The alternative with
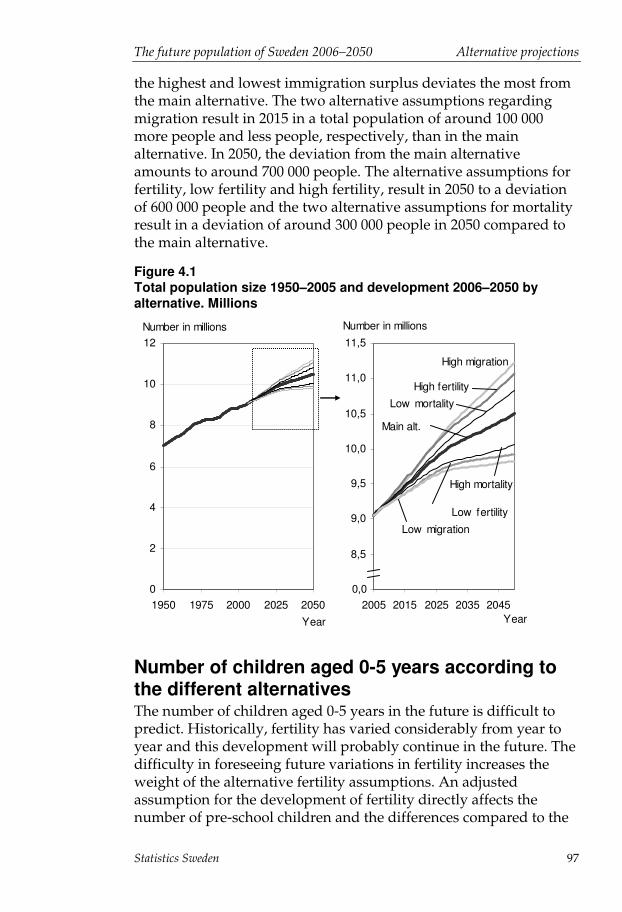
The future population of Sweden 2006–2050 Alternative projections
Statistics Sweden 97
the highest and lowest immigration surplus deviates the most from the main alternative. The two alternative assumptions regarding migration result in 2015 in a total population of around 100 000 more people and less people, respectively, than in the main alternative. In 2050, the deviation from the main alternative amounts to around 700 000 people. The alternative assumptions for fertility, low fertility and high fertility, result in 2050 to a deviation of 600 000 people and the two alternative assumptions for mortality result in a deviation of around 300 000 people in 2050 compared to the main alternative.
Figure 4.1 Total population size 1950–2005 and development 2006–2050 by alternative. Millions
0
2
4
6
8
10
12
1950 1975 2000 2025 2050Year
Number in millions
8,0
8,5
9,0
9,5
10,0
10,5
11,0
11,5
2005 2015 2025 2035 2045Year
High migration
High fertilityLow mortality
Main alt.
High mortality
Low fertility
Low migration
0,0
Number in millions
Number of children aged 0-5 years according to the different alternatives The number of children aged 0-5 years in the future is difficult to predict. Historically, fertility has varied considerably from year to year and this development will probably continue in the future. The difficulty in foreseeing future variations in fertility increases the weight of the alternative fertility assumptions. An adjusted assumption for the development of fertility directly affects the number of pre-school children and the differences compared to the

Alternative projections The future population of Sweden 2006–2050
Statistics Sweden 98
main alternative increase quickly with time. The alternative fertility assumptions result already in 2015 in a deviation from the main alternative of 70 000 children and, in 2050, this figure is 120 000 children compared to the main alternative. The alternative assumption for migration also affects the calculations on the future number of children in the long-term. In 2015, the deviation from the main alternative is 10 000 children, growing in 2050 to 60 000 more children or less children respectively. The alternative assumption for future mortality only marginally affects the number of children aged 0-5 years.
Figure 4.2 Population in age 0–5 by sex 1950–2005 and development 2006–2050 by alternative fertility and migration assumptions. Thousands
250
300
350
400
450
1950 1975 2000 2025 2050
Main
High
Low
Number in thousands
Girls
0
Year
250
300
350
400
450
1950 1975 2000 2025 2050
Main
High
Low
Number in thousands
Boys
0
Year
Fertility Migration
Number of children of school age, 6-15 years, according to the different alternatives. In the short-term, the number of children of school age is not affected by the alternative assumptions for fertility. Migration also has a minimal effect. In 2015, the alternative assumptions for fertility give only a marginal deviation of around 30 000 children compared to the main alternative and the alternative assumptions for migration give an even smaller deviation. In the long-term however the deviations can be more significant. In 2050, the alternative assumption for fertility will result in a deviation of around 160 000 children while the alternative assumptions for
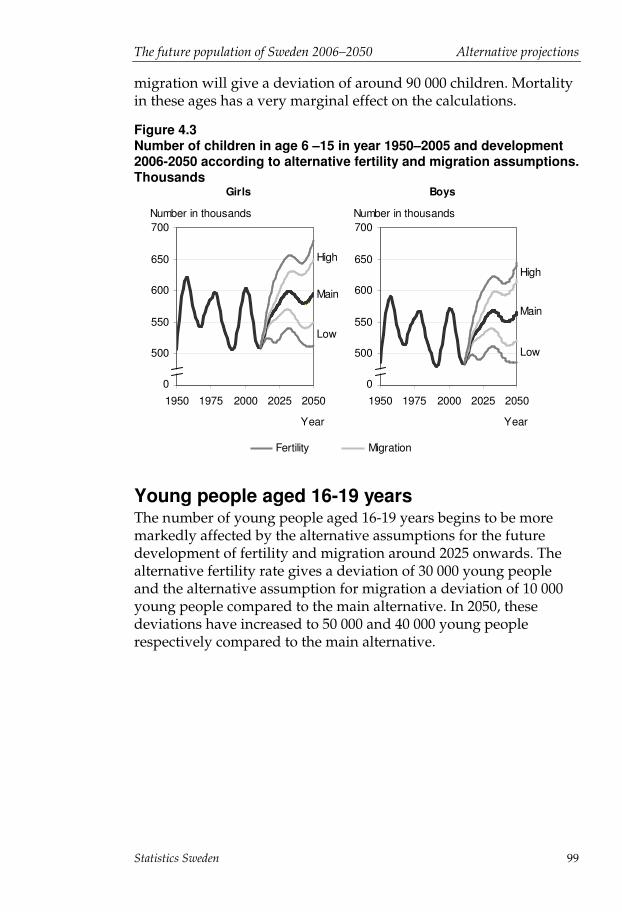
The future population of Sweden 2006–2050 Alternative projections
Statistics Sweden 99
migration will give a deviation of around 90 000 children. Mortality in these ages has a very marginal effect on the calculations.
Figure 4.3 Number of children in age 6 –15 in year 1950–2005 and development 2006-2050 according to alternative fertility and migration assumptions. Thousands
450
500
550
600
650
700
1950 1975 2000 2025 2050
Main
High
Low
Number in thousands
Girls
0
Year
450
500
550
600
650
700
1950 1975 2000 2025 2050
Main
High
Low
Number in thousands
Boys
0
Year
Fertility Migration
Young people aged 16-19 years The number of young people aged 16-19 years begins to be more markedly affected by the alternative assumptions for the future development of fertility and migration around 2025 onwards. The alternative fertility rate gives a deviation of 30 000 young people and the alternative assumption for migration a deviation of 10 000 young people compared to the main alternative. In 2050, these deviations have increased to 50 000 and 40 000 young people respectively compared to the main alternative.
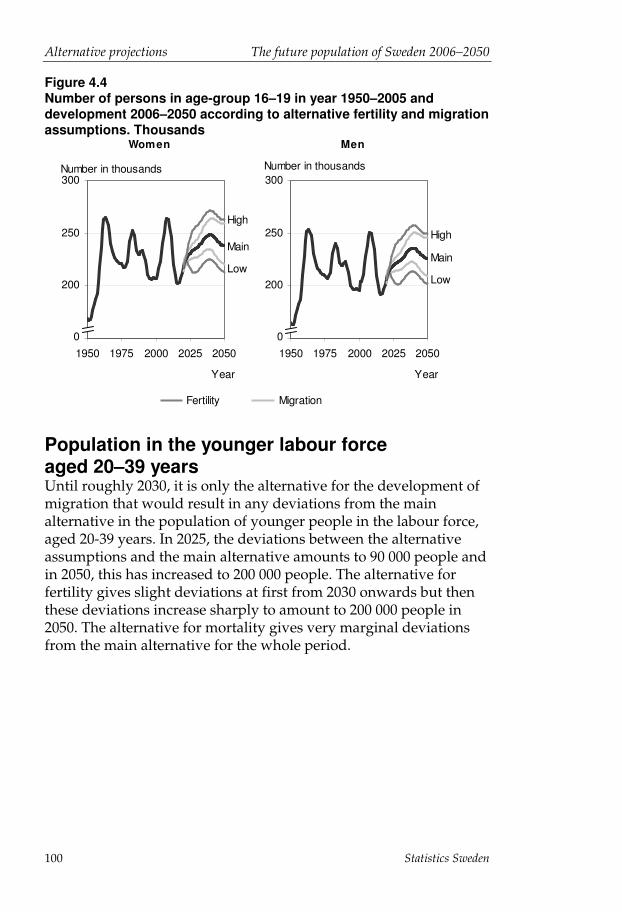
Alternative projections The future population of Sweden 2006–2050
Statistics Sweden 100
Figure 4.4 Number of persons in age-group 16–19 in year 1950–2005 and development 2006–2050 according to alternative fertility and migration assumptions. Thousands
150
200
250
300
1950 1975 2000 2025 2050
Main
High
Low
Number in thousands
Women
0
Year
150
200
250
300
1950 1975 2000 2025 2050
Main
High
Low
Number in thousands
Men
0
Year
Fertility Migration
Population in the younger labour force aged 20–39 years Until roughly 2030, it is only the alternative for the development of migration that would result in any deviations from the main alternative in the population of younger people in the labour force, aged 20-39 years. In 2025, the deviations between the alternative assumptions and the main alternative amounts to 90 000 people and in 2050, this has increased to 200 000 people. The alternative for fertility gives slight deviations at first from 2030 onwards but then these deviations increase sharply to amount to 200 000 people in 2050. The alternative for mortality gives very marginal deviations from the main alternative for the whole period.
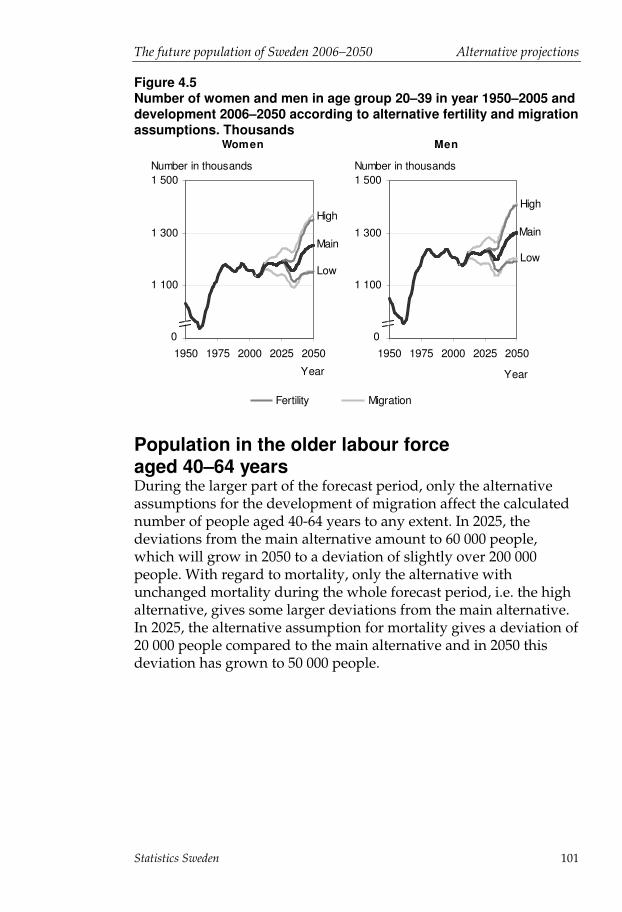
The future population of Sweden 2006–2050 Alternative projections
Statistics Sweden 101
Figure 4.5 Number of women and men in age group 20–39 in year 1950–2005 and development 2006–2050 according to alternative fertility and migration assumptions. Thousands
900
1 100
1 300
1 500
1950 1975 2000 2025 2050
Main
High
Low
Number in thousands
Women
0
Year
900
1 100
1 300
1 500
1950 1975 2000 2025 2050
Main
High
Low
Number in thousands
Men
0
Year
Fertility Migration
Population in the older labour force aged 40–64 years During the larger part of the forecast period, only the alternative assumptions for the development of migration affect the calculated number of people aged 40-64 years to any extent. In 2025, the deviations from the main alternative amount to 60 000 people, which will grow in 2050 to a deviation of slightly over 200 000 people. With regard to mortality, only the alternative with unchanged mortality during the whole forecast period, i.e. the high alternative, gives some larger deviations from the main alternative. In 2025, the alternative assumption for mortality gives a deviation of 20 000 people compared to the main alternative and in 2050 this deviation has grown to 50 000 people.

Alternative projections The future population of Sweden 2006–2050
Statistics Sweden 102
Figure 4.6 Number of women and men in age group 40–64 in year 1950–2005 and development 2006–2050 according to alternative mortality and migration assumptions. Thousands
1 000
1 100
1 200
1 300
1 400
1 500
1 600
1 700
1950 1975 2000 2025 2050
Main
High
Low
Number in thousands
Women
0
Year
High
1 000
1 100
1 200
1 300
1 400
1 500
1 600
1 700
1950 1975 2000 2025
Main
High
Low
Number in thousands
Men
0
Year
HIgh
Mortality Migration
People aged 65-79 years The calculations of the number of people aged 65-79 years is above all affected by the alternative assumptions for mortality and then by the alternative with unchanged mortality for the entire forecast period, i.e. the high alternative. In 2025, the deviation from the main alternative is 60 000 people and in 2050 this deviation has grown to 130 000 people. The alternative assumption for migration has a marked effect on the forecasts first from about 2030 and onwards. In 2050, the difference between the alternative assumption for migration and the main alternative amount to around 50 000 people.

The future population of Sweden 2006–2050 Alternative projections
Statistics Sweden 103
Figure 4.7 Number of women and men in age group 65–79 in year 1950–2005 and development 2006–2050 according to alternative mortality and migration assumptions. Thousands
200
300
400
500
600
700
800
900
1950 1975 2000 2025 2050
Main
Number in thousands
Women
0
Year
200
300
400
500
600
700
800
900
1950 1975 2000 2025 2050
Main
Number in thousands
Men
0
Year
550
600
650
700
750
800
850
900
2010 2020 2030 2040 2050
Main
Number in thousands
0
Year
550
600
650
700
750
800
850
900
2010 2020 2030 2040 2050
Main
Number in thousands
0
Year
Mortality Migration
People aged 80 years and older In the age group 80 years and older, the calculations are affected very marginally by the alternative assumptions for migration. The alternative assumptions for the development of mortality however have a strong penetration in the calculations of the number of "older elderly" people. In the short-term, the effects are already considerable and by 2025, we can see a deviation from the main alternative of between 60 and 70 000 people, rising to around 260 000 people in 2050.

Alternative projections The future population of Sweden 2006–2050
Statistics Sweden 104
Figure 4.8 Number of women and men in age group 80 and older in year 1950–2005 and development 2006–2050 according to alternative mortality and migration assumptions. Thousands
0
100
200
300
400
500
600
700
1950 1975 2000 2025 2050
Main
Low
High
Number in thousands
Women
0
Year
0
100
200
300
400
500
600
700
1950 1975 2000 2025 2050
Main
Low
Number in thousands
Men
0
Year
High
Mortality
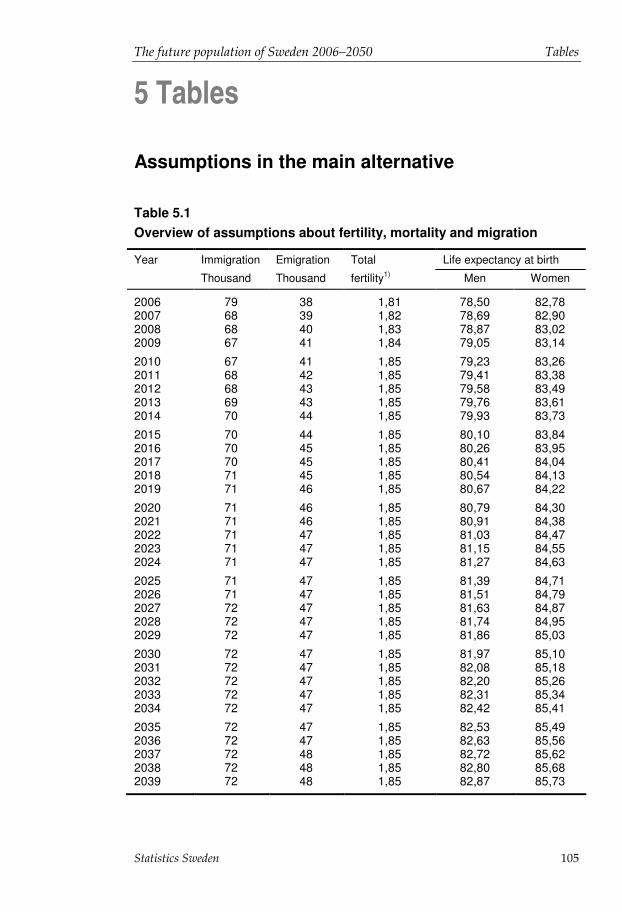
The future population of Sweden 2006–2050 Tables
Statistics Sweden 105
5 Tables
Assumptions in the main alternative
Table 5.1 Overview of assumptions about fertility, mortality and migration
Year Immigration Emigration Total Life expectancy at birth
Thousand Thousand fertility1) Men Women
2006 79 38 1,81 78,50 82,78 2007 68 39 1,82 78,69 82,90 2008 68 40 1,83 78,87 83,02 2009 67 41 1,84 79,05 83,14
2010 67 41 1,85 79,23 83,26 2011 68 42 1,85 79,41 83,38 2012 68 43 1,85 79,58 83,49 2013 69 43 1,85 79,76 83,61 2014 70 44 1,85 79,93 83,73
2015 70 44 1,85 80,10 83,84 2016 70 45 1,85 80,26 83,95 2017 70 45 1,85 80,41 84,04 2018 71 45 1,85 80,54 84,13 2019 71 46 1,85 80,67 84,22
2020 71 46 1,85 80,79 84,30 2021 71 46 1,85 80,91 84,38 2022 71 47 1,85 81,03 84,47 2023 71 47 1,85 81,15 84,55 2024 71 47 1,85 81,27 84,63
2025 71 47 1,85 81,39 84,71 2026 71 47 1,85 81,51 84,79 2027 72 47 1,85 81,63 84,87 2028 72 47 1,85 81,74 84,95 2029 72 47 1,85 81,86 85,03
2030 72 47 1,85 81,97 85,10 2031 72 47 1,85 82,08 85,18 2032 72 47 1,85 82,20 85,26 2033 72 47 1,85 82,31 85,34 2034 72 47 1,85 82,42 85,41
2035 72 47 1,85 82,53 85,49 2036 72 47 1,85 82,63 85,56 2037 72 48 1,85 82,72 85,62 2038 72 48 1,85 82,80 85,68 2039 72 48 1,85 82,87 85,73
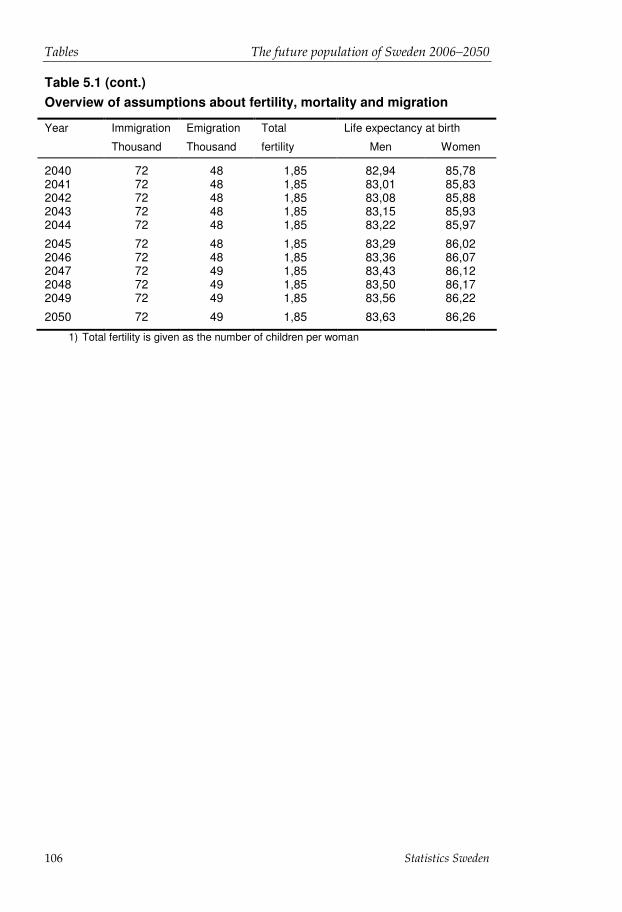
Tables The future population of Sweden 2006–2050
Statistics Sweden 106
Table 5.1 (cont.) Overview of assumptions about fertility, mortality and migration
Year Immigration Emigration Total Life expectancy at birth
Thousand Thousand fertility Men Women
2040 72 48 1,85 82,94 85,78 2041 72 48 1,85 83,01 85,83 2042 72 48 1,85 83,08 85,88 2043 72 48 1,85 83,15 85,93 2044 72 48 1,85 83,22 85,97
2045 72 48 1,85 83,29 86,02 2046 72 48 1,85 83,36 86,07 2047 72 49 1,85 83,43 86,12 2048 72 49 1,85 83,50 86,17 2049 72 49 1,85 83,56 86,22
2050 72 49 1,85 83,63 86,26
1) Total fertility is given as the number of children per woman

The future population of Sweden 2006–2050 Tables
Statistics Sweden 107
Table 5.2 Number of children born per 1000 women by age at end of the year
Age Year
2006 2007 2008 2009 2010 2011 2012 2013–2050
16 1 1 1 1 1 1 1 1 17 3 3 3 3 3 3 3 3 18 6 6 6 6 6 6 6 6 19 11 11 11 11 11 11 11 11
20 21 20 20 20 20 20 20 20 21 31 31 31 31 31 31 31 31 22 38 38 38 38 38 38 38 38 23 49 48 48 48 48 48 48 48 24 60 59 58 58 58 58 58 58
25 75 74 74 73 73 73 73 73 26 88 87 87 87 86 86 86 86 27 103 101 101 101 101 100 100 100 28 119 118 117 117 117 117 116 116 29 132 132 132 131 131 131 130 130
30 139 137 137 137 137 137 136 136 31 142 143 142 141 139 139 139 139 32 138 138 139 139 137 137 137 137 33 129 129 130 132 129 129 129 129 34 116 118 119 119 118 118 118 118
35 100 101 103 105 104 104 104 104 36 82 85 87 88 90 90 90 90 37 65 67 71 71 73 73 73 73 38 51 54 56 58 60 60 60 60 39 37 40 42 42 45 45 45 45
40 27 28 30 31 34 34 34 34 41 18 19 20 22 24 24 24 24 42 12 13 14 15 17 17 17 17 43 8 8 8 9 10 10 10 10 44 4 4 5 5 6 6 6 6
45 2 2 3 3 3 3 3 3 46 1 1 1 1 1 1 1 1 47 0 0 0 0 0 0 0 0 48 0 0 0 0 0 0 0 0 49 0 0 0 0 0 0 0 0
50 0 0 0 0 0 0 0 0
Total 1 808 1 819 1 833 1 844 1 853 1 851 1 850 1 849
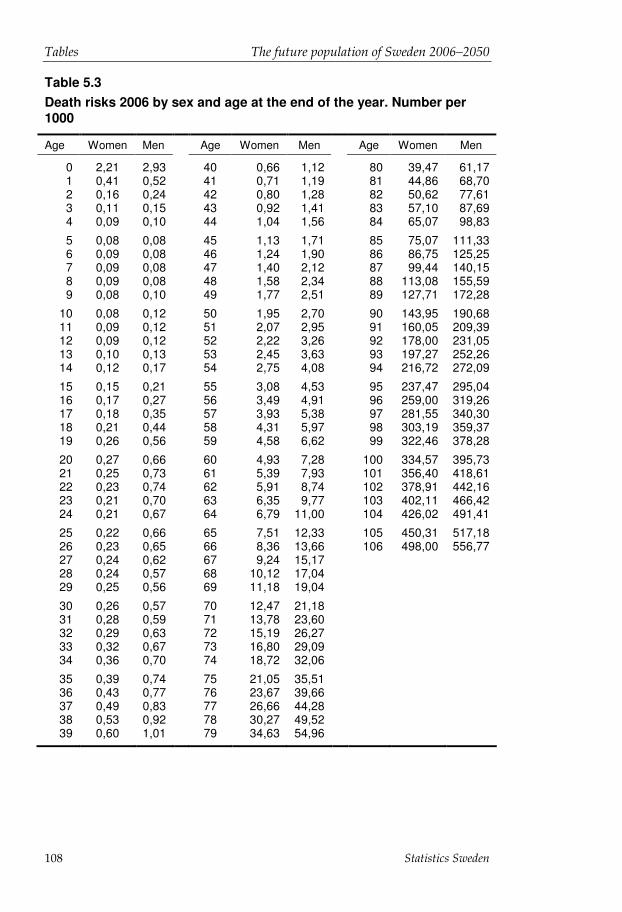
Tables The future population of Sweden 2006–2050
Statistics Sweden 108
Table 5.3 Death risks 2006 by sex and age at the end of the year. Number per 1000
Age Women Men Age Women Men Age Women Men
0 2,21 2,93 40 0,66 1,12 80 39,47 61,17 1 0,41 0,52 41 0,71 1,19 81 44,86 68,70 2 0,16 0,24 42 0,80 1,28 82 50,62 77,61 3 0,11 0,15 43 0,92 1,41 83 57,10 87,69 4 0,09 0,10 44 1,04 1,56 84 65,07 98,83
5 0,08 0,08 45 1,13 1,71 85 75,07 111,33 6 0,09 0,08 46 1,24 1,90 86 86,75 125,25 7 0,09 0,08 47 1,40 2,12 87 99,44 140,15 8 0,09 0,08 48 1,58 2,34 88 113,08 155,59 9 0,08 0,10 49 1,77 2,51 89 127,71 172,28
10 0,08 0,12 50 1,95 2,70 90 143,95 190,68 11 0,09 0,12 51 2,07 2,95 91 160,05 209,39 12 0,09 0,12 52 2,22 3,26 92 178,00 231,05 13 0,10 0,13 53 2,45 3,63 93 197,27 252,26 14 0,12 0,17 54 2,75 4,08 94 216,72 272,09
15 0,15 0,21 55 3,08 4,53 95 237,47 295,04 16 0,17 0,27 56 3,49 4,91 96 259,00 319,26 17 0,18 0,35 57 3,93 5,38 97 281,55 340,30 18 0,21 0,44 58 4,31 5,97 98 303,19 359,37 19 0,26 0,56 59 4,58 6,62 99 322,46 378,28
20 0,27 0,66 60 4,93 7,28 100 334,57 395,73 21 0,25 0,73 61 5,39 7,93 101 356,40 418,61 22 0,23 0,74 62 5,91 8,74 102 378,91 442,16 23 0,21 0,70 63 6,35 9,77 103 402,11 466,42 24 0,21 0,67 64 6,79 11,00 104 426,02 491,41
25 0,22 0,66 65 7,51 12,33 105 450,31 517,18 26 0,23 0,65 66 8,36 13,66 106 498,00 556,77 27 0,24 0,62 67 9,24 15,17 28 0,24 0,57 68 10,12 17,04 29 0,25 0,56 69 11,18 19,04
30 0,26 0,57 70 12,47 21,18 31 0,28 0,59 71 13,78 23,60 32 0,29 0,63 72 15,19 26,27 33 0,32 0,67 73 16,80 29,09 34 0,36 0,70 74 18,72 32,06
35 0,39 0,74 75 21,05 35,51 36 0,43 0,77 76 23,67 39,66 37 0,49 0,83 77 26,66 44,28 38 0,53 0,92 78 30,27 49,52 39 0,60 1,01 79 34,63 54,96

The future population of Sweden 2006–2050 Tables
Statistics Sweden 109
Table 5.4 Yearly reduction of death risks 2007–2050. Percent
Age Women Men
2007– 2015
2019–2035
2039–2050 2007–
2015 2019–
2035 2039–
2050
0-45 -2,00 -1,50 -1,00 -2,00 -1,50 -1,00
46 -2,00 -1,50 -1,00 -2,05 -1,54 -1,03 47 -2,00 -1,50 -1,00 -2,10 -1,58 -1,05 48 -2,00 -1,50 -1,00 -2,15 -1,61 -1,08 49 -2,00 -1,50 -1,00 -2,20 -1,65 -1,10
50 -1,90 -1,43 -0,95 -2,25 -1,69 -1,13 51 -1,80 -1,35 -0,90 -2,25 -1,69 -1,13 52 -1,70 -1,28 -0,85 -2,25 -1,69 -1,13 53 -1,60 -1,20 -0,80 -2,25 -1,69 -1,13 54 -1,50 -1,13 -0,75 -2,25 -1,69 -1,13
55 -1,40 -1,05 -0,70 -2,25 -1,69 -1,13 56 -1,40 -1,05 -0,70 -2,25 -1,69 -1,13 57 -1,40 -1,05 -0,70 -2,25 -1,69 -1,13 58 -1,40 -1,05 -0,70 -2,25 -1,69 -1,13 59 -1,40 -1,05 -0,70 -2,25 -1,69 -1,13
60 -1,40 -1,05 -0,70 -2,25 -1,69 -1,13 61 -1,40 -1,05 -0,70 -2,25 -1,69 -1,13 62 -1,40 -1,05 -0,70 -2,25 -1,69 -1,13 63 -1,40 -1,05 -0,70 -2,25 -1,69 -1,13 64 -1,40 -1,05 -0,70 -2,25 -1,69 -1,13
65 -1,40 -1,05 -0,70 -2,25 -1,69 -1,13 66 -1,40 -1,05 -0,70 -2,20 -1,65 -1,10 67 -1,40 -1,05 -0,70 -2,15 -1,61 -1,08 68 -1,40 -1,05 -0,70 -2,10 -1,58 -1,05 69 -1,40 -1,05 -0,70 -2,05 -1,54 -1,03
70 -1,40 -1,05 -0,70 -2,00 -1,50 -1,00 71 -1,40 -1,05 -0,70 -2,00 -1,50 -1,00 72 -1,40 -1,05 -0,70 -2,00 -1,50 -1,00 73 -1,40 -1,05 -0,70 -2,00 -1,50 -1,00 74 -1,40 -1,05 -0,70 -2,00 -1,50 -1,00
75 -1,40 -1,05 -0,70 -2,00 -1,50 -1,00 76 -1,40 -1,05 -0,70 -2,00 -1,50 -1,00 77 -1,40 -1,05 -0,70 -2,00 -1,50 -1,00 78 -1,40 -1,05 -0,70 -2,00 -1,50 -1,00 79 -1,40 -1,05 -0,70 -2,00 -1,50 -1,00

Tables The future population of Sweden 2006–2050
Statistics Sweden 110
Table 5.4 (cont.) Yearly reduction of death risks 2007–2050. Percent
Age Women Men
2007– 2015
2019–2035
2039–2050 2007–
2015 2019–
2035 2039–
2050
80 -1,40 -1,05 -0,70 -1,86 -1,39 -0,93 81 -1,40 -1,05 -0,70 -1,72 -1,29 -0,86 82 -1,40 -1,05 -0,70 -1,57 -1,18 -0,79 83 -1,40 -1,05 -0,70 -1,43 -1,07 -0,72
84 -1,35 -1,01 -0,68 -1,29 -0,97 -0,65 85 -1,20 -0,90 -0,60 -1,15 -0,86 -0,57 86 -1,05 -0,79 -0,53 -1,01 -0,75 -0,50 87 -0,90 -0,68 -0,45 -0,86 -0,65 -0,43 88 -0,75 -0,56 -0,38 -0,72 -0,54 -0,36
89 -0,60 -0,45 -0,30 -0,58 -0,44 -0,29 90 -0,50 -0,38 -0,25 -0,44 -0,33 -0,22 91 -0,46 -0,35 -0,23 -0,39 -0,30 -0,20 92 -0,42 -0,32 -0,21 -0,35 -0,26 -0,18 93 -0,38 -0,29 -0,19 -0,31 -0,23 -0,15
94 -0,36 -0,27 -0,18 -0,26 -0,20 -0,13 95 -0,34 -0,26 -0,17 -0,22 -0,16 -0,11 96 -0,30 -0,23 -0,15 -0,17 -0,13 -0,09 97 -0,26 -0,20 -0,13 -0,13 -0,10 -0,07 98 -0,22 -0,17 -0,11 -0,10 -0,08 -0,05
99 -0,20 -0,15 -0,10 -0,10 -0,08 -0,05 100 -0,18 -0,14 -0,09 -0,10 -0,08 -0,05 101 -0,16 -0,12 -0,08 -0,10 -0,08 -0,05 102 -0,14 -0,11 -0,07 -0,10 -0,08 -0,05 103 -0,12 -0,09 -0,06 -0,10 -0,08 -0,05
104 -0,10 -0,08 -0,05 -0,10 -0,08 -0,05 105 -0,10 -0,08 -0,05 -0,10 -0,08 -0,05 106 -0,10 -0,08 -0,05 -0,10 -0,08 -0,05
The death risks for 2007-2015 are obtained by reducing the death risks annually by the percent that is given in the table for each year. Because the annual reduction for men and women aged 0-45 during the period 2007-2015 is 2 percent, the death risk in 2006 is multiplied by 0.98 for these ages in order to obtain the death risk for 2007. The death risk for 2008 is obtained by multiplying the death risk in 2007 by 0.98 etc. (chain multiplication). During the transition years 2015-2019 and 2035-39, the reduction figures are interpolated in a linear manner between 2015 and 2019 and 2035 and 2039.

The future population of Sweden 2006–2050 Tables
Statistics Sweden 111
Table 5.5 Age distribution of Swedish and foreign born immigrants by age at end of year 2006. Number per 10 000
Age Women Men Swedish-born Foreign-born Swedish-born Foreign- born
0 102 114 103 120 1 149 276 144 218 2 140 179 140 171 3 142 145 150 155 4 150 140 155 154
5 165 142 156 143 6 155 139 163 144 7 166 133 161 142 8 157 131 158 136 9 150 128 153 132
10 150 121 145 132 11 142 121 132 128 12 124 113 126 130 13 112 113 122 124 14 99 110 105 119
15 94 107 96 118 16 105 111 110 120 17 93 109 84 123 18 106 145 97 118 19 132 226 106 115
20 247 271 113 141 21 250 294 124 180 22 242 320 147 245 23 263 350 191 310 24 265 369 190 351
25 266 381 217 373 26 273 373 226 378 27 267 346 228 359 28 274 337 248 351 29 271 310 241 334
30 299 300 263 319 31 317 281 254 301 32 296 250 258 277 33 290 237 268 262 34 278 216 249 237
35 241 206 216 225 36 203 185 215 208 37 217 174 222 195 38 203 153 214 172 39 199 142 220 158

Tables The future population of Sweden 2006–2050
Statistics Sweden 112
Table 5.5 (cont.) Age distribution of Swedish and foreign born immigrants by age at end of year 2006. Number per 10 000
Age Women Men Swedish-born Foreign-born Swedish-born Foreign-born
40 187 135 204 153 41 168 123 183 135 42 138 112 168 123 43 124 101 168 118 44 111 92 160 108
45 103 85 129 102 46 85 77 117 89 47 78 72 116 84 48 72 64 108 74 49 68 61 117 68
50 66 55 94 65 51 61 53 94 63 52 70 48 95 57 53 59 46 97 53 54 54 42 88 46
55 59 38 90 47 56 59 38 87 40 57 61 32 91 40 58 59 32 87 37 59 65 31 85 35
60 67 32 97 31 61 52 31 106 35 62 61 29 80 32 63 37 27 70 28 64 33 24 49 27
65 32 25 53 23 66 26 23 35 25 67 19 19 38 21 68 17 18 25 18 69 17 16 25 16
70 12 14 15 13 71 20 13 15 12 72 10 12 16 10 73 7 10 16 8 74 8 9 15 7
75 11 9 8 7 76 7 8 12 5 77 5 8 5 4 78 4 6 12 4 79 2 5 5 3

The future population of Sweden 2006–2050 Tables
Statistics Sweden 113
Table 5.5 (cont.) Age distribution of Swedish and foreign born immigrants by age at end of year 2006. Number per 10 000
Age Women Men Swedish-born Foreign-born Swedish-born Foreign-born
80 1 4 3 2 81 2 4 4 3 82 2 4 1 2 83 2 3 3 2 84 1 4 3 1
85 1 3 2 1 86 1 2 1 1 87 1 2 0 1 88 0 1 0 1 89 1 1 0 1
90 0 1 0 0 91 0 1 1 0 92 0 0 0 0 93 0 0 0 0 94 0 0 0 0
95 0 0 0 0 96 0 0 0 0 97 0 0 0 0 98 0 0 0 0 99 0 0 0 0
100 0 0 0 0 101 0 0 0 0 102 0 0 0 0 103 0 0 0 0 104 0 0 0 0
105 0 0 0 0 106 0 0 0 0

Tables The future population of Sweden 2006–2050
Statistics Sweden 114
Table 5.6 Sex ratio of immigrants (proportion women) 2006–2050
Year Swedish-born Foreign-born
2006 0,493 0,500 2007 0,497 0,500 2008 0,494 0,500 2009 0,493 0,500
2010 0,493 0,500 2011 0,489 0,500 2012 0,489 0,500 2013 0,489 0,500 2014 0,486 0,500
2015 0,482 0,500 2016 0,482 0,500 2017 0,480 0,500 2018 0,478 0,500 2019 0,477 0,500
2020 0,476 0,500 2021 0,476 0,500 2022 0,475 0,500 2023 0,475 0,500 2024 0,474 0,500
2025 0,473 0,500 2026 0,472 0,500 2027 0,472 0,500 2028 0,474 0,500 2029 0,474 0,500
2030 0,474 0,500 2031 0,474 0,500 2032 0,474 0,500 2033 0,474 0,500 2034 0,474 0,500
2035 0,474 0,500 2036 0,474 0,500 2037 0,474 0,500 2038 0,475 0,500 2039 0,475 0,500
2040 0,475 0,500 2041 0,475 0,500 2042 0,476 0,500 2043 0,476 0,500 2044 0,476 0,500
2045 0,476 0,500 2046 0,476 0,500 2047 0,476 0,500 2048 0,476 0,500 2049 0,476 0,500 2050 0,476 0,500

The future population of Sweden 2006–2050 Tables
Statistics Sweden 115
Table 5.7a Number of immigrants 2006–2050
Year Women Men Total
Swedish-born Foreign-born Swedish-
born Foreign-born
2006 5 777 33 571 5 940 33 547 78 835 2007 5 965 27 809 6 051 27 791 67 616 2008 6 012 28 021 6 155 27 995 68 183 2009 6 101 27 211 6 269 27 198 66 779
2010 6 203 27 410 6 376 27 388 67 377 2011 6 217 27 605 6 486 27 584 67 892 2012 6 317 27 788 6 594 27 766 68 465 2013 6 410 27 969 6 701 27 949 69 029 2014 6 432 28 146 6 814 28 123 69 515
2015 6 510 28 315 6 999 28 289 70 113 2016 6 591 28 315 7 076 28 289 70 271 2017 6 622 28 315 7 179 28 289 70 405 2018 6 649 28 315 7 267 28 289 70 520 2019 6 706 28 315 7 364 28 289 70 674
2020 6 765 28 315 7 444 28 289 70 813 2021 6 821 28 315 7 515 28 289 70 940 2022 6 878 28 315 7 590 28 289 71 072 2023 6 935 28 315 7 663 28 289 71 202 2024 6 984 28 315 7 737 28 289 71 325
2025 7 017 28 315 7 804 28 289 71 425 2026 7 030 28 315 7 862 28 289 71 496 2027 7 045 28 315 7 891 28 289 71 540 2028 7 119 28 315 7 912 28 289 71 635 2029 7 135 28 315 7 929 28 289 71 668
2030 7 181 28 315 7 978 28 289 71 763 2031 7 170 28 315 7 961 28 289 71 735 2032 7 186 28 315 7 977 28 289 71 767 2033 7 196 28 315 7 987 28 289 71 787 2034 7 198 28 315 7 983 28 289 71 785
2035 7 206 28 315 7 994 28 289 71 804 2036 7 238 28 315 8 021 28 289 71 863 2037 7 225 28 315 7 999 28 289 71 828 2038 7 230 28 315 8 009 28 289 71 843 2039 7 251 28 315 8 020 28 289 71 875
2040 7 300 28 315 8 058 28 289 71 962 2041 7 292 28 315 8 043 28 289 71 939 2042 7 315 28 315 8 059 28 289 71 978 2043 7 333 28 315 8 075 28 289 72 012 2044 7 356 28 315 8 096 28 289 72 056
2045 7 375 28 315 8 116 28 289 72 095 2046 7 394 28 315 8 141 28 289 72 139 2047 7 417 28 315 8 165 28 289 72 186 2048 7 434 28 315 8 184 28 289 72 222 2049 7 451 28 315 8 211 28 289 72 266 2050 7 471 28 315 8 230 28 289 72 305
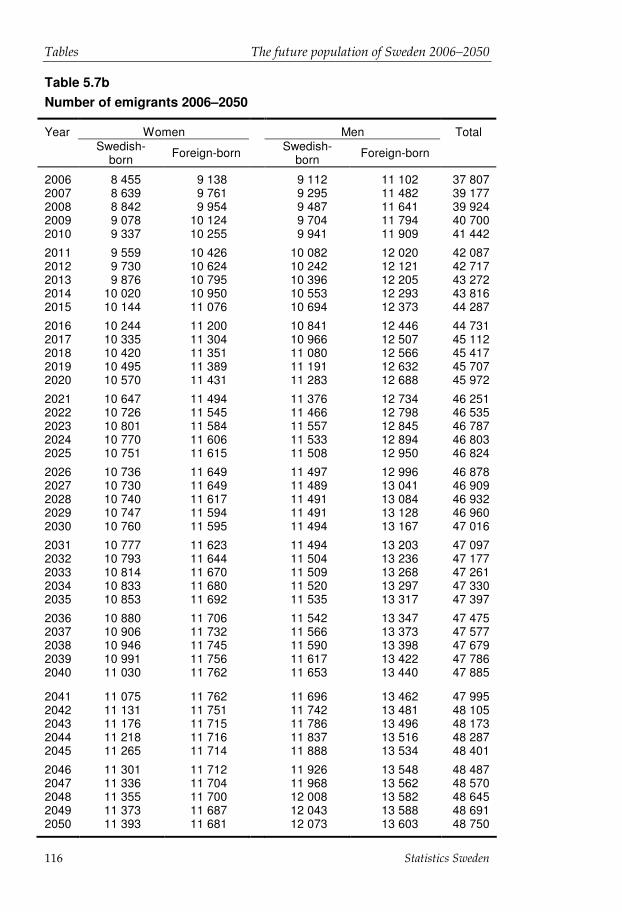
Tables The future population of Sweden 2006–2050
Statistics Sweden 116
Table 5.7b Number of emigrants 2006–2050
Year Women Men Total
Swedish-born Foreign-born Swedish-
born Foreign-born
2006 8 455 9 138 9 112 11 102 37 807 2007 8 639 9 761 9 295 11 482 39 177 2008 8 842 9 954 9 487 11 641 39 924 2009 9 078 10 124 9 704 11 794 40 700 2010 9 337 10 255 9 941 11 909 41 442
2011 9 559 10 426 10 082 12 020 42 087 2012 9 730 10 624 10 242 12 121 42 717 2013 9 876 10 795 10 396 12 205 43 272 2014 10 020 10 950 10 553 12 293 43 816 2015 10 144 11 076 10 694 12 373 44 287
2016 10 244 11 200 10 841 12 446 44 731 2017 10 335 11 304 10 966 12 507 45 112 2018 10 420 11 351 11 080 12 566 45 417 2019 10 495 11 389 11 191 12 632 45 707 2020 10 570 11 431 11 283 12 688 45 972
2021 10 647 11 494 11 376 12 734 46 251 2022 10 726 11 545 11 466 12 798 46 535 2023 10 801 11 584 11 557 12 845 46 787 2024 10 770 11 606 11 533 12 894 46 803 2025 10 751 11 615 11 508 12 950 46 824
2026 10 736 11 649 11 497 12 996 46 878 2027 10 730 11 649 11 489 13 041 46 909 2028 10 740 11 617 11 491 13 084 46 932 2029 10 747 11 594 11 491 13 128 46 960 2030 10 760 11 595 11 494 13 167 47 016
2031 10 777 11 623 11 494 13 203 47 097 2032 10 793 11 644 11 504 13 236 47 177 2033 10 814 11 670 11 509 13 268 47 261 2034 10 833 11 680 11 520 13 297 47 330 2035 10 853 11 692 11 535 13 317 47 397
2036 10 880 11 706 11 542 13 347 47 475 2037 10 906 11 732 11 566 13 373 47 577 2038 10 946 11 745 11 590 13 398 47 679 2039 10 991 11 756 11 617 13 422 47 786 2040 11 030 11 762 11 653 13 440 47 885
2041 11 075 11 762 11 696 13 462 47 995 2042 11 131 11 751 11 742 13 481 48 105 2043 11 176 11 715 11 786 13 496 48 173 2044 11 218 11 716 11 837 13 516 48 287 2045 11 265 11 714 11 888 13 534 48 401
2046 11 301 11 712 11 926 13 548 48 487 2047 11 336 11 704 11 968 13 562 48 570 2048 11 355 11 700 12 008 13 582 48 645 2049 11 373 11 687 12 043 13 588 48 691 2050 11 393 11 681 12 073 13 603 48 750
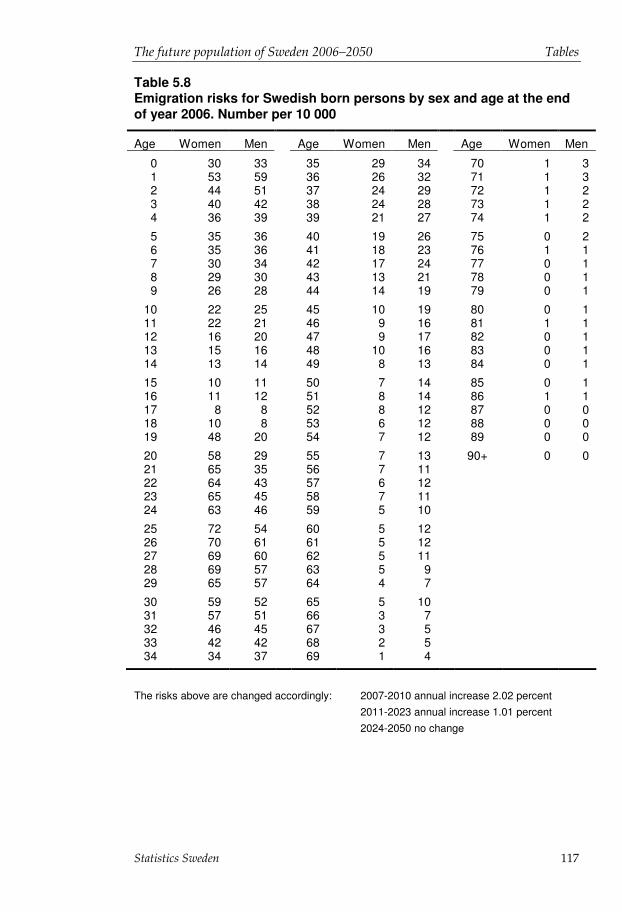
The future population of Sweden 2006–2050 Tables
Statistics Sweden 117
Table 5.8 Emigration risks for Swedish born persons by sex and age at the end of year 2006. Number per 10 000
Age Women Men Age Women Men Age Women Men
0 30 33 35 29 34 70 1 3 1 53 59 36 26 32 71 1 3 2 44 51 37 24 29 72 1 2 3 40 42 38 24 28 73 1 2 4 36 39 39 21 27 74 1 2
5 35 36 40 19 26 75 0 2 6 35 36 41 18 23 76 1 1 7 30 34 42 17 24 77 0 1 8 29 30 43 13 21 78 0 1 9 26 28 44 14 19 79 0 1
10 22 25 45 10 19 80 0 1 11 22 21 46 9 16 81 1 1 12 16 20 47 9 17 82 0 1 13 15 16 48 10 16 83 0 1 14 13 14 49 8 13 84 0 1
15 10 11 50 7 14 85 0 1 16 11 12 51 8 14 86 1 1 17 8 8 52 8 12 87 0 0 18 10 8 53 6 12 88 0 0 19 48 20 54 7 12 89 0 0
20 58 29 55 7 13 90+ 0 0 21 65 35 56 7 11 22 64 43 57 6 12 23 65 45 58 7 11 24 63 46 59 5 10
25 72 54 60 5 12 26 70 61 61 5 12 27 69 60 62 5 11 28 69 57 63 5 9 29 65 57 64 4 7
30 59 52 65 5 10 31 57 51 66 3 7 32 46 45 67 3 5 33 42 42 68 2 5 34 34 37 69 1 4
The risks above are changed accordingly: 2007-2010 annual increase 2.02 percent 2011-2023 annual increase 1.01 percent 2024-2050 no change
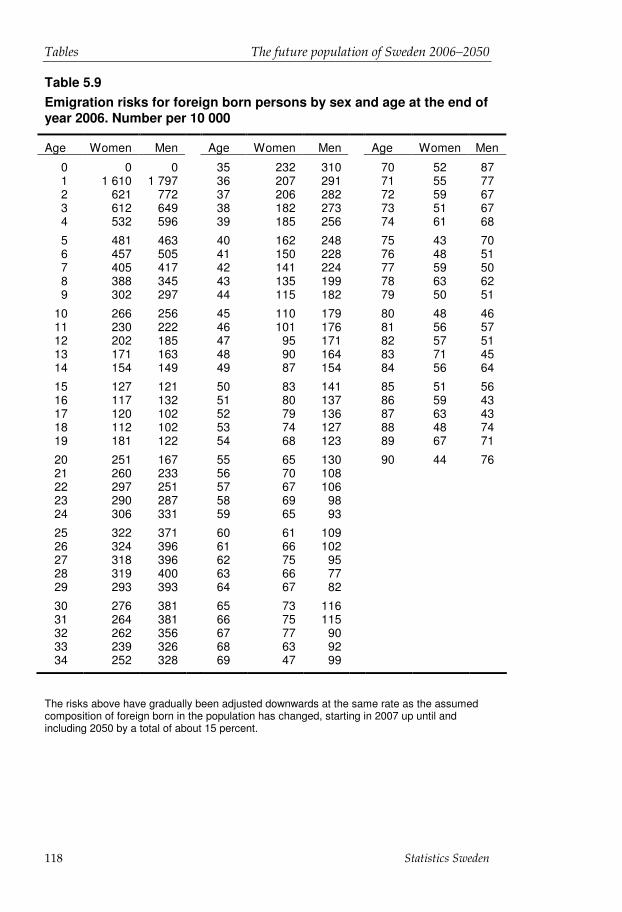
Tables The future population of Sweden 2006–2050
Statistics Sweden 118
Table 5.9 Emigration risks for foreign born persons by sex and age at the end of year 2006. Number per 10 000
Age Women Men Age Women Men Age Women Men
0 0 0 35 232 310 70 52 87 1 1 610 1 797 36 207 291 71 55 77 2 621 772 37 206 282 72 59 67 3 612 649 38 182 273 73 51 67 4 532 596 39 185 256 74 61 68
5 481 463 40 162 248 75 43 70 6 457 505 41 150 228 76 48 51 7 405 417 42 141 224 77 59 50 8 388 345 43 135 199 78 63 62 9 302 297 44 115 182 79 50 51
10 266 256 45 110 179 80 48 46 11 230 222 46 101 176 81 56 57 12 202 185 47 95 171 82 57 51 13 171 163 48 90 164 83 71 45 14 154 149 49 87 154 84 56 64
15 127 121 50 83 141 85 51 56 16 117 132 51 80 137 86 59 43 17 120 102 52 79 136 87 63 43 18 112 102 53 74 127 88 48 74 19 181 122 54 68 123 89 67 71
20 251 167 55 65 130 90 44 76 21 260 233 56 70 108 22 297 251 57 67 106 23 290 287 58 69 98 24 306 331 59 65 93
25 322 371 60 61 109 26 324 396 61 66 102 27 318 396 62 75 95 28 319 400 63 66 77 29 293 393 64 67 82
30 276 381 65 73 116 31 264 381 66 75 115 32 262 356 67 77 90 33 239 326 68 63 92 34 252 328 69 47 99
The risks above have gradually been adjusted downwards at the same rate as the assumed composition of foreign born in the population has changed, starting in 2007 up until and including 2050 by a total of about 15 percent.

The future population of Sweden 2006–2050 Tables
Statistics Sweden 119
Population projection – main alternative
Table 5.10 Population and population changes 1990–2005 and projection 2006–2050. Thousands
Year Births Deaths Birth sur-
plus
Immi-grants
Emi-grants
Net migr-ation
Pop. in-crease
Pop. 31 dec
1990 123,9 95,2 28,8 60,0 25,2 34,9 63,6 8 590,6 1991 123,7 95,2 28,5 49,7 24,7 25,0 53,5 8 644,1 1992 122,8 94,7 28,1 45,3 25,7 19,6 47,9 8 692,0 1993 118,0 97,0 21,0 61,9 29,9 32,0 53,1 8 745,1 1994 112,3 91,8 20,4 83,6 32,7 50,9 71,3 8 816,4
1995 103,4 94,0 9,5 45,9 34,0 11,9 21,1 8 837,5 1996 95,3 94,1 1,2 39,9 33,9 6,0 7,0 8 844,5 1997 90,5 93,3 -2,8 44,8 38,5 6,3 3,1 8 847,6 1998 89,0 93,3 -4,2 49,4 38,5 10,9 6,7 8 854,3 1999 88,2 94,7 -6,6 49,8 35,7 14,1 7,1 8 861,4
2000 90,4 93,5 -3,0 58,7 34,1 24,6 21,4 8 882,8 2001 91,5 93,8 -2,3 60,8 32,1 28,7 26,3 8 909,1 2002 95,8 95,0 0,8 64,1 33,0 31,1 31,7 8 940,8 2003 99,2 93,0 6,2 63,8 35,0 28,8 34,9 8 975,7 2004 100,9 90,5 10,4 62,0 36,6 25,4 35,7 9 011,4
2005 101,3 91,7 9,6 65,2 38,1 27,1 36,7 9 047,8 Projection
2006 103,4 92,9 10,5 78,8 37,8 41,0 51,5 9 099,3 2007 103,8 92,8 11,1 67,6 39,2 28,4 39,5 9 138,8 2008 104,4 92,6 11,8 68,2 39,9 28,3 40,1 9 178,9 2009 105,0 92,5 12,5 66,8 40,7 26,1 38,5 9 217,4
2010 105,6 92,4 13,3 67,4 41,4 25,9 39,2 9 256,7 2011 105,8 92,2 13,6 67,9 42,1 25,8 39,4 9 296,0 2012 106,2 92,1 14,1 68,5 42,7 25,8 39,8 9 335,9 2013 106,8 92,0 14,8 69,0 43,3 25,8 40,6 9 376,4 2014 107,5 91,9 15,7 69,5 43,8 25,7 41,4 9 417,8
2015 108,4 91,8 16,6 70,1 44,3 25,8 42,5 9 460,3 2016 109,4 91,8 17,6 70,3 44,7 25,5 43,1 9 503,4 2017 110,4 92,0 18,4 70,4 45,1 25,3 43,7 9 547,1 2018 111,3 92,3 19,0 70,5 45,4 25,1 44,1 9 591,2 2019 112,1 92,7 19,4 70,7 45,7 25,0 44,3 9 635,5
2020 112,7 93,3 19,4 70,8 46,0 24,8 44,3 9 679,8 2021 113,1 93,9 19,2 70,9 46,3 24,7 43,9 9 723,7 2022 113,2 94,7 18,5 71,1 46,5 24,5 43,1 9 766,7 2023 113,0 95,6 17,4 71,2 46,8 24,4 41,8 9 808,6 2024 112,5 96,6 15,9 71,3 46,8 24,5 40,4 9 849,0

Tables The future population of Sweden 2006–2050
Statistics Sweden 120
Table 5.10 (cont.) Population and population changes 1990–2005 and projection 2006–2050. Thousands
Year Births Deaths Birth sur-
plus
Immi-grants
Emi-grants
Net migr-ation
Pop. in-crease
Pop. 31 dec
2025 111,8 97,8 14,0 71,4 46,8 24,6 38,6 9 887,6 2026 111,0 99,0 11,9 71,5 46,9 24,6 36,5 9 924,1 2027 110,0 100,4 9,6 71,5 46,9 24,6 34,3 9 958,4 2028 109,2 101,8 7,3 71,6 46,9 24,7 32,0 9 990,4 2029 108,4 103,3 5,1 71,7 47,0 24,7 29,8 10 020,2
2030 107,8 104,9 2,9 71,8 47,0 24,7 27,7 10 047,9 2031 107,4 106,4 1,0 71,7 47,1 24,6 25,7 10 073,6 2032 107,3 107,9 -0,6 71,8 47,2 24,6 24,0 10 097,6 2033 107,4 109,2 -1,9 71,8 47,3 24,5 22,7 10 120,2 2034 107,7 110,5 -2,8 71,8 47,3 24,5 21,7 10 141,9
2035 108,1 111,5 -3,4 71,8 47,4 24,4 21,0 10 162,9 2036 108,7 112,4 -3,7 71,9 47,5 24,4 20,7 10 183,7 2037 109,4 113,1 -3,7 71,8 47,6 24,2 20,5 10 204,2 2038 110,1 113,7 -3,6 71,9 47,7 24,2 20,6 10 224,8 2039 110,8 114,1 -3,3 71,9 47,8 24,1 20,8 10 245,6
2040 111,6 114,4 -2,8 72,0 47,9 24,1 21,3 10 266,9 2041 112,3 114,6 -2,3 71,9 48,0 23,9 21,7 10 288,5 2042 113,0 114,6 -1,7 72,0 48,1 23,9 22,2 10 310,8 2043 113,6 114,7 -1,0 72,0 48,2 23,8 22,8 10 333,6 2044 114,3 114,7 -0,5 72,1 48,3 23,8 23,3 10 356,9
2045 114,8 114,8 0,0 72,1 48,4 23,7 23,7 10 380,6 2046 115,4 114,9 0,4 72,1 48,5 23,7 24,1 10 404,7 2047 115,9 115,1 0,7 72,2 48,6 23,6 24,4 10 429,0 2048 116,3 115,4 0,9 72,2 48,6 23,6 24,5 10 453,5 2049 116,7 115,8 0,9 72,3 48,7 23,6 24,5 10 478,0
2050 117,0 116,2 0,9 72,3 48,7 23,6 24,4 10 502,4

The future population of Sweden 2006–2050 Tables
Statistics Sweden 121
Table 5.11 Population by age 1950–2005 and projection 2006–2050. Thousands
Total By age 31 dec. resp. year 0–4 5–9 10–14 15–19 20–24 25–29
Both sexes
1950 7 046,9 610,6 589,8 450,7 415,8 459,7 534,0 1960 7 498,0 519,9 533,5 610,2 594,1 466,2 435,5 1970 8 081,1 576,6 575,1 530,3 551,4 657,9 633,9 1980 8 317,9 483,8 554,3 577,2 579,1 553,9 579,5 1990 8 590,6 566,0 487,8 494,4 563,3 601,0 615,5
2000 8 882,8 457,9 585,9 587,0 508,6 516,7 592,2 2001 8 909,1 455,8 557,4 607,1 519,1 515,6 580,9 2002 8 940,8 462,5 527,0 622,4 532,2 517,0 568,7 2003 8 975,7 472,9 501,6 624,5 553,3 520,0 556,0 2004 9 011,4 485,6 479,9 618,1 574,7 522,3 545,7
2005 9 047,8 496,3 468,7 595,7 598,4 527,3 544,1
Projection
2006 9 099,3 509,2 467,6 568,2 618,9 538,9 546,0 2007 9 138,8 516,7 474,3 538,2 634,0 550,8 547,5 2008 9 178,9 521,6 484,8 513,1 636,3 570,8 549,9 2009 9 217,4 524,9 497,6 492,0 630,4 591,8 550,7
2010 9 256,7 528,7 508,2 481,6 608,9 615,6 553,9 2011 9 296,0 530,9 519,6 479,5 580,9 635,1 563,0 2012 9 335,9 533,2 526,8 486,0 551,1 650,1 574,6 2013 9 376,4 535,5 531,5 496,2 526,1 652,6 594,2 2014 9 417,8 538,1 534,8 508,9 505,2 647,2 615,1
2015 9 460,3 540,9 538,7 519,4 494,9 626,4 638,8 2016 9 503,4 544,5 540,9 530,7 492,9 599,0 658,3 2017 9 547,1 548,6 543,2 537,9 499,3 569,7 673,4 2018 9 591,2 553,1 545,5 542,6 509,5 545,0 676,3 2019 9 635,5 557,6 548,0 546,0 522,1 524,2 671,3
2020 9 679,8 561,8 550,7 549,8 532,5 513,9 651,3 2021 9 723,7 565,4 554,2 552,0 543,8 511,7 624,6 2022 9 766,7 568,2 558,3 554,3 551,0 517,9 595,8 2023 9 808,6 569,9 562,6 556,5 555,7 527,9 571,3 2024 9 849,0 570,3 567,0 559,0 559,0 540,2 550,8
2025 9 887,6 569,4 571,1 561,7 562,8 550,6 540,4 2026 9 924,1 567,3 574,7 565,2 565,1 561,7 538,1 2027 9 958,4 564,2 577,5 569,2 567,4 568,9 544,0 2028 9 990,4 560,4 579,2 573,6 569,7 573,6 553,8 2029 10 020,2 556,4 579,6 578,0 572,2 577,0 565,9
2030 10 047,9 552,5 578,8 582,1 574,9 580,7 576,1 2031 10 073,6 549,1 576,8 585,7 578,4 583,1 587,0 2032 10 097,6 546,5 573,8 588,4 582,4 585,4 594,3 2033 10 120,2 544,8 570,2 590,1 586,7 587,7 599,0 2034 10 141,9 544,1 566,3 590,6 591,1 590,3 602,4

Tables The future population of Sweden 2006–2050
Statistics Sweden 122
Table 5.11 (cont.) Population by age 1950–2005 and projection 2006–2050. Thousands
Total By age 31 dec. resp. year 0–4 5–9 10–14 15–19 20–24 25–29
2035 10 162,9 544,4 562,5 589,8 595,2 593,0 606,2 2036 10 183,7 545,7 559,2 587,9 598,8 596,4 608,6 2037 10 204,2 547,7 556,7 585,0 601,5 600,4 610,9 2038 10 224,8 550,4 555,0 581,4 603,2 604,7 613,2 2039 10 245,6 553,5 554,3 577,6 603,7 609,0 615,7 2040 10 266,9 556,9 554,7 573,9 603,0 613,1 618,4 2041 10 288,5 560,5 555,9 570,6 601,0 616,7 621,8 2042 10 310,8 564,1 557,9 568,1 598,2 619,4 625,7 2043 10 333,6 567,6 560,5 566,5 594,6 621,1 629,9 2044 10 356,9 571,0 563,6 565,8 590,9 621,6 634,2
2045 10 380,6 574,2 566,9 566,2 587,2 620,9 638,3 2046 10 404,7 577,3 570,4 567,4 584,0 619,1 641,9 2047 10 429,0 580,1 574,0 569,4 581,5 616,2 644,6 2048 10 453,5 582,7 577,4 572,0 579,9 612,8 646,4 2049 10 478,0 585,2 580,8 575,0 579,3 609,1 646,9
2050 10 502,4 587,3 584,0 578,4 579,7 605,5 646,3

The future population of Sweden 2006–2050 Tables
Statistics Sweden 123
Table 5.11 (cont.) Population by age 1950–2005 and projection 2006–2050. Thousands
By age 31 dec.
resp. year
30–34 35–39 40–44 45–49 50–54 55–59 60–64
Both sexes
1950 543,1 545,6 540,7 489,1 435,9 380,5 330,2 1960 470,2 533,5 535,9 533,5 521,5 460,7 395,5 1970 490,1 444,8 471,9 527,4 521,3 507,9 479,2 1980 659,9 622,4 479,2 433,7 455,2 498,8 478,7 1990 577,0 585,3 654,9 613,0 467,2 415,4 423,7
2000 627,8 632,1 584,6 583,6 642,0 591,2 442,5 2001 619,1 651,1 583,2 585,6 623,7 623,4 455,1 2002 611,6 664,9 586,4 586,5 608,4 641,5 477,8 2003 609,1 665,9 596,6 584,9 595,2 648,4 506,1 2004 612,6 651,2 615,8 586,4 583,6 642,7 538,5
2005 610,3 638,0 636,2 584,9 578,8 630,5 573,3
Projection
2006 601,4 630,8 655,5 583,9 581,3 612,8 605,0 2007 589,5 623,5 669,3 586,7 582,1 597,9 622,8 2008 577,7 621,4 670,3 597,0 580,7 585,2 629,6 2009 567,7 625,9 656,5 616,2 582,5 574,1 624,3
2010 564,9 623,8 644,0 636,6 581,1 569,8 612,9 2011 564,0 613,2 635,8 655,2 579,7 572,0 595,8 2012 565,0 601,0 628,4 668,8 582,5 572,9 581,5 2013 566,8 588,9 626,3 669,9 592,5 571,6 569,5 2014 567,4 578,7 630,7 656,5 611,5 573,4 559,0
2015 570,6 575,6 628,6 644,2 631,8 572,1 555,1 2016 579,4 574,5 618,0 636,1 650,3 570,9 557,4 2017 591,0 575,2 605,8 628,9 664,0 573,8 558,4 2018 610,2 576,9 593,5 626,8 665,2 583,7 557,4 2019 630,9 577,3 583,2 631,1 652,1 602,4 559,3
2020 654,2 580,3 579,8 629,0 640,1 622,5 558,2 2021 673,6 588,9 578,6 618,4 632,2 640,7 557,2 2022 688,7 600,3 579,0 606,2 625,1 654,3 560,0 2023 692,1 619,4 580,5 593,9 623,1 655,6 569,8 2024 687,6 640,0 580,8 583,5 627,3 642,9 588,2
2025 668,4 663,3 583,7 580,0 625,2 631,2 607,9 2026 642,5 682,9 592,3 578,7 614,7 623,6 625,9 2027 614,2 698,2 603,7 579,0 602,6 616,8 639,3 2028 590,0 702,2 622,6 580,5 590,4 614,9 640,8 2029 569,7 698,1 643,3 580,8 580,1 619,1 628,7
2030 559,2 679,5 666,6 583,7 576,6 617,1 617,5 2031 556,7 654,0 686,3 592,2 575,3 606,8 610,2 2032 562,4 626,0 701,9 603,6 575,6 594,9 603,8 2033 572,0 601,8 706,2 622,5 577,0 582,9 602,1 2034 583,9 581,4 702,4 643,2 577,3 572,8 606,3

Tables The future population of Sweden 2006–2050
Statistics Sweden 124
Table 5.11 (forts.) Population by age 1950–2005 and projection 2006–2050. Thousands
By age 31 dec. resp. year 30–34 35–39 40–44 45–49 50–54 55–59 60–64
2035 594,0 570,7 684,1 666,4 580,2 569,3 604,4 2036 604,8 568,0 658,8 686,2 588,7 568,0 594,5 2037 612,0 573,6 631,0 701,8 600,1 568,3 582,9 2038 616,8 583,0 606,8 706,2 618,8 569,7 571,1 2039 620,2 594,8 586,4 702,6 639,4 570,1 561,3
2040 624,0 605,0 575,6 684,7 662,5 573,0 557,9 2041 626,5 615,8 572,8 659,6 682,2 581,4 556,7 2042 628,8 623,1 578,2 631,9 697,9 592,7 557,0 2043 631,1 627,9 587,6 607,7 702,5 611,2 558,4 2044 633,6 631,4 599,4 587,4 699,0 631,6 558,8
2045 636,3 635,2 609,6 576,5 681,3 654,6 561,8 2046 639,7 637,7 620,3 573,7 656,5 674,2 570,0 2047 643,6 640,0 627,7 579,1 629,0 689,7 581,2 2048 647,8 642,4 632,5 588,4 605,0 694,4 599,5 2049 652,1 644,9 636,0 600,1 584,8 691,1 619,7
2050 656,1 647,6 639,9 610,3 574,0 673,7 642,3

The future population of Sweden 2006–2050 Tables
Statistics Sweden 125
Table 5.11 (cont.) Population by age 1950–2005 and projection 2006–2050. Thousands
By age 31 dec. resp. year 65–69 70–74 75–79 80–84 85–89 90–94 95–99 100+
Both sexes
1950 270,2 209,0 135,3 68,5 30,1 7,2 0,9 0,0 1960 324,5 251,8 170,5 95,4 36,2 8,3 1,3 0,0 1970 399,4 309,9 213,7 122,7 51,5 13,8 2,0 0,1 1980 442,8 382,5 273,5 163,0 73,9 22,1 3,9 0,3 1990 443,2 394,1 319,3 220,5 107,5 34,7 6,3 0,6
2000 378,3 362,1 338,0 247,6 139,8 53,6 10,6 1,0 2001 380,3 358,4 329,1 256,5 140,7 54,8 11,2 1,0 2002 384,5 356,5 323,3 259,7 141,4 55,9 11,5 1,1 2003 395,7 350,4 319,2 263,2 142,2 57,4 11,9 1,2 2004 409,2 348,2 314,6 265,7 143,8 58,9 12,6 1,3
2005 420,3 346,0 311,9 259,2 153,9 59,5 13,2 1,3
Projection
2006 432,4 348,6 309,5 253,4 160,3 60,3 13,6 1,4 2007 454,3 353,1 308,5 250,0 162,6 61,1 14,2 1,5 2008 481,7 363,9 303,8 247,9 165,2 61,6 14,6 1,6 2009 513,2 376,8 302,5 244,8 166,4 62,4 14,9 1,7
2010 546,9 387,5 301,3 243,6 163,2 67,3 15,0 1,8 2011 577,3 399,1 304,3 242,6 160,5 70,5 15,2 1,9 2012 594,5 419,9 309,0 242,7 159,0 71,4 15,5 2,0 2013 601,2 446,0 319,1 239,8 158,5 72,4 15,7 2,0 2014 596,6 475,9 331,2 239,5 157,2 72,9 16,0 2,1
2015 586,0 507,8 341,2 239,5 157,3 71,9 17,5 2,1 2016 570,1 536,4 352,1 242,8 157,4 71,1 18,4 2,1 2017 556,9 552,8 371,3 247,6 158,0 70,5 18,6 2,2 2018 545,8 559,5 395,4 256,6 156,6 70,7 18,8 2,2 2019 536,1 555,7 422,9 267,0 156,9 70,3 18,8 2,3
2020 532,7 546,2 451,8 275,7 157,6 70,7 18,7 2,5 2021 535,1 531,9 477,6 285,1 160,6 70,9 18,5 2,6 2022 536,3 520,0 492,6 301,7 164,5 71,3 18,4 2,7 2023 535,6 510,2 499,1 322,4 171,0 70,8 18,5 2,7 2024 537,7 501,5 496,3 345,9 178,6 71,1 18,5 2,7
2025 536,7 498,8 488,3 370,2 184,7 71,7 18,7 2,7 2026 536,0 501,4 476,1 391,7 191,6 73,4 18,8 2,7 2027 539,1 503,0 466,1 404,4 203,7 75,6 18,9 2,7 2028 548,7 502,6 458,1 410,3 218,9 78,9 18,8 2,7 2029 566,7 504,9 450,9 408,6 236,0 82,6 18,9 2,7
2030 586,0 504,4 449,1 402,7 253,0 85,5 19,1 2,7 2031 603,5 504,1 452,1 393,3 267,6 88,8 19,7 2,7 2032 616,7 507,4 454,1 386,0 276,3 95,0 20,4 2,8 2033 618,4 516,8 454,3 380,3 280,6 102,9 21,3 2,7 2034 606,9 534,3 456,9 375,3 279,9 111,5 22,4 2,8

Tables The future population of Sweden 2006–2050
Statistics Sweden 126
Table 5.11 (cont.) Population by age 1950–2005 and projection 2006–2050. Thousands
By age 31 dec.
resp. year
65–69 70–74 75–79 80–84 85–89 90–94 95–99 100+
2035 596,4 552,9 456,9 374,7 276,3 119,5 23,2 2,8 2036 589,7 569,8 457,2 377,9 270,3 126,0 24,1 2,9 2037 583,7 582,6 460,8 380,4 266,1 129,9 26,0 3,0 2038 582,3 584,4 469,9 381,3 263,2 131,8 28,3 3,2 2039 586,5 573,8 486,5 383,9 260,5 131,5 30,9 3,3
2040 584,8 564,1 503,9 384,4 260,9 129,8 33,0 3,4 2041 575,2 558,1 519,7 385,3 263,7 127,0 34,6 3,6 2042 564,1 552,8 531,5 388,9 265,9 125,3 35,6 3,9 2043 552,8 551,7 533,4 397,3 267,0 124,4 36,0 4,2 2044 543,4 555,9 523,9 412,2 269,1 123,5 35,9 4,6
2045 540,2 554,4 515,4 427,6 269,8 124,1 35,3 4,9 2046 539,1 545,4 510,4 441,3 271,0 125,7 34,6 5,1 2047 539,5 535,0 506,1 451,6 274,3 127,0 34,2 5,3 2048 540,9 524,4 505,5 453,3 281,1 127,7 34,1 5,4 2049 541,3 515,7 509,6 445,5 292,8 128,8 34,0 5,3
2050 544,3 512,9 508,5 438,7 304,4 129,2 34,2 5,3

The future population of Sweden 2006–2050 Tables
Statistics Sweden 127
Table 5.12a Female population by age 1950–2005 and projection 2006–2050. Thousands
Total By age 31 dec.
resp. year 0–4 5–9 10–14 15–19 20–24 25–29
Women
1950 3 535,9 297,3 287,9 221,3 204,9 229,1 264,2 1960 3 757,8 252,5 259,3 297,7 290,8 230,4 215,6 1970 4 045,4 280,5 280,0 257,7 269,4 321,3 304,6 1980 4 198,1 236,0 270,6 281,2 282,7 271,0 283,1 1990 4 346,6 275,6 237,3 241,0 274,9 293,2 298,6
2000 4 490,0 223,0 285,5 285,7 247,1 253,5 290,9 2001 4 500,7 221,5 272,1 295,4 251,9 253,3 285,4 2002 4 513,7 224,9 257,4 302,4 258,7 253,8 279,3 2003 4 529,0 230,1 244,5 304,0 268,9 254,9 273,0 2004 4 545,1 236,2 233,8 301,3 279,5 255,7 268,0
2005 4 561,2 241,8 228,2 290,2 291,3 257,8 267,0
Projection
2006 4 585,4 248,2 227,4 277,3 301,3 263,5 268,2 2007 4 603,5 251,7 230,9 262,8 308,2 270,0 269,0 2008 4 621,9 254,0 236,3 250,1 309,8 279,7 270,1 2009 4 639,4 255,7 242,3 239,6 307,3 290,1 270,3
2010 4 657,2 257,4 247,8 234,5 296,7 301,9 271,9 2011 4 675,0 258,5 253,4 233,1 283,6 311,2 276,2 2012 4 693,1 259,6 256,8 236,4 269,1 318,1 282,4 2013 4 711,5 260,7 259,0 241,6 256,5 319,8 291,8 2014 4 730,3 261,9 260,6 247,6 246,0 317,5 302,1
2015 4 749,7 263,3 262,4 253,0 240,9 307,3 313,7 2016 4 769,5 265,0 263,4 258,6 239,6 294,5 323,1 2017 4 789,7 267,0 264,5 261,9 242,9 280,3 329,9 2018 4 810,2 269,2 265,6 264,2 248,0 267,7 331,8 2019 4 831,0 271,4 266,8 265,8 254,0 257,4 329,7
2020 4 851,9 273,5 268,1 267,5 259,3 252,3 319,9 2021 4 872,8 275,2 269,8 268,6 264,9 250,8 307,3 2022 4 893,5 276,6 271,8 269,7 268,2 253,9 293,4 2023 4 913,6 277,4 273,9 270,8 270,5 258,9 281,0 2024 4 933,3 277,6 276,1 272,0 272,1 264,8 270,8
2025 4 952,1 277,2 278,1 273,3 273,9 270,0 265,6 2026 4 970,1 276,1 279,9 275,0 274,9 275,4 264,1 2027 4 987,1 274,6 281,2 277,0 276,0 278,8 267,1 2028 5 003,1 272,8 282,0 279,1 277,1 281,1 271,9 2029 5 018,0 270,9 282,3 281,3 278,4 282,8 277,6
2030 5 031,9 269,0 281,9 283,3 279,7 284,5 282,8 2031 5 044,8 267,3 281,0 285,1 281,4 285,6 288,2 2032 5 056,8 266,1 279,5 286,4 283,4 286,7 291,6 2033 5 068,1 265,2 277,8 287,3 285,5 287,8 293,8 2034 5 078,7 264,9 275,9 287,5 287,7 289,1 295,5

Tables The future population of Sweden 2006–2050
Statistics Sweden 128
Table 5.12a (cont.) Female population by age 1950–2005 and projection 2006–2050. Thousands
Total By age 31 dec.
resp. year 0–4 5–9 10–14 15–19 20–24 25–29
Women
2035 5 088,9 265,1 274,1 287,2 289,7 290,4 297,2 2036 5 098,8 265,7 272,4 286,2 291,5 292,1 298,4 2037 5 108,4 266,6 271,2 284,8 292,8 294,0 299,5 2038 5 118,0 267,9 270,4 283,1 293,7 296,1 300,6 2039 5 127,6 269,5 270,1 281,3 293,9 298,3 301,9 2040 5 137,4 271,1 270,2 279,5 293,6 300,3 303,2 2041 5 147,3 272,8 270,8 277,9 292,6 302,0 304,8 2042 5 157,5 274,6 271,8 276,6 291,3 303,4 306,8 2043 5 168,1 276,3 273,1 275,9 289,5 304,2 308,8 2044 5 178,9 277,9 274,5 275,5 287,7 304,5 311,0
2045 5 190,0 279,5 276,2 275,7 285,9 304,2 312,9 2046 5 201,3 281,0 277,9 276,3 284,4 303,3 314,7 2047 5 212,9 282,4 279,6 277,3 283,2 301,9 316,1 2048 5 224,6 283,7 281,3 278,5 282,4 300,3 317,0 2049 5 236,4 284,8 282,9 280,0 282,1 298,5 317,3
2050 5 248,2 285,9 284,4 281,6 282,3 296,8 317,0
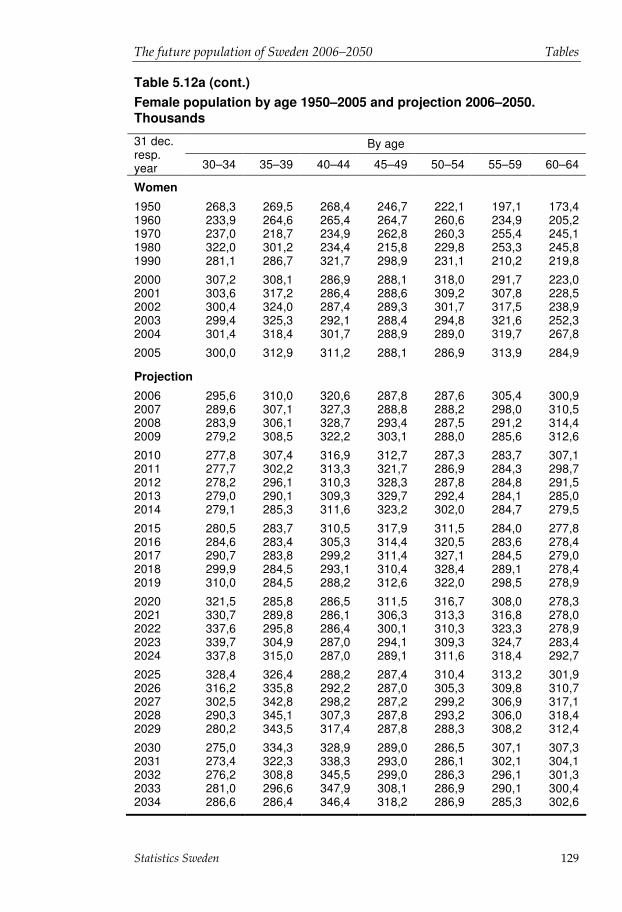
The future population of Sweden 2006–2050 Tables
Statistics Sweden 129
Table 5.12a (cont.) Female population by age 1950–2005 and projection 2006–2050. Thousands
By age 31 dec. resp. year 30–34 35–39 40–44 45–49 50–54 55–59 60–64
Women
1950 268,3 269,5 268,4 246,7 222,1 197,1 173,4 1960 233,9 264,6 265,4 264,7 260,6 234,9 205,2 1970 237,0 218,7 234,9 262,8 260,3 255,4 245,1 1980 322,0 301,2 234,4 215,8 229,8 253,3 245,8 1990 281,1 286,7 321,7 298,9 231,1 210,2 219,8
2000 307,2 308,1 286,9 288,1 318,0 291,7 223,0 2001 303,6 317,2 286,4 288,6 309,2 307,8 228,5 2002 300,4 324,0 287,4 289,3 301,7 317,5 238,9 2003 299,4 325,3 292,1 288,4 294,8 321,6 252,3 2004 301,4 318,4 301,7 288,9 289,0 319,7 267,8
2005 300,0 312,9 311,2 288,1 286,9 313,9 284,9
Projection
2006 295,6 310,0 320,6 287,8 287,6 305,4 300,9 2007 289,6 307,1 327,3 288,8 288,2 298,0 310,5 2008 283,9 306,1 328,7 293,4 287,5 291,2 314,4 2009 279,2 308,5 322,2 303,1 288,0 285,6 312,6
2010 277,8 307,4 316,9 312,7 287,3 283,7 307,1 2011 277,7 302,2 313,3 321,7 286,9 284,3 298,7 2012 278,2 296,1 310,3 328,3 287,8 284,8 291,5 2013 279,0 290,1 309,3 329,7 292,4 284,1 285,0 2014 279,1 285,3 311,6 323,2 302,0 284,7 279,5
2015 280,5 283,7 310,5 317,9 311,5 284,0 277,8 2016 284,6 283,4 305,3 314,4 320,5 283,6 278,4 2017 290,7 283,8 299,2 311,4 327,1 284,5 279,0 2018 299,9 284,5 293,1 310,4 328,4 289,1 278,4 2019 310,0 284,5 288,2 312,6 322,0 298,5 278,9
2020 321,5 285,8 286,5 311,5 316,7 308,0 278,3 2021 330,7 289,8 286,1 306,3 313,3 316,8 278,0 2022 337,6 295,8 286,4 300,1 310,3 323,3 278,9 2023 339,7 304,9 287,0 294,1 309,3 324,7 283,4 2024 337,8 315,0 287,0 289,1 311,6 318,4 292,7
2025 328,4 326,4 288,2 287,4 310,4 313,2 301,9 2026 316,2 335,8 292,2 287,0 305,3 309,8 310,7 2027 302,5 342,8 298,2 287,2 299,2 306,9 317,1 2028 290,3 345,1 307,3 287,8 293,2 306,0 318,4 2029 280,2 343,5 317,4 287,8 288,3 308,2 312,4
2030 275,0 334,3 328,9 289,0 286,5 307,1 307,3 2031 273,4 322,3 338,3 293,0 286,1 302,1 304,1 2032 276,2 308,8 345,5 299,0 286,3 296,1 301,3 2033 281,0 296,6 347,9 308,1 286,9 290,1 300,4 2034 286,6 286,4 346,4 318,2 286,9 285,3 302,6

Tables The future population of Sweden 2006–2050
Statistics Sweden 130
Table 5.12a (cont.) Female population by age 1950–2005 and projection 2006–2050. Thousands
By age 31 dec.
resp. year
30–34 35–39 40–44 45–49 50–54 55–59 60–64
Women
2035 291,7 281,1 337,4 329,7 288,1 283,6 301,6 2036 297,0 279,4 325,5 339,1 292,1 283,2 296,7 2037 300,4 282,2 312,0 346,3 298,0 283,4 290,8 2038 302,7 286,9 299,8 348,8 307,1 284,0 285,0 2039 304,4 292,5 289,6 347,4 317,2 283,9 280,3
2040 306,2 297,6 284,2 338,5 328,6 285,2 278,6 2041 307,3 302,9 282,5 326,7 338,1 289,1 278,2 2042 308,5 306,4 285,2 313,2 345,3 295,0 278,4 2043 309,6 308,7 289,9 301,0 347,8 304,1 279,0 2044 310,9 310,5 295,5 290,9 346,5 314,1 278,9
2045 312,2 312,2 300,6 285,5 337,7 325,4 280,3 2046 313,8 313,4 306,0 283,8 325,9 334,8 284,1 2047 315,8 314,6 309,5 286,4 312,6 341,9 289,9 2048 317,8 315,7 311,8 291,1 300,5 344,5 298,9 2049 319,9 317,0 313,6 296,7 290,4 343,2 308,7
2050 321,9 318,4 315,4 301,8 285,0 334,5 319,9

The future population of Sweden 2006–2050 Tables
Statistics Sweden 131
Table 5.12a (cont.) Female population by age 1950–2005 and projection 2006–2050. Thousands
By age 31 dec.
resp. year
65–69 70–74 75–79 80–84 85–89 90–94 95–99 100+
Women
1950 142,3 110,6 72,5 38,1 17,4 4,3 0,6 0,0 1960 172,8 136,9 93,3 52,9 20,5 5,0 0,9 0,0 1970 211,9 170,1 122,4 72,3 31,0 8,6 1,3 0,1 1980 233,2 209,9 159,9 101,0 48,8 15,3 2,8 0,2 1990 234,7 216,0 185,0 137,2 73,1 25,2 4,9 0,5
2000 197,7 197,6 193,0 151,0 93,5 39,2 8,4 0,8 2001 197,8 195,1 187,3 156,1 93,7 39,9 9,0 0,9 2002 199,0 193,4 183,6 157,5 93,7 40,7 9,2 1,0 2003 204,0 189,2 181,4 159,0 94,0 41,6 9,5 1,0 2004 209,9 187,3 178,1 160,8 94,5 42,5 10,0 1,1
2005 214,8 184,8 176,3 155,8 100,6 43,0 10,4 1,1
Projection
2006 220,0 185,4 174,3 151,8 104,5 43,4 10,8 1,2 2007 230,0 186,8 173,1 149,4 105,8 43,9 11,2 1,3 2008 243,2 191,7 169,6 147,9 107,0 44,1 11,5 1,4 2009 258,3 197,4 168,1 145,4 107,7 44,5 11,7 1,5
2010 275,1 202,2 166,2 144,3 105,2 47,8 11,8 1,5 2011 290,4 207,3 167,0 143,0 103,0 49,9 12,0 1,6 2012 299,7 216,9 168,6 142,4 101,7 50,5 12,2 1,7 2013 303,5 229,6 173,2 139,9 101,2 51,0 12,3 1,7 2014 301,8 244,1 178,7 139,0 99,9 51,3 12,5 1,8
2015 296,6 260,1 183,2 137,8 99,6 50,4 13,6 1,8 2016 288,6 274,7 188,1 138,9 99,2 49,6 14,3 1,8 2017 281,7 283,6 197,1 140,7 99,0 49,1 14,4 1,9 2018 275,6 287,3 209,0 144,9 97,6 49,1 14,5 1,9 2019 270,4 285,7 222,6 149,9 97,3 48,6 14,6 1,9
2020 268,8 280,9 237,4 153,9 96,8 48,7 14,4 2,1 2021 269,4 273,5 250,7 158,3 98,1 48,7 14,3 2,2 2022 270,1 267,1 258,9 166,3 99,8 48,7 14,1 2,3 2023 269,5 261,4 262,4 176,9 103,2 48,1 14,2 2,3 2024 270,2 256,7 261,1 188,9 107,0 48,1 14,1 2,3
2025 269,6 255,3 256,8 201,6 110,1 48,1 14,2 2,3 2026 269,3 256,0 250,2 213,1 113,6 49,0 14,2 2,3 2027 270,3 256,8 244,6 220,2 119,9 50,1 14,3 2,2 2028 274,7 256,4 239,7 223,4 128,2 52,0 14,1 2,3 2029 283,8 257,1 235,6 222,5 137,5 54,2 14,2 2,3
2030 292,9 256,6 234,5 219,0 147,0 55,8 14,2 2,3 2031 301,4 256,5 235,4 213,7 155,4 57,7 14,6 2,3 2032 307,7 257,6 236,3 209,2 160,5 61,3 15,1 2,3 2033 309,1 261,9 236,1 205,4 162,9 66,0 15,7 2,3 2034 303,3 270,7 236,9 202,3 162,5 71,2 16,4 2,3
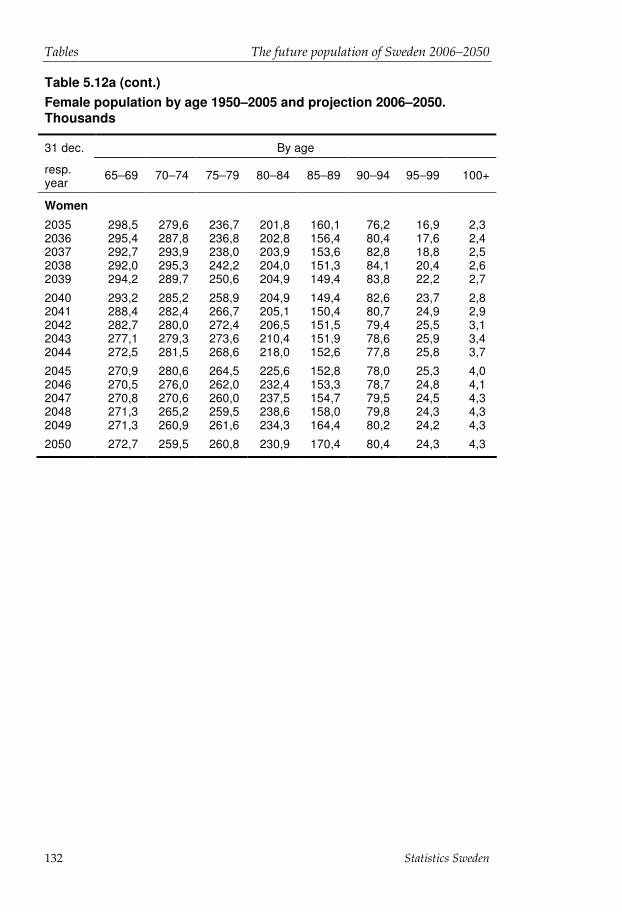
Tables The future population of Sweden 2006–2050
Statistics Sweden 132
Table 5.12a (cont.) Female population by age 1950–2005 and projection 2006–2050. Thousands
By age 31 dec.
resp. year
65–69 70–74 75–79 80–84 85–89 90–94 95–99 100+
Women
2035 298,5 279,6 236,7 201,8 160,1 76,2 16,9 2,3 2036 295,4 287,8 236,8 202,8 156,4 80,4 17,6 2,4 2037 292,7 293,9 238,0 203,9 153,6 82,8 18,8 2,5 2038 292,0 295,3 242,2 204,0 151,3 84,1 20,4 2,6 2039 294,2 289,7 250,6 204,9 149,4 83,8 22,2 2,7
2040 293,2 285,2 258,9 204,9 149,4 82,6 23,7 2,8 2041 288,4 282,4 266,7 205,1 150,4 80,7 24,9 2,9 2042 282,7 280,0 272,4 206,5 151,5 79,4 25,5 3,1 2043 277,1 279,3 273,6 210,4 151,9 78,6 25,9 3,4 2044 272,5 281,5 268,6 218,0 152,6 77,8 25,8 3,7
2045 270,9 280,6 264,5 225,6 152,8 78,0 25,3 4,0 2046 270,5 276,0 262,0 232,4 153,3 78,7 24,8 4,1 2047 270,8 270,6 260,0 237,5 154,7 79,5 24,5 4,3 2048 271,3 265,2 259,5 238,6 158,0 79,8 24,3 4,3 2049 271,3 260,9 261,6 234,3 164,4 80,2 24,2 4,3
2050 272,7 259,5 260,8 230,9 170,4 80,4 24,3 4,3
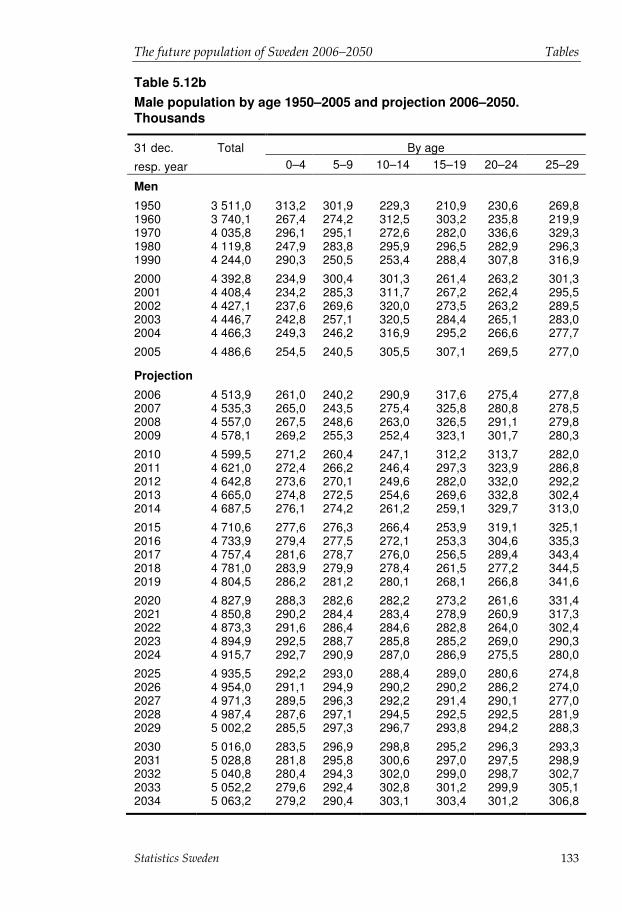
The future population of Sweden 2006–2050 Tables
Statistics Sweden 133
Table 5.12b Male population by age 1950–2005 and projection 2006–2050. Thousands
Total By age 31 dec.
resp. year 0–4 5–9 10–14 15–19 20–24 25–29
Men
1950 3 511,0 313,2 301,9 229,3 210,9 230,6 269,8 1960 3 740,1 267,4 274,2 312,5 303,2 235,8 219,9 1970 4 035,8 296,1 295,1 272,6 282,0 336,6 329,3 1980 4 119,8 247,9 283,8 295,9 296,5 282,9 296,3 1990 4 244,0 290,3 250,5 253,4 288,4 307,8 316,9
2000 4 392,8 234,9 300,4 301,3 261,4 263,2 301,3 2001 4 408,4 234,2 285,3 311,7 267,2 262,4 295,5 2002 4 427,1 237,6 269,6 320,0 273,5 263,2 289,5 2003 4 446,7 242,8 257,1 320,5 284,4 265,1 283,0 2004 4 466,3 249,3 246,2 316,9 295,2 266,6 277,7
2005 4 486,6 254,5 240,5 305,5 307,1 269,5 277,0
Projection
2006 4 513,9 261,0 240,2 290,9 317,6 275,4 277,8 2007 4 535,3 265,0 243,5 275,4 325,8 280,8 278,5 2008 4 557,0 267,5 248,6 263,0 326,5 291,1 279,8 2009 4 578,1 269,2 255,3 252,4 323,1 301,7 280,3
2010 4 599,5 271,2 260,4 247,1 312,2 313,7 282,0 2011 4 621,0 272,4 266,2 246,4 297,3 323,9 286,8 2012 4 642,8 273,6 270,1 249,6 282,0 332,0 292,2 2013 4 665,0 274,8 272,5 254,6 269,6 332,8 302,4 2014 4 687,5 276,1 274,2 261,2 259,1 329,7 313,0
2015 4 710,6 277,6 276,3 266,4 253,9 319,1 325,1 2016 4 733,9 279,4 277,5 272,1 253,3 304,6 335,3 2017 4 757,4 281,6 278,7 276,0 256,5 289,4 343,4 2018 4 781,0 283,9 279,9 278,4 261,5 277,2 344,5 2019 4 804,5 286,2 281,2 280,1 268,1 266,8 341,6
2020 4 827,9 288,3 282,6 282,2 273,2 261,6 331,4 2021 4 850,8 290,2 284,4 283,4 278,9 260,9 317,3 2022 4 873,3 291,6 286,4 284,6 282,8 264,0 302,4 2023 4 894,9 292,5 288,7 285,8 285,2 269,0 290,3 2024 4 915,7 292,7 290,9 287,0 286,9 275,5 280,0
2025 4 935,5 292,2 293,0 288,4 289,0 280,6 274,8 2026 4 954,0 291,1 294,9 290,2 290,2 286,2 274,0 2027 4 971,3 289,5 296,3 292,2 291,4 290,1 277,0 2028 4 987,4 287,6 297,1 294,5 292,5 292,5 281,9 2029 5 002,2 285,5 297,3 296,7 293,8 294,2 288,3
2030 5 016,0 283,5 296,9 298,8 295,2 296,3 293,3 2031 5 028,8 281,8 295,8 300,6 297,0 297,5 298,9 2032 5 040,8 280,4 294,3 302,0 299,0 298,7 302,7 2033 5 052,2 279,6 292,4 302,8 301,2 299,9 305,1 2034 5 063,2 279,2 290,4 303,1 303,4 301,2 306,8

Tables The future population of Sweden 2006–2050
Statistics Sweden 134
Table 5.12b (cont.) Male population by age 1950–2005 and projection 2006–2050. Thousands
Total By age 31 dec.
resp. year 0–4 5–9 10–14 15–19 20–24 25–29
Men
2035 5 074,1 279,4 288,5 302,6 305,5 302,6 308,9 2036 5 084,9 280,0 286,8 301,6 307,3 304,3 310,2 2037 5 095,8 281,1 285,5 300,1 308,7 306,4 311,4 2038 5 106,8 282,4 284,6 298,3 309,6 308,6 312,6 2039 5 118,0 284,0 284,3 296,3 309,8 310,8 313,9 2040 5 129,5 285,8 284,4 294,4 309,4 312,8 315,2 2041 5 141,2 287,6 285,1 292,7 308,4 314,6 316,9 2042 5 153,2 289,5 286,1 291,4 306,9 316,0 318,9 2043 5 165,5 291,3 287,5 290,6 305,1 316,9 321,1 2044 5 177,9 293,0 289,0 290,3 303,1 317,1 323,3
2045 5 190,6 294,7 290,8 290,5 301,3 316,7 325,4 2046 5 203,3 296,3 292,6 291,1 299,6 315,8 327,1 2047 5 216,1 297,7 294,4 292,1 298,3 314,3 328,5 2048 5 228,9 299,1 296,2 293,5 297,5 312,5 329,4 2049 5 241,6 300,3 297,9 295,0 297,2 310,6 329,7
2050 5 254,2 301,4 299,5 296,8 297,4 308,7 329,3
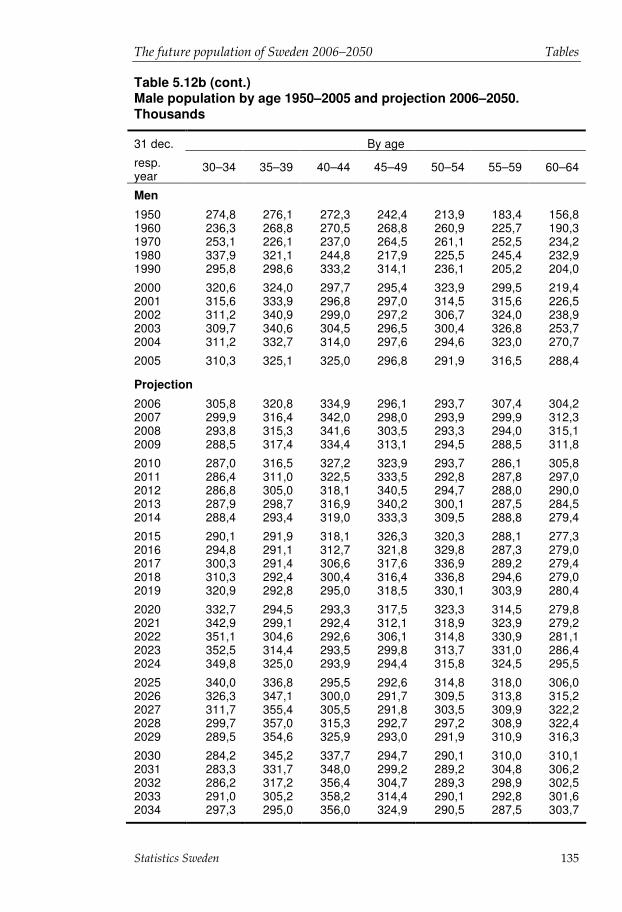
The future population of Sweden 2006–2050 Tables
Statistics Sweden 135
Table 5.12b (cont.) Male population by age 1950–2005 and projection 2006–2050. Thousands
By age 31 dec.
resp. year
30–34 35–39 40–44 45–49 50–54 55–59 60–64
Men
1950 274,8 276,1 272,3 242,4 213,9 183,4 156,8 1960 236,3 268,8 270,5 268,8 260,9 225,7 190,3 1970 253,1 226,1 237,0 264,5 261,1 252,5 234,2 1980 337,9 321,1 244,8 217,9 225,5 245,4 232,9 1990 295,8 298,6 333,2 314,1 236,1 205,2 204,0
2000 320,6 324,0 297,7 295,4 323,9 299,5 219,4 2001 315,6 333,9 296,8 297,0 314,5 315,6 226,5 2002 311,2 340,9 299,0 297,2 306,7 324,0 238,9 2003 309,7 340,6 304,5 296,5 300,4 326,8 253,7 2004 311,2 332,7 314,0 297,6 294,6 323,0 270,7
2005 310,3 325,1 325,0 296,8 291,9 316,5 288,4
Projection
2006 305,8 320,8 334,9 296,1 293,7 307,4 304,2 2007 299,9 316,4 342,0 298,0 293,9 299,9 312,3 2008 293,8 315,3 341,6 303,5 293,3 294,0 315,1 2009 288,5 317,4 334,4 313,1 294,5 288,5 311,8
2010 287,0 316,5 327,2 323,9 293,7 286,1 305,8 2011 286,4 311,0 322,5 333,5 292,8 287,8 297,0 2012 286,8 305,0 318,1 340,5 294,7 288,0 290,0 2013 287,9 298,7 316,9 340,2 300,1 287,5 284,5 2014 288,4 293,4 319,0 333,3 309,5 288,8 279,4
2015 290,1 291,9 318,1 326,3 320,3 288,1 277,3 2016 294,8 291,1 312,7 321,8 329,8 287,3 279,0 2017 300,3 291,4 306,6 317,6 336,9 289,2 279,4 2018 310,3 292,4 300,4 316,4 336,8 294,6 279,0 2019 320,9 292,8 295,0 318,5 330,1 303,9 280,4
2020 332,7 294,5 293,3 317,5 323,3 314,5 279,8 2021 342,9 299,1 292,4 312,1 318,9 323,9 279,2 2022 351,1 304,6 292,6 306,1 314,8 330,9 281,1 2023 352,5 314,4 293,5 299,8 313,7 331,0 286,4 2024 349,8 325,0 293,9 294,4 315,8 324,5 295,5
2025 340,0 336,8 295,5 292,6 314,8 318,0 306,0 2026 326,3 347,1 300,0 291,7 309,5 313,8 315,2 2027 311,7 355,4 305,5 291,8 303,5 309,9 322,2 2028 299,7 357,0 315,3 292,7 297,2 308,9 322,4 2029 289,5 354,6 325,9 293,0 291,9 310,9 316,3
2030 284,2 345,2 337,7 294,7 290,1 310,0 310,1 2031 283,3 331,7 348,0 299,2 289,2 304,8 306,2 2032 286,2 317,2 356,4 304,7 289,3 298,9 302,5 2033 291,0 305,2 358,2 314,4 290,1 292,8 301,6 2034 297,3 295,0 356,0 324,9 290,5 287,5 303,7
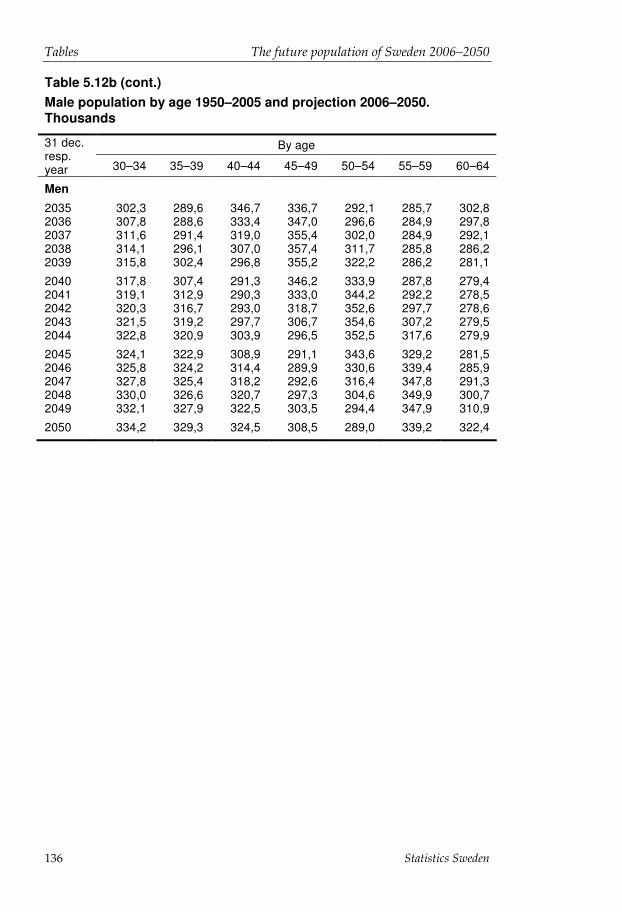
Tables The future population of Sweden 2006–2050
Statistics Sweden 136
Table 5.12b (cont.) Male population by age 1950–2005 and projection 2006–2050. Thousands
By age 31 dec. resp. year 30–34 35–39 40–44 45–49 50–54 55–59 60–64
Men
2035 302,3 289,6 346,7 336,7 292,1 285,7 302,8 2036 307,8 288,6 333,4 347,0 296,6 284,9 297,8 2037 311,6 291,4 319,0 355,4 302,0 284,9 292,1 2038 314,1 296,1 307,0 357,4 311,7 285,8 286,2 2039 315,8 302,4 296,8 355,2 322,2 286,2 281,1
2040 317,8 307,4 291,3 346,2 333,9 287,8 279,4 2041 319,1 312,9 290,3 333,0 344,2 292,2 278,5 2042 320,3 316,7 293,0 318,7 352,6 297,7 278,6 2043 321,5 319,2 297,7 306,7 354,6 307,2 279,5 2044 322,8 320,9 303,9 296,5 352,5 317,6 279,9
2045 324,1 322,9 308,9 291,1 343,6 329,2 281,5 2046 325,8 324,2 314,4 289,9 330,6 339,4 285,9 2047 327,8 325,4 318,2 292,6 316,4 347,8 291,3 2048 330,0 326,6 320,7 297,3 304,6 349,9 300,7 2049 332,1 327,9 322,5 303,5 294,4 347,9 310,9
2050 334,2 329,3 324,5 308,5 289,0 339,2 322,4
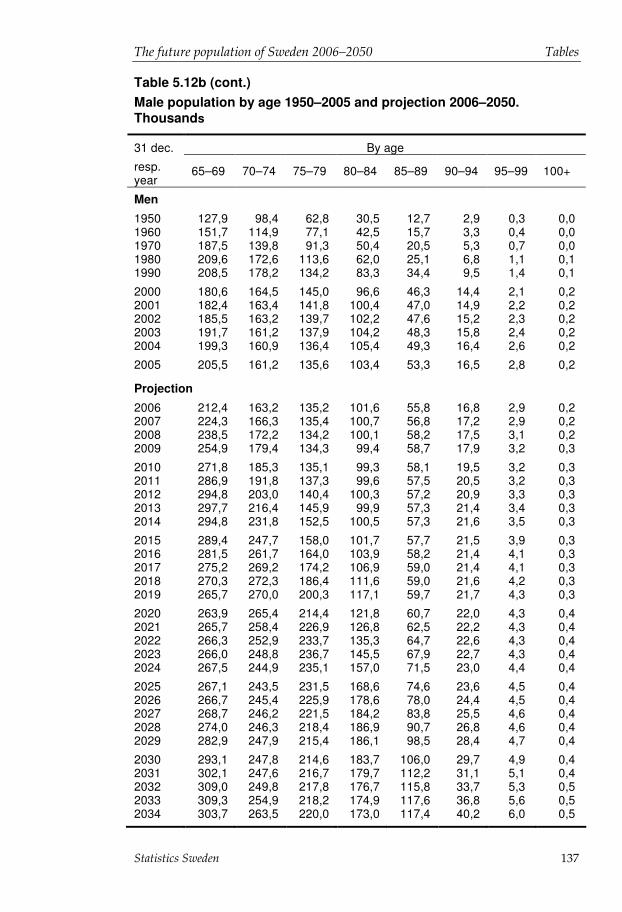
The future population of Sweden 2006–2050 Tables
Statistics Sweden 137
Table 5.12b (cont.) Male population by age 1950–2005 and projection 2006–2050. Thousands
By age 31 dec.
resp. year
65–69 70–74 75–79 80–84 85–89 90–94 95–99 100+
Men
1950 127,9 98,4 62,8 30,5 12,7 2,9 0,3 0,0 1960 151,7 114,9 77,1 42,5 15,7 3,3 0,4 0,0 1970 187,5 139,8 91,3 50,4 20,5 5,3 0,7 0,0 1980 209,6 172,6 113,6 62,0 25,1 6,8 1,1 0,1 1990 208,5 178,2 134,2 83,3 34,4 9,5 1,4 0,1
2000 180,6 164,5 145,0 96,6 46,3 14,4 2,1 0,2 2001 182,4 163,4 141,8 100,4 47,0 14,9 2,2 0,2 2002 185,5 163,2 139,7 102,2 47,6 15,2 2,3 0,2 2003 191,7 161,2 137,9 104,2 48,3 15,8 2,4 0,2 2004 199,3 160,9 136,4 105,4 49,3 16,4 2,6 0,2
2005 205,5 161,2 135,6 103,4 53,3 16,5 2,8 0,2
Projection
2006 212,4 163,2 135,2 101,6 55,8 16,8 2,9 0,2 2007 224,3 166,3 135,4 100,7 56,8 17,2 2,9 0,2 2008 238,5 172,2 134,2 100,1 58,2 17,5 3,1 0,2 2009 254,9 179,4 134,3 99,4 58,7 17,9 3,2 0,3
2010 271,8 185,3 135,1 99,3 58,1 19,5 3,2 0,3 2011 286,9 191,8 137,3 99,6 57,5 20,5 3,2 0,3 2012 294,8 203,0 140,4 100,3 57,2 20,9 3,3 0,3 2013 297,7 216,4 145,9 99,9 57,3 21,4 3,4 0,3 2014 294,8 231,8 152,5 100,5 57,3 21,6 3,5 0,3
2015 289,4 247,7 158,0 101,7 57,7 21,5 3,9 0,3 2016 281,5 261,7 164,0 103,9 58,2 21,4 4,1 0,3 2017 275,2 269,2 174,2 106,9 59,0 21,4 4,1 0,3 2018 270,3 272,3 186,4 111,6 59,0 21,6 4,2 0,3 2019 265,7 270,0 200,3 117,1 59,7 21,7 4,3 0,3
2020 263,9 265,4 214,4 121,8 60,7 22,0 4,3 0,4 2021 265,7 258,4 226,9 126,8 62,5 22,2 4,3 0,4 2022 266,3 252,9 233,7 135,3 64,7 22,6 4,3 0,4 2023 266,0 248,8 236,7 145,5 67,9 22,7 4,3 0,4 2024 267,5 244,9 235,1 157,0 71,5 23,0 4,4 0,4
2025 267,1 243,5 231,5 168,6 74,6 23,6 4,5 0,4 2026 266,7 245,4 225,9 178,6 78,0 24,4 4,5 0,4 2027 268,7 246,2 221,5 184,2 83,8 25,5 4,6 0,4 2028 274,0 246,3 218,4 186,9 90,7 26,8 4,6 0,4 2029 282,9 247,9 215,4 186,1 98,5 28,4 4,7 0,4
2030 293,1 247,8 214,6 183,7 106,0 29,7 4,9 0,4 2031 302,1 247,6 216,7 179,7 112,2 31,1 5,1 0,4 2032 309,0 249,8 217,8 176,7 115,8 33,7 5,3 0,5 2033 309,3 254,9 218,2 174,9 117,6 36,8 5,6 0,5 2034 303,7 263,5 220,0 173,0 117,4 40,2 6,0 0,5

Tables The future population of Sweden 2006–2050
Statistics Sweden 138
Table 5.12b (cont.) Male population by age 1950–2005 and projection 2006–2050. Thousands
By age 31 dec.
resp. year
65–69 70–74 75–79 80–84 85–89 90–94 95–99 100+
Men
2035 297,9 273,4 220,2 173,0 116,2 43,3 6,2 0,5 2036 294,3 282,0 220,5 175,2 113,9 45,7 6,6 0,5 2037 291,0 288,7 222,8 176,5 112,5 47,0 7,2 0,5 2038 290,3 289,2 227,8 177,3 111,8 47,7 7,9 0,6 2039 292,4 284,1 235,9 179,1 111,1 47,7 8,7 0,6
2040 291,6 278,9 245,0 179,5 111,5 47,2 9,3 0,6 2041 286,8 275,7 253,0 180,1 113,2 46,3 9,8 0,7 2042 281,4 272,8 259,2 182,4 114,4 45,9 10,0 0,7 2043 275,7 272,4 259,7 187,0 115,2 45,9 10,1 0,8 2044 270,9 274,4 255,3 194,2 116,5 45,7 10,1 0,9
2045 269,3 273,8 250,9 202,0 116,9 46,0 10,0 0,9 2046 268,6 269,4 248,4 208,9 117,7 46,9 9,8 1,0 2047 268,7 264,4 246,1 214,1 119,6 47,5 9,8 1,0 2048 269,6 259,1 246,0 214,6 123,1 47,9 9,8 1,0 2049 270,0 254,7 248,0 211,2 128,5 48,5 9,8 1,0
2050 271,7 253,4 247,6 207,8 134,0 48,7 9,9 1,0
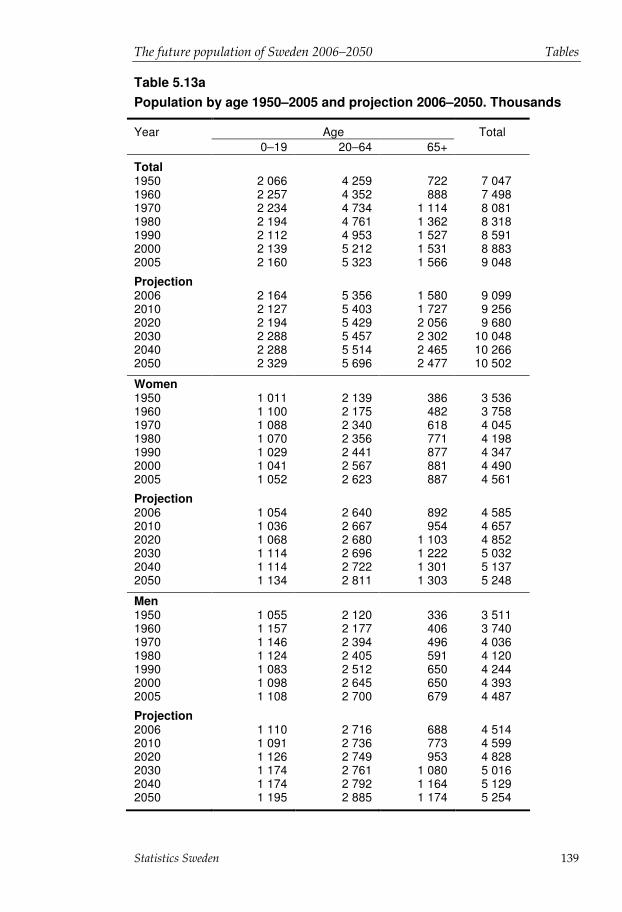
The future population of Sweden 2006–2050 Tables
Statistics Sweden 139
Table 5.13a Population by age 1950–2005 and projection 2006–2050. Thousands
Year Age Total 0–19 20–64 65+
Total 1950 2 066 4 259 722 7 047 1960 2 257 4 352 888 7 498 1970 2 234 4 734 1 114 8 081 1980 2 194 4 761 1 362 8 318 1990 2 112 4 953 1 527 8 591 2000 2 139 5 212 1 531 8 883 2005 2 160 5 323 1 566 9 048
Projection 2006 2 164 5 356 1 580 9 099 2010 2 127 5 403 1 727 9 256 2020 2 194 5 429 2 056 9 680 2030 2 288 5 457 2 302 10 048 2040 2 288 5 514 2 465 10 266 2050 2 329 5 696 2 477 10 502
Women 1950 1 011 2 139 386 3 536 1960 1 100 2 175 482 3 758 1970 1 088 2 340 618 4 045 1980 1 070 2 356 771 4 198 1990 1 029 2 441 877 4 347 2000 1 041 2 567 881 4 490 2005 1 052 2 623 887 4 561
Projection 2006 1 054 2 640 892 4 585 2010 1 036 2 667 954 4 657 2020 1 068 2 680 1 103 4 852 2030 1 114 2 696 1 222 5 032 2040 1 114 2 722 1 301 5 137 2050 1 134 2 811 1 303 5 248
Men 1950 1 055 2 120 336 3 511 1960 1 157 2 177 406 3 740 1970 1 146 2 394 496 4 036 1980 1 124 2 405 591 4 120 1990 1 083 2 512 650 4 244 2000 1 098 2 645 650 4 393 2005 1 108 2 700 679 4 487
Projection 2006 1 110 2 716 688 4 514 2010 1 091 2 736 773 4 599 2020 1 126 2 749 953 4 828 2030 1 174 2 761 1 080 5 016 2040 1 174 2 792 1 164 5 129 2050 1 195 2 885 1 174 5 254

Tables The future population of Sweden 2006–2050
Statistics Sweden 140
Table 5.13b Share of population by age 1950–2005 and projection 2006–2050. Percent
Year Age Total 0–19 20–64 65+
Total 29 60 10 100 1950 30 58 12 100 1960 28 59 14 100 1970 26 57 16 100 1980 25 58 18 100 1990 24 59 17 100 2000 24 59 17 100 2005 Projection 2006 24 59 17 100 2010 23 58 19 100 2020 23 56 21 100 2030 23 54 23 100 2040 22 54 24 100 2050 22 54 24 100 Women 1950 29 60 11 100 1960 29 58 13 100 1970 27 58 15 100 1980 25 56 18 100 1990 24 56 20 100 2000 23 57 20 100 2005 23 58 19 100 Projection 2006 23 58 19 100 2010 22 57 20 100 2020 22 55 23 100 2030 22 54 24 100 2040 22 53 25 100 2050 22 54 25 100 Men 1950 30 60 10 100 1960 31 58 11 100 1970 28 59 12 100 1980 27 58 14 100 1990 26 59 15 100 2000 25 60 15 100 2005 25 60 15 100 Projection 2006 25 60 15 100 2010 24 59 17 100 2020 23 57 20 100 2030 23 55 22 100 2040 23 54 23 100 2050 23 55 22 100
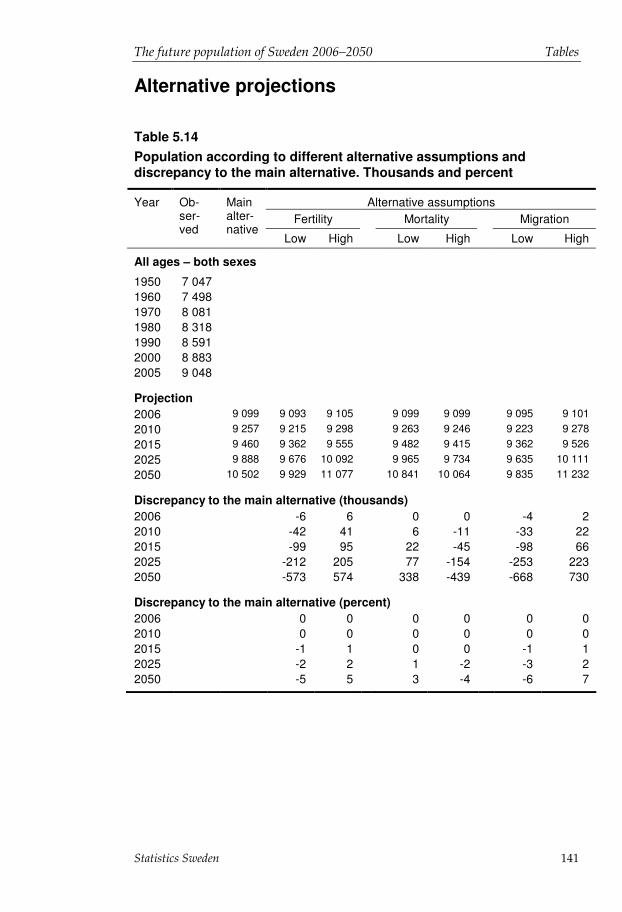
The future population of Sweden 2006–2050 Tables
Statistics Sweden 141
Alternative projections
Table 5.14 Population according to different alternative assumptions and discrepancy to the main alternative. Thousands and percent
Alternative assumptions Fertility Mortality Migration
Year Ob-ser-ved
Main alter-native
Low High Low High Low High
All ages – both sexes
1950 7 047 1960 7 498 1970 8 081 1980 8 318 1990 8 591 2000 8 883 2005 9 048
Projection 2006 9 099 9 093 9 105 9 099 9 099 9 095 9 101 2010 9 257 9 215 9 298 9 263 9 246 9 223 9 278 2015 9 460 9 362 9 555 9 482 9 415 9 362 9 526 2025 9 888 9 676 10 092 9 965 9 734 9 635 10 111 2050 10 502 9 929 11 077 10 841 10 064 9 835 11 232
Discrepancy to the main alternative (thousands) 2006 -6 6 0 0 -4 2 2010 -42 41 6 -11 -33 22 2015 -99 95 22 -45 -98 66 2025 -212 205 77 -154 -253 223 2050 -573 574 338 -439 -668 730
Discrepancy to the main alternative (percent) 2006 0 0 0 0 0 0 2010 0 0 0 0 0 0 2015 -1 1 0 0 -1 1 2025 -2 2 1 -2 -3 2 2050 -5 5 3 -4 -6 7
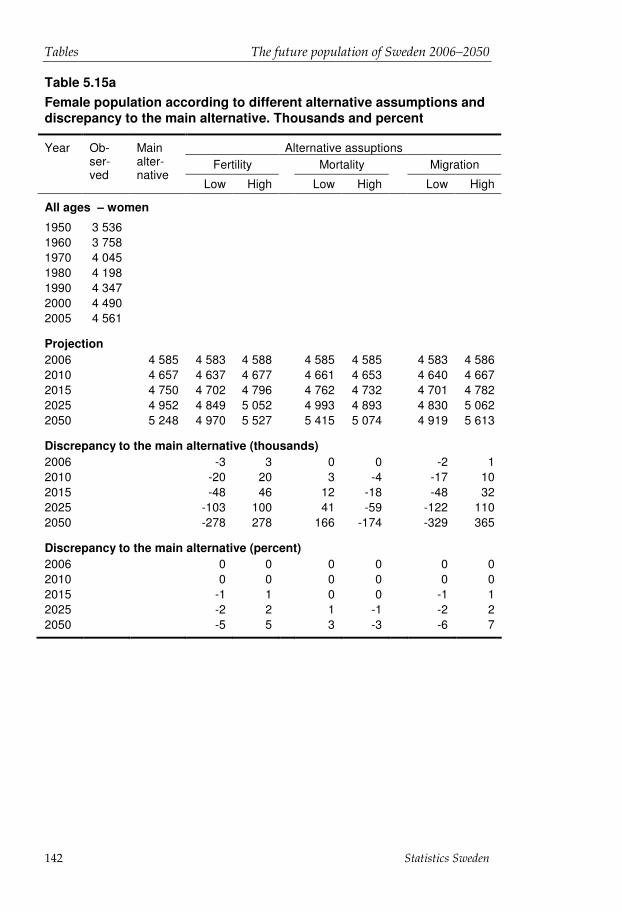
Tables The future population of Sweden 2006–2050
Statistics Sweden 142
Table 5.15a Female population according to different alternative assumptions and discrepancy to the main alternative. Thousands and percent
Alternative assuptions Fertility Mortality Migration
Year Ob-ser-ved
Main alter-native
Low High Low High Low High
All ages – women
1950 3 536 1960 3 758 1970 4 045 1980 4 198 1990 4 347 2000 4 490 2005 4 561
Projection 2006 4 585 4 583 4 588 4 585 4 585 4 583 4 586 2010 4 657 4 637 4 677 4 661 4 653 4 640 4 667 2015 4 750 4 702 4 796 4 762 4 732 4 701 4 782 2025 4 952 4 849 5 052 4 993 4 893 4 830 5 062 2050 5 248 4 970 5 527 5 415 5 074 4 919 5 613
Discrepancy to the main alternative (thousands) 2006 -3 3 0 0 -2 1 2010 -20 20 3 -4 -17 10 2015 -48 46 12 -18 -48 32 2025 -103 100 41 -59 -122 110 2050 -278 278 166 -174 -329 365
Discrepancy to the main alternative (percent) 2006 0 0 0 0 0 0 2010 0 0 0 0 0 0 2015 -1 1 0 0 -1 1 2025 -2 2 1 -1 -2 2 2050 -5 5 3 -3 -6 7

The future population of Sweden 2006–2050 Tables
Statistics Sweden 143
Table 5.15b Male population according to different alternative assumptions and discrepancy to the main alternative. Thousands and percent
Alternative assumptions Fertility Mortality Migration
Year Ob-ser-ved
Main alter-native
Low High Low High Low High
All ages – men
1950 3 511 1960 3 740 1970 4 036 1980 4 120 1990 4 244 2000 4 393 2005 4 487
Projection 2006 4 514 4 511 4 517 4 514 4 514 4 512 4 515 2010 4 599 4 578 4 621 4 602 4 593 4 583 4 611 2015 4 711 4 660 4 759 4 720 4 684 4 660 4 745 2025 4 935 4 827 5 041 4 972 4 841 4 805 5 049 2050 5 254 4 959 5 550 5 426 4 990 4 916 5 619
Discrepancy to the main alternative (thousands) 2006 -3 3 0 0 -2 1 2010 -22 21 3 -7 -17 11 2015 -51 49 9 -27 -50 34 2025 -109 105 36 -95 -131 114 2050 -295 296 172 -265 -338 365
Discrepancy to the main alternative (percent) 2006 0 0 0 0 0 0 2010 0 0 0 0 0 0 2015 -1 1 0 -1 -1 1 2025 -2 2 1 -2 -3 2 2050 -6 6 3 -5 -6 7
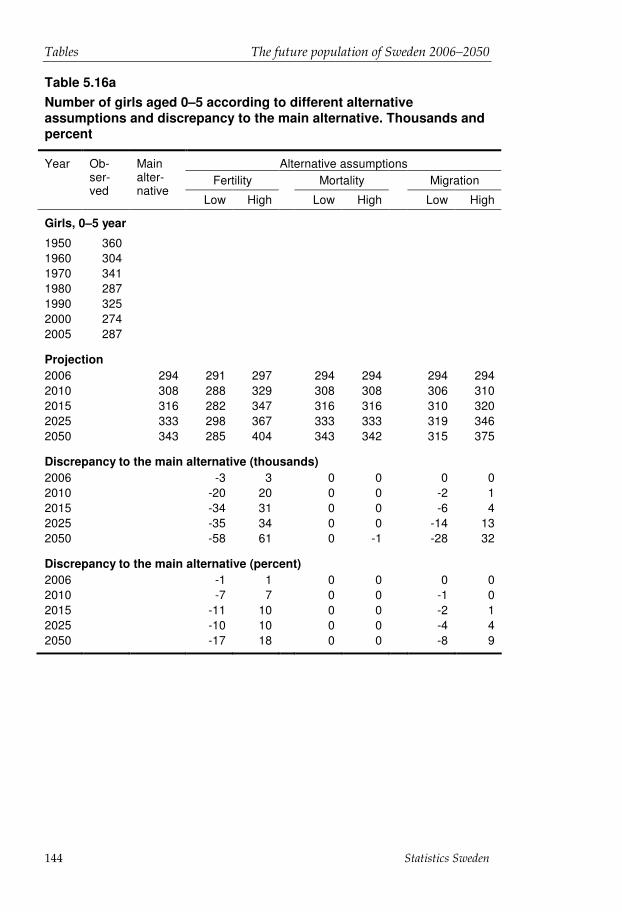
Tables The future population of Sweden 2006–2050
Statistics Sweden 144
Table 5.16a Number of girls aged 0–5 according to different alternative assumptions and discrepancy to the main alternative. Thousands and percent
Alternative assumptions Fertility Mortality Migration
Year Ob-ser-ved
Main alter-native
Low High Low High Low High
Girls, 0–5 year
1950 360 1960 304 1970 341 1980 287 1990 325 2000 274 2005 287
Projection 2006 294 291 297 294 294 294 294 2010 308 288 329 308 308 306 310 2015 316 282 347 316 316 310 320 2025 333 298 367 333 333 319 346 2050 343 285 404 343 342 315 375
Discrepancy to the main alternative (thousands) 2006 -3 3 0 0 0 0 2010 -20 20 0 0 -2 1 2015 -34 31 0 0 -6 4 2025 -35 34 0 0 -14 13 2050 -58 61 0 -1 -28 32
Discrepancy to the main alternative (percent) 2006 -1 1 0 0 0 0 2010 -7 7 0 0 -1 0 2015 -11 10 0 0 -2 1 2025 -10 10 0 0 -4 4 2050 -17 18 0 0 -8 9
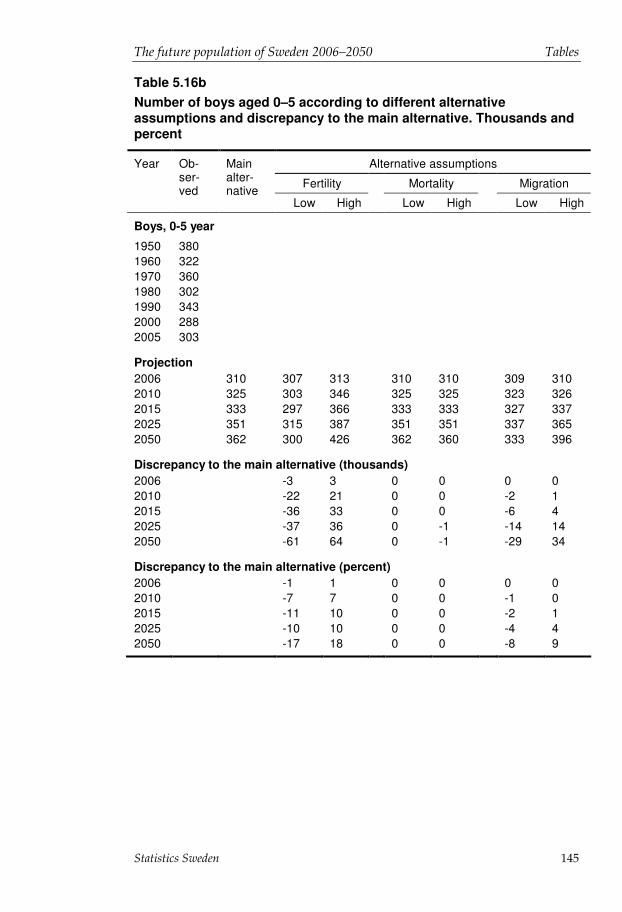
The future population of Sweden 2006–2050 Tables
Statistics Sweden 145
Table 5.16b Number of boys aged 0–5 according to different alternative assumptions and discrepancy to the main alternative. Thousands and percent
Alternative assumptions
Fertility Mortality Migration
Year Ob-ser-ved
Main alter-native
Low High Low High Low High
Boys, 0-5 year
1950 380 1960 322 1970 360 1980 302 1990 343 2000 288 2005 303
Projection 2006 310 307 313 310 310 309 310 2010 325 303 346 325 325 323 326 2015 333 297 366 333 333 327 337 2025 351 315 387 351 351 337 365 2050 362 300 426 362 360 333 396
Discrepancy to the main alternative (thousands) 2006 -3 3 0 0 0 0 2010 -22 21 0 0 -2 1 2015 -36 33 0 0 -6 4 2025 -37 36 0 -1 -14 14 2050 -61 64 0 -1 -29 34
Discrepancy to the main alternative (percent) 2006 -1 1 0 0 0 0 2010 -7 7 0 0 -1 0 2015 -11 10 0 0 -2 1 2025 -10 10 0 0 -4 4 2050 -17 18 0 0 -8 9

Tables The future population of Sweden 2006–2050
Statistics Sweden 146
Table 5.17a Number of girls aged 6–15 according to different alternative assumptions and discrepancy to the main alternative. Thousands and percent
Alternative assumptions
Fertility Mortality Migration
Year Ob-ser-ved
Main alter-native
Low High Low High Low High
Girls, 6-15 year
1950 486 1960 569 1970 530 1980 561 1990 481 2000 572 2005 537
Projection 2006 522 522 522 522 522 521 522 2010 484 484 484 484 484 482 485 2015 510 496 525 510 510 504 514 2025 550 496 602 550 550 531 567 2050 565 487 644 565 563 522 617
Discrepancy to the main alternative (thousands) 2006 0 0 0 0 0 0 2010 0 0 0 0 -2 1 2015 -14 15 0 0 -6 4 2025 -55 51 0 0 -19 17 2050 -78 79 0 -2 -43 52
Discrepancy to the main alternative (percent) 2006 0 0 0 0 0 0 2010 0 0 0 0 0 0 2015 -3 3 0 0 -1 1 2025 -10 9 0 0 -3 3 2050 -14 14 0 0 -8 9

The future population of Sweden 2006–2050 Tables
Statistics Sweden 147
Table 5.17b Number of boys aged 6–15 according to different alternative assumptions and discrepancy to the main alternative. Thousands and percent
Alternative assumptions Fertility Mortality Migration
Year Ob-ser-ved
Main alter-native
Low High Low High Low High
Boys, 6-15 year
1950 506 1960 599 1970 559 1980 589 1990 506 2000 603 2005 565
Projection 2006 549 549 549 549 549 549 549 2010 510 510 510 510 510 508 511 2015 538 523 553 538 538 531 542 2025 580 523 635 580 580 560 598 2050 595 513 679 596 593 550 650
Discrepancy to the main alternative (thousands) 2006 0 0 0 0 0 0 2010 0 0 0 0 -2 1 2015 -15 15 0 0 -6 5 2025 -58 54 0 -1 -20 18 2050 -82 84 0 -2 -45 55
Discrepancy to the main alternative (percent) 2006 0 0 0 0 0 0 2010 0 0 0 0 0 0 2015 -3 3 0 0 -1 1 2025 -10 9 0 0 -3 3 2050 -14 14 0 0 -8 9
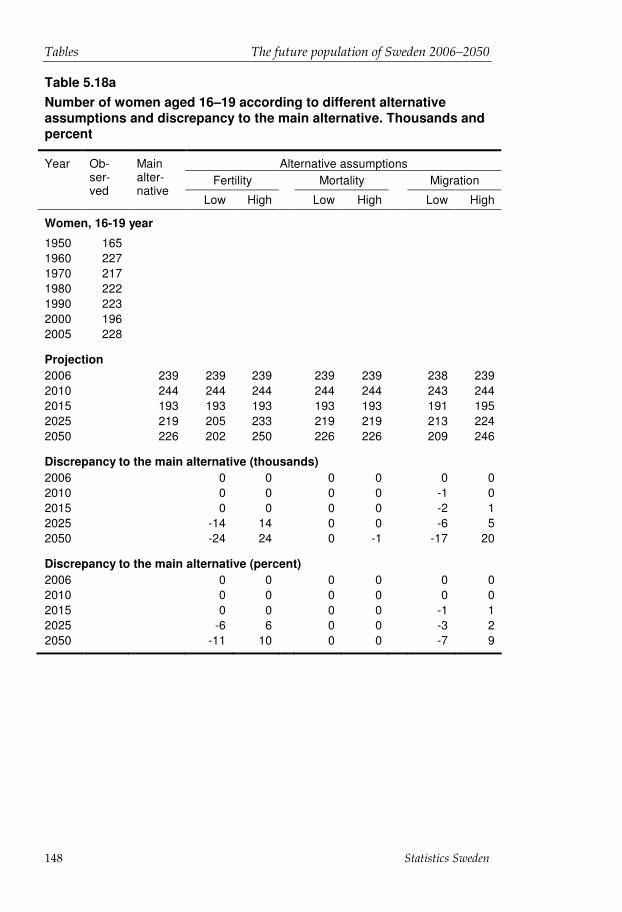
Tables The future population of Sweden 2006–2050
Statistics Sweden 148
Table 5.18a Number of women aged 16–19 according to different alternative assumptions and discrepancy to the main alternative. Thousands and percent
Alternative assumptions Fertility Mortality Migration
Year Ob-ser-ved
Main alter-native
Low High Low High Low High
Women, 16-19 year
1950 165 1960 227 1970 217 1980 222 1990 223 2000 196 2005 228
Projection 2006 239 239 239 239 239 238 239 2010 244 244 244 244 244 243 244 2015 193 193 193 193 193 191 195 2025 219 205 233 219 219 213 224 2050 226 202 250 226 226 209 246
Discrepancy to the main alternative (thousands) 2006 0 0 0 0 0 0 2010 0 0 0 0 -1 0 2015 0 0 0 0 -2 1 2025 -14 14 0 0 -6 5 2050 -24 24 0 -1 -17 20
Discrepancy to the main alternative (percent) 2006 0 0 0 0 0 0 2010 0 0 0 0 0 0 2015 0 0 0 0 -1 1 2025 -6 6 0 0 -3 2 2050 -11 10 0 0 -7 9
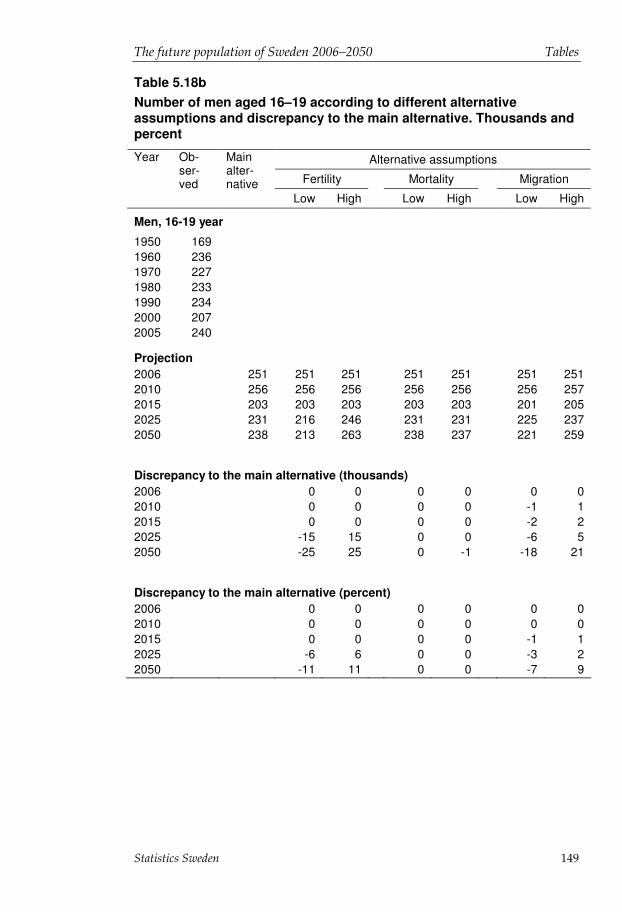
The future population of Sweden 2006–2050 Tables
Statistics Sweden 149
Table 5.18b Number of men aged 16–19 according to different alternative assumptions and discrepancy to the main alternative. Thousands and percent
Alternative assumptions
Fertility Mortality Migration
Year Ob-ser-ved
Main alter-native
Low High Low High Low High
Men, 16-19 year
1950 169 1960 236 1970 227 1980 233 1990 234 2000 207 2005 240
Projection 2006 251 251 251 251 251 251 251 2010 256 256 256 256 256 256 257 2015 203 203 203 203 203 201 205 2025 231 216 246 231 231 225 237 2050 238 213 263 238 237 221 259
Discrepancy to the main alternative (thousands) 2006 0 0 0 0 0 0 2010 0 0 0 0 -1 1 2015 0 0 0 0 -2 2 2025 -15 15 0 0 -6 5 2050 -25 25 0 -1 -18 21
Discrepancy to the main alternative (percent) 2006 0 0 0 0 0 0 2010 0 0 0 0 0 0 2015 0 0 0 0 -1 1 2025 -6 6 0 0 -3 2 2050 -11 11 0 0 -7 9

Tables The future population of Sweden 2006–2050
Statistics Sweden 150
Table 5.19a Number of women aged 20–39 according to different alternative assumptions and discrepancy to the main alternative. Thousands and percent
Alternative assumptions Fertility Mortality Migration
Year Ob-ser-ved
Main alter-native
Low High Low High Low High
Women, 20-39 year
1950 1 031 1960 945 1970 1 082 1980 1 177 1990 1 160 2000 1 160 2005 1 138
Projection 2006 1 137 1 137 1 137 1 137 1 137 1 136 1 138 2010 1 159 1 159 1 159 1 159 1 159 1 150 1 164 2015 1 185 1 185 1 185 1 185 1 185 1 162 1 201 2025 1 190 1 190 1 190 1 190 1 190 1 143 1 236 2050 1 254 1 153 1 352 1 255 1 251 1 153 1 370
Discrepancy to the main alternative (thousands) 2006 0 0 0 0 -1 1 2010 0 0 0 0 -9 5 2015 0 0 0 0 -23 16 2025 0 0 0 -1 -48 46 2050 -101 98 0 -3 -101 116
Discrepancy to the main alternative (percent) 2006 0 0 0 0 0 0 2010 0 0 0 0 -1 0 2015 0 0 0 0 -2 1 2025 0 0 0 0 -4 4 2050 -8 8 0 0 -8 9

The future population of Sweden 2006–2050 Tables
Statistics Sweden 151
Table 5.19b Number of men aged 20–39 according to different alternative assumptions and discrepancy to the main alternative. Thousands and percent
Alternative assumptions Fertility Mortality Migration
Year Ob-ser-ved
Main alter-native
Low High Low High Low High
Men, 20-39 year
1950 1 051 1960 961 1970 1 145 1980 1 238 1990 1 219 2000 1 209 2005 1 182
Projection 2006 1 180 1 180 1 180 1 180 1 180 1 179 1 180 2010 1 199 1 199 1 199 1 199 1 199 1 191 1 205 2015 1 226 1 226 1 226 1 226 1 225 1 203 1 242 2025 1 232 1 232 1 232 1 232 1 230 1 186 1 276 2050 1 301 1 193 1 406 1 303 1 295 1 202 1 414
Discrepancy to the main alternative (thousands) 2006 0 0 0 0 -1 0 2010 0 0 0 0 -8 6 2015 0 0 0 -1 -23 16 2025 0 0 0 -2 -47 44 2050 -108 105 1 -6 -100 113
Discrepancy to the main alternative (percent) 2006 0 0 0 0 0 0 2010 0 0 0 0 -1 0 2015 0 0 0 0 -2 1 2025 0 0 0 0 -4 4 2050 -8 8 0 0 -8 9
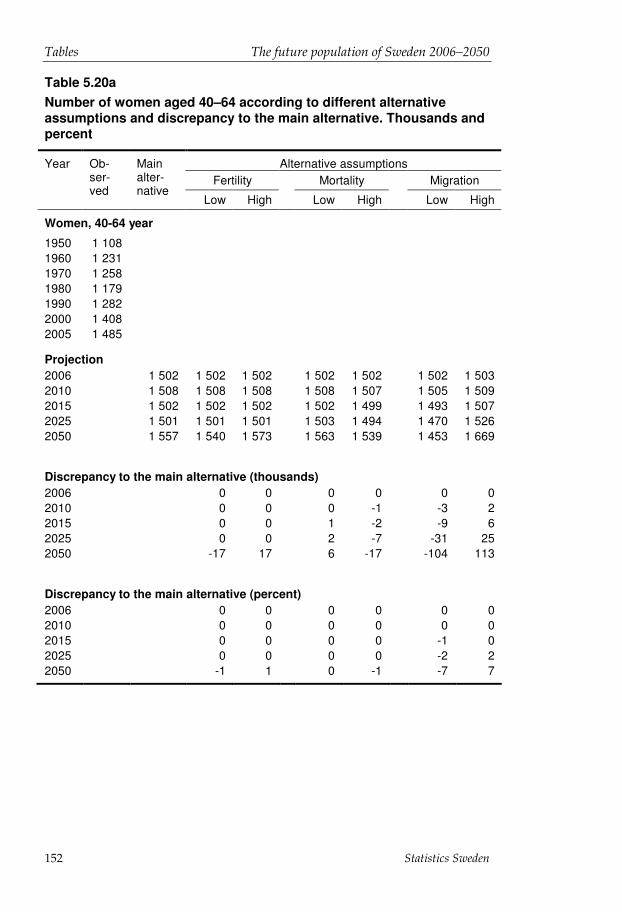
Tables The future population of Sweden 2006–2050
Statistics Sweden 152
Table 5.20a Number of women aged 40–64 according to different alternative assumptions and discrepancy to the main alternative. Thousands and percent
Alternative assumptions Fertility Mortality Migration
Year Ob-ser-ved
Main alter-native
Low High Low High Low High
Women, 40-64 year
1950 1 108 1960 1 231 1970 1 258 1980 1 179 1990 1 282 2000 1 408 2005 1 485
Projection 2006 1 502 1 502 1 502 1 502 1 502 1 502 1 503 2010 1 508 1 508 1 508 1 508 1 507 1 505 1 509 2015 1 502 1 502 1 502 1 502 1 499 1 493 1 507 2025 1 501 1 501 1 501 1 503 1 494 1 470 1 526 2050 1 557 1 540 1 573 1 563 1 539 1 453 1 669
Discrepancy to the main alternative (thousands) 2006 0 0 0 0 0 0 2010 0 0 0 -1 -3 2 2015 0 0 1 -2 -9 6 2025 0 0 2 -7 -31 25 2050 -17 17 6 -17 -104 113
Discrepancy to the main alternative (percent) 2006 0 0 0 0 0 0 2010 0 0 0 0 0 0 2015 0 0 0 0 -1 0 2025 0 0 0 0 -2 2 2050 -1 1 0 -1 -7 7

The future population of Sweden 2006–2050 Tables
Statistics Sweden 153
Table 5.20b Number of men aged 40–64 according to different alternative assumptions and discrepancy to the main alternative. Thousands and percent
Alternative assumptions Fertility Mortality Migration
Year Ob-ser-ved
Main alter-native
Low High Low High Low High
Men, 40-64 year
1950 1 069 1960 1 216 1970 1 249 1980 1 167 1990 1 293 2000 1 436 2005 1 519
Projection 2006 1 536 1 536 1 536 1 536 1 536 1 536 1 536 2010 1 537 1 537 1 537 1 537 1 535 1 534 1 539 2015 1 530 1 530 1 530 1 530 1 526 1 519 1 537 2025 1 527 1 527 1 527 1 528 1 514 1 489 1 556 2050 1 584 1 565 1 601 1 591 1 551 1 478 1 693
Discrepancy to the main alternative (thousands) 2006 0 0 0 0 0 0 2010 0 0 0 -1 -3 2 2015 0 0 0 -5 -11 7 2025 0 0 2 -13 -37 29 2050 -18 18 7 -32 -105 110
Discrepancy to the main alternative (percent) 2006 0 0 0 0 0 0 2010 0 0 0 0 0 0 2015 0 0 0 0 -1 0 2025 0 0 0 -1 -2 2 2050 -1 1 0 -2 -7 7

Tables The future population of Sweden 2006–2050
Statistics Sweden 154
Table 5.21a Number of women aged 65–79 according to different alternative assumptions and discrepancy to the main alternative. Thousands and percent
Alternative assumptions Fertility Mortality Migration
Year Ob-ser-ved
Main alter-native
Low High Low High Low High
Women, 65-79 year
1950 325 1960 403 1970 504 1980 603 1990 636 2000 588 2005 576
Projection 2006 580 580 580 580 580 580 580 2010 644 644 644 644 642 643 644 2015 740 740 740 742 734 739 741 2025 782 782 782 790 764 778 785 2050 793 793 793 818 749 764 819
Discrepancy to the main alternative (thousands) 2006 0 0 0 0 0 0 2010 0 0 1 -1 0 0 2015 0 0 2 -5 -1 1 2025 0 0 8 -18 -4 3 2050 0 0 25 -44 -29 26
Discrepancy to the main alternative (percent) 2006 0 0 0 0 0 0 2010 0 0 0 0 0 0 2015 0 0 0 -1 0 0 2025 0 0 1 -2 -1 0 2050 0 0 3 -6 -4 3
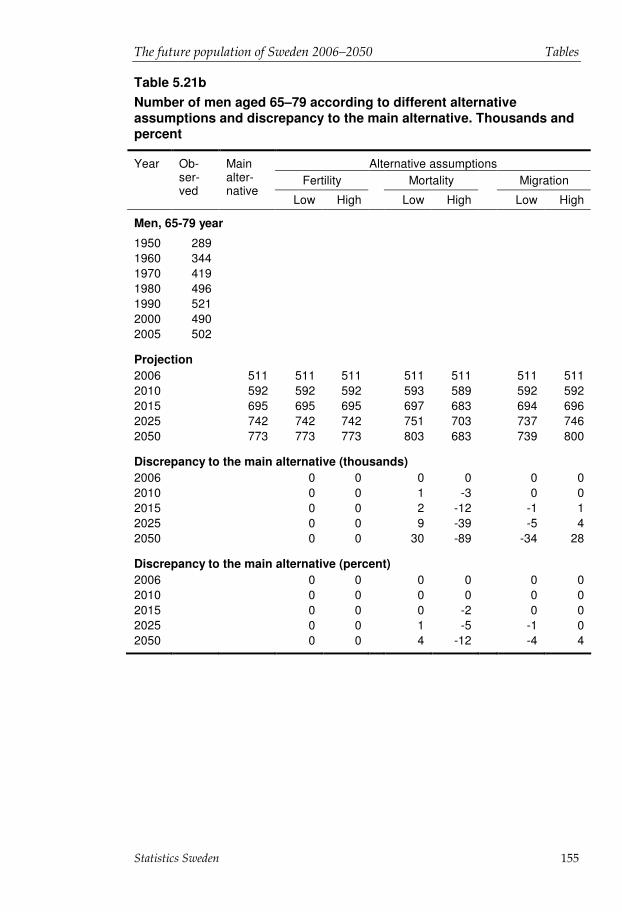
The future population of Sweden 2006–2050 Tables
Statistics Sweden 155
Table 5.21b Number of men aged 65–79 according to different alternative assumptions and discrepancy to the main alternative. Thousands and percent
Alternative assumptions Fertility Mortality Migration
Year Ob-ser-ved
Main alter-native
Low High Low High Low High
Men, 65-79 year
1950 289 1960 344 1970 419 1980 496 1990 521 2000 490 2005 502
Projection 2006 511 511 511 511 511 511 511 2010 592 592 592 593 589 592 592 2015 695 695 695 697 683 694 696 2025 742 742 742 751 703 737 746 2050 773 773 773 803 683 739 800
Discrepancy to the main alternative (thousands) 2006 0 0 0 0 0 0 2010 0 0 1 -3 0 0 2015 0 0 2 -12 -1 1 2025 0 0 9 -39 -5 4 2050 0 0 30 -89 -34 28
Discrepancy to the main alternative (percent) 2006 0 0 0 0 0 0 2010 0 0 0 0 0 0 2015 0 0 0 -2 0 0 2025 0 0 1 -5 -1 0 2050 0 0 4 -12 -4 4
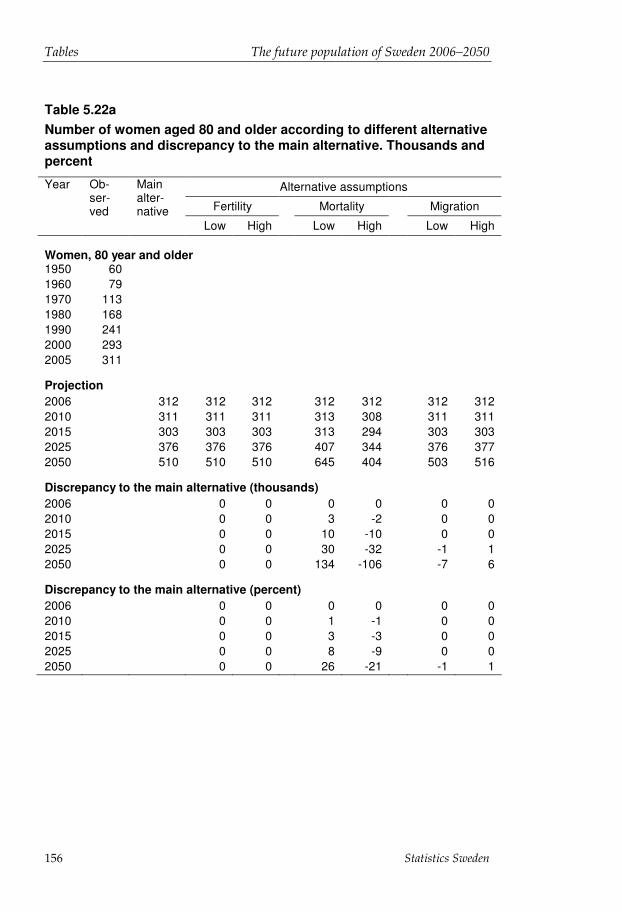
Tables The future population of Sweden 2006–2050
Statistics Sweden 156
Table 5.22a Number of women aged 80 and older according to different alternative assumptions and discrepancy to the main alternative. Thousands and percent
Alternative assumptions
Fertility Mortality Migration
Year Ob-ser-ved
Main alter-native
Low High Low High Low High
Women, 80 year and older 1950 60 1960 79 1970 113 1980 168 1990 241 2000 293 2005 311
Projection 2006 312 312 312 312 312 312 312 2010 311 311 311 313 308 311 311 2015 303 303 303 313 294 303 303 2025 376 376 376 407 344 376 377 2050 510 510 510 645 404 503 516
Discrepancy to the main alternative (thousands) 2006 0 0 0 0 0 0 2010 0 0 3 -2 0 0 2015 0 0 10 -10 0 0 2025 0 0 30 -32 -1 1 2050 0 0 134 -106 -7 6
Discrepancy to the main alternative (percent) 2006 0 0 0 0 0 0 2010 0 0 1 -1 0 0 2015 0 0 3 -3 0 0 2025 0 0 8 -9 0 0 2050 0 0 26 -21 -1 1

The future population of Sweden 2006–2050 Tables
Statistics Sweden 157
Table 5.22b Number of men aged 80 and older according to different alternative assumptions and discrepancy to the main alternative. Thousands and percent
Alternative assumptions Fertility Mortality Migration
Year Ob-ser-ved
Main alter-native
Low High Low High Low High
Men, 80 year and older
1950 46 1960 62 1970 77 1980 95 1990 129 2000 160 2005 176
Projection 2006 177 177 177 177 177 177 177 2010 180 180 180 182 178 180 180 2015 185 185 185 192 176 185 185 2025 272 272 272 297 232 271 272 2050 401 401 401 534 269 394 407
Discrepancy to the main alternative (thousands) 2006 0 0 0 0 0 0 2010 0 0 2 -2 0 0 2015 0 0 7 -9 0 0 2025 0 0 25 -39 -1 0 2050 0 0 133 -133 -8 6
Discrepancy to the main alternative (percent) 2006 0 0 0 0 0 0 2010 0 0 1 -1 0 0 2015 0 0 4 -5 0 0 2025 0 0 9 -14 0 0 2050 0 0 33 -33 -2 1

The future population of Sweden 2006–2050
Statistics Sweden 158

The future population of Sweden 2006–2050 Facts about the statistics
Statistics Sweden 159
Facts about the statistics
Scope of the statistics Population forecasts or projections have been carried out by Statistics Sweden since the 1940s. The main objective for the statistics is to provide projections of Sweden's population, divided by age and sex, as a basis for social planning. Starting with the forecast for the period 2003-2050 onwards, the population has also been divided into Swedish-born people and foreign-born people.
The population forecast presented is based on the population on 31 December 2005 and extends over every year until 31 December 2050.
The forecast has been made every year for the last eight years. Every third year (this year's forecast), a more extensive analysis is carried out of the assumptions with detailed descriptions in the publication series "Demographic reports". In the other years, a more concise report is made in the Statistical Report series.
Definitions and explanations Age-specific fertility rate The number of children born of women of a specific age during one calendar year, in relation (ratio) to the average population of women of the same age. If the period is longer than one year, the ratio's numerator consists of the risk time (average population multiplied by the period's length in years).
Average population Average population during a period.
Cohort - period data The majority of demographic measurements (mortality, fertility, etc.) usually relate to a calendar year and are called period data (cross section). Data on a cohort (people born in a certain year) aim to provide observations during the lifetime of these people, i.e. longitudinally.
Emigrant The term emigrant (Swedish-born and foreign-born) refers to a

Facts about the statistics The future population of Sweden 2006–2050
Statistics Sweden 160
person who on leaving Sweden has the intention of taking up residency abroad for at least one year.
Immigrants In the forecast, we differentiate between re-immigration of Swedish-born people and immigration of foreign-born people. The term immigrant refers to a foreign-born person who on arrival has the intention of taking up residency in Sweden for at least one year.
Mortality risk The number of deceased people of a certain age is divided by the population at the beginning of the period (results are adjusted for migration).
Natural population growth (birth surplus or deficit) The difference between the number of births and the number of deaths.
Net migration The number of immigrants minus the number of emigrants.
Remaining life expectancy The number of years on average that a person has left to live, calculated from different ages. The term "life expectancy" stipulates the life expectancy for a 0 year old. The calculation of life expectancy is carried out in the frame of the life tables (collective name for mortality risks, survival rate and life expectancy).
Total Fertility Rate (TFR) Sum of the age-specific fertility rates. This measurement shows how many children would be born on average of a woman throughout her fertile years (disregarding mortality).
How the statistics are produced The population forecast is based on partial forecasts of the various demographic changes: births, deaths, immigration and emigration.
Model The size of the population at the end of the year is determined using the population in one year age categories at the beginning of a year and the assumptions for the demographic change factors for that year as a basis. This forecasted population then forms the basis for the calculation of the population at the end of the following year.

The future population of Sweden 2006–2050 Facts about the statistics
Statistics Sweden 161
The forecast calculations are carried out for individuals, divided into Swedish-born, foreign-born and for each sex separately. We start with the last known population figure and then move forward from year to year in the way described above.
If x is the age at the end of the year and t is the calendar year, the recursive forecast method can be expressed for ages one year and older at the end of year t as
tx
tx
tx
tx
tx EIDPP −+−= −
−11 where
=txP number of men/women at the end of year t, who were born in
year t-x
=txD number of deceased men/women during year t, who were
born in year t-x
=tx
tx EI , number of immigrants and emigrants (men/women)
during year t, who were born in year t-x.
The basis for this calculation in stages is the population data from the last day in December 2005.
The number of deceased men/women in year t is given by tx
tx
tx qPD ⋅= −
−11
where txq = the forecast mortality risk for one year, or the forecast
probability that a man/woman born in year t-x will die during year t.
The number of emigrated men/women in year t is given by: tx
tx
tx ePE ⋅= −
−11
where txe = forecast annual emigration risk, or the forecast
probability that a man/woman born in year t-x will emigrate during year t. The sub-populations Swedish-born and foreign-born have different emigration risks but the same fertility and mortality risks. Swedish-born people who have at any time been resident abroad and have then returned to Sweden are treated in the same way as people who have never been resident abroad.
Immigration txI is partly an exogenous variable. Re-immigration of
Swedish-born people is calculated using a special routine which takes previous emigration into account.

Facts about the statistics The future population of Sweden 2006–2050
Statistics Sweden 162
The new addition of 0 year olds to the population, i.e. the expected number of births during year t, is given by:
2/)( 11
49
15
tx
tx
x
tx
t PPfF += −−
=�
where the population data relate to the number of women at the beginning and the end of year t and t
xf is the forecast age-specific fertility rate, which gives the expected number of births per women of age x years. The total number of births is included in the Swedish-born population regardless of the country of birth of the parents. In order to calculate the number of 0 year olds at the end of year t, attention is paid to the number of deaths and migrations among these young people.
The forecast model is described in detail in the Background material on Demography, Children and the Family 2005:1, Statistics Sweden's model for population forecasts - a documentation.
Fertility forecasts
Model for calculating fertility The future fertility rate of different ages must be calculated for use in the population forecast. We use the observed relative distribution of births in each cohort up to the first forecast year (measured using incidence figures). During the forecast period, the estimated transitional probabilities, which have been shown to be stable, are used to calculate relative events for the second, third and fourth child who corresponds to the incidence figure. The incidence figure is estimated by:
MBf x
px
px = (incidence figure)
pxB is the number of children born with ordinal position p to all
women of age x years (end of year). xM is the average time lived for women of age x regardless of ordinal position. The measure relates the number of children born with ordinal position p to the total number of women of age x years.
In the model, the incidence figures for the first, second and third child are estimated. The incidence figures for children with an ordinal position of over four have been added to the fourth child.
The total of all incidence figures correspond to the normal age-specific fertility rate:
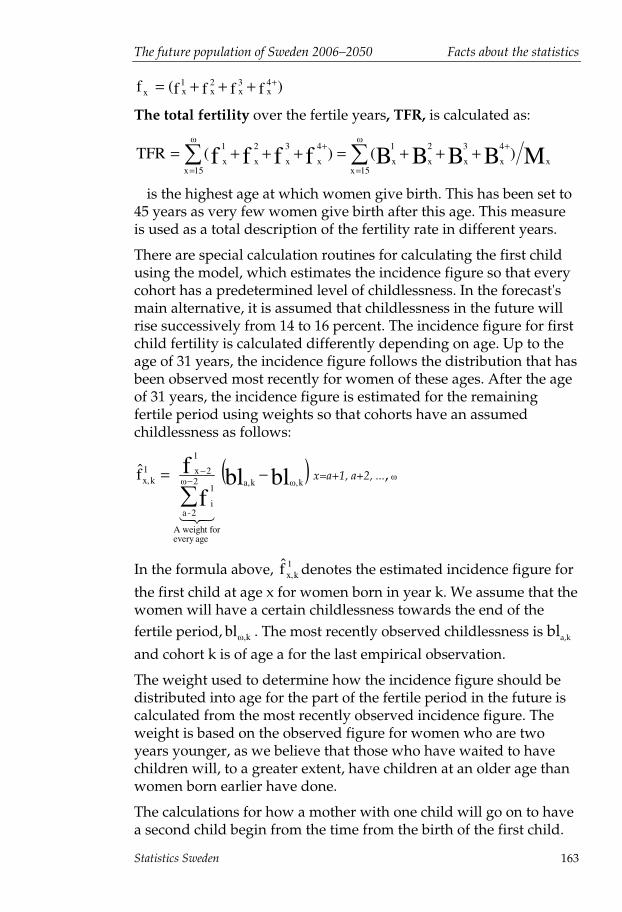
The future population of Sweden 2006–2050 Facts about the statistics
Statistics Sweden 163
)ffff(f 4x
3x
2x
1xx
++++=
The total fertility over the fertile years, TFR, is calculated as:
��=
++
=+++=+++=
�
15xx
4
x
3
x
2
x
1
x
4
x
3
x
2
x
1
x
�
15xMBBBBffff )()(TFR
ù is the highest age at which women give birth. This has been set to 45 years as very few women give birth after this age. This measure is used as a total description of the fertility rate in different years.
There are special calculation routines for calculating the first child using the model, which estimates the incidence figure so that every cohort has a predetermined level of childlessness. In the forecast's main alternative, it is assumed that childlessness in the future will rise successively from 14 to 16 percent. The incidence figure for first child fertility is calculated differently depending on age. Up to the age of 31 years, the incidence figure follows the distribution that has been observed most recently for women of these ages. After the age of 31 years, the incidence figure is estimated for the remaining fertile period using weights so that cohorts have an assumed childlessness as follows:
( )blblf
fk�,ka,
ageevery forA weight
2�
2-a
1
i
1
2x1kx,f̂ −=
�−
−
���
x=a+1, a+2, ..., �
In the formula above, 1kx,f̂ denotes the estimated incidence figure for
the first child at age x for women born in year k. We assume that the women will have a certain childlessness towards the end of the fertile period, k�,bl . The most recently observed childlessness is bla,k
and cohort k is of age a for the last empirical observation.
The weight used to determine how the incidence figure should be distributed into age for the part of the fertile period in the future is calculated from the most recently observed incidence figure. The weight is based on the observed figure for women who are two years younger, as we believe that those who have waited to have children will, to a greater extent, have children at an older age than women born earlier have done.
The calculations for how a mother with one child will go on to have a second child begin from the time from the birth of the first child.

Facts about the statistics The future population of Sweden 2006–2050
Statistics Sweden 164
The share that does go on to give birth to a second child also depends on the woman's age at the birth of their first child. The incidence figure for the second child is estimated for every birth cohort as follows:
p̂ff̂2
j-xj,
1
15
1kj,
2kx, �=
−
=
x
j
where 1kj,f is the incidence figure for the first child of age j for the
cohort born in year k and 2j-xj,p̂ is the estimated probability of a
second child being born x-j years after the first child's birth, given that a woman had their first child at age j. The probability 2
j-xj,p̂ is
estimated using information from 1987-2002 and is evened out to match the information from the last years before the forecast period.
The incidence figures for the third and fourth+ child are estimated in the same way as for the second child.
There are therefore several assumptions behind a fertility rate for one single age category as one point in time, which builds up a complex picture. The advantage of building up fertility rates in this way is that it is possible to explicitly take into account changes in the point of time of the birth of the first child. It is then easier to assess the consequences of compensation at a later age for low fertility at a younger age. Furthermore, consideration can be given more directly to any changes in the share of women going on to have more children and it is easier to add in assumptions about changes in the time between children.
A more detailed description of fertility forecasts is available in Statistics Sweden (2005b) Fertility model - a description of calculations of the number of births.
Fertility for Swedish-born and foreign-born women There are differences in fertility between mothers who were born in different countries, now living in Sweden. When comparing regions of the world, it can be seen that mothers born in the EU25 and in North America in 2004 had a fertility of between 1.6 and 1.7 children per woman, which is roughly the same as mothers born in Sweden (Statistics Sweden, 2005a). Mothers born in Asia and Europe outside the EU25 had a fertility which roughly matches the reproduction, 2.1 children per woman. The highest fertility can be seen in mothers born in Africa, with 2.7 children per woman.

The future population of Sweden 2006–2050 Facts about the statistics
Statistics Sweden 165
There is also a difference in the fertility of foreign-born women in Sweden with Swedish citizenship and those with foreign citizenship. As an example, we can look at the fertility for mothers born in Iraq. The fertility rate for Iraqi citizens was 3.8 and for Swedish citizens born in Iraq, it was 2.1. According to Andersson (2004), immigrant women adapt in the long-term to the Swedish birth patterns.
The forecast model that is used today does not show Swedish-born people with Swedish and foreign citizenship. Both groups are considered as Swedish-born. The fertility rate used in the model is based on the observed figures for Swedish-born and foreign-born mothers. If the share of Swedish-born and foreign-born women of childbearing age changes suddenly, the assumptions could be incorrect.
Statistics Sweden has initiated a study into fertility among foreign-born women. The study aims to produce a good basis for reporting how the group of women with foreign background will change in future forecasts.
Mortality forecasts The risks of death in the forecast are defined using denominations from a normal life table (actuary table).
The number of people surviving to the exact age x, is written as xl in the life table. The average number of people surviving to two closely related exact ages, x and x+1, gives the number of people living in a one year age category (x, x+1), written as xL .
The probability of death, which forms the basis for the calculation of people living xl (exact age x) in the official statistics, appears as follows
xx
xx dR
Dq
+=
where xD is the number of deceased people aged x during calendar
year t, xR is the risk time at age x years (mean population) during
year t and xd is the number of deceased people aged x, who died

Facts about the statistics The future population of Sweden 2006–2050
Statistics Sweden 166
after their birthday during year t16. The probability describes the mortality for a person between the exact ages x and x+1.
The forecast uses the mortality on the basis of cohorts, txq (the
probability of dying for a person born in year t-x during year t) when the projection is carried out. These probabilities are defined as complementary probabilities of surviving to an age between the ages (x-1, x) and the age (x,x+1) at the end of each year. The risks of death in the forecast are defined and calculated using the following measurement17,
000 /1 lLq t −= 0l = radix (“newborns”)
1/1 −−= xxtx LLq 1051 ≤≤ x
)/(1 105106106 +++ −= LLq t
where xl = number of people surviving to exact age x years ( 0l is the survival table's radix= 100 000)
2/)( 1++= xxx llL represents those surviving to an age category (x,x+1).
In the report, the mortality risks according to the cohort method are used unless stated otherwise (x gives the age at the end of the calendar year). In the context of forecasts, therefore, an age displacement takes place according to the system described above of the usual probabilities of death as used in the official statistics.
When deriving the mortality risks for the first forecast year, the most recently observed life table is used (five year calendar period). These relatively stable risks are slightly adjusted to correspond to the first forecast year. The publication of life tables at Statistics Sweden is currently so quick that 3 years forwards in time from the median of the table is sufficient18.
16 See Statistics Sweden's official population statistics. 17 The forecast is carried out for the population in one year age categories with one open age category, 105+. This age category is divided into those surviving in two age categories; firstly those who are 104 at the beginning of the year who are 105 at the end of the calendar year and secondly people of age 105+ years who become 106+ in the same period. 18 In the current forecast (2006-2050), we have used the first year forecast value from the forecast 2003-2050, i.e. a displacement with an adjustment of the base table 3+3 years.

The future population of Sweden 2006–2050 Facts about the statistics
Statistics Sweden 167
To calculate the future change in mortality after the first forecast year, we have used a method advocated by Lee and Carter (Lee and Carter, 1992). According to this method, time parameters (vectors) are determined on the basis of observed mortality data, which can then be extrapolated.
The parameters in the Lee-Carter model are estimated on the basis of the mortality rate and not mortality risks (the probability of dying at a given age). The mortality rate (m) is always slightly higher than the corresponding mortality risk and consists of the ratio between the number of deaths and the time of exposure (mean population) for a given year19, and can be converted back into mortality risks. The mortality rate is, as with mortality risks, divided into sex and one year age categories (x, age at the end of the year).
2/)( 11
tx
tx
txt
x PPD
m+
= −−
,
where d = deaths during year t, P= population at the turn of year t-1 and t for the cohort.
The mortality rate by age and sex (matrix) consists of an origin matrix. The logarithmic values of the matrix in each cell can then be reproduced using the model according to Lee-Carter,
txtxxtx kbam ,, )ln( ε++= ,
xa = age-specific average level of mortality
tk = trends over time in the mortality rate
xb = age-specific weight for trend over time
tx,ε = random terms
It can be noted that if the mortality rate for a given time period lacks a trend-related development or other functional change, it would be sufficient to describe the logarithm of the mortality rate using the average level (first term) and the random term (third term) in the above formula.
19 The mortality rate and mortality risks are approximately the same but differ slightly in later ages.
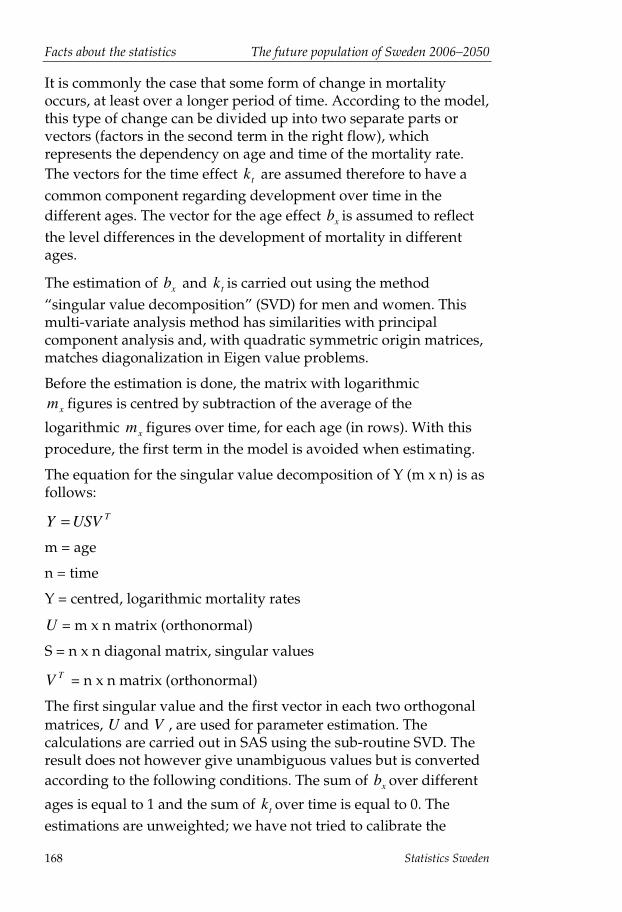
Facts about the statistics The future population of Sweden 2006–2050
Statistics Sweden 168
It is commonly the case that some form of change in mortality occurs, at least over a longer period of time. According to the model, this type of change can be divided up into two separate parts or vectors (factors in the second term in the right flow), which represents the dependency on age and time of the mortality rate. The vectors for the time effect tk are assumed therefore to have a common component regarding development over time in the different ages. The vector for the age effect xb is assumed to reflect the level differences in the development of mortality in different ages.
The estimation of xb and tk is carried out using the method “singular value decomposition” (SVD) for men and women. This multi-variate analysis method has similarities with principal component analysis and, with quadratic symmetric origin matrices, matches diagonalization in Eigen value problems.
Before the estimation is done, the matrix with logarithmic
xm figures is centred by subtraction of the average of the
logarithmic xm figures over time, for each age (in rows). With this procedure, the first term in the model is avoided when estimating.
The equation for the singular value decomposition of Y (m x n) is as follows:
TUSVY =
m = age
n = time
Y = centred, logarithmic mortality rates
U = m x n matrix (orthonormal)
S = n x n diagonal matrix, singular values TV = n x n matrix (orthonormal)
The first singular value and the first vector in each two orthogonal matrices, U and V , are used for parameter estimation. The calculations are carried out in SAS using the sub-routine SVD. The result does not however give unambiguous values but is converted according to the following conditions. The sum of xb over different
ages is equal to 1 and the sum of tk over time is equal to 0. The estimations are unweighted; we have not tried to calibrate the

The future population of Sweden 2006–2050 Facts about the statistics
Statistics Sweden 169
parameter values in relation to the number of deaths. Such an unweighted estimation can be made under the assumption that the inner structure of development over time is homogenous in different ages.
The Lee-Carter method is commonly used on data that extends over very long time periods. In several cases, the whole of the 1900s has been used. We have however found that the age effect is not particularly stable for such long time series. At the beginning of the century, there was primarily a decline in the number of deaths of young people and, at the end of the century, this decline related more to older people (Lundström and Qvist, 2002). We have therefore limited our study to the later period of 1990-2005.
To calculate the future mortality, the time vector, tk is extrapolated. This can be done using an ARIMA model. We have chosen to apply a simple variation by assuming that the development is linear20. It is clear from the model that the annual changes show the relative changes in the mortality rate21.
When applying the Lee-Carter method, we have concentrated on estimations of the ages over 40. We have done so to make the structure of mortality as homogenous as possible, dominated by chronic diseases. The number of deaths in these ages is a determining factor for the forecast, as the majority of deaths occur in these ages.
For the younger ages, 0-40 years, we use the technique used in previous forecasts. For reasons of stability when estimating, we have also done the same for the higher ages, 91-106+ years. In the age groups mentioned, the ratios between the life tables for the two neighbouring five year periods have been used for the calculations of change.
The actual change figures often changes relatively slowly over time and can be approximated by the average annual change
xr calculated as follows:
20 We then get the average annual time change as the difference between the last and first values in the kt curve, divided by the number of points in time minus one (slope coefficient). We can obtain the relative annual change factors, intended for extrapolation of mortality rates by age, by weighting the slope by the age factor. Some equalisation is required. The projection of mortality implies that the slope coefficient is multiplied by the number of years being forecast. 21 It can be noted that the changes are roughly the same for the mortality rate as for the corresponding mortality risks in the case presented here.
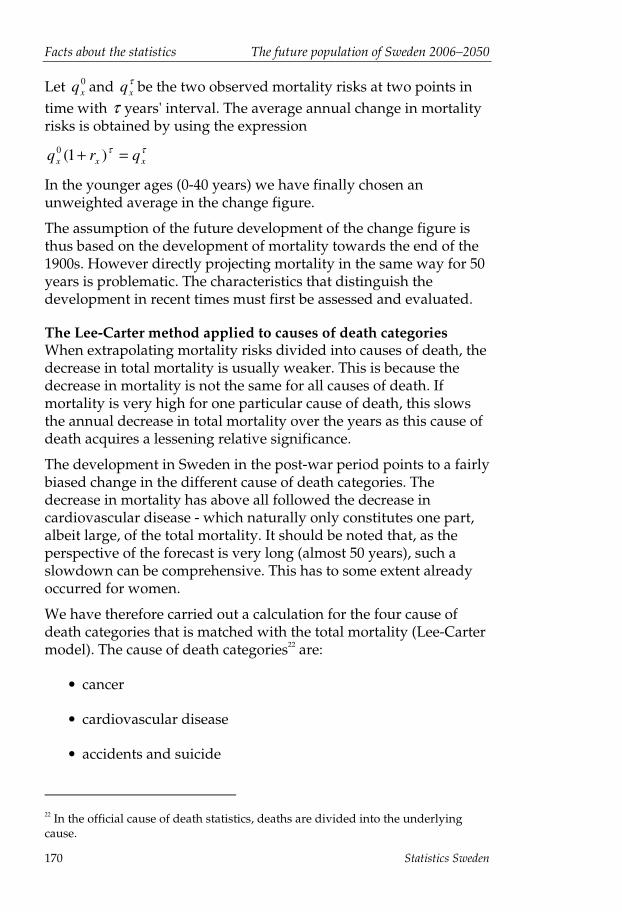
Facts about the statistics The future population of Sweden 2006–2050
Statistics Sweden 170
Let 0xq and τ
xq be the two observed mortality risks at two points in time with τ years' interval. The average annual change in mortality risks is obtained by using the expression
ττxxx qrq =+ )1(0
In the younger ages (0-40 years) we have finally chosen an unweighted average in the change figure.
The assumption of the future development of the change figure is thus based on the development of mortality towards the end of the 1900s. However directly projecting mortality in the same way for 50 years is problematic. The characteristics that distinguish the development in recent times must first be assessed and evaluated.
The Lee-Carter method applied to causes of death categories When extrapolating mortality risks divided into causes of death, the decrease in total mortality is usually weaker. This is because the decrease in mortality is not the same for all causes of death. If mortality is very high for one particular cause of death, this slows the annual decrease in total mortality over the years as this cause of death acquires a lessening relative significance.
The development in Sweden in the post-war period points to a fairly biased change in the different cause of death categories. The decrease in mortality has above all followed the decrease in cardiovascular disease - which naturally only constitutes one part, albeit large, of the total mortality. It should be noted that, as the perspective of the forecast is very long (almost 50 years), such a slowdown can be comprehensive. This has to some extent already occurred for women.
We have therefore carried out a calculation for the four cause of death categories that is matched with the total mortality (Lee-Carter model). The cause of death categories22 are:
• cancer
• cardiovascular disease
• accidents and suicide
22 In the official cause of death statistics, deaths are divided into the underlying cause.

The future population of Sweden 2006–2050 Facts about the statistics
Statistics Sweden 171
• other diseases
When estimating the parameters in the Lee-Carter model, the mortality rate for different cause of death categories is used in five year age categories (in the interval 40-79 years) and for the time period 1978-2000 (the estimation remains from the previous forecast 2003-2050). When extrapolating the mortality rate in each cause of death category, it is assumed that the relative changes (decreases) are constant from year to year until 2050. The decrease in the summed extrapolated figures for the cause of death categories for a given age can then be compared at different points in time.
When comparing between the average decrease in total mortality over the whole forecast period (2003-2050) and the decrease at the beginning of the forecast period (2003-2004), the average decrease in different ages was considerably lower. In the younger ages in the interval 40-79 years however the differences were relatively small. If we limit the study to those aged over 55 in the given age interval, the decrease was on average around 25 percent lower. The decrease for middle-aged men which was 2.25 percent per year according to the previous total mortality forecast was thereby reduced to 1.7 percent (0.75 x 2.25 percent) during a large part of the forecast period23. At the end of the forecast period, the decrease was close to 50 percent compared to the beginning of the forecast period, which led to a change in the reduction, 0.5 x 2.25 = 1.1 percent. It can also be added that women had a slightly faster reduction than men. The calculations are unweighted averages of the specified ages for men and women together in the forecast.
One question that is often asked about the technique of division into causes of death is whether a simple summing up of the mortality rates can be accepted as we go back to the extrapolated total mortality. As long as we are working with the mortality rate (transition intensity), it is mathematically correct to carry out a simple summing up. However, there is a risk that we do not sufficiently take into account the relationships between the different causes of death. An example in this respect is that people who are very old may have overlapping causes of death. As we only work here with one cause of death per death (the underlying cause), distortions may occur. In higher ages, there may be multiple causes of death (cardiovascular disease may occur as a contributing cause
23 The extrapolation results without a division into cause of death categories from the Lee-Carter model are applicable until 2015.

Facts about the statistics The future population of Sweden 2006–2050
Statistics Sweden 172
of death). To avoid this problem as far as possible, we have excluded the highest age groups and only carried out the analysis on ages up to 80 years24. However we expect that the above de-escalation in the reduction is also applicable for ages over 80 years.
Migration forecasts The forecast25 divides the migration to and from Sweden into four flows: the emigration of Swedish-born people, the re-immigration of Swedish-born people, the immigration of foreign-born people and the re-emigration of foreign-born people. Every flow is divided into age (one year categories) and into men and women.
The immigration of foreign-born people (IB) is determined outside of the forecast model while the other three flows (EB, EA and IA) are calculated in the model (risks).
Net migration, also called the immigration surplus, indicates how these four flows affect the size of the population annually. The immigration surplus is given by the difference between immigration and emigration for Swedish-born and foreign-born people, IA + IB - EA - EB
.
Emigration of Swedish-born people The emigration of Swedish-born men and women is calculated using an emigration risk, xAk
u , , which is the product of a 5-year
average, xAku , , a scale factor, Ac and a trend factor, tf t. In the
forecast, we assume that the emigration risks of Swedish-born people will develop over time as follows:
tAxA
txA tfcuu
kk⋅⋅= ,, ,
24 There is another problem relating to the relationship between different causes of death, consisting of "disturbances" in the risk structure of changed survival rates. If the survival rate for one cause of death increases for some reason, such as a new medical treatment, the share with high risk behaviour increases paradoxically in the population (e.g. more heavy smokers can survive). The mortality rate for the other causes of death that are also related to smoking can then increase. Even if such shifts can occur, the age limitations we have imposed should also in this case reduce the problem (mortality is relatively low). Another reason is that illnesses often have a complex background which can mean that the effect on the composition of risks can be more unspecific with a change in the survival rate. 25 The migration part of the forecast is under development. Work is now ongoing to develop a model and the estimation methods to be used.

The future population of Sweden 2006–2050 Facts about the statistics
Statistics Sweden 173
where xAku , is given by the following expression:
�
�
=
−−
== 2005
2001
11,
2005
2001,
,
τ
τ
τ
τ
xA
xA
xA
k
k
k
P
Uu ,
106,,1 �=x refers to the individual's age at the end of the year
Ak refers to the Swedish-born men or women, k = {man, woman} τ
xAkU , is the number of emigrants in year τ
11,
−−
τxAk
P is the number of individuals in the population at the end of
year 1−τ .
cA is a factor that adjusts the share of emigrants for the forecast in 2006 so that the number of Swedish-born emigrants matches the number observed in 2005. The scale factor is given by the following expression:
�
�
=−
=
⋅≈ 106
1
20051,,
106
1
2005,
xxAxA
xxA
A
kk
k
Pu
Uc .
tf t is a trend factor where
���
���
�
=⋅
=⋅
=
= −
−
.2050,,2020 0101,10202,1
2019,,20100101,10202,1
2009,,20070202,1
113
20093
2006
�
�
�
t
t
t
tf t
t
t
The reasoning that forms the basis for how the trend develops over time is described in more detail in Chapter 3.
The formula above describes how large the share of emigrants is in all age groups with the exception of children who were born in Sweden during each forecast year, i.e. newborn babies of 0 years. In the calculations, we cannot for obvious reasons use the one year younger population of the previous year, which is done for the other age groups.
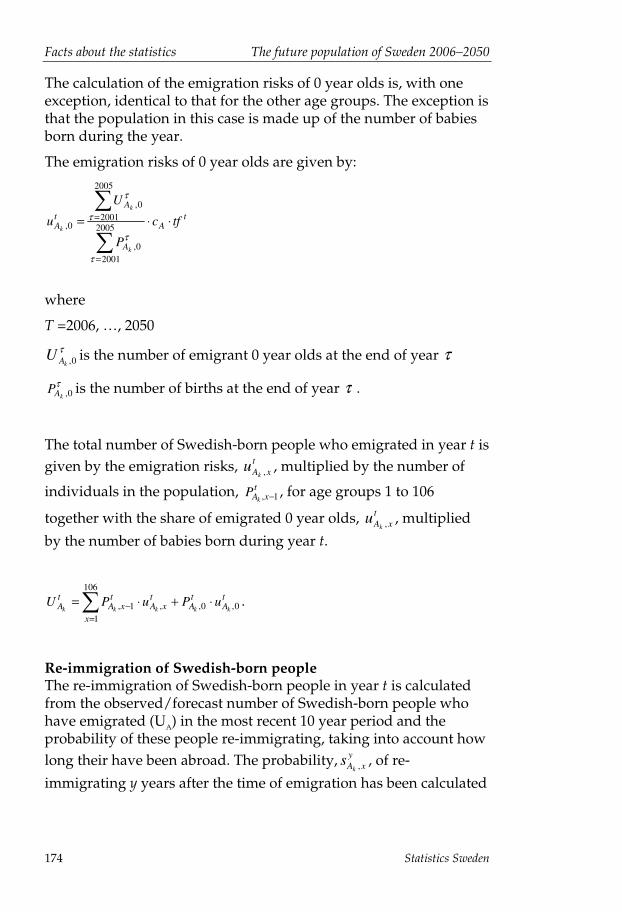
Facts about the statistics The future population of Sweden 2006–2050
Statistics Sweden 174
The calculation of the emigration risks of 0 year olds is, with one exception, identical to that for the other age groups. The exception is that the population in this case is made up of the number of babies born during the year.
The emigration risks of 0 year olds are given by:
tA
A
AtA tfc
P
U
u
k
k
k⋅⋅=
�
�
=
=2005
20010,
2005
20010,
0,
τ
τ
τ
τ
where
T =2006, …, 2050 τ
0,kAU is the number of emigrant 0 year olds at the end of year τ
τ0,kAP is the number of births at the end of year τ .
The total number of Swedish-born people who emigrated in year t is given by the emigration risks, t
xAku , , multiplied by the number of
individuals in the population, txAk
P 1, − , for age groups 1 to 106
together with the share of emigrated 0 year olds, txAk
u , , multiplied
by the number of babies born during year t.
tA
tA
txA
x
txA
tA kkkkk
uPuPU 0,0,,
106
11, ⋅+⋅=�
=− .
Re-immigration of Swedish-born people The re-immigration of Swedish-born people in year t is calculated from the observed/forecast number of Swedish-born people who have emigrated (UA) in the most recent 10 year period and the probability of these people re-immigrating, taking into account how long their have been abroad. The probability, y
xAks , , of re-
immigrating y years after the time of emigration has been calculated
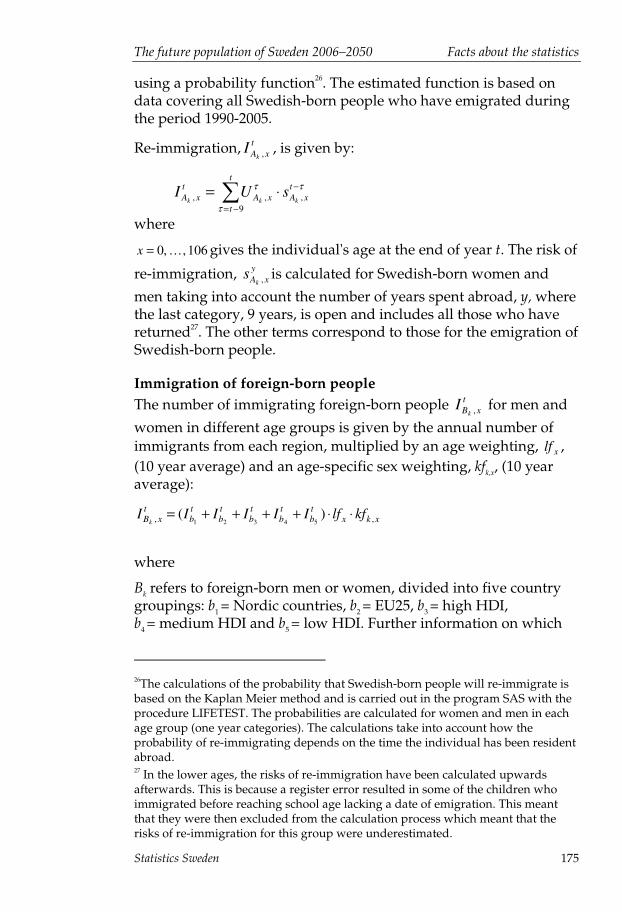
The future population of Sweden 2006–2050 Facts about the statistics
Statistics Sweden 175
using a probability function26. The estimated function is based on data covering all Swedish-born people who have emigrated during the period 1990-2005.
Re-immigration, txAk
I , , is given by:
�−=
−⋅=t
t
txAxA
txA kkk
sUI9
,,,τ
ττ
where
106,,0 �=x gives the individual's age at the end of year t. The risk of
re-immigration, yxAk
s , is calculated for Swedish-born women and
men taking into account the number of years spent abroad, y, where the last category, 9 years, is open and includes all those who have returned27. The other terms correspond to those for the emigration of Swedish-born people.
Immigration of foreign-born people The number of immigrating foreign-born people t
xBkI , for men and
women in different age groups is given by the annual number of immigrants from each region, multiplied by an age weighting, xlf , (10 year average) and an age-specific sex weighting, kfk,x, (10 year average):
xkxtb
tb
tb
tb
tb
txB kflfIIIIII
k ,, )(54321
⋅⋅++++=
where
Bk refers to foreign-born men or women, divided into five country groupings: b1 = Nordic countries, b2 = EU25, b3 = high HDI, b4 = medium HDI and b5 = low HDI. Further information on which
26The calculations of the probability that Swedish-born people will re-immigrate is based on the Kaplan Meier method and is carried out in the program SAS with the procedure LIFETEST. The probabilities are calculated for women and men in each age group (one year categories). The calculations take into account how the probability of re-immigrating depends on the time the individual has been resident abroad. 27 In the lower ages, the risks of re-immigration have been calculated upwards afterwards. This is because a register error resulted in some of the children who immigrated before reaching school age lacking a date of emigration. This meant that they were then excluded from the calculation process which meant that the risks of re-immigration for this group were underestimated.

Facts about the statistics The future population of Sweden 2006–2050
Statistics Sweden 176
countries are included in which country grouping can be found in Chapter 3.
xlf is an age weighting,
kfk,x is the share of women and men in each age category.
xlf , the age weighting can be written as:
�
�
=
== 2005
1996
2005
1996
)(τ
τ
τ
τ
B
B
x
I
Ilf
x
for
��������� �= .
The age-specific sex weighting can be written as:
�
�
=
=
+= 2005
1996,,
2005
1996,
,
)(τ
ττ
τ
τ
xBxB
xB
xk
kvinnaman
k
II
I
kf for ��������� �= .
The assumption on the number of immigrants is based as mentioned earlier on previously observed immigration to Sweden, the monitoring of world events and reference group discussions. The reasoning behind this and a more detailed description is given in Chapter 3.
Re-emigration of foreign-born people The re-emigration of foreign-born men and women is calculated using a risk of emigration, xBk
u , , which is based on a 5 year average
of the share of emigrating foreign-born people, xBku , , adjusted by
factor, Bc , and multiplied by a factor related to the composition of
the foreign-born population, tsf , changes over time, as follows:
tBxB
txb sfcuu
kk⋅⋅= ,, .
The five year average for the share of emigrating foreign-born people, xBk
u , , has been calculated as follows:

The future population of Sweden 2006–2050 Facts about the statistics
Statistics Sweden 177
�
�
=
−−
== 2005
2001
11,
2005
2001,
,
τ
τ
τ
τ
xB
xB
xB
k
k
k
P
U
u .
cB is an adjustment factor of the same type as cA, i.e.
�
�
=−
=
⋅≈ 106
1
20051,,
106
1
2005,
xxBxB
xxB
B
kk
k
Pu
U
c .
tsf is a scale factor, adjusting the risk for emigration over time. It is
dependent on how the composition of foreign-born people from different country groupings develops over time. The factor takes into account to what extent the foreign-born part of the population comes from country groupings with a high or low inclination to re-emigrate.
As the population forecast calculates the foreign-born population as a unified group and does not forecast every country grouping separately, the scale factor, tsf , is based on a rough estimation. The five country groupings are divided on the basis of whether the risk of emigration is high or low. The factor calculates how the share with a high risk of emigration in the foreign-born population changes during the forecast period 2006-2050. It does not take into account age or sex. As the share of foreign-born people with a high risk of emigration falls, the inclination to emigrate among the foreign-born population also falls.
The population in the country groupings is calculated by adding together the previous year's sub-population and the net immigration figure for the relevant forecast year.
tb
tb
tb iii
NPP += −1 for country grouping i = 1, …, 5 and
t = 2006, …, 2050

Facts about the statistics The future population of Sweden 2006–2050
Statistics Sweden 178
where
�=
=106
0
2005,
2005
xxbb ii
PP
and
)1( 2005
1996
2005
1996
�
�
=
=−⋅=
τ
τ
τ
τ
i
i
ii
b
btb
tb
I
U
IN .
The net immigration figure is calculated approximately as the number of emigrants in relation to the number of immigrants over the last observed 10 year period, i.e. over the period 1996-2005.
Foreign-born people from the Nordic countries (i=1), the EU member states (i=2) and countries with a high HDI (i=3) have a high inclination to re-emigrate. When their share in the foreign-born population decreases, the scale factor adjusts the risks of re-emigration downwards for the foreign-born population, as follows:
2006hh
sft
t =
where
tB
i
tb
i
tb
i
tb
t
P
P
P
P
hi
i
i �
�
�=
=
= ==
3
15
1
3
1 .
The scale factor is thus described as an index with 2006 as the base year.
The total number of foreign-born people who emigrate in year t is given by the share of emigrants, t
xBku , , multiplied by the
population, txBk
P 1, − , summed for the ages 1 to 106 years.
The future population of Sweden 2006–2050 Facts about the statistics
Statistics Sweden 179
txB
x
txB
tB kkk
uPU ,
106
11, ⋅=�
=− .
The emigration of children born outside of Sweden, 0 year olds, is considered insignificant.
Accuracy of the statistics The projections deal with the future and measurements of accuracy as used in traditional statistics cannot therefore be calculated.
The size and compilation of the future population is determined by the start population and by the demographic change factors: fertility, mortality and international migration. The accuracy regarding the population born before the beginning of the forecast period is considered to be very good during the first part of the forecast period but gradually decreasing. The accuracy regarding those born during the forecast period is naturally lower.
One way to express uncertainty is to use alternative forecasts; low, medium and high assumptions for each of the change factors. This also provides a basis for partial variations of the factors.
In general, the following applies:
- for the coming years, the forecast is relatively certain but becomes more uncertain the further forward in time it goes. Uncertainty is greater in the forecast's calculations for older people.
- the forecast is the most accurate for people born in the period before the forecast begins.
- the forecast is uncertain for people born during the forecast period.
Follow-up of the forecasts, i.e. comparisons between the forecast and the actual results have been presented in the report series Demographic Reports since the middle of the 1980s.

The future population of Sweden 2006–2050
Statistics Sweden 180
The future population of Sweden 2006–2050 References
Statistics Sweden 181
References Alm Stenflo, G. (1989) Parity-dependent fertility in a population with natural fertility in northern Sweden 1720–1900. Journal of Family History, Vol. 14 No 3:211-227
Alm Stenflo, G. (2002) Långa sjukskrivningar har ersatt förtidspension. Välfärdsbulletinen Nr 3, Statistiska centralbyrån
Andersson, G. (2004) Childbearing after migration: Fertility patterns of foreign-born women in Sweden. International Migration Review 38(2): 747–775.
Becker, W, Enghardt, H. & Robertsson, A-K. (1994) Kostundersökningar i Sverige 1950–1990. Livsmedelsverket, Uppsala.
Carlsson, G, et al. (1979) Liv och hälsa. Liber, Stockholm.
Duvander, A & Olsson, S (2001) När har vi råd att skaffa barn? Riksförsäkringsverket analyserar 2001:8.
Fahey, T. & Spéder, Z. (2004) Fertility and family issues in an enlarged Europé. European Foundation for the Improvement of Living and Working Conditions.
Finnström, O. & Nygren, K-G. (2005) In vitro-fertilisering i nytt skede – Teknisk utveckling och ett-embryoåterföring ger säkrare behandling. Läkartidningen Nr 46 Volym 102.
Fries J.F. (1980) Ageing, natural death, and the compression of morbidity. New England Journal of Medicine, 303 (3): 130.
Hammar, N, et al. (1992) Time trends in survival from myocardial infarction in Stockholm county 1976–1984. Int J Epid, 21(6): 1090–1096
Hoem, J. (2005) Why does Sweden have such high fertility? Demographic Research Volume 13, Article 22: 559–572.
Lampic, C, et al. (2006) Fertility awareness, intentions concerning childbearing, and attitudes toward parenthood among female and male academics. Human Reproduction 21(2): 558–564
Lee, R.D. & Carter, L.R. (1992) Modeling and forecasting U.S. mortality. JASA, 87, 419: 659–671
Leridon, H. (2004) Can assisted reproduction technology compensate for the natural decline in fertility with age? A model assessment. Human Reproduction 19: 1548–1553.
References The future population of Sweden 2006–2050
Statistics Sweden 182
Lindberg, A. (2005) Sammanställning av en enkät till landets smittskyddsenheter om vaccinationstäckningen av ålderspensionärer hösten 2004 (Elektronisk) Smittskyddsläkarföreningen Tillgänglig: <http://www.slf.se/smittskydd> [2006-05-08]
Lundström H. & Qvist J. (2004) Mortality forecasting and trend shifts: An application of the Lee-Carter model to Swedish mortality data. International Statistical Review, 72,1: 37–50.
Migrationsverket (2006) Verksamhets- och utgiftsprognos 2006. Migrationsverket, Norrköping.
Nygren O. (2005) De äldre arbetar mindre. Välfärd Nr 1. Statistiska centralbyrån.
Persson, L. (2006) Barnafödandet i Sverige och USA. (Opublicerat arbetspapper). Statistiska centralbyrån.
Olshansky, J. & Ault, B. (2002) The fourth stage of the epidemiologic transition: The age of delayed degenerative diseases, Population and society: essential reading:, 48–62. Ontario: Oxford University Press.
Simonsen, Lone (2005) Impact of influenza vaccination on seasonal mortality in the US Elderly Population. Arch Internal Medicine 165(3).
Sobotka, Tomas (2004) Postponement of Childbearing and Low Fertility in Europe. Dutch University Press, Netherlands .
Socialdepartementet (2001) Barnafödandet i fokus – Från befolkningspolitik till ett barnvänligt samhälle. Ds 2001:57 Fritzes Stockholm.
Socialstyrelsen (2005) Assisterad befruktning 2002. Statistik. Hälsa och sjukdomar 2004:12.
Statistiska centralbyrån (SCB) (1992) Livslängden i Sverige. Demografiska rapporter 1992:3.
Statistiska centralbyrån (SCB) (1995) Kvinnors och mäns liv- Barnafödande. Demografiska rapporter 1995:2.3
Statistiska centralbyrån (SCB) (2001a) Varför föds det så få barn? – Resultat av en enkätundersökning om vad som påverkar beslutet att få barn. Demografiska rapporter 2001:1.
Statistiska centralbyrån (SCB) (2001b) Arbetsmarknadsstatus och fruktsamhet – Påverkar anknytningen till arbetsmarknaden kvinnors och mäns barnafödande? Demografiska rapporter 2001:2.

The future population of Sweden 2006–2050 References
Statistics Sweden 183
Statistiska centralbyrån (SCB) (2002) Hur många barn får jag när jag blir stor? – Barnafödande ut ett livsperspektiv. Demografiska rapporter 2002:5.
Statistiska centralbyrån (SCB) (2003) Sveriges framtida befolkning – Befolkningsframskrivning för åren 2003–2050. Demografiska rapporter 2003:4.
Statistiska centralbyrån (SCB) (2004) Sveriges framtida befolkning 2004–2050. Statistiska meddelanden, Serie Be. Befolkning och levnadsförhållanden BE SM 0501.
Statistiska centralbyrån (SCB) (2005a) Beskrivning av Sveriges befolkning 2004. Befolkningsstatistik.
Statistiska centralbyrån (SCB) (2005b) Fruktsamhetsmodellen – beskrivning av beräkningarna av antalet födda. Bakgrundsmaterial om demografi, barn och familj 2005:2.
Statistiska centralbyrån (SCB) (2005c) SCB:s modell för befolkningsprognoser – En dokumentation. Bakgrundsmaterial om Demografi, Barn och Familj 2005:1.
Statistiska centralbyrån (SCB) (2005c) Sveriges framtida befolkning 2005–2050. Statistiska meddelanden, Serie Be. Befolkning och levnadsförhållanden BE SM 0501.
Statistiska centralbyrån (SCB) (2006a) Befolkningsutvecklingen i kommungrupper och påverkan på fruktsamheten. Bakgrundsmaterial om demografi, barn och familj 2006:1.
Statistiska centralbyrån (SCB) (2006b) Äldres omsorgsbehov och närhet till anhöriga. Demografiska Rapporter 2006:1.
United Nations Development Programme (UNDP) (2002) Human Development Report 2002.

The future population of Sweden 2006–2050
Statistics Sweden 184

The future population of Sweden 2006–2050 Annex
Statistics Sweden 185
Annex
List of representatives in the reference group
Reference group for fertility Marc Bygdeman, Professor emeritus, Karolinska Hospital Maria Danielsson, health researcher, National Board of Health and Welfare Anna Kleen, Under Secretary, Ministry of Finance Åsa Löfström, Associate Professor, Department of Economics, Umeå University Karl-Gösta Nygren, Professor, Sophiahemmet Livia Olah, D.Phil, Department of Demography, Stockholm University
Reference group for migration Kristina Eklöf, Researcher, Swedish Migration Board Monika Geite, Researcher, Swedish Board of Integration Anna Kleen, Under Secretary, Ministry of Finance Martin Klinthäll, DPhil, Department of Economic History, Lund University Lena Lundkvist, Researcher, Swedish Social Insurance Agency André Nilen, Administrative Officer, Ministry of Foreign Affairs Åke Nilsson, Demography, Demografikonsulten Peter Springfeldt, Director, Ministry of Industry, Employment and Communications Eskil Wadensjö, Professor, Swedish Institute for Social Research (SOFI), Stockholm University
Reference group for mortality Maj-Lis Hellenius, Professor, Karolinska Institute Örjan Hemström, Associate Professor, Centre for Health Studies (CHESS), Stockholm University Nils Holmgren, Researcher, Swedish Social Insurance Agency Anna Kleen, Under Secretary, Ministry of Finance Ulf Pettersson, Professor, Medical genetics, Uppsala University Måns Rosén, Professor, Centre of Epidemiology, National Board of

Annex The future population of Sweden 2006–2050
Statistics Sweden 186
Health and Welfare Jens Tjernström, Economist, Swedish Association of Local Authorities and Regions

The future population of Sweden 2006–2050The population of Sweden continues to increase. From 1995 to 2005 the population increased by nearly 211 000 persons. During the next ten year period 2006–2015 the population is expected to grow by slightly more than 410 000 persons. The increasing growth rate is primarily due to an increased number of births coupled with a positive net migration. According to this year’s projection, the population will increase from 9.1 million in 2005 to 9.5 million in 2015. In 2050 the population is expected to be 10.5 million.
Life expectancy for women is predicted to increase from 82.8 years in 2005 to 86.3 years in 2050. The corresponding expected increase for men is from 78.4 to 83.6 years.
The fertility rate is expected to rise from today’s 1.77 children per woman to average 1.85 children per woman until 2050. The percentage women remaining childless is expected to increase slightly.
In 2006 immigration is expected to be unusually high due to the temporary asylum law. Net migration is expected to reach 41 000 for 2006, drop to 28 000 the following year and reach a level around 24 000 at the end of the projection period. Immigration and emigration of both Swedish born and foreign born persons is expected to increase.
www.scb.se
ISSN 1654-1510 (online)
Publikationstjänsten: E-post: [email protected], tfn: 019-17 68 00, fax: 019-17 64 44. Postadress: 701 89 Örebro.
Information och bibliotek: E-post: [email protected], tfn: 08-506 948 01, fax: 08-506 948 99.Besöksadress: Biblioteket, Karlavägen 100, Stockholm.
Publication services:E-mail: [email protected], phone: +46 19 17 68 00, fax: +46 19 17 64 44. Address: SE-701 89 Örebro.
Information: E-mail: [email protected], phone: +46 8 506 948 01, fax: +46 506 948 99Statistics Sweden, Library, Karlavägen 100, Stockholm, Sweden.