![Carriage of Goods by Sea[1]](https://static.fdocuments.in/doc/165x107/577ccfee1a28ab9e7890f4a0/carriage-of-goods-by-sea1.jpg)
Future of the sea: trends in the transport of goods by sea · 2017-08-24 · 2 Trends in the...
23
Future of the Sea: Trends in the Transport of Goods by Sea Foresight – Future of the Sea Evidence Review Foresight, Government Office for Science
Transcript of Future of the sea: trends in the transport of goods by sea · 2017-08-24 · 2 Trends in the...

Future of the Sea:
Trends in the Transport of Goods by
Sea
Foresight – Future of the Sea
Evidence Review Foresight, Government Office for Science

2
Trends in the Transport of Goods by Sea
Professor D. John Mangan
August 2017
This review has been commissioned as part of the UK government’s Foresight Future of the Sea project. The views expressed do not represent policy of any government or organisation.

Trends in the Transport of Goods by Sea
3
Contents
1. Executive Summary......................................................................................................................... 4
2. Introduction ..................................................................................................................................... 5
3. Understanding the UK’s Maritime Freight Flows .......................................................................... 6
3.1 Domestic Traffic ......................................................................................................................... 8
3.2 Unitised Traffic, Directional Imbalances and the Channel Tunnel ............................................... 8
4. What Drives UK Maritime Freight Flows? ...................................................................................... 9
5. Future Influences on UK Maritime Freight Flows ........................................................................ 13
5.1 Supply-Chain Vulnerability ....................................................................................................... 13
5.2 Potential for a ‘Disruptive Innovation’........................................................................................ 14
5.3 The ‘Future Proof Ship’, Smart Shipping and Self-Thinking Supply Chains .............................. 16
5.3.1 Changes in Manufacturing ................................................................................................. 17 5.3.2 Climate Change and Green Shipping ................................................................................ 18 5.3.3 Geopolitics, Demographics and Emerging Markets ........................................................... 19
6. Vision UK Maritime Freight Flows 2050 ....................................................................................... 20
References ............................................................................................................................................ 21

Trends in the Transport of Goods by Sea
4
1. Executive Summary Maritime transport is a key enabler of a country’s ability to trade internationally, especially
in the case of an open, trading economy such as the UK. Globally, maritime trade represents over 80 per cent of total world merchandise trade, with UK ports handling some 5 per cent of total world maritime trade.
In our just-in-time world characterised by lean and near-zero inventory holding, disruptions to the maritime freight transport network can have rapid and wide-ranging effects on economies and societies.
In this evidence review we first describe the UK maritime freight transport sector, place it in its international context, and disaggregate the various maritime freight flows – bulk (liquid and dry), unitised (RoRo and LoLo – the latter also commonly referred to as containers), and other general cargo. We distinguish freight flows by volume and value, and note too the important roles of risk and vulnerability.
While the UK’s overall maritime freight volumes are relatively static, this masks certain trends, in particular the continued rise of (higher-value) containerised traffic. We note too that in the UK’s maritime trades there is generally an excess of imports, with resulting directional imbalances and the challenges this entails. We identify the maritime flows in a UK context of particular significance as unitised freight and (declining) bulk energy product flows (and note too the emergence of new, niche trades such as biomass).
Maritime transport is a ‘derived demand’ with the demand for shipping a reflection of trade between countries. We discuss recent observations on the dilution of the link between GDP growth and maritime freight flows (thus making forecasting more difficult) which is driven inter alia by changes in global patterns of production.
Containerisation has been a key enabler of globalisation, with the world today more interconnected than at any time in the past. Shipping is likely to continue to prosper by moving goods from consignors to consignees, wherever these actors happen to be located. The advent of blockchain technology is likely to be a further and important enabler of global trade.
We do not foresee any major ‘disruptive innovations’ radically reshaping the shipping sector, however trends in a number of areas (ship technology, ICT, 3D printing, global production networks, the environment and sustainability, demographics, geopolitics and the development of emerging markets) will significantly impact and dictate what is shipped where and how.
Shipping has been ‘behind the curve’ with regard to the uptake of digital technologies when compared with other actors in the supply chain; however the advent of ‘smart shipping’ is changing this. There is the potential for shipping (including the individual cargoes carried on the ship) to seamlessly link into the supply chain, leading many of the latter to become more efficient and, in some cases, ‘self-thinking’.
Based on the evidence presented in this paper, we envision that UK maritime freight flows in 2050 will be characterised by:
o A flexible (on and offshore) ports sector with automated handling capabilities and linked (physically and digitally) to its hinterland;
o Green and Smart ‘future proof’ ships will service a global shipping network characterised by inter-hub connections and serviced by mega-ships;
o Product flows within self-thinking supply chains will be characterised by global flows of lighter- and higher-energy products in a connected global economy.

Trends in the Transport of Goods by Sea
5
2. Introduction
Maritime freight transport allows the UK’s open, trading economy to function and prosper – carrying both imports (goods for sale and consumption, plus fuels for the energy sector) and exports for sale to overseas markets. The Maritime Foundation put it succinctly: the UK is a maritime-dependent nation.1 Disruptions to the maritime freight transport network can have rapid and wide-ranging effects: two recent examples are the impact on retailers of the collapse of the Korean container shipping line Hanjin2 and the delays to cross-Channel freight from protests and security challenges at the port of Calais.3
Globally, international maritime trade exceeded 10 billion tonnes in 2015 – the provisional figure is 10,047 million tonnes – the largest volume carried since records began. This comprised 29 per cent oil and gas, 29 per cent bulk commodities such as coal and iron ore, and the remaining 42 per cent comprised other dry cargoes. It is estimated that this maritime trade represents in turnover 80 per cent of total world merchandise trade (with the remaining freight thus travelling by air, road and rail). The statistics quoted thus far are physical freight volumes – it is harder to get an accurate figure on the maritime freight transport share of world trade value with estimates varying between 55 per cent and over 67 per cent.4 With regard to UK maritime freight traffic, Department for Transport statistics for 2015 show that UK ports handled 497 million tonnes (thus representing approximately 5 per cent of the world total volume of maritime trade).5
The purpose of this report is to inter alia predict future UK-centric maritime freight flows and the drivers that will influence such freight flows. A superficial understanding might suggest that this could be done by simply extrapolating historical time series, especially given the traditional link that exists between GDP and maritime freight flows. There are robust time series data available for maritime freight traffic stretching back decades; note too however that we show below in section 4 how this link has become less evident. This in any event would be flawed as it ignores both the composition of maritime freight traffic (the different products/categories flowing) and – given that maritime freight transport is a derived demand – the drivers influencing these freight flows. In essence then, GDP is not the only, or indeed necessarily key, determinant of maritime freight flows. An added dimension is that we need to be careful to distinguish trends with regard to freight flows when measuring volumes and values. It is essential then that in order to tackle this subject comprehensively and accurately we need to first understand and interrogate the relevant data on maritime freight flows – this must be our starting point, we have to understand what goes where with regard to shipping movements – and build our inferences and discussion from that starting point. Accordingly, we need to:
1 ‘Highlighting the economic importance of the maritime sector’, http://www.bmcf.org.uk/about-us/highlighting-the-economic-importance-of-the-maritime-sector
2 ‘The ghost ships of Hanjin and why they’re spoiling Christmas’, Chris Cooper, Bloomberg, https://www.bloomberg.com/news/articles/2016-09-09/quicktake-q-a-the-shipping-line-that-could-spoil-christmas
3 ‘Ports in a storm’, Jackie Storer, Confederation of British Industry, http://www.cbi.org.uk/businessvoice/latest/ports-in-a-storm
4 The global statistics and shares quoted thus far are from the UCTAD Review of Maritime Transport 2016, 6.
5 The statistics for the UK quoted here, and in detail in the next section, are from the Department for Transport maritime and shipping statistics available at: https://www.gov.uk/government/collections/maritime-and-shipping-statistics#publications-2017

Trends in the Transport of Goods by Sea
6
disaggregate UK-centric maritime freight flows into their various categories;
understand the (economic/market) drivers influencing these freight flows;
investigate what influences (e.g. new shipping, manufacturing and ICT technologies, climate change, geopolitics, demographics) could alter such freight flows;
consider the UK’s capability to handle future freight flows.
3. Understanding the UK’s Maritime Freight
Flows
As noted above, UK ports handled in 2015 some 497 million tonnes – c. 5 per cent of the world’s total maritime freight traffic volumes. Figure 1 shows the breakdown by type for this traffic together with a time series from 1994 and Figure 2 shows the import–export splits.
Figure 1. UK major port freight traffic (volumes in ’000 tonnes)
Source: Department for Transport Statistics
0
100
200
300
400
500
600
1994 1995 1996 1997 1998 1999 2000 2001 2002 2003 2004 2005 2006 2007 2008 2009 2010 2011 2012 2013 2014 2015
Liquid Bulk Dry Bulk Container & RoRo Other General Cargo Total
Trends in the Transport of Goods by Sea
7
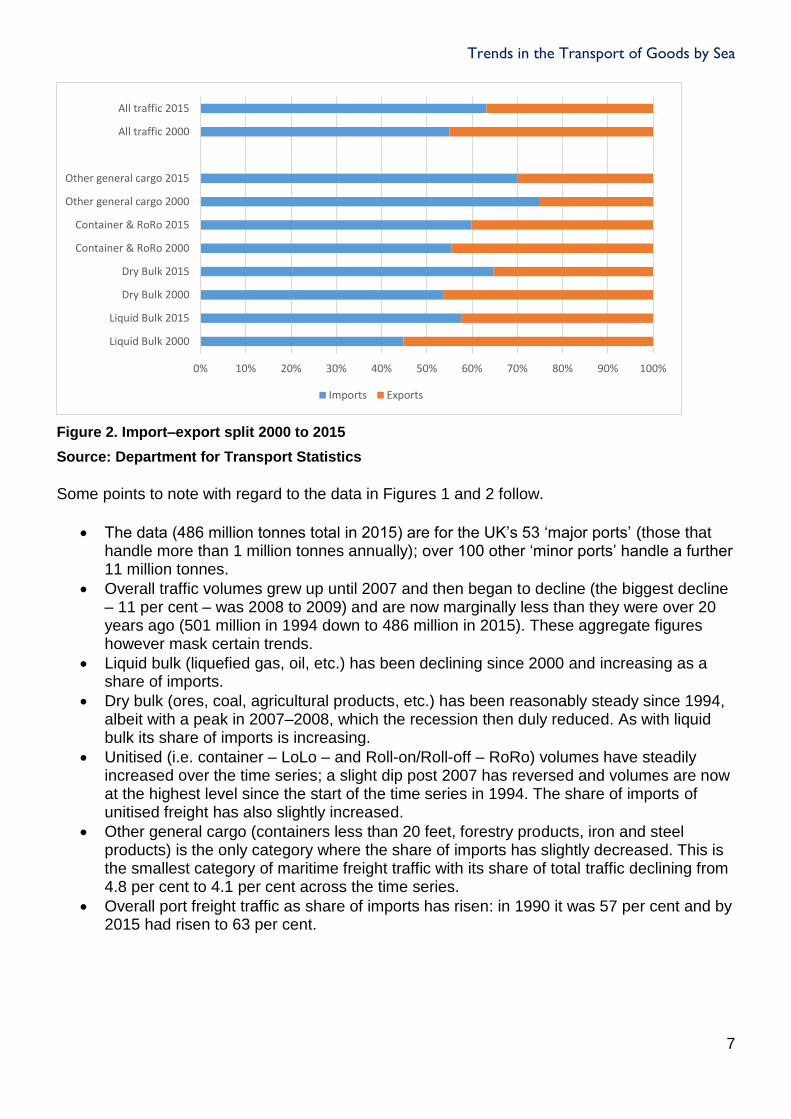
Figure 2. Import–export split 2000 to 2015
Source: Department for Transport Statistics
Some points to note with regard to the data in Figures 1 and 2 follow.
The data (486 million tonnes total in 2015) are for the UK’s 53 ‘major ports’ (those that handle more than 1 million tonnes annually); over 100 other ‘minor ports’ handle a further 11 million tonnes.
Overall traffic volumes grew up until 2007 and then began to decline (the biggest decline – 11 per cent – was 2008 to 2009) and are now marginally less than they were over 20 years ago (501 million in 1994 down to 486 million in 2015). These aggregate figures however mask certain trends.
Liquid bulk (liquefied gas, oil, etc.) has been declining since 2000 and increasing as a share of imports.
Dry bulk (ores, coal, agricultural products, etc.) has been reasonably steady since 1994, albeit with a peak in 2007–2008, which the recession then duly reduced. As with liquid bulk its share of imports is increasing.
Unitised (i.e. container – LoLo – and Roll-on/Roll-off – RoRo) volumes have steadily increased over the time series; a slight dip post 2007 has reversed and volumes are now at the highest level since the start of the time series in 1994. The share of imports of unitised freight has also slightly increased.
Other general cargo (containers less than 20 feet, forestry products, iron and steel products) is the only category where the share of imports has slightly decreased. This is the smallest category of maritime freight traffic with its share of total traffic declining from 4.8 per cent to 4.1 per cent across the time series.
Overall port freight traffic as share of imports has risen: in 1990 it was 57 per cent and by 2015 had risen to 63 per cent.
0% 10% 20% 30% 40% 50% 60% 70% 80% 90% 100%
Liquid Bulk 2000
Liquid Bulk 2015
Dry Bulk 2000
Dry Bulk 2015
Container & RoRo 2000
Container & RoRo 2015
Other general cargo 2000
Other general cargo 2015
All traffic 2000
All traffic 2015
Imports Exports

Trends in the Transport of Goods by Sea
8
3.1 Domestic Traffic
Domestic traffic6 accounted for 22 per cent (108 million tonnes) of all UK maritime freight traffic in 2015. This domestic traffic comprised ‘one-port traffic’ (17 per cent) and coastwise traffic between UK ports (83 per cent); one-fifth of this coastwise traffic was between Northern Ireland and GB ports. In addition some 47 million tonnes of freight was carried on inland waterways; in effect this represents a combined total volume of 94 million tonnes of freight lifted and discharged, a not inconsiderable sum when compared with the UK total for (other) maritime freight handled of 497 million tonnes. The River Thames handled the largest share – 47 per cent – of the total traffic on inland waterways.
3.2 Unitised Traffic, Directional Imbalances and the Channel
Tunnel
UK ports handled a total of 13.5 million freight units in 2015 (16 per cent of these were domestic). In addition, the Channel Tunnel rail link carried 1.5 million freight units (in contrast, 2.9 million freight units travelled by sea between the UK and France). The dominance of imports is especially visible when unitised freight flows are examined:7
93 per cent of inbound LoLo containers were full or partially loaded, while only 50 per cent of outbound were full or partially loaded;
95 per cent of inbound RoRo containers were full or partially loaded, while 75 per cent of outbound were full or partially loaded.
Such directional imbalances are a feature of many maritime networks, with the ability to secure backhaul8 flows being key to route profitability; we discuss some of the ideas that are used to address this issue in section 5.
Figure 3 illustrates the UK’s major ports showing both the different types of freight handled and relative port size in terms of freight volume handled.
6 According to the ‘Department for Transport Port Freight Statistics 2015: Notes and Definitions’, domestic traffic is either coastwise or one port. One-port traffic comprises dredged sand, gravel etc., landed at a port for commercial purposes; and traffic to and from UK offshore oil and gas installations (traffic with non-UK offshore oil and gas installations is recorded as foreign traffic). The term ‘coastwise’ generally infers that the freight is flowing along the coast between ports within the one country and the term ‘one port’ refers to freight flows involving one port only (i.e. a port of origin or destination, but not both, as is the case with other freight flows).
7 The directional imbalance is the opposite in the case of Scotland where a larger share of outbound containers were fully or partially loaded; that said, however, Scottish major ports handle less than 4 per cent of the total number of containers handled by all UK ports.
8 In logistics, we refer to the headhaul as the leg with the higher volume of traffic, and the backhaul as the (return) leg with the lower volume of traffic.

Trends in the Transport of Goods by Sea
9
Figure 3. UK Major Ports, by cargo category (2015)
Source: Department for Transport
4. What Drives UK Maritime Freight Flows?
As noted above, maritime transport is a derived demand, carrying our imports and exports, which in turn are a reflection of economic output. We noted too the traditional link that exists between GDP and maritime freight flows; it might be inferred then that changes in maritime freight flows can be predicted from forecasts of GDP. Trade–GDP elasticity was estimated at 2.2 in the period 1986–2000 (i.e. as GDP grew, a more-than-twofold increase in trade ensued), but this elasticity dropped to 0.7 for the period 2008–2013 (UNCTAD 2016). Cyclical, structural and adjustment factors arising from the most recent recession may contribute to a share of this decline; however it is likely that other factors too are at play including:9
9 Box 1.1 on page 5 of UNCTAD (2016) contains a detailed discussion on the Trade–GDP relationship and some of these factors.

Trends in the Transport of Goods by Sea
10
a reduction in vertical specialisation10 as value chains and markets mature;
production and trade patterns shift;
production processes consolidate;
services and servitisation (discussed further below) play a greater role in international trade;
nearshoring and reshoring increase.
For many categories of maritime freight, inferring a direct link to changes in GDP may thus be too superficial and even invalid. We noted too above that when analysing trends we need to be careful to distinguish between freight volumes and freight values. HMRC collects data on maritime freight flows through customs systems.11 Given their need to collect data on trade, calculation of taxation and import dues, etc., their focus is more on freight values, but not exclusively as volume data is also collected. The HMRC data helps to identify the relative value shares of different commodities shipped. Table 1 illustrates by value the top commodities imported and exported in December 2016. Many of these are likely to have been transported in maritime freight units12 (with some also transported by air freight), while the fuels and metals would usually be transported as bulk shipping (liquid or dry) and larger mechanical appliances usually shipped as ‘other general cargo’. In summary then, unitised freight and some bulk metals and fuels are the primary import and export commodities from the perspective of freight value.
The importance of unitised freight in the context of overall maritime freight flows is supported by data illustrated in a report by MDS Transmodal (2016). That report estimated that UK trade in goods by value in 2014 totalled £711 billion, of which £511 billion moved through UK seaports, with 69 per cent of the latter being unitised freight.13 The HMRC data can also be analysed to reveal the top commodities measured in volume terms (the broad categories are already evident from the Department for Transport (DfT) data shown in Figure 1). Not surprisingly though these are typically bulk cargoes, with certain dense products constituting the bulk of such flows. While petroleum flows thus are important to the UK, if we examine flows only in terms of volume we risk missing other equally important product flows. In 2016 the top five commodities by volume were, in millions of tonnes:14
export: petroleum (63), ores and metal scrap (9), cereals (6), organic chemicals (5), iron and steel (5);
import: petroleum (80), gas (37), vegetables and fruit (11), non-metallic mineral manufactures (8), iron and steel (8).
10 In effect companies using more locally / regionally produced intermediate goods as production inputs rather than sourcing these from afar (see Constantinescu et al. 2015).
11 HMRC Overseas Trade Statistics: Commodity and Country Analysis, available at: https://www.uktradeinfo.com/Statistics/OverseasTradeStatistics/Pages/Commodities.aspx
12 Note that import and export motor vehicles are also regarded as unitised maritime freight.
13 Includes all unitised freight except cars and other vehicles.
14 ‘Top 30 products quarterly – imports and exports – value and net mass’, available at: https://www.uktradeinfo.com/Statistics/Pages/Quarterly-Tables.aspx

Trends in the Transport of Goods by Sea
11
Table 1. Top Commodities (by value) imported and exported, December 2016
EU Non-EU
Export Motor vehicles Precious metals
Mineral fuels Mechanical appliances
Mechanical appliances Motor vehicles
Electronic equipment Pharmaceutical products
Pharmaceutical products Electronic equipment
Import Motor vehicles Mechanical appliances
Mechanical appliances Mineral fuels
Electronic equipment Electronic equipment
Pharmaceutical products Precious metals
Mineral fuels Aircraft
Source: HMRC Statistics
It is also worth considering who are the UK’s largest trading partners. In volume terms, the Netherlands is the UK’s largest trading partner, accounting for 15 per cent of all international traffic. Unitised traffic represents a significant share of this which is indicative in part of transhipment from other overseas ports of origin. Liquid bulk is also a significant commodity on the UK–Netherlands trade route, again indicative of transhipment. The largest cargo-specific trading route is the import of liquid bulk from Norway which represents 25 per cent of all liquid bulk imports. Figure 4 illustrates the top 10 country trade routes (by volume) with the UK, and how these have changed between 2005 and 2015. The dominance of Intra-European (EU + Norway) freight flows in the ranking is notable.
Figure 4. Top 10 (by volume) country trade routes with the UK
Source: Department for Transport

Trends in the Transport of Goods by Sea
12
When looked at in value terms however the hierarchy of countries that emerges is somewhat different to that in Figure 4: the UK’s largest trading partner is Germany (£96 billion), followed by the US (£86 billion), Netherlands (£53 billion) and China (£49 billion)15. The UK’s largest trading partner when measured by value – Germany – is currently ranked number 9 in the top 10 trade routes when measured in volume terms (Figure 4), thus emphasising a point made earlier that when analysing and inferring from maritime freight statistics it is important to distinguish between volumes and values. Clearly the UK–Germany trade route has a high concentration of more valuable cargoes (electronics, pharmaceuticals, cars, etc.).
Following on from the foregoing discussion and analysis (disaggregated by traffic type, route, port, value, volume, commodity) of the myriad freight flows in and out of the UK, the freight flows that are likely of the most significance in the context of our endeavour to explore how maritime freight flows will evolve into the future, and as further discussed below, are:
unitised maritime freight;
bulk energy products.
At present, intra-Europe maritime freight flows play a significant role. This significance is not surprising for a developed, open, trading nation such as the UK and is supported widely in the literature. Brooks (2010) for example noted that changes in the global economy – whereby developed countries are moving towards jobs based in service sectors and other industries – do not add significantly to shipping tonne miles. She goes on to argue that, as ‘western’ countries’ economies have moved on from manufacturing and heavy industry, their economies are based more around providing services such as software, education services, biotechnology, ecotourism, leisure and recreation, and business services, which consequently means that these countries tend to import more goods by sea than they export (hence the directional imbalances noted in the previous section). More recently a trend known as ‘servitisation’ (combining product and service offerings) has come to the fore.16 Knowledge-intensive industries, hi-tech manufacturing and demand for consumer goods thus impact significantly upon freight flows, and point in particular to a rising demand for containerised transportation (which tends to be used for higher-value products).
Figure 5 illustrates the changes in international energy commodity flows in and out of the UK since 2005. Crude oil and coal flows have declined, while flows of oil products and liquefied gas have increased. Overall however, the total volume of such flows (161 million tonnes in 2015) has declined. In addition, there were 48 million tonnes of domestic energy commodity flows in 2015, a decline from 100 million tonnes in 2005. A number of variables are relevant in this regard including reducing North Sea reserves, improved energy efficiency of fuels, and the growth of renewable energy sources. It is notable for example that a new trade – the import of wood pellets for large-scale biomass plants in the UK – has grown significantly in recent years: in 2014 almost 5 million tonnes were imported into the UK, 79 per cent of which were from North America.17
15 Totals calculated from data available in the HMRC ‘Summary of import and export trade with EU and non-EU countries – Annual 2009–2016’, available at: https://www.uktradeinfo.com/Statistics/Pages/Annual-Tables.aspx
16 See, for example, Baines and Lightfoot (2013). A ‘traditional’ manufacturing company such as Rolls-Royce, for example, now generates 50 per cent of its revenues from services.
17 ‘UK and EU trade of wood pellets’, DECC, available at: https://www.gov.uk/government/uploads/system/uploads/attachment_data/file/462361/Trade_of_wood_pellets.pdf

Trends in the Transport of Goods by Sea
13
Figure 5. International energy commodity flows through UK major ports (’000 tonnes)
Source: Department for Transport
5. Future Influences on UK Maritime Freight
Flows
At this juncture we have hopefully established a sufficient baseline of maritime freight traffic flows, and outlined pertinent trends. We noted that the maritime flows of particular significance in a UK context are unitised freight and (declining) bulk energy products, and also that intra-Europe maritime freight flows play a significant role.
5.1 Supply-Chain Vulnerability
Our analysis thus far has focused on consideration of data on freight volumes and values. This is in keeping with the usual approach in many freight studies; however a third and critical dimension needs to be added, viz. risk – how critical to the UK (economy and society) is a particular import or export? One example is food retail: with a lean (and near-zero) inventory holding now the norm across the sector (witness for example the recent low availability of many green vegetables in supermarkets arising from production shortages out of Southern Europe), there is a high level of reliance on available maritime freight services to carry our food imports – in effect transport becomes a ‘rolling warehouse’. While we can (probably) survive without green vegetables, there are many other products not produced in the UK that are of critical importance (for example some medical devices, parts for hi-tech equipment, etc. We thus need to discern maritime freight flows not just from (monetary) value and volume perspectives, but also from a risk perspective. To give one other example: according to DfT statistics the port of Felixstowe handled two out of every five LoLo container units in 2015; the impact of closures or delays (including on the access/egress routes) at this port would be considerable. (Recall from above that 69 per cent of UK trade by value is unitised.)
0 50 100 150 200 250
Liquefied Gas
Crude Oil
Oil Products
Coal
Total
2015 2005

Trends in the Transport of Goods by Sea
14
There is a growing awareness – in both the academic literature and in practice – of supply-chain vulnerability: the likelihood of a supply chain or logistics system being exposed to damage, disruption or failure (Mangan and Lalwani 2016, 382). Given the disparate range of potential disruptions to supply chains (for example weather, cyberthreats, biothreats, shortages and failures by supply-chain partners, terrorism, political upheavals), the emphasis now is on building flexibility and agility into supply chains, anticipating rather than reacting to turbulence – for example, greater use of dual sourcing, postponement and rapid manufacturing – so that they are both robust (able to manage regular fluctuations in demand, for example) and resilient (capable of returning to their desired state after being disturbed).18 The traditional emphasis on network optimisation, focused only on low unit costs, is shifting to an awareness that volatility cannot be eradicated and thus flexibility needs to be a key feature in supply-chain design. We noted too above (in the context of the discussion on the link between GDP and trade flows) the shifts in production and trade patterns – global manufacturing networks are always evolving – and it is likely that, driven by factors such as risk, technology, changing demographics and changing comparative advantage among countries, there will be further redistribution of manufacturing networks over the coming decades. This then is the context within which the derived demand for shipping co-exists and provides the framework to consider future influences on UK maritime freight flows (grouped under three headings following on from the next section).
5.2 Potential for a ‘Disruptive Innovation’
But first to address a key question: what potential exists for a ‘disruptive innovation’ (i.e. a new market and value network) in the maritime sector? The closest we are likely to come to this is in the area of smart shipping (detailed below); however we are unlikely to witness disruptions as extreme as those that have for example reshaped the music industry (via iTunes and Spotify, etc.) but, regardless of the rise of ‘nationalism, protectionism, isolation’ (Grillo 2017), the reality is that countries still need to trade with each other given their relative comparative advantages.
So, is globalisation an ‘inexorable and unstoppable force’? Dicken (2015, 37) answers ‘not inevitably … as the period between 1919 to 1939 shows’. He however notes that today the situation is much different: ‘the interconnections within the global economy are now much deeper – and faster – than in the past’ (ibid.). Containerisation has been a key enabler of globalisation and has reduced the cost of moving many products around the world to negligible levels (e.g. 35 pence for a pair of jeans to Europe from Asia).19 The advent of blockchain technology (Iansiti and Lakhani 2017) is likely to be a further and important enabler of global trade.20
18 For a general insight into supply-chain vulnerability, robustness and resilience see, for example, chapter 13 in Mangan and Lalwani (2016); for a detailed insight into supply-chain strategies to cope with such vulnerability see, for example, Christopher and Holweg (2011, 2017).
19 For a detailed discussion around the history of containerisation, its impact on the global economy and the costs of moving goods today see chapter 2 in Mangan and Lalwani (2016) which also includes some useful references to background readings and data sources. For a wide-ranging insight into how the global container shipping industry works see George (2013).
20 In one of the first applications in the maritime logistics sector, Maersk announced early in 2017 that they were partnering with IBM to ‘digitalise paperwork related to the global supply chain process to improve efficiency and optimise costs’ (Wei Zhe Tan, Lloyd’s List Daily Briefing, 7 March 2017).

Trends in the Transport of Goods by Sea
15
A risk of globalisation however is that supply chains have become too ‘stretched’21 and, in the context of the discussion above with regard to vulnerability, are open to disruption from multiple sources. The reality however is that, given the structure of the global economy and the low cost of moving products around the world – and notwithstanding the complexity inherent in many supply chains, if one source of supply dries up we simply shift to another. Shipping is likely to continue to prosper by moving goods from consignors to consignees, wherever these actors happen to be located. Even one of the most exciting and innovative potential technological innovations in transport today – the hyperloop22 – is unlikely, if it is successful, to displace shipping for the movement of long-distance freight in the short to medium term. In 100 or so years from now, however, the potential of such technologies for volume flows over long distances could be much greater.
When considering each of the future influences it is useful to consider a timescale to 2050, which is reasonable given that many capital projects in the maritime sector (ships, cranes, terminals etc.) are typically planned to a multi-decade lifespan. Furthermore, in the context of this analysis and in order to understand the significance/implications by shipping sector, the UK’s freight flows are best disaggregated into three categories as in Table 2.
Table 2. Maritime freight flows by category
Unitised Bulk energy Other
Represents 34 per cent of all UK maritime flows by volume and 69 per cent by value.
Represents 43 per cent of all UK maritime flows by volume – but declining.
Remaining 23 per cent are other liquid bulks, ores, agricultural products, forestry products, iron and steel products, etc.
21 Many supply chains cross borders and have nodes in multiple countries – see, for example, Rivoli (2009); the website http://open.sourcemap.com also provides some interesting visualisations. Following on from the aforementioned increasing emphasis on supply-chain risk and vulnerability, there is a growing awareness now that many supply chains are becoming too ‘stretched’, with the concomitant risks this entails – see, for example, Blanchard (2015) and Mangan and Lalwani (2016, chapter 16).
22 The company Hyperloop One (www.hyperloop-one.com) is developing a vacuum tube transport concept whereby a custom electric motor accelerates and decelerates a levitated pod through a low-pressure tube with the pod gliding silently for miles with no turbulence: ‘think broadband for transportation’. The company has unveiled a full-scale test track in Nevada and sees potential application in particular around connecting up relatively proximate and dense urban areas with high demand for freight and passenger movement (examples include Miami–Orlando and Dubai–Abu Dhabi).

Trends in the Transport of Goods by Sea
16
5.3 The ‘Future Proof Ship’, Smart Shipping and Self-Thinking
Supply Chains
The renowned maritime economist Professor Martin Stopford (2015) has stated that the digital revolution will transform merchant shipping in the coming decades. Such smart shipping comprises inter alia autonomous and connected ships with better performance and lower costs via deployment of various sensors and data analytics.23, 24 Indeed shipping has been ‘behind the curve’ with regard to the uptake of digital technologies when compared with other actors in the supply chain: the CEO of DHL (Porter 2016) flagged a wake-up call to container lines that they need to adopt new technologies rather than focus so much on ship utilisation. Up to now, much of the focus of technology developments in shipping has been around ship operations (propulsion, communications, navigation, etc.). In terms of ship hull and engineering design, according to Lloyd’s Register et al. (2015, 72) ‘evolution rather than revolution seems to be the future in the near to medium term’. Container ships have been increasing almost exponentially in size since first introduced: the first such vessel was the ‘Ideal X’ (101 TEU25) in 1956; the largest container ship in 1988 was c.4,300 TEU; in 1997 it was c. 8,200 TEU; in 2006 was c. 14,800 TEU, and today container ships of c. 20,000 TEU are being delivered. Lloyd’s Register et al. (2015, 81) envisage a maximum container ship size of around 26,000 TEU by 2030; most likely economies of scale benefits will be outweighed by demand and network constraints.26 In addition an oversupply of some categories of container vessels is serving to focus attention on the utilisation of existing assets over placing new orders.27 The near-exponential growth in container ship size witnessed in recent decades is likely to reach a ceiling in the not too distant future, then.
Oskar Levander (Naval Architect 2017), the VP for Innovation at Rolls-Royce, points to a future of low-cost smart shipping that takes advantage of smaller, more reliable ‘future proof’ ships with modular designs to allow for greater flexibility. There is ultimately likely to be a necessity to have shipping (including the individual cargoes carried on the ship) seamlessly linked into the
23 There is a burgeoning literature on this topic: see, for example:
http://www.rolls-royce.com/~/media/Files/R/Rolls-Royce/documents/customers/marine/ship-intel/rr-ship-intel-aawa-8pg.pdf (‘Autonomous ships: The next step’, Rolls-Royce);
https://theconversation.com/to-service-global-trade-todays-ships-and-cargo-are-smarter-than-ever-46032 (‘To service global trade, today’s ships and cargo are smarter than ever’, The Conversation);
Lloyd’s Register et al. (2015) (overview of global marine technology trends to 2030);
Naval Architect (2017) (the future proof ship).
24 A downside of smart shipping is of course the risk of cyber attacks.
25 TEU = twenty-foot equivalent unit.
26 Such ‘megaships’ typically are deployed on ‘strings’ connecting the major ports with smaller, feeder vessels in turn servicing those ports. End-to-end transit times and total ‘landed’ costs are thus key determinants in the success of the wider networks within which these vessels are deployed. A report by the International Transport Forum (2015) has examined the impact and costs of such megaships. See too an article by Robert Wright on www.ft.com (9 March 2016) ‘Shipping’s size obsession could be ending’.
27 See article by Jamie Robertson, 1 March 2017, ‘Shipping slump: Why a vessel worth $60m was sold as scrap’, http://www.bbc.com/news/business-38653546

Trends in the Transport of Goods by Sea
17
supply chain where various technological developments (e.g. in areas such as low-cost sensors, augmented reality, data analytics, automation and robotics) 28 are revolutionising
logistics and supply-chain management; indeed such developments are leading many supply chains to become more efficient and, in some cases, ‘self-thinking’; related to this too is the growth in anticipatory shipping where freight is moved downstream in the supply chain closer to (real-time) demand (Calatayud 2017) The impact of smart shipping is not confined just to ships. At the time of writing, Maersk is looking to integrate its various brands – terminals, container line, logistics service provider, etc.) and use digitalisation (including blockchain technology as noted above – to integrate and transform its product offering (Porter 2017). Technology too is impacting ports, with automated cargo handling now becoming more prevalent (and also considerably safer). Floating and offshore ports are also being developed which both allow port draft limitation constraints to be ignored and transhipment at sea; the idea is not as revolutionary as it sounds: in the offshore energy sector, for example, Floating Production, Storage and Offloading Units (FPSOs) are quite common. Ports of the future will also be characterised by greater use of port-centric logistics (PCL)29 and more intermodal connections to inland (dry) ports.
5.3.1 Changes in Manufacturing
In the discussion on the trade–GDP relationship in section 4 above, we noted that global manufacturing networks are changing. Production and trade patterns are shifting, with both nearshoring (moving an offshored process to a location closer to next-stage demand, for example a European company moving an offshored process from Asia back to Eastern Europe or North Africa) and reshoring (moving an offshored process back ‘in house’) increasing.30 Two particular points are apposite in this regard:
many reshored processes are more highly automated (thus not necessarily leading to significant employment gains);
the relative wage advantage of heretofore ‘low-cost’ countries is declining, rendering them less competitive for low-cost manufacturing; furthermore as their national income increases so does their demand for imported consumer goods.31
Technologies and trends that will impact shipping include additive manufacturing (3D and 4D printing) and related developments in materials science and decarbonisation, plus the growth of modular manufacturing (shipping semi-finished products rather than smaller parts and components). Adidas is just one example of a company that is using additive manufacturing technology to allow it to reshore some processes to Europe. Views differ as to the relative impact of additive manufacturing on container lines: a report by PwC concluded that as much as
28 For an insight into technology developments in logistics and supply chain see, for example, http://www.dhl.com/en/about_us/logistics_insights/dhl_trend_research.html
29 Indeed PCL (see for example Mangan et al. 2008) – which involves providing value-adding logistics services in addition to the physical handling of freight (examples include pick and pack, packaging, and transloading) – can be viewed as a form of servitisation as discussed in section 4 above.
30 See, for example, Stephen Chick, Arnd Huchzermeier and Serguei Netessine, ‘Europe’s solution factories’, Harvard Business Review, April 2014, 111–115.
31 In the case of China, for example, see Das and N’Diaye, 2013.

Trends in the Transport of Goods by Sea
18
37 per cent of the ocean container business was at risk;32 in contrast DHL estimate that only 2-4 per cent of their Asia–Europe container traffic is at risk.33 The nature of products that are shipped in containers is shifting to lighter products with a higher value/volume ratio and lower transport-costs sensitivity. The question that arises is: will this lead to lower total container volumes moving? Or will it be offset by growth in demand and a change too in the nature of products flowing (e.g. raw materials for subsequent 3D printing and customisation, rather than modules and finished products)? It is of course impossible to predict the future and know the answer to this but – given the changing demographics discussed below – combined with other developments (for example in shipping, technology and geopolitics) it is difficult to envisage a significant future decline (if any) in global container movements. This inference also holds in the context of the increased nearshoring and reshoring as outlined above, and in the context too of the apparent reduction in vertical specialisation outlined in section 4 and footnote 10, whereby there is evidence that some companies are using more locally/regionally produced intermediate goods as production inputs rather than sourcing these from afar. Global production networks are always evolving and reshaping, but always also inevitably involve mass movement of freight between countries reflecting their desire – indeed necessity – to trade with each other.
It is important too to highlight that a risk in many shipping networks is the lack of backhaul flows, which hinders route profitability (cf. the discussion in section 3 on container loading). Ways to redress this include carrying non-traditional products on the lighter backhaul leg (e.g. waste to landfill). Another idea is to add value to product in transit (e.g. desalinate ballast water on returning (empty) oil tankers). Notable in this context are natural resource pressures (water, crops) in some world regions – and the associated issues too (justice and resource conflicts) with regard to countries buying up land in overseas countries.
We can envisage a future whereby individual loading units are (re)routed to satisfy emerging demand, with alterations also to the cargoes where necessary within those units (e.g. ripening foods or 3D printing of fashion items), and ships serving as ‘rolling warehouses’ and ‘floating factories’. Intra-regional, as opposed to long-distance global container flows, are also likely to become more significant with the shifts in production and demand.
5.3.2 Climate Change and Green Shipping
Concurrent with initiatives around the world to reduce greenhouse gas emissions, shipping too is endeavouring (albeit more slowly than others, largely as a result of the slow pace of change that besets worldwide regulation and governance of the sector)34 to become more ‘green’. Emissions control areas (such as the Sulphur ECA in North West Europe) and other pan-national agreements are slowly coming into force. Many of the green shipping initiatives complement those around smart shipping. Developments include measures to lower emissions, enhance fuel efficiency and develop alternative energy sources, to reduce noise (not just at ports but also with regard to marine life), and efforts to measure the carbon footprint of
32 Andrew Tipping, Andrew Schmahl and Frederick Duiven, PwC strategy&, ‘2015 commercial transportation trends’ (undated), https://www.strategyand.pwc.com/trends/2015-commercial-transportation-trends
33 See, again, article by Jamie Robertson, 1 March 2017, ‘Shipping slump: Why a vessel worth $60m was sold as scrap’, http://www.bbc.com/news/business-38653546
34 See, for example, Harvey, F. (2016) ‘Shipping industry criticised for failure to reach carbon emissions deal’, The Guardian, 28 October 2016.

Trends in the Transport of Goods by Sea
19
shipping.35 Dr Tristan Smith from University College London notes: “We think that by 2050, the carbon intensity [CO2 emitted] that ships will have to operate under will have to be 60 per cent to 90 per cent lower per tonne-mile”.36 The industry is exploring the potential of various technological solutions such as fuel cells replacing, at least in part, the use of heavy fuel oil and diesel.
5.3.3 Geopolitics, Demographics and Emerging Markets
Changing demographics (and concomitant demand patterns) are a key factor in the demand for shipping. Dicken (2015, 341) notes that, according to the UN, world population is set to increase to around 10.1 billion by 2100, with increased urbanisation and further rise of megacities key features of this population growth. According to the Office for National Statistics the UK population is projected to grow to 70 million by mid-2027.37 We noted too above – in the context of changes in manufacturing – that as developing countries’ national income increases their demand for imported consumer goods rises (e.g. higher protein food products) which in turn will lead to increased demand for maritime transport. Geopolitical developments and trade agreements will also influence future maritime flows (e.g. Brexit, TTIP) and may also lead to new, niche trades.38 New routes too are slowly emerging such as the Northern Sea routes (the potential currently constrained by various factors such as seasonality, technology and insurance)39, China’s ‘one belt one (silk) road’40, and the proposed Nicaragua Canal (funded by a Chinese billionaire).41 As both markets change and the logistics industry develops, it is notable too that other ‘non-traditional’ actors, such as Amazon, are entering the logistics marketplace and acquiring their own transport and warehouse assets.42
35 For an insight into this subject see, for example, the work of the UK multi-university consortium at http://www.lowcarbonshipping.co.uk
36 Quoted in Tradewinds, 9 March 2017, Paul Berrill ‘Fuel cells will be “far cheaper than diesel within next decade”’.
37 See https://www.ons.gov.uk/peoplepopulationandcommunity/populationandmigration/populationprojections
38 For example cheaper imports of oranges to the UK, post Brexit, from Brazil as opposed to Spain?
39 Malte Humpert, ‘Is northern sea route shipping in a deep freeze?’ Arctic Deeply, 6 June 2016, https://www.newsdeeply.com/arctic/articles/2016/06/06/is-northern-sea-route-shipping-in-a-deep-freeze
40 Cecilia Ma Zecha, Joe Ngai and Kevin Sneader, ‘China’s one belt, one road: will it reshape global trade?’ McKinsey, podcast July 2016, http://www.mckinsey.com/global-themes/china/chinas-one-belt-one-road-will-it-reshape-global-trade
41 Suzanne Daly, ‘Lost in Nicaragua, a Chinese tycoon’s canal project’ New York Times, 3 April 2016, https://www.nytimes.com/2016/04/04/world/americas/nicaragua-canal-chinese-tycoon.html
42 ‘Elizabeth Weise, Amazon could be moving into the $350B ocean freight market’, USAToday, 14 January 2016, http://www.usatoday.com/story/tech/news/2016/01/14/amazon-makes-move-into-shipping-china-freight-forwarder/78810804

Trends in the Transport of Goods by Sea
20
6. Vision UK Maritime Freight Flows 2050
We envision UK maritime freight flows in 2050 will be characterised by:
A flexible (on and offshore) ports sector with automated handling capabilities and linked (physically and digitally) to its hinterland – serviced by a network of inland ports and intermodal transport connections; there will be increased use too of coastal shipping and inland waterways;
Green and smart ‘future proof’ ships will service a global shipping network characterised by inter-hub connections serviced by mega-ships, with more flexible smaller modular ships connecting these hubs to diffuse regional port networks;
Product flows within self-thinking supply chains will be characterised by global flows of lighter and higher-energy products in a connected global economy, with ships acting as both rolling warehouses and floating factories with capacity to both process/customise products on board and react to both real-time and predicted demand.

Trends in the Transport of Goods by Sea
21
References
Baines, T. and Lightfoot, H. (eds) (2013) Made to Serve, Chichester: Wiley.
Blanchard, D. (2015) Don’t Stretch Your Global Supply Chain Past the Breaking Point, Industry Week, 5 February. http://www.industryweek.com/supply-chain/dont-stretch-your-global-supply-chain-past-breaking-point.
Brooks, M. (2010) International Trade in Manufactured Goods. In C. Grammenos (ed.), The Handbook of Maritime Economics and Business, 2nd edition, London: Lloyd’s List.
Calatayud, A. (2017) The Connected Supply Chain, IDB Discussion Paper 508, March. New York: Inter-American Development Bank.
Christopher, M. and Holweg, M. (2011) ‘Supply Chain 2.0’: Managing Supply Chains in the Era of Turbulence, International Journal of Physical Distribution and Logistics Management, 41 (1), 63–82.
Christopher, M. and Holweg, M. (2017) Supply Chain 2.0 Revisited: A Framework for Managing Volatility-Induced Risk in the Supply Chain, International Journal of Physical Distribution and Logistics Management, 47 (1), 2–17.
Constantinescu, C., Mattoo, A. and Ruta, M. (2015) The Global Trade Slowdown: Cyclical or Structural? IMF Working Paper 15/6, Washington, DC: International Monetary Fund.
Department for Transport (2017) Maritime and Shipping Statistics, https://www.gov.uk/government/collections/maritime-and-shipping-statistics#publications-2017.
Das, M. and N’Diaye, P. (2013) The End of Cheap Labour, Finance & Development 50 (2), 34–37.
Dicken, P. (2015) Global Shift, 7th edition, London: Sage.
George, R. (2013) Ninety Percent of Everything, New York: Picador.
Grillo, U. (2017) Federation of German Industries (BDI), quoted in: Merkel Warns European Business Not to Press for ‘Comfortable’ Trade Deals, Financial Times, 6 October.
Iansiti, M. and Lakhani, K. (2017) The Truth about Blockchain, Harvard Business Review, 95 (1), 118–127.
International Transport Forum (2015) The Impact of Mega-Ships, Paris: International Transport Forum and OECD.
Lloyd’s Register, QinetiQ and the University of Southampton (2015) Global Marine Technology Trends 2030, available at http://www.lr.org.

Trends in the Transport of Goods by Sea
22
Mangan, J., Lalwani, C. and Fynes, B. (2008) Port-Centric Logistics, International Journal of Logistics Management 19 (1), 29-41.
Mangan, J. and Lalwani, C. (2016) Global Logistics and Supply Chain Management, 3rd edition, Chichester: Wiley.
MDS Transmodal (2016) The Value of Goods Passing through UK Ports, available at http://www.abports.co.uk/About_ABP/Downloads.
Naval Architect (2017) Low-Cost Smart Shipping, in Maritime Industry IoT developments 2017 (a supplement to The Naval Architect) January, 4-6.
Porter, Janet (2016) Neuroscientist Sends Wake-up Call to Container Lines, Containerisation International, April, 28–32.
Porter, Janet (2017) Last Word to Shippers as Project Maersk Swings into Action, Containerisation International, January/February, 22–24.
Rivoli, P. (2009) The Travels of a T-Shirt in the Global Economy, Hoboken, NJ: Wiley.
Stopford, M. (2015) From Eco-Ships to Smart-Shipping: Revolution or Evolution? The Naval Architect, January, 18-21.
UNCTAD (2016) Review of Maritime Transport 2016, Geneva: United Nations Conference on Trade and Development.

Trends in the Transport of Goods by Sea
23
© Crown copyright 2015
This publication is licensed under the terms of the Open Government Licence v3.0 except where otherwise stated. To view this licence, visit nationalarchives.gov.uk/doc/open-government-licence/version/3 or write to the Information Policy Team, The National Archives, Kew, London TW9 4DU, or email: [email protected].
Where we have identified any third party copyright information you will need to obtain permission from the copyright holders concerned.
This publication available from www.gov.uk/go-science
Contacts us if you have any enquiries about this publication, including requests for alternative formats, at:
Government Office for Science 1 Victoria Street London SW1H 0ET Tel: 020 7215 5000 Email: [email protected]