
Future Network Architectures - UK Government Web …webarchive.nationalarchives.gov.uk/+/http:/ ·...
153
Future Network Architectures CONTRACT NUMBER: DG/DTI/00102/00/00 URN NUMBER: 08/641
Transcript of Future Network Architectures - UK Government Web …webarchive.nationalarchives.gov.uk/+/http:/ ·...
Future Network Architectures
CONTRACT NUMBER: DG/DTI/00102/00/00
URN NUMBER: 08/641
DWG HORIZON SCANNING P01 STEERING GROUPDWG HORIZON SCANNING P01 STEERING GROUPDWG HORIZON SCANNING P01 STEERING GROUPDWG HORIZON SCANNING P01 STEERING GROUP
THE PB POWER REPORT ON THE PB POWER REPORT ON THE PB POWER REPORT ON THE PB POWER REPORT ON FUTURE NETWORK FUTURE NETWORK FUTURE NETWORK FUTURE NETWORK
ARCHITECTURESARCHITECTURESARCHITECTURESARCHITECTURES
Introduction:Introduction:Introduction:Introduction: In support of DWG Horizon Scanning P01, the BERR’s Emerging Energy Technologies Programme commissioned PB Power to
undertake an investigation and report on proposed ‘Future Network
Architectures’ (CONTRACT NUMBER: DG/DTI/00102/00/00) to inform the future development of Distribution Networks in the UK in response to the
many challenges and drivers now being faced by the industry. The
investigation was undertaken during 2007 and was guided by the DWG HS Project 01 Manager and steering group. The final report was submitted to
AEA Technology (acting for the BERR Emerging Energy Technologies
Programme) in November 2007.
Objective:Objective:Objective:Objective: The aim of the study was to suggest possible innovative
distribution network architectures that would be compatible with the 2020
generation/demand scenarios resulting from Horizon Scanning P01 and the SuperGen scenarios, both produced by the University of Strathclyde.
Further, this should not only consider the technical issues but also the
impact on commercial and regulatory frameworks.
The study focused on three possible but different generation/demand
scenarios (as considered by a stakeholder group). A fourth “Greenfield”
scenario was also included as a contrast to the architectures developed from existing networks. The report considers the effects that each scenario
would have on Distribution Network Architecture going forward.
Methodology:Methodology:Methodology:Methodology: A number of approaches were used to ensure the greatest
possible engagement with stakeholders and also provide fresh, innovative
thinking into the process. A literature search, a stakeholder workshop, interviews with key players and a number of challenge meetings with the
project steering group were all used to ensure the widest possible
consensus on future network evolution or revolution.
Findings:Findings:Findings:Findings: The report has been well received by DWG members and
provides a very useful array of conclusions and proposals for further
consideration. The report provides a balanced view on the likely impacts in terms of technical, commercial and regulatory issues that will need to be
addressed if the challenges of the European 2020 targets are to be
effectively addressed.
Further Work:Further Work:Further Work:Further Work: Since completion of the report, there have been further
developments relating to renewable electricity generation:

Firstly, late in 2007, the Government clarified (primarily for Stamp Duty exemption purposes) its definition of a ‘Zero Carbon Home’ and this has
direct implications for distribution network architecture in terms of the role
that on-site and local renewable generation will play in meeting that
definition.
Secondly, as announced on 23 January 2008, in order to meet its
obligations towards the EU’s climate change proposals and CO2 reduction targets, the UK will have to meet 15% of its total energy consumption from
renewable sources by 2020. This in turn means that a substantial
percentage of electricity production may have to be from renewable sources (noting that this percentage of production implies a considerably
greater proportion by capacity if it is assumed that intermittent renewables,
in particular wind, are to play a major role in meeting this target).
It is therefore recommended that the implications surrounding Zero Carbon
Homes and the ‘15% from renewables’ target are converted into realistic
regionally dissagregated transmission and distribution connected generation mix scenarios which in turn can be tested against existing
network architectures. This will provide a more detailed view of the
challenges that distribution networks will face. It will also allow known solutions to be tested for their efficacy so that shortcomings can be
identified and addressed.
FUTURE NETWORK ARCHITECTURES
CONTRACT NUMBER: DG/DTI/00102/00/00 URN NUMBER: 08/641
Contractor
PB Power
Lower Watts Consulting
The work described in this report was carried out under contract as part of the BERR Emerging Energy Technologies Programme, which is managed by AEA Energy & Environment. The views and judgements expressed in this report are those of the contractor and do not necessarily reflect those of the BERR or AEA Energy & Environment.
First published 2007 © Crown Copyright 2007

EXECUTIVE SUMMARY
Introduction PB Power was commissioned by the DBERR to propose future network architecture solutions that would most efficiently meet the Supergen 2020 Scenarios published in July 2006. The project was initiated by the Distribution Working Group (DWG) Programme Group 1: Horizon Scanning and builds on the “Technical Architecture – The Way Ahead” Report prepared by the IEE Power Systems & Equipment Professional Network on behalf of the Distributed Generation Coordinating Group. During the preparation of this report, a number of documents have been published of significance to the scope of the report, including:
• European Commission; European Technology Platform SmartGrids; Strategic Research Agenda for Europe’s Electricity Networks of the Future, May 2007
• Energy White Paper, 23 May 2007
• ERGEG; Towards Voltage Quality Regulation in Europe – An ERGEG Conclusions Paper, 18 July 2007, and
• CIRED 2007, 19th International Conference on Electricity Distribution, Vienna, 21 – 24 May 2007.
As and where appropriate we have taken account of the developments therein. Review of Supergen 2020 scenarios An initial review of the Supergen 2020 scenarios concluded that the Continuing Prosperity and Environmental Awakening scenarios would be the most challenging and more likely to influence future network architecture. They also aligned more closely with recent European and UK Government announcements on carbon emission and renewables targets than the Economic Concern and Supportive Regulation scenarios. A third scenario, Power to the People, was developed to focus on the impact of high penetration levels of micro generation connected onto the low voltage network. Existing Architecture & System Integration of Distributed Generation We review existing network architecture, the main point being that distribution networks have traditionally been passive networks facilitating power flows in one direction from the grid intake point to demand customers. We conclude that:
• Renewable Distributed Generation (DG), e.g. on-shore wind, biomass, are, by their nature, regional resources favouring certain areas of the UK. The impact of increased distributed generation will therefore not be felt uniformly across the distribution network.
• Short circuit fault levels tend to be an issue on urban networks with short feeder lengths, particularly where direct 132/11kV transformation is used, or on
i

interconnected networks as the source impedance is lower in these types of network.
• Voltage rise tends to be an issue on rural networks with longer, small capacity feeder lengths and low network loads.
• Voltage unbalance and voltage rise are potential issues on the LV network particularly existing LV networks with tapered conductors.
• A low impedance LV network can accept unbalanced loads and generation while remaining within the voltage unbalance limit whereas a high impedance network might not.
We also briefly review some of the more relevant recent studies concerning distributed generation and technologies that enable the connection of increasing amounts of distributed generation and conclude that:
• If significant amounts of distributed generation are to be integrated in an economic and cost effective manner then distribution network architecture needs to be reconsidered in light of new and emerging technologies.
• The network will develop at different paces and there are likely to be hybrid networks utilising new network architecture superimposed on existing network topologies. Active Network Management (ANM) will enable existing network capacity to be optimised and this is already starting to happen as existing examples of ANM solutions have shown.
• Ofgem’s Innovation Funding Incentive (IFI) scheme has encouraged DNOs to look for innovative solutions and there has already been significant progress in terms of identifying new technologies. This has led to a number of industry trials. Translating this into adopted solutions is an important next step.
Commercial and Regulatory We analyse the commercial and regulatory implications associated with the adopted 2020 scenarios and conclude that:
• Ofgem should consider reviewing the functional and licensed roles of supply, distribution and transmission under a low carbon, high DG future. This should ideally extend to examine the licence restriction on DNOs owning and operating generation and storage, and the respective roles of the distributor and supplier in relation to commercial treatment of demand side management and storage. Such a review should also examine the ability of DG to offer, deliver and trade ancillary services on a local and regional basis to DNO, as an alternative to the GB System Operator (SO) providing these via transmission connected generation.
• In future, consideration should be given to introducing more flexibility into distribution business price controls, (similar to recent approach taken to the Transmission Price Control) to allow for rapid unforeseen expenditure caused by DG, and specify treatment of stranded assets in the event that DG does not take off in particular areas, where investment has occurred ahead of need. The balance between OPEX and CAPEX should be critically examined, in order to ensure that the practise of ANM is not unreasonably restrained.
ii

• The DG connection incentive should be revisited to cater for the ability to plan on a holistic basis, in order to properly consider multiple generator applications optimally.
• In circumstances where there maybe a large volume of connected micro generation (Power to the People) the efficiency and ‘robustness’ of the electricity trading system and ‘Supplier Hub’ needs to be critically examined, focusing on the relationship between suppliers and distributors and the potential introduction of regional balancing markets as an alternative mechanism.
Network Architecture for 2020 We describe the vision for the network architecture for 2020 for the three adopted scenarios. We develop this vision further by considering a “Greenfield Approach” where an idealised 132/20kV/LV network is established anew, as presented in Figure E1, in which the principal elements of future network architecture would be:
• power network,
• enhancements to the power network,
• network control and
• electricity market and trading From our review of the scenarios and the Greenfield Approach, we conclude that:
• Although a “Greenfield Approach” 132/20kV/LV network configuration would have advantages of capacity over existing configurations, including lower losses and therefore a lower “carbon footprint”, asset replacement requirements alone to 2020 are unlikely to be a strong driver to support such a change.
• A number of new devices for enhancing existing networks are available now or in the near future which can be applied to existing network topologies to meet the requirements up to 2020.
• The requirement for storage within MV (20 or 11kV) and LV networks would depend on the economics of such storage, the existence of network constraints and the market for stored energy including system balancing power requirements.
• The principal driver for providing a future architecture for network control is the volume of distributed generation to be connected to the distribution network.
• Where micro generation is to be installed the key network architecture device is the smart meter with two-way communications and arranged for automatic meter management (AMM); data aggregation would be required, possibly in the form of the Virtual Power Plant (VPP) concept (from the FENIX project) with the VPP performing two activities, commercial and technical (power flow management, voltage control and at the system operator level, the power balancing and frequency control function).
iii

Figure E1 Greenfield Approach – Future Network Architecture Figure E1 Greenfield Approach – Future Network Architecture
iv
iv

Indicative costs We estimated the indicative costs of the future network architectures, applying specific technical solutions (in particular more advanced voltage control) to existing networks. The basis for the estimates of indicative costs is the Network Voltage Change report prepared by PB Power for DTI in which the costs per MW of additional distributed generation were derived from modelling of networks. The conclusions of this section of the report are that:
• Indicative capital costs of applying network solutions to the three scenarios are in the range of £18.8/kW to £88.6/kW of additional distributed generation, over the period 2005 to 2020.
• The highest cost is associated with Scenario 3, Power to the People, reflecting the assumed quantity (about 12 million) of smart meters.
• In Scenario 3, Power to the People, these costs (while excluding any connection costs) approach Ofgem’s reported average cost of £82 per kW of connecting distributed generation – including both sole-use and shared asset costs; furthermore the average costs per kW are shown to be rising with increasing levels of distributed generation. It is for consideration therefore, whether additional regulatory incentives should be provided in DPCR5 (2010 to 2015) to cover the measures required to accept additional distributed generation.
Impact Assessment In the section on Impact Assessment we consider the likely impact of the 2020 levels of distributed generation for each scenario. We conclude that:
• In general:
• Increased penetration of DG will have an impact on the planning and operation of distribution networks as it is often difficult to determine an accurate gross demand on a network with DG connected due to the lack of network information available on distribution networks and in particular on LV networks.
• It is generally accepted that there is a skills shortage within the electricity industry. As the network becomes more active, the operation of the network will become more complex with an impact on staff training requirements.
• The technical requirements of planning and operating the electricity networks are stated in the ESQCR and the Grid and Distribution Codes and further consideration should be given to the impact on the aspects of:
• frequency control (Balancing Mechanism) to accommodate increasing levels of distributed generation,
• Distribution Code – generation planning standard proposal,
• relaxation of planning standards (we would discount a stochastic approach with relaxed standards for power quality as in BS EN50160),
• constraints (interruptible contracts and/or LOLE type guarantee).
• The Power to the People Scenario will have the largest impact on both technical and commercial aspects of the distribution network. In the longer term the
v
relationship between the supplier and distributor in this situation may need clarifying, and the ability of the trading system to cope with large numbers of regional trading and balancing markets may need to be addressed.
• Major unscheduled ‘activity’ on the local network instigated by suppliers, for example, automatically responding to national system balancing signals and scheduling all DG on or off, without involving distributors will be unsustainable or will result in potentially unnecessary network investment, if the parties continue to adopt current roles and duties.
The way forward The following areas for further work have been identified: Network Architecture for 2020 Further work on network architecture would usefully include:
• the capacities and limitations of LV networks to accept increasing amounts of single phase connected micro generation,
• enhanced protection to accommodate bi-directional power flows, particularly to avoid false tripping and blinding of protection due to distributed generation,
• development of network design tools to assist network planning with large penetrations of DG connected; these would include probabilistic techniques to assess network risk and available capacity and algorithms to forecast DG and demand behaviour based on weather and price signals,
• a review of requirements of smart meter installations where micro generation is installed, in particular the issue of separate metering of generation and load,
• a review of communications requirements and media, particularly to meet the needs of micro-generation and
• further development of the VPP concept, including the interface between Commercial and Technical VPP functions.
vi
Commercial and Regulatory Further work on commercial and regulatory issues would usefully include:
• examination of the feasibility of widespread ancillary service delivery by DG to DNOs,
• exploration of the commercial consequences of long term partial constrained operation of DG,
• review of functional and licensed roles of supply, distribution and transmission under a low carbon, high DG future,
• introduction of more flexibility in DNO price controls to allow for rapid unforeseen expenditure caused by DG, and specification of the treatment of stranded assets in the event that DG does not take off in particular areas, where investment has occurred ahead of need,
• review of the balance between OPEX and CAPEX, in order to ensure that the practise of Active Networks Management is not unreasonably restrained and
• consideration of the longer term relationship between the supplier and distributor, and the ability of the trading system to cope with large numbers of potential regional trading and balancing markets – particularly in the Power to the People scenario.
Indicative Costs Further refinement of the use of the Network Voltage Change model would usefully include modelling of:
• combinations of generation added by type of network and by voltage level at different dates over the horizon to 2020,
• the effect of network loadings not being homogeneously distributed,
• corresponding short circuit levels,
• operating costs including losses and hence deriving NPVs of overall cost streams and
• consideration of energy outputs and hence derivation of costs per unit of energy.
vii

CONTENTS
1. Introduction..................................................................................................................1 1.1 Background ........................................................................................................................1 1.2 Scope ..................................................................................................................................1 1.3 Approach ............................................................................................................................1 1.4 Developments during the preparation of report............................................................2
2. Review of Supergen 2020 scenarios...........................................................................3 2.1 Introduction.........................................................................................................................3
2.1.1 Continuing Prosperity ...............................................................................................4 2.1.2 Economic Concern ....................................................................................................4 2.1.3 Environmental Awakening .......................................................................................4 2.1.4 Supportive Regulation ..............................................................................................5 2.1.5 Comments on Supergen 2020 Scenarios .............................................................5
2.2 Alternative Scenario Studies ...........................................................................................5 2.2.1 Supergen HDPS ........................................................................................................5 2.2.2 Tyndall Centre RCEP UK Electricity Scenarios for 2050....................................6 2.2.3 PB London Study ......................................................................................................7 2.2.4 Comments on other Scenario Work .......................................................................7
2.3 Other Considerations ........................................................................................................7 2.3.1 UK Government Climate Change Bill.....................................................................7 2.3.2 EU Proposals .............................................................................................................7 2.3.3 Energy White Paper May 2007 ...............................................................................8
2.4 Conclusions ........................................................................................................................8 2.4.1 Scenarios for Future Network Architecture ...........................................................9
3. Existing Distribution Network Architecture.................................................................11 3.1 Introduction.......................................................................................................................11 3.2 Existing Network Architecture .......................................................................................11 3.3 Challenges Faced by Future Network Architecture ...................................................13
3.3.1 System Voltage........................................................................................................13 3.3.2 Power Quality...........................................................................................................14 3.3.3 Reverse Power Flows.............................................................................................15 3.3.4 Thermal Constraints................................................................................................16 3.3.5 Short Circuit Fault Levels .......................................................................................16 3.3.6 SCADA and Communication Systems.................................................................17
3.4 Review of Recent Studies ..............................................................................................17 3.4.1 Econnect Report for the DTI ..................................................................................17 3.4.2 PB Report for the DTI on Network Voltage Change and Reverse Power ......18 3.4.3 KEMA Report for the DTI .......................................................................................19 3.4.4 Durham University...................................................................................................19 3.4.5 Module 5 of EA Technology’s Strategic Technology Programme ...................19
3.5 Conclusions ......................................................................................................................20 4. System Integration of Distributed Generation............................................................21
4.1 Traditional Solutions .......................................................................................................21 4.2 Alternative Network Topology .......................................................................................21
4.2.1 Alternative Voltage Levels .....................................................................................21 4.2.2 Alternative Network Configurations ......................................................................22
viii

4.3 Enabling Technologies ...................................................................................................22 4.3.1 Automatic Voltage Control .....................................................................................22 4.3.2 Fault Current Management ....................................................................................23 4.3.3 Reactive Power Compensation.............................................................................23 4.3.4 Smart Metering ........................................................................................................24 4.3.5 Intelligent Electronic Devices ................................................................................24 4.3.6 Active Network Management ................................................................................24
4.4 Conclusions ......................................................................................................................25 5. Commercial and Regulatory ......................................................................................26
5.1 Introduction.......................................................................................................................26 5.2 Current Status of Regulatory and Commercial Influences on DG...........................26
5.2.1 European Union.......................................................................................................26 5.2.2 Ofgem Statutory Duties ..........................................................................................26 5.2.3 Distribution Price Control (DPC) ...........................................................................26 5.2.4 Connection and charging policy ............................................................................27 5.2.5 Trading Power..........................................................................................................27 5.2.6 Ancillary Services ....................................................................................................28 5.2.7 Avoided Network Reinforcement ..........................................................................28
5.3 Value of ‘Green’ Energy .................................................................................................28 5.3.1 Renewable Obligation Certificates (ROCs).........................................................28 5.3.2 Climate Change Levy (CCL)..................................................................................28 5.3.3 Carbon ......................................................................................................................29
5.4 Electricity Licensing ........................................................................................................29 5.4.1 Generation ................................................................................................................29 5.4.2 Supply .......................................................................................................................29 5.4.3 On-site.......................................................................................................................30
5.5 Regulatory and Commercial Implications of the 2020 Scenarios ............................30 5.6 Conclusions ......................................................................................................................32
5.6.1 Functional & Operational Review .........................................................................32 5.6.2 Price Controls ..........................................................................................................32 5.6.3 Trading Systems......................................................................................................32
6. Network Architecture for 2020 ...................................................................................33 6.1 Introduction.......................................................................................................................33 6.2 Flexibility for the Future ..................................................................................................33 6.3 Continuing Prosperity Scenario ....................................................................................34 6.4 Environmental Awakening Scenario ............................................................................37 6.5 Power to the People Scenario.......................................................................................40 6.6 2020 Functional Requirements .....................................................................................43
6.6.1 Network Functionality .............................................................................................43 6.6.2 Common Functionality ............................................................................................43 6.6.3 SCADA Functionality ..............................................................................................44
6.7 ”Greenfield Approach” ....................................................................................................46 6.7.1 Power network topology .........................................................................................46 6.7.2 Power Network Design Principles and Functionality .........................................48 6.7.3 Network Control .......................................................................................................50 6.7.4 Electricity Market and Trading...............................................................................52
6.8 Conclusions ......................................................................................................................52 7. Indicative Costs .........................................................................................................55
7.1 Introduction.......................................................................................................................55 7.2 Reverse Power/Voltage Limitations .............................................................................55
ix

7.2.1 PB Report for the DTI on Network Voltage Change and Reverse Power ......55 7.2.2 2020 Scenarios ........................................................................................................56 7.2.3 Comments on assumptions ...................................................................................59
7.3 Optimise Network Capacity ...........................................................................................60 7.4 Constraint Management .................................................................................................60 7.5 Demand Side Participation (Smart Meters) ................................................................61 7.6 Fault Level Management................................................................................................61 7.7 Protection..........................................................................................................................62 7.8 Electricity Market and Trading.......................................................................................63 7.9 Exclusions ........................................................................................................................63 7.10 Conclusions ......................................................................................................................65
8. Impact Assessment ...................................................................................................67 8.1 General .............................................................................................................................67 8.2 Technical Requirements ................................................................................................67 8.3 2020 Scenarios ................................................................................................................69
8.3.1 Continuing Prosperity .............................................................................................69 8.3.2 Environmental Awakening .....................................................................................69 8.3.3 Power to the People................................................................................................70
8.4 Costs .................................................................................................................................71 8.5 Timescales .......................................................................................................................72 8.6 Conclusions ......................................................................................................................74
Appendix A Review of Equipment & Systems Appendix B Literature Survey and Review of EU Smart Grids Report Appendix C General Observations on the Future of DG Appendix D Disaggregated Generation Data Appendix E Feedback from the Workshop Appendix F Letter from Dave Openshaw to DWG Members Appendix G Terms of Reference
x
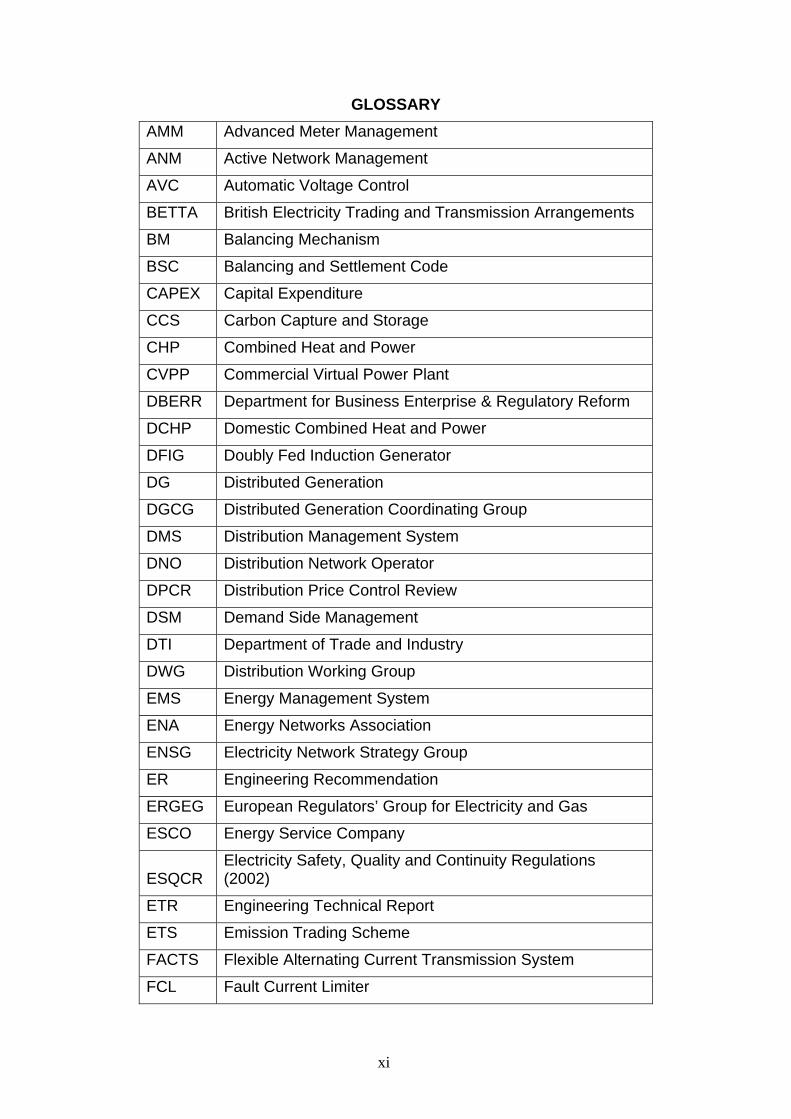
GLOSSARY AMM Advanced Meter Management
ANM Active Network Management
AVC Automatic Voltage Control
BETTA British Electricity Trading and Transmission Arrangements
BM Balancing Mechanism
BSC Balancing and Settlement Code
CAPEX Capital Expenditure
CCS Carbon Capture and Storage
CHP Combined Heat and Power
CVPP Commercial Virtual Power Plant
DBERR Department for Business Enterprise & Regulatory Reform
DCHP Domestic Combined Heat and Power
DFIG Doubly Fed Induction Generator
DG Distributed Generation
DGCG Distributed Generation Coordinating Group
DMS Distribution Management System
DNO Distribution Network Operator
DPCR Distribution Price Control Review
DSM Demand Side Management
DTI Department of Trade and Industry
DWG Distribution Working Group
EMS Energy Management System
ENA Energy Networks Association
ENSG Electricity Network Strategy Group
ER Engineering Recommendation
ERGEG European Regulators’ Group for Electricity and Gas
ESCO Energy Service Company
ESQCR Electricity Safety, Quality and Continuity Regulations (2002)
ETR Engineering Technical Report
ETS Emission Trading Scheme
FACTS Flexible Alternating Current Transmission System
FCL Fault Current Limiter
xi
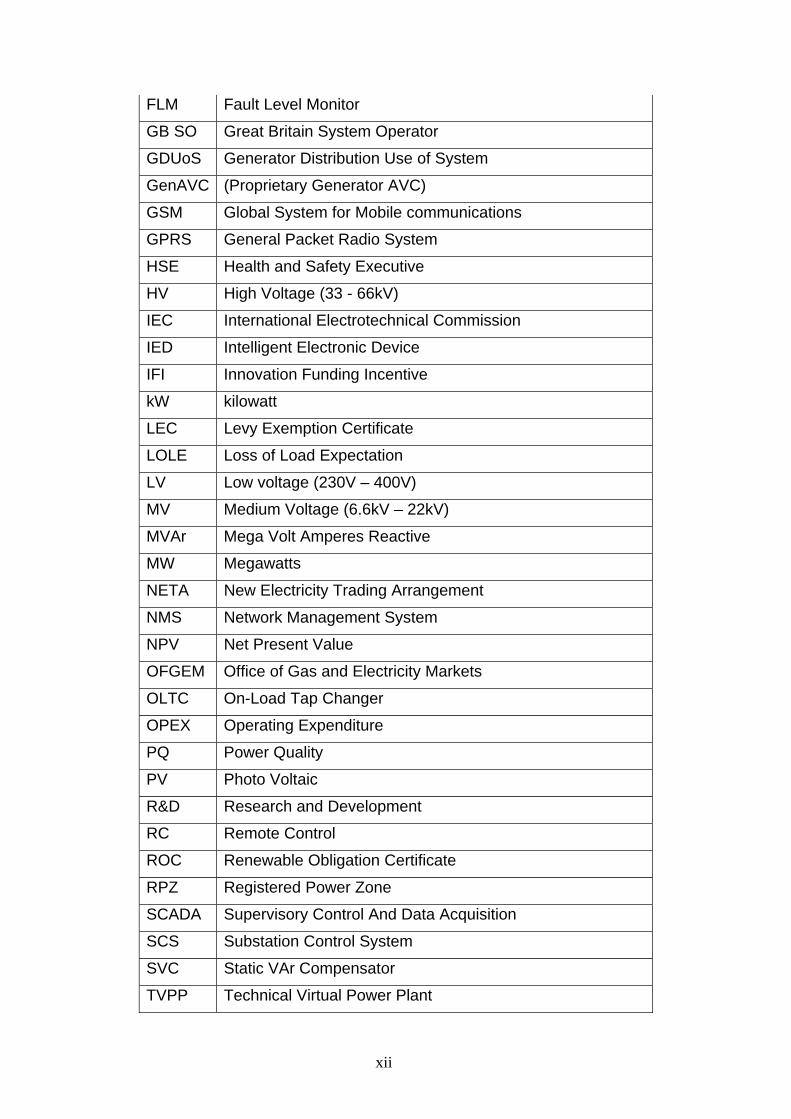
FLM Fault Level Monitor
GB SO Great Britain System Operator
GDUoS Generator Distribution Use of System
GenAVC (Proprietary Generator AVC)
GSM Global System for Mobile communications
GPRS General Packet Radio System
HSE Health and Safety Executive
HV High Voltage (33 - 66kV)
IEC International Electrotechnical Commission
IED Intelligent Electronic Device
IFI Innovation Funding Incentive
kW kilowatt
LEC Levy Exemption Certificate
LOLE Loss of Load Expectation
LV Low voltage (230V – 400V)
MV Medium Voltage (6.6kV – 22kV)
MVAr Mega Volt Amperes Reactive
MW Megawatts
NETA New Electricity Trading Arrangement
NMS Network Management System
NPV Net Present Value
OFGEM Office of Gas and Electricity Markets
OLTC On-Load Tap Changer
OPEX Operating Expenditure
PQ Power Quality
PV Photo Voltaic
R&D Research and Development
RC Remote Control
ROC Renewable Obligation Certificate
RPZ Registered Power Zone
SCADA Supervisory Control And Data Acquisition
SCS Substation Control System
SVC Static VAr Compensator
TVPP Technical Virtual Power Plant
xii

UCTE Union for the Co-ordination of Transmission of Electricity
VAr Volt Amperes Reactive
VPP Virtual Power Plant
WP Work Programme
xiii
1. INTRODUCTION
1.1 Background PB Power was commissioned by the DTI to propose future network architecture solutions that would most efficiently meet the Supergen 2020 Scenarios published in July 2006. The work was initiated by the Distribution Working Group (DWG) Programme Group 1: Horizon Scanning and builds on the “Technical Architecture – The Way Ahead” Report prepared by the IEE Power Systems & Equipment Professional Network on behalf of the Distributed Generation Coordinating Group. Distribution networks were originally designed as simple passive networks delivering power from the transmission system down to the end user. They were not designed to have large amounts of distributed generation connected and this can cause network issues for both primary and secondary networks. If significant amounts of distributed generation are to be integrated in an economic and cost effective manner then distribution network architecture needs to be reconsidered in light of new and emerging technologies.
1.2 Scope The scope of the project was to consider and recommend the network functionality and architecture that would be required for each of the Supergen 2020 scenarios taking into consideration:
• EU and UK Energy Policy
• Technical barriers
• Existing infrastructure life cycles
• Existing global products and solutions
• Regulatory and commercial barriers The term network architecture defines the topology of the network, that is, the voltage levels employed and the connectivity of the network. The functionality defines how the network will operate. The relationship between heavy current and light current solutions was emphasized in the terms of reference.
1.3 Approach The first stage of the project was to review the Supergen 2020 scenarios published in July 2006 in light of the 2006 Energy Review and more recent European and UK Government announcements on carbon emission and renewables targets.
1

A literature review was also undertaken at this stage to identify new technologies and innovative solutions in development or under trial that would aid the integration of distributed generation. A workshop was held in April 2007 to obtain feedback from a representative group of stakeholders on the scenarios, identify the technical and non technical barriers and how these might be overcome. A summary of the workshop can be found in Appendix E. A more detailed review of the network issues associated with the integration of distributed generation and the status of enabling technologies was undertaken. This was used as supporting information to identify alternative network solutions. For each scenario a description of how the distribution network might look and behave was used to determine the network functionality requirements. Indicative costs to implement the proposed solutions were estimated by applying the scenarios to generic networks developed by PB for a previous DTI funded project.
1.4 Developments during the preparation of report During the preparation of this report, a number of documents have been published of significance to the scope of the report, including:
• European Commission; European Technology Platform SmartGrids; Strategic Research Agenda for Europe’s Electricity Networks of the Future, May 2007
• Energy White Paper, 23 May 2007
• ERGEG; Towards Voltage Quality Regulation in Europe – An ERGEG Conclusions Paper, 18 July 2007, and
• CIRED 2007, 19th International Conference on Electricity Distribution, Vienna, 21 – 24 May 2007.
As and where appropriate we have taken account of the developments therein.
2

2. REVIEW OF SUPERGEN 2020 SCENARIOS
2.1 Introduction The Supergen Future Networks Technologies Consortium produced a set of 2020 scenarios based on their six 2050 scenarios previously developed to present a vision of the potential energy provision in the UK, although they did not consider in detail the impact on the network. The relationship of these four intermediate scenarios is illustrated in Figure 2-1 with Table 2-1 describing the scenarios in terms of the four key parameters.
Figure 2-1 Relationship between 2020 and 2050 Scenarios1
Table 2-1 Summary of SuperGen 2020 Electricity Industry Scenarios1
1 Electricity Network Scenarios for 2020 EPSRC/SGFNT/TR/2006-001
3

2.1.1 Continuing Prosperity This scenario envisions a future where economic growth is supported by research and development investment in electricity network and generation technologies, leading to an electricity industry of increased technological sophistication with increased use of energy services. Electricity demand and peak power continue to grow year on year. Demand side management and smart metering are employed to avoid reinforcement and support implementation of micro generation. There is continued investment in renewable energy generation (wind, biomass, wave and tidal) and non-renewable energy generation remains dominated by natural gas fired units. Some nuclear plant has been life-extended with new nuclear plant under construction. There are increased imports from Europe through interconnectors and micro-grids and local markets are being trialled to manage the local networks.
2.1.2 Economic Concern There is an ongoing moderate economic decline with the finance available for research and development being restricted. Economic drivers take precedence over environmental issues and electricity demand growth is reduced due to sluggish economic growth. There continues to be some interest in demand side management from industry and commercial users as a peak management tool. Renewable generation continues to develop (wind, biomass and marine) although the capacity additions create network issues that are considered uneconomic to alleviate. Large generation dominates with 85% of electricity supplied through this route; coal and nuclear plant have been life extended with limited new build coal and natural gas plant. Network development is limited with existing assets being life-extended; distribution networks remain largely passive in operation and small scale wind and micro-generation is still not economic.
2.1.3 Environmental Awakening There is a heightened awareness of environmental issues and an increased adoption of energy efficiency measures. There is widespread use of smart meters and demand side management techniques which see the energy and peak demands comparable with those in 2006. The investment in demand side measures has reduced the diurnal variability in electricity demand. Strong investment in renewable energy has seen the sites for large onshore wind being developed meaning that new sites are tending to be connected at distribution voltages. The main renewable energy is from offshore wind with biomass. New central plant is predominantly natural gas fired with some CHP; no new nuclear plant is built but existing nuclear is life-extended. Existing coal plant is closed and the remaining plant is rendered uneconomic due to a high carbon price and low carbon allocations. There are some demonstration Carbon Capture & Storage (CCS) plants, but concerns remain over the long-term CO2 infrastructure. Networks are being developed with increased prevalence of circuit under-grounding for environmental reasons. Some bulk energy storage prototypes are being deployed and there is a large increase in the amount of small scale wind, biomass and micro-CHP.
4

2.1.4 Supportive Regulation Electricity demand growth remains strong although the wide scale adoption of demand side participation (DSP) means that the growth in peak generation capacity is significantly restricted. The government and regulators support research and development in low and zero carbon technologies and market arrangements and incentives have been put in place to support qualifying renewable generation. Renewable energy is dominated by onshore wind and biomass projects with some offshore wind and marine generation. The pressure for fuel diversity sees one or two new nuclear plants operational in 2020. Coal plants are using new technologies and incorporating CCS techniques. Natural gas plant remains as the largest contributor, although some pilot CCS schemes are in place on both coal and gas plant. Transmission system capacity is replaced as it becomes life expired, with distribution systems experiencing stress from the increased quantity of embedded generation. Domestic DSP and micro-CHP is not encouraged by central policy with attendant low development. Low voltage networks are increasingly under-grounded.
2.1.5 Comments on Supergen 2020 Scenarios Given that the intention was to identify scenarios that presented various states of ‘stress’ to distribution networks in 2020, it was felt that the ‘Economic Concern’ scenario was unlikely to present many issues. Most of the generation growth was in larger projects connected at 132kV and above with minimal adoption of micro generation and small scale renewables. ‘Supportive Regulation’, whilst having continued demand growth, was not too dissimilar to the ‘Economic Concern’ scenario outcome. The bulk of the additional energy requirements are provided by increased nuclear power utilisation and increased adoption of larger renewable energy projects. Again it is not believed that this scenario would present many issues since most of the additional generation is at higher voltages. These scenarios were not taken any further in the review of future electricity network architecture. ‘Continuing Prosperity’ and ‘Environmental Awakening’ are more challenging scenarios and have therefore been considered further.
2.2 Alternative Scenario Studies A number of other generation mix scenarios up to 2020 were reviewed to determine the validity of the Supergen 2020 Scenarios for the Future Electricity Network Architecture project.
2.2.1 Supergen HDPS The Supergen Consortium recently produced a set of scenarios for use within the Supergen consortium on highly distributed power systems (HDPS). The scenarios have been developed to test the consortium’s key research and provide a common basis for all research groups. This is the latest known scenario work to be published. Having reviewed previous studies, the report recommends three scenarios, developed by combining the Supergen 2020 scenarios with the more demand
5

focused UK Domestic Carbon model (UKDCM) produced by the Environmental Change Institute. The three Supergen HDPS scenarios are summarised below.
• Business As Usual: This scenario represents the continuation of near term trends, technology developments, environmental attitudes and policy. Power generation remains predominantly centralised with natural gas plant being the mainstay; existing coal plant is retired and any new coal plant uses new technology. No CCS plant is envisaged to be operational by 2020. Large offshore wind makes good headway. Most of the demand increase stems from increased wealth and adoption of additional electronic and luxury goods. There is a low level adoption of small scale generation with the main technologies being solar PV and micro-CHP, although neither is significant by 2020. The operational modes for the transmission and distribution systems continue as at present.
• Low Carbon: There is a strong environmental priority in this scenario with electricity demand reduced in comparison to the Business as Usual scenario. The main driver for this low carbon scenario is that society places a value on carbon and adopts energy savings measures accordingly. Wind and marine renewables develop strongly, coal plant is gradually phased out, no new nuclear is envisaged, and gas makes up the balance. Distributed generation provides a significant contribution (~10% of electricity supplied in 2020) with district heating and domestic micro-generation (solar PV, wind and CHP) being the main contributors. System operation is beginning to require active management at distribution level and co-ordinated control of the distributed generation.
• Deep Green: In this scenario, electricity demand is similar to that in the Low Carbon scenario due to a similar societal vision however decentralised generation plays a more significant role in the network operation. Renewable generation has a significant proportion of the total electricity supplied at around 25% in 2020; mainly from onshore and offshore wind with a small amount of marine. The operation of the distribution networks requires significant change at the high voltage level to manage the large number of decentralised generators.
2.2.2 Tyndall Centre RCEP UK Electricity Scenarios for 2050 In 2003 the Tyndall Centre produced four scenarios based on achieving the government’s target of 60% carbon emissions by 2050. Scenario 1 delivered carbon saving through increased nuclear generation. Scenario 3 also relies on nuclear with significant load reductions. Scenarios 2 and 4 both envisaged more decentralised generation, particularly solar PV and micro CHP. Both these scenarios require demand reductions, however Scenario 4 requires very large demand reductions (33% of end use) to achieve the 2050 target. Taking Scenario 2 and linearly interpolating back to 2020 from the 2050 scenario, solar PV and micro CHP provide significant contribution to the overall electricity
6

provision (~11%). Decentralised generation (wind, marine and biomass plant) contribute ~22% (in addition to the micro generation contribution) with the balance coming from nuclear (7.7%), hydro (4.4%) and fossil (56%). Under this scenario, the operation of distribution systems would need to be changed to accommodate the level of decentralised and micro-generation envisioned.
2.2.3 PB London Study This study argues that distributed generation delivers significant benefits within the context of a large urban centre such as London or other major cities and conurbations in the UK. The benefits are derived through the efficient use of primary energy sources coupled to more energy efficient building construction. Two distributed generation scenarios were considered ‘Low DG’ and ‘High DG’.
2.2.4 Comments on other Scenario Work The Tyndall and PB work indicates that a useful third scenario could be developed to include considerably higher penetration levels of micro generation. This scenario is referred to as “Power to the People” and is used as a testing scenario for LV networks in particular. The level of micro generation connected to the LV is two times that of the “Environmental Awakening”. For this scenario it is assumed that this would displace centrally controlled synchronous generation connected to the EHV.
2.3 Other Considerations
2.3.1 UK Government Climate Change Bill The proposal to introduce binding legislation that will enable fines to be levied on the UK Government for any failure to achieve stated carbon reduction targets will promote confidence and under-pin the development and adoption of low and zero carbon technologies. Certainly this provides a bias towards the ‘Green’ scenarios that may be considered to be appropriate for the assessment of the future networks architectures in 2020. It also makes the possibility of new nuclear more likely.
2.3.2 EU Proposals The EU recently published a Renewable Energy Road Map setting out a European target of 20% renewables by 2020. This is a binding target although the apportionment between Member States has not been determined. The report suggests that electricity production from renewables could increase from the current 15% to approximately 34% of overall electricity consumption in 2020. The report states that wind has the potential to contribute 12% of EU electricity by 2020, one third of which would be offshore and that the biomass sector has potential to grow significantly using wood, energy crops and bio-waste in power stations. Figure 2-2 illustrates the significant increases in electricity generated expected from wind and biomass.
7

Large scale hydro continues to contribute to the amount of electricity in the EU produced from renewables. The report also suggests that predicted cost reductions in new technology will lead to increased levels of solar, wave and tidal power.
Figure 2-2 EU Projected Growth in Renewable Generation2
2.3.3 Energy White Paper May 2007 The aims set out in the Government’s Energy White Paper are to deliver energy security and accelerate the transition to a low carbon economy. This would be achieved by saving energy, developing cleaner energy supplies and ensuring secure, reliable energy at a competitive price. This paper promotes energy efficiency and saving measures including the improved energy efficiency of consumer electronics and the introduction of real time displays and smart meters in domestic and commercial premises. There are a number of proposals to encourage the connection of renewables and distributed generation including micro generation for example the proposed changes to the planning inquiry rules to remove some of the practical barriers. New nuclear is seen as a distinct possibility with the Government’s preliminary view being that it is in the public interest to give private sector energy companies the option of investing in new nuclear power stations.
2.4 Conclusions The EU projections for wind are therefore much higher than the UK scenarios developed so far whilst the biomass projections are similar.
2 EU Renewable Energy Roadmap
8

Of the Supergen 2020 scenarios, “Environmental Awakening” contains the most wind generation, however even in this scenario wind only accounts for 6% of the electricity produced. All of the Supergen 2020 scenarios show an increase in electricity produced from Biomass (10 – 14% of total electricity supplied in 2020). The Tyndall scenarios 1 & 2 also show significant contribution from energy crops and agricultural waste. Another recent proposal by the EU estimates that up to 30% of the lighting energy consumption could be saved through the adoption of compact fluorescent light bulbs – equivalent to some 80TWh pa in the UK context. The above provides evidence of a future move towards the ‘Green’ scenarios – and favours those that predict demand reduction. Although considered a very challenging scenario, the Power to the People Scenario, with high penetration of micro generation and demand side participation by domestic customers, is therefore a feasible future scenario if EU targets are to be met.
2.4.1 Scenarios for Future Network Architecture The three recommended scenarios for the development of future electricity network architectures are:
• Continuing Prosperity: Supergen 2020 scenario, increasing demand levels, increased level of DG, centralised load balancing, some level of distribution network flexibility required
• Environmental Awakening: Supergen 2020 scenario with high levels of DG, requiring increased decentralised load balancing and fault level management
• Power to the People: A new scenario, based on the Tyndall Scenario 2 and PB London High DG Scenario predictions for micro generation, developed to enable the exploration of future network architecture for LV networks with very high levels of micro generation and the role of domestic customers
A breakdown of the installed capacity by type and voltage level is shown in Table 2-2. The peak demands used in the Supergen 2020 scenarios for Continuing Prosperity and Environmental Awakening scenarios are shown in Table 2-3. It is has been assumed that where people have more information and ownership of their energy use they will consume less energy, and peak shift to take advantage of cheaper energy prices or energy generated locally. The peak demand for the Power to the People scenario is therefore lower than the other two scenarios.
9

Table 2-2 Capacity Installed at Each Voltage Level (GW)
At end of 2004
Scenario 1: Continuing Prosperity
2020
Scenario 2: Environmental
Awakening 2020
Scenario 3: Power to
the People 2020
EHV: Uncontrolled Generation (GW)
8.7 11.8 11.0
EHV: Synchronous Generation (GW)
73.8 63 49 45
HV: Uncontrolled Generation (GW)
3.9 4.0 5.1 4.0
HV: Asynchronous & Inverter Fed Generation (GW)
1.0 3.5 4.6 3.0
MV: Uncontrolled Generation (GW)
1.8 2.0 2.7 2.0
MV: Asynchronous & Inverter Fed Generation (GW)
0.7 1.5 2.2 1.0
LV: Inverter Fed Uncontrolled Generation (GW)
0.4 3.0 6.0 12.0
Totals 81.6 85.7 81.4 78.0
Table 2-3 Peak Demand (GW)
At end of 2004
Scenario 1: Continuing Prosperity
Scenario 2: Environmental
Awakening
Scenario 3: Power to the
People
59.4 66 60 57
10

3. EXISTING DISTRIBUTION NETWORK ARCHITECTURE
3.1 Introduction This section gives a brief description of existing network architecture, a summary of network issues arising from the connection of distributed generation and an overview of recent quantitative studies that identify which network issues are significant at which voltage levels for varying penetrations of DG.
3.2 Existing Network Architecture Distribution networks have traditionally been passive networks facilitating power flows in one direction from the grid intake point to demand customers. There has previously been a “fit & forget” approach to the connection of distributed generation often resulting in network reinforcement, or connection with agreed constraints on the generation. Existing network architecture and design has been and still is influenced by several statutory and industry documents including:
• Electricity Safety Quality and Continuity Regulations (2002): this specifies, amongst other requirements, voltage limits at the customers terminals, earthing and protection obligations
• ENA Engineering Recommendations (ER): the relevant ERs are listed in Annex 1 of the Distribution Code, forming part of the technical requirements of that code and specify the standards to which UK distribution networks are planned including network security and power quality limits
ER P2/6 Security of Supply sets out the minimum level of network security required for different classes of demand and this has influenced primary network architecture. For example, load groups >1MW up to 12MW must have, as a minimum, a switchable alternative supply available within 3 hours. This can be met by using open ring network architecture as shown in Figure 3-1, where load can be re-supplied by moving the normal open point. Alternatively, interconnected network architecture can be used as shown in Figure 3-2 where load is automatically re-supplied from an alternative source. A closed ring configuration, as shown in Figure 3-3, is sometimes used to supply large customers with a more reliable supply. Each side of the ring is fed from the same source. More sophisticated protection such as unit or directional overcurrent protection is used to isolate the fault. Closed ring configuration is also commonly used at higher voltages such as 33kV and 132kV to meet the requirements of ER P2/6 Class C and above requirements. At these higher voltages, more sophisticated protection such as unit and/or distance protection is used to achieve faster clearance times.
11

Figure 3-1 Typical Open Ring Network
= Normally open switch = Normally closed switch
HV/MV Sub A
HV/MV Sub B
11kV Ring Main Unit
Normal Open Point
= normally closed circuit breaker
Figure 3-2 Typical Interconnected Network
HV/MV Sub A
HV/MV Sub B
Figure 3-3 Typical Closed Ring Connection
HV/MV Sub A
HV/MV Sub B
DOC DOC Directional
Overcurrent Protection installed
at Substation
12

3.3 Challenges Faced by Future Network Architecture There are a number of technical issues associated with the connection of generation onto distribution networks which future network architecture must overcome to enable the integration of DG. These are discussed below.
3.3.1 System Voltage The voltage profile of a network is determined by the magnitude and direction of the power flow and the circuit impedances. With no distributed generation connected to a system, power flows to customer demands will result in a voltage drop between the substation and the customer installation. Distribution systems are typically designed so that, when necessary, the full allowable voltage range is used. Under maximum demand conditions the system voltage will approach the minimum statutory limit and under minimum demand conditions the voltage will approach the maximum statutory limit as shown in Figure 3-4. The export from distributed generation will act as a negative load and reduce the feeder loading or during periods of low demand cause reverse power flows. This results in a voltage rise along the feeder. Maximum export during minimum demand conditions is the most onerous condition and could result in the voltage rising above the statutory limit as shown in Figure 3-5.
Figure 3-4 Typical Voltage Profile
Consumer Load
Substation
Statutory Limit
Statutory Limit
Minimum Load
Maximum Load
106%
Power Flow
Distance along Feeder >
110%
94%
% Voltage
Consumer Load
Substation
Statutory Limit
Statutory Limit
Minimum Load
Maximum Load
106%
Power Flow
Distance along Feeder >
110%
94%
Figure 3-5 Voltage Profile with Generation Connected
13

Consumer LoadSubstation
Statutory Limit
Statutory Limit
Min Load, Max Gen
Max Load, Max Gen106%
Power Flow
Distance along Feeder >
110%
94%
G
Max Load, Min Gen
Min Load, Min Gen % Voltage
Consumer LoadSubstation
Statutory Limit
Statutory Limit
Min Load, Max Gen
Max Load, Max Gen106%
Power Flow
Distance along Feeder >
110%
94%
G
Max Load, Min Gen
Min Load, Min Gen
3.3.2 Power Quality
3.3.2.1 Voltage Unbalance Voltage unbalance generally occurs where the single phase loads are unbalanced. ER P29 sets out the network design limits for voltage unbalance at each voltage level. Voltage unbalance can lead to negative phase currents, counter rotating torque in induction motors and motor overheating. Large numbers of single phase micro generation units connected to an LV network could potentially cause voltage unbalance outside of the P29 limits as the export power could be unevenly distributed across the phases. For multiple installations of single-phase micro generation units, balancing the unit generation evenly against the load on the phases will need to be considered. The PB Power report3 on the impact of small scale embedded generation indicates that network impedance is the most significant design factor. A low impedance LV network can accept unbalanced loads and generation while remaining within the limit set by ER P29 whereas a high impedance network might not.
3.3.2.2 Voltage Fluctuation and Flicker Voltage fluctuation occurs when there are sudden changes in demand or network source impedance. Highly fluctuating loads such arc furnaces or welding loads can cause voltage flicker. ER P28 states short term and long term flicker severity limits designed to avoid these types of load causing disturbance to other customers. Flicker levels as low as 0.2% are visible in lighting.
3 PB Power report to DTI New and Renewable Energy Programme, “The Impact of SSEG on the Operating Parameters of Distribution Networks’’, 2003, K/EL/00303/04/01, URN 03/1051
14

Changes in the output from distributed generation can have the same effect, for example the variable output from a wind turbine, or the inrush current during start up of an induction type generator.
3.3.2.3 Harmonics Ideally the voltage supplied to a customer’s terminal would be a pure sine wave, however there are many non linear loads and equipment connected to the system that introduce harmonic components and cause a distorted sine wave. ER G5/4 states the level of total harmonic distortion and individual harmonics acceptable at each voltage level. High levels of harmonics can cause interference with communication systems as well as overheating in equipment such as transformers and cables. Inverter connected generators such as micro generation must be manufactured to comply with BS EN 61000-3-2: 2000 Limits for harmonic current emissions (equipment input current up to and including 16 A per phase). However when connected in high numbers the cumulative effect could increase the harmonic levels in the network.
3.3.3 Reverse Power Flows Distribution networks were traditionally designed to facilitate the flow of electricity in one direction from the grid interface down to the demand customers. Increasing levels of distributed generation can lead to the export from these generators exceeding the local demand of the network and the local transformers experiencing reverse power flows up to the next voltage level. There are two main factors which limit the reverse power flows allowable on a particular network. The first is the reverse power rating of the primary plant, such as transformers. The second is the ability of the network’s automatic control systems to respond correctly under reverse power flow conditions. Transformer tap changers are the only primary plant item that has been identified as having a restricted reverse power rating. This is dependent on the design of the tap changer, those with a single diverter switch (i.e. bridging) resistor have reduced reverse power ratings. However, most modern tap changers do not have this restriction since they are based on designs using two diverter switch resistors. Voltage control schemes, in the form of Automatic Voltage Control (AVC) relays, are normally applied to 132/33kV and 33/11kV transformers. Some DNOs also use line drop compensation or negative reactance compensation to provide improved operation under loaded conditions or when operating transformers in parallel. Both rely on the measurement of transformer load current and therefore may be affected by flows of reverse power. There have also been reports of transformer directional overcurrent protection operating due to reverse power flows. This protection normally has a low current setting and therefore a potential limiting factor.
15

The reverse power flows through 11/0.4kV transformers will only be limited by the full load rating of the transformer, since these transformers have off-load tap changers.
3.3.4 Thermal Constraints Network equipment such as transformers, cables and overhead lines have a rating based on their thermal capability. Typically, cyclic and continuous ratings are used and seasonal or ambient temperature corrections applied where appropriate. Since the majority of load currently supplied on a distribution network is cyclic in nature the network’s thermal ability has tended to be designed using cyclic ratings and hence smaller cross sectional area conductors or lower rated transformers have been installed than would be necessary for continuous load. When generation is connected to the distribution system the power flows may become less cyclic, and the use of cyclic ratings less appropriate. Rural areas with low demands are typically fed using smaller conductors. This often restricts the amount of generation that can be connected in these areas without network reinforcement. The use of a higher distribution voltage such as 20kV or equivalent would increase capacity and improve voltage regulation along this type of feeder. Some DNOs have existing 22kV networks in rural areas.
3.3.5 Short Circuit Fault Levels The design short circuit fault levels at each distribution voltage level were originally based on the fault infeed from the transmission system and infeeds from rotating load i.e. mainly induction motors (the latter only formally being taken into account following the introduction of IEC 60909 and ER G74). Standard transformer impedances and switchgear ratings were based on these design levels. The contribution to the network short circuit fault level from distributed generation is dependent on the type of generation connected. Synchronous generators will increase the overall system fault level (both ‘make’ and ‘break’ fault levels) whereas induction type generators mostly impact on peak “make” fault levels as the fast decay of the current contribution over time results in a lesser effect on the RMS “break” fault level. The majority of micro generators are connected to the network via an inverter interface which provide a much lower short circuit fault current than synchronous or induction type generators. Fault levels are therefore unlikely to be a big issue at LV although this is dependent on the fault level of the next voltage level up. The rotor of a doubly fed induction generator as developed for wind generator applications is also connected via an inverter. The short circuit contribution to peak “make” is similar to that of a conventional induction generator but the RMS “break” duty is low due to a fast acting short circuit “crow bar” applied to the rotor winding under fault conditions. This type of generator is typically connected at the MV or higher voltage levels.
16

3.3.6 SCADA and Communication Systems The main concerns of utilities are the availability and security of the communications network. This has led to utilities owning and managing their own private networks in addition to using third party networks communications networks. These systems are designed for protection signalling, SCADA and voice communication. Within the electricity infrastructure there is a hierarchy with respect to the required level of redundancy, reliability and availability of the electrical network and associated network management and communications networks. Generally, the higher the voltage, the more sophisticated and secure the communication infrastructure. At transmission and sub transmission voltage substations there are typically two physically separated, point to point communication links that provide duplication and hence additional security. On distribution networks there may be one multi drop link between substations with no duplication. At the low voltage there is no communication infrastructure. Various communication types, including DNO owned and third party provider networks are currently used on distribution networks. A DTI report reviewed existing SCADA and communication systems and concluded that there are fundamental limitations to the speed of operation, reliability and resilience of existing distribution network SCADA systems that would limit its application where the consequence of failure is significant4. Resilient communications are a key requirement of any SCADA or other active management solution. This is currently not widely available in existing distribution networks.
3.4 Review of Recent Studies A number of studies have been undertaken in recent years to examine the effect of increasing levels of distributed generation on distribution networks and to determine the penetration levels at which DG will start to cause capacity, fault level and voltage problems. These are a useful guide as to the types of network solutions that will be required in the future. Below is a summary of the more recent work involving typical UK network models.
3.4.1 Econnect Report for the DTI A DTI commissioned report, compiled by Econnect (2006), on “Accommodating Distributed Generation” studied a generic network model under two generation scenarios. The “high impact” scenario envisaged high penetrations of wind and marine generation onto the HV and MV networks and micro generation connected at LV.
4 Network Management systems for active distribution networks, a feasibility Study, D.A. Roberts, SP Power Systems Ltd & Scottish Power PLC. 2004. Contract number K/EL/00310/REP, URN Number 04/1361.
17

The second scenario looked at high penetrations of micro generation only. The study considered the impact on the network in years 2010, 2020 and 2050. The scenarios used for this piece of work are similar to the Environmental Awakening and Power to the People scenarios considered by the Future Electricity Network Architecture workshop and this report, although different timescales have been applied. The study identified the following:
• Voltage rise and fault level issues will mainly occur on the 33kV network. In the 2030 scenario, voltage rise becomes significant on the LV network due to increased levels of micro generation
• Reverse power flows from the 33kV to 132kV occurred under the 2010, 2030 and 2050 scenarios although no transformer ratings are exceeded
• Thermal constraints did not start to have an impact on the generic network until 2030 and then only at 33kV
• Short circuit fault level issues appeared first on 33kV busbars in the 2010 scenario and by 2030 became a problem at isolated LV substations
The results showed that penetration levels of 18% domestic micro generation could be accommodated on a typical DNO network without significant cost. However this is assumed to be distributed across the network as opposed to high penetration clusters of micro generation. The report discusses alternative network solutions such as fault current limiting devices and dynamic ratings, and how these could be adopted to facilitate the integration of DG to existing network architecture.
3.4.2 PB Report for the DTI on Network Voltage Change and Reverse Power A DTI commissioned report, compiled by PB Power titled “Future Energy Solutions, Network Voltage Change and Reverse Power Flow with Distributed Generation – Final Report, Report No. 62115A/1, Final Rev3, dated April 2005”, studied the impact of increased levels of distributed generation on generic rural, urban and meshed network models. Generation was added to each busbar in the generic model to determine the amount of generation that could be accommodated before voltage violations or reverse power flows beyond equipment ratings occurred. With the exception of the LV networks and rural MV networks, reverse power was the first issue encountered as levels of DG increase as opposed to voltage limit constraints. Voltage rise restricted the amount of generation that could be connected on the LV network and weaker rural networks.
18

3.4.3 KEMA Report for the DTI A DTI commissioned report compiled by KEMA (2005) indicated that fault levels would not be problematic in the majority of LV networks, with even a 100% penetration of micro CHP only increasing the LV fault levels by 6-7%. This statement assumes the micro generation is connected via power electronic devices which contribute little fault infeed. The report expected fault level problems would occur in the following areas in the period to 2010:
- MV urban networks. The increase in power generated from small, medium and large CHP as well as landfill gas and waste fuelled generation will lead to the increase in fault levels on already densely connected 11kV and 33kV networks which currently have the lowest fault level headroom
- Rural HV substations. Large scale DG projects connecting into rural networks will lead to localised instances where equipment fault level ratings are exceeded requiring major reinforcement works
- Isolated LV situations. LV networks with high levels of DG penetration may require fault level related reinforcement where, for example, micro CHP is installed in high density urban areas.
3.4.4 Durham University Durham University have recently completed a study on the impact on voltage unbalance of high penetrations of single phase micro generation5. The study results showed that the ER P29 limits were exceeded when there is approximately 150%6 penetration of 1.1kW embedded generation connected to one phase on a 4-wire system. The results are comparable with those contained in the DTI Report, Impact of Small Scale Embedded Generation on Operating Parameters of Distribution Networks by PB Power. This report indicates that voltage unbalance will become the most significant constraint once voltage rise issues are solved.
3.4.5 Module 5 of EA Technology’s Strategic Technology Programme This project has undertaken electrical network monitoring of an LV network supplying a cluster of 500 houses each with 1kWe domestic CHP installed7. The initial results based on measurements taken from a LV feeder supplying 69 properties indicate a change in the daily load profile with a higher load factor.
5 An Investigation of Voltage Unbalance in Low Voltage Distribution Networks with High Levels of SSEG, Durham University & E.ON UK, CIRED 2007 6 The study used 1.1kWe generation connected at each customer as a base to compare the results with those obtained in the earlier PB Power study. The 150% penetration case therefore refers to 1.5 x 1.1kWe = 1.65kWe connected at each customer. 7 Beddoes A., Gosden M., Povey I., The performance of an LV network supplying a cluster of 500 houses each with an installed 1kWe domestic combined heat and power unit, CIRED 2007, paper 0030.
19

A peaky voltage profile was observed in the morning and evening with 6am to 7am being the peak voltage point. Flicker and harmonic distortion was observed to be below the acceptable limits however an abnormal spike was observed at 7.30am which over a larger sample could increase in magnitude and become a quality of supply issue.
3.5 Conclusions Renewable DG (e.g. on-shore wind, biomass) are, by their nature regional resources favouring certain areas of the UK, and the impact of increased distributed generation will therefore not be felt uniformly across the distribution network. Short circuit fault levels tend to be an issue on urban networks with short feeder lengths, particularly where direct 132/11kV transformation is used, or on interconnected networks as the source impedance is lower in these types of network. Alternatively, voltage rise tends to be an issue on rural networks with longer, small capacity feeder lengths and low network loads. Voltage unbalance and voltage rise are potential issues on the LV network particularly existing LV networks with tapered conductors. A low impedance LV network can accept unbalanced loads and generation while remaining within the voltage unbalance limit whereas a high impedance network might not.
20

4. SYSTEM INTEGRATION OF DISTRIBUTED GENERATION
4.1 Traditional Solutions The traditional approach to solving network issues resulting from the connection of distributed generation has generally been a “fit and forget” one. Solutions tended to be one of the following:
• Network reinforcement such as circuit overlays or switchgear replacement
• Connect the generator at a higher voltage level where it has less impact on the network
• Limit the size of generator that can be connected at that location i.e. reducing the size of the generator such that the voltage rise is within statutory limits or the short circuit fault levels are within the existing switchgear rating
• Constrain the generator’s output during periods of minimum demand i.e. only allow the generator to export between set hours of the day or times of the year to prevent circuit overloads
These approaches can have high capital costs associated with them or result in loss of revenue to the generator and can sometimes prevent the generation project from going ahead. More innovative approaches are required to facilitate the increased penetration of DG in an efficient way.
4.2 Alternative Network Topology
4.2.1 Alternative Voltage Levels Internationally, there has been a move towards the use of 20kV as the preferred MV distribution voltage. Distribution network operators, both in the UK and overseas, are considering 20kV networks as an alternative to 11kV and 6.6kV in urban areas. The driver for this has tended to be the need to supply high density loads in built up areas where cable congestion and land for substation sites can constrain network development. This increase in voltage would also provide additional capacity to connect distributed generation. In urban areas, the main restriction on the connection of distributed generation is usually the short circuit fault level at 6.6kV or 11kV. An increase in voltage to 20kV would be beneficial in this instance as the design fault level of a 20kV network is much higher, enabling more distributed generation to be connected. However the increased thermal capacity of a 20kV feeder would result in a larger amount of demand being at risk for a single fault on the network, with consequential impact on CIs and CMLs. More sophisticated protection and automation schemes would help mitigate this risk.
21

4.2.2 Alternative Network Configurations An alternative to ring and interconnected network designs is the “double tee” arrangement, where the MV/LV transformer is supplied by teeing off two separate circuits as shown in Figure 4-1 below. In the event of a fault the supply to the transformer is automatically switched over to the “healthy” alternative feeder. This design has merits in terms of security of supply but no additional advantage over the open ring configuration with regards to the connection of distributed generation. This type of network is not used in the UK, however a similar arrangement is used by EDF on the 20kV distribution network in Paris.
Figure 4-1 Double Tee Network Configuration
HV/MV Sub A
HV/MV Sub B
4.3 Enabling Technologies A number of new technologies and innovative solutions are in development or under trial. Most look to solve the technical constraints on existing primary network architecture by applying new secondary network technology to optimise the existing capacity, for example active network management to restore supplies, control voltage and manage fault level.
4.3.1 Automatic Voltage Control The installation of MV/0.4kV transformers with on-load tap changers would improve the control of the 400V system voltages. AREVA is currently developing a two position tap changer for such applications and there are plans to trial this on the United Utilities network. Power electronic single phase LV voltage regulators are currently being trialled by United Utilities and Scottish Power to solve customer voltage complaints. Although the majority of these units have been installed at locations where voltage is below statutory limits, they have also been used to reduce voltages previously above the statutory limits.
22

Econnect’s GenAVC is being trialled by EDF Energy and United Utilities to optimise network capacity and generation export. The GenAVC system uses state estimation techniques to feedback nodal voltage level into the substation voltage control scheme to reduce or increase the primary busbar volts accordingly.
4.3.2 Fault Current Management The ENSG DWG Work Programme Two, ‘Network Design for a Low Carbon Economy’ has recently commissioned a review of the current state of technical solutions for fault level management and to develop a methodology to determine the materiality and locality of short circuit fault levels on distribution networks in the future. The ENA is coordinating a project to develop a fault level monitor that will accurately determine the actual real time network fault level allowing actual rather than calculated fault levels to be used when assessing generator connections. Fault current limiters (FCL) are often used on industrial networks to reduce the actual current that flows during fault conditions. Traditional explosive type devices have so far not been considered to be failsafe and are therefore not used on UK distribution networks. However, superconducting and magnetic type fault current limiters are currently being developed by most of the major manufacturers and are generally perceived to be a failsafe alternative to the traditional type of FCL. These devices could be used as an alternative to split busbars with auto-close switching as currently used by some DNOs to manage network fault levels. This would reduce the number of short duration interruptions experienced by customers during the auto-close time. There are a number of options regarding the location of a FCL device on the network. They can be placed in series with a source of fault infeed or used to couple a split network. Practical considerations such as physical space and access for maintenance need to be assessed alongside the technical aspects.
4.3.3 Reactive Power Compensation Reactive power compensation can be used to control voltage and increase capacity by injecting or absorbing reactive power at the point of connection. American Superconductor’s Dynamic VAR or D-VAR8 system uses power electronic converters. D-VAR detects and instantaneously compensates for voltage disturbances by injecting leading or lagging reactive power at key points on the network. This device is available up to 35kV and can inject up to +/- 8MVAr. The EU sponsored DGFACTS9 project is the use of the Flexible AC Transmission System (FACTS) concept in distribution systems by designing a set of modular systems, so-called DGFACTS systems, to optimally improve the stability and quality
8 http://www.amsuper.com/documents/PES_DVR_01_0804a.pdf 9 http://dgfacts.labein.es/dgfacts/index.jsp
23
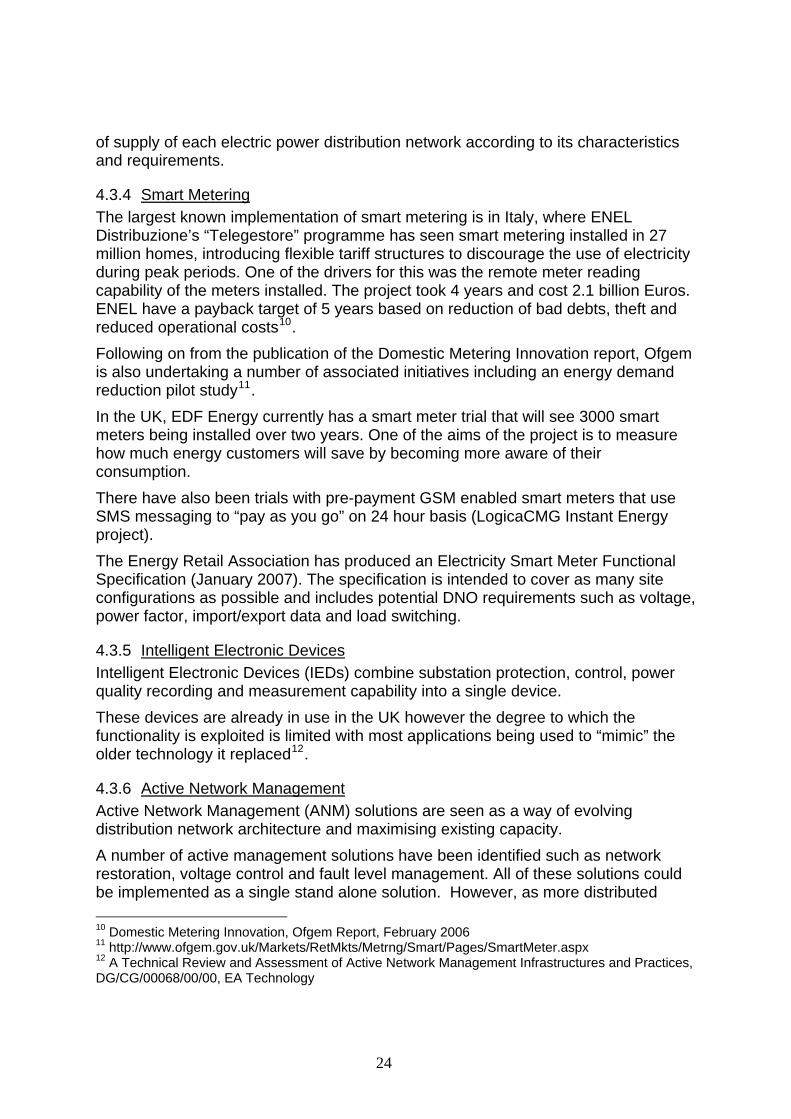
of supply of each electric power distribution network according to its characteristics and requirements.
4.3.4 Smart Metering The largest known implementation of smart metering is in Italy, where ENEL Distribuzione’s “Telegestore” programme has seen smart metering installed in 27 million homes, introducing flexible tariff structures to discourage the use of electricity during peak periods. One of the drivers for this was the remote meter reading capability of the meters installed. The project took 4 years and cost 2.1 billion Euros. ENEL have a payback target of 5 years based on reduction of bad debts, theft and reduced operational costs10. Following on from the publication of the Domestic Metering Innovation report, Ofgem is also undertaking a number of associated initiatives including an energy demand reduction pilot study11. In the UK, EDF Energy currently has a smart meter trial that will see 3000 smart meters being installed over two years. One of the aims of the project is to measure how much energy customers will save by becoming more aware of their consumption. There have also been trials with pre-payment GSM enabled smart meters that use SMS messaging to “pay as you go” on 24 hour basis (LogicaCMG Instant Energy project). The Energy Retail Association has produced an Electricity Smart Meter Functional Specification (January 2007). The specification is intended to cover as many site configurations as possible and includes potential DNO requirements such as voltage, power factor, import/export data and load switching.
4.3.5 Intelligent Electronic Devices Intelligent Electronic Devices (IEDs) combine substation protection, control, power quality recording and measurement capability into a single device. These devices are already in use in the UK however the degree to which the functionality is exploited is limited with most applications being used to “mimic” the older technology it replaced12.
4.3.6 Active Network Management Active Network Management (ANM) solutions are seen as a way of evolving distribution network architecture and maximising existing capacity. A number of active management solutions have been identified such as network restoration, voltage control and fault level management. All of these solutions could be implemented as a single stand alone solution. However, as more distributed 10 Domestic Metering Innovation, Ofgem Report, February 2006 11 http://www.ofgem.gov.uk/Markets/RetMkts/Metrng/Smart/Pages/SmartMeter.aspx 12 A Technical Review and Assessment of Active Network Management Infrastructures and Practices, DG/CG/00068/00/00, EA Technology
24

generation is connected there will be a need to manage several network constraints on the same part of the network. This will require increased levels of network monitoring and intelligent control algorithms to optimise the network, generation and demand. There will be a need for fast, reliable and affordable communication links to integrate existing substation and feeder automation into Energy and Distribution Management Systems. DWG Programme 3: Enabling Active Network Management project group have recently published “A Technical Review and Assessment of Active Network Management Infrastructures and Practices Areas”12. The report concludes that ANM schemes have demonstrated potential to enable more distributed generation to be connected without expensive network reinforcement and that it is possible to implement some local ANM using existing technology installed on DNO networks. However, take up has been slow due to “a lack of confidence in the technology, with a preference expressed for simpler, proven robust solutions” on the part of those questioned.
4.4 Conclusions If significant amounts of distributed generation are to be integrated in an economic and cost effective manner then distribution network architecture needs to be reconsidered in light of new and emerging technologies. The network will develop at different paces and there are likely to be hybrid networks utilising new network architecture superimposed on existing network topologies. Active network management will enable existing network capacity to be optimised and this is already starting to happen as existing examples of ANM solutions have shown. Ofgem’s IFI scheme has encouraged DNOs to look for innovative solutions and there has already been significant progress in terms of identifying new technologies. This has led to a number of industry trials. Translating this into adopted solutions is an important next step.
25

5. COMMERCIAL AND REGULATORY
5.1 Introduction This section of the report analyses the commercial and regulatory implications associated with the adopted 2020 scenarios.
5.2 Current Status of Regulatory and Commercial Influences on DG
5.2.1 European Union In March 2007, the European Council adopted a binding target of a 20% share of renewable energies in overall EU energy consumption by 2020. The apportionment between Member States has yet to be determined, but 34% of electricity generated may have to be from renewables. This production target, which is already ambitious, will of course require a much greater installed capacity in order for this power delivery to occur.
5.2.2 Ofgem Statutory Duties Ofgem’s principal duty as an economic regulator is to protect the interests of energy consumers. It has a secondary duty relating to the environment and sees its sustainable development duty as underpinning its other duties. It emphasises the need to identify policy options that satisfy its social, economic and environmental duties simultaneously, “where possible”13.
5.2.3 Distribution Price Control (DPC) In 2005 Ofgem introduced new incentives on DNOs to facilitate the connection of DG. The “hybrid” incentive scheme provides for partial pass-through of capital invested, with the rest remunerated by a £/MW/year term. It is argued by some 14 that whilst this specific new incentive may be sufficient to remunerate connection of some DG, it incentivises DNOs to minimise their risk by investing only what is required to accommodate DG on a scheme by scheme basis, potentially leading to piecemeal and sub-optimal development of the distribution network. In areas where network infrastructure is sparse (often those areas with potential for renewable generation) it is considered that there may be a particular need to plan network upgrades to cater for sizeable increments of generation over the medium to long term in a ‘holistic’ manner. The 2005 DPC also introduced the twin concepts of Innovation Funding Incentives (IFI) and Registered Power Zones (RPZ). The RPZ incentive allows the DNOs to
13 Letter from Ofgem to the Sustainable Development Committee dated 2nd November 2006, in response to questions raised regarding Ofgem’s role in relation to sustainable development. www.ofgem.gov.uk 14 SSE, SP in their response to 2006 DTI Consultation: Distributed Energy. A call for evidence for the review of barriers and incentives to distributed electricity generation, including combined heat and power
26

earn additional revenue for facilitating innovative DG schemes. Although these schemes are at an early stage, they have made a technical contribution towards facilitating DG.
5.2.4 Connection and charging policy Since 2005, initially on an interim basis, connection of new DG has been charged on a ‘shallowish’ basis, with ongoing payment for generator use of system charges (GDUoS). This policy was introduced by Ofgem as there was a perceived barrier to entry of DG with the previous ‘deep’ connection policy. Various charging models are now being developed by DNOs to take this forward, to determine the arrangements for the future. Some claim that the new policy does not appear to be actually stimulating new connections and it is now also argued that GDUoS creates uncertainty for generators, rather than a known up-front payment15. It is unclear whether this uncertainty will change as more DG is connected at different voltage levels, and the signals become ‘smoother’. As far as domestic micro-generators are concerned, assuming the capacity of the generation device is no greater than the maximum domestic load, there is presently no separate connection charge other than the standard connection arrangements. Domestic, Distribution Network Usage of System (DUoS) charges are recovered from the suppliers on the basis of the electricity consumed (DUoS charge per kWh consumed) and a fixed charge per Meter Point Administration Number (MPAN) per day. A domestic micro-generator where micro-generated electricity is consumed on-site therefore reduces a supplier’s use of system charges (fewer units transported through the DNO). Assuming that fixed charges account for around half of the total DUoS payments, a supplier will reduce its DUoS payments by half for each unit of avoided import (DGCG Technical Steering Group, 2004). In the case where there is wide spread take-up of micro-generation, DNOs may need to review and modify their charging policy as they may not achieve the returns on the direct local assets involved.
5.2.5 Trading Power Most DG is too small to participate directly in BETTA, and DG operators consider the transaction costs to be a barrier. As such, under the current arrangements, DG will need to be contracted with a supplier, who will ‘net-off’ demand against the generator output and may share embedded generation benefits. Intermittent generation clearly has a higher balancing risk passed through in such contracts. Local ‘self’ trading of power ‘beneath’ the wholesale market was originally envisaged by government as an alternative option to sale to suppliers, but with the creation and complexity of the new trading arrangement in 2001, this concept faded, and with a few notable exceptions, supply of power is in the hands of six large, country-wide suppliers16.
15 ENA: ibid 16 The recently published Energy White Paper signals a commitment from these suppliers to publish easily accessible export tariffs for smaller generators.
27

5.2.6 Ancillary Services With the exception of a type of system reserve, ancillary services are not currently competitively sought from DG by the Transmission System Operator (TSO), although some Grid Code standards for mandatory support from transmission connected generators, are being ‘migrated’ to the Distribution Code, as NG becomes concerned about the long-term ability to manage the system with large amounts of DG. DNOs do not presently trade such services, although consumption of reactive power at a generator connection point is often charged when it breaches certain limits.
5.2.7 Avoided Network Reinforcement Engineering standards (i.e. ER P2/6 – Security of Supply) have been recently modified to value DG capacity, and allow DNOs to consider suitable generators as an alternative to investment in new cables or overhead lines. In addition, trials are being conducted, under the Regional Power Zone initiative, to create active networks, whereby more generation can be connected to a particular line in exchange for generators potentially being ‘constrained off’ or turned down for short periods when the thermal capacity of the circuit is reached. This may be particularly helpful for wind generation, as there is a good match between the wind farm output and the cooling effect of the wind, on overhead line conductors17.
5.3 Value of ‘Green’ Energy
5.3.1 Renewable Obligation Certificates (ROCs) Suitably qualifying generation can capture this benefit, and trade the certificates with suppliers. The mechanism is presently under-going a government review and the obligation may be modified or banded to differentiate between generation resources. However, the overall targets may have to be raised in the light of the recent EU decision on binding targets. This review may recommend differentiating between renewable resources e.g. by reducing the ROC value for on-shore wind in favour of off-shore wind, as the latter is deemed to require more stimulus.
5.3.2 Climate Change Levy (CCL) The climate change levy is a tax, introduced in 2001, on the use of energy in industry, commerce and the public sector with offsetting cuts in employers' National Insurance Contributions and additional support for energy efficiency schemes and renewable sources of energy. Electricity generated from new renewable energy and fuel used by good quality combined heat and power schemes ("Good Quality CHP" - certified via the CHP Quality Assurance Programme CHPQA) are exempt and
17 The project financing of generators in this situation may need to be further examined as the circumstances for being constrained in this way would need to be legally bounded in time or season, otherwise there would be an uncertain income stream for the project potentially threatening the bank financing.
28

therefore qualify for Levy Exemption Certificated (LECs). LECs have a value by enabling electricity suppliers to avoid paying CCL.
5.3.3 Carbon Phase 1 of the EU Emission Trading Scheme (ETS) began on 1 January 2005 and runs until the end of 2007. Phase II will operate from 2008 to 2012. Under the scheme, each participating country has a National Allocation Plan (NAP) specifying caps on greenhouse gas emissions for individual power plants and other large point sources. Each facility gets a maximum amount of emission "allowances" for a particular period. To comply, facilities can either reduce their emissions or purchase allowances from facilities with an excess of allowances. Progressively tightening caps are foreseen for each new period, forcing overall reductions in emissions. Large non-renewable DG will be allocated sector specific (e.g. CHP) permits in their own right, but generally it is expected that the traded costs of complying with the scheme will feed through to electricity prices. Given the European scale and complexity of the scheme, with significant changes in scope coverage and rules at each phase and with limited trading history, relying on this in order to plan and finance a project is not easy. The EU is currently consulting on the ETS framework post 2012, which will be needed to underpin the long-term value of carbon. In view of the timescale for utility and network investment this is accepted as being an urgent international priority, and businesses and government agree the trajectory for the cap on emissions covered by the scheme must be for at least as far as 2030 to give sufficient clarity.
5.4 Electricity Licensing
5.4.1 Generation On several occasions since Vesting of the electricity industry in 1990, the Government has relaxed the licensing regime for generation. This was done both to remove ‘red tape’ of compliance for de-minimus activities and to allow local value to be captured, giving access to embedded generation benefits for DG. Some of these benefits have fallen away since the demise of the Pool in 2001, but still include avoided Transmission Network Use of System (TNUoS) and Balancing Services Use of System (BSUoS) charges and, reduced energy losses.
5.4.2 Supply Depending on the classification, the upper limit for supply licence exemption is set at 2.5MW or 1MW supply for domestic customers. This is considered by some independent distribution network operators (iDNOs) and Energy Service Companies (ESCOs) to be unnecessarily restrictive and is serving to inhibit the growth and connection of local DG, particularly Combined Heat and Power. The counter argument is that customers on a private network who experience problems, or face
29

increased prices, do not have the advantage of recourse to Ofgem, or a choice of competitive supplier, as the exempt supply is outside the licensing regime.18
5.4.3 On-site The Secretary of State in his decision on the treatment of ‘On-Site Generation’ in 1991, ruled that such power should be ‘netted-off’ from site demand, rather than being sold on a ‘gross’ basis to a central market. This concept may increasingly come under threat as the volume of DG grows at the expense of transmission-connected generation plant.
5.5 Regulatory and Commercial Implications of the 2020 Scenarios Each adopted scenario has a number of features and a differing demand and capacity balance, potentially requiring enhanced or changed responses from the various participants. It should be noted however that each of the scenarios still assumes a regulatory structure that is ‘liberalised’, or in the case of the Environmental Awakening ‘largely liberalised with some environmental intervention’, and as such may not be compatible with the new ambitious renewable and energy efficiency targets that the EU require the UK to meet, (relying purely on incentives may not deliver the magnitude step change required over the next decade or so). Although Ofgem will not commence work on the five year 2010 Distribution Price Control Review until 2008, it has recently requested views on the general approach and key issues for the review, with the intention of undertaking some preparatory tasks this year. Not surprisingly Ofgem expects DG, and issues associated with it, to feature heavily. Its objectives flow from its statutory duties, which in themselves, may be broadened to suit wider Government energy policy and environmental objectives. However, Ofgem still expects to achieve these objectives through incentive regulation, possibly modified to include consideration of environmental costs associated with carbon emissions. The interface, ownership and operation of transmission and distribution networks with larger amounts of DG are also signalled by Ofgem as a subject for potential review. Others are calling for a similar review to examine the distinction between the functional and licence requirements of 'supply' and 'distribution', in the circumstances where power and ancillary and balancing services, may be increasingly generated (and consumed) at a local level, and traded at grid or regional interfaces. In more detail, and as reported in the recent Energy Review, Ofgem is expected to focus more on scenarios that could arise as a consequence of Government policy and market development including, for example, a significant shift in the UK fuel mix and the associated integration of renewable generation capacity with intermittent or variable output. The scenario analysis is to focus on medium and long term timeframes, 2025 – 2050. It is also intended to look at the drivers of future energy demand and potential changes to the supply side. On the demand side, key issues will include the growth in demand for energy services, the scope for energy 18 This area is currently being examined by an industry working group, chaired by Ofgem, with the expectation of joint DTI/Ofgem consultation later in 2007.
30

efficiency, technological and social trends and the requirements to meet carbon emissions limits. On the supply and generation side, key areas for consideration will include the different fuels and technology types likely to proliferate, fuel security and the development of a viable decentralised system (including micro generation) alongside today’s predominately centralised system. DNOs are also increasingly engaging in the debate over the future and direction of the industry in an increasingly carbon constrained environment. One of the fundamental questions is whether to adapt and plan for this future on a piecemeal basis, or to anticipate it and take significant steps (ahead of time) to ensure networks are optimally fit for purpose when they need to be. An increase in distributed generation would require distribution networks to become more actively managed and implies a substantial investment in networks. This leads to the prospect of redundancy and stranded investments in otherwise long-lived assets in the event that DG does not take off. Investing for anticipated changes in generation could be inefficient. It is also argued that is a difficult issue to address, in comparison to other international networks, given the functional and financial unbundling that has been a key feature of the liberalisation the UK energy networks, and the periodic 5 year review. It is increasingly argued that some of the traditional 'economics-based' network investment criteria (discounted case flow etc.) will not support the development and application of suitable technologies unless there is a way of 'costing' more of the values that future network architectures are attempting to address. A more flexible price control mechanism has recently been introduced for regulating NGC, and the Government highlighted this as a possibility for DG in the recent Energy White Paper. Ofgem has acknowledged that it also needs to review its criteria for better integration of capital and operational expenditure, as currently the price controls favour spending more on ‘wires’ and less on network solutions that might avoid capital investment. Renewable DG (e.g. on-shore wind, biomass) are, by their nature regional resources favouring certain areas of the UK, and the impact of all of these scenarios will therefore not be felt uniformly across the DNOs. It will therefore be difficult for the regulator to compare companies’ expenditure when faced with a price control decision. In addition, a rapid uptake of DG up to 2020, under the current five year price control period, may inhibit innovation, in scenarios where change is acute, as DNOs faced with the current distribution price control settlement will seek to accommodate the ‘unforeseen’ DG by individual least cost capital expenditure rather than optimising connection in a way which anticipates evolving future connection. The individual DNOs may be uncomfortable about seeking to ‘reopen’ the price control decision, as it may introduce regulatory uncertainty and draw focus on other areas, and thus threaten investor confidence across the business. DNOs however, may well be concerned by the prospect of effectively ‘rolling’ annual price controls and micro management by the Regulator, and may care for a longer price control in order to develop long-term optimal network solutions. In terms of
31

technology commercialisation routes, investment will be forthcoming provided that the risks are assessable and can be managed. This in turn requires regulatory uncertainty to be as low as possible, as the technology risks are reasonably high. Ofgem statutory duty relating to sustainability and the environment may well be further revised by Government given the urgency in tackling climate change. A number of parties are also increasingly calling for a ‘heat obligation’ to be put in place in preference to power only plant in order to encourage the construction and operation of combined heat and power schemes, and local community heat and power deliver in preference to individual householder schemes. It is not clear however on which party that obligation might be placed.
5.6 Conclusions
5.6.1 Functional & Operational Review
Ofgem should consider reviewing the functional and licensed roles of supply, distribution and transmission under a low carbon, high DG future. This should extend to examine the licence restriction on DNOs owning and operating generation and storage, and the respective roles of the distributor and supplier in relation to commercial treatment of demand side management and storage. Such a review should also look at the ability of DG to offer, deliver and trade ancillary services on a local and regional basis to DNO, as an alternative to the GB SO providing these via transmission connected generation.
5.6.2 Price Controls
In future, consideration should be given to introducing more flexibility into distribution business price controls, (similar to recent approach taken to the NG price control) to allow for rapid unforeseen expenditure caused by DG, and specify treatment of stranded assets in the event that DG does not take off in particular areas, where investment has occurred ahead of need. The balance between OPEX and CAPEX should be critically examined, in order to ensure that the practice of Active Networks Management is not unreasonably restrained.
The DG connection incentive should be revisited to cater for the ability to plan on a holistic basis, in order to properly consider multiple generator applications optimally.
5.6.3 Trading Systems
In the circumstances where there maybe a large volume of connected micro generation (Power to the People) the efficiency and ‘robustness’ of the electricity trading system and ‘Supplier Hub’ needs to be critically examined, focusing on the relationship between suppliers and distributors and the potential introduction of regional balancing markets as an alternative mechanism.
32

6. NETWORK ARCHITECTURE FOR 2020
6.1 Introduction This section describes the vision for 2020 network architecture based on the three scenarios discussed in Chapter 2 of this report.
• Continuing Prosperity
• Environmental Awakening
• Power to the People Functionality and network behaviour common across all of the scenarios are identified based on the integration of the distributed generation by adapting existing network design. This is followed up by a Greenfield approach has then been taken to enable the consideration of network architecture without the constraints of the existing infrastructure and perhaps develop a more radical vision of future distribution networks.
6.2 Flexibility for the Future One of the key aims in determining network architecture for 2020 is that it must be flexible enough to accommodate a range of scenarios to avoid stifling future generation plans or investment in the wrong areas. To quote two of the “Technical Architecture – The Way Forward” Report19 ‘Ground Rules’:
• “Network development must be ADAPTIVE, recognising a considerable bandwidth of UNCERTAINTY”
• “Uncertainty will be ongoing, future-proofing has to be part of design”
The three scenarios considered each have an increasing amount of distributed generation connected; with the Power to the People scenario being the most onerous. The network architecture could be developed in stages, adapting as the amount of generation increases.
19 Technical Architecture – The Way Ahead, 2005, on behalf of the IEE Power Systems and Equipment Professional Network
33

6.3 Continuing Prosperity Scenario This scenario can be considered as the “low” case for distributed generation. Load growth is also highest in this scenario and likely to be as much of a driver for network change as generation. For example increased levels of cooling load could change seasonal and daily load profiles. There is an estimated 3.5GW of asynchronous and inverter fed generation connected at HV and 2GW at MV. This is assumed to be predominately onshore wind generation connected in rural areas where the network issues are geographic specific and likely to be voltage or thermal restrictions. The 6GW of uncontrolled synchronous generation connected in total across the MV and HV networks in this scenario is assumed to be small to medium CHP such as a community heating scheme in an urban area or biomass plant located on the outskirts of an urban or suburban area. For this type of generation the restriction is likely to be the short circuit fault level on the 11kV and 33kV networks as discussed in Section 3.4.3. In particular networks with inherently higher fault levels such as interconnected networks and networks with direct 132/11kV transformation are likely to require fault level management. The 3GW of inverter fed uncontrolled generation connected at LV is assumed to be domestic micro generation. If evenly distributed this level of micro generation could be accommodated with no significant change to the network. The predicted increase in demand on the network could also create thermal overloads, especially on networks with no or low levels of generation, which will need to be managed. Distribution network issues such as thermal overloads, voltage control and short circuit fault levels are likely to be localised due to clustering of distributed generation or historical network design practices. The underlying topology of the network will not be required to change significantly from existing network design, however active network management will be employed to enable existing network capacity to be utilised more efficiently. Figure 6-1 illustrates how this scenario may look with the following functionality:
• Active voltage control may be necessary in rural areas with high levels of DG connected, using the generator in active and reactive power mode to optimise the network voltage and prevent voltage rise
• The increase in load growth will reduce the risk of reverse power flows although there could be local issues requiring replacement of tap changers on older transformers and modifications to existing AVC schemes
• Intelligent condition monitoring, improved and dynamic equipment ratings will improve existing network utilisation, enabling more generation and load to be connected without thermal overload
34

• Growth in demand is high in this scenario. Energy efficiency and demand side management is likely to be to be encouraged to avoid load related network reinforcement. Storage may also be employed to reduce peak demands
• Active monitoring of fault levels and automatic network reconfiguration will be required in urban areas with high levels of distributed generation. Fault current limiters may also be required
• Network reliability and reduced restoration times will also be important design drivers as customers expect higher levels of network performance. Remote control and network automation schemes will be increasingly employed to reduce CIs and CMLs
• Improved network information systems will be required in order to understand and control network behaviour. This will require increased use of measuring devices and sensors on the network
35
Figure 6-1 Continuing Prosperity Scenario
33kV
11kV
36

6.4 Environmental Awakening Scenario This scenario sees an increase in the amount of DG connected, the majority of which will be from renewables and can be considered as a “medium” case for distributed generation. There is an increase of around 31% and 47% in the level of asynchronous and inverter fed DG connected at HV and MV respectively from the amounts assumed in the Continuing Prosperity scenario. The level of uncontrolled synchronous DG connected at MV and HV also increases by around 30%. At the low voltage level the amount of micro generation doubles to 6GW (approximately 20% penetration). Distribution network issues such as thermal overloads, voltage control and short circuit fault levels are still likely to be localised but more frequent implementation of network solutions is anticipated. Customer energy efficiency measures result in lower load growth and the reduction in large synchronised generation connected to the transmission systems suggest there could be a requirement for decentralised load balancing on a local basis using demand side management and storage devices to match demand to generation output. These would act a virtual power plant (VPP) by aggregating load and generation within a local area or community. Active network management will be increasingly employed to enable existing network capacity to be utilised more efficiently and there is also the possibility of several active solutions interacting for example active fault level management and dynamic ratings required on the same network. The LV network will start to become more active in this scenario as the level of micro generation is increased. Figure 6-2 illustrates how this scenario will look with the following functionality:
• Active voltage control, particularly in rural areas with high levels of DG connected, using the generator in active and reactive power mode to optimise the network voltage and prevent voltage rise
• Voltage control on LV networks with higher penetrations of micro generation will be needed to maintain customer terminal voltage within statutory limits and prevent high volts from activating the ER G83 over voltage protection
• The high levels of DG will increase the likelihood of reverse power flows requiring tap changers on older transformers to be replaced and modifications to existing AVC schemes
• Intelligent condition monitoring, improved and dynamic equipment ratings will improve existing network utilisation, enabling more generation to be connected without thermal overload
37

• Demand growth is lower in this scenario as energy efficiency measures are already having an impact. Demand management and storage may be required to smooth the variable output from renewable generation
• There may be localised requirements for controllable reactive power to improve poor power factors caused by the kW output only from generators
• Active monitoring of fault levels and automatic network reconfiguration will be required in urban areas with high levels of distributed generation
• Network reliability and reduced restoration times will also be important design drivers although customers may be more accepting of interruptions in return for ‘greener’ energy
• Improved network information systems will be required in order to understand and control network behaviour
38

Figure 6-2 Environmental Awakening Scenario
33kV
11kV
39

6.5 Power to the People Scenario This scenario was developed to test the LV network. At 12GW (approximately 40% penetration), this scenario has the highest penetration of micro generation connected at LV and can be considered as a “high” case for distributed generation although the levels of DG connected at MV and HV are very similar to the Continuing Prosperity scenario. Since LV networks currently have zero intelligence this is the network likely to see the most change under this scenario. The HV and MV networks will require similar functionality to the Continuing Prosperity Scenario however there will be more interaction between the MV and LV network as export from the micro generation will impact on MV power flows. Figure 6.3 illustrates how the power to the people scenario might look. There are three potential deployment modes20 for the micro generation:
• Plug & Play where the customer owns the generation and operates autonomously based on the individual household requirements
• Company Control where an energy supplier owns the generation and provides system balancing services
• Community Microgrid where a community energy company operating on a private wire network looks to balance the local network
The network functionality will need to be able to cope with all or a combination of these deployment modes. The following is likely to be required:
• Local LV voltage control to prevent voltage rise and the subsequent tripping of micro generation due to high volts protection. This could be achieved in a number of different ways including:
- Controlling the voltage at the 400V terminals of the 11/0.4kV transformer – this has the advantage of being simple to apply and relatively cheap
- Controlling the voltage part way along the LV feeder
- Controlling the voltage at the customer terminals – this has the advantage of potentially enabling the DNO to run the LV network at a higher voltage to increase the feeding distance and reduce losses. It could also enable voltage reduction within the domestic premises to reduce demand
20 Economic Analysis of Micro-generation Deployment Models, SPRU et al, Sustainable Technologies Programme
40

• Real time communication will be required to enable DNOs to obtain network data for planning and operational purposes
• Data from smart meters will need to be communicated to the distribution company for network analysis applications. The most likely communication will be to connect the smart meters to broadband and send the data to a central server from which the distribution company could extract the required data
In this scenario, customer generation and demand play an active role in balancing the local network. This will require the following functionality within the customer’s home or commercial premises:
• Smart metering to receive real time price signals and provide the customer with information about energy usage
• Home Control Unit (HCU) would control the overall demand of the house by optimising the generation, electricity storage and demand within the house, based on user preference and current energy tariffs
• Intelligent white goods to provide demand side management services such as responsive load21 which uses the system frequency signal to control demand, and using wireless networks to control the scheduling of non time critical activities22 based on price signals
• Electronic appliances with integral energy storage that can be used to balance the network during periods of low output from the micro generation
21 http://www.rltec.com/ 22 http://dr.berkeley.edu/REM/index.htm
41

Figure 6-3 Power to the People Scenario
Home controller
Solar thermal
Ground source heating Power Store with voltage regulator
Domestic load
Micro wind
Micro CHP
Price Signals to Smart Metering
42

6.6 2020 Functional Requirements
6.6.1 Network Functionality The 2020 functional requirements identified for each scenario are summarised in Table 6-1 below:
Table 6-1 2020 Functional Requirements
Functional Requirements Continuing Prosperity
Environmental Awakening
Power to the People
LV Voltage Control L M H
Integrated Generator AVC M H M
Reverse Power Capability M H H
Optimise Network Capacity M H M
Constraint Management M H H
Demand Side Management M M H
Fault Level Management M H L
Network Restoration H M M
The degree to which solutions are implemented is expected to be: H = High, M = Medium, L = Low
6.6.2 Common Functionality There is common functionality across the scenarios. All scenarios could result in localised voltage, capacity and short circuit fault level issues. The difference between the scenarios is the degree to which solutions are implemented and rolled out across the network. It is therefore possible to focus on technology developments and the functionality requirements to resolve particular network issues rather than on individual scenarios. This will provide the flexibility to accommodate a range of DG scenarios. It is likely that some DNOs may need to adopt more radical solutions and new network architectures earlier than other DNOs, due to the clustering of DG or historical network design practices.
43

6.6.3 SCADA Functionality The requirements for the level of SCADA functionality may be considered as follows, Levels of SCADA Functionality (SCADA);
1. Binary indication from a fault passage indicator 2. Power measurements, switchgear status, alarms 3. Power measurements, switchgear control, alarms 4. Local coordination of multiple sites from the substation control system
(SCS), power measurements, switchgear control, alarms (intelligent network controller)
The functionality required from the network management systems will increase directly with the number of active nodes. These nodes may have real time data telemetry, delayed telemetry from smart metering or estimated values from modelling of the node. SCADA functionality requirements can therefore be expressed as a function of the impact of the DG on the network and the type of DG such that:
f (SCADA) = f (DG Impact) + f (DG Type) The impact of the DG on network (DG Impact) can be categorised as follows:
1. No significant impact on network when generator(s) is on or off 2. Low impact on network when generator(s) is on or off. Localised voltage
rise on the network, no possibility of reverse power flow 3. Medium impact on network when generator(s) is on or off. Feeder voltage
rise on the network, intermittent reverse power flow 4. Large impact on network when generator(s) is on or off. Feeder voltage
rise on the network, continuous reverse power flow possible The type of distributed generation (DG Type) can be categorised as follows:
1. Domestic micro generation 2. Small scale CHP power plants (<100 houses) 3. Large scale CHP power plant (>100 houses / industrial user)
4. Small to medium scale distributed generation that does not use electricity for own consumption. (Wind farm, biomass)
5. Large scale distributed generation that does not use electricity for own consumption. (Wind farm, biomass)
44

This may be represented in Table 6-2 as follows:
Table 6-2 SCADA Functionality Requirements
DG Impact SCADA Functionality
4 4 4 4 4 4
3 2 3 3 4 4
2 2 2 3 3 4
1 1 2 2 2 3
DG Type 1 2 3 4 5 For example, a small to medium scale distributed generation such as a wind farm with medium impact on the network, that is voltage regulation issues caused by more than one generator connected in the same locality, would require SCADA functionality to enable local coordination of multiple sites from the substation control system. This would need an intelligent network controller to acquire power measurements, remote control of switchgear and alarms and indication.
45

6.7 ”Greenfield Approach” As an alternative to modifying or adapting existing networks to meet the 2020 scenarios, a “Greenfield Approach” has been considered in which the principal elements of future network architecture would be:
• Power network topology
• Power network design principles and functionality
• Network control
• Electricity Market and Trading These elements are presented in Figure 6-4. The requirement for islanded operation is considered unlikely, except in remote areas under severe weather conditions, and so is not considered further.
6.7.1 Power network topology The left hand side of Figure 6-4 presents the power network topology (in black). Only three distribution voltages are considered, 132kV, 20kV (the preferred Medium Voltage (MV) level in Continental Europe and used in the rural networks in Northumbria) and Low voltage (LV). In the diagram an underground cable network supplying an urban area is shown but the principles for an overhead network would be similar. A 132/11kV/LV network, many of which exist at present, would be similar but with more primary substations and less MV network capacity. The adoption of a single voltage level between 132kV and LV has the advantage of eliminating a transformation level with corresponding reductions in capital and operating costs (losses) compared with the corresponding “Greenfield” 132/33/11kV/LV network typical of present practice. The reduction in losses alone would enhance “low carbon” credentials noting that in Distribution Price Control Review 4 (DPCR4) the losses incentive rate of £48/MWh (in 2004/5 prices) includes an allowance for the environmental cost of losses.23
The disadvantage of longer rural circuits at 20kV leading to poorer network reliability performance, as measured by customer interruptions and customer minutes lost. Although network automation and sectionalising can improve this. In urban areas with high load densities the use of 20kV has the advantage of reducing cable congestion and a high reliability of supply can be achieved using increased protection and automation.
23 Ofgem; Electricity Distribution Price Control Review; Initial Proposals; June 2004
46

Figure 6-4 Greenfield Approach – Future Network Architecture
47

Nevertheless we would consider a widespread conversion to 20kV in the horizon to 2020 as unlikely, partly for reasons stated in the next section where we examine the ability of existing networks to accept the increasing amounts of distributed generation in the scenarios and also because over the same time frame our asset replacement modelling for DPCR4 indicates that only about 14 per cent of the distribution network, by replacement cost, would be due for replacement due to age/condition considerations alone24. Such replacement would in any case be expected to be spread over a network and not concentrated as might otherwise justify the upgrading of an MV network en bloc. The only other drivers to adopt 20kV at presently under consideration in Great Britain and of which we are aware are load growth and the level of demand in high density central business district areas i.e. London.
6.7.2 Power Network Design Principles and Functionality Design principles for of the power network would include:
• high short circuit capacities, by design
• No tapering of radial circuits
• provision of increased capacity on LV networks (i.e. low network impedances) to accept (inter alia) single phase connected micro generation
• enhanced protection, including more unit protection, to accommodate bi-directional flow of power
• full remote control of, and indication from, all switching devices (including, say, the ring (circuit) switches in a ring main unit), thereby providing a connectivity model for distributed generation and enabling the identification of any network islanding, for example
• optical fibres integrated in cables and overhead line conductors at all voltage levels and including service connections, for communications purposes (surplus bandwidth could be rented out to non-regulated business for example, Broadband)
Voltage unbalance due the connection of single phase micro generation could limit the amount of such micro generation that could be connected to LV networks as discussed in section 3.3.2.1 of this report. Consideration therefore needs to be given to the following mitigating measures:
• network reinforcement (distribution transformers & feeders) to reduce the network impedance to a level where the voltage unbalance due single phase connected micro generation is within limit; given the scale of the micro
24 As a matter of record, in Distribution Price Control Review 3 (undertaken in 1998/9 for the period 2000/2005) one particular DNO proposed a major rebuild of its network at 132/11kV in order to achieve a significant improvement in reliability performance by 2020. Ofgem rejected this approach on the grounds that the assets did not need to be replaced at that time.
48

generation envisaged in the scenarios, such network reinforcement could be a major cost item
• altering connections (the quantities and inconvenience would be adverse factors; adopting three phase connections instead for micro generation may have safety implications in domestic properties)
• phase balancers (Steinmetz principle - expensive and used mainly on single phase ac traction supplies generally connected at sub-transmission or transmission level)
• power quality monitoring (essential in order for DNO to control network)
• The relaxation of planning and operating standards to allow short duration excursions outside ER P29 limits should also be considered.
The power network functionality that may be required to accept the additional distributed generation envisaged, much of it being micro generation connected at LV, is shown in red on Figure 6-4 and comprises:
• “intelligent” automatic voltage control (AVC) of transformer tap changers
• (superconducting) fault current limiter (FCL)
• fault level monitoring (FLM)25
• dynamic thermal rating of overhead line conductors and underground cables to take account of ambient conditions
• on-load tap changers (OLTC) on distribution transformers
• voltage regulators on MV and LV circuits
• power quality monitors on MV and LV circuits, particularly for identifying limits (voltage, unbalance, harmonics) being approached as distributed generation is increased
• energy storage (battery/fuel cell/flywheel)
• smart meters (Automatic Meter Management (AMM) with two-way communication between the meter and the supplier, including remote meter reading and indication to the customer of spot prices)
• home control units (control of domestic loads according to electricity spot prices)
The requirement for storage within MV and LV networks will depend on the economics of such storage, the existence of network constraints (the benefits of
25 Williamson, G.E.; Jenkins, N.; Cornfield, G.C.; Use of naturally occurring system disturbances to estimate the fault current contribution of induction motors, Generation, Transmission and Distribution, IEE Proceedings - Volume 143, Issue 3, May 1996 Page(s):243 - 248
49

storage are greater on weak networks) and the market for such stored energy including system balancing power requirements. The extent to which this functionality would be required for the Greenfield 132/20kV/LV network would need to be determined by modelling of the network.
6.7.3 Network Control
6.7.3.1 VPP Concept The principal driver for providing a future architecture for network control is the volume of distributed generation to be connected to the distribution network, particularly as the output of much of this generation would be variable, as it would comprise a large quantity of very small generating units connected at LV. Furthermore the variable output would be driven to a large extent by heat requirements (DCHP) and weather (solar, wind) and not by demand as with conventional generation. We would assume that micro generation, for example, would be self dispatched unless subject to constraints. A DNO would have to actively manage its distribution network with increasing levels of (variable) distributed generation, the tasks of Active Network Management (ANM) comprising:
• power flow management
• voltage control
• fault level management
• demand side management (DSM) The GB System Operator (GB SO) would similarly have to manage the transmission network to operate the Balancing Mechanism to control system frequency with increasing levels of (variable) distributed generation. The Virtual Power Plant (VPP) concept is aimed at making distributed generation manageable from the viewpoint of the system operator. The VPP is being developed to aggregate the on-line signals from the distributed generation and controllable loads and to present these signals as if they were from large scale power plants and the VPP acted accordingly26. In the architecture proposed by the FENIX project, a VPP would perform two activities, a Commercial VPP (CVPP) and a Technical VPP (TVPP). The meter data, from smart meters, would be shared between the two activities. The Technical VPP function would be locational, covering voltage and power flow control and hence would be performed by the DNO. The balancing mechanism and frequency control function would be performed by the GB SO.
26 Bel I., Valenti A., Maire J., Corera J.M., Lang P., Innovative Operation with Aggregated Distributed Generation, CIRED 2007, Paper 0461.
50

6.7.3.2 LV networks Figure 6-4 shows, in green, metered data being transmitted to a local data concentrator cum control unit located at a secondary MV/LV substation. Other signals would be transmitted from the power quality monitors and switchgear on the LV network. Voltage control devices such as transformer on-load tap changers, LV voltage regulators, and power factor correcting capacitors (not shown) would also be controlled. As far as possible control functions would be local and automatic. Issues to be resolved are:
• the refresh rate or polling rate for the smart metering (at least every settlement period (half hour)) and hence the bandwidth required for the communications system
• communications medium (optical fibre/GSM/GPRS/power line carrier/low power radio/Internet – power line carrier and GPRS are the preferred media in Italy and France)27
• separate metering of distributed generation and load at customer’s premises
• relationship of data protocols to IEC 61850, presently arranged for substation control (the scope of IEC 61850 is presently being extended)
• need for aggregator to transmit to DNO and thence to GB SO on-line signals of generation output by type of generation in view of different characteristics of DCHP, solar and wind generation so that the GB SO can model the respective outputs on-line and/or
• treat DG outputs/customer demands on a statistical (profile) basis and correlated with various parameters (weather, prices)
6.7.3.3 Primary Distribution / Sub-transmission Figure 6-4 shows the VPP aggregation at the primary substation level with data shared between the TVPP and CVPP. Much of the control of the existing primary network would already be undertaken by the existing SCADA and network Management System (NMS). Similarly it is to be expected that distributed generation connected at the primary level would have half-hourly (HH) metering but nevertheless would be suitable to be aggregated by a VPP. Issues to be resolved are:
• relationship of ANM to existing SCADA and Network Management Systems (NMS)
• requirements for optimal power flow software and state estimation at NMS level
• path for on-line information on output of distributed generation to the GB SO
27 Global System for Mobile communications (GSM), General Packet Radio System (GPRS)
51

6.7.4 Electricity Market and Trading Figure 6-4 shows, in blue, the CVPP acting as a market operator and participating in the BETTA market (Forward/futures contract market, Short term bilateral market (exchange), Balancing Mechanism, Imbalance Settlement) as a Balancing Settlement Code (BSC) party. The CVPP would also offer ancillary services (mainly frequency control) to the GB SO. Signalling of spot market prices would be sent in turn to the customers with distributed generation and/or controllable loads. Issues to be resolved are:
• obligation of a distributed generator to join a CVPP, in view of a report that there may be insufficient Distributed Energy to attract aggregators and transitional arrangements might be required until this situation changed28
• licensing of CVPP (would this differ from an aggregator/broker today?)
• risks to CVPP on imbalances particularly in view of variability of the output of distributed generation (risks for distributed generation following introduction of NETA in 2001)
• use of generation/time profiles by CVPP for bidding purposes, assuming knowledge of distributed generation mix (DCHP, solar)
• cost of setting up CVPP IT systems
• compliance with BSC particularly regarding smart metering (data quality issues)
• Balancing Services charges
• refresh/polling times of smart metering and communications bandwidth/medium required
• scope for provision of ancillary services, noting present de minimis limits29
6.8 Conclusions Although a “Greenfield Approach” 132/20kV/LV network configuration would have advantages of capacity over existing configurations, including lower losses and therefore “carbon footprint”, asset replacement requirements to 2020 are unlikely to be a strong driver to support such a change. A number of new devices for enhancing existing networks are either available now or shortly will be and can be applied to existing network topologies to meet the requirements up to 2020. The requirement for storage within MV (20 or 11kV) and LV networks however will depend on the economics of such storage, the existence of network constraints and the market for stored energy including system balancing power requirements. 28 Ofgem; Distributed Energy Working Group, 30 May 2007 29 Grid Code CC.8, Ancillary Services and NGET Seven Year Statement 2007, Chapter 4, Ancillary Services
52

The principal driver for providing a future architecture for network control is the volume of distributed generation to be connected to the distribution network. Where micro generation is to be installed the key network architecture device is the smart meter with two-way communications and arranged for AMM. Data aggregation would be required, possibly in the form of the Virtual Power Plant (VPP) concept (from the FENIX project) with the VPP performing two activities, commercial and technical (power flow management, voltage control and at the system operator level, the power balancing and frequency control function). Key issues to be resolved include:
• quantities of smart meters and programme for installation
• communications requirements and medium
• sharing of meter data between Technical VPP (distribution business) and Commercial VPP (supply business) functions
• on-line aggregated meter data to GB SO for Balancing Mechanism purposes and/or treatment of micro generation outputs/customer demands on a statistical (profile) basis and correlated with various parameters (weather, prices)
• relationship of ANM to SCADA/NMS
• Grid Code/Distribution Code changes o frequency control (Balancing Mechanism) to accommodate
increasing levels of distributed generation o Distribution Code – generation planning standard proposal o LV voltage unbalance – capacity to accept single phase
connected micro generation o relaxation of planning standards (we would discount a stochastic
approach as in BS EN50160) and o Constraints (interruption contracts and/or LOLE type guarantee)
The Commercial VPP would act as a market operator and participate in the BETTA market as a BSC party. The Commercial VPP would also offer ancillary services to the GB SO. At the same time signals of spot prices would be sent to customers with distributed generation and/or controllable loads. The minimum time period for data refreshing would be a Settlement period. Key issues to be resolved include:
• obligation of a distributed generator to join a VPP
• requirements of a Commercial VPP to be a BSC party
• cost of setting up Commercial VPP IT systems
• scope for provision of ancillary services by VPP
53
Further work should address the:
• capacities and limitations of LV networks to accept increasing amounts of single phase connected micro generation
• enhanced protection to accommodate bi-directional power flows, particularly to avoid false tripping and blinding of protection due to distributed generation
• requirements of smart meter installations where micro generation is installed – issue of separate metering of generation and load
• communications requirements and medium, particularly to meet the requirements of micro-generation
• VPP concept, interface between Commercial and Technical VPP functions
• requirements of Commercial VPP to be a BSC party; ancillary services
• DNO and GB SO interfaces
• feedback of results of DTI trial of smart meters as well as the workings of DTI (now Department for Business, Enterprise and Regulatory Reform) Metering Interoperability Working Group, Ofgem Industry Metering Advisory Group and other metering groups working in parallel
54

7. INDICATIVE COSTS
7.1 Introduction The indicative costs of the future network architectures applying specific technical solutions (in particular more advanced voltage control) to existing networks have been estimated for the three scenarios in Table 2-2, Capacity Installed at Each Voltage Level (GW), and for the functional requirements summarised in Table 5-1, 2020 Functional Requirements. The basis for the estimates of indicative costs is a report prepared by PB Power for DTI in which the costs per MW of additional distributed generation were derived from modelling of networks. The model considered increasing the level of distributed generation until a limitation (reverse power on transformer tap changers, voltage rise outside statutory limits) was identified, costed and the resulting increase in distributed generation quantified. The costs per MW of additional generation were then applied to the gross amounts of additional distribution to obtain overall costs. The costs so obtained are in essence costs of reinforcing the existing network infrastructure. In addition to these costs derived from the model, estimates of costs for demand side participation (smart metering) and fault level management have been provided.
7.2 Reverse Power/Voltage Limitations
7.2.1 PB Report for the DTI on Network Voltage Change and Reverse Power The costs of measures to overcome reverse power and voltage limitations have been estimated by applying the findings of the PB report to the DTI entitled “Future Energy Solutions, Network Voltage Change and Reverse Power Flow with Distributed Generation – Final Report, Report No. 62115A/1, Final Rev3, dated April 2005”. That report considered three models of generic networks (rural, urban and meshed, each 400/132/33/11 kV/LV), applied increased distributed generation at each distribution voltage level, identified export limits, applied a remedial measure to resolve the condition determining the limit and so derived an average capital cost per MW for the additional generation that may be accepted. Each of the model networks was considered to have a demand of the order of 200MW. The inability of (some) transformer tap changers to accept reverse power flow was identified as the first limiting condition except for two cases where the LV statutory voltage limit was the constraint. Alternate cases were considered:
• Case 1, where the remedial measures are replacement of automatic voltage control schemes (AVC)
• Case 2, where the remedial measures are replacement of on-load tap changers (OLTC) on power transformers and
• Case 3, where voltage control measures within the networks have been considered, including replacing existing distribution transformers with units fitted with on-load tap changers.
55
7.2.2 2020 Scenarios In order to quantify the addition of gross generating capacity by 2020 for each of the three scenarios in this (Future Network Architecture) report, the disaggregated generating capacity as at the end of 2004 (start date for the Network Voltage Change model) has been derived from consideration of statistics published by DTI30 and ENA31. The generation capacity as at the end of 2004 has been disaggregated by voltage level and generation type and by generation technology (wind, biomass, nuclear etc.). The forecast generating capacities for each of the three scenarios for 2020 have similarly been disaggregated and reconciled with the totals in the SuperGen 2020 report. The disaggregation enables the additions of generation to be applied to corresponding average capital costs per MW of additional generation for the rural and urban networks at the respective voltage levels and costs derived accordingly. (Meshed networks have not been considered further for this exercise as they are only a part of one particular DNO’s network). The details of the disaggregation of generation capacity are presented in Appendix D and show:
• Reductions in CHP capacity (in order to balance the capacities at given voltage levels in Table 2-2)
• Most of the additional generation is added at the 132kV level or above (off shore wind and biomass) and at LV (micro-generation)
• Additions at the 33kV and 11kV levels are relatively modest The capital costs as used in the Network Voltage Change report have been further modified to take account of information received since that report was written:
• Adoption of the GenAVC costs for control of 11kV network voltage from a report by Econnect32
• Assuming that 400/132kV and 132/33kV transformers in the model are capable of accepting reverse power and that only half the 33/11kV transformers can do so (i.e. only half the 33/11kV transformers would require replacement of tap changers)
• 11kV/LV distribution transformers would be fitted with an on-load tap changer connected to the existing off-circuit taps33 and would therefore not need to be replaced completely
Table 7-1 presents the costs per MW of additional generation, by measure and voltage level, as derived from the Network Voltage Change report and as further modified as indicated above. 30 DTI; Digest of United Kingdom Energy Statistics (DUKES), 2005 31 Energy Networks Association; Distributed Generation Connection Activity in the Great Britain Distribution Networks 32 Econnect report to DTI: Accommodating Distributed Generation, May 2006 33 Oates C., Barlow A., Levi V., Tap Changer for Distributed Power, CIRED 2007, paper 0420
56

The costs for the 6.6, 11 and 20 kV network in Case 1 are influenced by the assumed cost of the GenAVC voltage control system. Appendix A provides examples of the corresponding costs for the application of GenAVC to two actual 11kV networks.
Table 7-1 Costs per MW of additional generation Network Case 1
AVC Rural
Case 1 AVC
Urban
Case 2 OLTC Rural
Case 2 OLTC Urban
Case 3 Voltage
limit-ations Rural
Case 3 Voltage
limit-ations Urban
General> 2nd Export Limit
(£/MW increase) > = 132 kV Rural 69 81 0 0 0 0 > = 132 kV Urban 69 81 0 0 0 0 > = 132 kV Rural/
Urban 69 81 0 0 0 0
> = 132 kV n/a 69 81 0 0 0 0 33 & 66 kV Rural 586 365 0 0 6,640 19,600 33 & 66 kV Urban 586 365 0 0 6,640 19,600 33 & 66 kV Rural/
Urban 586 365 0 0 6,640 19,600
6.6, 11 & 20kV Rural 92,593 109,375 29,650 35,000 3,450 2,510 6.6, 11 & 20kV Urban 92,593 109,375 29,650 35,000 3,450 2,510 6.6, 11 & 20kV Rural/
Urban 92,593 109,375 29,650 35,000 3,450 2,510
6.6, 11 & 20kV Urban 14,000 LV Rural 68,966 13,333 68,966 13,333 68,966 13,333 LV Urban 68,966 13,333 68,966 13,333 68,966 13,333 LV Rural/
Urban 68,966 13,333 68,966 13,333 68,966 13,333
Table 7-2 presents the calculation of the indicative costs of applying the three Cases to Scenario 1, Continuing Prosperity. Generation has been assumed to be connected to either rural or urban circuits according to technology (e.g. wind power would be connected to rural networks, micro-generation to urban networks and biomass shared between the two i.e. rural/urban in the table). (The network category > = 132 kV refers to changes in conventional generation connected directly to the 275 kV and 400 kV transmission system and hence outside the scope of this report.) A further assumption is that all the distributed generation capacity would be available and no allowance has been made for diversity.
57

Table 7-2 Scenario 1 – Continuing Prosperity
Cost of measures to avoid reverse power and voltages outside limits Network Cumulative
Gross Capacity addition 2004 to 2020
Case 1 AVC
Case 2 OLTC
Case 3 Voltage
Limitations (GW) (£m) (£m) (£m)
> = 132 kV Rural 12.8 0.9 0.0 0.0 > = 132 kV Urban 2.9 0.2 0.0 0.0 > = 132 kV Rural/
Urban 6.9 0.5 0.0 0.0
> = 132 kV n/a 15.3 0.0 0.0 0.0 33 & 66 kV Rural 4.0 2.3 0.0 26.5 33 & 66 kV Urban 2.9 1.0 0.0 56.1 33 & 66 kV Rural/
Urban 2.4 1.2 0.0 32.0
6.6, 11 & 20kV Rural 1.0 94.9 30.4 3.5 6.6, 11 & 20kV Urban 2.9 313.3 100.2 7.2 6.6, 11 & 20kV Rural/
Urban 1.0 99.0 31.7 2.9
6.6, 11 & 20kV Urban 0.0 0.0 0.0 0.0 LV Rural 0.0 0.0 0.0 0.0 LV Urban 2.9 38.2 38.2 38.2 LV Rural/
Urban 0.0 0.0 0.0 0.0
TOTAL 551.5 200.5 166.5 Table 7-3 presents the calculation of the indicative costs of applying the three Cases to Scenario 2, Environmental Awakening.
Table 7-3 Scenario 2 – Environmental Awakening Cost of measures to avoid reverse power and voltages outside limits
Network Cumulative Gross Capacity
addition 2004 to 2020
Case 1 AVC
Case 2 OLTC
Case 3 Voltage
Limitations (GW) (£m) (£m) (£m)
> = 132 kV Rural 17.2 1.2 0.0 0.0 > = 132 kV Urban 5.9 0.5 0.0 0.0 > = 132 kV Rural/
Urban 9.0 0.7 0.0 0.0
> = 132 kV n/a 9.6 0.0 0.0 0.0 33 & 66 kV Rural 5.4 3.1 0.0 35.7 33 & 66 kV Urban 5.9 2.2 0.0 115.9 33 & 66 kV Rural/
Urban 4.5 2.1 0.0 58.8
6.6, 11 & 20kV Rural 1.6 147.7 47.3 5.5 6.6, 11 & 20kV Urban 5.9 646.9 207.0 14.8 6.6, 11 & 20kV Rural/
Urban 2.0 201.7 64.6 6.0
6.6, 11 & 20kV Urban 18.2 18.2 18.2 LV Rural 0.0 0.0 0.0 0.0 LV Urban 5.9 78.9 78.9 78.9 LV Rural/
Urban 0.0 0.0 0.0 0.0
TOTAL 1,103.1 415.9 333.7
58

As with Scenario 1 the costs in Case 1 are influenced by the assumed cost of the GenAVC voltage control system. Furthermore the Scenario 2 costs are higher than Scenario 1 due to the cumulative effect of the doubling of micro-generation connected at low voltage. The costs also include an amount of £18.2 million to overcome a second export limit, a voltage limit at the 6.6, 11 and 20 kV level on the urban network model as identified in the Network Change Report. This particular limit is encountered in Scenario 2 due to the increased level of generation connected at the LV level and hence causing further voltage rise at the HV level and occurs under the condition of minimum system load. The remedial measure applied here would be the introduction of voltage regulators on the HV circuits. Table 7-4 presents the calculation of the indicative costs of applying the three Cases to Scenario 3.
Table 7-4 Scenario 3 – Power to the People Cost of measures to avoid reverse power and voltages outside limits
Network Cumulative Gross Capacity
addition 2004 to 2020
Case 1 AVC
Case 2 OLTC
Case 3 Voltage
Limitations (GW) (£m) (£m) (£m)
> = 132 kV Rural 14.6 1.0 0.0 0.0 > = 132 kV Urban 11.8 1.0 0.0 0.0 > = 132 kV Rural/
Urban 6.9 0.5 0.0 0.0
> = 132 kV n/a 2.8 0.0 0.0 0.0 33 & 66 kV Rural 3.6 2.1 0.0 23.7 33 & 66 kV Urban 11.8 4.3 0.0 230.6 33 & 66 kV Rural/
Urban 2.4 1.2 0.0 31.9
6.6, 11 & 20kV Rural 1.0 94.2 30.2 3.5 6.6, 11 & 20kV Urban 11.8 1,286.6 411.7 29.5 6.6, 11 & 20kV Rural/
Urban 1.0 98.7 31.6 2.9
6.6, 11 & 20kV Urban 108.2 108.2 108.2 LV Rural 0.0 0.0 0.0 0.0 LV Urban 11.8 156.8 156.8 156.8 LV Rural/
Urban 0.0 0.0 0.0 0.0
TOTAL 1,754.4 738.5 587.2
The higher costs of Scenario 3 reflect the accumulation of distributed power at each voltage level as a consequence of the doubling of micro-generation from Scenario 2 to Scenario 3. The costs also include an amount of £108.2 million to overcome the second export voltage limit.
7.2.3 Comments on assumptions In order to derive indicative costs for what is a complex process, the following assumptions have been made:
• models in the Network Voltage Change report are representative of typical rural and urban networks
59

• all distribution transformers have off-circuit taps as per ENA TS 35-1
• networks as modelled are assumed to be homogeneous whereas in practice there would be statistical distribution of circuit utilisations and hence headrooms between loadings and capacities
• only reverse power and voltage control remedial measures have been identified, capacity related measures (such as dynamic circuit rating) have not been costed although could be required
• in Case 1, for transformers stepping down to 132 kV, 66 kV and 33 kV, the reverse power limitation can be corrected by the replacement of the AVC control scheme at relatively low cost
• the allocations of additional generation to network type would be as described
• the average costs per MW of additional generation, derived singly at a given voltage level, can be applied to the cumulative distributed generation for all voltage levels up to and including that voltage level
• the analysis establishes indicative capital costs at 2020 and does not take account of incidence or operating costs, particularly losses and costs of constraints; consideration of incidence alone over the horizon to 2020 may show average costs per MW varying with the level of penetration of distributed generation
• limitations of capacity due to harmonics have not been taken into account although inverter connected generation could contribute to harmonic levels
• limitations of capacity due to voltage unbalance due to single-phase connected micro-generation have not been taken into account
7.3 Optimise Network Capacity As the Network Voltage Change report did not identify network capacity as the first restraint to be overcome, no expenditure for optimising network capacity or employing dynamic rating devices has been included. However, as an indication of the likely costs, the Central Networks scheme to manage the Boston/Skegness 132kV network using dynamic ratings has been calculated to be approximately £3,000 per MW (see Appendix A for more details).
7.4 Constraint Management The Network Voltage Change report did not identify any capital costs associated with constraint management. However, as an indication of the likely costs, the Scottish and Southern Energy network management scheme to be deployed in the Orkney Islands has been calculated to be approximately £13,333 per MW (see Appendix A for more details).
60

7.5 Demand Side Participation (Smart Meters) Smart meters have been included at £100 per meter including communications34. The quantity of meters has been taken to be the capacity of micro-generation added at low voltage, assuming that each micro-generation unit has an average capacity of 1 kWe. We further note that the Energy Retail Association’s Smart Meter Functional Specification requires a four quadrant measuring element, recording kWh import and export separately. We have not however taken further account of the possibility of separate metering of the micro-generators themselves35 which could increase the above cost. The Government’s expectation is that, within the next 10 years, all domestic energy customers will have smart meters with visual displays of real-time information that allow communication between the meter, the energy supplier and the customer is, however, noted36.
7.6 Fault Level Management The Network Voltage Change report identified the headroom between fault level and switchgear interruption capacity at each voltage level but did not examine the effect of adding distributed generation. The smallest headroom margins were identified at the 33 kV and 11 kV levels on urban networks. KEMA has reported that:
• Fault level headroom incursions are most likely to occur with connection of distributed generation to urban 33 kV and 11 kV networks and that the most likely form of distributed generation requiring connection to these networks is small, medium and large CHP, landfill gas and CHP
• For CHP connections at 11kV, 33 kV and 132 kV with a high rate of CHP growth (government targets met) the total cost would be between £10 million and £18 million annually37
As a separate exercise, we estimated the costs of installing superconducting short circuit fault current limiters as bus section reactors in each urban 33 kV and 11 kV substation busbar, on the assumptions that half the power transformers supply urban networks, only urban networks require means of limiting fault levels and that there are typically two transformers per substation (i.e. one short circuit fault current limiter per 33kV or 11kV busbar). Costs of £150,000 per 33kV device and £100,000 per
34 Estimates of costs of smart meters vary. Two noteworthy references are:
Sustainability First report “Smart Meters: Commercial, Policy and Regulatory Drivers”, March 2006 (+/- £120 per meter including communications (either power line carrier (PLC) or low power radio (LPR) which offer lower costs than GSM (system used by mobile phones)) and Commission for Energy Regulation, Ireland, “Demand Side Management & Smart Metering”, Consultation Paper, CER/07/038, 13 March 2007 (EUR 225 per meter)
35 DGCG, TSG, P02a Working Paper One, Metering for Micro Generation, 21 March 2003. 36 Energy White Paper, 2007, section 2.64 37 KEMA Ltd report to DTI, “The Contribution to Distribution Network Fault Levels from the Connection of Distributed Generation”, DG/CG/00027/00/00, URN Number 05/636, May 2005
61

11kV device were assumed based on an indication of the price level at which such devices would be economic. An overall cost of £280 million was obtained. In view of the broad assumptions in deriving this cost, a cost of £10 million per year instead has been included in our estimates, corresponding to £150 million for the horizon from 2004 to 2020. Further work outside the scope of this report is required to derive a closer estimate of the costs of measures to take account of fault levels being exceeded as distributed generation is increased. Such work should principally take account of the cumulative addition of different types of distributed generation particularly their respective contributions to switchgear current making and breaking fault currents and could be undertaken by using the models in the Network Voltage Change report. Further consideration could be given to the increasing effect of penetration of distributed generation38 and to alternative remedial measures (replacement of existing plant versus introduction of busbar connected fault current limiters, for example). Another device for consideration is the fault level monitor concept.
7.7 Protection As the level of distributed generation increases, power flows will tend to be bi-directional. Particular problems which may impact on conventional protection arrangements for (hitherto passive) radial (typically) 11kV networks are:
• false tripping of feeders (unintended tripping when distributed generation feeds an upstream fault (e.g. on an adjacent feeder) and the current exceeds the overcurrent setting on the (healthy) feeder to which the distributed generation is connected
• blinding of protection when distributed generation feeds a downstream fault but, as the fault current seen by the feeder protection is less that the setting, the protection does not operate (protection under-reach) and
• unwanted islanding and subsequent unsynchronised automatic reclosing Enhanced protection measures to accommodate increasing levels of distributed generation may comprise:
• directional overcurrent and earth fault protection
• unit protection, such as high speed (circulating) current differential unit protection using pilots (fibre optic cables)
• distance protection
• intertripping
• additional switchgear (suitably located along radial circuits which have normally open points between adjacent circuits) and/or
38 Tumilty R. M., Roberts D. A., Kinson A. S., Burt G. M., McDonald J.R., A Demonstrator for Active Network Management Devices and Techniques, CIRED 2007, paper 0535.
62

• adaptive measures whereby protection settings and functions are changed according to network configuration and level of penetration of distributed generation
The costs would vary considerably according to network configuration, type of generation (synchronous/asynchronous/inverter fed) and, particularly where pilots are used, circuit length. Costs of protection schemes retro-fitted to existing circuits are likely to be higher than for new installations. Furthermore it is not clear the extent to which such protection costs were included in the assessment by Ofgem of distributed generation capital expenditure in DPCR4 as we note, from a survey of international literature, that the effects of distributed generation on distribution network protection operation may not have been fully appreciated until recently. The requirements of system reliability performance will also be a driver for protection requirements and hence costs. Accordingly we have not included estimates of costs to enhance protection and instead identify enhanced protection as an aspect requiring further study. Clearly protection enhancement could be a major cost item given the scale involved.
7.8 Electricity Market and Trading As stated in the previous section we have included indicative costs for:
• VPP/Aggregator IT system (£100 million) and
• Modifications to existing trading arrangements (£8 million)
7.9 Exclusions The following costs have been excluded from our analysis:
• the estimates of indicative costs exclude the costs of connection (i.e. sole use assets) of distributed generation (smart meters apart); the costs indicated by the DNOs were reviewed for Ofgem as part of DPCR439; average unit costs of £41 to £42 per kW of additional distributed generation were identified for shared asset costs; Ofgem reported a typical overall level of average capital expenditure to connect distributed generation of £82 per kW, including both sole use and shared asset costs over the period 2005 to 201040
• in view of the wide range of connection costs/kW depending on voltage level, length of connection, reinforcement requirements and construction (overhead/underground), we have not allowed for connection costs (sole use assets)
• costs of enhanced protection to accommodate bi-directional power flows resulting from increasing levels of distributed generation
39 Mott MacDonald/British Power International report to Ofgem, DG-BPQ Analysis, Summary of Findings, Final Report, March 2004 40 Ofgem; Electricity Distribution Price Control Review, Final Proposals, November 2004
63

• transmission network costs; only distribution networks have been considered
• cost for network restoration in view of the subjective judgment involved and as network reliability is part of a wider and complex network performance issue
• operating costs of the proposed technical solutions, including losses, have not been considered
• no allowance has been made for the inclusion of storage devices within the distribution networks
• reinforcement of LV networks to accept the voltage unbalance due to single phase connected micro generation and
• no allowance has been made for harmonic filters or phase balancers; power quality monitoring however may to a certain extent be included in the smart meters
The estimates of indicative costs of applying specific technical solutions to existing networks are presented in Table 7-5.
Table 7-5– Estimates of Indicative Costs
Continuing Prosperity 2020
Environmental Awakening 2020
Power to the People 2020
Case 1
Total (£m)
Case 2
(Total) (£m)
Case 3
Total (£m)
Case 1
Total (£m)
Case 2
(Total) (£m)
Case 3
Total (£m)
Case 1
Total (£m)
Case 2
(Total) (£m)
Case 3
Total (£m)
Reverse Power/Voltage limitations
> = 132 kV 1.6 0.0 0.0 2.3 0.0 0.0 2.5 0.0 0.0
33 and 66 kV 4.5 0.0 114.7 7.4 0.0 210.4 7.5 0.0 286.2
6.6, 11 and 20kV 507.1 162.3 13.6 1014.4 337.0 44.5 1587.6 581.6 144.1
LV 38.2 38.2 38.2 78.9 78.9 78.9 156.8 156.8 156.8
Demand Side Participation
(Smart Metering)
286.4 286.4 286.4 591.5 591.5 591.5 1176.3 1176.3 1176.3
Fault Level Management
150.0 150.0 150.0 150.0 150.0 150.0 150.0 150.0 150.0
Electricity Market and Trading - VPP/Aggregator IT System
100.0 100.0 100.0 100.0 100.0 100.0 100.0 100.0 100.0
Electricity Market and Trading - Modifications to existing trading
8.0 8.0 8.0 8.0 8.0 8.0 8.0 8.0 8.0
64

arrangements
Totals 1095.9 744.9 710.9 1952.5 1265.3 1183.2 3188.8 2172.8 2021.5
Gross Capacity addition 2004 to 2010 (GW)
37.9 37.9 37.9 41.7 41.7 41.7 36.0 36.0 36.0
Cost (£) / gross kW DG added
28.9 19.7 18.8 46.8 30.3 28.4 88.6 60.4 56.2
Figure 7-1 presents the trend in cost per gross kW of distributed generation added as a function of the micro-generation capacity connected to the low voltage networks. The trend is that capital costs increase exponentially with the micro generation capacity and, although dominated by smart meter costs, may themselves indicate an eventual limit to that capacity.
Figure 7-1 Increase in capital cost/kW with microgeneration capacity
0
10
20
30
40
50
60
70
80
90
100
0 2 4 6 8 10 12 14
Micro generation capacity 2020 (GW)
Cap
ital c
ost (
£)/g
ross
kW
DG
add
ed
7.10 Conclusions The analysis presented in this section, based on the Network Voltage Change report, indicates that the distributed generation for each of the three scenarios could be accommodated on existing networks with specific technical solutions applied, subject to the caveats stated below. The indicative capital costs of applying network solutions to the three scenarios are in the range of £18.8/kW to £88.6/kW of additional distributed generation, over the
65

period 2005 to 2020. The highest cost is associated with Scenario 3, Power to the People, reflecting the assumed quantity (about 12 million) of smart meters at £100 each. The estimated costs in the table contain some specific large amounts which relate to single calculations and assumptions, namely the:
• 6.6, 11 and 20 kV costs for Case 1 AVC reflect the cost of GenAVC (£175,000 per network)
• smart metering costs reflect both the assumed cost per meter and in particular the quantity of meters installed and
• fault level management costs assumption is common to all cases and scenarios.
The costs per MW increase in generation for the four actual (and mainly formal) RPZ schemes are of the same order as those derived in the Network Voltage Change report and reflect higher costs at the lower voltage levels and vice versa. The costs/kW of distributed generation added (gross) vary accordingly and reflect costs of reinforcement of the infrastructure of existing networks to accommodate the additional distributed generation by 2020. In Scenario 3, Power to the People, these costs (while excluding any connection costs) approach Ofgem’s reported average cost per kW of connecting distributed generation – including both sole-use and shared asset costs. Furthermore the average costs per kW are shown to be rising with increasing levels of distributed generation. It is for consideration therefore whether additional regulatory incentives should be provided in DPCR5 to cover the measures required to accept additional distributed generation. Further refinement of the use of the Network Voltage Change model would usefully include modelling of:
• combinations of generation added by type of network and by voltage level at different dates over the horizon to 2020
• effect of loadings of networks not being homogeneously distributed
• corresponding short circuit levels
• operating costs including losses and hence deriving NPVs of overall cost streams
• consideration of energy outputs and hence derivation of costs per unit of energy
66
8. IMPACT ASSESSMENT
8.1 General The technical implications of connecting increased levels of DG have been discussed at length in previous sections. In addition to these, increased penetration of DG will have an impact on the planning and operation of distribution networks. It is often difficult to determine an accurate gross demand on a network with DG connected due to the lack of network information available on distribution networks and in particular on LV networks. This has an impact on the assessment of network capacity making it difficult to forecast future reinforcement. Better information is required particularly if DG is to be considered as an alternative to network reinforcement. New planning tools such as probabilistic techniques for assessing network capacity, risk and uncertainties of DG and demand in active networks will need to be developed. It is generally accepted that there is a skills shortage with the electricity industry. As the network becomes more active, the operation of the network will become more complex with associated training requirements. These are issues that must be addressed.
8.2 Technical Requirements The technical requirements of planning and operating the electricity networks are stated in the ESQCR and the Grid and Distribution Codes, the latter two documents being licence requirements on the transmission and distribution network operators respectively and govern their relationships with the Users of the respective networks.
8.2.1.1 Grid Code The Grid Code has been progressively revised and recently has incorporated requirements for renewable type generation including reference to “Intermittent Power Source”, “Non-Synchronous Generating Unit”, “Novel Unit” and “Power Park Unit” and the fault ride though capability of Power Parks (comprising asynchronous generation). It is for consideration whether further modification to the Grid Code would be required to accommodate the emergence of CVPPs trading as single units while prospectively representing millions of micro-generators. Particular aspects concern the Balancing Mechanism (Balancing Code) i.e. frequency control and provision of Ancillary Services, noting de minimis limits referred to earlier and under what circumstances a CVPP should be a BM Participant. It is also worth mentioning that there have been reported instances in continental Europe of unscheduled power flows on transmission circuits across country borders exceeding the UCTE “N-1” security criteria under conditions of high wind generation. These instances lead to the question of constraining such generation, how often and the extent to which such generation should be constrained.

We would consider that the process, whereby the Grid Code has been progressively modified over time to adapt to changing circumstances, should be able to meet the general requirements of increasing levels of distributed generation. One aspect that is likely to require attention is the matter of frequency control (balancing mechanism) with increasing quantities of variable output distributed generation as discussed above.
8.2.1.2 Distribution Code The Distribution Code however, although also progressively revised, has been written to meet the requirements of a largely passive distribution network. Connection of distributed generation is covered comprehensively in the Engineering Recommendations G59/1, G75/1 and G83/1, supported by report ETR 12641. However one DNO in particular has proposed that there should be a “generation planning standard” for distribution networks, stating that:
• apart from simple radial systems, it is debatable what is meant by system capacity for complex interconnected systems, as there are numerous criteria (thermal, steady state and transient stability, steady state and transient voltage, fault level etc.) that must be satisfied, any one of which can define the system limit
• without a clear concise generation planning standard that defines limits for these criteria, there is likely to be significant disagreement over system capacities42
We would broadly concur with this view. In the Distribution Code the statement is made that a person who has connected a Generation Set in accordance with ER G83/1 (Small scale embedded generators up to 16A per phase) is not classified as a Generator for the purpose of this Distribution Code. (Distribution Glossary and Definitions (DGD) page 8 of the Distribution Code issue 8 - November 2006.) It would appear that this omission alone might cause problems when the amounts of micro generation start to increase.
8.2.1.3 Planning standards With regard to relaxation of planning and operating standards, the European Technology Platform SmartGrids document “Strategic Research Agenda for Europe’s Electricity Networks for the Future” states, in the introduction to Research Area 1, that “Deterministic approaches based on maximum-minimum conditions are generally far too conservative, unnecessarily limiting larger penetration of DER or underestimating its potential benefits. A stochastic approach is needed.” One such approach is in BS EN 5016043 which states that during each period of one week 95 per cent of the 10 minute rms values of the supply voltage (also supply
41 Energy Networks Association, Engineering Technical Report 126, Guidelines for actively managing voltage levels associated with the connection of a single generation plant, August 2004. 42 United Utilities letter to Ofgem, “Distribution Price Control Review – Policy Document”, section 5.8, 22 April 2004.
68

voltage unbalance and harmonics) shall be within the specified ranges. We would however discount a stochastic approach to voltage limits for the following reasons:
• the limits set in BS EN 50160, whilst followed in other European countries that are CENELEC signatories, are generally outside those in the ESQCR and the Distribution Code and so adopting an EN 50160 approach would imply reducing power quality standards in the United Kingdom and
• ERGEG44 has recently published the findings to its Voltage Quality Regulation consultation in which it has concluded that
o the “95% of time clause” should be avoided and limits should refer to “100% of normal operating conditions” and
o in some countries limits stricter than those in EN 50160 exist and these requirements should be retained as they are beneficial to customers
We would nevertheless recommend that the capacities and limitations of LV networks to accept the levels of single phase connected micro generation envisaged in the scenarios be studied further, including costs of modifying LV networks where necessary.
8.2.1.4 Constraints Probabilistic criteria may however be appropriate when considering constraints on the operation of distributed generation according to availability of network capacity. Two of the RPZs presently in operation enable non-firm capacity to be used to accommodate distributed generation. Two possibilities for regulating constraints are:
• interruptible connection contracts and/or
• a guarantee to a distributed generator based on, say, a Loss of Load Expectation (LOLE)45 type criterion
8.3 2020 Scenarios
8.3.1 Continuing Prosperity It is not envisaged that this scenario will require any forced commercial or regulatory changes not envisaged at present, although going forward there will need to be a commercial clarification of the role of distributor and supplier in responsibilities for carrying out demand side management, and storage activities and in allowing DG to operate as a ‘mirror’ component of this service in supporting the local network.
8.3.2 Environmental Awakening This scenario has implications for the provision of ancillary services by DG, and will no doubt require a trading of these products at a local and national grid interface, as 43 BS EN 50160, Voltage characteristics of electricity supplied by public distribution systems. 44 European Regulators’ Group for Electricity and Gas (ERGEG), Towards Voltage Quality Regulation in Europe – An ERGEG Conclusions Paper, Ref: E07-EQS-15-03, dated 18 July 2007. 45 Loss of Load Expectation (LOLE); days when peak load exceeds capacity.
69

DNOs or others increasingly develop Active Network Management functions. Contract arrangements between generators and DNOs (or others) will need to be developed in order for these and network solutions to work. As active constraints result in more generation being constrained off, there maybe a further need for energy storage to maximise the potential from variable generation such as wind turbines. The continued restriction on DNOs owning and operating generation and storage devices which benefit the network through offering these services may have to be critically examined, alternatively aggregators for such services may emerge as intermediaries. Finally with the explicit possibility of localised island networks occurring, DNOs will need to develop IT, interface and control and management policies to allow these to function safely. In certain circumstances derogation from power quality standards may be required whilst customers are in island mode. The implications for other regulatory incentives and drivers such as Customer Interruption (CI) and Customer Minutes Loss (CML) will also have to be addressed in this scenario.
8.3.3 Power to the People It has been generally accepted that DNOs can absorb in general, a penetration of around 20% of micro generation on domestic properties distributed evenly across existing urban networks without significant problems or significant additional costs. It is difficult to apply a similar generalisation to rural networks, or significant clusters of installations, which will have to be considered on a case-by-case basis. If significant generation is not matched to delivered load, then clearly local export may occur from the LV system, especially if household demand management has occurred. In the longer term the relationship between the supplier and distributor in this situation may need clarifying, and the ability of the trading system to cope with large number of regional trading and balancing markets may need to be addressed. Clearly major unscheduled ‘activity’ on the local network instigated by suppliers, for example automatically responding to national system balancing signals and scheduling all DG on or off, without involving distributors will be unsustainable or will result in potentially unnecessary network investment, if the parties continue to adopt current roles and duties. At the meter, although current functionality allows for data associated with DG operation to flow to the DNO, it is a secondary route via the supplier or data aggregator, and under this scenario it should be a developed into a ‘right’ rather than a secondary function. More fundamentally, and as has already been observed, the current ability of network operators to take advantage or trade ancillary services from this class of generators is absent, and major primary role changes allowing DNOs to carry out this function at a local level may be needed. More work will be required in order to gauge the collective and probabilistic impact of large volumes of DG on diversity calculations that have underpinned network investment decisions in the past in order for this change in the network function to be optimized in the future. This scenario, with 12GW of micro-generation connected as ‘Plug and Play’, and with the lowest contribution from transmission connected generation out of any of the
70

other scenarios, raises the specific role of these devices contributing to system balancing. The description of large numbers of small generators delivering these services is known as Large Scale Virtual Power Plants (LSVPP). This concept is being tested and developed in various international projects, such as the four year EC project FENIX (Flexible Electricity Networks to Integrate the eXpected ‘energy evolution’), involving a consortia of network operators, utilities, research centres and manufacturers.
8.4 Costs The capital costs of enhancing existing power networks are covered in the Section 7 of the report. The dominating costs of future network architectures as presented however are expected to be the costs of:
• smart metering, including communications
• IT systems to support the VPP/aggregator function
• modifications to existing trading arrangements In Table 8-1, the capital costs of smart meters have been included at £100 per meter including communications46 (similar average costs per smart meter are indicated from the San Diego Gas & Electric smart meter project recently announced). The quantity of meters has been taken to be the capacity of micro-generation added at low voltage, assuming that each micro-generation unit has an average capacity of 1 kWe. The costs of IT systems to support the VPP/aggregator function and modifications to existing trading arrangements are more difficult to estimate since these systems are of their nature bespoke. However the costs of the establishment of the New Electricity and Trading Arrangements (NETA) in 2001 (£100 million) and the British Electricity Trading and Transmission Arrangements (BETTA) in 2004 (£8m) are considered to provide indicative costs.
46 Estimates of costs of smart meters vary. Two noteworthy references are: Sustainability First report “Smart Meters: Commercial, Policy and Regulatory Drivers”, March 2006 (+/- £120 per meter including communications (either power line carrier (PLC) or low power radio (LPR) which offer lower costs than GSM (system used by mobile phones)) and Commission for Energy Regulation, Ireland, “Demand Side Management & Smart Metering”, Consultation Paper, CER/07/038, 13 March 2007 (EUR 225 per meter)
71

Table 8-1 Estimates of Indicative Capital Costs of Future Network Architectures
(Excluding power network devices) – 2005 to 2020 (£m)
Scenario Continuing Prosperity
2020
Environmental Awakening
2020
Power to the People 2020
Demand Side Participation (Smart Metering)
286.4 591.5 1176.3
VPP/Aggregator IT system 100 100 100 Modifications to existing trading arrangements
8 8 8
Total 394.4 699.5 1284.3
8.5 Timescales Distribution networks are made up of components with long asset lives and so existing network topology will continue to exist for many years. However, a significant amount of assets were installed during the 1960s and the predicted asset replacement programme resulting from this provides an opportunity between now and 2020 to install both primary and secondary equipment that will better enable the integration of DG, although this challenge is unprecedented under a regulatory regime, which has only small changes in the distribution of power since 1990. Active Network Management (ANM) will enable existing network architecture to be fully utilised rather than the traditional “fit and forget” conservative approach to integrating DG. This will enable more DG to be connected at a reduced capital cost.
72

Figure 8-1, taken from the report “A Technical Review and Assessment of Active Network Management Infrastructures and Practices Areas”12 shows the timeline for the development of ANM.
73

Figure 8-1 Illustration of the process to develop ANM9
The resolution of non-technical issues could result in lengthy consultation periods. For example, DNOs could potentially play a valuable role in both optimising distribution network utilisation (including a reduction in losses) and providing a transmission system balancing ancillary and reserve service through controlling demand and micro-generation. This would require industry wide consultation to agree roles, responsibilities and incentive mechanisms.
8.6 Conclusions Increased penetration of DG will have an impact on the planning and operation of distribution networks as it is often difficult to determine an accurate gross demand on a network with DG connected due to the lack of network information available on distribution networks and in particular on LV networks. It is generally accepted that there is a skills shortage within the electricity industry. As the network becomes more active, the operation of the network will become more complex with an impact on staff training requirements. The technical requirements of planning and operating the electricity networks are stated in the ESQCR and the Grid and Distribution Codes and further consideration should be given to the impact on the aspects of:
• frequency control (Balancing Mechanism) to accommodate increasing levels of distributed generation,
• Distribution Code – generation planning standard proposal,
• relaxation of planning standards (we would discount a stochastic approach with relaxed standards for power quality as in BS EN50160),
74

• constraints (interruptible contracts and/or LOLE type guarantee). The Power to the People Scenario will have the largest impact on both technical and commercial aspects of the distribution network. In the longer term the relationship between the supplier and distributor in this situation may need clarifying, and the ability of the trading system to cope with large numbers of regional trading and balancing markets may need to be addressed. Major unscheduled ‘activity’ on the local network instigated by suppliers, for example, automatically responding to national system balancing signals and scheduling all DG on or off, without involving distributors will be unsustainable or will result in potentially unnecessary network investment, if the parties continue to adopt current roles and duties.
75

APPENDIX A
REVIEW OF EQUIPMENT & SYSTEMS
A1 Voltage Control
A1.1 Current Systems Voltage regulation on distribution networks is currently achieved through on-load tap changers controlled by automatic voltage control (AVC) schemes at each transformation point down to the MV busbars of a primary substation. These AVC schemes will typically maintain the busbar voltage at slightly higher than nominal voltage to allow for voltage drop along the outgoing feeders. The bandwidth and time delay of the voltage control schemes are coordinated with the transformers connected at the voltage level above. The voltage control scheme of a 33/11kV transformer will have a narrow bandwidth and long time delay. This ensures that the 132/33kV transformers have time to correct a system wide voltage change before a local voltage excursion is corrected, avoiding unnecessary tap operation. Similar coordination exists between the 132/33kV transformers and the 400/132kV transformers. In rural areas Line Drop Compensation (LDC) is sometimes used to boost the voltage at the 11kV busbars during periods of high demand by taking into consideration the R/X characteristics of the circuits. MV voltage regulators have been used in a small number of cases to control voltage rise and increase the amount of distributed generation that can be connected to a particular feeder and conversely to boost voltage on long feeders supplying load. MV/0.4kV distribution transformers have off load tappings with a range of +/- 5% in 2.5% steps. These are typically set up so that distribution transformers located at the far end of the feeder have a lower tap setting than those closest to the substation in order to compensate for the increase in voltage drop along the 11kV feeder. In the UK low voltage radial feeders are normally designed to have a maximum volt drop of 7% from the substation busbars to any customer’s terminals. This is based on a transformer voltage ratio of 11kV/433/250V (which allows for a full load busbar voltage of 415/240V) and the requirement to comply with the Electricity Safety, Quality and Continuity Regulations 2002 (ESQCR) which states that the declared voltage at the customer’s terminals must be 230V +10% / -6%.
A1.2 Development Assumptions and Risks There are a number of voltage control schemes currently being developed and trialled on UK distribution systems. Econnect’s GenAVC is being trialled by EDF Energy and United Utilities to optimise network capacity and generation export. The GenAVC system uses state estimation techniques to feedback nodal voltage level at into the substation voltage control scheme to reduce or increase the primary busbar volts accordingly. EDF Energy needed to increase the export on an 11kV network in Sussex by 1.5MW without exceeding voltage limits or without incurring the cost of installing another feeder1. The cost of the GenAVC scheme has been stated at £180,000. On this basis, the average cost per additional MW of generating capacity is £180,000/1.5 = £120,000 per MW
1 Presentations by P. Aston, EDF Energy, and Jonathan Hill, Econnect, at IET Active Networks Workshop, 18 April 2007

This average cost may be high as EDF Energy has indicated that further generation could be accepted but has not quantified the amount. EDF Energy has also applied the GenAVC voltage control scheme to a rural 11kV network supplied from Martham Primary substation in North Norfolk in order to overcome voltage problems that would otherwise be caused by increased penetration of distributed generation, namely wind farms. EDF Energy states that there is nearly 3.8 MW of wind generation connected to this substation and that it is estimated that the same amount again could be integrated into this network by the use of GenAVC2. Econnect has stated that a typical cost of a GenAVC scheme is £180,000. On this basis the average cost per additional MW of generating capacity is: £180,000/3.8 per MW = £47,400 per MW The installation of MV/0.4kV transformers with on-load tap changers would improve the control of the 400V system voltages. AREVA is currently developing a two position tap changer for such applications and there are plans to trial this on the United Utilities network. LV voltage regulators manufactured by Microplanet are currently being trialled by United Utilities and Scottish Power to solve customer voltage complaints. Although the majority of these units have been installed at locations where voltage is below statutory limits, they have also been used to reduce voltage previously above the statutory limits.
2 Reference: EDF Energy Networks Ltd - IFI/RPZ Report for EPN/LPN/SPN April 2005 to March 2006, section 4.

A2 Reverse Power Flows
A2.1 Current Systems There are two types of on-load tap changers; reactor type and resistor type. The resistor types are classified as either double resistor or single resistor arrangements. The reverse power capability of single resistor on-load tap changers is restricted. This restriction is described further in the J&P Transformer Book. Most modern tap changers do not have this restriction since they are based on designs using two bridging resistors.
A2.2 Development Assumptions and Risk The impact of reverse power flows on automatic voltage control schemes and protection schemes needs to be considered.
A3 Optimisation of Conductor Rating
A3.1 Current Systems The loading of circuits must remain within the conductor ratings under system normal and, in certain instances, N-1 conditions. Circuit overloads are generally due to load growth or increased levels of distributed generation in concentrated areas of the distribution network. The traditional solution has generally been increase circuit capacities by using larger cross sectional area (CSA) conductor or increase the number of circuits. Seasonal constraints on generator export in line with seasonal ratings have also been implemented where the cost of network reinforcement is prohibitive. Central Networks has taken this one step further and actively manage the Boston/Skegness 132kV network to enable more generation to be connected on to the existing circuits. This solution enables the temperature of the line to be calculated based on the actual ambient temperature and power flowing in the circuit. This allows the rating of the circuit to be calculated more accurately and used to communicate automatically with generators to optimise the amount of power flowing in the circuit using the existing network control system. This solution has overcome a headroom shortfall of 41.5MW in meeting applications for connection of additional generation without the need for expensive network reinforcement work3. Ofgem has allowed this scheme to qualify for additional revenues (£3/kW of distributed generation connected, for the first five years) as a Registered Power Zone (RPZ). Ofgem has commented that it would cost Central Networks around £270,000 to develop the scheme. This amount does not include ongoing operational costs or generator connections cost. The scheme could enable as much as 90MW additional connected generation capacity.4 On this basis, the average cost per additional MW of generating capacity is £270,000/90 = £3,000 per MW.
A3.2 Development Assumptions and Risks The dynamic rating of conductors is seen as an important development to relieving network constraints caused by increased levels of both generation and load. The “Thermal Modelling and Active Network Management” project, a joint collaboration between Durham University, Imass, PB Power, Scottish Power and Siemens, explores the benefits of real time thermal status of conductors and using a thermal state estimation and control technique to actively control distributed generation.
3 Presentation by M. Orme, Central Networks, at IET Active Networks Workshop, 18 April 2007 4 Ofgem Press Release R/28 dated 29 June 2005

A4 Fault Level Management
A4.1 Current Systems DNOs currently restrict short circuit fault levels on their system to within either a design fault level for each voltage or the actual switchgear ratings, whichever is lower. The former is usually employed for MV networks where there are likely to be high numbers of older switchgear with lower fault ratings despite the primary switchboard having a fault rating above the design fault level. Where only the “make” duty of the switchgear is exceeded there is the option to manage this situation by temporarily reducing the network fault level before closing a circuit breaker. Where the network fault level is above the “break” duty of the switchgear a permanent solution is required. Switchgear replacement with higher rated equipment is one option. However short circuit fault levels can be reduced by a number of alternative “passive” methods such as the use of higher impedance transformers, network splitting, fault limiting reactors or connecting the distributed generation at a higher voltage level. However, each of the solutions result in one of more of the following disadvantages:
• lower system reliability
• increased operational complexity
• increased cost
• reduction in power quality
• degradation of power system stability Simplified active fault level management solutions already implemented by some DNOs such as split busbars to reduce the fault level with auto-close schemes to restore supplied. Although not currently used on UK distribution networks explosive fault current limiters are an alternative solution often used on industrial networks to reduce the actual current that flows during fault conditions. These devices have so far not been considered to be failsafe. A DTI commissioned report issued in 2004 (PB Power, 2004) concluded that the installation of Is Limiters would lead to:
• difficulties related to compliance with UK Health and Safety Executive (HSE) safety legislation
• duty holders bound by The Electricity Safety, Quality and Continuity Regulations 2002 (ESQCR) being in breach of their licence conditions and therefore open to prosecution
• potentially being in breach of the absolute requirements of Regulations 5 and 11 of the Electricity at Work Regulations

A4.2 Development Assumptions and Risks The ENA is coordinating a project to develop a fault level monitor that will accurately determine the actual real time network fault level allowing actual rather than calculated fault levels to be used when assessing generator connections. Superconducting Fault Current Limiters (SCFCL) are being developed by most of the major manufacturers. In 2001, ABB reported the successful test of an 8kV, 6.4 MVA resistive SCFCL (Chen et al, 2002) and Nexans Superconductors have developed a 10kV resistive SCFCL (CURL 10) that was field tested in Germany for one year from 2003. CE Electric, Scottish Power, United Utilities and Applied Superconductors are collaborating to trial three 12kV SCFCL devices (one per DNO) in different network configurations. This will provide useful installation and operational experience on a UK distribution network. The ENSG DWG Work Programme Two, ‘Network Design for a Low Carbon Economy’ has recently commissioned a review of the current state of technical solutions for fault level management and to develop a methodology to determine the materiality and locality of short circuit fault levels on distribution networks in the future.

A5 Demand Side Management
A5.1 Current Systems Active demand side management (DSM) is not currently used by DNOs. Prior to licence separation of distribution and supply businesses, demand side measures were sometimes used as an alternative to reinforcement, for example the implementation of Economy 7 tariff which encouraged energy use during periods of low demand. Voltage reduction or optimisation5 equipment is commercially available and can be used to reduce electricity consumption. This energy saving measure is promoted by the Carbon Trust and several councils and large supermarkets have already installed this equipment. In some states of Australia there is a regulatory requirement for the distribution network operator to consider DSM as an alternative to network reinforcement. Examples have been the improvement of the network power factor using power factor correcting (PFC) capacitors.
A5.2 Development Assumptions and Risks Smart metering is key to large scale domestic demand side management. Smart meter technology already exists and offers the opportunity to introduce new tariffs to encourage efficient energy use. They can also provide energy consumption information to help the customer to manage their consumption. The largest known implementation of smart metering is in Italy, where ENEL Distribuzione’s “Telegestore” programme has seen smart metering installed in 27Million homes, introducing flexible tariff structures to discourage the use of electricity during peak periods. One of the drivers for this was the remote meter reading capability of the meters installed. The meters are also fitted with thermal overloads to limit the load taken by the customer. In the UK, EDF Energy currently have a smart meter trial that will see 3000 smart meters being installed over two years. One of the aims of the project is to measure how much energy customers will save by becoming more aware of their consumption. There have also been trials with pre-payment GMS enabled smart meters that use SMS messaging to “pay as you” on 24 hour basis (LogicaCMG Instant Energy project). The Energy Retail Association has produced an Electricity Smart Meter Functional Specification (January 2007) The specification is intended to cover as many site configurations as possible and includes potential DNO requirements such as voltage, power factor, import/export data and load switching.
5 http://www.powerperfector.com

A6 Active Network Management
A6.1 Current Systems Scottish and Southern Energy have plans to trial an active power flow management trial in the Orkney Islands. This project has been designated a Registered Power Zone by Ofgem. In a press announcement Ofgem commented that Scottish and Southern Energy (SSE) had devised a network management scheme that would make better use of the existing infrastructure in the Orkneys where the electricity network is connected to the Scottish mainland by two 33kV submarine cables6. The control scheme would allow new generators to control their electricity output to match the available capacity of the network in real time. This innovation would be particularly helpful to wind and wave generators and would allow more of them to be connected to the network. Ofgem further commented that SSE’s scheme could realise a total of 62 MW or more of generator connection capacity onto the Orkney network. Of this, 47 MW is already contracted and a further 15 MW of viable renewable projects could be connected at times of peak demand. The project would be funded through the RPZ scheme and SSE estimated it would cost around £200,000 to develop. SSE and the University of Strathclyde have recently presented details of the scheme7,8 which was also the subject of a report by SSE to the DTI9. On this basis, the average cost per additional MW of generating capacity is £200,000/15 = £13,333 per MW
A6.2 Development Assumptions and Risks The DTI has recently published a register of active management pilots, trials and research and development activities10. This register lists a 105 projects, 78% of these are at research and / or development stage. The most advanced areas are communications and control, voltage control and power flow management each of which have actual projects implemented and a number of pilot trials. The AURA-NMS (Automated Regional Active Network Management System) project aims to produce a set of control algorithms to provide active network management enabling improved network performance and asset utilisation. It will develop solutions for managing multiple generation connections in a local area. The aim is to overcome existing SCADA and communication system limitations. This is a joint project between ABB, EDF Energy, Scottish Power and several universities.
6 Ofgem Press Release R/22. 7 Presentation by A. Watson, SSE, and R. Currie, University of Strathclyde, at IET Active Networks Workshop, 18 April 2007 8 Currie R.A.F., Ault G.W, MacLeman D.F., Fordyce R.W., Smith M.A., McDonald J.R., Design and trial of an active power flow management scheme on the North-Scotland network, CIRED 2007 paper 0421 9 SSE Report to DTI, Facilitate generation connections on Orkney by automatic distribution network management, K/EL/00311/00/00, URN NUMBER: 05/514, 2004. 10 Register of Active management Pilots, Trials, Research, Development and Demonstration Activities, URN No. 06/1414, for the DTI

A7 Virtual Power Plants
A7.3 Current Systems A Virtual Power Plant (VPP) is a cluster of distributed generation installations which are collectively run by a central control entity11.
A7.4 Development Assumptions and Risks The Flexible Electricity Networks to Integrate the eXpected 'energy evolution' (FENIX12) is a 4 year European Union project managed by a consortium of European network operators, manufacturers and Universities including National Grid, EDF Energy and University of Manchester. The objective of FENIX is to maximise distributed energy resources by optimising their contribution to the electric power system, through aggregation into Large Scale Virtual Power Plants (LSVPP) and decentralised management. This would provide similar flexibility and controllability to that of a large conventional power station.
11 http://www.encorp.com/dwnld/pdf/prodsheet/VPP-TechDataSheet.pdf 12 http://www.fenix-project.org

A8 Telecommunications Telecommunications is one of the key issues that was discussed during the workshop for a number of functions such as SCADA, protection, voltage control, metering and eventually energy trading. The future development of communication systems and technology may be the most difficult to predict. An example of this would be the development of mobile telephone and internet technology.
A8.1 Current Systems The main concerns of utilities are the availability and security of the communications network. This has lead to utilities owning and managing their own private networks separate to public communications networks. These systems are designed for protection signalling, SCADA and voice communication. Generally, the higher the voltage, the more sophisticated and secure the communication infrastructure. At transmission and sub transmission voltage substations there are typically two physically separated, point to point communication links that provide duplication and hence additional security. On distribution networks there may be one multi drop link between substations with no duplication. At the low voltage there is no communication infrastructure. Distribution companies are currently investing in systems to improve their key performance indicators in terms of CIs and CML. This has lead to a greater requirement for telecommunications at the medium voltage level in order to locate a fault and provide SCADA for controllable circuit breakers and switches. The communication types are a mixture of point to point & multi drop using radio, pilot wires or power line carrier. There are no control systems utilising public communication networks. The following table describes various communication options that are currently in use or undergoing large scale pilot by European utilities.
Communication Type Description
Dial Up domestic wire telephone system
This is the standard domestic telephone network. The data would be accessed by a central computer telephoning the device at regular intervals.
Broadband using domestic wire telephone system.
Broadband is often called high-speed Internet, because it usually has a high rate of data transmission. In general, any connection to the customer of 256 kbit/s (0.250 Mbit/s) or more is considered broadband Internet. The International Telecommunication Union Standardization Sector (ITU-T) recommendation I.113 has defined broadband as a transmission capacity that is faster than primary rate ISDN, at 1.5 to 2 Mbit/s. The FCC definition of broadband is 200 kbit/s (0.2 Mbit/s) in one direction, and advanced broadband is at least 200 kbit/s in both directions.
Broadband using WiFi Technology.
WiFi technology is an TCP/IP wireless LAN currently being used in domestic houses and large public areas such as hotels, airports and shopping centres. This technology allows suitably equipped equipment to connect to the wireless LAN to access typical internet services.

Communication Type Description
Broadband using power line carrier.
Broadband over power lines (BPL), also known as power-line internet or Power-band, is the use of PLC technology to provide broadband Internet access through ordinary power lines. A computer (or any other device) would need only to plug a BPL "modem" into any outlet in an equipped building to have high-speed Internet access.
Mobile telephone GPRS / GSM messaging
General Packet Radio Service (GPRS) is a Mobile Data Service available to users of GSM and IS-136 mobile phones. GPRS data transfer is typically charged per megabyte of transferred data, while data communication via traditional circuit switching is billed per minute of connection time, independent of whether the user has actually transferred data or has been in an idle state. GPRS can be utilized for services such as WAP access, SMS and MMS, but also for Internet communication services such as email and web access. In the future, it is expected that low cost voice over IP will be made available in cell phones
Dedicated point to point link / multi-drop link.
This is a link directly from the distribution company telecommunications system that would need to be placed beside the power cables. Typically copper pilot cables or fibre optic cables.
Digital Power Line Carrier.
In spite of the growing significance of digital communication systems - especially those employing optical fibre links, PLC still remains in many cases the most cost-effective solution to cover the operational needs of a power system. This applies particularly when only low volumes of data have to be transmitted over long distances.
A8.2 Development Assumptions and Risks Communications technology will continue to get faster and more easily available throughout the UK. In particular access to broadband should be available in all locations using telephone systems (fixed line and mobile) or through satellite and digital television systems. Assuming readily available communications media, the remote terminal units (RTU) or smart metering devices need to be able to connect to the media using a standard connection and communication protocol. Communication systems continue to develop and by 2020 there will be a wide choice of communication options for different geographical locations and data transfer requirements. Currently if any geographical point in the UK requires communications a solution can be found. The key action for communications is to ensure that all network connected devices (RTU, meters & generation) are capable of remote communications using standard interfaces and protocols.

A9 Supervisory Control and Data Acquisition (SCADA)
A9.1 Current Systems The report is intended to discuss possible solutions to distribution network SCADA within the time frame of 2020. A detailed report on the current systems in the UK can be found in the report K/EL/00310/REP Network Management Systems for Active Distribution NetworksError! Bookmark not defined.. A SCADA system is typically divided into two parts;
1. The data acquisition in the substation. This is typically achieved using a device called a remote terminal unit (RTU) or it current equivalent substation control / automation system (SCS / SAS). Typical functions include;
a. Alarm and event notification to control centre. b. Power system measurements, voltage current and power. c. Switchgear control, circuit breakers, switches and transformer tap positions. d. Substation interlocking to prevent mal-operation. e. Recording of measurements, system events and alarms.
2. The data processing in the control centre. The software application in the control centre to process all the data received from the network substations is known as the network management system. These systems contain may functions that allow the network operator to control, manage and maintain the electricity network. Typical applications include;
a. Graphical representation of the network. This is usually a single line diagram representation of the network or a geographical representation.
b. State estimation. This function allows the operator to estimate the voltages and currents throughout the network. For high voltage networks, this function is used as a check of the telemetry data received from the substations. For distribution networks this function is used to estimate the voltages on sections of the network without any telemetry.
c. Load flow analysis. This function similar to the state estimator, allows the operator to predict possible currents and fault currents in the network. This is used to plan switching operations so fault levels are no exceeded.
d. Fault location and restoration. This function allows the operator to locate a fault on the network, using both real and estimated data, and provided the operator with suggested network re-configuration options to isolate the fault and restore the healthy network.
e. Power dispatch. This function, normally a grid function, manages the power from generators to match the network load to ensure frequency and voltage stability.
Functions ‘b’, ‘c’, and ‘d’ are not normally used by distribution companies because to achieve accurate results, detailed network characteristics need to be entered into the application and updated with changes in the network. A typical distribution company will have far more nodes than the National Grid Network. These functions also require significant computer power for real time calculation which only the most modern control centres will be capable of performing.

Function ‘e’ is never used by distribution companies. They are simply required to manage the network. It is currently the responsibility of Grid to actively match generation and load. With significant distributed generation the power data will at least need to be transmitted to grid. Estimation of the amount of energy produced is possible but the number of variables is significant. Current SCADA systems available on the market are capable of managing distributed generation. The issue for the SCADA system is that as the level of distributed generation increases the faster the telemetry has to be processed to ensure the network remains within regulatory limits.
A9.2 Development Assumptions and Risks The devices required for SCADA data acquisition are already available or under final development. The real technical problem will be with existing control centres network management software and hardware. Control centre applications need to be upgraded before significant amounts of distributed generation are installed. The typical life cycle of control centre network management software is between 10 to 15 years. Distribution companies need to plan for a complete upgrade of their computer systems to meet the predicated increase in telemetry and processing requirements.
A10 Data Transfer Protocols
A10.1 Current Systems Communication protocols are used to transfer data between computer systems over any type of communication media. If a device is configured for one protocol and is connected to another device expecting a different protocol, it is impossible to transfer data. Protocols are used to transfer data between devices within a substation, from the substation to the control centre and from control centre to control centre. A simple analogy is two people who speak different languages trying to communicate on the telephone. Their voices are successfully transmitted over the telephone network (wire, fibre, satellite) but there is no possibility of understanding or providing an intelligent response, unless one person coverts their language to the other persons. Within the electricity industry communication protocols are slowly converging to a few open standards internationally managed through the IEC. These standards include the following;
• IEC60870-5-101 (Telecontrol equipment and systems - Part 5-101: Transmission protocols - Companion standard for basic telecontrol tasks , Point to Point SCADA Communication Protocol)
• IEC60870-5-103 (Telecontrol equipment and systems - Part 5-103: Transmission protocols - Companion standard for the informative interface of protection equipment, Point to Point Protection Communication Protocol)
• IEC60870-5-104 (Telecontrol equipment and systems - Part 5-104: Transmission protocols - Network access for IEC 60870-5-101 using standard transport profiles, TCP/IP version of 101, allows for local & wide area networks LAN & WAN)
• IEC61850 (Communication networks and systems in substations series, Latest industry protocol allowing protection & SCADA signals over LAN & WAN)
• IEC62056-31 which has superseded IEC 61107 (Electricity metering - Data exchange for meter reading, tariff and load control - Part 31: Use of local area networks on twisted pair with carrier signalling)
Recent industry protocols are all based on using standard communication equipment typically computer network equipment. This allows for communication over standard internet devices without any change in the hardware.

A10.2 Development Assumptions and Risks Protocols will continue to be developed to maximise the benefits of the communication technology and the higher bandwidths available. If a large number of devices, probably smart meters, are installed by a manufacture using a propriety protocol, this may become the UK standard protocol. If a large number of devices are installed by a manufacture using a propriety protocol, this may restrict the development of smart metering functionality and impact any trading arrangements. Market forces within the electrical industry are driving substation devices to use open protocols. The issue is the smart metering protocol is not as advanced and may need government regulation to insist on devices being open.

APPENDIX B
LITERATURE SURVEY
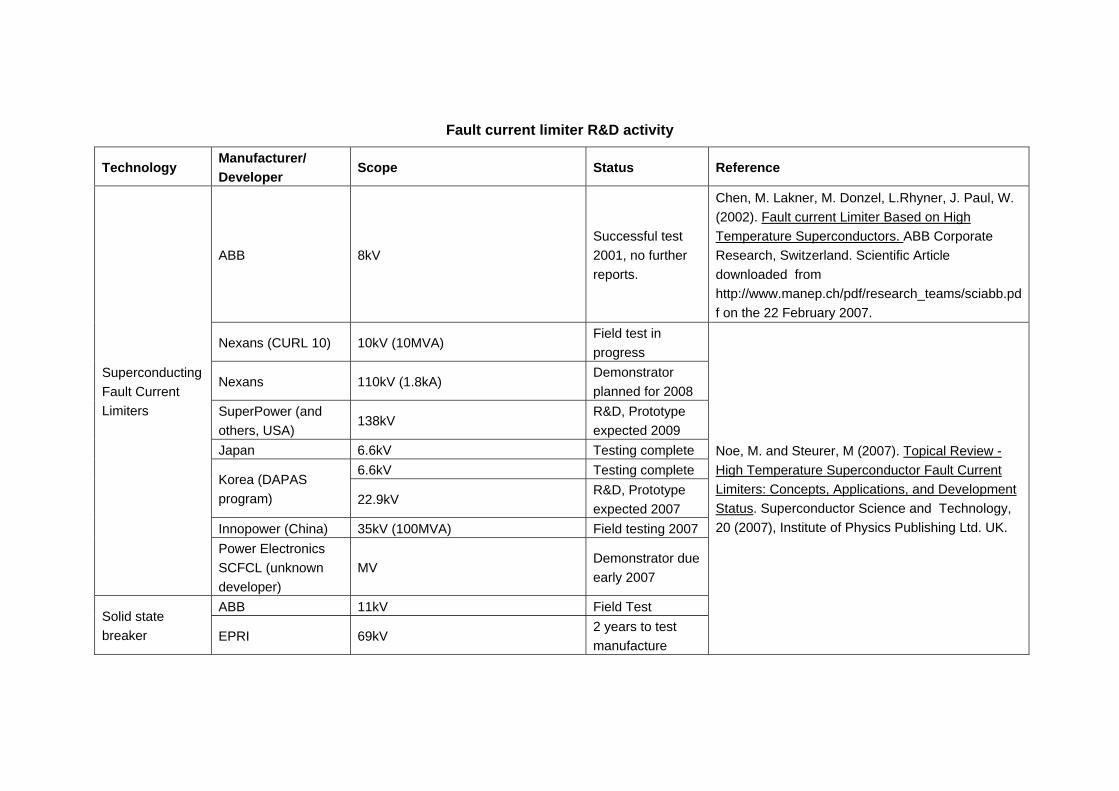
Fault current limiter R&D activity
Technology Manufacturer/ Developer
Scope Status Reference
ABB 8kV Successful test 2001, no further reports.
Chen, M. Lakner, M. Donzel, L.Rhyner, J. Paul, W. (2002). Fault current Limiter Based on High Temperature Superconductors. ABB Corporate Research, Switzerland. Scientific Article downloaded from http://www.manep.ch/pdf/research_teams/sciabb.pdf on the 22 February 2007.
Nexans (CURL 10) 10kV (10MVA) Field test in progress
Nexans 110kV (1.8kA) Demonstrator planned for 2008
SuperPower (and others, USA)
138kV R&D, Prototype expected 2009
Japan 6.6kV Testing complete 6.6kV Testing complete
Korea (DAPAS program) 22.9kV
R&D, Prototype expected 2007
Innopower (China) 35kV (100MVA) Field testing 2007
Superconducting Fault Current Limiters
Power Electronics SCFCL (unknown developer)
MV Demonstrator due early 2007
ABB 11kV Field Test Solid state breaker EPRI 69kV
2 years to test manufacture
Noe, M. and Steurer, M (2007). Topical Review - High Temperature Superconductor Fault Current Limiters: Concepts, Applications, and Development Status. Superconductor Science and Technology, 20 (2007), Institute of Physics Publishing Ltd. UK.

Technology Manufacturer/ Developer
Scope Status Reference
Magnetic Fault Current Limiter
Areva 400V (250A) prototype R&D
Chong, E. Rasolonjanahary, J-L. Sturgess, J. Baker, A. Sasse, C (2006). A Novel Concept for a Fault Current Limiter. 8th IEE International Conference ACDC 2006, AC and DC Power Transmission, IC 513 Proceedings, 28-31 March 2006, Savoy Place , London, UK.
SLIMFORMER – Multi-Functional Self-Limiting Superconducting Transformer
Areva T&D, with 6 partners
The main objective of this three-year STREP is to develop an innovative, hybrid device that integrates a HTS cable termination with a HTS transformer, a fault current limiter and robust refrigeration.
April 2006 – April 2009
http://ukerc.rl.ac.uk/Landscapes/Electricity_TransDist_Section8.pdf
UNIFLEX-PM – Advanced Power Converters for Universal and Flexible Power Management in Future Electricity Networks
Areva T&D, with 8 partners
The objective of this project is to develop advanced power conversion techniques to meet new application needs in the Future European Electricity Network, and to validate these techniques in hardware.
March 2006 – March 2009
http://ukerc.rl.ac.uk/Landscapes/Electricity_TransDist_Section8.pdf
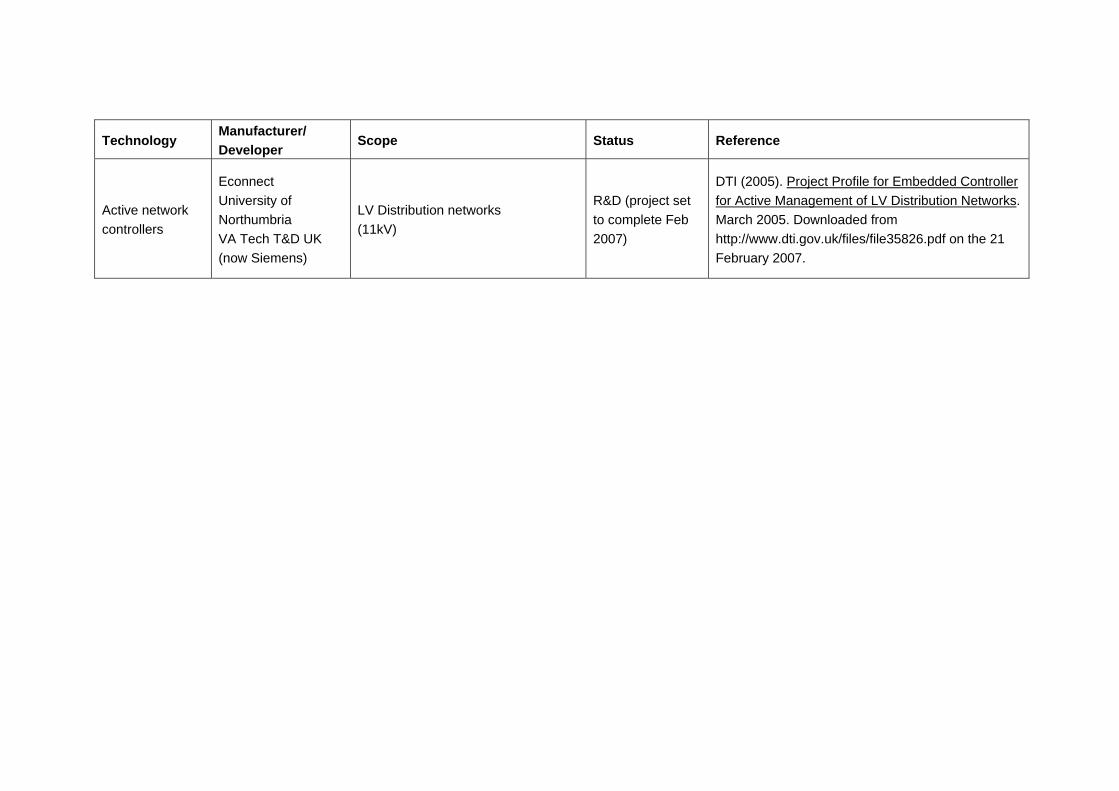
Technology Manufacturer/ Developer
Scope Status Reference
Active network controllers
Econnect University of Northumbria VA Tech T&D UK (now Siemens)
LV Distribution networks (11kV)
R&D (project set to complete Feb 2007)
DTI (2005). Project Profile for Embedded Controller for Active Management of LV Distribution Networks. March 2005. Downloaded from http://www.dti.gov.uk/files/file35826.pdf on the 21 February 2007.
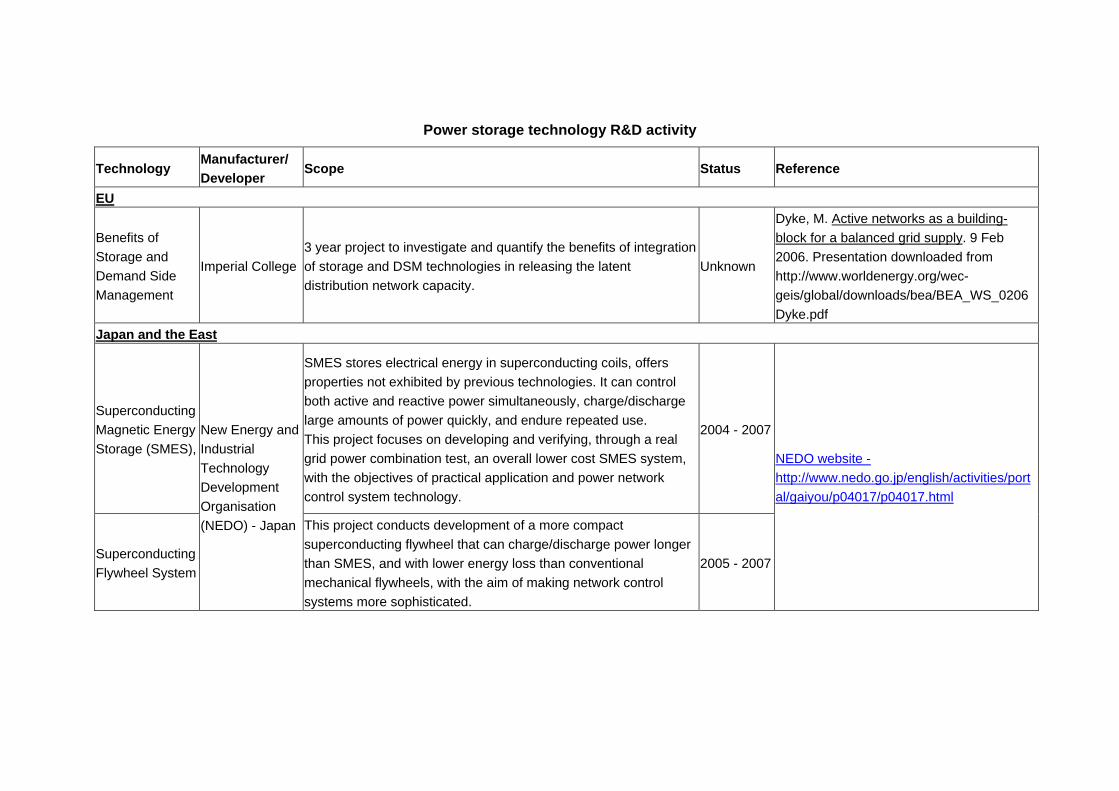
Power storage technology R&D activity
Technology Manufacturer/ Developer
Scope Status Reference
EU
Benefits of Storage and Demand Side Management
Imperial College 3 year project to investigate and quantify the benefits of integration of storage and DSM technologies in releasing the latent distribution network capacity.
Unknown
Dyke, M. Active networks as a building-block for a balanced grid supply. 9 Feb 2006. Presentation downloaded from http://www.worldenergy.org/wec-geis/global/downloads/bea/BEA_WS_0206Dyke.pdf
Japan and the East
Superconducting Magnetic Energy Storage (SMES),
SMES stores electrical energy in superconducting coils, offers properties not exhibited by previous technologies. It can control both active and reactive power simultaneously, charge/discharge large amounts of power quickly, and endure repeated use. This project focuses on developing and verifying, through a real grid power combination test, an overall lower cost SMES system, with the objectives of practical application and power network control system technology.
2004 - 2007
Superconducting Flywheel System
New Energy and Industrial Technology Development Organisation (NEDO) - Japan This project conducts development of a more compact
superconducting flywheel that can charge/discharge power longer than SMES, and with lower energy loss than conventional mechanical flywheels, with the aim of making network control systems more sophisticated.
2005 - 2007
NEDO website - http://www.nedo.go.jp/english/activities/portal/gaiyou/p04017/p04017.html

Technology Manufacturer/ Developer
Scope Status Reference
Wind Power Stabilization Technology Development Project
New Energy and Industrial Technology Development Organisation (NEDO) - Japan
Contribute to the wider introduction and implementation of wind power by developing technology to stabilize the output of wind farms. To achieve this NEDO has installed an energy storage system (BESS), using a vanadium redox-flow battery, for power generated at the Tomamae Win Villa wind farm. NEDO is comprehensively evaluating the costs of storage capacity, total efficiency, etc., versus the benefits of stabilizing output, reliability, etc. NEDO is developing control and storage technology that keeps in check the short-range output fluctuations that impact grids lines. In addition, NEDO aims to mitigate the impact on systems operating with unpredictable wind power generation in a three year plan that commenced in FY2005
2003 - 2007
NEDO website - http://www.nedo.go.jp/english/activities/portal/gaiyou/p03039/p03039.html and CREIPI website http://criepi.denken.or.jp/en/e_publication/a2006/051.pdf
Development of an Electric Energy Storage System for Grid-connection with New Energy Resources
New Energy and Industrial Technology Development Organisation (NEDO) - Japan
The development of low-cost and long-life energy storage systems, such as batteries, is a high priority to facilitate installation of intermittent DG. To absorb power fluctuations associated with wind-farm-scale new energy generation systems, a megawatt-class, high-performance and low-cost electric energy storage system will be developed in this project, based on the following: (1) Technology development to contribute to the practical application of large-scale power storage systems (2) Development of elemental technologies to reduce the cost and extend the usable life of power storage systems (3) Technological development related to new, next-generation electric energy storage (4) Fundamental study to evaluate various factors, including the safety and usable life of energy storage systems
2006 - 2010NEDO website - http://www.nedo.go.jp/english/activities/portal/gaiyou/p06004/p06004.html

Demand Side Management R&D Activity
Project Developer Scope Status Reference
DREAM
University of California (Berkley)
Demand response and residential energy management R&D projects. This low-cost demand-responsive electrical appliance manager (DREAM) exploits wireless technology and a system of learning (both by machine and occupant). DREAM automatically responds to price signals so that the homeowner is not forced to be a "day trader" in electricity. It accepts the homeowner's preferences for cost versus comfort. This "thermostat" controls other appliances in the house, such as electric water heaters, refrigerators, pool pumps, and lights in response to price signals from the utility.
Before demand-response systems can be effectively deployed on a wide scale in the residential sector, several issues must be resolved. One group of the team is working on the infrastructure of communications. Another group is developing metering infrastructure, and yet another group is working on energy scavenging. The DRETD Thermostat and Controls Group is developing a demand response thermostat.
http://dr.berkeley.edu/dream/index.htm#presentation
Off grid systems
Econnect's Distributed Intelligent Load Control technology is providing optimum power and control for off-grid power systems. Their Distributed Intelligent Load Controllers (DILCs) are currently deployed in isolated power systems around the world. Load
Management System
Econnect
Grid connected systems
Communication capabilities are currently being added to DILCs to allow them to operate with larger mini-grids and grid connected systems. This controller promises to allow the minimisation of energy costs by enabling the generation form DG to be utilised by the local communities and demand.
http://www.econnect.co.uk/show_page.php?id=1146231123

Smart Metering adoption activity
Developer Application voltage level Status Reference
ENEL (Italy)
The advanced automated meter management (AMM) system integrates metering, billing and contract management. ENEL states that it can provide improved customer service by reducing metering errors and maintenance time, and by offering varied tariff structures with lower energy costs for off-peak consumption.
ENEL the Italian electricity utility with 30 million customers embarked on a major programme of smart meter installation in 2002. By 2004 ENEL had installed 15 million new meters. Its intention was to install a further 15 million to complete the programme by the end of 2005.
Sweden In Sweden electric utilities will have had to introduce automatic meter reading for billing electric energy consumption by 2009.
A number of companies are active in supplying solutions including mobile phone providers such as Vodaphone who are working with Actaris the meter manufacturer.
Northern Ireland
The need to replace some 80,000 pre-payment meters drove NIE to install pre-payment meters on their distribution system.
In 2005, NIE had 175,000 pre-payment meter customers out of a total of 700,000 customers.
Ontario Energy Board (OEB)
The OEB required distributors to introduce a basic smart metering system that would measure how much electricity a customer uses each hour of the day. It was intended that through wireless communication or other technologies, the data would be transferred daily to the local electricity distributor who would use that data to charge customers an energy price that varies depending on when the electricity was consumed.
The implementation plan proposed that all new and existing customers of licensed distributors in Ontario, including all residential and small commercial customers, had some type of smart meter by December 31, 2010. The OEB intends to introduce a regulated price plan for residential customers with smart meters with prices that vary by time of use.
Get Smart: Bringing meters into the 21st Century. Energywatch August 2005.

eMeter’s EnergyIP solution has been selected for a central Meter Data Management and Repository (MDM/R) service in support of the Ontario government’s Smart Metering Initiative. It will provide meter data management services to the Ontario electricity industry, supporting the province’s program to install a smart meter in 800,000 homes and small businesses by 2007 and throughout Ontario by 2010.
http://www.emeter.com/news/press/press011707.php

Active networks, Microgrids and Virtual Power Plant R&D activity
Technology Developer Scope Status Reference
EU
Network controller utilising dynamic thermal equipment ratings
PB Scottish Power University of Durham Imass Areva
Distribution networks (132kV and below)
R&D (scheduled end Sept 2009) PB
Active network controllers
Econnect University of Northumbria VA Tech T&D UK (now Siemens)
LV Distribution networks (11kV)
R&D (unknown status)
DTI (2005). Project Profile for Embedded Controller for Active Management of LV Distribution Networks. March 2005. Downloaded from http://www.dti.gov.uk/files/file35826.pdf on the 21 February 2007.
PoMS (Power Quality Management System)
Dispower Implements active management of DG , controllable consumption, storage devices, and power quality devices in LV grids.
A proof of concept has been achieved for active LV grid control and the possibility to create added value by energy management on the LV level. Although PoMS solution has some potential for application in niche markets today, the main markets will emerge in the future with widespread
DISPOWER, 2006. DISPOWER, Final Public Report. Distributed Generation with High Penetration of Renewable Energy Sources. 2006, Kassel, Germany.

Technology Developer Scope Status Reference
remote metering and active management of LV grids.
Downloaded form http://www.dispower.org/ on 16/03/2007.
AURA - NMS (Autonomous Regional Active Network Management)
ABB Scottish Power EDF Energy and universities
Network restoration, reconfiguration, voltage control, constrained connection management. Agent based local control of 33kV and 11kV networks.
Three year project R&D, started 2005/6
FENIX (Flexible Electricity Networks to Integrate the eXpected ‘energy evolution’)
Part EU funded project with twenty European partners, led by Iberdrola of Spain.
To conceptualise, design and demonstrate a technical architecture and commercial framework that would enable Distributed Energy Resources (DER) based systems to become the solution for the future cost efficient, secure and sustainable EU electricity supply system. Development of new commercial and regulatory solutions to support Large Scale Virtual Power Plants (LSVPP). Validation through 2 large field tests in Spain an UK. Interacts with stakeholders through an advisory group.
Apr.2005 - Apr. 2009 http://www.fenix-project.org/

Technology Developer Scope Status Reference
More Microgrids - Advanced Architectures and Control Concepts for More Microgrids
Institute of Communication and Computer Systems - Greece 22 partners, including The Turbo Genset Company, and University of Manchester
Research within the FP5 Project MICROGRIDS (ENK5-CT-2002-00610), focused on the operation of a single Microgrid, has successfully investigated appropriate control techniques and demonstrated the feasibility of Microgrids operation through laboratory experiments. The proposed project extends this work significantly
January 2006 – December 2009 http://ukerc.rl.ac.uk/Landscapes/Electricity_TransDist_Section8.pdf

Technology Developer Scope Status Reference
USA
IntelliGrid EPRI
The IntelliGrid program provides the methods, tools, and integrating technologies that allow utilities to deploy technologies today that meet near-term business needs while laying the groundwork for an intelligent grid. It is following an open-standards-based approach that provides transmission and distribution companies with the knowledge to cost-effectively integrate advanced automation applications and diverse vendor products. This open systems architecture enables resource leveraging in ways that are not possible with single-purpose systems, and encourages competitive procurement of advanced equipment.
With its foundation established, the IntelliGrid Architecture and implementation tools in place, and demonstrations showing success, the program is developing integration guidelines, providing specification assistance, disseminating information, and educating, building, and supporting a user community The IntelliGrid program in 2007 consists of the IntelliGrid Core project set, which focuses on integration assistance, education, and visioning plus three optional project sets, offering demonstration and research projects designed to suit specific operational needs. The IntelliGrid Core project set must be purchased to gain access to any or all of the optional research project sets.
EPRI website - http://www.epri.com/portfolio/product.aspx?id=1992
Japan and the East

Technology Developer Scope Status Reference
Regional Power Grid with Renewable Energy Resources - a Demonstrative Project in Hachinohe
Mitsubishi Electric Corp. Mitsubishi Research Institute New Energy and Industrial Technology Development Organization
The scope of the project is to develop, operate, and evaluate a Dispersed Renewable Energy Supply System with the ability to adapt the total energy output in response to changes in weather and demand. Such a system would reduce the impact that PV and WT generation systems have on commercial grids and allow the interconnection of more Dispersed Energy Resources (DER)
The system was put into operation in October 2005 and is being evaluated from the viewpoints of electrical power quality, cost effectiveness, and environmental burden over the demonstration period, which will last until March 2008.
Fujioka, Y, Maejima, H, Nakamura, S. Uesaka, S, and Okudera, M. Regional Power Grid with Renewable Energy Resources - a Demonstrative Project in Hachinohe. Japan 2006, paper presented at Cigre 2006.
International Cooperative Demonstration Project for Stabilised and Advanced Grid Connection PV Systems
Thailand, Malaysia, Indonesia and China
In this project, experimental development is being carried out to address the technical challenges to be addressed in order to connect new energy sources located near the energy demand to power grids in order to achieve a stable supply of electric power in such microgrids. Three phases... (1) Demonstrative Research Project on Micro Grid Stabilization (2) Demonstrative Research on Power Supply Systems to Maximize the Use of Solar and Other Fluctuating Renewable Power Sources (3) Simulation Analysis of Grid Connection and Standalone Operations
2005 - 2007
Energy and Environment Technologies pdf document downloaded from NEDO website, http://www.nedo.go.jp/english/activities/portal/gaiyou/p03039/p03039.html on the 20/03/07.
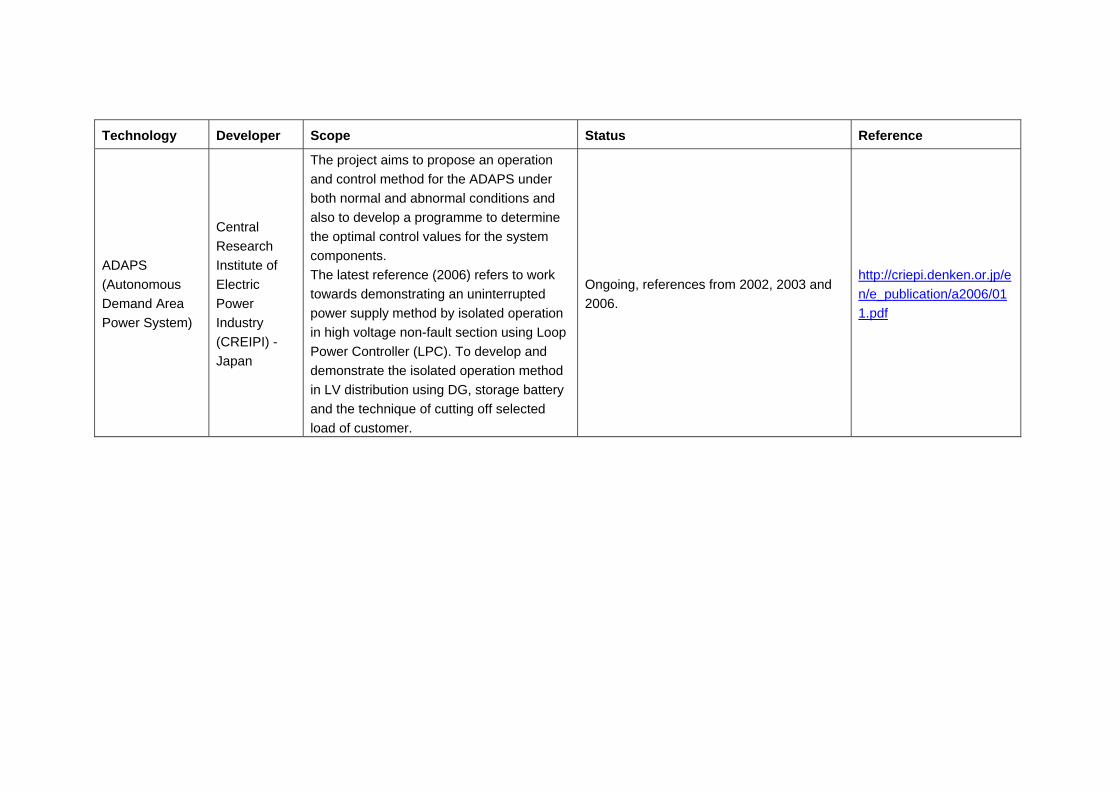
Technology Developer Scope Status Reference
ADAPS (Autonomous Demand Area Power System)
Central Research Institute of Electric Power Industry (CREIPI) - Japan
The project aims to propose an operation and control method for the ADAPS under both normal and abnormal conditions and also to develop a programme to determine the optimal control values for the system components. The latest reference (2006) refers to work towards demonstrating an uninterrupted power supply method by isolated operation in high voltage non-fault section using Loop Power Controller (LPC). To develop and demonstrate the isolated operation method in LV distribution using DG, storage battery and the technique of cutting off selected load of customer.
Ongoing, references from 2002, 2003 and 2006.
http://criepi.denken.or.jp/en/e_publication/a2006/011.pdf

High level strategic and future network R&D activity
Project Owner Scope Status Reference
EU
SUPERGEN I - Future Network Technologies
Addressing the engineering problems created by embedding renewable energy sources into a distribution network and the market and regulatory environment that creates the right commercial drivers to encourage sustainable energy generation and use. It is considering two timescales: the medium term (2010-2020) and the long-term (2020-2050). There are seven work-packages each containing a mixture of engineering, economic and social acceptability aspects: System wide reliability and security; Decentralised Operation & Control; Demand-Side Participation; Micro-Grids; Foresight; System Evolution; and Outreach.
2003 – Oct. 2007
SUPERGEN III - Highly Distributed Power Systems
Funded by Engineering and Physical Sciences Research Council (EPSRC)
Investigation of how to coordinate many small distributed energy resources (DERs), such that they contribute to (and are rewarded for) the effective operation of the power system. Research will identify whether network support functions should be provided by coordination of the multitude of low cost distributed sources or whether these functions should be concentrated in larger dedicated items of equipment. The Consortium is addressing conceptual design frameworks for operation and appraisal, and the systematic integration requirements for DERs.
2005 -2009
http://ukerc.rl.ac.uk/Landscapes/Electricity_TransDist_Section3.pdf
Power Systems and High Voltage Laboratories, Switzerland
Vision of Future Energy Networks
This project aims at a greenfield approach for future power systems; this means that boundary conditions given by today’s systems are basically neglected in order to achieve better overall system performance. In this project emphasis is put on the use of multiple energy carriers (not only electricity) and distributed energy resources for energy conversion and storage. One of the next steps in the project is to create future scenarios based on the energy hub approach for the supply of a town in Switzerland. Investigations will be carried out together with the local multi-utility.
?
Geidl, M. Favre-Perrod, P. Klockl, B. Koeppel, P. A Greenfield Approach for Future Power systems. Power Systems and High Voltage Laboratories, Swirtzerland, 2006. paper presented at Cigre 2006.

Project Owner Scope Status Reference
DER-LAB – Network of DER Laboratories and Pre-Standardisation
Institut Fuer Solare 11 partners, including Universities of Manchester, Strathclyde, Imperial College, and NaRec
The main objective of DER-Lab is to support the sustainable integration of renewable energy sources (RES) and distributed energy resources (DER) in the electricity supply by developing common requirements, quality criteria, as well as proposing test and certification procedures
Oct. 2005 – Oct. 2011
EU-DEEP – European Distributed Energy Partnership
Gaz De France 30 partners, including Bowman Power Systems Ltd
A group of eight European energy utilities propose an Integrated Project to remove, in five and a half years, most of the technical and non-technical barriers, which prevent a massive deployment of distributed energy resources (DER) in Europe.
Jan. 2004 – Jul. 2009
RELIANCE
Suez-Tractebel SA 17 partners, including University of Manchester
A group of 8 Transmission System Operators (Belgium, Denmark, Italy, Norway, Nederland, Spain, Czech and Slovenia) proposes a Coordination Action to remove, in 2 years, most of the technical and non-technical barriers preventing today a proactive approach needed to perform joint RTD (Research & Technology Development) tasks of European added value
Oct. 2005 – Oct. 2007
http://ukerc.rl.ac.uk/Landscapes/Electricity_TransDist_Section8.pdf

Project Owner Scope Status Reference USA
GridWise US Department of Energy and the GridWise Alliance
GridWise is a consortium of public and private stakeholders who are aligned around a vision of an electric system that integrates the infrastructure, processes, devices, information and market structure so that energy can be generated, distributed, and consumed more efficiently and cost effectively. The Alliance and its members advocate change locally, regionally, and nationally to promote new policies and technology solutions that move closer to the vision. The Alliance provides a forum where members representing a broad range of interests in the electricity sector can meet, exchange ideas, and work cooperatively on a common set of issues, with the goal of moving our industrial-age electric grid into the information age. In addition, the Alliance provides its members with opportunities to interact with senior policy makers on both the federal and state level who, together with industry, will transform the nation’s electric power system.
Ongoing http://www.gridwise.org/index.html

Project Owner Scope Status Reference
Japan and the East
Demonstrative Project on New Power Network Systems
New Energy and Industrial Technology Development Organisation (NEDO)
Technology is being developed in this project to maintain grid power quality even when dispersed power sources, including new energy, are connected to the grid on a large-scale. Additional project aims include developing technology to meet consumers' power quality needs using the dispersed new energy power sources, and confirming the effectiveness of the system through verification tests. (1) Demonstrative Project on Power Network Technology. Developing grid line control devices and systems and conducting verification studies to maintain power quality on grid lines when new energy and other dispersed power sources are introduced on a large-scale using a model power distribution system composed of dispersed power sources, including new energy, as well as dummy load simulators and grid line control devices. (2) Demonstrative Project on Power Supply Systems by Service Level. Conducting verification studies that involve supplying consumers who have differing power quality requirements with varying energy service levels using consumers' power supply systems composed of dispersed power sources, including new energy, inverters, batteries, high-speed breakers, etc. (3) Comprehensive Investigation into New Power Network Technology. In order to make efficient and effective progress in each area of research for this project, NEDO is conducting comprehensive research and investigation to provide feedback on the data analysis, evaluation, and
2004 - 2007
NEDO website - http://www.nedo.go.jp/english/activities/portal/gaiyou/p04020/p04020.html

research carried out for all of the studies and verification tests.

EC SmartGrids Report Summary of the EC SmartGrids report and the items of particular relevance to this report.
EC: EUROPEAN TECHNOLOGY PLATFORM SMARTGRIDS STRATEGIC RESEARCH AGENDA FOR EUPOPE’S ELECTRICITY NETWORKS OF THE FUTURE
Research Area/Task Comment Relevance to this Future Network Architectures Report
Research Area 1 – Smart Distribution Infrastructure (Small Customers and Network Design)
Particular problems: lack of compatibility of fault protection systems and metering.
Protection problem addressed in report
Inadequacy of existing dynamic simulation tools
Further consideration required.
Deterministic approaches are generally too conservative – a stochastic approach is needed.
Probabilistic constraint mechanism may be required (e.g. LOLE) but ESQCR/Distribution Code power quality standards should not be relaxed
RT 1.1 – The distribution networks of the future – new architectures for system design and customer participation
Particular emphasis on regulatory, statutory or technical standards barriers
Regulatory aspects addressed in report
RT 1.2 – The distribution networks of the future – new tools to study DG integration in system planning
Probabilistic techniques for DG, taking account of behaviour of DG and DSM
Diversity assumptions, response to price signals and use of generation/load profiles – further work required
Research Area 2 – Smart Operation, Energy Flows and Customer Adaptation (Small Customers and Networks)
Operation in real time; “Grid computing”, interaction of DSM and storage – all embracing
RT 2.1 – The networks of the future – new tools to study the operational integration of distributed generation and active customers
Simulation models - generation dispatching - steady state analysis - forecasting techniques - transient behaviour
Dispatch analysis aide to VPP concept Unbalanced loads Weather related Power electronic converters – all very relevant.
RT 2.2 – Innovative energy management strategies for large distributed generation penetration, storage and demand response
Decentralised distribution control strategy; Microgrids (up to 2MW) capable of islanding; storage
Decentralised control addressed in report but Microgrids capable of islanded operation discounted. Storage requires economic cost/benefit analysis.
RT 2.3 – The distribution networks of the future – customer driven markets
Customer response programs – install and operate a cluster of houses with aggregated demand response
CVPP concept for energy trading and management; UUE LV network with DCHP connected particularly relevant

Research Area/Task Comment Relevance to this Future Network Architectures Report here.
Research Area 3 – SmartGrid Assets and Asset Management (Transmission and Distribution)
Asset management is hindered by the traditional paradigms of reliability and long pay back periods.
Transmission aspects (HVDC, FACTS) outside scope of this report.
RT 3.1 – Network asset management – Transmission and distribution
Advanced methods/models/tools for asset condition modelling and risk base asset management
Complex and all-embracing models are often impracticable. Condition based techniques and age-based modelling, as well as risk assessment techniques, are well developed in UK. Requirement now is for cost/benefit technique to justify replacement of assets to meet DG requirements ahead normal life expiry of those assets.
RT 3.2 – Transmission networks of the future – new architectures and new tools
Scope appears to address UCTE network
Transmission aspects (HVDC, FACTS) outside scope of this report.
RT 3.3 – Transmission networks of the future – long distance power supply
Gas versus electricity for long distance energy transmission
As for RT 3.2
Research Area 4 – European Interoperability of SmartGrids (Transmission and Distribution)
Long distance power supply
RT 4.1 – Ancillary services, sustainable operations and low level dispatching
Active power balancing – UCTE and Nordel systems considered as models
CVPP aspect – trading of ancillary services particularly with increasing amounts of micro generation is addressed in report
RT 4.2 – Advanced forecasting techniques for sustainable operations and power supply
Appears to be similar in scope to RT 1.2
RT 4.3 – Architectures and tools for operations, restorations and defence plans
“Self-healing networks” Doubtful whether this is relevant to most UK networks
RT 4.4 – Advanced operation of the high voltage system – seamless smart grids
Transmission orientated
RT 4.5 – Pre-standardisation research
Harmonised procedures IEC and CENELEC procedures mature and, for example, IEC 61850 is presently being extended to meet needs of DG.
Research Area 5 – SmartGrids Cross-Cutting

Research Area/Task Comment Relevance to this Future Network Architectures Report
Issues and Catalysts RT 5.1 – Customer interface technologies and standards
Communications requirements for smart meters (bearers, protocols); AMM
Addressed in report
RT 5.2 – The networks of the future –information and communications
Architecture for communications, including control and metering
Requirement of VPP concept – very relevant.
RT 5.3 – Multiple energy carrier systems
Interconnection of different energy systems
Limited relevance to this report
RT 5.4 – Storage and its strategic impact on grids
Assessment and field testing of storage options
Storage identified as an aspect for further study, particularly economics aspects.
RT 5.5: Regulatory incentives and barriers
European energy market Doubtful whether this is relevant to most UK networks
RT 5.6 – Underpinning technologies for innovation
Wide-ranging scope (data management, high temperature conductors)
Data transfer between transmission system operators is an issue in Europe (UCTE)

APPENDIX C
GENERAL OBSERVATIONS ON THE FUTURE OF DG

C1 General Observations on the Future of DG As part of a commitment given by the Government in the Energy Review in July 2006, evidence was called for in November 2006 for a review of the barriers and incentives to DG. The review and any recommendations have yet to be published but the responses to the call for evidence are in the public domain and an edited selection of views are presented below as timely useful contribution to this report and a useful guide to the instruments that are being considered by actors in the industry.
C1.1 General duties of Ofgem A change in the statutory duties of Ofgem should be considered to give a higher priority to promotion of a sustainable energy system and consideration of wider energy policy objectives.1
C1.2 Distributed Price Control Despite strong representations from a number of DNOs, Ofgem specifically excluded any funding for general deep network reinforcement associated with potential DG2. In the longer term, the Government must identify whether particular investments form part of policy so that they may be incorporated within the future monopoly regulatory regimes of the network owners.3
An increase in distributed generation would require distribution networks to become more actively managed and implies a substantial investment in networks. This leads to the prospect of redundancy and stranded investments in otherwise long-lived assets in the event that DG does not take off. Investing for anticipated changes in generation could be inefficient. Plans for network developments should therefore incorporate features designed to mitigate the risks of stranded investments that would otherwise become a burden on customers and the industry.4
The Innovation Funding Initiative (IFI) should be extended to at least 2015 with a flat pass-through rate of 80%. There should be a removal of the cap on internal costs in the IFI mechanism, and of a mechanism to fund deep reinforcement to facilitate DG should be introduced.
C1.3 Licensing Reform Densely populated urban areas are and should be a principal target for reducing carbon emissions, including and in particular in the context of major urban re-generation schemes. Low and zero carbon energy schemes, involving one or all of combined heat and power, renewable sources of electricity and heat generation, and micro generation, are principal vehicles through which this can be achieved.
1 Nabarro Nathanson 2 Scottish Power 3 National Power 4 ibid

Such low and zero carbon energy schemes are dependent also upon distributed energy technologies and a regulatory and market environment which supports distributed energy. There are barriers presented by the regulatory and market structure within which distributed generation currently operates, most notably constraints contained in the Electricity (Class Exemptions from the Requirement for a Licence) Order 2001 upon which many distributed energy schemes rely. The removal of these constraints would promote distributed energy and with that, low and zero carbon energy schemes and the reduction of carbon output in urban areas. The removal of such constraints will assist in the creation of local wholesale markets in licence exempt electricity which will assist in the growth of such schemes and that of micro generation. To achieve that, it is necessary that the Class Exemptions facilitate the transport of electricity from one 'exempt' site to another and that the Class Exemptions do not prevent 'on site' or 'private wire' licence exempt supply to domestic consumers on the required scale.5
C1.4 Licensing Simplification Rather than increasing the licence exemption, it may be possible to introduce a simpler form of licence that responsible developers could sign up to for specific projects. This simpler form would make the developer responsible for satisfying a number of conditions, including safety, in the customers’ interest but be less complex than the current full licence obligations. The need for small-scale activities to be subject to some form of control may increase if such schemes form a substantial share of the total market.6
We believe that the way forward to encourage more distributed energy is the new generation energy centres - where an energy services company provides a packaged solution, tailor-made to the developer’s needs. To facilitate this, changes to the electricity class exemption rules would help remove barriers facing energy services companies (ESCOs) who are affiliated to existing licence holders. In addition, over the longer-term, consideration should be given to the creation of a new licensed ESCO entity at a reasonable size. 7
As an energy services provider we have found that the class exemption regulations for electricity licensing place limits on the economic potential for private wire networks and also do not reflect the demand for these green alternatives to meet relevant planning requirements. In our view, to allow ESCOs affiliated to existing licence holders to offer similar solutions to non-affiliated ESCOs, the 1MW electrical power limit on Distribution Class B and Supply Class C exemptions should be increased to 2.5MW. This would be in line with the Class A exemptions for small distributors and small suppliers, and would facilitate the provision of environmentally friendly energy services to the domestic market. Such a change would allow all
5 Nabarro Nathanson 6 National Power 7 SSE

parties to participate on a level playing field. We also suggest the current regulatory framework may act to constrain the development of the market in this field by limiting to 1MW the electricity generation capacity allowed for embedded developments with domestic customers. In the short-term increasing this to 5MW would facilitate the provision of ‘green’ energy services to the domestic market.8
If consideration were to be given to establishing a new licensed “ESCO” regime we believe that this would provide the appropriate safeguards for customers supplied via such projects. As an energy services provider we have taken the decision to provide equivalent standards of service to customers supplied. It is important to recognise that in order to make such projects financially viable and sustainable on a long-term basis, there is a need to “retain” customers contractually for a significant period of time. This is the trade-off that will have to be made between satisfying environmental/low carbon objectives via DG and facilitating supply competition via a centralised system.9
8 ibid 9 ibid

APPENDIX D
DISAGGREGATED GENERATION CAPACITY

Continuing Prosperity 2020 Environmental Awakening 2020 Power to the People 2020
Voltage Description Generation technology 2004 Dis-aggregated
2004 Total
Dis-aggregated
before adjustment
Disaggregated Total
Dis-aggregated
before adjustment
Dis-aggregated Total
Dis-aggregated
before adjustment
Dis-aggregated Total
> = 132 kV EHV: Uncontrolled Generation (GW)
Offshore & onshore wind 8.8 8.7 11.7 11.8 11 10.9
Marine generation Biomass Hydro Pumped storage Micro generation Nuclear
Large gas-fired units, inc
CHP
Coal and oil
> = 132 kV EHV: Uncontrolled Generation (GW)
8.7 11.8 11
> = 132 kV EHV: Synchronous Generation (GW)
Offshore & onshore wind
Marine generation Biomass 0.0 4.5 4.5 4.5 4.5 4.5 4.5 Hydro 0.5 0.6 0.5 0.6 0.6 0.6 0.5 Pumped storage 2.8 Micro generation Nuclear 11.9 8 7.9 7 7.0 7 6.9
Large gas-fired units, inc
CHP 25.6 41.2 40.9 32.2 32.3 28.8 28.5
Coal and oil 31.7 9 8.9 4.5 4.5 4.5 4.5
> = 132 kV EHV: Synchronous Generation (GW)
73.8 63 49 45
33 and 66 kV HV: Uncontrolled Generation (GW)
Offshore & onshore wind
Marine generation Biomass 0.0 1.5 1.5 2.5 2.5 1.5 1.5 Hydro 1.0 1.2 1.2 1.2 1.2 1.2 1.2 Pumped storage Micro generation Nuclear
Large gas-fired units, inc
CHP 2.8 1.4 1.4 1.4 1.4 1.4 1.4
Coal and oil
33 and 66 kV HV: Uncontrolled Generation (GW)
3.9 4 5.1 4

33 and 66 kV
HV: Asynchronous & Inverter Fed Generation (GW)
Offshore & onshore wind 0.4 2.2 2.2 2.7 2.7 1.8 1.8
Marine generation 1 1.0 1.3 1.3 1 1.0 Biomass Hydro Pumped storage Micro generation Nuclear
Large gas-fired units, inc
CHP 0.6 0.3 0.3 0.3 0.3 0.3 0.3
Coal and oil
33 and 66 kV
HV: Asynchronous & Inverter Fed Generation (GW)
1.0 3.5 4.6 3
6.6, 11 and 20kV
MV: Uncontrolled Generation (GW)
Offshore & onshore wind
Marine generation Biomass 0.0 1 1.0 2 2.0 1 1.0 Hydro 0.2 0.2 0.2 0.2 0.2 0.2 0.2 Pumped storage Micro generation Nuclear
Large gas-fired units, inc
CHP 1.6 0.8 0.8 0.8 0.8 0.8 0.8
Coal and oil 6.6, 11 and
20kV MV: Uncontrolled Generation (GW)
1.8 2 2.7 2
6.6, 11 and 20kV
MV: Asynchronous & Inverter Fed Generation (GW)
Offshore & onshore wind 0.3 0.3 0.3 0.6 0.6 0.0
Marine generation 0.0 1 1.0 1.3 1.3 1 1.0 Biomass Hydro Pumped storage Micro generation Nuclear
Large gas-fired units, inc
CHP 0.4 0.2 0.2 0.2 0.2 0.1 0.1
Coal and oil
6.6, 11 and 20kV
MV: Asynchronous & Inverter Fed Generation (GW)
0.7 1.5 2.2 1
LV
LV: Inverter Fed Uncontrolled Generation (GW)
Offshore & onshore wind
Marine generation 0.0

Biomass 0.0 Hydro 0.0 Pumped storage Micro generation 0.1 3 3.0 6 6.0 12 11.9 Nuclear
Large gas-fired units, inc
CHP 0.2 0.1 0.1 0.1 0.1 0.1 0.1
Coal and oil
LV
LV: Inverter Fed Uncontrolled Generation (GW)
0.4 3 6 12
Totals 80.1 81.6 86.3 85.7 85.7 81.0 81.4 81.4 78.8 78.0 78 Peak Demand (GW) 59.4 66 60 57
Offshore & onshore wind 0.7 11.3 11.2 6% 15.0 15.1 8% 12.8 12.7
Reconciliation with SuperGen Report Table 6 Marine generation 0.0 2.0 2.0 2% 2.5 2.5 2% 2.0 2.0
Biomass 0.0 7.0 7.0 10% 9.0 9.0 14% 7.0 6.9 Hydro 1.7 2.0 2.0 1% 2.0 2.0 1% 2.0 2.0 Pumped storage 2.8 0.0 0.0 0.0 0.0 0.0 0.0 Micro generation 0.1 3.0 3.0 3% 6.0 6.0 5% 12.0 11.9 Nuclear 11.9 8.0 7.9 11% 7.0 7.0 11% 7.0 6.9
Large gas-fired units, inc CHP 31.2 44.0 43.7 55% 35.0 35.2 52% 31.5 31.2
Coal and oil 31.7 9.0 8.9 12% 4.5 4.5 7% 4.5 4.5 Total GW 80.1 86.3 85.7 100% 81.0 81.4 100% 78.8 78.0 TWh 347 415 360

APPENDIX E
FEEDBACK FROM WORKSHOP

E.1 FEEDBACK FROM WORKSHOP A workshop was held on 4th April 2007 at PB’s Manchester office and attended by sixteen invitees from across the industry including distribution network operators (DNOs), manufacturers, consultants and representatives from Ofgem and the ENA. The workshop was based around the three future scenarios identified in section 2 of this report. The workshop agenda included break out sessions during which the network issues were examined in more detail for each of the three scenarios and reported back to the whole group. A final round up session discussed the opportunities for change and possible ways forward.
E1.1 Feedback on Scenarios The three scenarios were discussed at the start of the workshop and generated a lively debate. It was recognised that the scenarios can only be an indication of how the future may develop and that geographical influences make them difficult to apply across the whole of the UK. However the following can be taken as reasonable general assumptions:
• High levels of micro generation are most likely to develop in clusters i.e. new housing developments where each dwelling has generation installed as standard. These are also most likely to be in urban and suburban areas
• Community CHP schemes similar to the Woking1 project, delivering electricity, heat and cooling, are likely to develop in urban areas and be connected at 11kV or equivalent
• Small biomass plants up to 20MW likely to be connected at 11kV and 33kV
• Onshore wind projects are usually connected in rural areas where network issues are likely to be geographic specific and the wind generation could be connected at any distribution voltage level, depending on the capacity of the generation
• Future large offshore wind generation is likely to be connected onto the transmission network
E1.2 Feedback from Breakout Sessions Copies have been made of the flipcharts from the break out sessions and notes made of the discussions. The feedback from the sessions is summarised below.
1 http://www.woking.gov.uk/html/queensaward/W-17.pdf

Technical Issues Identified It quickly became apparent that many of the technical issues identified were common across the three scenarios. The five main issues were:
• Voltage rise
• Reverse power
• Increased short circuit fault levels
• Thermal constraints
• Limitations in SCADA and communication systems currently in use
Short circuit fault levels tend to be an issue on urban networks with short feeder lengths, particularly where direct 132/11kV transformation is used, or on interconnected networks as the source impedance is lower in these types of network. Alternatively, voltage rise tends to be an issue on rural networks with longer, small capacity feeder lengths and low network loads. Each of the scenarios could see geographical areas with high penetration of distributed generation resulting in similar issues arising in particular parts of the network across all scenarios. Other issues identified were the impact of DG on power quality and protection devices. There was also the concern that large penetrations of distributed generation will make it difficult for DNOs to assess the gross demand on the network. Better information regarding generator behaviour will therefore be required for network planning purposes.
E1.3 Non Technical Issues Identified Non technical issues identified were:
• Separation of supply and distribution businesses
• Who will take on the role of local aggregator for small scale generation and demand side participation
• Lack of incentives for DNOs to reduce the demand on the network
• Regulatory timescales may need to be reconsidered to pick up the challenge of 2020 EU vision for renewables
E1.4 Critical Technology Many of the technologies identified during the breakout session as being required for future networks are either currently available or in development. The following examples were given:
• Single phase LV voltage regulators are currently being used by at least two DNOs to solve voltage drop or rise issues on the LV network

• Fault current limiters are commercially available and although not currently used on UK distribution networks there are trials planned of the superconducting type on 11kV networks in at least three DNO areas
• A number of active network projects are currently being sponsored in the UK and Europe. The DTI have recently published a register of active management pilots, trials and research and development activities2
Smart meter technology is already being used in other European countries, for example Italy and Norway. There are also a number of trials taking place in the UK3,4
E1.5 Opportunities Asset replacement strategies and network design standards could provide the opportunity for change. The following examples were given:
• There is scope to understand existing assets better and optimise existing networks
• Modern transformer tap changers have reverse power capability and therefore this restriction on reverse power flow will be gradually phased out as existing transformers are replaced
• Specifying switchgear with higher rated short circuit capacity to increase fault level limits in the future
• Changing the practice of using tapered conductors on new installations to reduce voltage rise problems
• Introduction of new network configurations and /or voltage levels to provide additional thermal and fault level capacity
• Improved communication systems with embedded intelligence using new technology such as Intelligent Electric Devices (IED) to collect network data and send it back to a central location
• Adoption of a common communication protocol such as in the standard IEC 61850 for application to the control of networks with extensive distributed generation5
• Introduction of smart meters and new energy tariffs could be used to encourage changes to demand profiles
2 Register of Active management Pilots, Trials, Research, Development and Demonstration Activities, URN No. 06/1414, for the DTI3 http://www.visionmagazine.net/Vision06.asp?intID=122 ; also see http://www.logicacmg.com/pSecured/admin/countries/_app/assets/instant_energy_flyer_international-1122006.pdf 4 http://news.bbc.co.uk/1/hi/sci/tech/4754109.stm 5 International Electrotechnical Commission, IEC 61850, Communications Networks and System in Substations; a version entitled “Communications systems for distributed energy resources (DER)” is under development.

• Introduction of product standards for white goods to enable domestic demand side management participation
E1.6 Key Messages from the workshop The following key messages from the workshop were:
• Solutions must be cost effective
• Future network architecture must be flexible enough to cope with any or a combination of scenarios
• There is a need for an integrated approach to network architecture taking both primary plant and light current systems into consideration
• Many of the network issues identified for each scenario are common and could be resolved by similar methods or technologies
• There is a need for better information to optimise existing assets
• Many of the technologies required for future networks are available or in development
• Commercial and regulatory barriers are likely to be more material than technical barriers
E1.7 Conclusions The feedback from the workshop was very positive. Ofgem’s Innovation Funding Incentives scheme has encouraged Distribution Network Operators (DNOs) to look for innovative solutions and there has already been significant progress in terms of identifying new technologies, leading to a number of industry trials. Translating this into adopted solutions is an important next step. The development of future network architecture needs to take into consideration both existing network architecture to enable this to be better utilised by integrating intelligent new technology and “Greenfield” development where new technology could enable more efficient network topology and design. In both cases, future commercial arrangements and requirements need to be taken into consideration.

APPENDIX F
LETTER TO MEMBERS OF THE DWG

18 May 2007 All members of the DWG and supporting Project Groups As the new ‘Chair’ of DWG, I would like to alert you to an important piece of work that would benefit greatly from your informed view. As a DWG member, you will be aware that ‘Future Electricity Network Architectures’ is one of several projects being managed by the DWG ‘Horizon Scanning’ Project Group (PG1). This project has particular relevance in identifying how distribution networks might need to evolve, or be transformed, between now and 2020 in order to accommodate a higher penetration of DG and renewable energy sources. This has particular relevance to DNO’s in the context of the forthcoming 5th Distribution Price Review. The aim of the project is to explore potential network architectures based on the scenarios produced by the PG1-P01 Project ‘Supergen 2020 Scenarios’. The contract for this project has been awarded to PB Power who are undertaking the work with the support of the PG1 Advisory Group. In terms of progress to date: a workshop has been held in order to gather a wide range of industry views on how electricity networks could be developed over the next 15 years, taking account of the commercial, regulatory and environmental (as well as technological) implications. The overall feedback from the workshop was that an ‘evolutionary’ rather than ‘revolutionary’ approach to future network architecture could meet the 2020 challenges. However, there is concern that the workshop feedback may not have been entirely representative of the views of all companies; in particular, DNOs. In light of this concern, the Advisory Group for the project met last week and decided to take additional steps to ensure that they also capture the views of people who could not attend the workshop. The purpose of this message is to alert all DWG members to the opportunity to provide their input to this important work. In particular, as a DWG member, you might feel that you have a stronger insight into the drivers that will determine the requirements for future network architecture; especially in light of the EU 2020 binding targets for renewable energy. I believe it is important that the views of each company are captured and I would therefore urge you to seriously consider contributing to this work. If necessary, this can be achieved simply by participating in a conference call ‘meeting’ or even a telephone call to PB Power to express your views. Suggestions for alternative methods of engagement would also be welcomed. For further details, please contact Nicola Roscoe on Tel: 0161 257 5193 or email [email protected]. Nicola will be very happy to provide more information about the project and answer any queries you may have regarding participation.
c/o EDF Energy Networks Barton Road Bury St Edmunds IP32 7BG
edfenergy.com Tel +44 (0) 7875 115093
Email: [email protected]
EDF Energy Networks Ltd. Registered in England and Wales. Registered No. 3870728. Registered Office: 40 Grosvenor Place, Victoria, London, SW1X 7EN

Thank you in anticipation of your contribution; your views are valuable and will be much appreciated by the PG1 team. Dave Openshaw, Distribution Working Group Chair
edfenergy.com

Comments Received in Response to Dave Openshaw’s Letter Sohn Associates (extract from email received 21/5/2007)
• Rationalising of voltage levels - is 20kV the correct choice between 33 and 11kV? Is this better than say eliminating 11kV and using 33kV everywhere? If it hasn’t already happened, it would be useful to critique the economic justifications that various countries have made for selecting voltage levels, before doing a UK analysis. Obviously anything done in the past is unlikely to include the current DG scenarios we are now considering and it will be interesting to review other countries’ studies and superpose the DG requirements onto them.
• Radial v interconnected – radial is better if consumers and generators are reasonably unaffected by auto-changeover schemes. Nice link back to discussions on LF tripping of generators
• Simplicity v complexity – How many computer systems are required to support human beings’ decision-making at what level of complexity? How far should we go towards full automation? Should the Vision include something akin to the aircraft capabilities to fly by wire?
• Network layouts – perhaps this links to “strategic networks” – can we afford to perpetuate the habits of the past 25 years of developing networks “tactically” or “opportunistically” at the expense of good order and simple layouts (i.e. how many of the assets have “grown like topsy” and now require too much site-specific attention to every request for connection. This may be economic in terms of minimal cost by avoiding over investment, but does it yield a manageable network if the same approach continues for the next 25 years?
• Transmission v distribution. In the past, the 33kV network at one stage meant sub-transmission and then for a period the 132kV network was sub-transmission until the DNOs integrated it into the D Network (some DNOs did more if this than others). Should there be an interface between these networks or is it all one network. How far should we go in dismantling existing conventions and how should the future be characterised and defined in terms of network interfaces. Huge technical, commercial and regulatory issues here.
• Postulation v delivery. In future, perhaps no-one should be allowed to express a view of the future unless they are prepared to articulate how it will be delivered!!

EDF Energy (extract from email received 25/5/2007) The way forward is to apply new technology where it serves the strategic purpose but without losing the principle of 'simplicity' that is one of the inherent strengths of distribution networks. Notwithstanding some exciting revolutionary developments around power electronics, fault current limiters, network-friendly generators and storage, there is considerable room for development of diagnostic, information communication, control, protection, automation and state estimation technologies that can be applied to the basic network architecture to improve reliability, utilisation (e.g. dynamic ratings), supply quality, voltage control (and power factor), power quality, fault response, dynamic stability, power flow efficiency (and losses), safety and (not least) DG access - without undermining the simplicity of the basic design concept (which will continue to evolve anyway). So I think we are talking about network evolution with a revolutionary overlay. Voltage rationalisation is of course one of the potential synergies arising from the coincidence of timing between the need for a large scale condition-based network renewal programme, the need to deal with 'persistent' (and sometimes revolutionary) load growth (esp. summer load), and the need to integrate DG on a wide scale; that's where project P04 comes in. And as for the notional distinction between transmission and distribution - I think that needs to go back into the melting pot along with 'supply' and 'distribution' (and metering ownership). This is particularly pertinent to system balancing - taking on board the idea that DNOs could fulfil a potentially valuable role in maximising the opportunities surrounding large scale virtual power plants (LSVPPs) which could both optimise (distribution) network utilisation (inc. losses) and provide a (transmission) system balancing ancillary service through controlling demand and 'demand' side generation (i.e. microgeneration). The subtlety around DNOs providing this service (apart from any local network reinforcement offset benefits) is that the 'virtual power plant' could be defined in network-specific (and hence transmission interface-specific) terms, and take account of any network constraints or rerouting opportunities. This will become increasingly important as increased DG penetration (esp. intermittent technologies) will create the need for 'balancing' to devolve to a much greater level of disaggregation (i.e. further down the transmission-distribution chain). Indeed LSVPPs might also provide the equivalent of spinning reserve given their potentially fast response times. And talking of ancillary services, DNOs might also provide a range of Grid Code services such as reactive power, frequency response, fault ride-through and black start.

In conclusion - it seems to me that 'directed evolution' is what we need for the physical distribution networks; the 'revolution' that is needed is more around the way we perceive the commercial boundaries between networks; the increasingly non-existent distinction between transmission, distribution and (so called) 'demand-side' networks (electrons have never understood the distinction anyway); and our current inability to grasp the opportunities around balancing demand and generation across that complete network spectrum. CE Electric (summary of comments received via telephone & email 14/08/07)
• There is a lot of scope to better understand the capability of existing network e.g. dynamic ratings
• System modelling and control will come closer together enabling more accurate analysis of short term i.e. how much capacity is available on a half hour basis
• Parts of the network will develop differently i.e. drivers for change will only exist in certain areas. Other parts of the network will stay more or less the same e.g. need smart design, smart control and smart retro fit
• Interconnected networks – experience has been that communication required for protection e.g. pilot wires have maintenance implications. Distance protection may be a better option.
• Open ring with remote control and automation can go a long way to bring benefits for customer.
• Skills shortage - Need simple tools / guides to enable engineers to get the most benefit from new technology
• Aggregated dispatch or demand and generation. Need to agree who does it and why? How will the benefits and risk be shared? Could be done by DNO or supplier. Who would have first call? The Supplier trying to balance their portfolio or the DNO trying to balance the network?
• It is economic to upgrade from 6 to 11kV, as many firms have done, because the old 6.6kV cables can generally be re-used. However, the economics of upgrading from 11 to 20kV are currently unfavourable. Similarly, there has been relatively little down-rating from 20 to 11kV, again because the transaction costs are high. While 20kV has undoubted advantages, the economics of incremental network expansion mean that we tend to develop the two systems alongside each other. We would need a different regulatory framework to take the longer view of a wholesale change to 20kV to release headroom in fault level etc.
Other Comments Received Formal comments and contributions from SP Power Systems and United Utilities were received during project meetings and the drafting of the report.

APPENDIX G
SCOPE OF WORK
(Reproduced from the Statement of Requirement, Future Electricity Network
Architectures, (DWG PG1 – P02)

A summary of the DWG PG1 - P01 deliverables and conclusions, taking note
of additional information sources that may be available to compliment or augment these conclusions such as the July 2006 Energy Review.
Consider and recommend the network functionality that will be required for
each scenario out to 2020 taking account of the low carbon policy aims. Network functionality in this context includes the control and communications that may be required by ‘intelligent’ network users (producers and consumers of electricity) and a more sophisticated electricity market.
Based on the above functional specifications consider and recommend a
network architecture specification for each scenario. Each proposal should as a minimum detail, the voltage levels employed, a measure of the capacity required at each voltage level, the power flow management to be employed, the system control philosophy and the services that the networks will require from and offer to users. In the design, cognisance should be taken of existing infrastructure and the likely impact in terms of cost, customer benefit and likely disturbance to customers while migrating to the new configuration. Likely timings and an indication of the likely role-out schedule will demonstrate a real understanding of the issues that may be encountered and add credibility to any proposals.
Each network architecture specification should explain how the ‘light’(for
example communications and automation) and ‘heavy’ (for example switchgear and transformers) current designs come together into a fully integrated system. Any conflicts encountered in the design should be identified and where compromises have been embraced these should be justified. If ‘local’ design issues conflict with whole system design issues (whether technical, commercial, regulatory or environmental) they should be highlighted.
Highlight any specific equipment ‘challenges’ that may result from the network
architecture scenarios. Where possible existing global products should be considered rather than identifying UK specific product that would need special product development.
Although this is essentially a technical study, consideration should be given to
the commercial, regulatory and environmental implications of the developed scenarios.
The likely costs associated with the developed functional specifications should
be estimated as well as their impact on connection and use of system charging. A business case should be developed to substantiate the claims of the proposed architecture.

Provide a commentary on the likely transition from today’s networks to the future architectures proposed and highlight any specific transitional challenges as seen in short, medium and longer term.
Identify any similar studies, in Europe, North America and the Far East and if available compare recommendations and relevance to the UK network as it moves towards a low carbon approach.
If appropriate, recommend pilot projects that could significantly enhance the knowledge base and potentially deliver useable solutions.


