FUTURE Future Glasgow: Re-Clyde Environmental Challenges · Future Glasgow: Re-Clyde UNIT 5 FUTURE...
56
Future Glasgow: Re-Clyde UNIT 5 FUTURE CITIES Environmental Challenges
Transcript of FUTURE Future Glasgow: Re-Clyde Environmental Challenges · Future Glasgow: Re-Clyde UNIT 5 FUTURE...

Future Glasgow: Re-ClydeUNIT 5
FUTURE CITIES
Environmental Challenges

INTRODUCTION
It is the intention of this document to gather research regarding the environ-mental and ecological challenges currently surrounding the River Clyde.
The aim of the research was to focus specifically on issues that would be of importance adn relevance for future proposals within the urban environment
surrounding the river.
As such the document is broken down into serveal sub-sections that aim to disect each issue using the following methodology-
Introduce the environmental condition itself.
Highlight the situation as it is currently.
Produce a series of conclusions regarding the prospective benefits and the potential value to the immediate river context and the wider city.

Future Glasgow: Re-ClydeUNIT 5
FUTURE CITIES
Environmental Challenges
Climate Change in Glasgow City
Solar + Shadow Study in Glasgow City
Timeline of Climatic Change
Wind Records (Past and Now)
Temperature Change (Past, Now and Future)
Precipitation Change (Past, Now and Future)
Map of Wind Buffer through Urban Built Forms
River Clyde as Green Energy
Viable RE Techology for Clyde
PV + Wind Energy in Glasgow
Water Pollution
Water Bodies
River Clyde Quality Status
Overall Status of River Clyde
Surface Water Pollution(Human Activities Impact)
Water Quality For Aquatic Life(Dissolved Oxygen in River Clyde)
Water Quality For Bathing
Water Quality
Environmental Acts and Legislation relevant to River Clyde
Salmon Population and Chronology
Map of River Clyde Flooding Risk
Flooding Issues in Glasgow and River Clyde
Glasgow Extreme Flood Events
River Clyde Flood Management Strategy by City Council
Flood Defence Condition Assessmentby City Council
Case Study: Whitecart Water Flood Defence Scheme
Sustainable Urban Drainage Design (SUDS)
Types of Soils
Soil Permeability
Suitable Space for SUDS
Possible Management Train for SUDS
SUDS - The Management TrainsGlasgow Ecological
Network Map
causes
helps
mutual
impr
oves
improves
improves
( 1 ) ( 2 ) ( 3 )
( 4 )
( 5 )
( 6 )
SCOPEOF
STUDY
OFCONTENTS
Link and Relationship
Severe Events Records

Future Glasgow: Re-ClydeUNIT 5FUTURE CITIES
Environmental Challenges
Climate Challenge and Glasgow City
Observed Change in Scotland’s climate between 1961 and 2004
Temperature
Rainfall
Snow cover
Day of frost
Growing season
Sea Level
Recent temperatures are the highest in the records, with average annual temperature increasin 1°C be-tween 1961 and 2004. This applies across all seasons.
Annual precipitation increased by 21% between 1961 and 2004, with an almost 70% increase in winter pre-cipitation for Northern Scotland. Heavy rainfall event increased significantly in winter, particularly in north-ern and western regions.
There has been a 25% reduction in winter days with snow cover with even larger percentage decreases in spring and autumn. The snow season has shortened, starting later and finishing earlier in the year.
Since 1961 there has been a more than 25% reduction in the number of frost days across Scotland, with a downward trend since the 1980s.
The growing season is now nearly 5 weeks longer (comparing 1961 to 2004) with the greatest change occuring at the beginning of the season.
Sea level at all ports has been rising over the last cen-tury with the rate accelerating over the last two dec-ades (now exceeding 3-4mm/yr in 9 out of 10 ports).
(source: City Council Report)
Climate change, especially in the event of severe weather had brought several risk upon the society of Glas-gow: buildings and property, health, agriculture, transport system, water resources, and energy supply. On 15th January 1968, a violent gale swept central and southern part of Scotland, including Glasgow, leaving the city in devastated state. This was the worst gale ever recorded in UK, in terms of losses to the residential housing stock. This incident is partly due to poor quality and inadequate maintenance of tenement buildings in Glasgow City. Glasgow City Council immediately issued a policy for housing improvement after this event.
Extreme condition like the hurricane may only be prevented through meticulous planning and precau-tious measures. However in the 21st century, effect of global climate change, such as global warming had brought people into sense that emission of carbon must be minimized as much as possible for the good of future mankind.
This is no exception to Glasgow. As a settlement along the Clyde Estuaries, rising temperature would mean the rise of water level - increase of flooding risk.
Nevertheless, climate change might not solely contributed by man-made cause, but as a part of our Earth’s long cycle of nature. Figure on the right indicates different observed aspect of climate change throughout Scotland from 1961 to 2004, whereby some of the aspects exhibit interesting changes.
In the following sections, statistical data will be use to illustrate the magnitude and effect of climate change to Glasgow City and River Clyde. Inferences will henceforth be made from the study for further research pur-poses.
Figure 1.01: 1968 Scotland Hurricane Storm brought disaster to Glasgow City, 20 people were killed, 40 injured and 2,000 made homeless.
Figure 1.02: Observed Change in Scotland’s climate between 1961 and 2004

Future Glasgow: Re-ClydeUNIT 5FUTURE CITIES
Environmental Challenges
(source: City Council Report)Figure 1.04: Percentage of Severe Events Recorded in Glasgow
Figure 1.03: Numbers of Severe Events Identified(source: City Council Report)
Causes of Severe Events in Glasgow
According to Department for Environment Food & Rural Affairs (DEFRA) of UK, severe events refer to:
“The meteorological or statistical definition of extreme weather events are events at the extremes of the complete range of weather experienced in the past. Defined in this way, extreme weather events include, but are not limited to, severe events like heatwaves or intense rainfall. For example, the warmest day of winter can be described as a weather extreme.”
Glasgow city council had been working strategically to respond effectively to these extreme events. According to their report, more than 160 cases of severe event had been identified between year 1999 to 2009. Among these figures, wind (20%) and heavy rain (18%) are accounted for the detrimental impact to the city.

Future Glasgow: Re-ClydeUNIT 5FUTURE CITIES
Environmental Challenges
(source: City Council Report)Figure 1.06: Impacts of Heavy Rain in Glasgow
(source: City Council Report)Figure 1.05: Impacts of High Wind Events in Glasgow
Pie charts on the right indicate the major impact caused by both high wind and heavy rain respectively, in detail. It is important to note that one severe event may cause more than one impact.
As can be observed from these charts, damage to infrastructure is the most significant impact record-ed.
High wind events resulted in “dam-age to infrastructure” and “damage to buildings” more drastically. There-fore, stong wind as an environmental factor must be considered in future plannings especially in urban area with high density blocks of building.
Heavy rain events mostly causes “damage to infrastructure” and “damage to infrastructure & flood-ing”. Literally, heavy rain will cause city floods either from the river or area with impermeable surfaces. An effective strategy of drainage against these heavy rain events must be formulated in order to avoid further damage to the city infrastruc-tures.

Future Glasgow: Re-ClydeUNIT 5FUTURE CITIES
Environmental Challenges
(source: City Council Report)Figure 1.08: Damages to Infrastructure: Detail of Consequences
(source: City Council Report)
Figure 1.07: Impacts of High Wind and Heavy RainCombined in Glasgow
Another severe event that has the higher degree of effect is the event of combined high wind and heavy rain. Under constant strong wind blow and rain exposure, it can be imagined the great magnitude of damage to infrastructure coming from the extreme, which contributed to almost half of all impacts caused.
Damage of infrastructures have numerous of consequences, whereby the most significant of them is the disruption of road an rail travel, which in turns create car traffic jam and train network delay. Other significant damages include injuries to civilian, cost to business, and air travel distruption.
City council had been trying to response to these extremes more proactively instead of reactively. For example:
-Departments of Development and Regeneration Services (DRS) and Land and Environment Services (LES) receive regular weather forecast which in turn take precautious measures such as flood prevention and maintenance of the road network.
- Corporate Services (Custmer Care Centre, CCC) provides customer care to Glasgow citizens in enquiries to City Council’s response services.
-Arms Length External Organisations (ALEOs) in partnership with the council will take essential actions in the event of adverse impact caused by severe weather, prioritising treatment of citizen’s injuries.
Future city planners need to think more proactively to counter these severe events with more efficient ways of handling flooding risk, road planning and building heights consideration, for instances.

Climate Change- What does the river hold?

Future Glasgow: Re-ClydeUNIT 5
FUTURE CITIES
Environmental Challenges
Timeline Summary of Climate Change in Glasgow (1914-2080, 166 years span)
(For more details on climatic records, refer to subsequent pages)
Scenario of Climate Change:
-Higher carbon emission -> Mean Temperature Increase -> More precipitation and water -> Water runoff and fl ooding issues

Future Glasgow: Re-ClydeUNIT 5FUTURE CITIES
Environmental ChallengesEnvironmental Challenges
Prevai l ing Wind Direct ion + Speed in Glasgow
Glasgow climate is classified as Oceanic, despite the city is located on the northern latitude. Glasgow City has a typical wind direction coming from South West throughout the year, just like the rest of United Kingdom. However, the frequency of strong wind and gales in Scotland are higher than any other part in the UK, due to the passing of many of the major Atlantic depressions.
In major towns and cities of Scotland, strong winds are significantly buffered by the building blocks. However, depending on the arrangement and density of building blocks, wind funneling may form as a result thus the funneled wind will gust about the same speed of typical strong wind. Strong wind will cause damage to buildings and trees during major storms.
It is also notable that wind speed increases with elevation height. High building or high ground area will experience the effect of strong wind more drastically than low ground area. Therefore, skyscrapper building is not favoured in Scotland due to this factor as one of the many reasons.
Figure 1.11: Annual Windrose diagram of Glasgow, prevai l ing wind stat ist ics based on direct ion and speed record-ed on total hours basis. (Source: WeatherTool)
Figure 1.09: Stat ist ics based on observat ion taken between Nov 2000- Sep 2014 dai ly f rom 7am to 7pm local t ime. (Source: Windf inder)
Figure 1.10: Wind f low diagram i l lustrat ing the change of wind f low agaist di fferent height elevat ion and buffer effect .

Future Glasgow: Re-ClydeUNIT 5FUTURE CITIES
Environmental ChallengesEnvironmental Challenges
Figure 1.12: Monthly Windrose diagram of Glasgow, showing the comparison of prevai l ing wind distr ibut ion between months. (Source: WeatherTool)

Future Glasgow: Re-ClydeUNIT 5FUTURE CITIES
Environmental Challenges
The figure shows a gentle decrease of wind speed over roughly 30 years, from approx. 12.5 knots to 11.8 knots, for Western Scotland (includes Glasgow). This decrease is minor compared to Northern Scotland, which shows a significant decrease of 14.1 knots to 11.4 knots.
Decreased wind speed is not an optimistic prospect for energy generation by wind turbine, because it would mean power will be generated with lower efficiency, hence raising energy costing.
According to SNIFFER report, it is still hard to predict the future change of wind speed, but a change of ± 5% is typical.
The highest wind speed in 2014 was recorded on 20th March with the speed of 17 m/s (33 knots).
Scotland has rapid development and reliance on wind as a source of renewable energy by building wind farms at strategically open plains with high wind. Glasgow as a city, considering the topography and various urban factors such as public safety, it is impractical to deploy wind turbine in city area. However, Glasgow City Council could focus on developing more watersports activities like sailings, jetski-ing and kayaking. South west wind will be ideal for crossing the river from south bank to north bank, which is the City Center areas. Therefore, even though wind is not suitable to harness as energy source, it can help promote the industry of leisure sports or tourism.
Past Wind Records
Harnessing the Wind as a Resource
Figure 1.13: 1969-2003 Annual Mean Wind Speed for Scotland (3 Scottish Districts), with smoothed curves
Note: Glasgow City belongs to West Scotland
(source: SNIFFER, Met Office)
Figure 1.14: Daily Min and Max Wind Speed from Nov 2013 - Nov 2014(source: Weatherspark BETA)
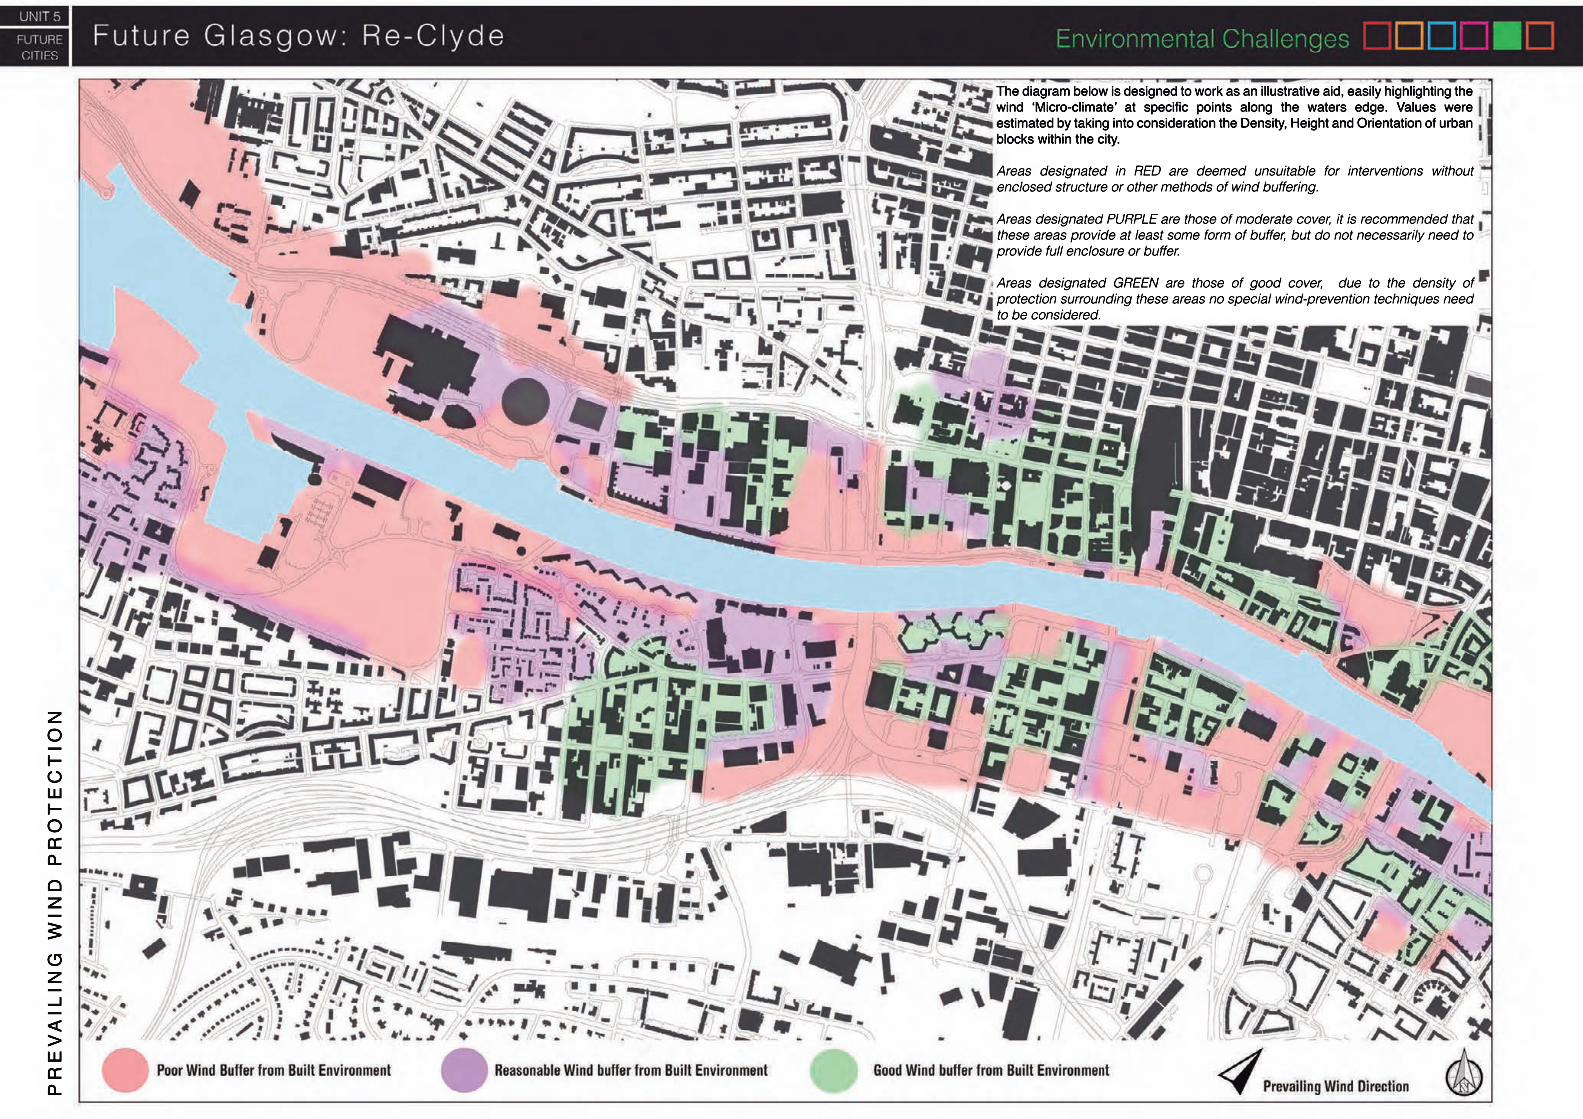
The diagram below is designed to work as an illustrative aid, easily highlighting the wind ‘Micro-climate’ at specific points along the waters edge. Values were estimated by taking into consideration the Density, Height and Orientation of urban blocks within the city.
Areas designated in RED are deemed unsuitable for interventions without enclosed structure or other methods of wind buffering.
AAreas designated PURPLE are those of moderate cover, it is recommended that these areas provide at least some form of buffer, but do not necessarily need to provide full enclosure or buffer.
Areas designated GREEN are those of good cover, due to the density of protection surrounding these areas no special wind-prevention techniques need to be considered.
PREVAILING WIND PROTECTION

Future Glasgow: Re-ClydeUNIT 5
FUTURE CITIES
Environmental Challenges
Pattern of Temperature Change
Figure 1.16: 1914-2004 Annual Mean Temperature for Scotland (3 Scottish Districts), with smoothed curves
Note: Glasgow City belongs to West Scotland
(source: SNIFFER, Met Offi ce)
The climate of Glasgow City (West Scotland) has a mild temperate setting compared to the cities of Eastern Scotland, due to stronger maritime infl uence (prevailing wind blowing from the Atlantic sea). Glasgow being a city, generates urban heat island effect and thus achieving a mean temperature that is the same to west coastal areas such as Ayshire, Bute and Kintyre, despite the city settlement situated in midland area.
Strong maritime control over temperature can be observed from the difference between mean temperature of the warmest and coldest months. The smaller the temperature range, the greater the infl uence of maritime setting.
As the sea hits the lowest temperature in February or Early March, the western coastal areas has coldest month in February generally. Regardless of that, Glasgow coldest month is still around January to early February.
The warmest months in West Scotland typically are July and August, which is the summer season.
Cycle of Temperature Change in Glasgow
Past Temperature Change
Past records (1961-2004) proves that climate change occured over the span of 43 years, with West Scotland’s temperature rose by 1.06 °C.
Climate change might be the source of cause for these severe events. Rising temperature will affect rainfall especially, and thus increasing the risk of city fl ooding. Therefore, scrutinising at the detail of temperature change in Glasgow is paramount, in order to plan the future cities in response.
PAST

Future Glasgow: Re-ClydeUNIT 5
FUTURE CITIES
Environmental Challenges
Glasgow City has an average temperature of 8.9°C by year 2014. The last recorded coldest day was 22th Nov 2013 (-6 °C) and the hottest day was 25th July 2014 (28 °C). From the chart, it can be seen that the period of April-October has a slightly greater range of deviation as opposed to November-March.
Current Temperature Records
Figure 1.18: Daily Min, Max, and Mean Temperature from Nov 2013 - Nov 2014Figure 1.17: Annual Mean Temperature Map Across Scotland 1971-2000
Note:The daily min (blue) and max (red) temperature during the last 12 months with the area between them shad-ed gray and superimposed over the corresponding averages (thick lines), and with percentile bands (inner band from 25th to 75th percentile, outer band from 10th to 90th percentile). The bar at the top of the graph is red where both the daily max and min are above average, blue where they are both below average, and white otherwise.
(source: Weatherspark BETA)(source: Met Offi ce)
NOW

Future Glasgow: Re-ClydeUNIT 5
FUTURE CITIES
Environmental Challenges
A probabilistic prediction model produced by DEFRA was used to predict the future change of mean temperature by level probability and 3 different emission scenarios (High, Med, Low).
Emission scenario is “a plausible representation of future development of emissions of substance (such as greenhouse gases and aerosols) that can affect the radiative balance of the globe” and based on “assumptions about determining factors (such as demographic and socio-economic development, technological change)” and key relationships.
As projected by the mathematical prediction, it is shown that by mid 21st century (approx. 2050), mean temperature in Glasgow would increase by 1.5-4.0 ºC with high emission rate (implying lack of green control in city). The range of uncertainty, presented as the highlighted area in graph, has a narrow volume which means this prediction is more certain with all factors in consideration.
Suppose that increase of 2 ºC is bound to happen in 35 years time, fl ooding risk would increase by correlation and thus creating more city problems in Glasgow. Furthermore, in another 50 years time, temperature in Glasgow would still continue to rise linearly with probably another 2 ºC. Therefore temperature rise is not a problem that Glasgow can overlook, being a city settled around a river.
Other impacts of temperature rise include:
- increase in summer heat wave- increase in frequency and intensity of extreme precipitation- reduced occurence of frost and snowfall- continual rise of sea level
Figure 1.19: Prediction of Future Change in Temperature in Glasgow ranging from year 2010 to 2099 with High Emission Scenario(source: DEFRA, UK Climate Projection)
FUTURE
Probabiliy-based Future Change of Temperature Estimation

Future Glasgow: Re-ClydeUNIT 5
FUTURE CITIES
Environmental Challenges
Figure 1.20: Prediction of Future Change in Temperature in Glasgow ranging from year 2010 to 2099 with Medium Emission Scenario(source: DEFRA, UK Climate Projection)
In Medium Emission Scenario, predicted rise of mean temperature is relatively lower, but range of uncertainty is greater. The predicted change of temperature by 2050 is approximately 1.0-3.5 ºC.
FUTURE

Future Glasgow: Re-ClydeUNIT 5
FUTURE CITIES
Environmental Challenges
Figure 1.21: Prediction of Future Change in Temperature in Glasgow ranging from year 2010 to 2099 with Low Emission Scenario(source: DEFRA, UK Climate Projection)
If people were to adapt to greener lifestyle and adopt sustainable approach against environmental issues, lower emission of gas substances would certainly happen. In Low Emission Scenario, the higher strand of probability curve is lowered by around 1ºC. The predicted change of temperature by 2050 is approximately 1.0-3.0 ºC, which does not differ much from Medium Scenario.
FUTURE

Future Glasgow: Re-ClydeUNIT 5
FUTURE CITIES
Environmental Challenges
Pattern of Precipi tat ion Change
Past Precipitation Records
Western Scotland has the highest annual precipitation amount (compared to two other districts). Contrary to popular beliefs that Scotland generally has high rainfall, it actually varies according to topography. For example in the below fi gure, the northern part of West Scotland (Loch Lomond area) had high average value of Rainfall Amount between 1971-2000. In contrast, Glasgow region in comparsion is very low on Rainfall Amount, about only 700-1300mm annually.
Precipitation amount amount for Western Scotland had remained quite consistent in the past 100 years, showing little rise and fall. However at the beginning of 1968 approximately, there was a uprising trend which increased the annual amount by 23% at year 2004.
The question in play is, did the economic and cultural renaissance at mid-80s in Glasgow contributed to the factor (leading to more urban development)? Or was it a natural cycle of Earth?
Figure 1.23: 1914-2004 Annual precipitation amount (mm) for Scottish regions,with smoothed curve
Figure 1.22: 1971-2000 Annual Average Rainfall Amount Map
Note: Glasgow City belongs to West Scotland
(source: Met Offi ce)(source: SNIFFER, Met Offi ce)
PAST

Future Glasgow: Re-ClydeUNIT 5
FUTURE CITIES
Environmental Challenges
Present Precipitation Records
Even thought Glasgow is situated at the driest part of Western Scotland (as shown in previous fi gure), rainfaill still occured regularly in light amount but long duration. For example, Glasgow has a 23hour of rainfall on 3rd Apr 2014. From the chart, it can be seen that around the period of Oct to Apr is the rainiest of the year.
Snowfall became extremely short in hours and only occured on selective days on Winter 2013/14.
Thunderstorm is also rare in occurence and happens occassionally throughout the year.
Making observation on the chart would implies that Glasgow has light drizzle regularly in the current climate.
Annual mean precipitation in Glasgow is typically 1100mm, where the driest weather is in May (63mm of rainfall) and wettiest weather is in December (127mm of rainfall).
Figure 1.24: Nov 2013-Nov 2014 Observed Hours of Precipitation in Glasgow
Note: The daily number of hourly observed precipitation reports during the last 12 months, color coded according to pre-cipitation type, and stacked in order of severity. From the bottom up, the categories are thunderstorms (orange); heavy, moderate, and light snow (dark to light blue); heavy, moderate, and light rain (dark to light green); and drizzle (lightest green). Not all categories are necessarily present in this particular graph. The faint shaded areas indicate climate nor-mals. The bar at the top of the graph is green if any precipitation was observed that day and white otherwise.
Figure 1.25: Annual Mean Precipitation in Glasgow
Annual Precipitation = 1109mm
(source: Weatherspark, BETA)
(source: Climatemps)
NOW

Future Glasgow: Re-ClydeUNIT 5
FUTURE CITIES
Environmental Challenges
Probabiliy-based Future Change of Temperature Estimation
Verdict of Climate Change Investigation
Figure 1.26: High Emission Scenario Change of Summer Precipitation in Glasgow, 2010-2099
Figure 1.27: High Emission Scenario Change of Winter Precipitation in Glasgow, 2010-2099
(source: DEFRA, UK Climate Projection)
(source: DEFRA, UK Climate Projection)
Change in precipitation correlates with the change in temperature. The higher the temperature, the more polarised the climatic extreme will be.
Based on the same probabilistic prediction model, summer will become drier and winter becoming wetter. By approx. 2050, summer will have roughly 8% lesser precipitation amount and 30% more in winter.
Therefore on the same basis, it can be assumed that global warming would cause higher degree of impact to winter rather than summer, which translates to drastic increase of fl ooding risk in Glasgow City.
In summary, climate change is inevitable whether being part of earth natural cycle or man-made caused warming. In the coming 80 years, city planners will be facing expanding set of challenges as opposed to the existing problems, especially the increased risk of fl ooding. Adopting a measure of proactive rather than reactive should always come at the highest priority. For instance, new systems such as Sustainable Urban Drainage System (SUDS) should be constantly and strategically implemented throughout towns and cities to mitigate fl ooding risk as much as possible. Public education about greener lifestyle may also help in raising awareness of climatic issues, which will ultimately reduce emission indirectly in the city, thus lowering the probability of temperature rising.
At this instant, Glasgow City Council made several attempts such as policy control or strategic response to mitigate impact of climate change as much as possible. On the other hand, city planners should study more on climatic issues and come out with sustainable approach in planning process, to embrace the future contigencies that will happen soon in decades.
FUTURE

Future Glasgow: Re-ClydeUNIT 5
FUTURE CITIES
Environmental Challenges
Solar and Shadow Study for Glasgow City
Figure: Stereographic Annual Sunpath of Glasgow, Study of Typical Shadow ProjectionFigure: Stereographic Sunpath of Glasgow in 3D, showing length of projected shadow. (source: SolarTool)
(source: SolarTool)
Glasgow City is situated on the Northern Hemisphere with the coordinate of 55.89 °N (Latitude), 4.26 °W (Longitude). Sun position hovers around south side relative to Glasgow position.
Sunpath of Glasgow
Sun in Glasgow typically has a low altitude angle around the period of dawn and evening, therefore result in the projection of long and sharp shadows (as shown in Figure)
N
N
Noon12:30
Afternoon16:30

Future Glasgow: Re-ClydeUNIT 5
FUTURE CITIES
Environmental Challenges
In order to achieve passive solar design, facing orientation of buildings must be considered. Based on simulation software, the optimum building orientation in Glasgow was calculated based on the warmest and coldest months. The result is building facing South West, more accurately at 20° SE has the best orientation.
Maximum solar gain can be achieved with building’s longitudinal facade facing this direction. In contrast, the worst angle of a build is 70 ° NE, which has the least solar radiation exposure.
In a cold climate setting, solar gain should be valued in design process for passive heat gain in buildings. However, by studying the building orientations in the Glasgow urban area around River Clyde, it can be observed that buildings in Glasgow typically facing South-West.
This condition may be affected by the geographical orientation of River Clyde, supposing that Glasgow settlement sprawl out along the normal direction of the river, which goes in the direction of South-West or North-East, resulting in most of the built building orientation.
Best Orientation for Building Blocks
Figure: Calculated Optimum Building Orientation in Glasgow based on Climatic Setting Figure: Classifi cation of Building Zones based on Quality of Orientation(source: WeatherTool)

Scotland's greenhouse gas emissions only account for 10% of the UK's emissions,[1] in 2003 when figures were published. 37% of Scottish emissions are in energy supply and 17% in transport. Between 1990 and 2007, Scottish net emissions have reduced by 18.7%.[2] The industrial processes sector had the largest decrease, of 72% with a reduction of 48% in the public sector trailing closely behind.

Future Glasgow: Re-ClydeUNIT 5
FUTURE CITIES
Environmental ChallagesEnvironmental Challages
RIVER CLYDE AS GREEN ENERGYREINVENTING THE CLYDE?
Ecological Footprint
This measures human demand on the Earth’s ecosystem.
It does so by comparing human demand with the Earth’s
ecological ability to regenerate.
Humanity’s total ecological footprint
Glasgow’s ecological footprint
We need 3.6 earth if everyone would live like the aver-
age Glaswegian use of ecological footprint
Scotland Climate Change Act 2009
Status: Pilot project
Place: Glasgow river Clyde
Kind of energy: Solar power
Sponsor: ZM Architecture/
Glasgow City Council
Status : Pioneer method
Place: Rivers and Sea
Kind of energy: Vortex/Hidro power
Sponsor:University of Michigan
Status: Future project
Place: Thames river
Kind of energy: Heat power
Sponsor: City council
Status : Future project
Place: River Clyde
Kind of energy: Hydro power
Sponsor: Glasgow city council

Future Glasgow: Re-ClydeUNIT 5
FUTURE CITIES
Environmental Challenges
United Kingdom, especially Scotland experiences all year overcast and cloudy sky, resulting in rare appearance of intense sunshine.
As shown in the maps, installing solar PV panels (horizontally mounted or optimally-inclined) in Glasgow would have medium to low solar energy effi ciency, in contrast to a higher reading of effi ciency in South of England.
Solar radiation generally peaks around the period of May-July due to the climate condition of Summer season. In contrast, the period of Nov-Jan has the least exposure to sunlight because of Winter season. Therefore a sensible strategy here is to store excess energy during the summer season and discharge them for winter heating use.
Feasibility Study of Photovoltaic Panels Installation in Glasgow
(source: European JRC)
(source: University of Strathclyde, Engineering Department)
(source: European JRC)
Figure 2.06: Yearly Sum of Solar Irradiance Map across United King-dom for Horizontally Mounted PV Modules
Figure 2.05: Annual Solar Irradiance of Glasgow(2.66kWh/m2/d average, 0.38kWh/m2/d min, 5.06kWh/m2/d max)
Figure 2.07: Yearly Sum of Solar Irradiance Map across United King-dom for Optimally-Inclined PV Modules
Yearly sum of global irradiation
[kWh/m2]
Yearly sum of solar electricity
generated by 1kWp with per-formance ratio
0.75[kWh/kWpeak]
Yearly sum of solar electricity
generated by 1kWp with per-formance ratio
0.75[kWh/kWpeak]
Yearly sum of global irradiation
[kWh/m2]
MEDIUM-LOWSOLAR ENERGY
EFFICIENCY
MEDIUM-HIGHSOLAR ENERGY
EFFICIENCY
HIGHSOLAR ENERGY
EFFICIENCY
MEDIUMSOLAR ENERGY
EFFICIENCY

Future Glasgow: Re-ClydeUNIT 5
FUTURE CITIES
Environmental Challenges
WIN
DS
OL
AR
WIN
D+S
OL
AR
(source: University of Strathlcyde, Engineering Department)
Figure 2.08: Annual Demand and Supply of Solar Energy, Wind Energy and Accumulative Renewable Energy, Estimation by MERIT Simulation based on Springburn, Glasgow
Less Demand of Energy, More Supply of Renewable Energy
More Energy Demandfor Heating
More Energy Demandfor Heating
The pattern of energy demand in Glasgow is quite linear: Rise during the winter because of more energy is required for spatial heating, falls during the summer because no heating is needed.
A feasibility study of the potential of renewable energy for Springburn, Glasgow, had been carried out by University of Strathclyde. Model of simulation based on recorded data was used to project energy demand of the town and supply of renewable energy which are solar and wind specifi cally.
Assumption was made that 10400 house roofs were equipped with PV panels and wind turbines were installsted in the vacant land around Springburn. It was observed that solar energy and wind respectively cannot adequately meet the demand of energy in Springburn (despite solar readings are higher), unless combined.
As a conclusion, solar roofs are more suitable for mass energy generation and local wind turbines for microgeneration.
Simulated Supply and Demandof Renewable Energy

Future Glasgow: Re-ClydeUNIT 5FUTURE CITIES
Environmental ChallagesEnvironmental Challages
WATER POLLUTION
Environmental Challages
Within our extent areas of analysis, River Clyde consisted of 2 river bodies (classified by Water Framework Directive) which is Clyde Estuary-Outer and Clyde Estuary - Inner (inc Cart) . This division is to
reduce the likelihood of significant differences in natural characteristics occurring within any one water body. The identification of surface water bodies needs to proceed by a series of steps to ensure that
the bodies that are identified represent the most suitable management units. (See Water Framework Directive in Scotland)
WATER BODIES
Notes:
What is Water Framework Directive?
The Water Framework Directive (the Directive)1 is a wide ranging and ambitious piece of European environmental legislation. The Directive is transposed within the Scotland river basin district via the Water
Environment and Water Services (Scotland) Act 2003 (WEWS Act). The Directive’s overall objective is to bring about the effective co-ordination of water environment policy and regulation across Europe in or-
der to: prevent deterioration and enhance the status of aquatic ecosystems, including those dependent on groundwater; promote sustainable water use; reduce pollution; help reduce the effects of floods and
droughts.
Figure 2.2 : Steps involved in identifying water Bodies Figure 2.1 : Two water bodies in River Clyde
Reference : Water Framework Directive in Scotland); SEPA - The Future For Scotland’s Waters

Future Glasgow: Re-ClydeUNIT 5FUTURE CITIES
Environmental ChallagesEnvironmental Challages
WATER POLLUTION
According to Water Framework Directive (WFD) ,the classification of surface water status are
based on its :
A) Ecological status
B) Chemical Status
A) Ecological Status
The classification of ecological status of a river is from “High”, “Good” , “ Moderate” , “Poor” to
“Bad” . High status represents only very minor changes to the hydromorphology, physico-chem-
istry and biology of a water body. Good status requires no more than slight changes to the bi-
ology of the water body and compliance with quality standards for pollutants. The other status
classes are defined according to the level of impact upon their biology.
Environmental Challages
RIVER CLYDE WATER QUALITY STATUS
Figure 2.4 : Requirements for the Different
Status Class
Figure 2.5 :Status Classification and Environmental Objec-
tives for Surface Waters
Figure 2.3 : Ecological status of Clyde Estuary Outer and Inner in 2012
Reference : SEPA - The Future For Scotland’s Waters
B) Chemical Status
Good surface water chemical status is achieved when the
chemical content in the water does not exceed the Environ-
mental Quality Standards that have been established under
Dangerous Substances Directive (76/464/EEC). They will also
include quality standards for any priority substances, and
groups of such substances identified for Community level ac-
tion under the Water Framework Directive.
Future Glasgow: Re-ClydeUNIT 5FUTURE CITIES
Environmental ChallagesEnvironmental Challages
WATER POLLUTIONRIVER CLYDE WATER QUALITY STATUSB) Chemical Status
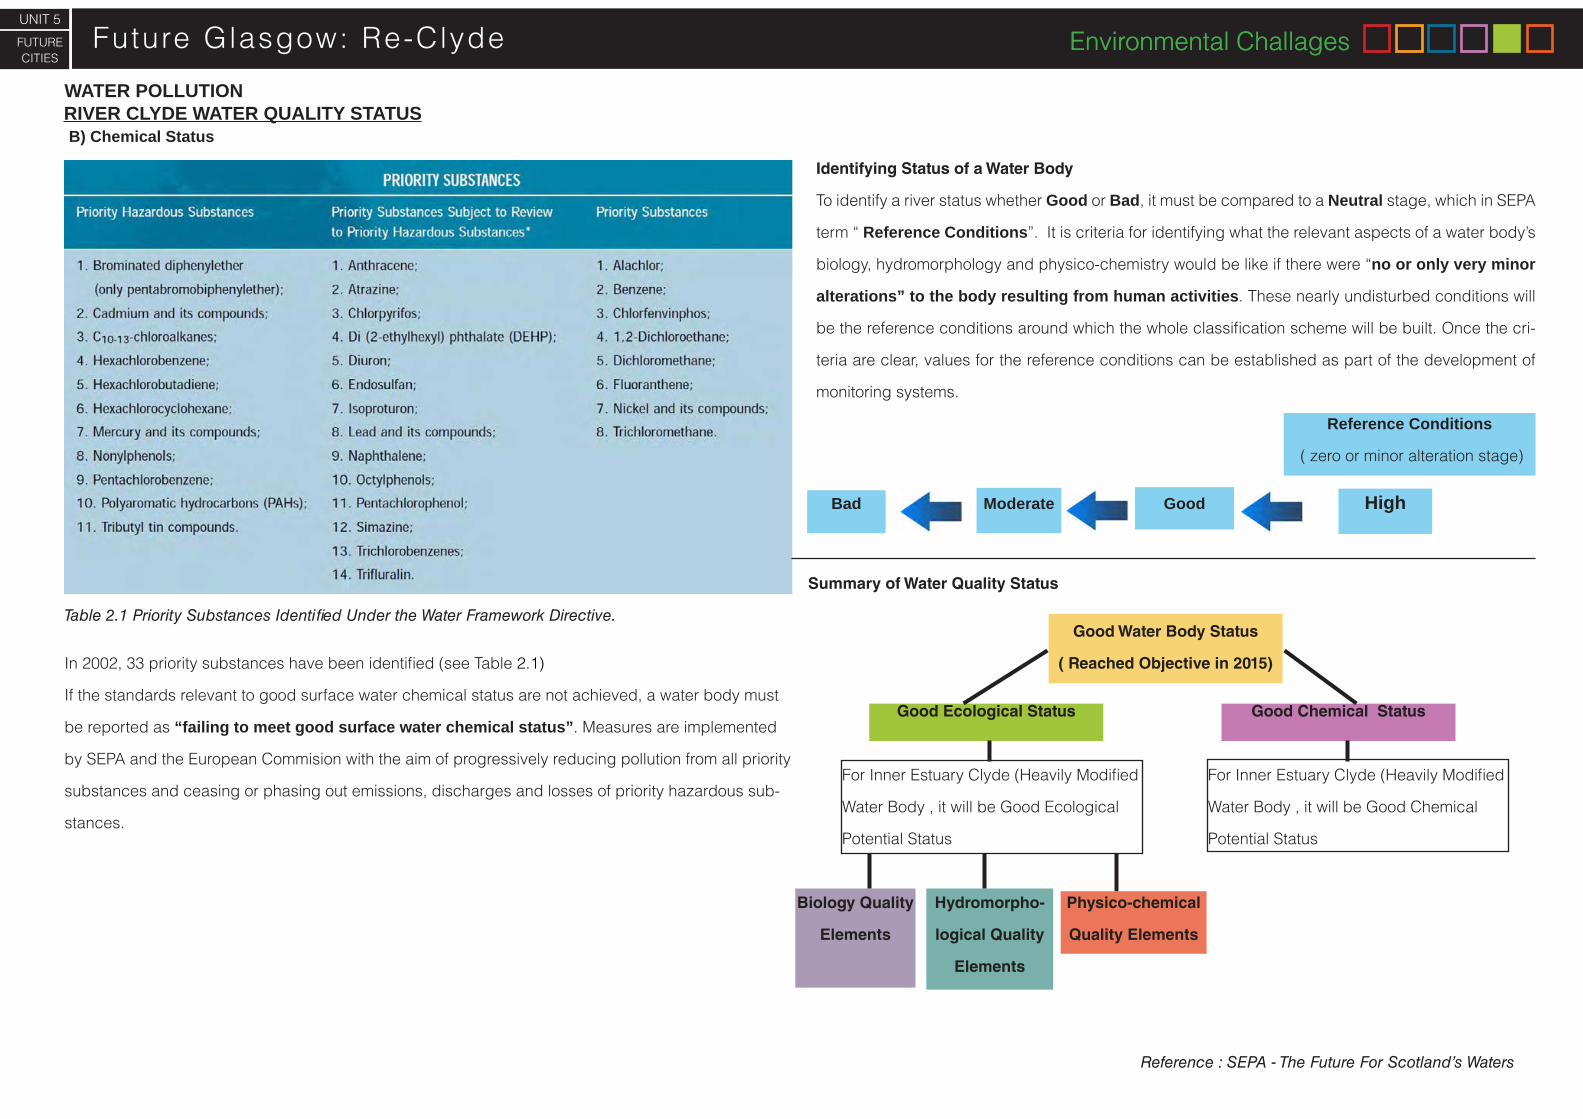
In 2002, 33 priority substances have been identified (see Table 2.1)
If the standards relevant to good surface water chemical status are not achieved, a water body must
be reported as “failing to meet good surface water chemical status”. Measures are implemented
by SEPA and the European Commision with the aim of progressively reducing pollution from all priority
substances and ceasing or phasing out emissions, discharges and losses of priority hazardous sub-
stances.
Table 2.1 Priority Substances Identified Under the Water Framework Directive.
Identifying Status of a Water Body
To identify a river status whether Good or Bad, it must be compared to a Neutral stage, which in SEPA
term “ Reference Conditions”. It is criteria for identifying what the relevant aspects of a water body’s
biology, hydromorphology and physico-chemistry would be like if there were “no or only very minor
alterations” to the body resulting from human activities. These nearly undisturbed conditions will
be the reference conditions around which the whole classification scheme will be built. Once the cri-
teria are clear, values for the reference conditions can be established as part of the development of
monitoring systems.
Reference Conditions
( zero or minor alteration stage)
GoodBad HighModerate
Summary of Water Quality Status
Good Water Body Status
( Reached Objective in 2015)
Good Ecological Status Good Chemical Status
For Inner Estuary Clyde (Heavily Modified
Water Body , it will be Good Ecological
Potential Status
For Inner Estuary Clyde (Heavily Modified
Water Body , it will be Good Chemical
Potential Status
Biology Quality
Elements
Hydromorpho-
logical Quality
Elements
Physico-chemical
Quality Elements
Reference : SEPA - The Future For Scotland’s Waters

Future Glasgow: Re-ClydeUNIT 5FUTURE CITIES
Environmental ChallagesEnvironmental Challages
WATER POLLUTION
A release of effluent or other matter to the water environment or
land, via a fixed installation, pipe, outlet or otherwise. Typically,
discharges will be made directly to water. Authorised point sourc-
es are all those sites that have consents to discharge at a specif-
ic place, like sewage works or industrial discharges.
Changes pertaining to geological structure or
earth surfaces
Diffuse pollution arises from land use and man-
agement
Point Source Pollution Morphological Alterations Diffuse Source Pollution
Point Source Pollution
Morphological Alterations
Diffuse Source Pollution
• sewage disposal
• Land drainage
• mixed farming
• mining and quarrying
• construction
• transport
• land drainge
• manufacturing
• electricity, gas and water supply
Example of Causes
SURFACE WATER POLLUTION - PRESSURE (HUMAN ACTIVITIES IMPACTS)The pressure and impact analysis reviews the impact of human activity on surface waters and on
groundwater. It identifies those water bodies that are at risk of failing to meet the Water Framework
Directive (WFD) ’s environmental objectives. The definition of the term “Pressure” used by WFD is the
general categorisation of human activities that contribute to water pollution based on how the pollut-
ers are discharged to the water bodies (river / lakes ). The “causes/sources of Pressure” describes
the specific human activities that causes the water pollution.
The reason WFD carried out these assessment oare to measure whether they are able to meet 2015
Objective : to achieve ‘good status’ for all surface waters by 2015. ‘Good status’ means both
‘good ecological status’ and ‘good chemical status’.
For the water bodies such as rivers that fail to meet the ‘Good’ status , it is considered ‘At Risk’.
Based on Sepa analysis on Clyde Estuary-Outer and Inner, both river bodies are “At Risk” through
different Assessment Parameter such as Colonial Tunicate, Leathery Sea Squirt, Nitrogen, and UK
Specific pollutants.
• Livestock grazing
• Cultivation of land,
• Run-off from urban areas and forestry activities.
• Sewage and trade effluent
• Surface water discharges from urban areas
• Abandoned mine discharges.
• Land claim
• Shoreline reinforcement -Physical barriers (such as flood defences, barrages and sluices)
Reference : SEPA Surface waterbodies risks and issues
Exa
mp
le o
f ’C
ause
s o
f P
ress
ure
’Ty
pes
of
Pre
ssu
re

Future Glasgow: Re-ClydeUNIT 5FUTURE CITIES
Environmental ChallagesEnvironmental Challages
WATER POLLUTION
Notes:There are a number of airport activities which has the potential to cause river pollution if not properly managed:• De-icing of aircraft and airside areas• Vehicle and aircraft washing• Aircraft and vehicle maintenance• Run-off From construction sites• Aircraft refuelling• Waste and cargo handling • Fire training activities (Source: Glasgow Airport Draft Master Plan 2011)
• Sewage Disposal
• Air Transport (Air-port)
• Change timing or frequency of discharge• Reduce Point Source
• Inputs
• Increase treatment
• Channelisation/realign-ment/ straightening • Recreational activities Impounding - weir / dam
• Improve Modified Hab-itat
• Sewage Disposal
• Organic Disposal
• Reduce Organic waste
• Sewage Disposal
• Change timing or frequency of dis- charge• Relocate all or part of discharge
• Water transport(sea, coastal or inland water transport) Reinforcement - involved using concrete • Recreational activities
• Dredging - resulting in removal of sediment
• Improve Modified Habitat Improvement to sediment management maintenance regime• Improve Modified Habitat
• Sewage Disposal
• Other manufacturing
• Reduce at source
SURFACE WATER POLLUTION - PRESSURE (HUMAN ACTIVITIES IMPACTS)Ta
rget
Act
ion
s b
y S
EPA
Cau
ses
of
Pre
ssu
reTy
pes
of
Pre
ssu
re Targ
et A
ctio
ns
by
SE
PAC
ause
s o
f P
ress
ure
Typ
es o
fP
ress
ure

Future Glasgow: Re-ClydeUNIT 5FUTURE CITIES
Environmental ChallagesEnvironmental Challages
WATER POLLUTIONSTATUS OF RIVER CLYDE (OUTER AND INNER ESTUARY) IN 2012
Table 2.2: Status of Clyde Estuary- Outer in 2012 Table 2.3 : Status of Clyde Estuary- Inner in 2012
Notes: Clyde Estuary - Inner status is known as Moderate Ecological Potential. Ecological Potential” is a term used to des-ignate to all Heavily Modified Water Body (HMWB). HWMB is a water body such as river that can’t achieve good ecological status because of substantial physical alterations that have been made to it for activities such as navigation, water storage, flood defence and land drainage. Hence, in comparing to Non-Heavily Modified Water Body, a lower restoration objective is set for HMWB when identifying their statuses such as Ecological Potential ‘Good’, ‘moderate’ ,’Poor’ or ‘Bad’. The reason of having this lower restoration objective is because the achievement of good ecological potential for HWMB may be technically unfeasible or disproportionately expensive.
The Dissolved Oxygen level is moderate compare to Estuary-Outer which is good, This topic will further discussed un-der the topic “Water Quality for Aquatic life”.
Compare to Clyde Estuary - Inner, Clyde Estuary- Outer has better status which is from “Moderate”
to “High”, part of the reason is these river body is situated away from industrial and urban area.
Besides, there are more green areas along the Clyde Estuary- Outer.
Reference : SEPA - The Future For Scotland’s Waters

Future Glasgow: Re-ClydeUNIT 5FUTURE CITIES
Environmental ChallagesEnvironmental Challages
WATER POLLUTIONCONCLUSION
There are many different government sectors and organisation that monitoring and managing the water
quality and condition of River Clyde to prevent it from pollution (see Table 2.4)
Table 2.4 : Government bodies or Organisation that in charge in different “Pressure”
As Clyde Estuary- Inner is located near Glasgow city and industrial area, there are urban run
off and sewage disposal issues that reduce the water quality. We believed that urban planner
should incorporate more green infrastructure in the city surrounding to reduce urban run off.
Beside,s government stormwater policies could promote the expansion of urban green spaces
by giving more credits to developer that incorporate more green infrastructure ( refer to Sustain-
able Urban Drainage System for information on Wetlands and Ponds)
Figure 2.8 Guadalupe River Park in San Jose, California, fea-
tures green infrastructure systems alongside dense down-
town redevelopment.
A study from United States Environmental Protection Agency, Washington stated that moderate coverage
for green roofs and trees could prevent over 311 million gallons of storm water from entering the sewer
system, reducing sewer discharges into the river into the river by 282 gallons and combined sewer over-
flow frequencies by 16 individual events. Moreover, the use of green roofs and trees throughout the city
could provide significant savings because of the decreased amount of water treatment required in addi-
tion to improved water quality.
Reference : SEPA - The Future For Scotland’s Waters;
NYC DEP Unveils Plan to Add Stormwater-Filtering Green Infrastructure to Bed-Stuy Streets ;
Green Infrastructure Prevents Sewer Overflows and Protects Water Quality
While Glasgow city does not
have many existing green ar-
eas,we suggest to incorporate
green infrastructures along
pathways in the city area. Figure
2.9 and Figure 2.10 shows a plan
by New York city Department of
Environmental Protection’s plan
of introducing a low cost green
infrastructure in eastern Bed-
ford-Stuyvesant, Brooklyn as a
means to prevent stormwater
from polluting Newtown Creek.
Figure 2.9: Green infrastructure plan in
Bedford-Stuyvesant, Brooklyn
Figure 2.10 : Storm water flows in to the green
areas with tree roots and bushes filtering the water

ACTS AND LEGISLATION
The Conservation of Salmon (Prohibition of Sale) (Scotland) Regulations 2002 (1) No person shall sell, offer or expose for sale any salmon that has been taken by rod and line.
(2) In paragraph (1), “rod and line” means single rod and line with such bait or lure as is lawful on 1st October 2002
Control of Pollution Act 1974
An Act to make further provision with respect to waste disposal, water pollution, noise, atmospheric pollution and public health; and for purposes connected with the matters aforesaid.
Environmental Liability (Scotland) Regulations 2009
Brings into force rules to force polluters to prevent and repair damage to water systems, land quali ty, species and their habitats and protected sites. The polluter does not have to be prosecuted first,so remedying the damage should be faster.
Groundwater Regulations 1998 SI 2746
Empowers SEPA to prevent direct or indirect discharge of certain dangerous substances to groundwater and control pollution re sulting from the discharge of those and other substances.
Salmon and Freshwater Fisheries (Consolidation) (Scotland) Act 2003
Sets out which fishing methods are allowed and dates of salmon and trout fishing seasons. Details of fences relating to and the administration of salmon and freshwater fisheries.
Sewerage (Scotland) Act 1968 c.47.
Requires the water and sewerage undertaker to provide public sewers as necessary for domestic sewage, surface water and trade effluent. Regulates discharges of trade effluent by grant of consent or by agreement.
Water Environment (Controlled Activities) (Scotland) Regulations 2011 SSI 209
Increases the transparency and efficiency of processing applications for water use licences, and increases flexibility to deal with emergencies with imminent risks of serious harm to people, property or the environment.
Water Environment and Water Services (Scotland) Act 2003
Sets out the duties and powers of public authorities to protect the water environment and to regulate potential polluting activi ties, and sets up river basin management districts.
This section is intended to highlight the most important and influential pieces of legislation that govern the water conditions through Scotland. Focusing primarily on the Acts which bear most relevance to the River Clyde and any aims to notify prospective developments of the design parameters and impacts that should be consid-ered.

Future Glasgow: Re-ClydeUNIT 5FUTURE CITIES
Environmental ChallagesEnvironmental Challages
WATER QUALITY FOR AQUATIC LIFE
Dissolved oxygen (DO) is an indicator of water quality because it is essential for the survival of most aquatic life, from animals living in the sediments to fish.
Some species are more tolerant of low dissolved oxygen concentrations than others. Game fish such as salmon are indicators of good water quality be-
cause they require well oxygenated water. “Low DO levels threaten aquatic life and negatively impact on other aspects of water quality, such as appearance
and odour.” SEPA (Engineerlive,2013). Beside, Low DO could also have a major impact on the water quality classification and compromise achievement of
the Water Framework Directive (WFD) objective of “Good Ecological Potential” (refer to Status of River Clyde under Chapter “Water Pollution”)
DISSOLVED OXYGEN IN RIVER CLYDE
Figure 2.11 : Long Term Trend in Dissolved Oxygen in River Clyde from 1970 to 2010
with the Comparison of Dissolved Oxygen Level in Outer and Inner Clyde Estuary
In Outer Clyde Estuary, the ‘DO 5-year mean level’ grew 1 milligram per litre average
over the year except the years of 1990 to 1999 which has a lower grow rate. While in In-
ner Clyde Estuary, the DO level grow in lower rate compare to the Outer. It has a higher
grow rate from the years of 2006 onwards to 2009, from around 2.5mg/l to 3.4mg/l.
Notes: Dissolved oxygen is routinely measured in the Clyde Estuary. Samples are collected at 5 depths through the water column every 3.2k in a transect along the length of the estuary. The data has been summarised for the months April to September each year during the period 2001-4 in comparison to the standard, which indicates that dissolved oxygen should not fall below 4 mg/l for more than 5% of the time during the growing season.
Figure 2.12 : Clyde Estuary Invertebrate Fauna (Spring/Summer) 1967-2003
Figure 2.13 Example of Benthic
Species
“The benthic population has been monitored since the late 1960s at a transect
of sites from the top of the estuary in Glasgow (designated 0 miles) and then
seawards at 4 miles (KGV Dock close to Shieldhall STW), 6.5 miles (Cart con-
fluence), 8 miles (Dalmuir STW) and 10 miles (Erskine). The estuary is a highly
dynamic system and the fauna populations reflect this variability. The number of
species recorded in the Clyde Estuary during the spring /summer (when reduced
oxygen levels are usually recorded) has generally increased (Figure 2.13) as
a result of the reduction in the organic load from waste water discharges”
(OSPAR Eutrophication Assessment Reports, 2006) which increase the DO con-
tent in the river.Reference : OSPAR Eutrophication Assessment Reports, 2006 ; “
Scottish Water starts trial of oxygenation of River Clyde” Engineerlive, 2013 ; The Scottish Government

Future Glasgow: Re-ClydeUNIT 5FUTURE CITIES
Environmental ChallagesEnvironmental Challages
WATER QUALITY FOR AQUATIC LIFE
Figure 2.14 : Pacific Quay , one of the major land reclamation area in Glasgow.
Organic Waste Land Reclamation & Dredging Urban Runoff (diffuse Pollution)
Decrease Dissolved oxygen (DO)
Affected Aquatic life especially Fish
DISSOLVED OXYGEN IN RIVER CLYDE (CONCLUSION)From 1975 to 2010, Dissolved oxygen (DO) concentration 5-year mean has increased from 1mg/l to 6mg/l
in Outer Estuary . While in Inner Estuary, DO concentration 5-year mean has increased from 0mg/l to
3mg/l in the year of 1975 to 2010.
Part of the reason the level of DO increased is due to the declined of discharges of organic waste as a
result of improvements to effluent treatment. This increase in dissolved oxygen resulted in the reappear-
ance of salmon in 1983 following an absence of over a century (refer to Chapter “Chronology of Salmon in
River Clyde” for more information). Salmon have reappeared each year since, along with increasing num-
bers of other fish species. However, further reductions in discharge of organic waste may not result in an
immediate increase in dissolved oxygen as organic matter trapped in the sediments continues to remove
oxygen from the overlying water.
Land reclamation and dredging such as development of Pacific Quay have made the inner Clyde nar-
rower and deeper than its natural state. These changes have reduced the strength of the tidal currents
causing less mixing between freshwater and the incoming seawater, resulting in layering of the water
column. This layering inhibits the transfer of oxygen from the surface allowing deeper water to become
depleted (used up) in oxygen.
A numerical model of the Clyde estuary is being used to predict the most cost effective option for
increasing dissolved oxygen in the Clyde. These options include:
• Further reducing inputs of organic waste.
• Changing the operation of the tidal weir to increase mixing between fresh and salt water.
• Injecting pure oxygen into the estuary at critical times (e.g. during extended dry, hot spells) and
locations.
• Changing the morphology of the estuary to improve flushing and reduce the residence time of organic waste.
While SEPA play the parts on monitoring and monitoring water quality, we as part of the architects
and urban designers have the obligations to protect the aquatic life and to help increase the Dis-
solved Oxygen through efficient and sustainable urban drainage system (SUDS) such as introduc-
ing Wetlands in Glasgow (Refer to Chapter Sustainable Urban Drainage System (SUDS) for more
information)
Sustainable
Solutions to
Increase DO
Efficient DrainageSustainable Urban Drainage System-
Wetlands

Future Glasgow: Re-ClydeUNIT 5FUTURE CITIES
Environmental ChallagesEnvironmental Challages
WATER QUALITY FOR AQUATIC LIFE SUSTAINABLE DRAINAGE SYSTEM AS A SOLUTION FOR POLLUTION (CONCLUSION ) HOW TO IMPROVE DISSOLVED OXYGEN THROUGH EFFICIENT DRAINAGE AND BUILDING WETLANDS ?
Efficient Drainage System Sustainable Drainage System (Ponds and Wetlands)
Agricultural runoff has variable flow rates and pollutant loads, and is highly suitable for treatment
by constructed wetlands and settling ponds. Decomposing organisms in artificial wetlands can
improve water quality by breaking down excess organic material.
Greater than 90 percent removal of total phosphorus and suspended solids has been recorded in well
designed constructed wetlands. The most effective designs include a silt trap, grass filter, wetland, pond,
and shallows. Site selection and system size are critical to wetland effectiveness.
Aquatic plants play an important role in these removal processes. Some aquatic plants such as
sedges and floating plants, pump atmospheric oxygen into their submerged stems, roots, and
tubers. The oxygen is then utilised by microbial decomposers attached to the aquatic plants
below water level.
This increases the rate of organic matter decomposition. Trees help to extract nutrients from subsurface
flows before entering streams. Plants also play an active role in taking up nitrogen, phosphorus, and
other compounds from the water. Some nitrogen and phosphorus goes back into the water as plants
die and decompose. In the case of nitrogen, much is converted to nitrogen gas through de-nitrification
processes in the wetland.
Constructed wetlands can also provide high quality wetland habitat for waterfowl, fish and other
wildlife. Ponds can also be stocked with molluscs to create an additional biological filter.
Refer to Chapter “Sustainable Urban Drainage System (SUDS) for information on wetlands.
Reference : Understanding Dissolved Oxygen in Stream
However, deep drainage may cause problems with DO in streams because groundwater is typi-
cally low or devoid of DO.
Maintain drains to a maximum of 1m depth. Stable, spoon-shaped drains are less prone to ero-
sion and are easier to maintain. They are also expected to reduce acid export from acid
sulphate soils.
Rock drops and drop boards in drains will also help to hold water in drains and will create turbu-
lence for greater aeration.
Deep drainage systems can prolong the in-flow of low Dissolved Oxygen (DO) groundwater to
streams. Groundwater may also contain high concentrations of ferrous irons in areas with acid
sulphate soils. This ferrous iron, plus soluble aluminium released at a similar time contribute to
Chemical Oxygen Demand (COD). Oxidation of the ferrous iron leads to formation of iron floc.
This can clog the gills of aquatic organisms and smother submerged plants.
Figure 2.15 : Rock drops along the drainage system will help aerate water.

CHRONOLOGY OF SALMON IN THE RIVER CLYDEThe following chronlogy charts the presence of Salmon within the river clyde and its subsidery water bodies. It highlights the effects that poor water management and heavy industial activity has had on salmon stocks, which in turn, act as a mesure for the rivers health over time.


Future Glasgow: Re-ClydeUNIT 5FUTURE CITIES
Environmental ChallagesEnvironmental Challages
WATER QUALITY FOR BATHING‘BATHING WATERS’ AREAS BY SCOTTISH ENVIRONMENTAL PROTECTION AGENCY (SEPA)
In Scotland, there are few seas designated as Bathing Waters and are monitored by SEPA through-
out the bathing water season from 1 June to 15 September ( Refer to “Bathing Water Profile” un-
der SEPA website for lists of Bathing Waters in Scotland). These Bathing Waters are also classed as
protected areas under Annex IV of the Water Framework Directive (WFD). Protected areas are areas
that have been identified as requiring special protection because of their sensitivity to pollution or
their economic, social or environmental importance.
SEPA produced Bathing Water profiles for each bathing water which includes:
• A description, map and photograph of the bathing water;
• Information on potential pollution sources and risks to water quality;
• Descriptions of measures being taken to improve water quality;
• Information on reporting and responding to any pollution incidents;
• local contact details for sources of further information.
Besides, SEPA also operate daily water quality prediction during the bathing water season. Informa-
tion is displayed on electronic message signs at the bathing water sites and daily forecasts are also
displayed on the SEPA website, smartphone application and are available via Beachline services.
How Bathing Waters’ Quality is measured?
Most bathing waters will be sampled 20 times during the season. Some geographically remote sites
will be sampled 10 times. Sites which have consistently demonstrated excellent water quality (typ-
ically every sample meeting guideline criteria for a number of years) are sampled five times.
The test of the bath water quality is based on the measured of the content of microbiological value
(through 2 types of bacteria : Escherichia coli and Intestinal enterococci) in the sample of 100ml
water collected from the specific area. Table 2.5 shows how compliance will be determined.
Escherichia coli (previously faecal coliforms)
Intestinal enterococci (previously faecal streptococci)
Mandatory pass (M)
95% of samples should not exceed 2,000 E. coli per 100 ml If a site is sampled 20 times, at least 19 samples must meet this criteria. If a site is sampled less than 20 times, all samples must meet this criteria
The 1976 directive contains no mandatory standard for this parameter
Guideline pass (G)
80% of samples should not exceed 100 E. coli per 100 ml If a site is sampled 20 times, at least 16 samples must meet this criteria Proportional reductions apply at sites with reduced sampling
90% of samples should not exceed 100 intestinal enterococci per 100 ml If a site is sampled 20 times, at least 18 samples must meet this criteria Proportional reductions apply at sites with reduced sampling
Table 2.5 Interpretation of microbiological values for bathing waters in the period 2012 to 2014.
Table 2.6 Example of water quality measurement result at
Lunderston Bay ( A nearest beach to River Clyde)
Notes: Most E. coli strains do not cause disease, but virulent strains can cause gastroenteritis, urinary tract infections, and neonatal meningitis.
While critical clinical infections caused by Intestinal enterococci include urinary tract infections, bacteremia, bacterial endocarditis, diverticulitis, and meningitis. Reference: Scottish Bathing waters
Figure 2.15
Measured on
E.coli tested on
sample water

Future Glasgow: Re-ClydeUNIT 5FUTURE CITIES
Environmental ChallagesEnvironmental Challages
WATER QUALITY FOR BATHING
River Clyde has the potential to be used developed as a leisure swimming area in Glasgow. We believe
that providing the opportunity for the peoples in Glasgow to get close to the river could further enhance
the peoples’ mental health and life. From the past until now, water elements could provide a psychol-
ogy, visual, auditory ,tactile effects and relaxing effects through visual, acoustic, and provide tactile in-
tegration on the human (Booth, 1990). Emotional contact with water occurs when people are allowed to
get as close as possible, resulting ‘mental leaning out over” (Moore and Litz, 1994). Furthermore, river
provides a different landscape and sensual experience in comparison to the sea.
At present, the behaviour and affection of the locals towards the river as a place for recreation are still
low. Swimming in River Clyde or having water activities are considered rare in Glasgow. Furthermore,
there are no public amenities which allow or encourage peoples to experience a direct contact with the
river. Public amenities such as deck, public toilets, showers, cafe and restaurants could be intro-
duced along the river.
Through the example of measurement of Bathing water areas carried out in Scotland, it is suggested
that River Clyde has the prospect to be included in Scotland ‘Bathing Waters’ scheme by improving and
monitoring its quantity of certain microbiological content (bacteria) that are harmful to human skin and
body. SEPA’s success story in monitoring Strathclyde Park loch’s water quality to be safe for Common-
wealth triathlon swimmers in last July 2014 Glasgow 2014 is the initial indication that River Clyde can be
a next swimming spot.
Another main reason that peoples do not use the rivers is the weather and temperature of water is al-
ways cold. Hence, technology which could monitor the temperature of the water or building a insulated
recreation centre over part of the river should be introduced.
In such, the objective of utilising River Clyde as a water source for improving peoples’ mental
health and lifestyle could be achieved.
CONCLUSION - POTENTIAL OF RIVER CLYDE FOR SWIMMING AND WATER ACTIVITIES
Currently, River Clyde is not categorized under the Bathing Waters in Water Framework Directive
(WFD). Our assumption of River Clyde is not categorised as Bathing area are:
1) It is not a sea, the current selected bathing water protected areas are sea or lake
2) There is no public facilities provided to allow possible access to the river
3) The river water quality is not safe for human body’s contact.
NOW FUTURE
PUBLIC AMENITIES
MONITOR WATER
QUALITY
PEOPLE LOVE RIVER CLYDE
ADAPTABLE ENCLOSURE
(WITH INSULATION)
PEOPLE DOESN’T LOVE RIVER CLYDE
STRATEGIES

Future Glasgow: Re-ClydeUNIT 5FUTURE CITIES
Environmental ChallagesEnvironmental Challages
WATER QUALITY FOR BATHINGEXAMPLES OF BATHING ALONG THE RIVER IN OTHER COUNTRIES
Copenhagen Harbour Bath, Islands Brygge Badeschiff (Bathing Ship) Flussbad Oberer Letten
Location :Copenhagen, Denmark
Built in : 2007
Areas : 2500 sqm
Architects : BIG & JDS Architects
Temp. Summer : Average 20 Celcius (Day)
Location : Berlin, Germany
Built in : 2004
Areas : 740 sqm
Architects : Wilk-Salinas Architekten
Temp. Summer : Average 20 Celcius (Day)
Location : Zurich, Swizerland
Areas : 400 meter long
Temp. Summer : Minimum 16 Celcius (Day)
Maximum 30 Celcius (Day)
Notes : The Floating pool give visitors a feeling of swimming in the river. In the summer the barges are open, two barges are sun decks and one is a floating swimming pool . In the winter, they are enclosed with insulated roofs.
Notes : The 400 meter Swimming canal is sectioned off on the Limmat River. There are built sunbathing decks and a woman only swimming areas near the river.
Notes : Water Quality (measured of E.coli bacteria in the water) is monitored daily

Future Glasgow: Re-ClydeUNIT 5
FUTURE CITIES
Environmental Challenges
Figure: Flood Risk Map of River Clyde from Govan to Glasgow Green, identifying the main areas that are more likely to be affected by fl ooding issue by likelihood. (source: SEPA, http://map.sepa.org.uk/fl oodmap/map.htm)
Up to the 19th Century, River Clyde had a long history of fl ooding in central Glasgow. From 18th centuries onwards, extensive engineering works were carried out, which includes wid-ening and deepen-ing of the river, the construction of quay walls and raising adjacent lands. These ef-forts had effectively neautralize the risk of fl ooding ever since.
Latest data map from SEPA (2013) indicates that there is none to negligible fl ood risk around the heart of the city. In contrast, it is can be seen that three areas have high-er likelihood to be fl ooded: Glasgow Science Center (Pacifi c Quay), Glasgow Spring-fi eld Quay (Paisley Road), and Rich-mond Park area, albeit the risk is still highly in control (avg. 1 in every 200 years/0.5% any one year). It is still uncertain that fl ood risk may increase over the course of time because of gradual climate change.
River ClydeFlooding Risk

Future Glasgow: Re-ClydeUNIT 5
FUTURE CITIES
Environmental Challenges
Glasgow Extreme Flood Event
08 December 2011(Winter)
Early August 2002(Summer)
03 January 2012 (Winter)
• Scotland has been battered by winter storm with winds reaching in excess of 80mph in central and southern areas.• Bridges had to be closed and the public was warned not to travel between the hours of 2pm and 9pm.• About 70% of Scotland’s 2,800 schools either did not open or were closed by the afternoon. Most schools hope to be open
on Friday.
Result:Levels on the River Clyde in Glasgow rise as the extreme weather continues - not far off covering Bells Bridge.
Cause: Glasgow Winter Storm on 3 January 2012
Closed Kingston Bridge Note wave Direction Flooding River Clyde Glasgow (area with rail track heading towards Central Station)
Flooding Clyde Walkway Clyde St Flooded Clyde Walkway George V bridge Clyde Walkway Gala Casino Broomielaw
Flash fl ood in the summer 2002 An extreme rainfall event in Glasgow on 30 July 2002 caused severe surface water fl ooding
Surface water fl ooding in Glasgow on 30 July 2002
2002 Glasgow Floods were a consecutive occurence of fl ash fl oods caused by severe thunderstorms in late July and early August of 2002. 200 people were evacuated in the East End, the worst affected district. Roads and railway system were interrupted in operation as well.
The water parasite Cryptosporidium (which can cause diarrhea) was discovered at Mug-dock Reservoir as a result of fl ooding, and affected 140,000 people in Glasgow.
(sources: http://news.bbc.co.uk/1/hi/scotland/2253388.stm, http://www.groundwateruk.org/Groundwater-issues-SUDS.aspx)
(source: http://www.bbc.co.uk/news/mobile/uk-scotland-scotland-politics-16082303)
(source: photos by James Brown, https://www.fl ickr.com/photos/8899981@N05/6630841095/in/photostream/)

River Clyde Flood Management Strategy - Glasgow City Council
Predicted flood levels along the 56km corridor between Greenock/Cardross have been used to produce flood maps for a range of return periods: 10 year, 50 year, 200 year, and 200 year plus climate change. Although high river flows can be damaging to structures, the risk of over-bank flooding in the city centre, downstream of the tidal weir, is essentially linked to extreme tides.
Scenarios of climate change, based on the latest published data by the UK climate change programme (UKCIP02), have been considered. A 300mm sea level rise and 20 per cent increase in river flows by 2080 translate into raised extreme flood levels, ranging from 300mm in Glasgow’s city centre to more than 900mm at Dalmarnock Bridge or Carmyle. Areas at risk of flooding would increase, with greater flood depth, in particular areas at fluvial risk.
Although direct flood defences in areas affected by fluvial flooding may have a local impact, they are considered the most suitable strategy for protecting the areas at risk of flooding, in Glasgow and in neighbouring local authorities.
The following design levels in the below table are for the predicted 0.5% annual probability (200 year return period) and include freeboard (which is an allowance above predicted levels to take into account uncertainties in predictions) and climate change.
These design levels should be used as guidance when preparing development proposals, in conjunction with the development criteria set out in this document.
Flood defences should take the form of permanent structures (e.g walls and earth embankments) which have an insignificant visual impact and do not act as a barrier to the movement of people or vehicles. Soft and hard landscaping can be used to disguise the true function of permanent flood defences. Where their construction would act as a barrier or result in a significant visual impact, demountable flood defences are an alternative.A combination of building design, raised areas and permanent and demountable defencescan achieve a satisfactory level of defence.
The City Plan recognises that quay wall maintenance has not been carried out in a consistent manner and that many of the quay walls are in a poor condition.The images on page 15 outline some of the potential approaches and solutions to quay wall stability from an engineering point of view.
Potential Quay Wall Stability Solutions
Cellular Construction
Rip Rap Ballast
Revetment Stabilisation
Stepped Revetment
Bio-Engineered Solution
Single Row Sheet Piles
Name Defence Level (m AOD)
George V Bridge to Tidal Weir 6.1
Clyde Tunnel to George V Bridge 6.0
Yoker to Clyde Tunnel 5.9
Table 2 - Tidal Reach
Visualisation of folding demountable defences at Lance�eld Flats
Flood Defence mechanisms

Future Glasgow: Re-ClydeUNIT 5
FUTURE CITIES
Environmental Challenges
Flood Defence Condition Assessment by City Council
City council had identifi ed the key areas with relatively high fl ood risk to the development along River Clyde. This study includes the assessment of quay wall condition, recommendation to improvement and brief description of the river edge area.
For more information, refer to River Clyde Flood Management document by Glasgow City Council.
source: River Clyde Flood Management Strategy (2006)

Future Glasgow: Re-ClydeUNIT 5
FUTURE CITIES
Environmental Challenges
Case Study: White Cart Water Flood Defence Scheme (South of Glasgow City)
White Cart Water Scheme: Facts and Figures
1. Cost of scheme: £53M1. 1,710 homes & 45 businesses protected from fl ooding2. Three fl ood storage areas and associated dams created — Blackhouse (Earn
Water) in East Renfrewshire, Kirkland Bridge (White Cart Water) and Kittoch Bridge (Kittoch Water) — to hold 2,500M.l of fl ood water
3. 4.5km of fl ood defence walls created4. Six surface water pumping stations5. The installation of the world’s largest Hydro-Brake fl ow control devices — the
fi ve hydro-brakes each have the capacity to hold a new mini-sized car6. Two new bridges built7. Two existing foot bridges raised8. 180,000m³ of earth shifted and reused in the creation of the three dams
Problem and Issues:
Normally, a shallow, fast-fl owing river, White Cart Water is prone to fl ash-fl ooding and water levels can rise by six metres after only 12 hours of rain. Since 1908 it has infl icted more than 20 serious fl oods on homes and other properties in the South Side of the City.
Solution:
Hydro-Brake, a large-scale fl ow control device (Engineered Solution)
The World’s Largest ever Hydro-Brake: Installation of a large-scale fl ow control device as part of a fl ood prevention scheme at Blackhouse Dam, near Glasgow.
Inland fl ash fl ood caused by Whitecart Storm(image source: http://www.ritmac.co.uk/news/whitecart_storm_fl ood_prevention_scheme/)
(source: http://www.nce.co.uk/news/water/glasgow-white-cart-water-fl ood-defence-scheme-opened/8621925.article)


SUDS - THE MANAGEMENT TRAIN

Future Glasgow: Re-ClydeUNIT 5
FUTURE CITIES
Environmental Challenges
Figure: Type of landscapes and their spatial location in Glasgow (source: Scottish Natural Heritage)
Identifying the landscape will be important to recognize the natural habitat for local species and strategy for SUDS treatment. One of the golden rule for SUDS design is NOT to use existing ponds, wetland or ditches for treat-ment, as it might be countereffective.
Each type of the landscape plays its own important role to the urban environment of Glasgow (detail refer to the fi gure). Local council and authorities made efforts to maintain and improve these landscapes to the benefi ts of both ecology and citi-zens.
More informations can be obtained from the website of Scottish Natural Heritage.
GlasgowEcologicalNetwork

Future Glasgow: Re-ClydeUNIT 5
FUTURE CITIES
Environmental Challenges
References
Climate Change
Scotland Climatehttp://web.archive.org/web/20070527202029/http://www.metoffi ce.gov.uk/climate/uk/location/scot-land/index.html
Glasgow Flood Risk Management Strategy by Glasgow City Councilhttps://www.glasgow.gov.uk/CHttpHandler.ashx?id=2140&p=0
Barnett, C., J. Hossell, M. Perry, C. Procter and G. Hughes (2006) Patterns of climate changeacross Scotland: Technical Report. SNIFFER Project CC03, Scotland & Northern Ireland Forumfor Environmental Research, 102pp.
Historical Weather for the Last Twelve Months in Glasgow, United Kingdomhttp://weatherspark.com/history/28752/2014/Glasgow-Scotland-United-Kingdom
The Glasgow ‘hurricane’ by Philip Eden (January 21, 2008)http://www.weatheronline.co.uk/cgi-app/reports?ARCHIV=0&LANG=en&MENU=Ex-tra&JJ=2008&MM=01&TT=21&FILE=extra_ne.tit
Climatemps, Glasgow Climate and Temperaturehttp://www.glasgow.climatemps.com/
Glasgow Ecological Network
Glasgow Neutral Grasslandhttps://www.glasgow.gov.uk/CHttpHandler.ashx?id=14112&p=0
Glasgow Acid Grasslandhttps://www.glasgow.gov.uk/CHttpHandler.ashx?id=14096&p=0
Glasgow Trees and Woodlandhttps://glasgow.gov.uk/index.aspx?articleid=3626
Scotland Wetlandshttp://www.sepa.org.uk/science_and_research/what_we_do/biodiversity/wetlands.aspx
Scotland Habitat Networks, by Scottish Natural Heritagehttp://www.snh.gov.uk/land-and-sea/managing-the-land/spatial-ecology/glossary/
Data from OpenGlasgow, by Scottish Natural Heritagehttp://data.glasgow.gov.uk/dataset/csgn-integrated-habitat-network
Solar + Shadow Study
ADEKOYEJO A. OLUGBILE (2011) ‘Project Spatial Mapping of Renewable Energy Potential in Springburn, Glasgow’, pp. [Online]. Available at: http://www.esru.strath.ac.uk/Documents/MSc_2011/Olugbile.pdf (Accessed: 10 November 2014).
Solar radiation and photovoltaic electricity potential country and regional maps for Europehttp://re.jrc.ec.europa.eu/pvgis/cmaps/eur.htm
Water Pollution
Water Framework Directive in Scotland-YOUR QUESTIONS ANSWEREDhttps://www.google.co.uk/url?sa=t&rct=j&q=&esrc=s&source=web&cd=7&cad=rja&uact=8&ved=-0CEoQFjAG&url=https%3A%2F%2Fwww.gov.uk%2Fgovernment%2Fuploads%2Fsystem%2Fup-loads%-2Fattachment_data%2Ffi le%2F307788%2Friver-basin-planning-standards.pdf&ei=uO9fVPOLJaG-v7Aa4loDQDQ&usg=AFQjCNG_RLDsDHDXxJxgu5EvqwZJpwiXCg
SEPA - The Future For Scotland’s Watershttp://www.sepa.org.uk/water/water_publications/idoc.ashx?docid=16d1f03a-e19c-4069-a247-8db-6b86589f3&version=-1
SEPA Surface waterbodies risks and issueshttp://www.sepa.org.uk/water/river_basin_planning/signifi cant_issues/environmental_characterisa-tion.aspx
Green Infrastructure Prevents Sewer Overfl ows and Protects Water Qualityhttp://ohio.sierraclub.org/central/SewerDoc_factsheet_Greeninfrastructure.pdf
Water For Aquatic Life
OSPAR Eutrophication Assessment Reports, 2006http://cefas.defra.gov.uk/media/166984/ospar%20-%20eutrophication%20committee%20-%20com-prehensive%20procedure%202008%20-%20sepa%20-%20clyde%20estuary%2012%20mar07.pdf“ Scottish Water starts trial of oxygenation of River Clyde” Engineerlive, 2013http://www.engineerlive.com/content/23652
Understanding Dissolved Oxygen in Streamhttp://www.soe-townsville.org/cleangreen/fi shwatch/dissolved_oxygen_streams.pdf
The Scottish Governmenthttp://www.scotland.gov.uk/Publications/2011/03/16182005/39
Water for Bathing
Scottish bathing waters 2013-2014https://www.google.co.uk/url?sa=t&rct=j&q=&esrc=s&source=web&cd=1&cad=r-ja&uact=8&ved=0CCEQFjAA&url=http%3A%2F%2Fwww.sepa.org.uk%2Fwater%2Fbathing_wa-ters%2Fidoc.ashx%3Fdocid%3D6d6ab23a-addc-4148-bf08-15cdaa24302d%26version%3D-1&ei=g_FfVKmEO6bX7QaV-IDg-DA&usg=AFQjCNHM25m72vMmEdv8yqXG6B8wpz2VkQ&bvm=bv.79189006,d.d2s
Scottish Bathing watershttp://www.sepa.org.uk/water/bathing_waters.aspx
Copenhagen Harbour Bathshttp://en.wikipedia.org/wiki/Copenhagen_Harbour_Bathshttp://www.archdaily.com/11216/copenhagen-harbour-bath-plot/
The Badeschiffhttp://www.slowtravelberlin.com/the-badeschiff/http://unlike.net/berlin/escapism/badeschiffhttp://www.arena-berlin.de/portfolio/badeschiff/
Flussbad Oberer Lettenhttp://www.badi-info.ch/oberer_letten.htmlhttp://www.myswitzerland.com/en-gb/fl ussbad-oberer-and-unterer-letten.htmlhttp://www.cool-cities.com/fl ussbad-oberer-letten-16469/
Salmon Vs Industrial & Chronology
http://www.scotland.gov.uk/Topics/marinehttp://www.clyderiverfoundation.org/http://www.clydeintheclassroom.com/
References For Prevailing Wind
http://www.bing.com/maps/?FORM=Z9LH3#Y3A9dDk5M253Z244ZDdyJmx2bD0xNSZzdHk9YiZl-bz0wJnNzPXlwLlRSQU5TUE9SVCUyME1VU0VVTX5wZy4xfnJhZC44MA==
River Clyde As Green Energy
The Scottish Government Publication Webpagehttp://www.scotland.gov.uk/Publications/2014/06/5527/3
National Atmospheric Emission Inventoryhttp://naei.defra.gov.uk/reports/
Glasgow Extreme Flood Events
ttp://news.bbc.co.uk/1/hi/scotland/2253388.stm, http://www.groundwateruk.org/Groundwater-is-sues-SUDS.aspx)
http://www.bbc.co.uk/news/mobile/uk-scotland-scotland-politics-16082303)
Photos by James Brown, https://www.fl ickr.com/photos/8899981@N05/6630841095/in/photostream/
Flood Defence Condition Assessment by City Council
River Clyde Flood Management Strategyhttps://glasgow.gov.uk/CHttpHandler.ashx?id=2140&p=0
Case Study: Whitecart Flood Prevention Scheme
http://www.nce.co.uk/news/water/glasgow-white-cart-water-fl ood-defence-scheme-opened/8621925.article)
mage source: http://www.ritmac.co.uk/news/whitecart_storm_fl ood_prevention_scheme/