Future climate projections for Malawi
12
Future climate projections for Malawi About FCFA Future Climate for Africa (FCFA) aims to generate fundamentally new climate science focused on Africa, and to ensure that this science has an impact on human development across the continent. www.futureclimateafrica.org COUNTRY CLIMATE BRIEF October 2017 Key messages Recent trends • There is a drying trend in annual rainfall, particularly since the early 2000s. • Between 1981 and 2016 there were areas of moderate drying in parts of northern and southern Malawi. In contrast, very small wetting trends occurred in the central part of Malawi. • Very wet years occurred in 1989 and 1997 and dry years in 1992, 2005 (driest on record) and 2008. • A clear warming trend is apparent in annual temperature (Figure 1). • Patterns of future rainfall are highly uncertain. Out of 34 models, almost half show that changes in rainfall are likely to be less than 5%, whilst the rest disagree on whether it will be wetter or drier – this means we have lower confidence in projections of future rainfall changes (Figure 2). Future projections Figure 1: Summary of climate changes in Malawi Map shows warming is evenly distributed across Malawi Introduction This brief provides an overview of future climate change in Malawi, using results from the latest available climate model simulations. The UMFULA research team of the Future Climate for Africa (FCFA) programme has analysed 34 Global Climate Models (GCMs) that provide projections for Malawi to try to distil robust messages and some key trends that may help planning and decision-making. We first present a summary of recent observed rainfall and temperature variability. This is followed by an overview of the range of climate projections available from the leading source of climate model results. A detailed annex 1 describes the methods and datasets used in the brief and presents a wider range of figures for further reference. A two-page summary 2 also highlights key findings.
Transcript of Future climate projections for Malawi
Future climate projections for Malawi
About FCFA
Future Climate for Africa (FCFA) aims togenerate fundamentally new climate science focused on Africa, and to ensure that this science has an impact on human development across
the continent.
www.futureclimateafrica.org
COUNTRY CLIMATE
BRIEF
October 2017
Key messages
Recent trends
• There is a drying trend in annual rainfall, particularly since the early 2000s.
• Between 1981 and 2016 there were areas of moderate drying in parts of northern and southern Malawi. In contrast, very small wetting trends occurred in the central part of Malawi.
• Very wet years occurred in 1989 and 1997 and dry years in 1992, 2005 (driest on record) and 2008.
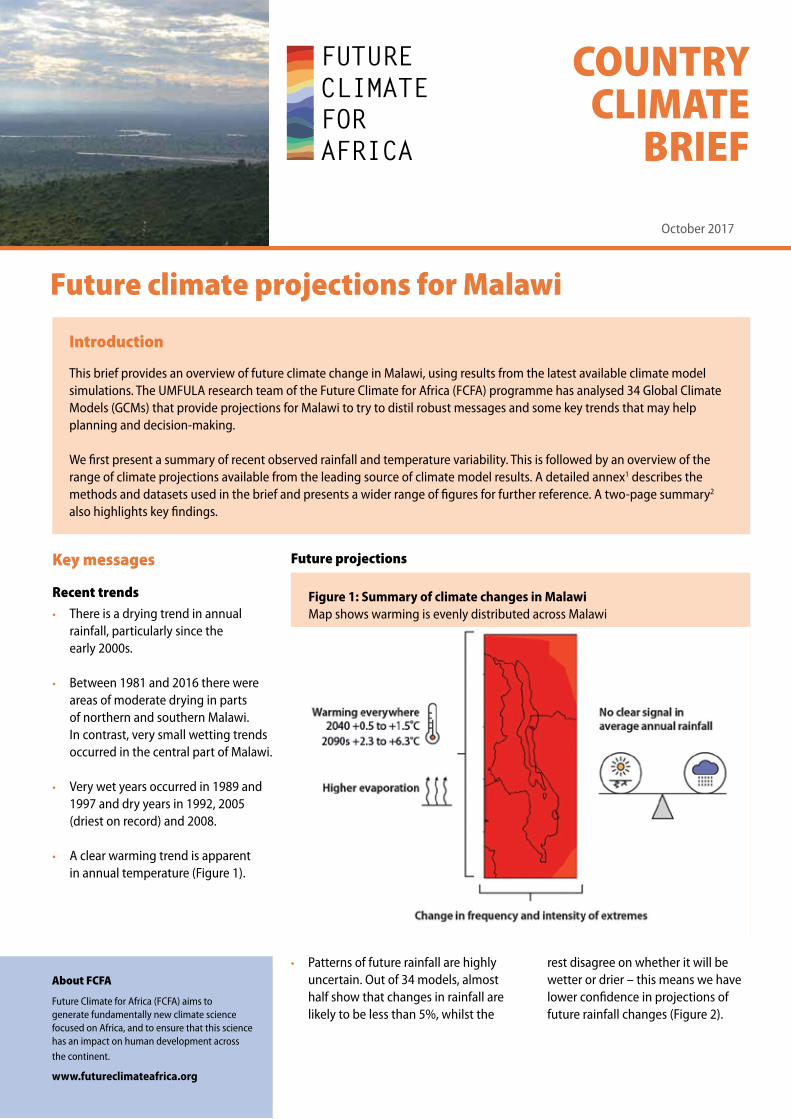
• A clear warming trend is apparent in annual temperature (Figure 1).
• Patterns of future rainfall are highly uncertain. Out of 34 models, almost half show that changes in rainfall are likely to be less than 5%, whilst the
rest disagree on whether it will be wetter or drier – this means we have lower confidence in projections of future rainfall changes (Figure 2).
Future projections
Figure 1: Summary of climate changes in Malawi Map shows warming is evenly distributed across Malawi
Introduction
This brief provides an overview of future climate change in Malawi, using results from the latest available climate model simulations. The UMFULA research team of the Future Climate for Africa (FCFA) programme has analysed 34 Global Climate Models (GCMs) that provide projections for Malawi to try to distil robust messages and some key trends that may help planning and decision-making.
We first present a summary of recent observed rainfall and temperature variability. This is followed by an overview of the range of climate projections available from the leading source of climate model results. A detailed annex1 describes the methods and datasets used in the brief and presents a wider range of figures for further reference. A two-page summary2 also highlights key findings.
2
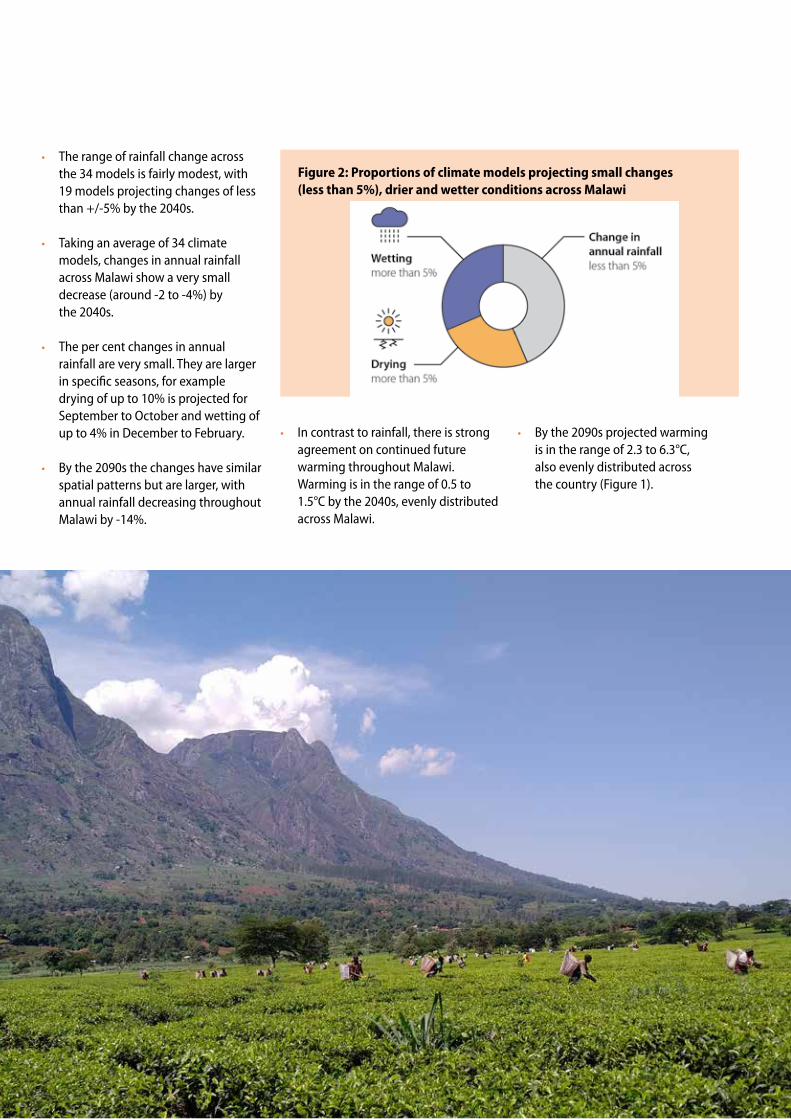
• The range of rainfall change across the 34 models is fairly modest, with 19 models projecting changes of less than +/-5% by the 2040s.
• Taking an average of 34 climate models, changes in annual rainfall across Malawi show a very small decrease (around -2 to -4%) by the 2040s.
• The per cent changes in annual rainfall are very small. They are larger in specific seasons, for example drying of up to 10% is projected for September to October and wetting of up to 4% in December to February.
• By the 2090s the changes have similar spatial patterns but are larger, with annual rainfall decreasing throughout Malawi by -14%.
Figure 2: Proportions of climate models projecting small changes (less than 5%), drier and wetter conditions across Malawi
• In contrast to rainfall, there is strong agreement on continued future warming throughout Malawi. Warming is in the range of 0.5 to 1.5°C by the 2040s, evenly distributed across Malawi.
• By the 2090s projected warming is in the range of 2.3 to 6.3°C, also evenly distributed across the country (Figure 1).
3
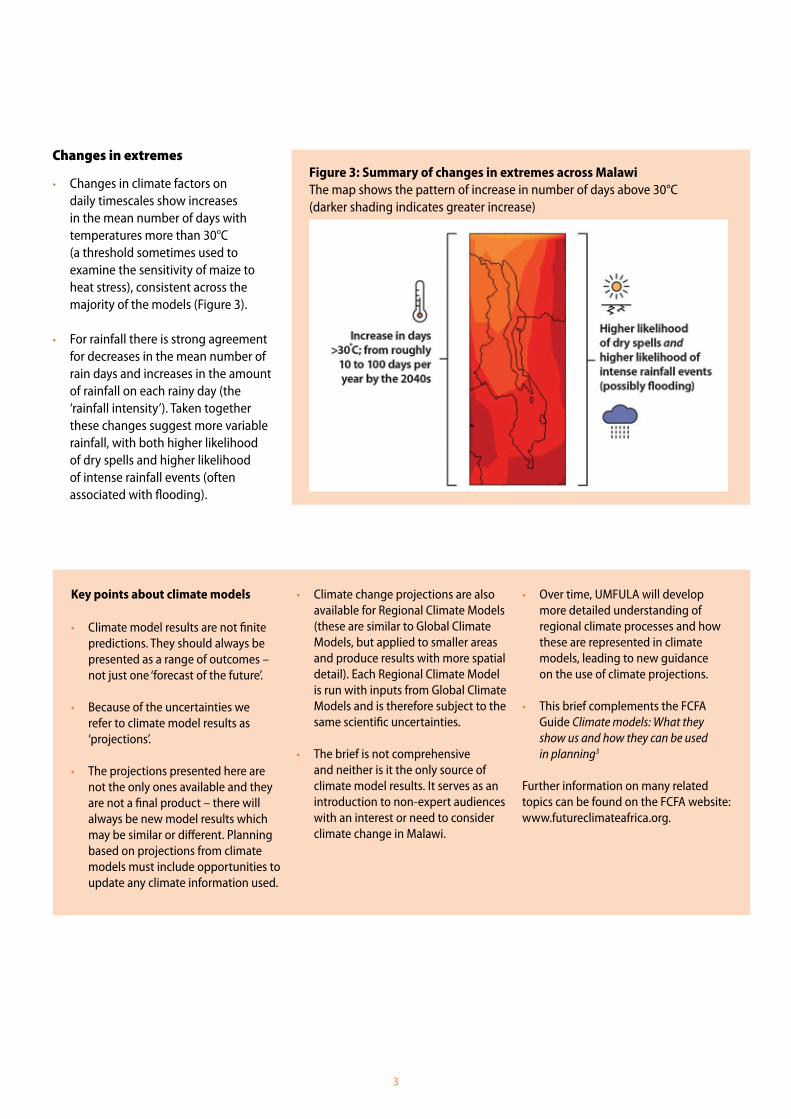
• Changes in climate factors on daily timescales show increases in the mean number of days with temperatures more than 30°C (a threshold sometimes used to examine the sensitivity of maize to heat stress), consistent across the majority of the models (Figure 3).
• For rainfall there is strong agreement for decreases in the mean number of rain days and increases in the amount of rainfall on each rainy day (the ‘rainfall intensity’). Taken together these changes suggest more variable rainfall, with both higher likelihood of dry spells and higher likelihood of intense rainfall events (often associated with flooding).
Changes in extremes
Key points about climate models • Climate model results are not finite
predictions. They should always be presented as a range of outcomes – not just one ‘forecast of the future’.
• Because of the uncertainties we refer to climate model results as ‘projections’.
• The projections presented here are not the only ones available and they are not a final product – there will always be new model results which may be similar or different. Planning based on projections from climate models must include opportunities to update any climate information used.
• Climate change projections are also available for Regional Climate Models (these are similar to Global Climate Models, but applied to smaller areas and produce results with more spatial detail). Each Regional Climate Model is run with inputs from Global Climate Models and is therefore subject to the same scientific uncertainties.
• The brief is not comprehensive and neither is it the only source of climate model results. It serves as an introduction to non-expert audiences with an interest or need to consider climate change in Malawi.
• Over time, UMFULA will develop more detailed understanding of regional climate processes and how these are represented in climate models, leading to new guidance on the use of climate projections.
• This brief complements the FCFA Guide Climate models: What they show us and how they can be used in planning3
Further information on many related topics can be found on the FCFA website: www.futureclimateafrica.org.
Figure 3: Summary of changes in extremes across MalawiThe map shows the pattern of increase in number of days above 30°C (darker shading indicates greater increase)

4
Table 1: Summary of data sources and parameters for past climate (See annex5 for full detail, CHIRPS data are v2.0 Climate Hazards group Infrared Precipitation with Stations).
Rainfall Temperature
Data source CHIRPS Climatic Research Unit
Data availability 1981-2017 1901-2015
Time period Seasonal and annual Seasonal and annual
Sources of data4
Knowledge of past rainfall and temperature in Africa is hampered by sparse weather stations and data gaps. Here we use international data sets which interpolate station data for temperature, and use station and remotely sensed satellite data for rainfall (Table 1). For future climate we use the 34 models used by the Intergovernmental Panel on Climate Change (IPCC), known as CMIP5, which project variations in temperature and rainfall for different periods in the future compared to the baseline period 1950-2005. We present climate simulations based only on a high greenhouse gas emission pathway (worst case scenario, known as RCP8.5, with other pathways available).
Recent climate variability and extremes from observations
Rainfall
Malawi is situated in the transition zone between equatorial and southern Africa. It also has significant relief features, such as highlands in the north, Mount Mulanje in the south, and the lakeshore. As a result of these factors, Malawi experiences differences in rainfall amounts from place to place (from 700-1800mm per year, Figure 4). The lakeshore in the northern and central regions experiences the highest rainfall, and this occurs during the months of December to February (which are the wettest) and March to May (which are relatively drier). Central and southern Malawi have a single rainy season from December to February.
Figure 5 presents time series of observed annual and seasonal rainfall. Key points are the presence of a drying trend in the series particularly since the early 2000s. Very wet years occurred in 1989 and 1997 and dry years in 1992, 2005 (driest on record) and 2008.
It is important to note that taking a country average may obscure large differences between locations and therefore Figure 6 shows a map of the trend in annual rainfall expressed as mm/year. There are marked areas of drying especially in the Lake Malawi region. In contrast, moderate wetting trends appear in central part of Malawi. Drying is pronounced in all the seasons in northern Malawi6. A prolonged drying trend has occurred in December to February (DJF) rainfall in the northern part of Lake Malawi7.
Figure 4: Observed mean annual rainfall (in mm) for 1981-2010
CHIRPS Annual rainfall 1981-2010 mm/yr
0 1500
1400
1200
1000
600
800
400
200
1300
1100
900
500
700
300
100
34E 36E
10S
12S
16S
14S

5
Figure 5: Observed annual and seasonal rainfall (rainfall totals in mm) for all of Malawi for 1981-2016Seasons are March to May (MAM), September to November (SON), and December to February (DJF). The dotted straight lines represent the linear negative trend over the whole period.
1981
1982
1983
1984
1985
1986
1987
1988
1989
1990
1991
1992
1993
1994
1995
1996
1997
1998
1999
2000
2001
2002
2003
2004
2005
2006
2007
2008
2009
2010
2011
2012
2013
2014
2015
2016
1400
1200
1000
0
200
400
600
800
Mea
n A
nnua
l Rai
nfal
l (m
m)
When does variability become a trend and does it matter? We can consider whether trends are present in observations in various ways, with the use of different statistical tests or combinations of the climate variable (using daily or annual rainfall, for example). The start and end point of a trend analysis can greatly affect whether a trend is detected (this is termed ‘sampling variability’). Trends may be expressed as mm or per cent change over time. Both measures can be difficult to interpret in terms of whether they are likely to have had a noticeable effect in real-life. A 50mm drying trend in rainfall per decade in a wet location may be insignificant and impossible for local people to notice (1000mm would reduce to 950mm over 10 years), whereas the same trend in a drier location may be significant and noticeable (600mm would reduce to 550mm, potentially limiting the viability of some rain fed crops).
Trends are generally very irregular which makes them difficult to detect (or even notice). A trend during recent years is much more likely to have been noticed by local people, and several dry years occurring close together by chance may easily be mistaken as a trend. The time of year when the trend occurs is also important in terms of perception.A trend becomes relevant from a practical perspective when it leads to either adverse impacts or opportunities affecting the environment or people. From a scientific perspective, trends are also important as they help to confirm whether change is happening and in understanding the causes of such changes, which can often be difficult to determine. Trends may sometimes be a function of variability over multiple years. It is thus not good practice to assume they will continue into the future without strong evidence to support this.
Figure 6: Observed trend in annual rainfall (linear trend for each grid cell in mm/year) for 1981-2016 Seasonal trends are shown in the annex12.
-20
10840-8 -4-12
-16
62-2-10
-6-14
-18
CHIRPS Annual rainfall trend 1981-2016 mm/yr
The El Niño-Southern Oscillation and El Niño events
El Niño events are typically linked to lower than average rainfall conditions in southern Africa8, and can be associated with drought9. If global average temperatures increase by 1.5°C El Niño events are likely to double in frequency10; and warming is also likely to double occurrence of extreme El Niño events11. The South African Weather Service, Council for Scientific and Industrial Research and universities are conducting research on climate dynamics and El Niño-Southern Oscillation to understand short-term and long-term consequences for southern Africa.
34E 36E
10S
12S
16S
14S
Annual DJF SON MAM
6
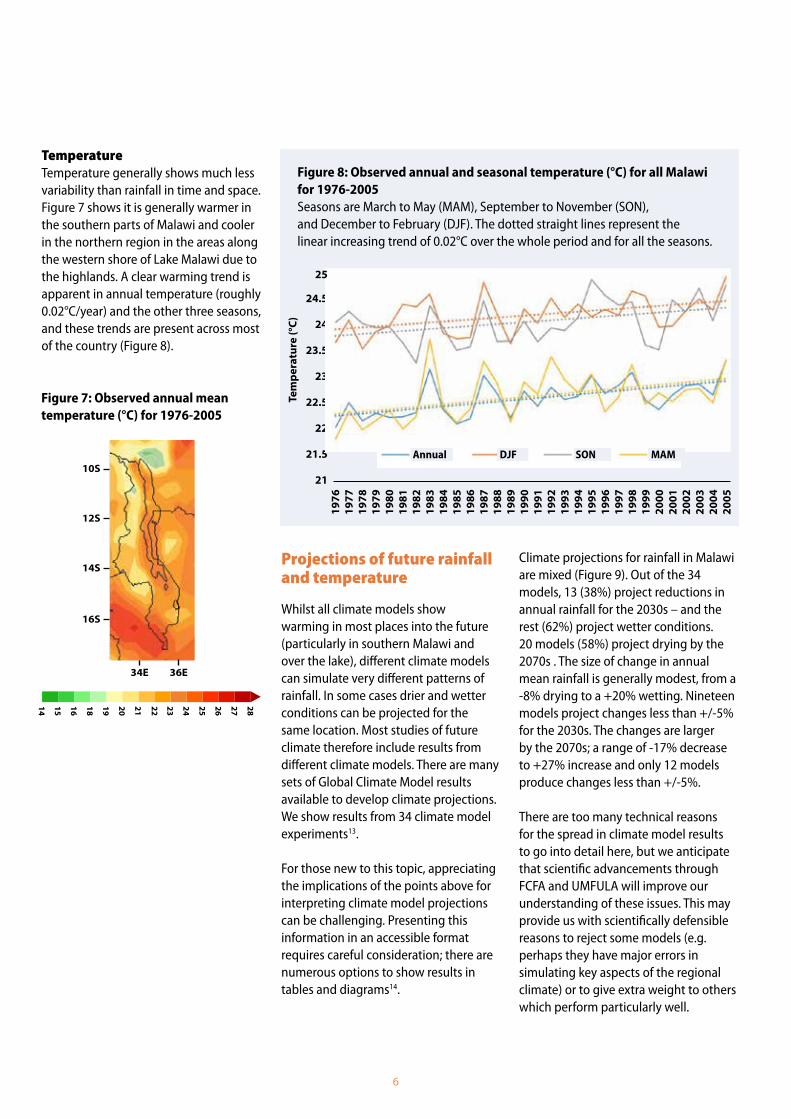
Figure 8: Observed annual and seasonal temperature (°C) for all Malawi for 1976-2005 Seasons are March to May (MAM), September to November (SON), and December to February (DJF). The dotted straight lines represent the linear increasing trend of 0.02°C over the whole period and for all the seasons.
Projections of future rainfall and temperature
Whilst all climate models show warming in most places into the future (particularly in southern Malawi and over the lake), different climate models can simulate very different patterns of rainfall. In some cases drier and wetter conditions can be projected for the same location. Most studies of future climate therefore include results from different climate models. There are many sets of Global Climate Model results available to develop climate projections. We show results from 34 climate model experiments13.
For those new to this topic, appreciating the implications of the points above for interpreting climate model projections can be challenging. Presenting this information in an accessible format requires careful consideration; there are numerous options to show results in tables and diagrams14.
Climate projections for rainfall in Malawi are mixed (Figure 9). Out of the 34 models, 13 (38%) project reductions in annual rainfall for the 2030s – and the rest (62%) project wetter conditions. 20 models (58%) project drying by the 2070s . The size of change in annual mean rainfall is generally modest, from a -8% drying to a +20% wetting. Nineteen models project changes less than +/-5% for the 2030s. The changes are larger by the 2070s; a range of -17% decrease to +27% increase and only 12 models produce changes less than +/-5%.
There are too many technical reasons for the spread in climate model results to go into detail here, but we anticipate that scientific advancements through FCFA and UMFULA will improve our understanding of these issues. This may provide us with scientifically defensible reasons to reject some models (e.g. perhaps they have major errors in simulating key aspects of the regional climate) or to give extra weight to others which perform particularly well.
1976
1977
1978
1979
1980
1981
1982
1983
1984
1985
1986
1987
1988
1989
1990
1991
1992
1993
1994
1995
1996
1997
1998
1999
2000
2001
2002
2003
2004
2005
24.5
24
23.5
21
21.5
22
22.5
23
Tem
pera
ture
(°C)
Figure 7: Observed annual mean temperature (°C) for 1976-2005
14 16 18 19 20 21 22 23 24 25 26 27 2815
Temperature Temperature generally shows much less variability than rainfall in time and space. Figure 7 shows it is generally warmer in the southern parts of Malawi and cooler in the northern region in the areas along the western shore of Lake Malawi due to the highlands. A clear warming trend is apparent in annual temperature (roughly 0.02°C/year) and the other three seasons, and these trends are present across most of the country (Figure 8).
34E 36E
10S
12S
16S
14S
Annual DJF SON MAM
25
7
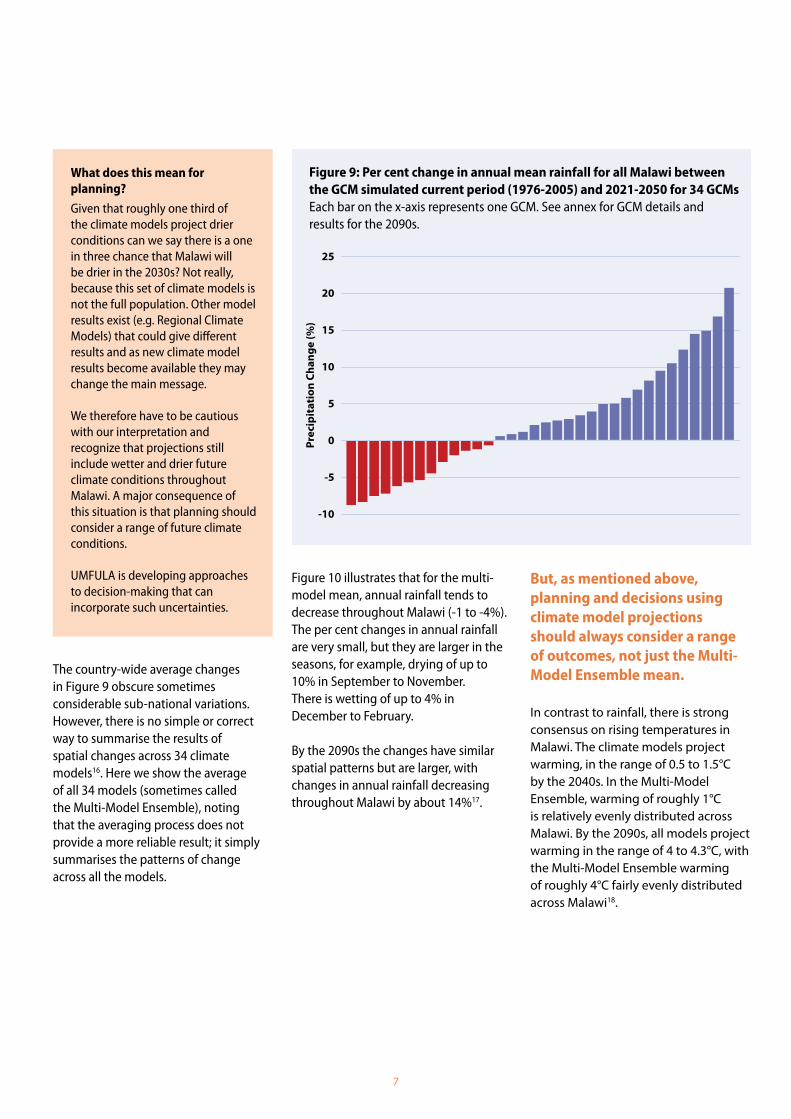
What does this mean for planning?Given that roughly one third of the climate models project drier conditions can we say there is a one in three chance that Malawi will be drier in the 2030s? Not really, because this set of climate models is not the full population. Other model results exist (e.g. Regional Climate Models) that could give different results and as new climate model results become available they may change the main message.
We therefore have to be cautious with our interpretation and recognize that projections still include wetter and drier future climate conditions throughout Malawi. A major consequence of this situation is that planning should consider a range of future climate conditions.
UMFULA is developing approaches to decision-making that can incorporate such uncertainties.
Figure 9: Per cent change in annual mean rainfall for all Malawi between the GCM simulated current period (1976-2005) and 2021-2050 for 34 GCMs Each bar on the x-axis represents one GCM. See annex for GCM details and results for the 2090s.
The country-wide average changes in Figure 9 obscure sometimes considerable sub-national variations. However, there is no simple or correct way to summarise the results of spatial changes across 34 climate models16. Here we show the average of all 34 models (sometimes called the Multi-Model Ensemble), noting that the averaging process does not provide a more reliable result; it simply summarises the patterns of change across all the models.
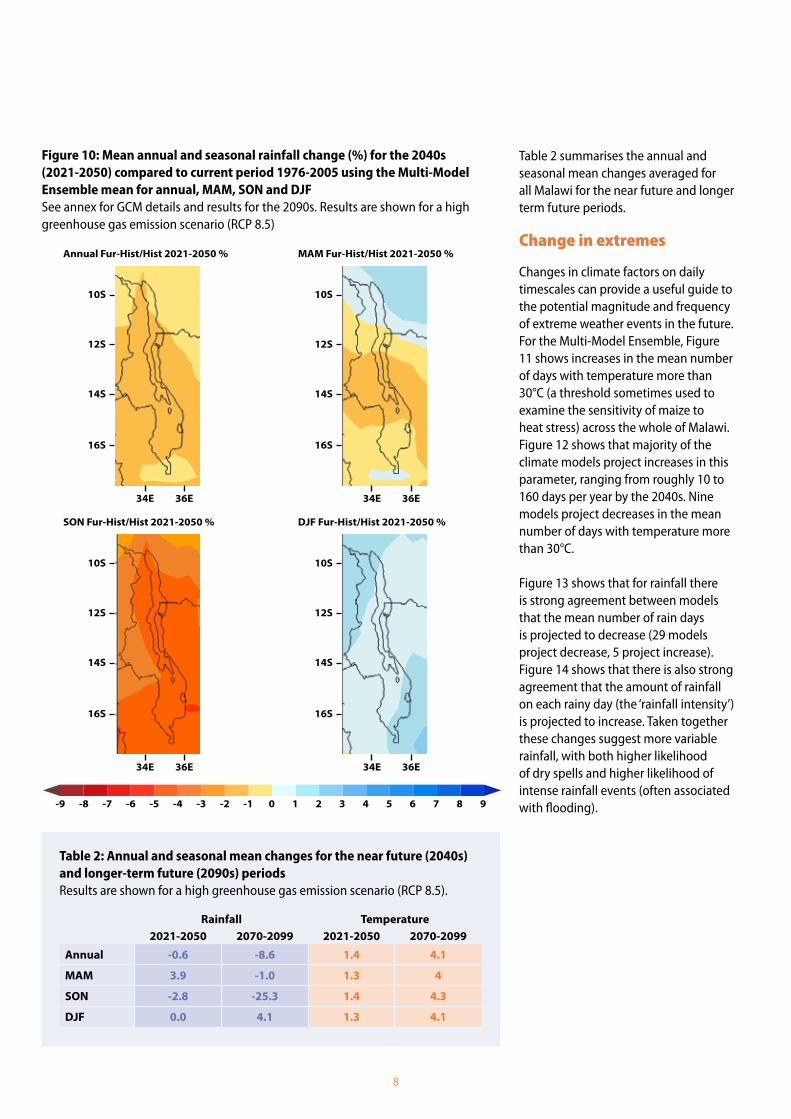
Figure 10 illustrates that for the multi-model mean, annual rainfall tends to decrease throughout Malawi (-1 to -4%). The per cent changes in annual rainfall are very small, but they are larger in the seasons, for example, drying of up to 10% in September to November. There is wetting of up to 4% in December to February. By the 2090s the changes have similar spatial patterns but are larger, with changes in annual rainfall decreasing throughout Malawi by about 14%17.
But, as mentioned above, planning and decisions using climate model projections should always consider a range of outcomes, not just the Multi-Model Ensemble mean.
In contrast to rainfall, there is strong consensus on rising temperatures in Malawi. The climate models project warming, in the range of 0.5 to 1.5°C by the 2040s. In the Multi-Model Ensemble, warming of roughly 1°C is relatively evenly distributed across Malawi. By the 2090s, all models project warming in the range of 4 to 4.3°C, with the Multi-Model Ensemble warming of roughly 4°C fairly evenly distributed across Malawi18.
20
25
10
0
-10
15
5
-5
Prec
ipit
atio
n Ch
ange
(%)
8
Table 2 summarises the annual and seasonal mean changes averaged for all Malawi for the near future and longer term future periods.
Change in extremes
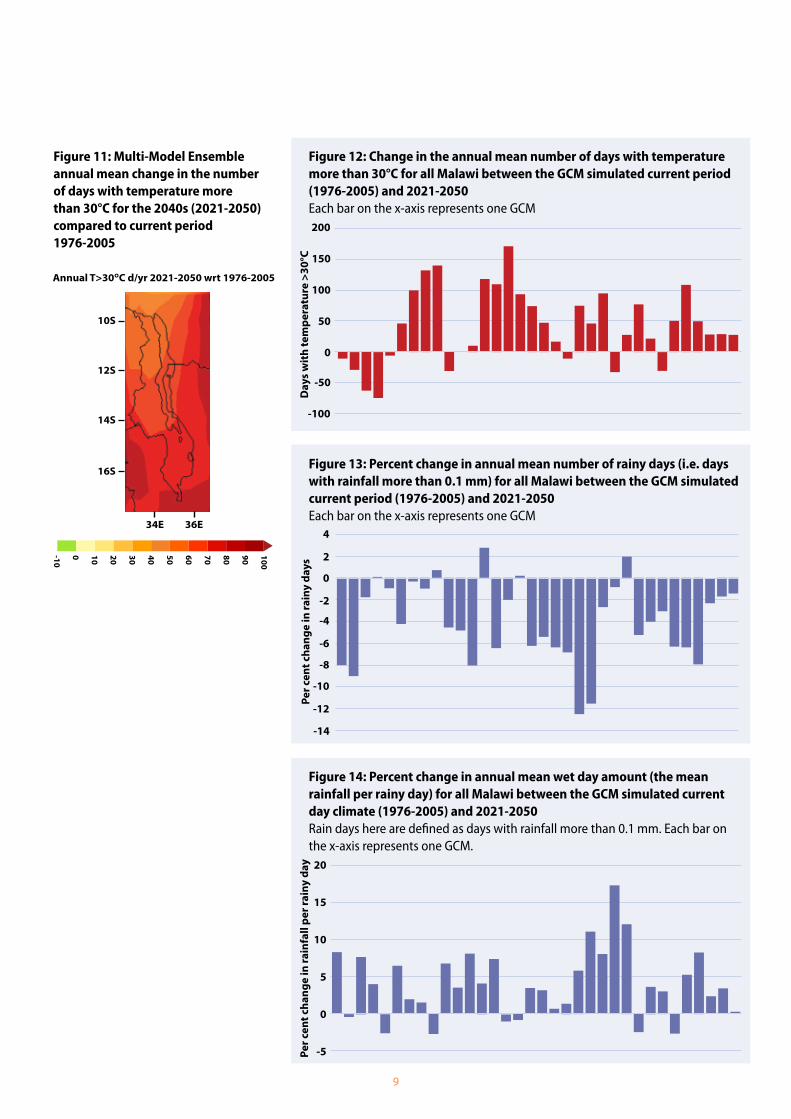
Changes in climate factors on daily timescales can provide a useful guide to the potential magnitude and frequency of extreme weather events in the future. For the Multi-Model Ensemble, Figure 11 shows increases in the mean number of days with temperature more than 30°C (a threshold sometimes used to examine the sensitivity of maize to heat stress) across the whole of Malawi. Figure 12 shows that majority of the climate models project increases in this parameter, ranging from roughly 10 to 160 days per year by the 2040s. Nine models project decreases in the mean number of days with temperature more than 30°C.
Figure 13 shows that for rainfall there is strong agreement between models that the mean number of rain days is projected to decrease (29 models project decrease, 5 project increase). Figure 14 shows that there is also strong agreement that the amount of rainfall on each rainy day (the ‘rainfall intensity’) is projected to increase. Taken together these changes suggest more variable rainfall, with both higher likelihood of dry spells and higher likelihood of intense rainfall events (often associated with flooding).
Table 2: Annual and seasonal mean changes for the near future (2040s) and longer-term future (2090s) periodsResults are shown for a high greenhouse gas emission scenario (RCP 8.5).
Rainfall Temperature2021-2050 2070-2099 2021-2050 2070-2099
Annual -0.6 -8.6 1.4 4.1
MAM 3.9 -1.0 1.3 4
SON -2.8 -25.3 1.4 4.3
DJF 0.0 4.1 1.3 4.1
Figure 10: Mean annual and seasonal rainfall change (%) for the 2040s (2021-2050) compared to current period 1976-2005 using the Multi-Model Ensemble mean for annual, MAM, SON and DJFSee annex for GCM details and results for the 2090s. Results are shown for a high greenhouse gas emission scenario (RCP 8.5)
Annual Fur-Hist/Hist 2021-2050 %
SON Fur-Hist/Hist 2021-2050 %
MAM Fur-Hist/Hist 2021-2050 %
DJF Fur-Hist/Hist 2021-2050 %
-9 -6 -3 0 3 6-8 -5 -2 1 4 7-7 -4 -1 2 5 8 9
34E
34E
36E
36E
10S
10S
12S
12S
16S
16S
14S
14S
34E
34E
36E
36E
10S
10S
12S
12S
16S
16S
14S
14S
9
Figure 13: Percent change in annual mean number of rainy days (i.e. days with rainfall more than 0.1 mm) for all Malawi between the GCM simulated current period (1976-2005) and 2021-2050 Each bar on the x-axis represents one GCM
-2
-14
-12
-10
-8
-4
Per c
ent c
hang
e in
rain
y da
ys
-6
Figure 14: Percent change in annual mean wet day amount (the mean rainfall per rainy day) for all Malawi between the GCM simulated current day climate (1976-2005) and 2021-2050 Rain days here are defined as days with rainfall more than 0.1 mm. Each bar on the x-axis represents one GCM.
Per c
ent c
hang
e in
rain
fall
per r
ainy
day
20
-5
0
5
15
10
Figure 11: Multi-Model Ensemble annual mean change in the number of days with temperature more than 30°C for the 2040s (2021-2050) compared to current period 1976-2005
Annual T>30°C d/yr 2021-2050 wrt 1976-2005
-10
100
90705010 30 80
60400 20
34E 36E
10S
12S
16S
14S
Figure 12: Change in the annual mean number of days with temperature more than 30°C for all Malawi between the GCM simulated current period (1976-2005) and 2021-2050 Each bar on the x-axis represents one GCM200
-100
-50
0
50
100
150
Day
s w
ith
tem
pera
ture
>30
°C
0
2
4
10
Some final technical points: better understanding regional climate
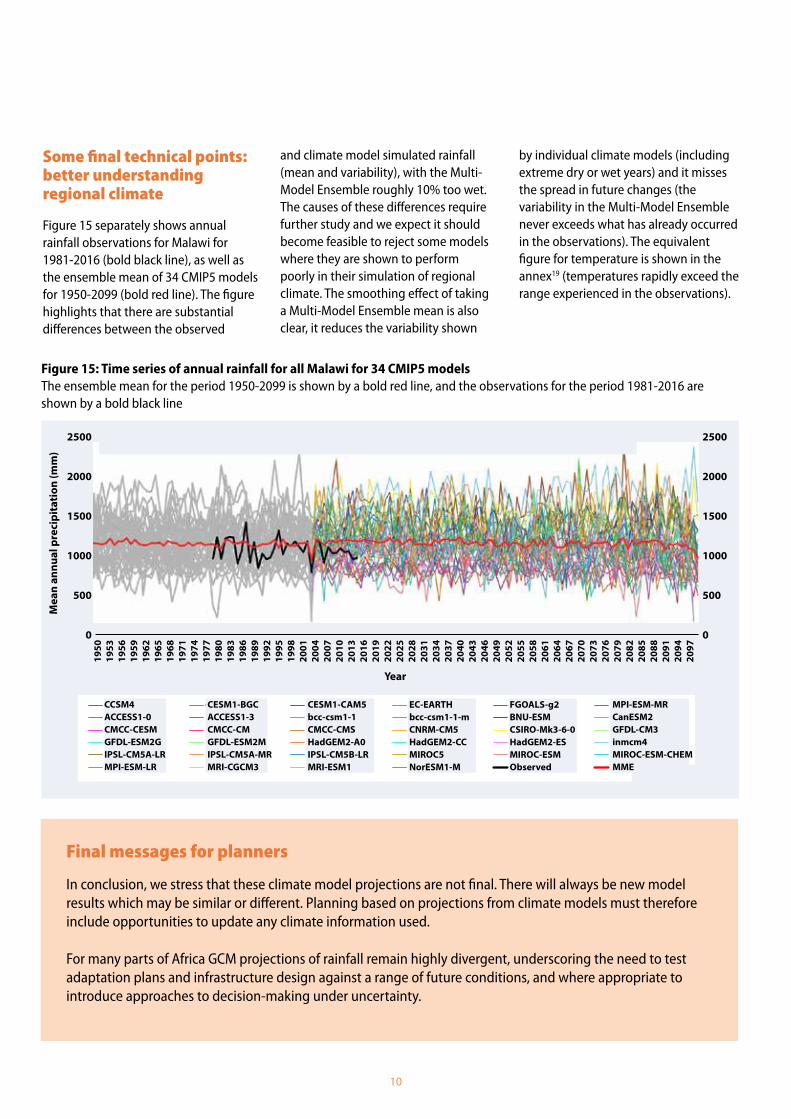
Figure 15 separately shows annual rainfall observations for Malawi for 1981-2016 (bold black line), as well as the ensemble mean of 34 CMIP5 models for 1950-2099 (bold red line). The figure highlights that there are substantial differences between the observed
and climate model simulated rainfall (mean and variability), with the Multi-Model Ensemble roughly 10% too wet. The causes of these differences require further study and we expect it should become feasible to reject some models where they are shown to perform poorly in their simulation of regional climate. The smoothing effect of taking a Multi-Model Ensemble mean is also clear, it reduces the variability shown
by individual climate models (including extreme dry or wet years) and it misses the spread in future changes (the variability in the Multi-Model Ensemble never exceeds what has already occurred in the observations). The equivalent figure for temperature is shown in the annex19 (temperatures rapidly exceed the range experienced in the observations).
Year
2500
2000
1500
1000
500
0
Mea
n an
nual
pre
cipi
tati
on (m
m)
1950
1953
1956
1959
1962
1965
1968
1971
1974
1977
1980
1983
1986
1989
1992
1995
1998
2001
2004
2007
2010
2013
2016
2019
2022
2025
2028
2031
2034
2037
2040
2043
2046
2049
2052
2055
2058
2061
2064
2067
2070
2073
2076
2079
2082
2085
2088
2091
2094
2097
0
500
1000
1500
2000
2500
3000
0
500
1000
1500
2000
2500
3000
1950
1953
1956
1959
1962
1965
1968
1971
1974
1977
1980
1983
1986
1989
1992
1995
1998
2001
2004
2007
2010
2013
2016
2019
2022
2025
2028
2031
2034
2037
2040
2043
2046
2049
2052
2055
2058
2061
2064
2067
2070
2073
2076
2079
2082
2085
2088
2091
2094
2097
Mea
n an
nual
Pre
cipi
tatio
n (m
m)
Year
CCSM4 CESM1-BGC CESM1-CAM5 EC-EARTH FGOALS-g2 MPI-ESM-MR ACCESS1-0 ACCESS1-3 bcc-csm1-1 bcc-csm1-1-m BNU-ESM CanESM2 CMCC-CESM CMCC-CM CMCC-CMS CNRM-CM5 CSIRO-Mk3-6-0 GFDL-CM3 GFDL-ESM2G GFDL-ESM2M HadGEM2-AO HadGEM2-CC HadGEM2-ES inmcm4 IPSL-CM5A-LR IPSL-CM5A-MR IPSL-CM5B-LR MIROC5 MIROC-ESM MIROC-ESM-CHEM MPI-ESM-LR MRI-CGCM3 MRI-ESM1 NorESM1-M Observed MME
CCSM4ACCESS1-0CMCC-CESMGFDL-ESM2GIPSL-CM5A-LRMPI-ESM-LR
CESM1-BGCACCESS1-3CMCC-CMGFDL-ESM2MIPSL-CM5A-MRMRI-CGCM3
CESM1-CAM5bcc-csm1-1CMCC-CMSHadGEM2-A0IPSL-CM5B-LRMRI-ESM1
EC-EARTHbcc-csm1-1-mCNRM-CM5HadGEM2-CCMIROC5NorESM1-M
FGOALS-g2BNU-ESMCSIRO-Mk3-6-0HadGEM2-ESMIROC-ESMObserved
MPI-ESM-MRCanESM2GFDL-CM3inmcm4MIROC-ESM-CHEMMME
Final messages for planners
In conclusion, we stress that these climate model projections are not final. There will always be new model results which may be similar or different. Planning based on projections from climate models must therefore include opportunities to update any climate information used.
For many parts of Africa GCM projections of rainfall remain highly divergent, underscoring the need to test adaptation plans and infrastructure design against a range of future conditions, and where appropriate to introduce approaches to decision-making under uncertainty.
Figure 15: Time series of annual rainfall for all Malawi for 34 CMIP5 models The ensemble mean for the period 1950-2099 is shown by a bold red line, and the observations for the period 1981-2016 are shown by a bold black line
2500
2000
1500
1000
500
0

11
This document is an output from a project funded by the UK Department for International Development (DFID) and the Natural Environment Research Council (NERC) for the benefit of developing countries and the advance of scientific research. However, the views expressed and information contained in it are not necessarily those of, or endorsed by DFID or NERC, which can accept no responsibility for such views or information or for any reliance placed on them. This publication has been prepared for general guidance on matters of interest only, and does not constitute professional advice. You should not act upon the information contained in this publication without obtaining specific professional advice. No representation or warranty (expressed or implied) is given as to the accuracy or completeness of the information contained in this publication, and, to the extent permitted by law, the Climate and Development Knowledge Network’s members, the UK Department for International Development (‘DFID’), the Natural Environment Research Council (‘NERC’), their advisors and the authors and distributors of this publication do not accept or assume any liability, responsibility or duty of care for any consequences of you or anyone else acting, or refraining to act, in reliance on the information contained in this publication or for any decision based on it.
Copyright © 2017, Climate and Development Knowledge Network. All rights reserved.
About Future Climate for Africa
Future Climate for Africa (FCFA) aims to generate fundamentally new climate science focused on Africa, and to ensure that this science has an impact on human development across the continent. This brief was written by members of the UMFULA research team: Neha Mittal, Katharine Vincent, Declan Conway, Emma Archer van Garderen, Joanna Pardoe, Martin Todd, Richard Washington, Christian Siderius and David Mkwambisi. You can find out more about their work under ‘research teams’ on www.futureclimateafrica.org. The authors thank the individuals from the Department for Climate Change and Meteorological Services, Malawi who commented on early versions of this brief.
www.futureclimateafrica.org e: [email protected] t: +2721 4470211
Endnotes1 FCFA (2017a) Annex: Future climate
projections for Malawi. Cape Town: Future Climate for Africa. www.futureclimateafrica.org/resource/future-climate-projections-for-malawi/
2 FCFA (2017b) Summary: Future climate projections for Malawi. Cape Town: Future Climate for Africa. www.futureclimateafrica.org/resource/future-climate-projections-for-malawi/
3 FCFA (2016) Climate models: What they show us and how they can be used in planning. Cape Town: Future Climate for Africa. www.futureclimateafrica.org/news/new-guide-climate-models-what-they-show-us-and-how-they-can-be-used-in-planning
4 FCFA (2017a) Op. cit.5 FCFA (2017a) Op. cit.6 FCFA (2017a) Op. cit.7 FCFA (2017a) Op. cit.
8 Nicholson, S. and Kim, J. (1997) The relationship of the El Niño Southern Oscillation to African rainfall, International Journal of Climatology, 17, 117-135
9 Hoell, A., Funk, C., Magadzire, T., Zinke, J., and Husak, G. (2015) El Niño–Southern Oscillation diversity and Southern Africa teleconnections during Austral Summer, Climate Dynamics, 45(5), 1583-1599.
10 Wang, Guojian; Cai, Wenju; Gan, Bolan; Wu, Lixin; Santoso, Agus; Lin, Xiaopei; Chan, Zhaohui; McPhaden, Michael J. (2017) Continued increase of extreme El Nino frequency long after 1.5C warming stabilisation. Nature Climate Change, 7, 568-572.
11 Cai, Wenju; Borlace, Simon; Lengaigne, Matthieu; van Rensch, Peter; Collins, Mat; Vecchi, Gabriel; Timmerman, Axel; Santoso, Agus; McPhaden, Michael J.; Wu, Lixin;
England, Matthew H.; Wang, Guojian; Guilyardi, Eric; Jin, Fei-Fei (2014) Increasing frequency of extreme El Nino events due to greenhouse warming. Nature Climate Change, 4, 111-116
12 FCFA (2017a) Op. cit.13 FCFA (2017a) Op. cit.14 FCFA (2017c) How to understand and
interpret global climate model results. Cape Town: Future Climate for Africa. www.futureclimateafrica.org/resource/how-to-understand-and-interpret-global-climate-model-results/
15 FCFA (2017a) Op. cit.16 FCFA (2017c) Op. cit.17 FCFA (2017a) Op. cit.18 FCFA (2017a) Op. cit.19 FCFA (2017a) Op. cit.
Funded by:
Fron
t cov
er p
hoto
: Neh
a M
ittal
|
Fro
nt in
side
cov
er: A
jay
Bhav
e |
Ba
ck in
side
cov
er: A
ndre
w M
oore
/Flic
kr