Furzer Crestani Forensic -----ABOUT FURZER CRESTANI FORENSIC Since 1985, Furzer Crestani Forensic...
30
www.furzercrestani.com.au - - - - - - - - - - ABOUT FURZER CRESTANI FORENSIC Since 1985, Furzer Crestani Forensic has provided a broad range of forensic accounting and related services across a variety of industries. We have been engaged on behalf of plaintiffs and defendants, as well as a single expert, shadow expert and independent referee. You and your clients will benefit from our team's extensive knowledge and skill set, as well as our comprehensive library of resources. Provision of expert witness testimony Detailed economic loss reports Costs of funds management reports Reports on complex commercial claims Financial investigations Reports dealing with estate and will disputes Get in touch with one of our expert forensic accountant specialists to discuss how we can assist you by calling us on (02) 9635 3044. Our services include: Compensation to Relatives claims Quantifying damages, including future care and other needs Calculations for negotiation purposes Business and entity valuations © Furzer Crestani Forensic 2018 Forensic Accounting and Financial Investigations
Transcript of Furzer Crestani Forensic -----ABOUT FURZER CRESTANI FORENSIC Since 1985, Furzer Crestani Forensic...
www.furzercrestani.com.au
-
-
-
-
-
-
-
-
-
-
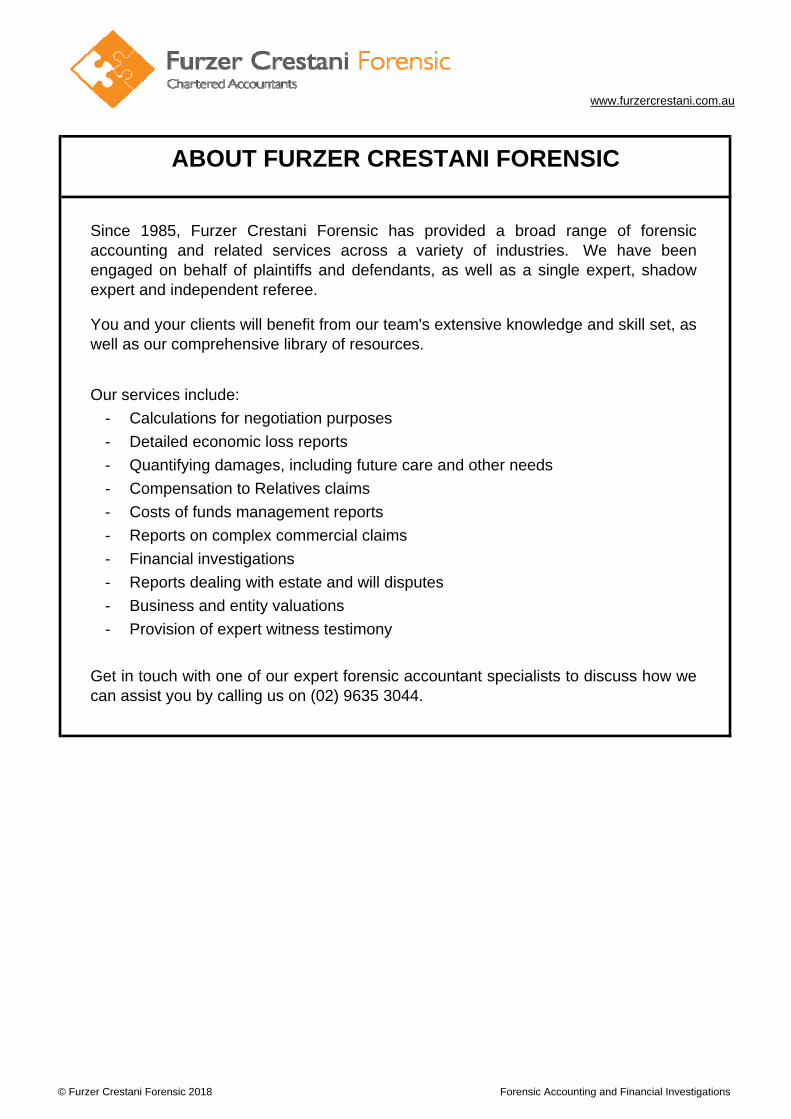
ABOUT FURZER CRESTANI FORENSIC
Since 1985, Furzer Crestani Forensic has provided a broad range of forensicaccounting and related services across a variety of industries. We have beenengaged on behalf of plaintiffs and defendants, as well as a single expert, shadowexpert and independent referee.
You and your clients will benefit from our team's extensive knowledge and skill set, aswell as our comprehensive library of resources.
Provision of expert witness testimony
Detailed economic loss reports
Costs of funds management reports
Reports on complex commercial claims
Financial investigations
Reports dealing with estate and will disputes
Get in touch with one of our expert forensic accountant specialists to discuss how wecan assist you by calling us on (02) 9635 3044.
Our services include:
Compensation to Relatives claims
Quantifying damages, including future care and other needs
Calculations for negotiation purposes
Business and entity valuations
© Furzer Crestani Forensic 2018 Forensic Accounting and Financial Investigations
www.furzercrestani.com.au
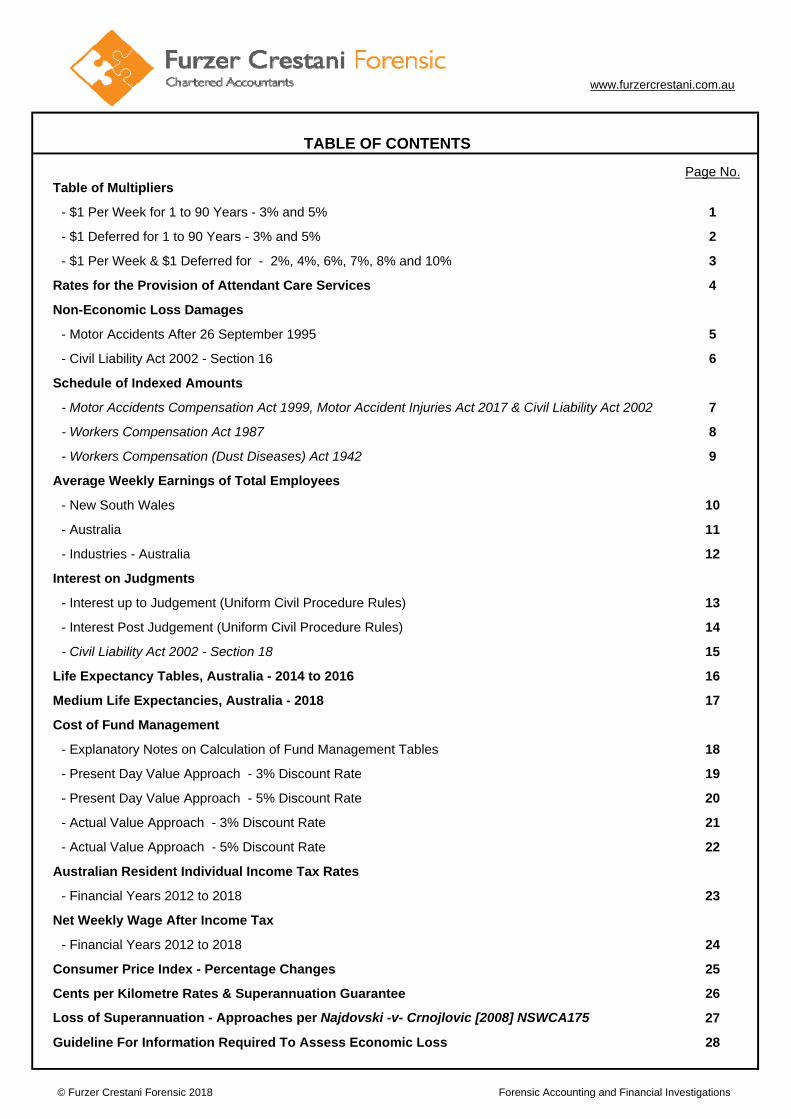
Page No.Table of Multipliers
- $1 Per Week for 1 to 90 Years - 3% and 5% 1
- $1 Deferred for 1 to 90 Years - 3% and 5% 2
- $1 Per Week & $1 Deferred for - 2%, 4%, 6%, 7%, 8% and 10% 3
Rates for the Provision of Attendant Care Services 4
Non-Economic Loss Damages
- Motor Accidents After 26 September 1995 5
- Civil Liability Act 2002 - Section 16 6
Schedule of Indexed Amounts
- Motor Accidents Compensation Act 1999, Motor Accident Injuries Act 2017 & Civil Liability Act 2002 7
- Workers Compensation Act 1987 8
- Workers Compensation (Dust Diseases) Act 1942 9
Average Weekly Earnings of Total Employees
- New South Wales 10
- Australia 11
- Industries - Australia 12
Interest on Judgments
- Interest up to Judgement (Uniform Civil Procedure Rules) 13
- Interest Post Judgement (Uniform Civil Procedure Rules) 14
- Civil Liability Act 2002 - Section 18 15
Life Expectancy Tables, Australia - 2014 to 2016 16
Medium Life Expectancies, Australia - 2018 17
Cost of Fund Management
- Explanatory Notes on Calculation of Fund Management Tables 18
- Present Day Value Approach - 3% Discount Rate 19
- Present Day Value Approach - 5% Discount Rate 20
- Actual Value Approach - 3% Discount Rate 21
- Actual Value Approach - 5% Discount Rate 22
Australian Resident Individual Income Tax Rates
- Financial Years 2012 to 2018 23
Net Weekly Wage After Income Tax
- Financial Years 2012 to 2018 24
Consumer Price Index - Percentage Changes 25
Cents per Kilometre Rates & Superannuation Guarantee 26
Loss of Superannuation - Approaches per Najdovski -v- Crnojlovic [2008] NSWCA175 27
Guideline For Information Required To Assess Economic Loss 28
TABLE OF CONTENTS
© Furzer Crestani Forensic 2018 Forensic Accounting and Financial Investigations
Page 1
www.furzercrestani.com.au
Years 3% 5% Years 3% 5% Years 3% 5%
1 51.4 50.9 31 1,059.2 833.8 61 1,474.4 1,014.9
2 101.3 99.4 32 1,079.8 845.0 62 1,482.9 1,017.5
3 149.8 145.6 33 1,099.8 855.7 63 1,491.1 1,020.0
4 196.9 189.6 34 1,119.2 865.9 64 1,499.1 1,022.3
5 242.6 231.5 35 1,138.0 875.6 65 1,506.8 1,024.6
6 286.9 271.4 36 1,156.2 884.8 66 1,514.4 1,026.7
7 330.0 309.4 37 1,174.0 893.6 67 1,521.7 1,028.8
8 371.8 345.6 38 1,191.2 902.0 68 1,528.8 1,030.7
9 412.4 380.1 39 1,207.9 909.9 69 1,535.6 1,032.5
10 451.8 412.9 40 1,224.2 917.5 70 1,542.3 1,034.3
11 490.0 444.1 41 1,239.9 924.8 71 1,548.8 1,036.0
12 527.2 473.9 42 1,255.2 931.6 72 1,555.1 1,037.6
13 563.3 502.3 43 1,270.1 938.2 73 1,561.2 1,039.1
14 598.3 529.3 44 1,284.5 944.5 74 1,567.2 1,040.5
15 632.3 555.0 45 1,298.5 950.4 75 1,573.0 1,041.9
16 665.3 579.5 46 1,312.1 956.1 76 1,578.6 1,043.2
17 697.3 602.8 47 1,325.3 961.5 77 1,584.0 1,044.5
18 728.4 625.0 48 1,338.1 966.6 78 1,589.3 1,045.7
19 758.6 646.2 49 1,350.6 971.5 79 1,594.4 1,046.8
20 787.9 666.4 50 1,362.6 976.2 80 1,599.4 1,047.9
21 816.4 685.6 51 1,374.4 980.6 81 1,604.2 1,048.9
22 844.0 703.8 52 1,385.7 984.9 82 1,608.9 1,049.9
23 870.9 721.2 53 1,396.8 988.9 83 1,613.4 1,050.8
24 896.9 737.8 54 1,407.5 992.7 84 1,617.9 1,051.7
25 922.2 753.6 55 1,418.0 996.4 85 1,622.2 1,052.5
26 946.8 768.7 56 1,428.1 999.8 86 1,626.3 1,053.3
27 970.6 783.0 57 1,437.9 1,003.2 87 1,630.4 1,054.1
28 993.8 796.6 58 1,447.4 1,006.3 88 1,634.3 1,054.8
29 1,016.2 809.6 59 1,456.7 1,009.3 89 1,638.1 1,055.5
30 1,038.1 822.0 60 1,465.7 1,012.2 90 1,641.8 1,056.2
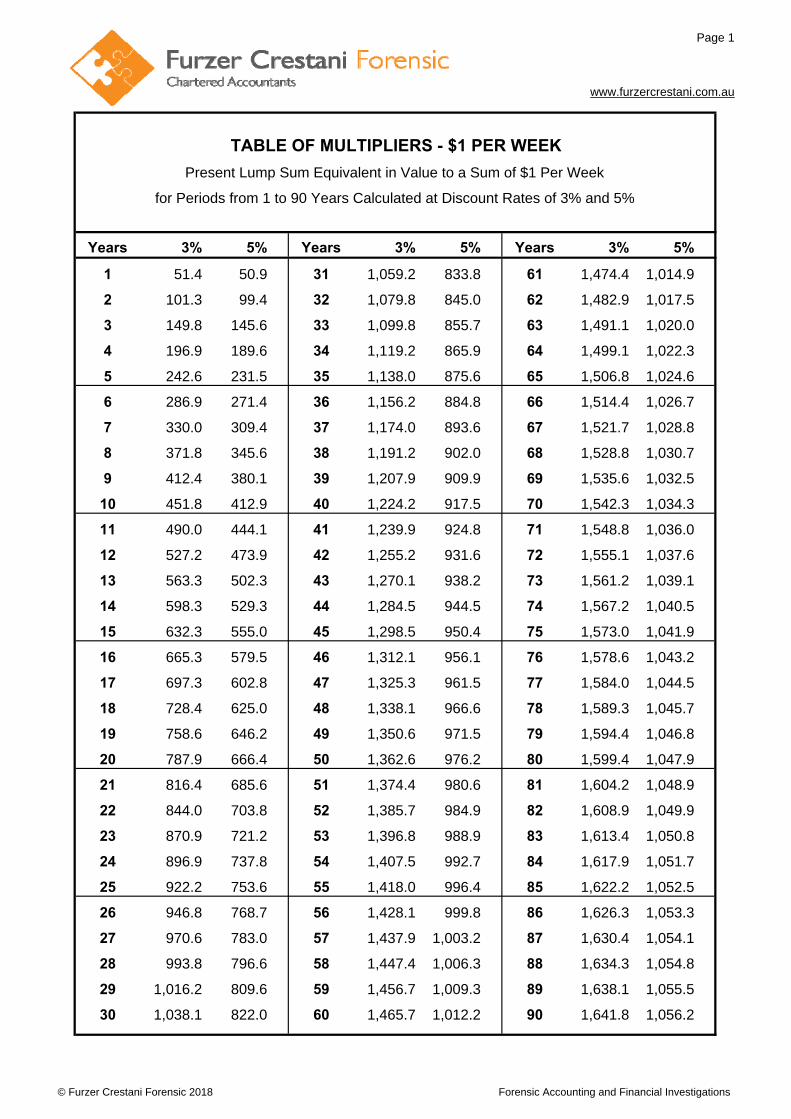
Present Lump Sum Equivalent in Value to a Sum of $1 Per Week
for Periods from 1 to 90 Years Calculated at Discount Rates of 3% and 5%
TABLE OF MULTIPLIERS - $1 PER WEEK
© Furzer Crestani Forensic 2018 Forensic Accounting and Financial Investigations
Page 2
www.furzercrestani.com.au
Years 3% 5% Years 3% 5% Years 3% 5%
1 0.971 0.952 31 0.400 0.220 61 0.165 0.051
2 0.943 0.907 32 0.388 0.210 62 0.160 0.049
3 0.915 0.864 33 0.377 0.200 63 0.155 0.046
4 0.888 0.823 34 0.366 0.190 64 0.151 0.044
5 0.863 0.784 35 0.355 0.181 65 0.146 0.042
6 0.837 0.746 36 0.345 0.173 66 0.142 0.040
7 0.813 0.711 37 0.335 0.164 67 0.138 0.038
8 0.789 0.677 38 0.325 0.157 68 0.134 0.036
9 0.766 0.645 39 0.316 0.149 69 0.130 0.035
10 0.744 0.614 40 0.307 0.142 70 0.126 0.033
11 0.722 0.585 41 0.298 0.135 71 0.123 0.031
12 0.701 0.557 42 0.289 0.129 72 0.119 0.030
13 0.681 0.530 43 0.281 0.123 73 0.116 0.028
14 0.661 0.505 44 0.272 0.117 74 0.112 0.027
15 0.642 0.481 45 0.264 0.111 75 0.109 0.026
16 0.623 0.458 46 0.257 0.106 76 0.106 0.025
17 0.605 0.436 47 0.249 0.101 77 0.103 0.023
18 0.587 0.416 48 0.242 0.096 78 0.100 0.022
19 0.570 0.396 49 0.235 0.092 79 0.097 0.021
20 0.554 0.377 50 0.228 0.087 80 0.094 0.020
21 0.538 0.359 51 0.221 0.083 81 0.091 0.019
22 0.522 0.342 52 0.215 0.079 82 0.089 0.018
23 0.507 0.326 53 0.209 0.075 83 0.086 0.017
24 0.492 0.310 54 0.203 0.072 84 0.083 0.017
25 0.478 0.295 55 0.197 0.068 85 0.081 0.016
26 0.464 0.281 56 0.191 0.065 86 0.079 0.015
27 0.450 0.268 57 0.185 0.062 87 0.076 0.014
28 0.437 0.255 58 0.180 0.059 88 0.074 0.014
29 0.424 0.243 59 0.175 0.056 89 0.072 0.013
30 0.412 0.231 60 0.170 0.054 90 0.070 0.012
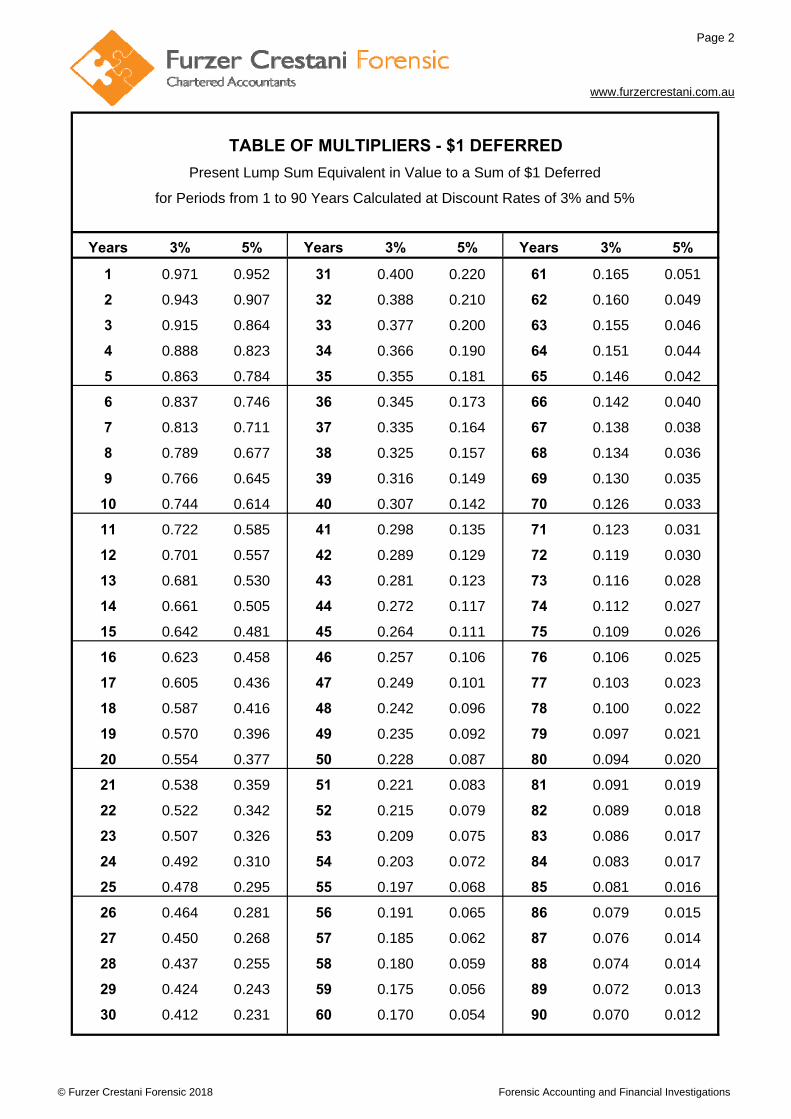
TABLE OF MULTIPLIERS - $1 DEFERRED
Present Lump Sum Equivalent in Value to a Sum of $1 Deferred
for Periods from 1 to 90 Years Calculated at Discount Rates of 3% and 5%
© Furzer Crestani Forensic 2018 Forensic Accounting and Financial Investigations
Page 3
www.furzercrestani.com.au
Years 2% 4% 6% 7% 8% 10% 2% 4% 6% 7% 8% 10%
1 51.7 51.2 50.7 50.4 50.2 49.7 0.980 0.962 0.943 0.935 0.926 0.909
2 102.3 100.4 98.5 97.6 96.7 95.0 0.961 0.925 0.890 0.873 0.857 0.826
3 152.0 147.7 143.6 141.6 139.7 136.1 0.942 0.889 0.840 0.816 0.794 0.751
4 200.7 193.2 186.1 182.8 179.6 173.5 0.924 0.855 0.792 0.763 0.735 0.683
5 248.4 236.9 226.3 221.3 216.5 207.4 0.906 0.822 0.747 0.713 0.681 0.621
6 295.3 279.0 264.2 257.3 250.7 238.3 0.888 0.790 0.705 0.666 0.630 0.564
7 341.1 319.4 299.9 290.9 282.3 266.4 0.871 0.760 0.665 0.623 0.583 0.513
8 386.1 358.3 333.6 322.3 311.6 291.9 0.853 0.731 0.627 0.582 0.540 0.467
9 430.2 395.7 365.4 351.6 338.7 315.1 0.837 0.703 0.592 0.544 0.500 0.424
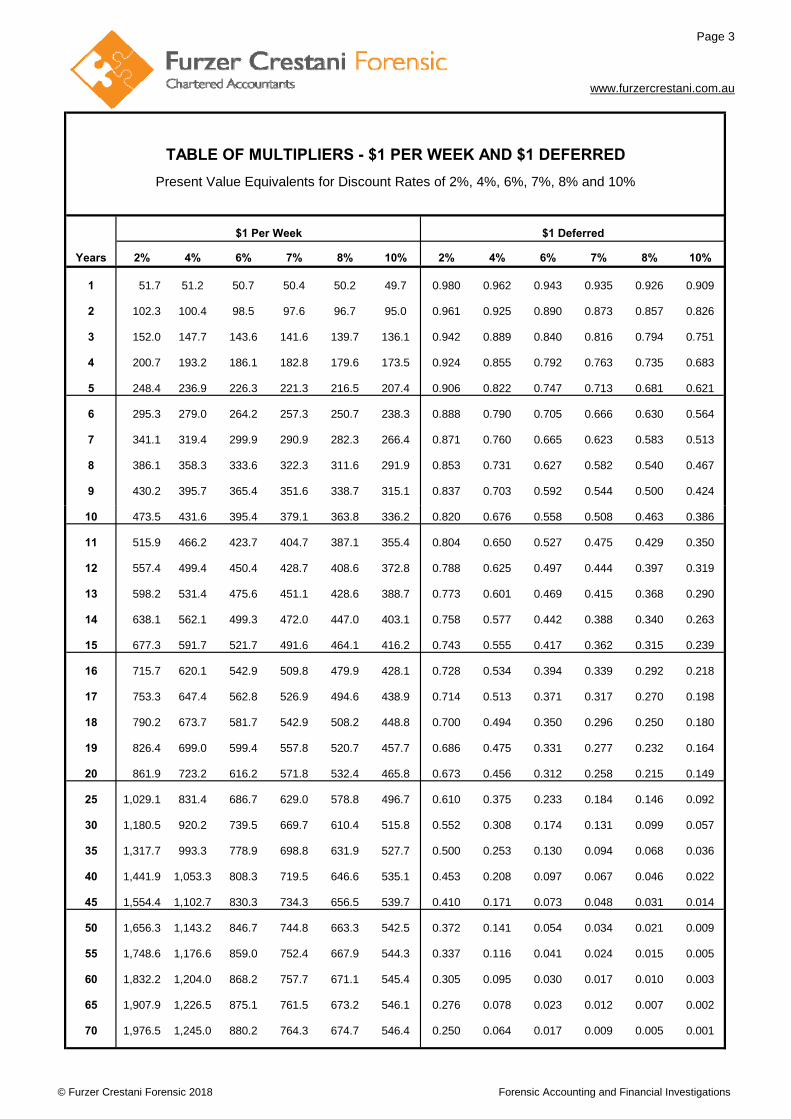
TABLE OF MULTIPLIERS - $1 PER WEEK AND $1 DEFERRED
$1 Per Week $1 Deferred
Present Value Equivalents for Discount Rates of 2%, 4%, 6%, 7%, 8% and 10%
10 473.5 431.6 395.4 379.1 363.8 336.2 0.820 0.676 0.558 0.508 0.463 0.386
11 515.9 466.2 423.7 404.7 387.1 355.4 0.804 0.650 0.527 0.475 0.429 0.350
12 557.4 499.4 450.4 428.7 408.6 372.8 0.788 0.625 0.497 0.444 0.397 0.319
13 598.2 531.4 475.6 451.1 428.6 388.7 0.773 0.601 0.469 0.415 0.368 0.290
14 638.1 562.1 499.3 472.0 447.0 403.1 0.758 0.577 0.442 0.388 0.340 0.263
15 677.3 591.7 521.7 491.6 464.1 416.2 0.743 0.555 0.417 0.362 0.315 0.239
16 715.7 620.1 542.9 509.8 479.9 428.1 0.728 0.534 0.394 0.339 0.292 0.218
17 753.3 647.4 562.8 526.9 494.6 438.9 0.714 0.513 0.371 0.317 0.270 0.198
18 790.2 673.7 581.7 542.9 508.2 448.8 0.700 0.494 0.350 0.296 0.250 0.180
19 826.4 699.0 599.4 557.8 520.7 457.7 0.686 0.475 0.331 0.277 0.232 0.164
20 861.9 723.2 616.2 571.8 532.4 465.8 0.673 0.456 0.312 0.258 0.215 0.149
25 1,029.1 831.4 686.7 629.0 578.8 496.7 0.610 0.375 0.233 0.184 0.146 0.092
30 1,180.5 920.2 739.5 669.7 610.4 515.8 0.552 0.308 0.174 0.131 0.099 0.057
35 1,317.7 993.3 778.9 698.8 631.9 527.7 0.500 0.253 0.130 0.094 0.068 0.036
40 1,441.9 1,053.3 808.3 719.5 646.6 535.1 0.453 0.208 0.097 0.067 0.046 0.022
45 1,554.4 1,102.7 830.3 734.3 656.5 539.7 0.410 0.171 0.073 0.048 0.031 0.014
50 1,656.3 1,143.2 846.7 744.8 663.3 542.5 0.372 0.141 0.054 0.034 0.021 0.009
55 1,748.6 1,176.6 859.0 752.4 667.9 544.3 0.337 0.116 0.041 0.024 0.015 0.005
60 1,832.2 1,204.0 868.2 757.7 671.1 545.4 0.305 0.095 0.030 0.017 0.010 0.003
65 1,907.9 1,226.5 875.1 761.5 673.2 546.1 0.276 0.078 0.023 0.012 0.007 0.002
70 1,976.5 1,245.0 880.2 764.3 674.7 546.4 0.250 0.064 0.017 0.009 0.005 0.001
© Furzer Crestani Forensic 2018 Forensic Accounting and Financial Investigations
Page 4
Updated: 24 April 2018
www.furzercrestani.com.au
Gross Wage Rate Per
Before Tax Hour - 1/40th
21/02/2009 to 15/05/2009 939.00 23.48
16/05/2009 to 21/08/2009 959.90 24.00
22/08/2009 to 20/11/2009 969.40 24.24
21/11/2009 to 19/02/2010 989.90 24.75
20/02/2010 to 21/05/2010 986.90 24.67
22/05/2010 to 20/08/2010 985.50 24.64
21/08/2010 to 19/11/2010 996.40 24.91
20/11/2010 to 18/02/2011 1,025.90 25.65
19/02/2011 to 20/05/2011 1,026.00 25.65
21/05/2011 to 19/08/2011 1,027.10 25.68
20/08/2011 to 18/11/2011 1,016.30 25.41
19/11/2011 to 17/02/2012 1,054.70 26.37
18/02/2012 to 18/05/2012 1,054.50 26.36
19/05/2012 to 16/11/2012 1,081.20 27.03
17/11/2012 to 17/05/2013 1,107.80 27.70
18/05/2013 to 15/11/2013 1,112.90 27.82
16/11/2013 to 16/05/2014 1,118.30 27.96
17/05/2014 to 21/11/2014 1,129.50 28.24
22/11/2014 to 15/05/2015 1,154.80 28.87
16/05/2015 to 20/11/2015 1,176.30 29.41
21/11/2015 to 20/05/2016 1,199.20 29.98
21/05/2016 to 18/11/2016 1,190.80 29.77
19/11/2016 to 19/05/2017 1,205.80 30.15
20/05/2017 to 17/11/2017 1,222.10 30.55
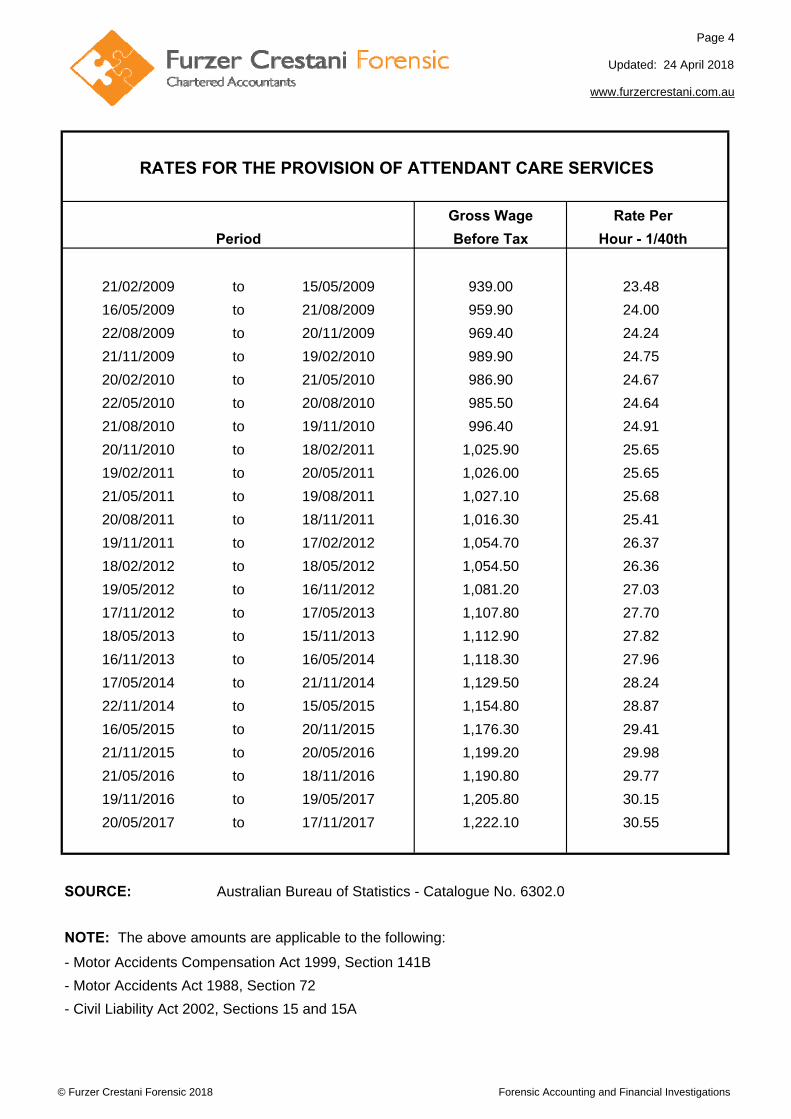
SOURCE: Australian Bureau of Statistics - Catalogue No. 6302.0
NOTE: The above amounts are applicable to the following:
- Motor Accidents Compensation Act 1999, Section 141B
- Motor Accidents Act 1988, Section 72
- Civil Liability Act 2002, Sections 15 and 15A
Period
RATES FOR THE PROVISION OF ATTENDANT CARE SERVICES
© Furzer Crestani Forensic 2018 Forensic Accounting and Financial Investigations
Page 5
Effective Date: 1 October 2017
www.furzercrestani.com.au
% of % of Max Award % of % of Max Award
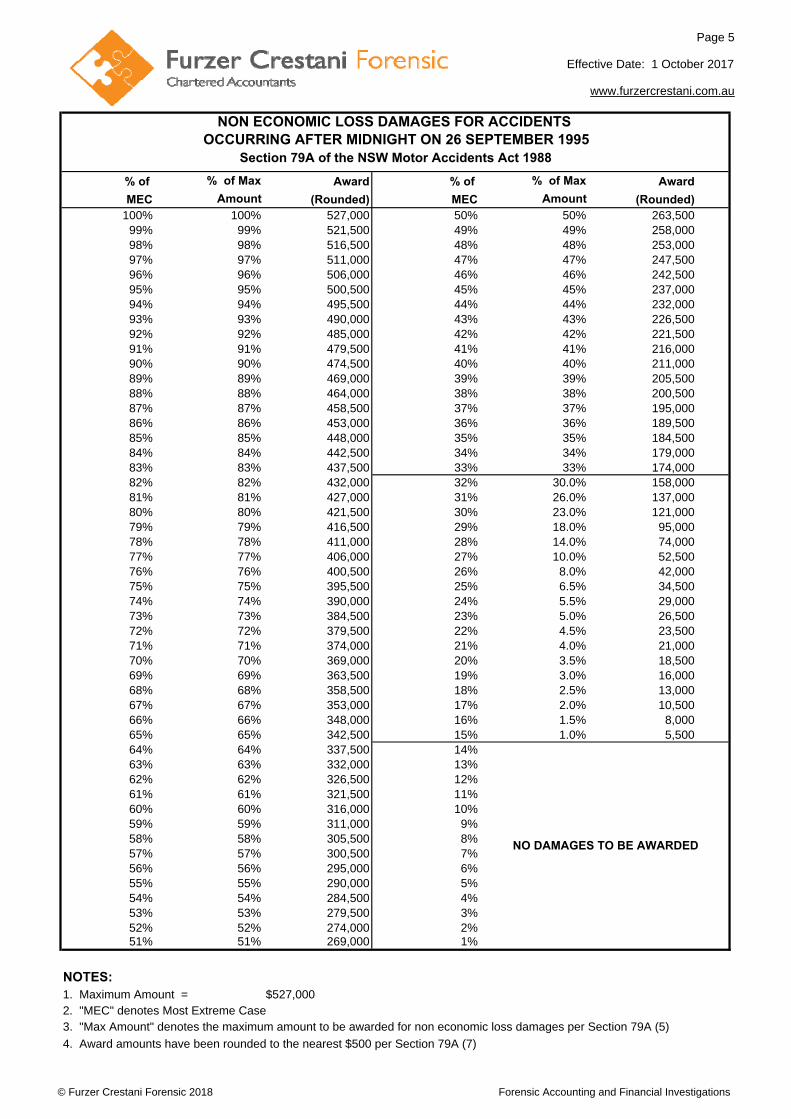
MEC Amount (Rounded) MEC Amount (Rounded)100% 100% 527,000 50% 50% 263,50099% 99% 521,500 49% 49% 258,00098% 98% 516,500 48% 48% 253,00097% 97% 511,000 47% 47% 247,50096% 96% 506,000 46% 46% 242,50095% 95% 500,500 45% 45% 237,00094% 94% 495,500 44% 44% 232,00093% 93% 490,000 43% 43% 226,50092% 92% 485,000 42% 42% 221,50091% 91% 479,500 41% 41% 216,00090% 90% 474,500 40% 40% 211,00089% 89% 469,000 39% 39% 205,50088% 88% 464,000 38% 38% 200,50087% 87% 458,500 37% 37% 195,00086% 86% 453,000 36% 36% 189,50085% 85% 448,000 35% 35% 184,50084% 84% 442,500 34% 34% 179,00083% 83% 437,500 33% 33% 174,00082% 82% 432,000 32% 30.0% 158,00081% 81% 427,000 31% 26.0% 137,00080% 80% 421,500 30% 23.0% 121,00079% 79% 416,500 29% 18.0% 95,00078% 78% 411,000 28% 14.0% 74,00077% 77% 406,000 27% 10.0% 52,50076% 76% 400,500 26% 8.0% 42,00075% 75% 395,500 25% 6.5% 34,50074% 74% 390,000 24% 5.5% 29,00073% 73% 384,500 23% 5.0% 26,50072% 72% 379,500 22% 4.5% 23,50071% 71% 374,000 21% 4.0% 21,00070% 70% 369,000 20% 3.5% 18,50069% 69% 363,500 19% 3.0% 16,00068% 68% 358,500 18% 2.5% 13,00067% 67% 353,000 17% 2.0% 10,50066% 66% 348,000 16% 1.5% 8,00065% 65% 342,500 15% 1.0% 5,50064% 64% 337,500 14%63% 63% 332,000 13%62% 62% 326,500 12%61% 61% 321,500 11%60% 60% 316,000 10%59% 59% 311,000 9%58% 58% 305,500 8%57% 57% 300,500 7%56% 56% 295,000 6%55% 55% 290,000 5%54% 54% 284,500 4%53% 53% 279,500 3%52% 52% 274,000 2%51% 51% 269,000 1%
NOTES:1. Maximum Amount = $527,0002. "MEC" denotes Most Extreme Case3. "Max Amount" denotes the maximum amount to be awarded for non economic loss damages per Section 79A (5)
4. Award amounts have been rounded to the nearest $500 per Section 79A (7)
NON ECONOMIC LOSS DAMAGES FOR ACCIDENTS OCCURRING AFTER MIDNIGHT ON 26 SEPTEMBER 1995
Section 79A of the NSW Motor Accidents Act 1988
NO DAMAGES TO BE AWARDED
© Furzer Crestani Forensic 2018 Forensic Accounting and Financial Investigations
Page 6
Effective Date: 1 October 2017
www.furzercrestani.com.au
% of % of Max Award % of % of Max Award
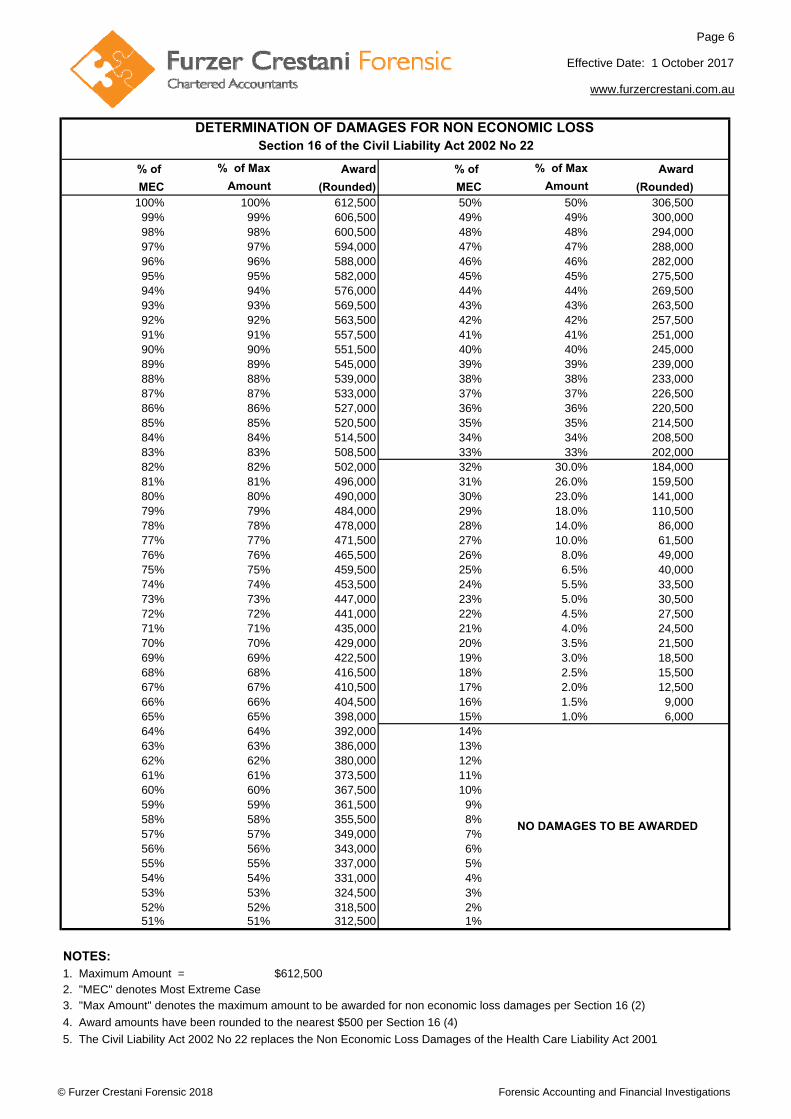
MEC Amount (Rounded) MEC Amount (Rounded)100% 100% 612,500 50% 50% 306,50099% 99% 606,500 49% 49% 300,00098% 98% 600,500 48% 48% 294,00097% 97% 594,000 47% 47% 288,00096% 96% 588,000 46% 46% 282,00095% 95% 582,000 45% 45% 275,50094% 94% 576,000 44% 44% 269,50093% 93% 569,500 43% 43% 263,50092% 92% 563,500 42% 42% 257,50091% 91% 557,500 41% 41% 251,00090% 90% 551,500 40% 40% 245,00089% 89% 545,000 39% 39% 239,00088% 88% 539,000 38% 38% 233,00087% 87% 533,000 37% 37% 226,50086% 86% 527,000 36% 36% 220,50085% 85% 520,500 35% 35% 214,50084% 84% 514,500 34% 34% 208,50083% 83% 508,500 33% 33% 202,00082% 82% 502,000 32% 30.0% 184,00081% 81% 496,000 31% 26.0% 159,50080% 80% 490,000 30% 23.0% 141,00079% 79% 484,000 29% 18.0% 110,50078% 78% 478,000 28% 14.0% 86,00077% 77% 471,500 27% 10.0% 61,50076% 76% 465,500 26% 8.0% 49,00075% 75% 459,500 25% 6.5% 40,00074% 74% 453,500 24% 5.5% 33,50073% 73% 447,000 23% 5.0% 30,50072% 72% 441,000 22% 4.5% 27,50071% 71% 435,000 21% 4.0% 24,50070% 70% 429,000 20% 3.5% 21,50069% 69% 422,500 19% 3.0% 18,50068% 68% 416,500 18% 2.5% 15,50067% 67% 410,500 17% 2.0% 12,50066% 66% 404,500 16% 1.5% 9,00065% 65% 398,000 15% 1.0% 6,00064% 64% 392,000 14%63% 63% 386,000 13%62% 62% 380,000 12%61% 61% 373,500 11%60% 60% 367,500 10%59% 59% 361,500 9%58% 58% 355,500 8%57% 57% 349,000 7%56% 56% 343,000 6%55% 55% 337,000 5%54% 54% 331,000 4%53% 53% 324,500 3%52% 52% 318,500 2%51% 51% 312,500 1%
NOTES:1. Maximum Amount = $612,5002. "MEC" denotes Most Extreme Case3. "Max Amount" denotes the maximum amount to be awarded for non economic loss damages per Section 16 (2)
4. Award amounts have been rounded to the nearest $500 per Section 16 (4)
5. The Civil Liability Act 2002 No 22 replaces the Non Economic Loss Damages of the Health Care Liability Act 2001
DETERMINATION OF DAMAGES FOR NON ECONOMIC LOSS Section 16 of the Civil Liability Act 2002 No 22
NO DAMAGES TO BE AWARDED
© Furzer Crestani Forensic 2018 Forensic Accounting and Financial Investigations
Page 7
Updated: 1 October 2017
www.furzercrestani.com.au
Latest Amount$
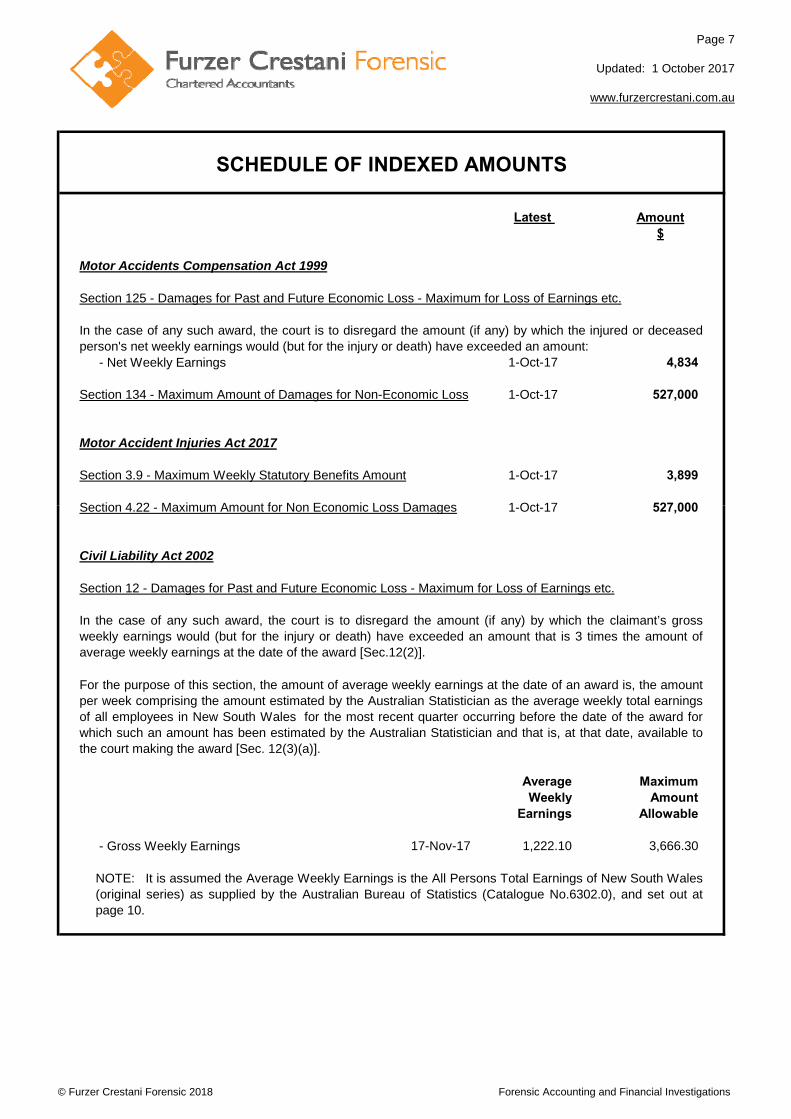
Motor Accidents Compensation Act 1999
1-Oct-17 4,834
1-Oct-17 527,000
Motor Accident Injuries Act 2017
1-Oct-17 3,899
1 Oct 17 527 000
SCHEDULE OF INDEXED AMOUNTS
- Net Weekly Earnings
Section 125 - Damages for Past and Future Economic Loss - Maximum for Loss of Earnings etc.
In the case of any such award, the court is to disregard the amount (if any) by which the injured or deceasedperson's net weekly earnings would (but for the injury or death) have exceeded an amount:
Section 4 22 Maximum Amount for Non Economic Loss Damages
Section 3.9 - Maximum Weekly Statutory Benefits Amount
Section 134 - Maximum Amount of Damages for Non-Economic Loss
1-Oct-17 527,000
Civil Liability Act 2002
Average MaximumWeekly Amount
Earnings Allowable
17-Nov-17 1,222.10 3,666.30
Section 12 - Damages for Past and Future Economic Loss - Maximum for Loss of Earnings etc.
In the case of any such award, the court is to disregard the amount (if any) by which the claimant’s grossweekly earnings would (but for the injury or death) have exceeded an amount that is 3 times the amount ofaverage weekly earnings at the date of the award [Sec.12(2)].
For the purpose of this section, the amount of average weekly earnings at the date of an award is, the amountper week comprising the amount estimated by the Australian Statistician as the average weekly total earningsof all employees in New South Wales for the most recent quarter occurring before the date of the award forwhich such an amount has been estimated by the Australian Statistician and that is, at that date, available tothe court making the award [Sec. 12(3)(a)].
NOTE: It is assumed the Average Weekly Earnings is the All Persons Total Earnings of New South Wales(original series) as supplied by the Australian Bureau of Statistics (Catalogue No.6302.0), and set out atpage 10.
- Gross Weekly Earnings
Section 4.22 - Maximum Amount for Non Economic Loss Damages
© Furzer Crestani Forensic 2018 Forensic Accounting and Financial Investigations
Page 8
Updated: 24 April 2018
www.furzercrestani.com.au
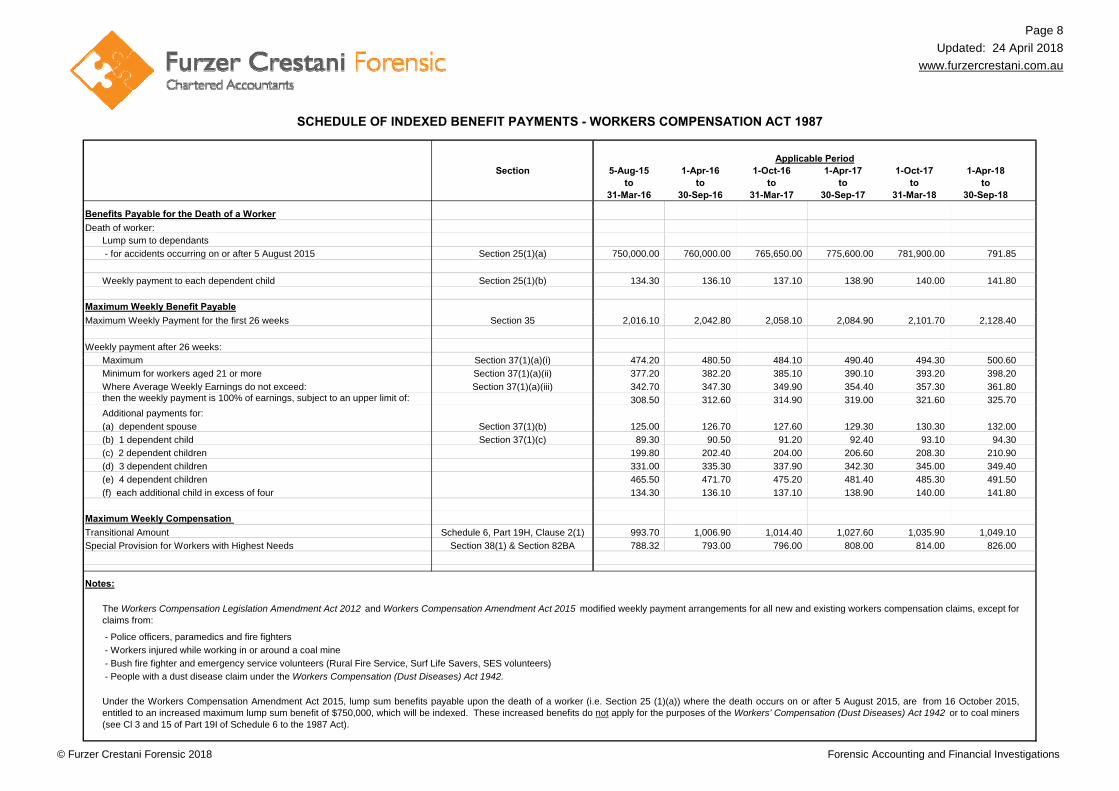
Section 5-Aug-15 1-Apr-16 1-Oct-16 1-Apr-17 1-Oct-17 1-Apr-18to to to to to to
31-Mar-16 30-Sep-16 31-Mar-17 30-Sep-17 31-Mar-18 30-Sep-18
Benefits Payable for the Death of a Worker
Death of worker: Lump sum to dependants
- for accidents occurring on or after 5 August 2015 Section 25(1)(a) 750,000.00 760,000.00 765,650.00 775,600.00 781,900.00 791.85
Weekly payment to each dependent child Section 25(1)(b) 134.30 136.10 137.10 138.90 140.00 141.80
Maximum Weekly Benefit Payable
Maximum Weekly Payment for the first 26 weeks Section 35 2,016.10 2,042.80 2,058.10 2,084.90 2,101.70 2,128.40
Weekly payment after 26 weeks:
M i S ti 37(1)( )(i) 474 20 480 50 484 10 490 40 494 30 500 60
SCHEDULE OF INDEXED BENEFIT PAYMENTS - WORKERS COMPENSATION ACT 1987
Applicable Period
Maximum Section 37(1)(a)(i) 474.20 480.50 484.10 490.40 494.30 500.60
Minimum for workers aged 21 or more Section 37(1)(a)(ii) 377.20 382.20 385.10 390.10 393.20 398.20
Where Average Weekly Earnings do not exceed: Section 37(1)(a)(iii) 342.70 347.30 349.90 354.40 357.30 361.80 then the weekly payment is 100% of earnings, subject to an upper limit of: 308.50 312.60 314.90 319.00 321.60 325.70
Additional payments for:
(a) dependent spouse Section 37(1)(b) 125.00 126.70 127.60 129.30 130.30 132.00
(b) 1 dependent child Section 37(1)(c) 89.30 90.50 91.20 92.40 93.10 94.30
(c) 2 dependent children 199.80 202.40 204.00 206.60 208.30 210.90
(d) 3 dependent children 331.00 335.30 337.90 342.30 345.00 349.40
(e) 4 dependent children 465.50 471.70 475.20 481.40 485.30 491.50
(f) each additional child in excess of four 134.30 136.10 137.10 138.90 140.00 141.80
Maximum Weekly Compensation
Transitional Amount Schedule 6, Part 19H, Clause 2(1) 993.70 1,006.90 1,014.40 1,027.60 1,035.90 1,049.10
Special Provision for Workers with Highest Needs Section 38(1) & Section 82BA 788.32 793.00 796.00 808.00 814.00 826.00
Notes:
Under the Workers Compensation Amendment Act 2015, lump sum benefits payable upon the death of a worker (i.e. Section 25 (1)(a)) where the death occurs on or after 5 August 2015, are from 16 October 2015,entitled to an increased maximum lump sum benefit of $750,000, which will be indexed. These increased benefits do not apply for the purposes of the Workers’ Compensation (Dust Diseases) Act 1942 or to coal miners(see Cl 3 and 15 of Part 19I of Schedule 6 to the 1987 Act).
- People with a dust disease claim under the Workers Compensation (Dust Diseases) Act 1942.
- Police officers, paramedics and fire fighters
- Workers injured while working in or around a coal mine
- Bush fire fighter and emergency service volunteers (Rural Fire Service, Surf Life Savers, SES volunteers)
The Workers Compensation Legislation Amendment Act 2012 and Workers Compensation Amendment Act 2015 modified weekly payment arrangements for all new and existing workers compensation claims, except forclaims from:
© Furzer Crestani Forensic 2018 Forensic Accounting and Financial Investigations
Page 9
Updated: 24 April 2018
www.furzercrestani.com.au
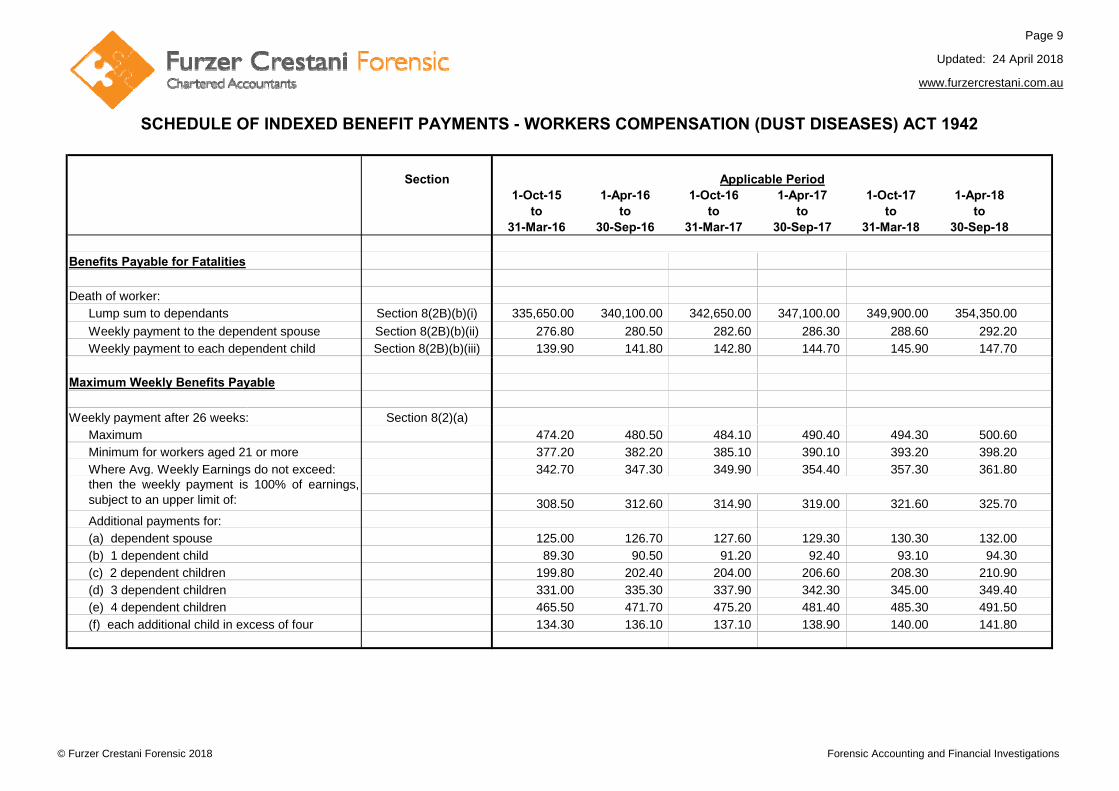
Section1-Oct-15 1-Apr-16 1-Oct-16 1-Apr-17 1-Oct-17 1-Apr-18
to to to to to to31-Mar-16 30-Sep-16 31-Mar-17 30-Sep-17 31-Mar-18 30-Sep-18
Benefits Payable for Fatalities
Death of worker: Lump sum to dependants Section 8(2B)(b)(i) 335,650.00 340,100.00 342,650.00 347,100.00 349,900.00 354,350.00
Weekly payment to the dependent spouse Section 8(2B)(b)(ii) 276.80 280.50 282.60 286.30 288.60 292.20 Weekly payment to each dependent child Section 8(2B)(b)(iii) 139.90 141.80 142.80 144.70 145.90 147.70
SCHEDULE OF INDEXED BENEFIT PAYMENTS - WORKERS COMPENSATION (DUST DISEASES) ACT 1942
Applicable Period
Maximum Weekly Benefits Payable
Weekly payment after 26 weeks: Section 8(2)(a)Maximum 474.20 480.50 484.10 490.40 494.30 500.60 Minimum for workers aged 21 or more 377.20 382.20 385.10 390.10 393.20 398.20 Where Avg. Weekly Earnings do not exceed: 342.70 347.30 349.90 354.40 357.30 361.80
308.50 312.60 314.90 319.00 321.60 325.70 Additional payments for:(a) dependent spouse 125.00 126.70 127.60 129.30 130.30 132.00 (b) 1 dependent child 89.30 90.50 91.20 92.40 93.10 94.30 (c) 2 dependent children 199.80 202.40 204.00 206.60 208.30 210.90 (d) 3 dependent children 331.00 335.30 337.90 342.30 345.00 349.40 (e) 4 dependent children 465.50 471.70 475.20 481.40 485.30 491.50 (f) each additional child in excess of four 134.30 136.10 137.10 138.90 140.00 141.80
then the weekly payment is 100% of earnings,subject to an upper limit of:
© Furzer Crestani Forensic 2018 Forensic Accounting and Financial Investigations
Page 10
Updated: 24 April 2018
www.furzercrestani.com.au
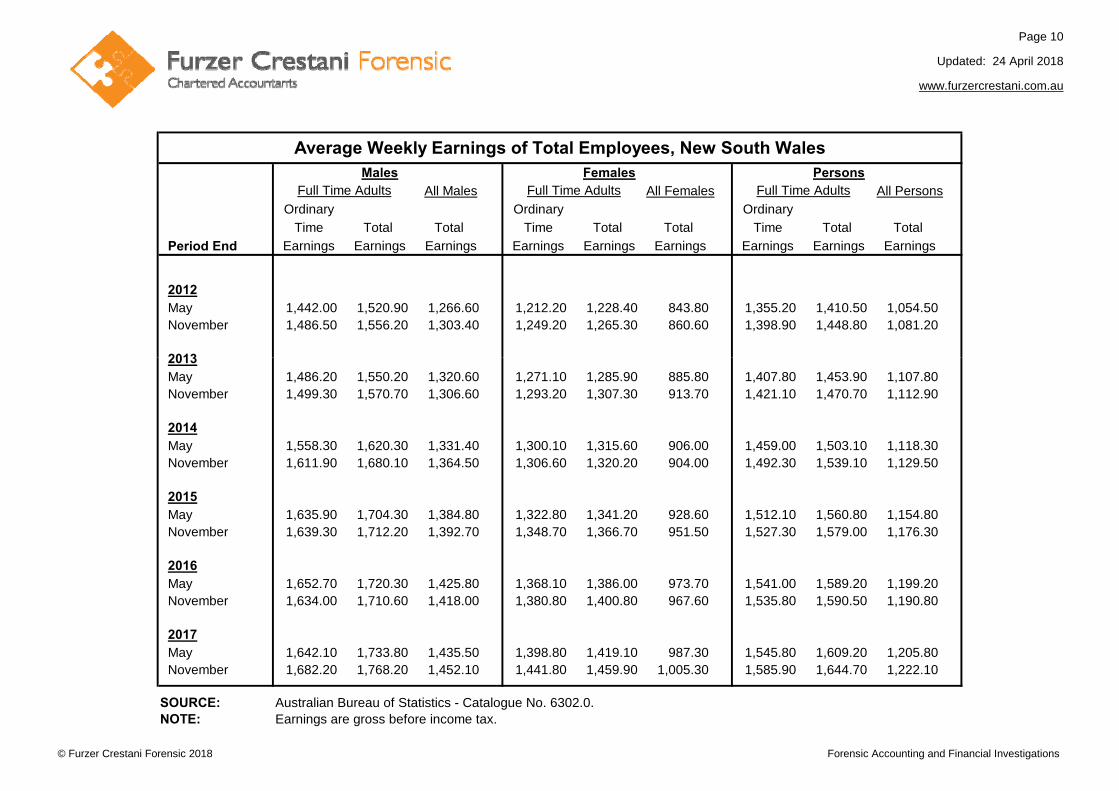
Males Females Persons
All Males All Females All Persons
Ordinary Ordinary Ordinary
Time Total Total Time Total Total Time Total Total
Period End Earnings Earnings Earnings Earnings Earnings Earnings Earnings Earnings Earnings
2012May 1,442.00 1,520.90 1,266.60 1,212.20 1,228.40 843.80 1,355.20 1,410.50 1,054.50 November 1,486.50 1,556.20 1,303.40 1,249.20 1,265.30 860.60 1,398.90 1,448.80 1,081.20
2013
Average Weekly Earnings of Total Employees, New South Wales
Full Time Adults Full Time Adults Full Time Adults
2013May 1,486.20 1,550.20 1,320.60 1,271.10 1,285.90 885.80 1,407.80 1,453.90 1,107.80 November 1,499.30 1,570.70 1,306.60 1,293.20 1,307.30 913.70 1,421.10 1,470.70 1,112.90
2014May 1,558.30 1,620.30 1,331.40 1,300.10 1,315.60 906.00 1,459.00 1,503.10 1,118.30 November 1,611.90 1,680.10 1,364.50 1,306.60 1,320.20 904.00 1,492.30 1,539.10 1,129.50
2015May 1,635.90 1,704.30 1,384.80 1,322.80 1,341.20 928.60 1,512.10 1,560.80 1,154.80 November 1,639.30 1,712.20 1,392.70 1,348.70 1,366.70 951.50 1,527.30 1,579.00 1,176.30
2016May 1,652.70 1,720.30 1,425.80 1,368.10 1,386.00 973.70 1,541.00 1,589.20 1,199.20 November 1,634.00 1,710.60 1,418.00 1,380.80 1,400.80 967.60 1,535.80 1,590.50 1,190.80
2017May 1,642.10 1,733.80 1,435.50 1,398.80 1,419.10 987.30 1,545.80 1,609.20 1,205.80 November 1,682.20 1,768.20 1,452.10 1,441.80 1,459.90 1,005.30 1,585.90 1,644.70 1,222.10
SOURCE: Australian Bureau of Statistics - Catalogue No. 6302.0.NOTE: Earnings are gross before income tax.
© Furzer Crestani Forensic 2018 Forensic Accounting and Financial Investigations

Page 11
Updated: 24 Apri l2018
www.furzercrestani.com.au
Males Females Persons
All Males All Females All Persons
Ordinary Ordinary Ordinary
Time Total Total Time Total Total Time Total Total
Period End Earnings Earnings Earnings Earnings Earnings Earnings Earnings Earnings Earnings
2012May 1,443.50 1,534.80 1,285.10 1,189.60 1,207.20 821.90 1,349.20 1,413.10 1,053.20 November 1,491.80 1,580.30 1,324.30 1,230.10 1,246.30 840.00 1,396.00 1,458.00 1,081.30
2013
Average Weekly Earnings of Total Employees, Australia
Full Time Adults Full Time Adults Full Time Adults
May 1,516.40 1,603.10 1,356.70 1,250.50 1,267.40 849.90 1,420.90 1,482.50 1,105.00November 1,532.10 1,621.50 1,347.90 1,270.50 1,287.30 872.60 1,437.00 1,500.10 1,114.20
2014May 1,560.50 1,648.20 1,364.60 1,274.40 1,292.10 881.30 1,454.10 1,515.80 1,123.00 November 1,587.50 1,681.20 1,371.50 1,292.70 1,311.00 887.90 1,477.00 1,542.40 1,128.70
2015May 1,591.60 1,674.80 1,369.50 1,307.40 1,325.50 907.80 1,483.10 1,541.50 1,136.90 November 1,603.60 1,688.60 1,374.80 1,327.60 1,345.80 914.80 1,500.50 1,560.50 1,145.70
2016May 1,613.50 1,694.50 1,395.10 1,352.10 1,369.60 925.80 1,516.00 1,573.30 1,160.90 November 1,631.90 1,719.90 1,397.90 1,370.30 1,389.60 932.40 1,533.40 1,595.50 1,163.50
2017May 1,637.20 1,725.80 1,417.20 1,386.60 1,405.50 946.80 1,543.20 1,605.60 1,179.00 November 1,665.00 1,753.50 1,427.80 1,410.80 1,429.80 959.50 1,569.60 1,632.10 1,191.50
SOURCE: Australian Bureau of Statistics - Catalogue No. 6302.0.NOTE: Earnings are gross before income tax.
© Furzer Crestani Forensic 2018 Forensic Accounting and Financial Investigations
Page 12
Updated: 24 April 2018
www.furzercrestani.com.au
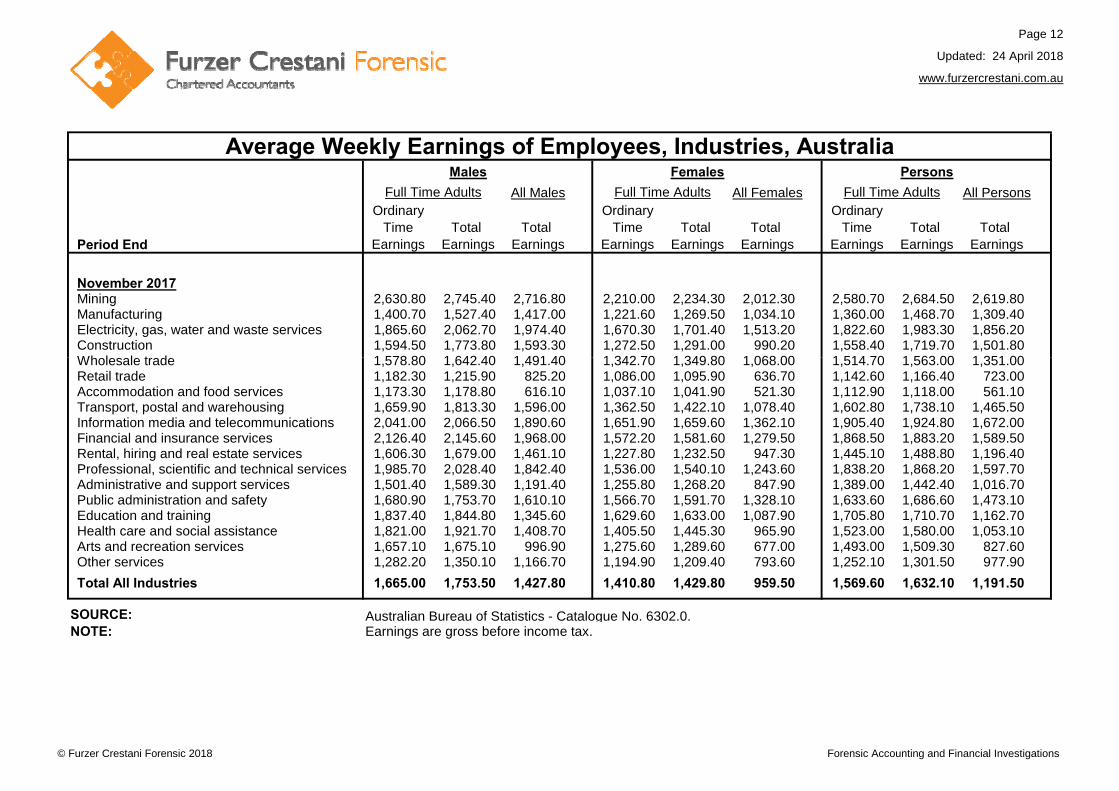
Males Females Persons
All Males All Females All Persons Ordinary Ordinary Ordinary
Time Total Total Time Total Total Time Total Total Period End Earnings Earnings Earnings Earnings Earnings Earnings Earnings Earnings Earnings
November 2017Mining 2,630.80 2,745.40 2,716.80 2,210.00 2,234.30 2,012.30 2,580.70 2,684.50 2,619.80Manufacturing 1,400.70 1,527.40 1,417.00 1,221.60 1,269.50 1,034.10 1,360.00 1,468.70 1,309.40Electricity, gas, water and waste services 1,865.60 2,062.70 1,974.40 1,670.30 1,701.40 1,513.20 1,822.60 1,983.30 1,856.20Construction 1,594.50 1,773.80 1,593.30 1,272.50 1,291.00 990.20 1,558.40 1,719.70 1,501.80Wh l l t d 1 578 80 1 642 40 1 491 40 1 342 70 1 349 80 1 068 00 1 514 70 1 563 00 1 351 00
Average Weekly Earnings of Employees, Industries, Australia
Full Time Adults Full Time Adults Full Time Adults
Wholesale trade 1,578.80 1,642.40 1,491.40 1,342.70 1,349.80 1,068.00 1,514.70 1,563.00 1,351.00Retail trade 1,182.30 1,215.90 825.20 1,086.00 1,095.90 636.70 1,142.60 1,166.40 723.00 Accommodation and food services 1,173.30 1,178.80 616.10 1,037.10 1,041.90 521.30 1,112.90 1,118.00 561.10 Transport, postal and warehousing 1,659.90 1,813.30 1,596.00 1,362.50 1,422.10 1,078.40 1,602.80 1,738.10 1,465.50Information media and telecommunications 2,041.00 2,066.50 1,890.60 1,651.90 1,659.60 1,362.10 1,905.40 1,924.80 1,672.00Financial and insurance services 2,126.40 2,145.60 1,968.00 1,572.20 1,581.60 1,279.50 1,868.50 1,883.20 1,589.50Rental, hiring and real estate services 1,606.30 1,679.00 1,461.10 1,227.80 1,232.50 947.30 1,445.10 1,488.80 1,196.40Professional, scientific and technical services 1,985.70 2,028.40 1,842.40 1,536.00 1,540.10 1,243.60 1,838.20 1,868.20 1,597.70Administrative and support services 1,501.40 1,589.30 1,191.40 1,255.80 1,268.20 847.90 1,389.00 1,442.40 1,016.70Public administration and safety 1,680.90 1,753.70 1,610.10 1,566.70 1,591.70 1,328.10 1,633.60 1,686.60 1,473.10Education and training 1,837.40 1,844.80 1,345.60 1,629.60 1,633.00 1,087.90 1,705.80 1,710.70 1,162.70Health care and social assistance 1,821.00 1,921.70 1,408.70 1,405.50 1,445.30 965.90 1,523.00 1,580.00 1,053.10Arts and recreation services 1,657.10 1,675.10 996.90 1,275.60 1,289.60 677.00 1,493.00 1,509.30 827.60 Other services 1,282.20 1,350.10 1,166.70 1,194.90 1,209.40 793.60 1,252.10 1,301.50 977.90
Total All Industries 1,665.00 1,753.50 1,427.80 1,410.80 1,429.80 959.50 1,569.60 1,632.10 1,191.50
SOURCE:NOTE: Earnings are gross before income tax.
Australian Bureau of Statistics - Catalogue No. 6302.0.
© Furzer Crestani Forensic 2018 Forensic Accounting and Financial Investigations
Page 13
Updated: 24 April 2018
www.furzercrestani.com.au
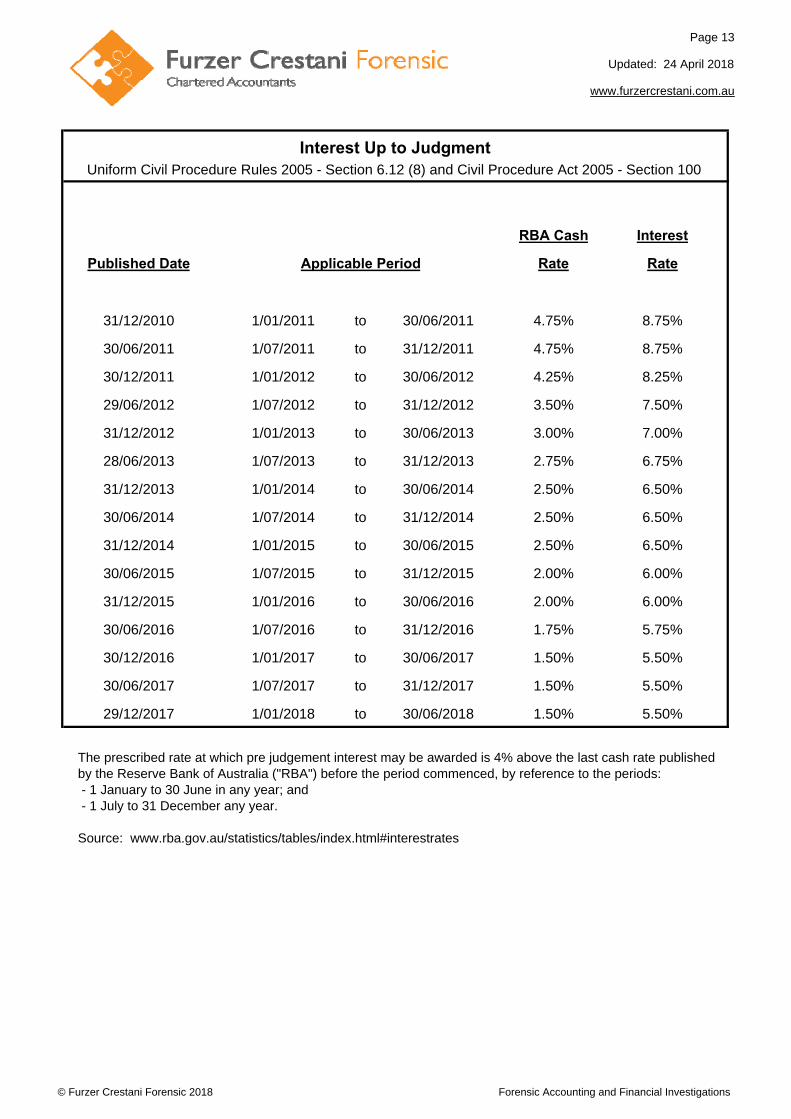
RBA Cash Interest
Published Date Rate Rate
31/12/2010 1/01/2011 to 30/06/2011 4.75% 8.75%
30/06/2011 1/07/2011 to 31/12/2011 4.75% 8.75%
30/12/2011 1/01/2012 to 30/06/2012 4.25% 8.25%
29/06/2012 1/07/2012 to 31/12/2012 3.50% 7.50%
31/12/2012 1/01/2013 to 30/06/2013 3.00% 7.00%
28/06/2013 1/07/2013 to 31/12/2013 2.75% 6.75%
31/12/2013 1/01/2014 to 30/06/2014 2.50% 6.50%
30/06/2014 1/07/2014 to 31/12/2014 2.50% 6.50%
31/12/2014 1/01/2015 to 30/06/2015 2.50% 6.50%
30/06/2015 1/07/2015 to 31/12/2015 2.00% 6.00%
31/12/2015 1/01/2016 to 30/06/2016 2.00% 6.00%
30/06/2016 1/07/2016 to 31/12/2016 1.75% 5.75%
30/12/2016 1/01/2017 to 30/06/2017 1.50% 5.50%
30/06/2017 1/07/2017 to 31/12/2017 1.50% 5.50%
29/12/2017 1/01/2018 to 30/06/2018 1.50% 5.50%
Source: www.rba.gov.au/statistics/tables/index.html#interestrates
- 1 July to 31 December any year.
Applicable Period
The prescribed rate at which pre judgement interest may be awarded is 4% above the last cash rate published by the Reserve Bank of Australia ("RBA") before the period commenced, by reference to the periods:
Interest Up to JudgmentUniform Civil Procedure Rules 2005 - Section 6.12 (8) and Civil Procedure Act 2005 - Section 100
- 1 January to 30 June in any year; and
© Furzer Crestani Forensic 2018 Forensic Accounting and Financial Investigations
Page 14
Updated: 24 April 2018
www.furzercrestani.com.au
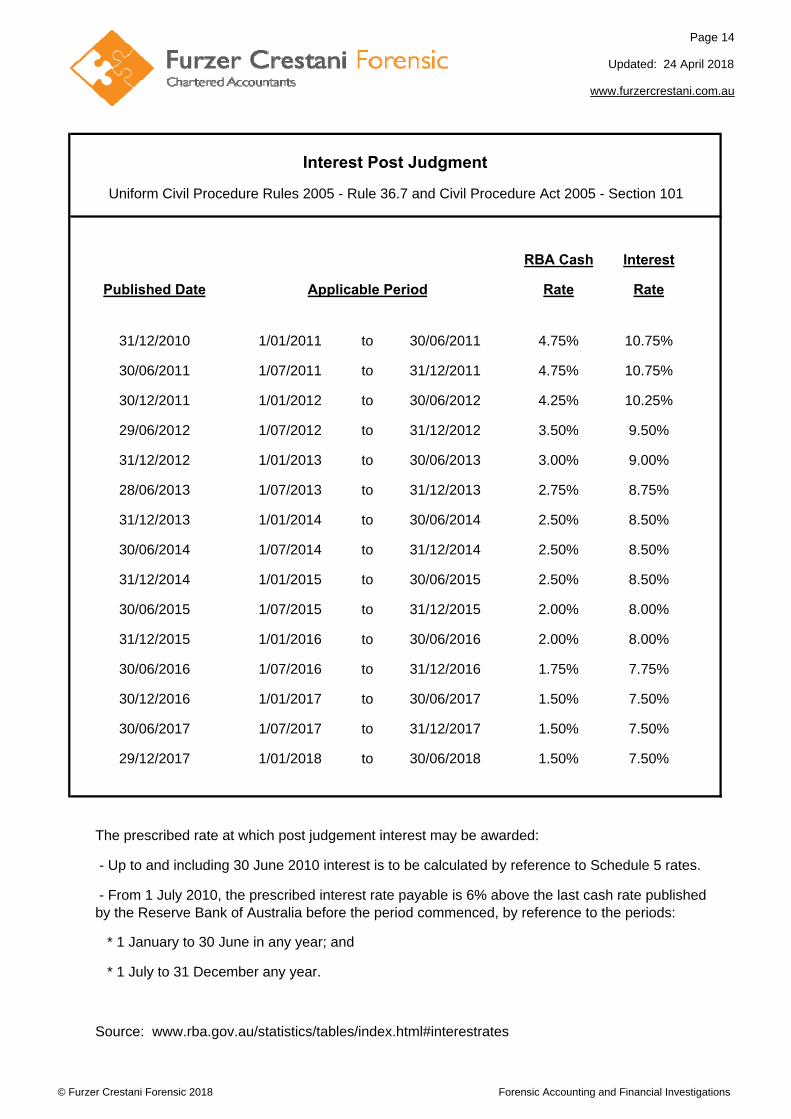
RBA Cash Interest
Published Date Rate Rate
31/12/2010 1/01/2011 to 30/06/2011 4.75% 10.75%
30/06/2011 1/07/2011 to 31/12/2011 4.75% 10.75%
30/12/2011 1/01/2012 to 30/06/2012 4.25% 10.25%
29/06/2012 1/07/2012 to 31/12/2012 3.50% 9.50%
31/12/2012 1/01/2013 to 30/06/2013 3.00% 9.00%
28/06/2013 1/07/2013 to 31/12/2013 2.75% 8.75%
31/12/2013 1/01/2014 to 30/06/2014 2.50% 8.50%
30/06/2014 1/07/2014 to 31/12/2014 2.50% 8.50%
31/12/2014 1/01/2015 to 30/06/2015 2.50% 8.50%
30/06/2015 1/07/2015 to 31/12/2015 2.00% 8.00%
31/12/2015 1/01/2016 to 30/06/2016 2.00% 8.00%
30/06/2016 1/07/2016 to 31/12/2016 1.75% 7.75%
30/12/2016 1/01/2017 to 30/06/2017 1.50% 7.50%
30/06/2017 1/07/2017 to 31/12/2017 1.50% 7.50%
29/12/2017 1/01/2018 to 30/06/2018 1.50% 7.50%
Source: www.rba.gov.au/statistics/tables/index.html#interestrates
* 1 July to 31 December any year.
The prescribed rate at which post judgement interest may be awarded:
- Up to and including 30 June 2010 interest is to be calculated by reference to Schedule 5 rates.
Interest Post Judgment
Uniform Civil Procedure Rules 2005 - Rule 36.7 and Civil Procedure Act 2005 - Section 101
Applicable Period
- From 1 July 2010, the prescribed interest rate payable is 6% above the last cash rate published by the Reserve Bank of Australia before the period commenced, by reference to the periods:
* 1 January to 30 June in any year; and
© Furzer Crestani Forensic 2018 Forensic Accounting and Financial Investigations
Page 15
Updated: 24 April 2018
www.furzercrestani.com.au
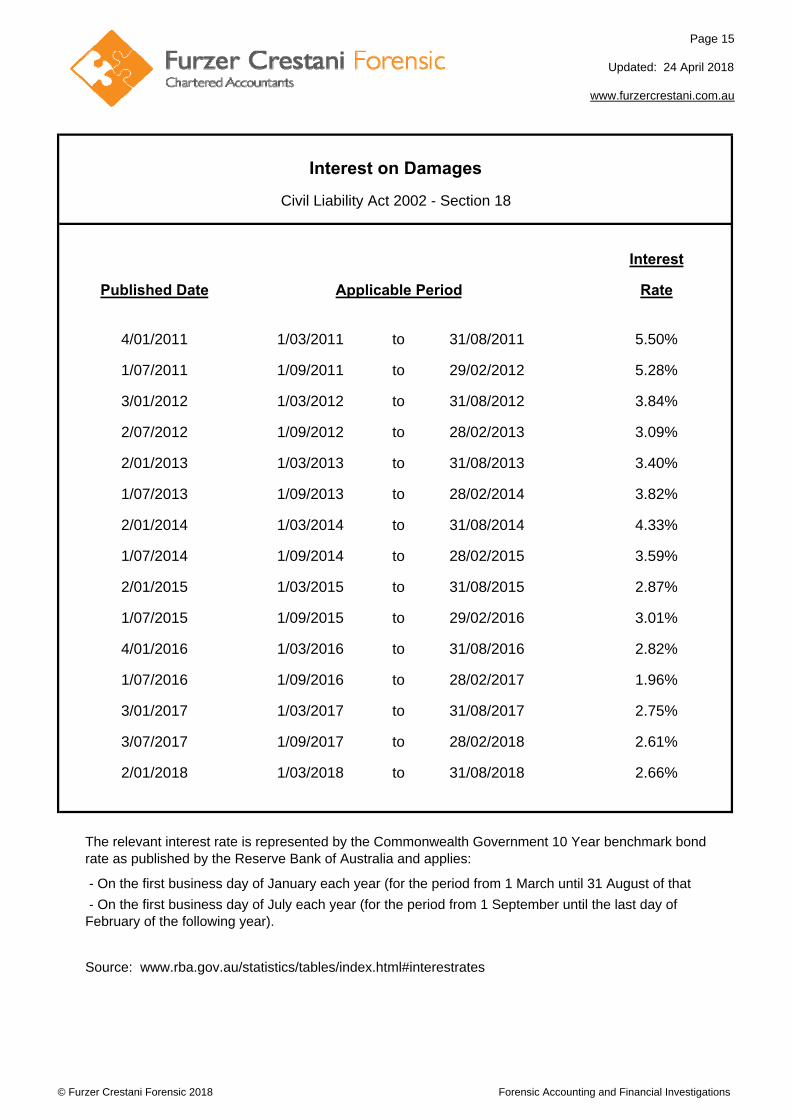
Interest
Published Date Rate
4/01/2011 1/03/2011 to 31/08/2011 5.50%
1/07/2011 1/09/2011 to 29/02/2012 5.28%
3/01/2012 1/03/2012 to 31/08/2012 3.84%
2/07/2012 1/09/2012 to 28/02/2013 3.09%
2/01/2013 1/03/2013 to 31/08/2013 3.40%
1/07/2013 1/09/2013 to 28/02/2014 3.82%
2/01/2014 1/03/2014 to 31/08/2014 4.33%
1/07/2014 1/09/2014 to 28/02/2015 3.59%
2/01/2015 1/03/2015 to 31/08/2015 2.87%
1/07/2015 1/09/2015 to 29/02/2016 3.01%
4/01/2016 1/03/2016 to 31/08/2016 2.82%
1/07/2016 1/09/2016 to 28/02/2017 1.96%
3/01/2017 1/03/2017 to 31/08/2017 2.75%
3/07/2017 1/09/2017 to 28/02/2018 2.61%
2/01/2018 1/03/2018 to 31/08/2018 2.66%
- On the first business day of January each year (for the period from 1 March until 31 August of that )
The relevant interest rate is represented by the Commonwealth Government 10 Year benchmark bond rate as published by the Reserve Bank of Australia and applies:
Source: www.rba.gov.au/statistics/tables/index.html#interestrates
Interest on Damages
Civil Liability Act 2002 - Section 18
Applicable Period
- On the first business day of July each year (for the period from 1 September until the last day of February of the following year).
© Furzer Crestani Forensic 2018 Forensic Accounting and Financial Investigations
Page 16
Updated: 19 October 2017
www.furzercrestani.com.au
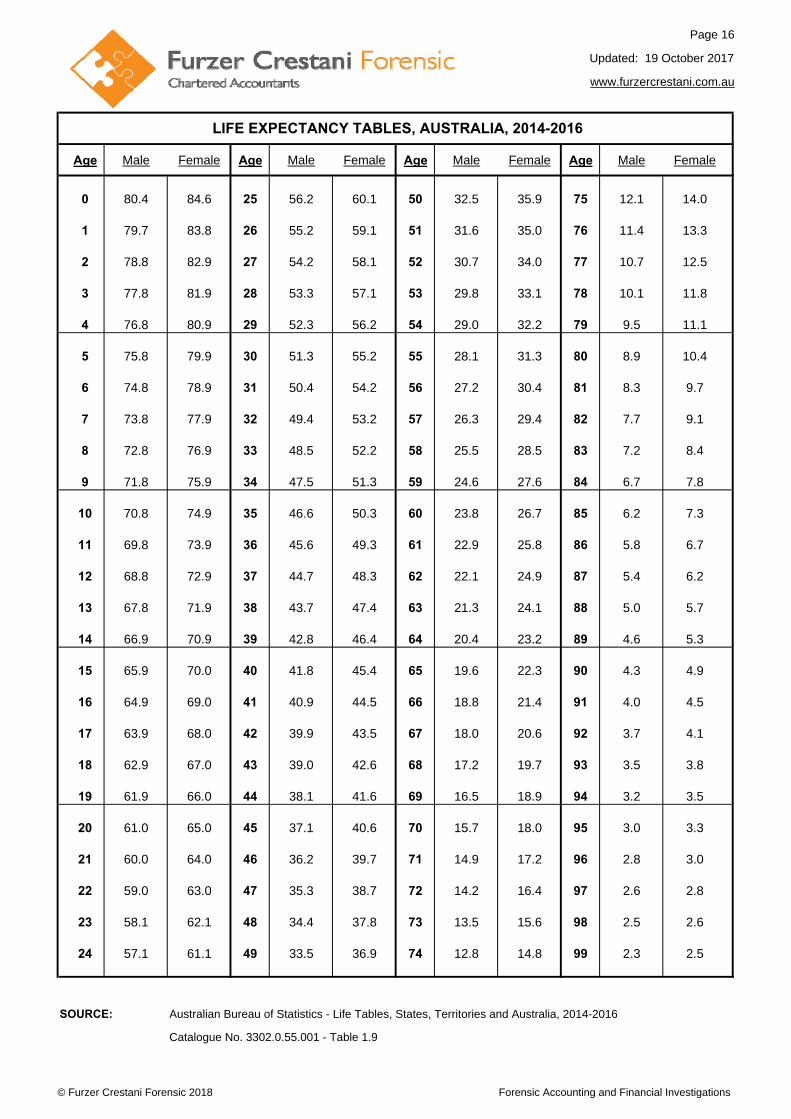
Age Male Female Age Male Female Age Male Female Age Male Female
0 80.4 84.6 25 56.2 60.1 50 32.5 35.9 75 12.1 14.0
1 79.7 83.8 26 55.2 59.1 51 31.6 35.0 76 11.4 13.3
2 78.8 82.9 27 54.2 58.1 52 30.7 34.0 77 10.7 12.5
3 77.8 81.9 28 53.3 57.1 53 29.8 33.1 78 10.1 11.8
4 76.8 80.9 29 52.3 56.2 54 29.0 32.2 79 9.5 11.1
5 75.8 79.9 30 51.3 55.2 55 28.1 31.3 80 8.9 10.4
6 74.8 78.9 31 50.4 54.2 56 27.2 30.4 81 8.3 9.7
7 73.8 77.9 32 49.4 53.2 57 26.3 29.4 82 7.7 9.1
8 72.8 76.9 33 48.5 52.2 58 25.5 28.5 83 7.2 8.4
9 71.8 75.9 34 47.5 51.3 59 24.6 27.6 84 6.7 7.8
10 70.8 74.9 35 46.6 50.3 60 23.8 26.7 85 6.2 7.3
11 69.8 73.9 36 45.6 49.3 61 22.9 25.8 86 5.8 6.7
12 68.8 72.9 37 44.7 48.3 62 22.1 24.9 87 5.4 6.2
13 67.8 71.9 38 43.7 47.4 63 21.3 24.1 88 5.0 5.7
14 66.9 70.9 39 42.8 46.4 64 20.4 23.2 89 4.6 5.3
15 65.9 70.0 40 41.8 45.4 65 19.6 22.3 90 4.3 4.9
16 64.9 69.0 41 40.9 44.5 66 18.8 21.4 91 4.0 4.5
17 63.9 68.0 42 39.9 43.5 67 18.0 20.6 92 3.7 4.1
18 62.9 67.0 43 39.0 42.6 68 17.2 19.7 93 3.5 3.8
19 61.9 66.0 44 38.1 41.6 69 16.5 18.9 94 3.2 3.5
20 61.0 65.0 45 37.1 40.6 70 15.7 18.0 95 3.0 3.3
21 60.0 64.0 46 36.2 39.7 71 14.9 17.2 96 2.8 3.0
22 59.0 63.0 47 35.3 38.7 72 14.2 16.4 97 2.6 2.8
23 58.1 62.1 48 34.4 37.8 73 13.5 15.6 98 2.5 2.6
24 57.1 61.1 49 33.5 36.9 74 12.8 14.8 99 2.3 2.5
SOURCE: Australian Bureau of Statistics - Life Tables, States, Territories and Australia, 2014-2016
Catalogue No. 3302.0.55.001 - Table 1.9
LIFE EXPECTANCY TABLES, AUSTRALIA, 2014-2016
© Furzer Crestani Forensic 2018 Forensic Accounting and Financial Investigations
Page 17
Updated: 24 April 2018
www.furzercrestani.com.au
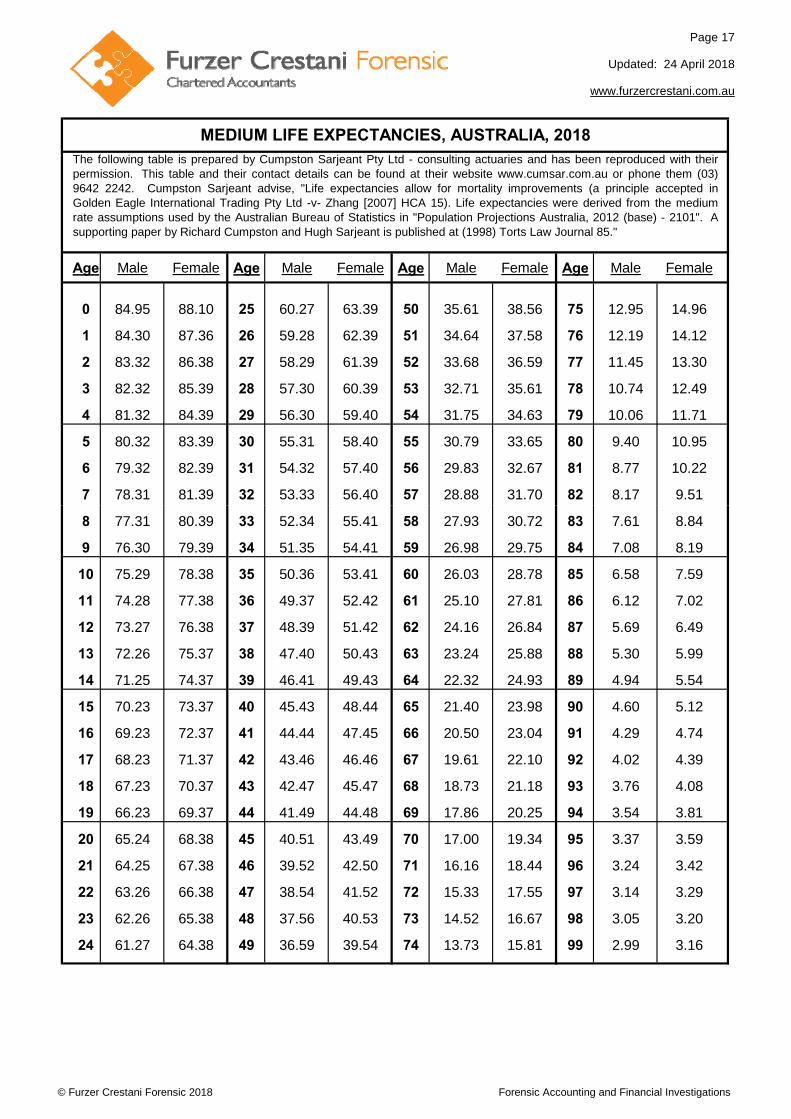
Age Male Female Age Male Female Age Male Female Age Male Female
0 84.95 88.10 25 60.27 63.39 50 35.61 38.56 75 12.95 14.96
1 84.30 87.36 26 59.28 62.39 51 34.64 37.58 76 12.19 14.12
2 83.32 86.38 27 58.29 61.39 52 33.68 36.59 77 11.45 13.30
3 82.32 85.39 28 57.30 60.39 53 32.71 35.61 78 10.74 12.49
4 81.32 84.39 29 56.30 59.40 54 31.75 34.63 79 10.06 11.71
5 80.32 83.39 30 55.31 58.40 55 30.79 33.65 80 9.40 10.95
6 79.32 82.39 31 54.32 57.40 56 29.83 32.67 81 8.77 10.22
7 78.31 81.39 32 53.33 56.40 57 28.88 31.70 82 8.17 9.51
MEDIUM LIFE EXPECTANCIES, AUSTRALIA, 2018The following table is prepared by Cumpston Sarjeant Pty Ltd - consulting actuaries and has been reproduced with theirpermission. This table and their contact details can be found at their website www.cumsar.com.au or phone them (03)9642 2242. Cumpston Sarjeant advise, "Life expectancies allow for mortality improvements (a principle accepted inGolden Eagle International Trading Pty Ltd -v- Zhang [2007] HCA 15). Life expectancies were derived from the mediumrate assumptions used by the Australian Bureau of Statistics in "Population Projections Australia, 2012 (base) - 2101". Asupporting paper by Richard Cumpston and Hugh Sarjeant is published at (1998) Torts Law Journal 85."
8 77.31 80.39 33 52.34 55.41 58 27.93 30.72 83 7.61 8.84
9 76.30 79.39 34 51.35 54.41 59 26.98 29.75 84 7.08 8.19
10 75.29 78.38 35 50.36 53.41 60 26.03 28.78 85 6.58 7.59
11 74.28 77.38 36 49.37 52.42 61 25.10 27.81 86 6.12 7.02
12 73.27 76.38 37 48.39 51.42 62 24.16 26.84 87 5.69 6.49
13 72.26 75.37 38 47.40 50.43 63 23.24 25.88 88 5.30 5.99
14 71.25 74.37 39 46.41 49.43 64 22.32 24.93 89 4.94 5.54
15 70.23 73.37 40 45.43 48.44 65 21.40 23.98 90 4.60 5.12
16 69.23 72.37 41 44.44 47.45 66 20.50 23.04 91 4.29 4.74
17 68.23 71.37 42 43.46 46.46 67 19.61 22.10 92 4.02 4.39
18 67.23 70.37 43 42.47 45.47 68 18.73 21.18 93 3.76 4.08
19 66.23 69.37 44 41.49 44.48 69 17.86 20.25 94 3.54 3.81
20 65.24 68.38 45 40.51 43.49 70 17.00 19.34 95 3.37 3.59
21 64.25 67.38 46 39.52 42.50 71 16.16 18.44 96 3.24 3.42
22 63.26 66.38 47 38.54 41.52 72 15.33 17.55 97 3.14 3.29
23 62.26 65.38 48 37.56 40.53 73 14.52 16.67 98 3.05 3.20
24 61.27 64.38 49 36.59 39.54 74 13.73 15.81 99 2.99 3.16
© Furzer Crestani Forensic 2018 Forensic Accounting and Financial Investigations
Page 18
www.furzercrestani.com.au
1.
2.
a)
b)
i)
ii)
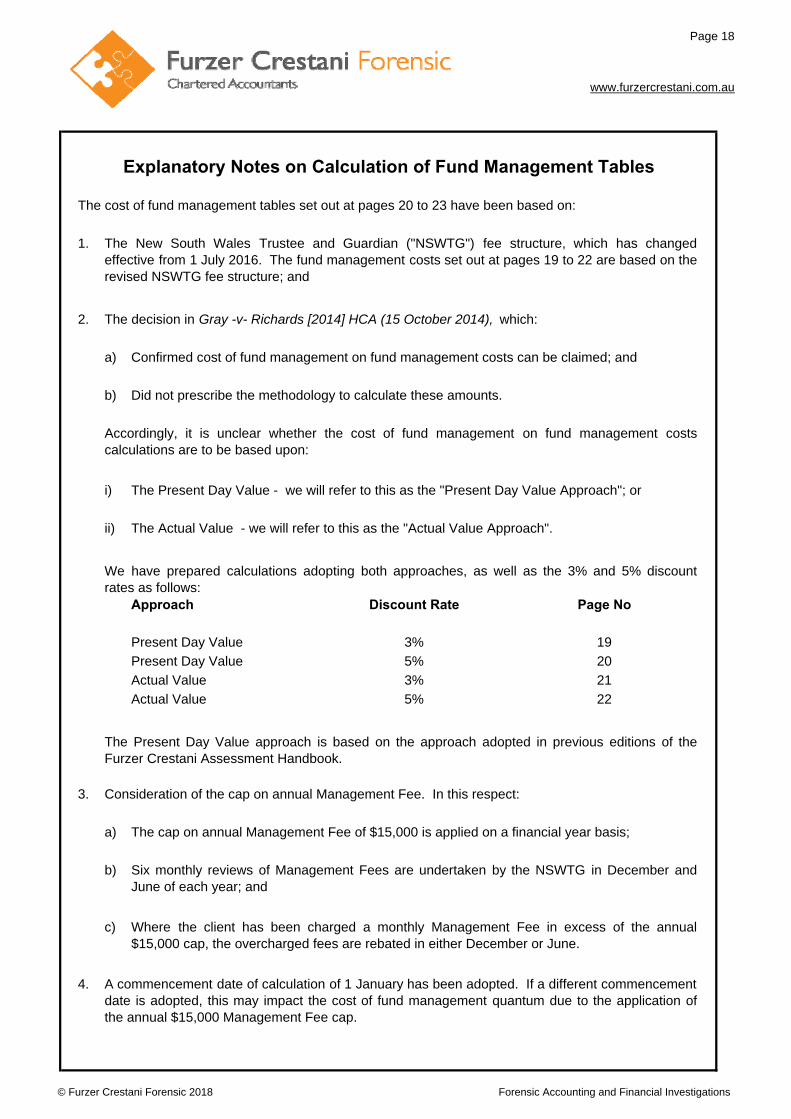
Approach Discount Rate Page No
Present Day Value 3% 19
Present Day Value 5% 20
Actual Value 3% 21
Actual Value 5% 22
3.
a)
b)
c)
4.
Explanatory Notes on Calculation of Fund Management Tables
The cost of fund management tables set out at pages 20 to 23 have been based on:
The New South Wales Trustee and Guardian ("NSWTG") fee structure, which has changedeffective from 1 July 2016. The fund management costs set out at pages 19 to 22 are based on therevised NSWTG fee structure; and
The Actual Value - we will refer to this as the "Actual Value Approach".
The decision in Gray -v- Richards [2014] HCA (15 October 2014), which:
Confirmed cost of fund management on fund management costs can be claimed; and
Did not prescribe the methodology to calculate these amounts.
The Present Day Value - we will refer to this as the "Present Day Value Approach"; or
Accordingly, it is unclear whether the cost of fund management on fund management costscalculations are to be based upon:
The cap on annual Management Fee of $15,000 is applied on a financial year basis;
Six monthly reviews of Management Fees are undertaken by the NSWTG in December andJune of each year; and
Where the client has been charged a monthly Management Fee in excess of the annual$15,000 cap, the overcharged fees are rebated in either December or June.
We have prepared calculations adopting both approaches, as well as the 3% and 5% discountrates as follows:
The Present Day Value approach is based on the approach adopted in previous editions of theFurzer Crestani Assessment Handbook.
A commencement date of calculation of 1 January has been adopted. If a different commencementdate is adopted, this may impact the cost of fund management quantum due to the application ofthe annual $15,000 Management Fee cap.
Consideration of the cap on annual Management Fee. In this respect:
© Furzer Crestani Forensic 2018 Forensic Accounting and Financial Investigations

Page 19
www.furzercrestani.com.au
Value of
Damages 10 15 20 25 30 35 40 45 50 60 70 80
500,000 39,303 56,123 71,922 86,765 100,542 113,461 125,556 136,698 147,055 165,698 181,865 195,787
1,000,000 74,697 107,879 139,092 167,875 194,501 219,106 241,633 262,377 281,363 314,768 342,913 366,696
1,500,000 102,468 144,928 183,475 218,517 250,278 279,078 305,063 328,650 349,918 386,632 416,922 441,718
2,000,000 119,087 166,524 209,044 246,972 281,147 311,699 339,227 363,868 386,026 423,804 454,378 479,154
2,500,000 128,711 178,910 223,886 264,033 299,869 331,846 360,417 385,961 408,803 447,431 478,389 503,227
PRESENT DAY VALUE APPROACH OF COST OF FUND MANAGEMENT ON FUND MANAGEMENT COSTS
USING 3% DISCOUNT RATE
3,000,000 135,301 188,158 235,247 276,969 314,240 347,372 376,768 403,007 426,384 465,731 497,054 522,045
3,500,000 141,209 195,613 244,565 287,650 326,160 360,146 390,416 417,299 441,184 481,301 513,122 538,390
4,000,000 145,560 202,445 252,468 296,969 336,533 371,511 402,424 429,953 454,355 495,294 527,672 553,397
4,500,000 149,738 207,981 259,678 305,463 346,025 381,771 413,453 441,577 466,504 508,308 541,290 567,389
5,000,000 153,892 213,517 266,362 313,215 354,646 391,311 423,750 452,487 477,905 520,576 554,209 580,846
5,500,000 157,776 218,676 272,718 320,578 362,902 400,388 433,516 462,866 488,826 532,347 566,669 593,830
6,000,000 160,816 223,195 278,502 327,477 370,816 409,111 442,956 472,911 499,400 543,809 578,818 606,589
6,500,000 163,863 227,710 284,292 334,389 378,508 417,468 451,997 482,575 509,666 554,999 590,735 619,100
7,000,000 166,902 232,219 290,094 340,876 385,825 425,707 460,973 492,119 519,698 565,974 602,444 631,454
NOTE: Before any reliance is placed on the above table, please read the Explanatory Notes on the Calculation of Fund Management Tables as set out at page 18.
© Furzer Crestani Forensic 201 Forensic Accounting and Financial Investigations
Page 20
www.furzercrestani.com.au
Value of
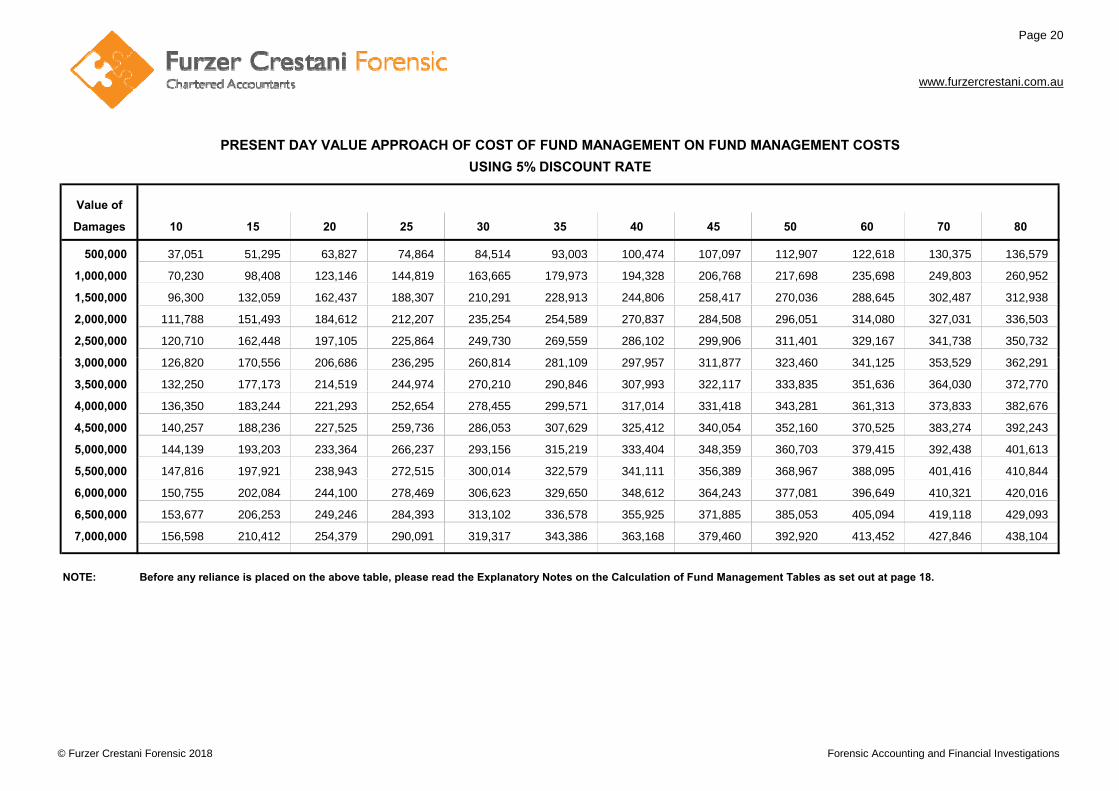
Damages 10 15 20 25 30 35 40 45 50 60 70 80
500,000 37,051 51,295 63,827 74,864 84,514 93,003 100,474 107,097 112,907 122,618 130,375 136,579
1,000,000 70,230 98,408 123,146 144,819 163,665 179,973 194,328 206,768 217,698 235,698 249,803 260,952
1,500,000 96,300 132,059 162,437 188,307 210,291 228,913 244,806 258,417 270,036 288,645 302,487 312,938
2,000,000 111,788 151,493 184,612 212,207 235,254 254,589 270,837 284,508 296,051 314,080 327,031 336,503
2,500,000 120,710 162,448 197,105 225,864 249,730 269,559 286,102 299,906 311,401 329,167 341,738 350,732
PRESENT DAY VALUE APPROACH OF COST OF FUND MANAGEMENT ON FUND MANAGEMENT COSTS
USING 5% DISCOUNT RATE
3,000,000 126,820 170,556 206,686 236,295 260,814 281,109 297,957 311,877 323,460 341,125 353,529 362,291
3,500,000 132,250 177,173 214,519 244,974 270,210 290,846 307,993 322,117 333,835 351,636 364,030 372,770
4,000,000 136,350 183,244 221,293 252,654 278,455 299,571 317,014 331,418 343,281 361,313 373,833 382,676
4,500,000 140,257 188,236 227,525 259,736 286,053 307,629 325,412 340,054 352,160 370,525 383,274 392,243
5,000,000 144,139 193,203 233,364 266,237 293,156 315,219 333,404 348,359 360,703 379,415 392,438 401,613
5,500,000 147,816 197,921 238,943 272,515 300,014 322,579 341,111 356,389 368,967 388,095 401,416 410,844
6,000,000 150,755 202,084 244,100 278,469 306,623 329,650 348,612 364,243 377,081 396,649 410,321 420,016
6,500,000 153,677 206,253 249,246 284,393 313,102 336,578 355,925 371,885 385,053 405,094 419,118 429,093
7,000,000 156,598 210,412 254,379 290,091 319,317 343,386 363,168 379,460 392,920 413,452 427,846 438,104
NOTE: Before any reliance is placed on the above table, please read the Explanatory Notes on the Calculation of Fund Management Tables as set out at page 18.
© Furzer Crestani Forensic 2018 Forensic Accounting and Financial Investigations
Page 21
www.furzercrestani.com.au
Value of
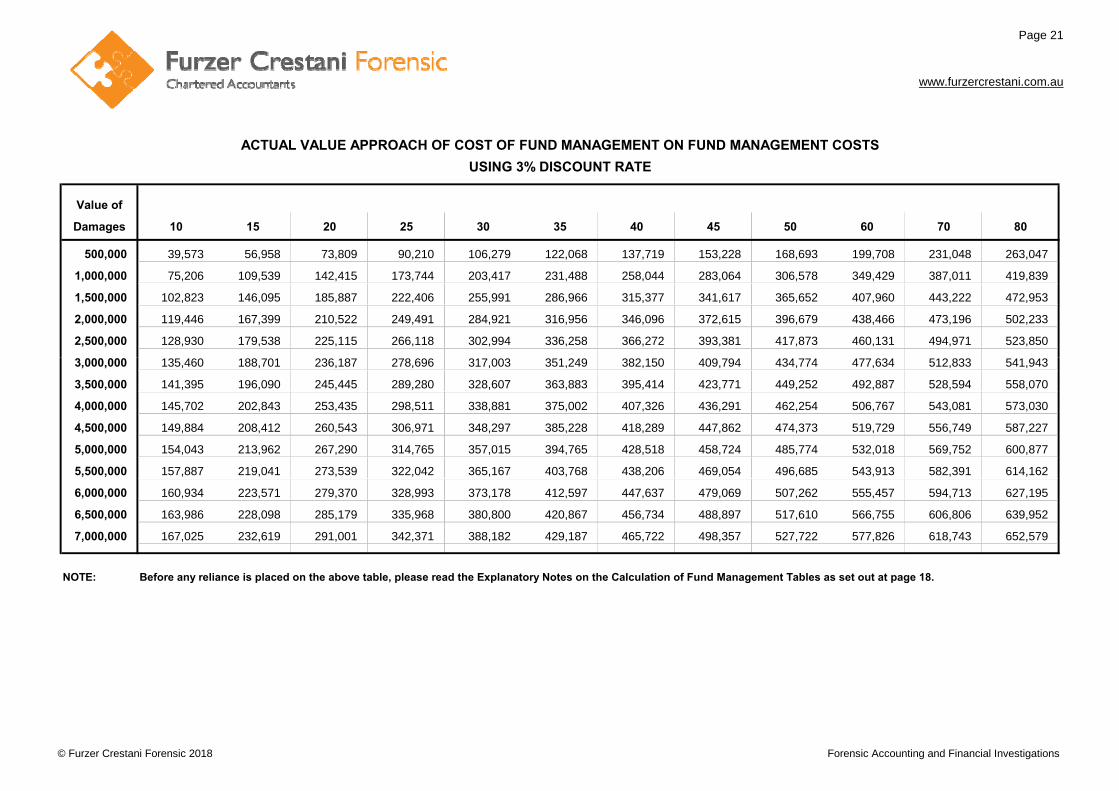
Damages 10 15 20 25 30 35 40 45 50 60 70 80
500,000 39,573 56,958 73,809 90,210 106,279 122,068 137,719 153,228 168,693 199,708 231,048 263,047
1,000,000 75,206 109,539 142,415 173,744 203,417 231,488 258,044 283,064 306,578 349,429 387,011 419,839
1,500,000 102,823 146,095 185,887 222,406 255,991 286,966 315,377 341,617 365,652 407,960 443,222 472,953
2,000,000 119,446 167,399 210,522 249,491 284,921 316,956 346,096 372,615 396,679 438,466 473,196 502,233
2,500,000 128,930 179,538 225,115 266,118 302,994 336,258 366,272 393,381 417,873 460,131 494,971 523,850
ACTUAL VALUE APPROACH OF COST OF FUND MANAGEMENT ON FUND MANAGEMENT COSTS
USING 3% DISCOUNT RATE
3,000,000 135,460 188,701 236,187 278,696 317,003 351,249 382,150 409,794 434,774 477,634 512,833 541,943
3,500,000 141,395 196,090 245,445 289,280 328,607 363,883 395,414 423,771 449,252 492,887 528,594 558,070
4,000,000 145,702 202,843 253,435 298,511 338,881 375,002 407,326 436,291 462,254 506,767 543,081 573,030
4,500,000 149,884 208,412 260,543 306,971 348,297 385,228 418,289 447,862 474,373 519,729 556,749 587,227
5,000,000 154,043 213,962 267,290 314,765 357,015 394,765 428,518 458,724 485,774 532,018 569,752 600,877
5,500,000 157,887 219,041 273,539 322,042 365,167 403,768 438,206 469,054 496,685 543,913 582,391 614,162
6,000,000 160,934 223,571 279,370 328,993 373,178 412,597 447,637 479,069 507,262 555,457 594,713 627,195
6,500,000 163,986 228,098 285,179 335,968 380,800 420,867 456,734 488,897 517,610 566,755 606,806 639,952
7,000,000 167,025 232,619 291,001 342,371 388,182 429,187 465,722 498,357 527,722 577,826 618,743 652,579
NOTE: Before any reliance is placed on the above table, please read the Explanatory Notes on the Calculation of Fund Management Tables as set out at page 18.
© Furzer Crestani Forensic 2018 Forensic Accounting and Financial Investigations

Page 22
www.furzercrestani.com.au
Value of
Damages 10 15 20 25 30 35 40 45 50 60 70 80
500,000 37,444 52,474 66,316 79,295 91,545 103,205 114,471 125,393 136,065 157,071 177,982 199,045
1,000,000 70,991 100,677 127,771 152,333 174,574 194,680 212,898 229,291 244,136 269,513 290,110 306,831
1,500,000 96,826 133,645 165,501 192,994 216,846 237,671 255,713 271,491 285,282 307,780 324,623 337,740
2,000,000 112,315 152,659 186,496 215,087 239,455 260,063 277,724 292,842 305,794 326,593 342,289 354,399
2,500,000 121,031 163,255 198,603 228,277 253,210 274,225 291,943 307,066 319,868 340,337 355,640 367,424
ACTUAL VALUE APPROACH OF COST OF FUND MANAGEMENT ON FUND MANAGEMENT COSTS
USING 5% DISCOUNT RATE
3,000,000 127,059 171,279 207,874 238,370 263,970 285,342 303,370 318,540 331,459 351,854 367,162 378,914
3,500,000 132,517 177,809 215,687 246,976 273,058 294,934 313,169 328,588 341,665 362,298 377,705 389,631
4,000,000 136,543 183,800 222,497 254,541 281,251 303,528 322,165 337,853 351,095 372,038 387,692 399,821
4,500,000 140,459 188,809 228,672 261,545 288,856 311,607 330,587 346,547 360,040 381,405 397,405 409,770
5,000,000 144,362 193,815 234,534 268,129 296,014 319,222 338,617 354,908 368,690 390,464 406,811 419,525
5,500,000 147,983 198,444 240,050 274,344 302,786 326,490 346,294 362,948 377,043 399,335 416,042 429,085
6,000,000 150,924 202,633 245,245 280,342 309,491 333,684 353,838 370,843 385,188 408,040 425,164 438,550
6,500,000 153,858 206,807 250,415 286,314 315,906 340,556 361,233 378,633 393,282 416,651 434,216 447,974
7,000,000 156,780 210,993 255,578 291,958 322,171 347,468 368,542 386,206 401,274 425,179 443,188 457,288
NOTE: Before any reliance is placed on the above table, please read the Explanatory Notes on the Calculation of Fund Management Tables as set out at page 18.
© Furzer Crestani Forensic 2018 Forensic Accounting and Financial Investigations
Page 23
Updated: 1 October 2017
www.furzercrestani.com.au
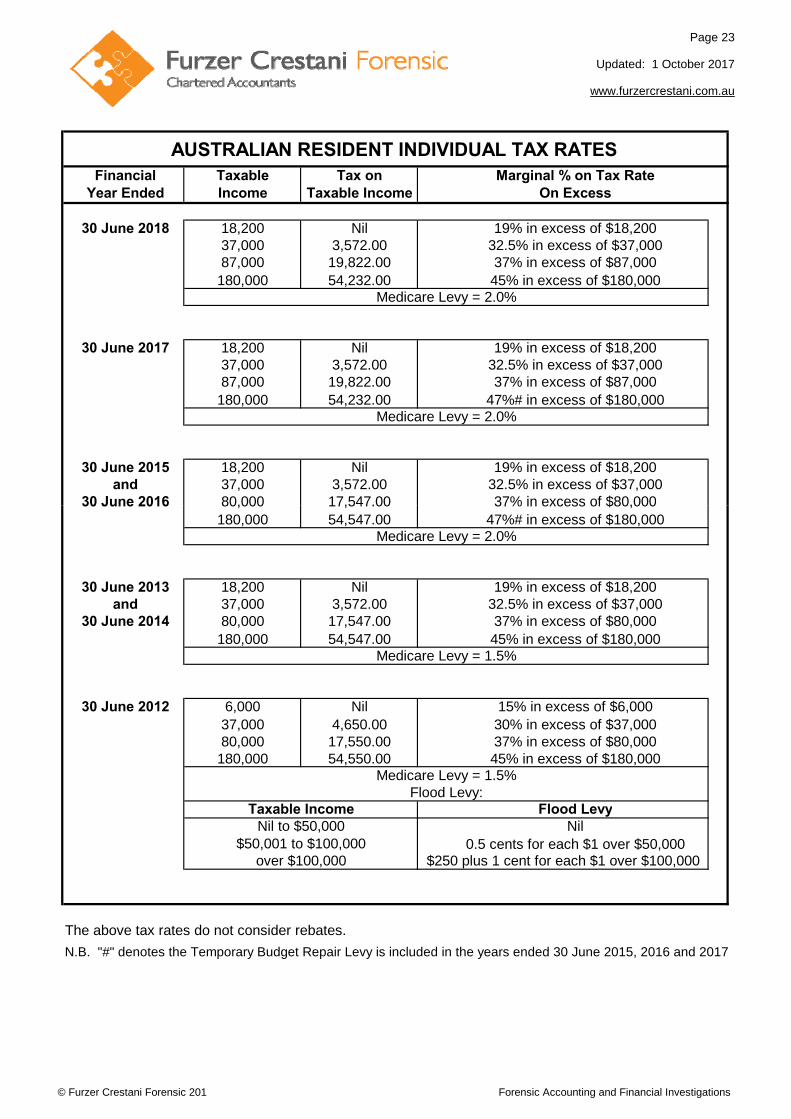
Financial Taxable Tax on Marginal % on Tax RateYear Ended Income Taxable Income On Excess
30 June 2018 18,200 Nil 19% in excess of $18,20037,000 3,572.00 32.5% in excess of $37,00087,000 19,822.00 37% in excess of $87,000
180,000 54,232.00 45% in excess of $180,000
30 June 2017 18,200 Nil 19% in excess of $18,20037,000 3,572.00 32.5% in excess of $37,00087,000 19,822.00 37% in excess of $87,000
180,000 54,232.00 47%# in excess of $180,000
30 June 2015 18,200 Nil 19% in excess of $18,200and 37,000 3,572.00 32.5% in excess of $37,000
30 June 2016 80,000 17,547.00 37% in excess of $80,000
AUSTRALIAN RESIDENT INDIVIDUAL TAX RATES
Medicare Levy = 2.0%
Medicare Levy = 2.0%
30 June 2016 80,000 17,547.00 37% in excess of $80,000180,000 54,547.00 47%# in excess of $180,000
30 June 2013 18,200 Nil 19% in excess of $18,200and 37,000 3,572.00 32.5% in excess of $37,000
30 June 2014 80,000 17,547.00 37% in excess of $80,000180,000 54,547.00 45% in excess of $180,000
30 June 2012 6,000 Nil 15% in excess of $6,00037,000 4,650.00 30% in excess of $37,00080,000 17,550.00 37% in excess of $80,000
180,000 54,550.00 45% in excess of $180,000
Flood LevyNil
0.5 cents for each $1 over $50,000
The above tax rates do not consider rebates.
N.B. "#" denotes the Temporary Budget Repair Levy is included in the years ended 30 June 2015, 2016 and 2017
Flood Levy:Medicare Levy = 1.5%
Nil to $50,000$50,001 to $100,000
over $100,000
Taxable Income
$250 plus 1 cent for each $1 over $100,000
Medicare Levy = 2.0%
Medicare Levy = 1.5%
© Furzer Crestani Forensic 201 Forensic Accounting and Financial Investigations
Page 24
Updated: 1 October 2017
www.furzercrestani.com.au
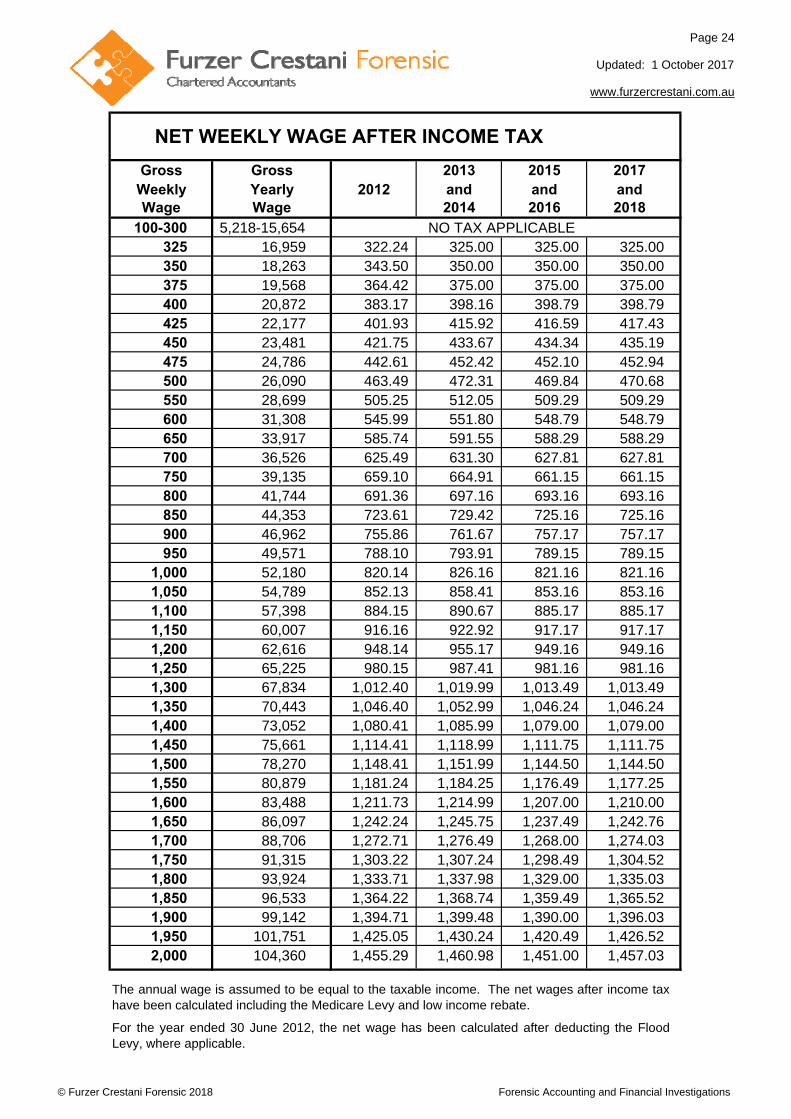
2013 2015 20172012 and and and
2014 2016 2018
100-300 5,218-15,654325 16,959 322.24 325.00 325.00 325.00 350 18,263 343.50 350.00 350.00 350.00 375 19,568 364.42 375.00 375.00 375.00 400 20,872 383.17 398.16 398.79 398.79 425 22,177 401.93 415.92 416.59 417.43 450 23,481 421.75 433.67 434.34 435.19 475 24,786 442.61 452.42 452.10 452.94 500 26,090 463.49 472.31 469.84 470.68 550 28,699 505.25 512.05 509.29 509.29 600 31,308 545.99 551.80 548.79 548.79 650 33,917 585.74 591.55 588.29 588.29 700 36,526 625.49 631.30 627.81 627.81 750 39,135 659.10 664.91 661.15 661.15 800 41,744 691.36 697.16 693.16 693.16 850 44,353 723.61 729.42 725.16 725.16 900 46,962 755.86 761.67 757.17 757.17 950 49,571 788.10 793.91 789.15 789.15
1,000 52,180 820.14 826.16 821.16 821.16 1,050 54,789 852.13 858.41 853.16 853.16 1,100 57,398 884.15 890.67 885.17 885.17 1,150 60,007 916.16 922.92 917.17 917.17 1,200 62,616 948.14 955.17 949.16 949.16 1,250 65,225 980.15 987.41 981.16 981.16 1,300 67,834 1,012.40 1,019.99 1,013.49 1,013.49 1,350 70,443 1,046.40 1,052.99 1,046.24 1,046.24 1,400 73,052 1,080.41 1,085.99 1,079.00 1,079.00 1,450 75,661 1,114.41 1,118.99 1,111.75 1,111.75 1,500 78,270 1,148.41 1,151.99 1,144.50 1,144.50 1,550 80,879 1,181.24 1,184.25 1,176.49 1,177.25 1,600 83,488 1,211.73 1,214.99 1,207.00 1,210.00 1,650 86,097 1,242.24 1,245.75 1,237.49 1,242.76 1,700 88,706 1,272.71 1,276.49 1,268.00 1,274.03 1,750 91,315 1,303.22 1,307.24 1,298.49 1,304.52 1,800 93,924 1,333.71 1,337.98 1,329.00 1,335.03 1,850 96,533 1,364.22 1,368.74 1,359.49 1,365.52 1,900 99,142 1,394.71 1,399.48 1,390.00 1,396.03 1,950 101,751 1,425.05 1,430.24 1,420.49 1,426.52 2,000 104,360 1,455.29 1,460.98 1,451.00 1,457.03
The annual wage is assumed to be equal to the taxable income. The net wages after income taxhave been calculated including the Medicare Levy and low income rebate.
For the year ended 30 June 2012, the net wage has been calculated after deducting the FloodLevy, where applicable.
NET WEEKLY WAGE AFTER INCOME TAX
Wage Wage
Gross GrossWeekly Yearly
NO TAX APPLICABLE
© Furzer Crestani Forensic 2018 Forensic Accounting and Financial Investigations
Page 25
Updated: 1 October 2017
www.furzercrestani.com.au
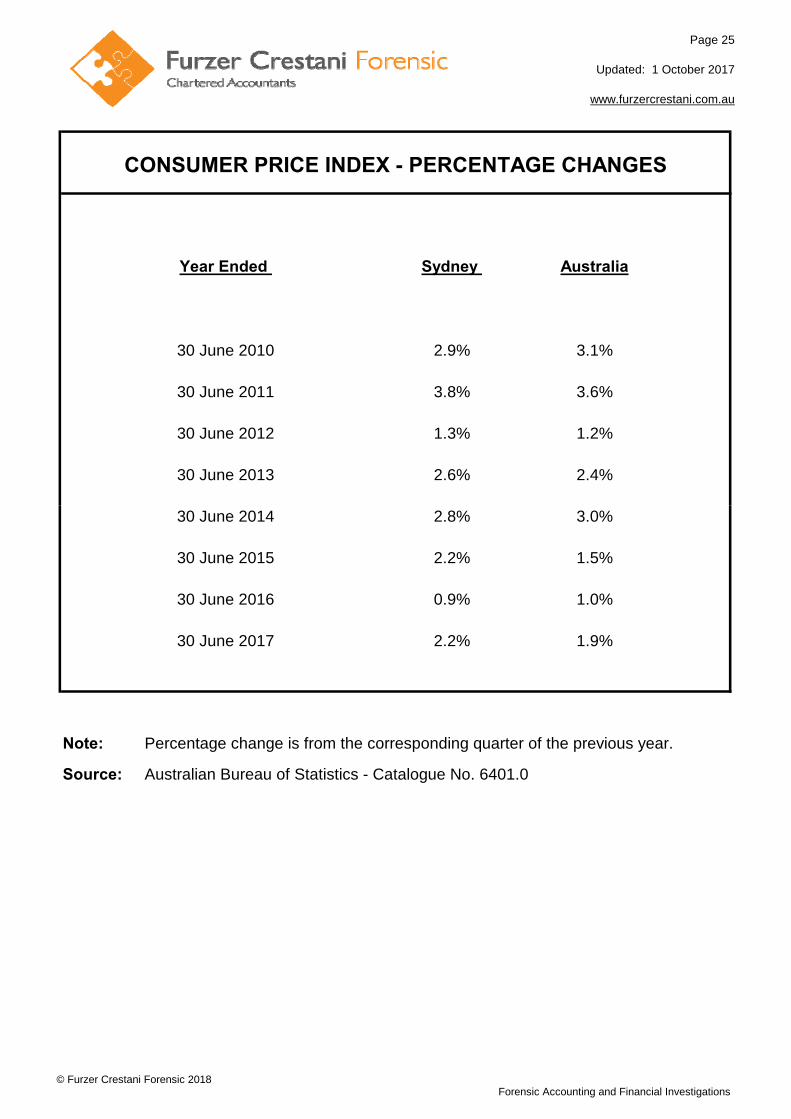
Year Ended
30 June 2010 2.9% 3.1%
30 June 2011 3.8% 3.6%
30 June 2012 1.3% 1.2%
30 June 2013 2.6% 2.4%
CONSUMER PRICE INDEX - PERCENTAGE CHANGES
Sydney Australia
30 June 2014 2.8% 3.0%
30 June 2015 2.2% 1.5%
30 June 2016 0.9% 1.0%
30 June 2017 2.2% 1.9%
Note: Percentage change is from the corresponding quarter of the previous year.
Source: Australian Bureau of Statistics - Catalogue No. 6401.0
© Furzer Crestani Forensic 2018Forensic Accounting and Financial Investigations
Page 26
Updated: 1 October 2017
www.furzercrestani.com.au
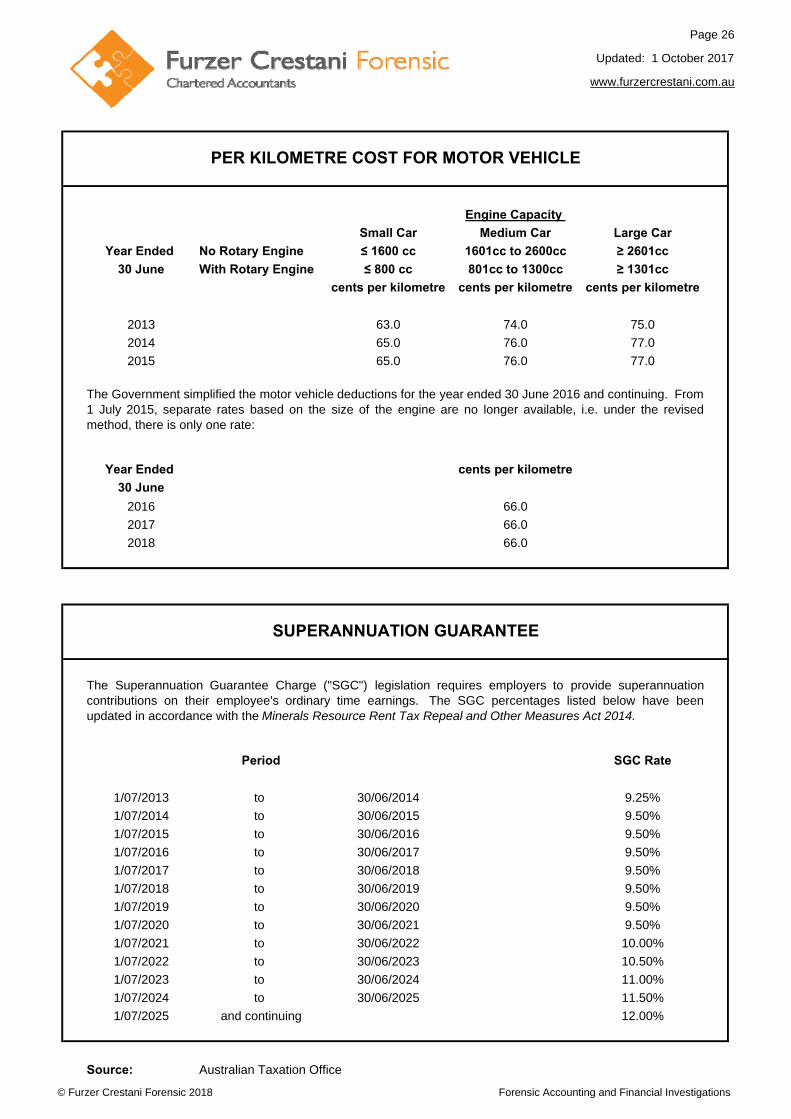
Small Car Medium Car Large Car
Year Ended No Rotary Engine ≤ 1600 cc 1601cc to 2600cc ≥ 2601cc
30 June With Rotary Engine ≤ 800 cc 801cc to 1300cc ≥ 1301cc
cents per kilometre cents per kilometre cents per kilometre
2013 63.0 74.0 75.0
2014 65.0 76.0 77.0
2015 65.0 76.0 77.0
Year Ended cents per kilometre
30 June
2016 66.0
2017 66.0
2018 66.0
Period SGC Rate
1/07/2013 to 30/06/2014 9.25%
1/07/2014 to 30/06/2015 9.50%
1/07/2015 to 30/06/2016 9.50%
1/07/2016 to 30/06/2017 9.50%
1/07/2017 to 30/06/2018 9.50%
1/07/2018 to 30/06/2019 9.50%
1/07/2019 to 30/06/2020 9.50%
1/07/2020 to 30/06/2021 9.50%
1/07/2021 to 30/06/2022 10.00%
1/07/2022 to 30/06/2023 10.50%
1/07/2023 to 30/06/2024 11.00%
1/07/2024 to 30/06/2025 11.50%
1/07/2025 and continuing 12.00%
Source: Australian Taxation Office
PER KILOMETRE COST FOR MOTOR VEHICLE
The Superannuation Guarantee Charge ("SGC") legislation requires employers to provide superannuationcontributions on their employee's ordinary time earnings. The SGC percentages listed below have beenupdated in accordance with the Minerals Resource Rent Tax Repeal and Other Measures Act 2014.
Engine Capacity
SUPERANNUATION GUARANTEE
The Government simplified the motor vehicle deductions for the year ended 30 June 2016 and continuing. From1 July 2015, separate rates based on the size of the engine are no longer available, i.e. under the revisedmethod, there is only one rate:
© Furzer Crestani Forensic 2018 Forensic Accounting and Financial Investigations
Page 27
Updated: 1 October 2017
www.furzercrestani.com.au
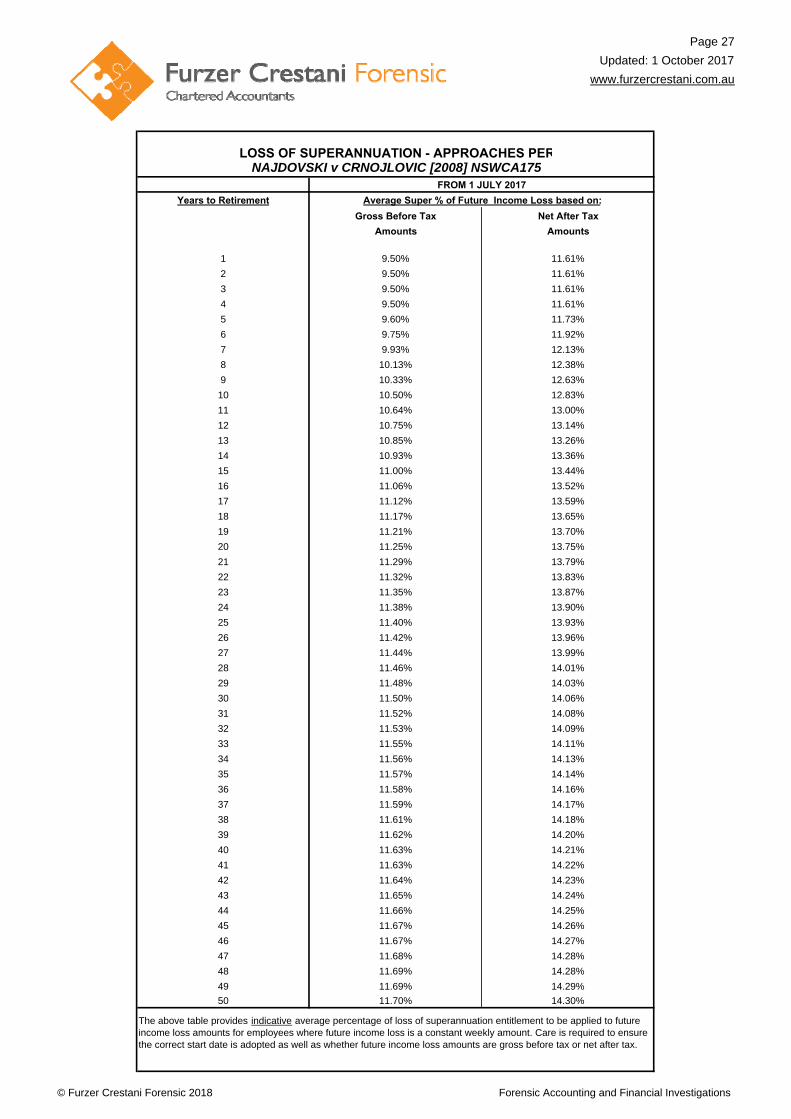
Years to Retirement
Gross Before Tax Net After Tax
Amounts Amounts
1 9.50% 11.61%
2 9.50% 11.61%
3 9.50% 11.61%
4 9.50% 11.61%
5 9.60% 11.73%
6 9.75% 11.92%
7 9.93% 12.13%
8 10.13% 12.38%
9 10.33% 12.63%
10 10.50% 12.83%
11 10.64% 13.00%
12 10.75% 13.14%
13 10.85% 13.26%
14 10.93% 13.36%
15 11.00% 13.44%
16 11.06% 13.52%
17 11.12% 13.59%
18 11.17% 13.65%
19 11.21% 13.70%
20 11.25% 13.75%
21 11.29% 13.79%
22 11.32% 13.83%
23 11.35% 13.87%
24 11.38% 13.90%
25 11.40% 13.93%
26 11.42% 13.96%
27 11.44% 13.99%
28 11.46% 14.01%
29 11.48% 14.03%
30 11.50% 14.06%
31 11.52% 14.08%
32 11.53% 14.09%
33 11.55% 14.11%
34 11.56% 14.13%
35 11.57% 14.14%
36 11.58% 14.16%
37 11.59% 14.17%
38 11.61% 14.18%
39 11.62% 14.20%
40 11.63% 14.21%
41 11.63% 14.22%
42 11.64% 14.23%
43 11.65% 14.24%
44 11.66% 14.25%
45 11.67% 14.26%
46 11.67% 14.27%
47 11.68% 14.28%
48 11.69% 14.28%
49 11.69% 14.29%
50 11.70% 14.30%
The above table provides indicative average percentage of loss of superannuation entitlement to be applied to future income loss amounts for employees where future income loss is a constant weekly amount. Care is required to ensure the correct start date is adopted as well as whether future income loss amounts are gross before tax or net after tax.
Average Super % of Future Income Loss based on:
LOSS OF SUPERANNUATION - APPROACHES PER NAJDOVSKI v CRNOJLOVIC [2008] NSWCA175
FROM 1 JULY 2017
© Furzer Crestani Forensic 2018 Forensic Accounting and Financial Investigations
Page 28
www.furzercrestani.com.au
Individuals - Employed- personal income tax returns and notice of income tax assessments- a detailed chronology of the plaintiff's employment history- the plaintiff’s educational and other qualifications-
- details of the applicable state or federal industrial award governing the plaintiff's position -
- intentions of plaintiff, i.e. career goals, including promotional path- superannuation benefits
* annual statements (pre and post event), closing superannuation fund balances on member accounts
details of comparable employee/s, such as name, gross weekly wage (ordinary and overtime), nature ofduties
Guideline For Information Required To Assess Economic Loss
Set out below is a guideline of information that may be required in order to assess economic loss (this is notexhaustive).
The information required will be dependant upon the plaintiff's claim for economic loss, entity structure andrelated industry. Information may not be fully available and therefore, documents and records not normallyrequested may be required in order to re-construct missing information.
Information, documents and source records commonly requested may include the following for a period of four(4) full financial years prior to the event and to date (inclusive):
details of the plaintiff's position pre and post-event such as, nature of duties, gross weekly wages (ordinary,overtime, allowances, etc., hours worked) and confirmation of details from employer
* contributions made on behalf of the plaintiff by the employer* contributions made by the plaintiff* terms and conditions of the superannuation fund* date of entry as member of the superannuation fund* financial performance of the superannuation fund* details of actual payments from the superannuation fund
Businesses - i.e. for all types of entities-
-
- industry or government statistics- roles and duties of plaintiff and employees- wage records for the determination of substitute labour- depending on the type of claim, the following records may be needed for the same period, such as:
* gross income records (e.g. invoice books)* bank deposit/receipt books* bank statements* cash/cheque payment books/records/cheque butts* general ledger records* wage records/books, group certificates, PAYG statements * superannuation benefits (same as individual - employed)* lease agreements* minute books* management accounts* diaries, appointment books, etc.
Compensation to Relatives Claims-
* detailed and itemised household expenditure and saving patterns* individual expenditure and saving pattern of the deceased* names and dates of birth of spouse, children and other dependants* details of whether the spouse (and/or other dependants) was (were) actually involved in the business
the records required would include the above (depending on the deceased's business structure) and alsoinclude the following for 2 to 3 years prior to the deceased’s death:
the plaintiff's business income tax returns including full detailed profit & loss statements and balance sheetsincluding depreciation schedules, and any schedules/annexuresthe plaintiff's and plaintiff's spouse personal income tax returns and notice of income tax assessments (ifavailable)
© Furzer Crestani Forensic 2018 Forensic Accounting and Financial Investigations