Further Decline in Credibility Ratings for Most News … · · 2012-08-16THURSDAY, AUGUST 16,...
15
THURSDAY, AUGUST 16, 2012 Further Decline in Credibility Ratings for Most News Organizations FOR FURTHER INFORMATION CONTACT: Andrew Kohut President, Pew Research Center Carroll Doherty and Michael Dimock Associate Directors Scott Keeter Director of Survey Research 1615 L St, N.W., Suite 700 Washington, D.C. 20036 Tel (202) 419-4350 Fax (202) 419-4399 www.people-press.org
Transcript of Further Decline in Credibility Ratings for Most News … · · 2012-08-16THURSDAY, AUGUST 16,...

THURSDAY, AUGUST 16, 2012
Further Decline in Credibility Ratings for Most News Organizations
FOR FURTHER INFORMATION CONTACT:
Andrew Kohut
President, Pew Research Center
Carroll Doherty and Michael Dimock
Associate Directors
Scott Keeter
Director of Survey Research
1615 L St, N.W., Suite 700
Washington, D.C. 20036
Tel (202) 419-4350
Fax (202) 419-4399
www.people-press.org
Further Decline in Credibility Ratings for Most
News Organizations
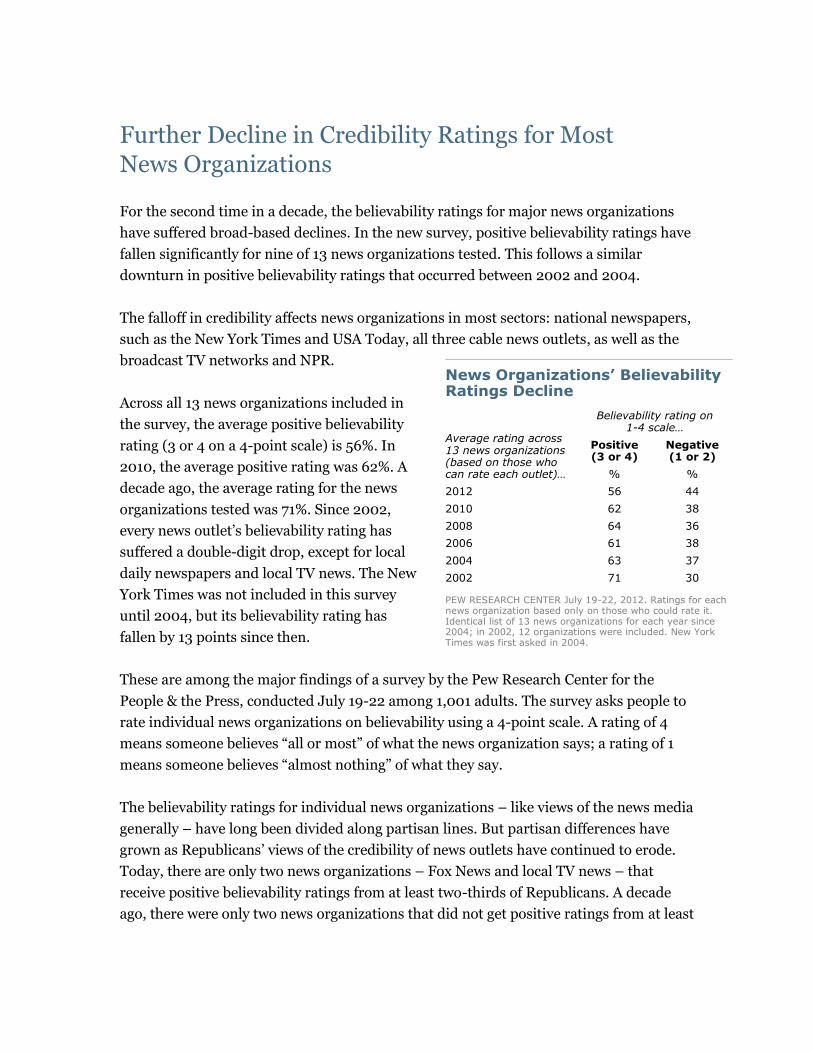
For the second time in a decade, the believability ratings for major news organizations
have suffered broad-based declines. In the new survey, positive believability ratings have
fallen significantly for nine of 13 news organizations tested. This follows a similar
downturn in positive believability ratings that occurred between 2002 and 2004.
The falloff in credibility affects news organizations in most sectors: national newspapers,
such as the New York Times and USA Today, all three cable news outlets, as well as the
broadcast TV networks and NPR.
Across all 13 news organizations included in
the survey, the average positive believability
rating (3 or 4 on a 4-point scale) is 56%. In
2010, the average positive rating was 62%. A
decade ago, the average rating for the news
organizations tested was 71%. Since 2002,
every news outlet’s believability rating has
suffered a double-digit drop, except for local
daily newspapers and local TV news. The New
York Times was not included in this survey
until 2004, but its believability rating has
fallen by 13 points since then.
These are among the major findings of a survey by the Pew Research Center for the
People & the Press, conducted July 19-22 among 1,001 adults. The survey asks people to
rate individual news organizations on believability using a 4-point scale. A rating of 4
means someone believes “all or most” of what the news organization says; a rating of 1
means someone believes “almost nothing” of what they say.
The believability ratings for individual news organizations – like views of the news media
generally – have long been divided along partisan lines. But partisan differences have
grown as Republicans’ views of the credibility of news outlets have continued to erode.
Today, there are only two news organizations – Fox News and local TV news – that
receive positive believability ratings from at least two-thirds of Republicans. A decade
ago, there were only two news organizations that did not get positive ratings from at least
News Organizations’ Believability Ratings Decline
Average rating across 13 news organizations (based on those who can rate each outlet)…
Believability rating on 1-4 scale…
Positive (3 or 4)
Negative (1 or 2)
% %
2012 56 44
2010 62 38
2008 64 36
2006 61 38
2004 63 37
2002 71 30
PEW RESEARCH CENTER July 19-22, 2012. Ratings for each news organization based only on those who could rate it. Identical list of 13 news organizations for each year since 2004; in 2002, 12 organizations were included. New York Times was first asked in 2004.

2
www.people-press.org
two-thirds of Republicans. By contrast, Democrats generally rate the believability of
news organizations positively; majorities of Democrats give all the news organizations
tested ratings of 3 or 4 on the 4-point scale, with the exception of Fox News.
Current Believability Ratings
The Pew Research Center has asked about the
believability of individual news organizations
for more than two decades. During this period,
the Center also has asked separately about the
news media’s overall performance; ratings for
the news media’s accuracy, fairness and other
aspects of performance also have shown long-
term declines. (For the most recent report, see
“Press Widely Criticized, But Trusted More
than Other Information Sources,” Sept. 22,
2011.)
The believability measures are based on those
who give each news organization a rating.
Roughly one-in-five are unable to rate the
believability of NPR (21%), the New York
Times (19%), the Wall Street Journal (19%)
and USA Today (17%).
As in past believability surveys, local TV news and the CBS News program 60 Minutes
receive the most positive ratings. Nearly two-thirds (65%) of those able to rate local TV
news give it a rating of 3 or 4. Ratings are comparable for 60 Minutes (64% 3 or 4).
Despite the declines in believability, majorities continue to give most news organizations
ratings of 3 or 4. However, ratings are mixed for NPR, MSNBC, the New York Times, Fox
News and USA Today. About half give each of these news organizations believability
ratings of 3 or 4; approximately the same percentages give them ratings of 1 or 2.
News Organization Believability
How much can you believe each?
Positive (3/4)
Negative (1/2) N
Can’t
rate
% % %
Local TV news 65 35 947 5
60 Minutes 64 35 915 10
ABC News 59 41 930 7
Wall Street Journal 58 41 806 19
CNN 58 42 934 6
CBS News 57 43 943 6
Daily newspaper you know best 57 43 922 8
NBC News 55 44 944 5
NPR 52 47 796 21
MSNBC 50 50 883 10
New York Times 49 50 796 19
Fox News 49 51 916 8
USA Today 49 51 824 17
PEW RESEARCH CENTER July 19-22, 2012. Ratings for each news organization based only on those who could rate it.

3
www.people-press.org
77 66 66 68
62 58
02 04 06 08 10 12
62 55 58 58
49
02 04 06 08 10 12
67 60
56 58 56 49
02 04 06 08 10 12
64 55
59 65
59 57
02 04 06 08 10 12
Believability of News Organizations: 2002-2012
Positive believability ratings for the New York
Times have fallen by nine points since 2010,
from 58% to 49%. The decline has been
comparable for USA Today. Two years ago,
56% rated USA Today’s believability at 3 or 4;
today 49% do so.
About six-in-ten (58%) rate the Wall Street
Journal’s believability positively. That is little
changed since 2010 (62%), but in 2002, 77%
rated the Journal’s believability at 3 or 4 on the
4-point scale.
Perceptions of the believability of the daily
newspaper “you are most familiar with” are
about the same as they were two years ago.
Currently, 57% give their daily newspaper a
positive believability rating, which is little
changed from 2010 (59%).
Credibility of Newspapers
Wall Street Journal New York Times
USA Today Daily paper
you know best
PEW RESEARCH CENTER July 19-22, 2012. Percent giving each news organization believability ratings of 3 or 4 on a 4-point scale. Based on those who could rate each organization in each year.

4
www.people-press.org
76 72 67 69
65 58
02 04 06 08 10 12
73 64 62 63 60
50
02 04 06 08 10 12
67 62
58 59 56 49
02 04 06 08 10 12
68 63 63
70 69 65
02 04 06 08 10 12
Believability ratings for all three major cable
news outlets have declined since 2010.
MSNBC’s believability rating has fallen from
60% to 50%, while the percentages giving CNN
and Fox News believability ratings of 3 or 4
have declined seven points each, to 58% and
49%, respectively. In 2002, the ratings for all
three cable news outlets were considerably
higher – 76% for CNN, 73% for MSNBC and
67% for Fox News.
The believability ratings for local TV news are
higher than those for the three cable news
outlets. Currently, 65% give local news a rating
of 3 or 4. Since 2002, credibility ratings for
local TV news have remained more stable than
have ratings for the three main cable news
outlets.
Credibility of Cable, Local TV News
CNN MSNBC
Fox News Local TV news
PEW RESEARCH CENTER July 19-22, 2012. Percent giving each news organization believability ratings of 3 or 4 on a 4-point scale. Based on those who could rate each organization in each year.

5
www.people-press.org
62 56 58 60 60
52
02 04 06 08 10 12
72 64 65 64 64
59
02 04 06 08 10 12
72 66 65 66 63 55
02 04 06 08 10 12
77 70 65
70 67 64
02 04 06 08 10 12
There also have been slight declines since 2010
in believability ratings for the three major TV
networks — ABC News, CBS News and NBC
News. Over the past decade, positive ratings
for all three have fallen from the low 70s to the
mid- to high-50s. More than six-in-ten (64%)
give the CBS weekly newsmagazine 60 Minutes
believability ratings of 3 or 4. That is down 13
points since 2002.
Since 2010, the percentage giving NPR
believability ratings of 3 or 4 has dropped eight
points to 52%. NPR’s believability ratings had
changed little from 2002 to 2010; about six-in-
ten in each year rated NPR’s believability
positively.
Credibility of Network News, 60 Minutes
ABC News CBS News
NBC News 60 Minutes
PEW RESEARCH CENTER July 19-22, 2012. Percent giving each news organization believability ratings of 3 or 4 on a 4-point scale. Based on those who could rate each organization in each year.
Credibility of NPR
PEW RESEARCH CENTER July 19-22, 2012. Percent giving NPR believability ratings of 3 or 4 on a 4-point scale. Based on those who could rate NPR in each year.
72 63
59 61 62 57
02 04 06 08 10 12

6
www.people-press.org
Partisan Gaps in Credibility Ratings
Republicans have long held a more negative
view of the credibility of the news media than
Democrats and this continues to be reflected in
current assessments of news outlets.
Republicans rate the believability of nine of 13
news organizations less positively than do
Democrats. Fox News is the only news
organization that is rated higher for
believability by Republicans (67% of
Republicans vs. 37% of Democrats). However,
the percentage of Republicans giving Fox a
believability rating of 3 or 4 has fallen 10
points, from 77%, since 2010.
Partisan differences in believability ratings are
more pronounced for broadcast and cable TV
news organizations, with more modest gaps for
most newspapers.
More than twice as many Democrats as
Republicans rate MSNBC’s believability positively (69% vs. 32%). The differences are
about as large in views of the believability of CNN and the three broadcast networks.
The partisan divide in views of the New York Times’ believability also is substantial; 65%
of Democrats, but just 37% of Republicans, rate the believability of the Times at 3 or 4.
However, there are smaller differences in views of other newspapers. More Democrats
(65%) than Republicans (49%) give positive ratings for the newspaper they know best,
but about as many Republicans as Democrats rate the believability of the Wall Street
Journal and USA Today positively.
A majority of Democrats (59%) give NPR a believability rating of 3 or 4. That compares
with 48% of Republicans.
Wide Partisan Differences in Most Believability Ratings
% giving each believability rating of 3 or 4 …
Rep Dem Ind R-D gap
% % % %
MSNBC 32 69 46 -37
CNN 40 76 54 -36
ABC News 43 77 53 -34
NBC News 41 74 49 -33
CBS News 45 77 50 -32
60 Minutes 51 81 60 -30
New York Times 37 65 44 -28
Daily newspaper you know best
49 65 52 -16
NPR 48 59 53 -11
Wall Street Journal 57 65 55 -8
USA Today 50 54 44 -4
Local TV News 68 70 58 -2
Fox News 67 37 43 +30
PEW RESEARCH CENTER July 19-22, 2012. Percent giving each news organization believability ratings of 3 or 4 on a 4-point scale. Based on those who could rate each organization.

7
www.people-press.org
The partisan differences in views of the believability of most news organizations have
increased greatly since 2002. For example, the partisan gap in believability of each of the
cable networks was only about 10 points a decade ago; today, the gaps in believability
ratings for Fox News, MSNBC and CNN are at least 30 points.
News Organizations’ Credibility Ratings by Party 2002-2012
------Republicans------ ------Democrats------ R-D Gap
% giving each believability rating of 3 or 4 …
02 04 06 08 10 12
02 04 06 08 10 12 02 08 10 12
% % % % % % % % % % % %
CNN 72 64 58 55 48 40 84 83 73 79 78 76 -12 -24 -30 -36
60 Minutes 74 61 58 61 60 51 85 77 73 79 77 81 -11 -18 -17 -30
CBS News 70 53 49 48 51 45 80 71 65 68 71 77 -10 -20 -20 -32
ABC News 67 54 58 55 53 43 80 73 69 72 76 77 -13 -17 -23 -34
MSNBC 70 56 60 52 46 32 80 75 65 74 79 69 -10 -22 -33 -37
NBC News 68 57 56 51 51 41 82 72 71 75 77 74 -14 -24 -26 -33
NPR 63 44 53 50 51 48 64 63 60 68 69 59 -1 -18 -18 -11
Daily newspaper you know best
63 52 54 61 58 49
73 59 64 70 71 65
-10 -9 -13 -16
NY Times -- 50 43 41 40 37 -- 70 62 70 76 65 -20* -29 -36 -28
Local TV News 72 64 61 70 67 68 72 67 65 68 71 70 0 +2 -4 -2
Wall St. Journal 86 65 67 66 67 57 75 67 66 68 68 65 +11 -2 -1 -8
USA Today 70 57 54 55 48 50 70 65 59 59 64 54 0 -4 -16 -4
Fox News 76 71 76 75 77 67 67 55 51 51 43 37 +9 +24 +34 +30
PEW RESEARCH CENTER July 19-22, 2012. Percent giving each news organization believability ratings of 3 or 4 on a 4-point scale. Based on those who could rate each organization. * New York Times from 2004.

8
www.people-press.org
About the Believability Survey Data The media believability report draws on a series of surveys conducted since 1985. The project was initiated by the Times Mirror Center for the People & the Press and continued by the Pew Research Center for the People & the Press since 1996. All believability surveys have been conducted by telephone. Since 2010, cell phone interviewing has been included. All interviews have been conducted in English. The analysis in this report is based primarily on surveys conducted between 2002 and 2012.
Year Field Dates Sample
Size Margin of Error
(percentage points) Interview Mode
2002 May 6-16, 2002 1,005 3.5 Telephone—landline
2004 May 3-9, 2004 1,001 3.5 Telephone—landline
2006 June 14-19, 2006 1,004 3.5 Telephone—landline
2008 May 21-25, 2008 1,505 3.0 Telephone—landline
2010 July 8-11, 2010 1,001 4.0 Telephone—landline and cell
2012 July 19-22, 2012 1,001 3.6 Telephone—landline and cell
The current survey is based on telephone interviews conducted July 19-22, 2012 among a national sample of 1,001 adults 18 years of age or older living in the continental United States (600 respondents were interviewed on a landline telephone, and 401 were interviewed on a cell phone, including 191 who had no landline telephone). The survey was conducted by interviewers at Princeton Data Source under the direction of Princeton Survey Research Associates International. A combination of landline and cell phone random digit dial samples were used; both samples were provided by Survey Sampling International. Interviews were conducted in English. Respondents in the landline sample were selected by randomly asking for the youngest adult male or female who is now at home. Interviews in the cell sample were conducted with the person who answered the phone, if that person was an adult 18 years of age or older. For detailed information about our survey methodology, see: http://people-press.org/methodology/. The combined landline and cell phone sample are weighted using an iterative technique that matches gender, age, education, race, Hispanic origin and region to parameters from the March 2011 Census Bureau's Current Population Survey and population density to parameters from the Decennial Census. The sample also is weighted to match current patterns of telephone status, based on extrapolations from the 2011 National Health Interview Survey. The weighting procedure also accounts for the fact that respondents with both landline and cell phones have a greater probability of being included in the combined sample and adjusts for household size within the landline sample. Sampling errors and statistical tests of significance take into account the effect of weighting. With a 95% level of confidence, the margin of error for the total sample of 1,001 is plus-or-minus 3.6 percentage points. Analysis in this report was based on those who could rate each news organization. That number ranged from 796, with a margin of error of plus or minus 4.0 points, to 947, with a margin of error of 3.7 points. The sample included 239 Republicans, 286 Democrats and 384 independents. Margins of error are 7.4 points, 6.8 points and 5.8 points, respectively. Not all partisans offered ratings of all news

9
www.people-press.org
organizations. As few as 183 Republicans and as many as 230 Republicans rated the various news outlets, with margins of error ranging from 7.5 to 8.4 percentage points. As few as 222 Democrats and as many as 272 Democrats rated the news outlets, with margins of error from 6.9 to 7.7 percentage points. Among independents, as few as 314 and as many as 363 rated the news outlets, producing margins of error of 6.0 to 6.4 percentage points. Sample sizes and sampling errors for other subgroups are available upon request. In addition to sampling error, one should bear in mind that question wording and practical difficulties in conducting surveys can introduce error or bias into the findings of opinion polls.

10
www.people-press.org
© Pew Research Center, 2012

11
www.people-press.org
PEW RESEARCH CENTER July 19-22, 2012 OMNIBUS
FINAL TOPLINE N=1,001
QUESTIONS PEW.1, PEW.3 AND PEW.4 PREVIOUSLY RELEASED; NO QUESTION PEW.2
ASK ALL: PEW.5 As I name some news organizations1, please rate how much you think you can BELIEVE
each that I name on a scale of 4 to 1. On this four point scale, "4" means you can believe all or most of what the news organization says, and "1" means you believe almost nothing of what they say. First, how would you rate the believability of [INSERT ITEM; RANDOMIZE] on this scale of 4 to 1? How about [NEXT ITEM]? [IF NECESSARY: How would you rate the believability of [NEXT ITEM] on this scale of 4 to 1 where "4" means you can believe all or most of what the news organization says, and "1" means you believe almost nothing of what they say?] [INTERVIEWERS: PROBE TO DISTINGUISH BETWEEN “NEVER HEARD OF” AND “CAN’T RATE”]
(VOL.) Cannot Never (VOL.) Believe Believe Heard Can't 4 3 2 1 of Rate a. USA Today July 19-22, 2012 12 28 27 16 2 15 July 8-11, 2010 13 30 22 12 1 22 Late May, 2008 13 35 26 8 2 16 June, 2006 15 30 25 10 2 18 May, 2004 15 32 22 8 2 21 May, 2002 15 36 19 6 1 23 May, 2000 17 31 20 7 2 23
May, 1998 18 35 21 5 2 19 April, 1996 20 34 20 9 3 14 February, 1993 20 36 21 7 1 15 August, 1989 21 32 18 5 6 18 June, 1985 13 26 13 2 4 42 b. The Wall Street Journal July 19-22, 2012 17 30 19 15 1 18 July 8-11, 2010 18 27 17 11 * 27 Late May, 2008 20 34 17 8 2 19 June, 2006 19 29 17 8 3 24
May, 2004 18 31 17 8 1 25 May, 2002 22 29 11 4 1 33 May, 2000 27 24 9 6 4 30 May, 1998 30 30 9 4 2 25 April, 1996 28 29 13 7 3 20 February, 1993 30 32 14 6 2 16 August, 1989 30 26 9 3 6 26 June, 1985 25 23 6 2 1 43 c. The New York Times July 19-22, 2012 14 26 24 17 * 19 July 8-11, 2010 15 28 15 15 1 26
Late May, 2008 14 32 19 14 2 19 June, 2006 15 26 19 14 2 24 May, 2004 16 31 18 10 2 23
1 In 2010 and earlier, question introduction referred to “organizations,” not “news organizations.”

12
www.people-press.org
PEW.5 CONTINUED... (VOL.) Cannot Never (VOL.) Believe Believe Heard Can't 4 3 2 1 of Rate d. The daily newspaper you
are most familiar with July 19-22, 2012 18 34 27 13 * 8 July 8-11, 2010 19 35 25 12 0 9 Late May, 2008 21 39 23 8 1 8 June, 2006 18 37 26 12 1 6 May, 2004 17 33 30 12 * 8 May, 2002 20 39 25 9 0 7 May, 2000 23 38 24 8 * 7 May, 1998 27 36 24 7 * 6 April, 1996 24 37 26 8 * 5 February, 1993 22 41 25 8 * 4 August, 1989 26 41 24 7 * 2
June, 1985 28 52 13 2 * 5 e. CNN July 19-22, 2012 24 31 23 17 * 6 July 8-11, 2010 26 32 20 12 1 9 Late May, 2008 28 36 18 9 1 8 June, 2006 25 35 20 10 1 9 May, 2004 29 36 17 8 1 9 May, 2002 32 34 15 6 1 12 May, 2000 33 32 14 5 1 15 May, 1998 37 35 11 4 1 12 April, 1996 34 37 14 4 1 10
February, 1993 41 35 10 4 2 8 August, 1989 33 31 11 2 8 16 June, 1985 20 24 7 1 10 38 f. The Fox News CABLE Channel July 19-22, 2012 20 24 23 24 * 8 July 8-11, 2010 25 26 20 20 * 8 Late May, 2008 21 32 21 15 2 9 June, 2006 22 29 21 15 1 12 May, 2004 21 33 23 9 1 13 May, 2002 19 34 20 6 2 19
May, 2000 19 28 19 9 3 22 g. MSNBC July 19-22, 2012 17 28 24 21 1 9 July 8-11, 2010 19 32 18 16 3 12 Late May, 2008 21 34 22 10 2 11 June, 2006 17 34 24 8 2 15 May, 2004 18 36 22 8 2 14 May, 2002 21 34 17 5 4 19 May, 2000 19 29 15 6 8 23 h. ABC News
July 19-22, 2012 21 35 25 13 * 7 July 8-11, 2010 19 39 21 12 1 8 Late May, 2008 22 37 25 9 1 6 June, 2006 20 39 23 10 * 8 May, 2004 22 36 24 9 * 9 May, 2002 22 43 19 6 * 10

13
www.people-press.org
PEW.5 CONTINUED... (VOL.) Cannot Never (VOL.) Believe Believe Heard Can't 4 3 2 1 of Rate May, 2000 26 36 20 6 * 12
May, 1998 28 43 18 4 * 7 April, 1996 30 44 17 5 * 4 February, 1993 34 42 17 4 * 3 August, 1989 30 46 14 3 1 7 June, 1985 32 51 11 1 * 5 i. CBS News July 19-22, 2012 19 35 28 12 * 6 July 8-11, 2010 19 36 21 13 1 11 Late May, 2008 20 36 26 10 1 7 June, 2006 20 34 27 10 1 8 May, 2004 22 35 24 9 1 9
May, 2002 23 41 19 6 * 11 May, 2000 26 37 20 7 * 10 May, 1998 26 43 21 4 * 6 April, 1996 30 42 17 6 * 5 February, 1993 31 44 16 5 * 4 August, 1989 29 45 16 4 1 5 June, 1985 33 51 11 1 * 4 j. NBC News July 19-22, 2012 19 33 26 15 * 5 July 8-11, 2010 18 40 22 13 * 7 Late May, 2008 23 40 21 11 * 5
June, 2006 21 39 24 8 * 8 May, 2004 22 39 24 9 * 6 May, 2002 23 43 19 6 * 9 May, 2000 26 37 21 7 * 9 May, 1998 28 42 20 4 * 6 April, 1996 28 46 18 5 * 3 February, 1993 31 42 18 6 * 3 August, 1989 32 47 14 2 * 5 June, 1985 31 51 12 1 * 5 k. Your local TV news
July 19-22, 2012 27 35 24 9 * 5 July 8-11, 2010 27 38 21 7 0 7 Late May, 2008 27 40 21 8 * 4 June, 2006 22 38 25 10 * 5 May, 2004 23 36 27 9 * 5 May, 2002 26 39 22 7 * 6 May, 2000 30 39 19 6 * 6 May, 1998 32 38 19 6 * 4 June, 1985 34 47 13 1 * 5 l. 60 Minutes July 19-22, 2012 27 32 21 11 1 9
July 8-11, 2010 28 29 19 9 1 14 Late May, 2008 27 36 21 7 1 8 June, 2006 24 34 22 9 1 10 May, 2004 29 33 19 9 * 10 May, 2002 30 39 15 5 * 11 May, 2000 31 37 17 7 * 8

14
www.people-press.org
PEW.5 CONTINUED... (VOL.) Cannot Never (VOL.) Believe Believe Heard Can't 4 3 2 1 of Rate May, 1998 32 37 20 4 * 7
m. NPR, National Public Radio July 19-22, 2012 19 22 19 19 5 16 July 8-11, 2010 20 23 18 11 7 21 Late May, 20082 19 23 18 10 12 18 June, 2006 17 27 20 12 4 20 May, 2004 17 25 22 12 3 21 May, 2002 16 28 20 7 6 23 May, 2000 16 21 18 8 13 24 May, 1998 13 34 17 7 7 22
2 In 2008 and earlier, item was “National Public Radio.”