Fungal Biomass in Decayed Wood - forestpathology.org · ditions (Dionex) were similar to that of...
8
Mycologia, 87(4),1995, pp. 459-466. ? 1995, by The New York Botanical Garden, Bronx, NY 10458-5126 Fungal biomass in decayed wood Heather L. Jones1 James J. Worrall College of Environmental Scienceand Forestry, Syracuse, New York 13210 Abstract: Fungal biomass in decayed wood was mea- sured using glucosamine as an indicator. Apparent mass loss and glucosamine content of wood blocks decayed by Trametes versicolor, Oligoporus placentus, Bjerkandera adusta, Gloeophyllum trabeum, and Phialo- cephala dimorphospora were measured at selected in- tervals. After 12 weeks of decay by T. versicolor, birch blocks contained 31.3% fungal biomass, more than any other fungus-wood combination. Fungal biomass in birch decayed by B. adusta and G. trabeum exceeded 9.0%. Measurements of apparent mass loss underes- timate actual loss of wood mass, determined by cor- recting for fungal biomass, by as much as 42%. Such errors are greatest at lower mass losses. Key Words: chitin, fungal biomass, glucosamine, wood decay INTRODUCTION Mass loss of wood is the most commonly used measure of wood decay in laboratory studies. Such studies ne- glect the mass of the fungus present in decayed wood. We are aware of only a few cases in which fungal biomass was acknowledged in studies of wood decay. Cowling (1961), in a study of the chemical and physical changes in wood during decay, acknowledged that fun- gal biomass is a source of error in mass loss measure- ments but considered it to be negligible. Swift (I973) quantified fungal biomass in wood decayed by Trametes versicolor (L.: Fr.) Pilat. Sawdust (Castanea sativa Mill.) decayed by T. versicolor for 12 wk was found to contain 47% fungus. We have calculated the actual mass loss based on Swift's results and determined that it indi- cates a 45% error in measurement of apparent mass loss. Using the results of Gurusiddiah et al. (1978) we calculated 5.3% fungus in coniferous wood chips de- cayed by T. versicolor for 5 months. Thus, considerable Accepted for publication March 15, 1995. ' Present address: Oneida Research Services, Inc., One Halsey Road, Whitesboro, New York 13492 459 errors in apparent mass loss may occur because of fungal biomass in decayed wood but the size of these errors has not been investigated; nor has the variation among fungi, decay types, and wood types been ex- plored. Our study was designed to quantify fungal biomass in decayed wood and to estimate the contri- butions of residual wood vs. fungal biomass to total dry mass in decayed wood samples at various stages and conditions of decay. To establish a reliable measure of fungal biomass in decayed wood, one can measure a chemical compo- nent that is present in fungi but not in wood and calculate a factor that accounts for the concentration of the component in pure mycelia. Chitin is one of the most commonly used components for estimating fungal biomass (Matcham et al., 1985; Mayama et al., 1975; Ride and Drysdale, I971, 1972; Swift, 1973). Chi- tin, an unbranched polymer of N-acetyl-D-glucosa- mine, is a cell wall component of some fungi. Acid hydrolysis of chitin releases glucosamine and the ratio of glucosamine to dry mass in pure mycelium can be determined and used to calculate fungal biomass in the substrate. This approach has been applied to a wide range of substrates including plant tissue (Mat- cham et al., 1985; Mayama et al., I975; Ride and Drys- dale, 197I, I972; Toppan et al., 1976; Wu and Stahman, I975), decayed wood (Gurusiddaiah et al., 1978; Swift, I973), mycorrhizae (Becker and Gerdemann, I977; Be- thlenfalvay et al., 1981; Hepper, I977; Johnson and McGill, 1990; Toth et al., 1991), fermentations (Des- granges et al., I991), and food products (Arima and Uozumi, 1967; Sakurai et al., I977). MATERIALS AND METHODS Cultures.-The following fungal cultures were select- ed as representatives of white-, brown-, and soft-rot fungi: Trametes versicolor (491 -FS), Oligoporus placentus (Fr.) Gilbn. & Ryvarden (622), Bjerkandera adusta (Willd.: Fr.) P. Karst. (620), Gloeophyllum trabeum (Fr.) Murr. (621), and Phialocephala dimorphospora Kendrick (N-18; kindly provided by C. J. K. Wang). Fungi were cultured on malt extract agar (1.5%) and incubated at 25 C. Decay tests. -Yellow birch (Betula alleghaniensis Brit- ton) and southern yellow pine (Pinus taeda L.) were subjected to decay by various fungi using a modified
Transcript of Fungal Biomass in Decayed Wood - forestpathology.org · ditions (Dionex) were similar to that of...
Mycologia, 87(4), 1995, pp. 459-466. ? 1995, by The New York Botanical Garden, Bronx, NY 10458-5126
Fungal biomass in decayed wood
Heather L. Jones1 James J. Worrall
College of Environmental Science and Forestry, Syracuse, New York 13210
Abstract: Fungal biomass in decayed wood was mea- sured using glucosamine as an indicator. Apparent mass loss and glucosamine content of wood blocks
decayed by Trametes versicolor, Oligoporus placentus, Bjerkandera adusta, Gloeophyllum trabeum, and Phialo-
cephala dimorphospora were measured at selected in- tervals. After 12 weeks of decay by T. versicolor, birch blocks contained 31.3% fungal biomass, more than
any other fungus-wood combination. Fungal biomass in birch decayed by B. adusta and G. trabeum exceeded 9.0%. Measurements of apparent mass loss underes- timate actual loss of wood mass, determined by cor-
recting for fungal biomass, by as much as 42%. Such errors are greatest at lower mass losses.
Key Words: chitin, fungal biomass, glucosamine, wood decay
INTRODUCTION
Mass loss of wood is the most commonly used measure of wood decay in laboratory studies. Such studies ne-
glect the mass of the fungus present in decayed wood. We are aware of only a few cases in which fungal biomass was acknowledged in studies of wood decay. Cowling (1961), in a study of the chemical and physical changes in wood during decay, acknowledged that fun-
gal biomass is a source of error in mass loss measure- ments but considered it to be negligible. Swift (I973) quantified fungal biomass in wood decayed by Trametes versicolor (L.: Fr.) Pilat. Sawdust (Castanea sativa Mill.) decayed by T. versicolor for 12 wk was found to contain 47% fungus. We have calculated the actual mass loss based on Swift's results and determined that it indi- cates a 45% error in measurement of apparent mass loss. Using the results of Gurusiddiah et al. (1978) we calculated 5.3% fungus in coniferous wood chips de-
cayed by T. versicolor for 5 months. Thus, considerable
Accepted for publication March 15, 1995. ' Present address: Oneida Research Services, Inc., One Halsey Road, Whitesboro, New York 13492
459
errors in apparent mass loss may occur because of
fungal biomass in decayed wood but the size of these errors has not been investigated; nor has the variation
among fungi, decay types, and wood types been ex-
plored. Our study was designed to quantify fungal biomass in decayed wood and to estimate the contri- butions of residual wood vs. fungal biomass to total
dry mass in decayed wood samples at various stages and conditions of decay.
To establish a reliable measure of fungal biomass in
decayed wood, one can measure a chemical compo- nent that is present in fungi but not in wood and calculate a factor that accounts for the concentration of the component in pure mycelia. Chitin is one of the most commonly used components for estimating fungal biomass (Matcham et al., 1985; Mayama et al., 1975; Ride and Drysdale, I971, 1972; Swift, 1973). Chi-
tin, an unbranched polymer of N-acetyl-D-glucosa- mine, is a cell wall component of some fungi. Acid
hydrolysis of chitin releases glucosamine and the ratio of glucosamine to dry mass in pure mycelium can be determined and used to calculate fungal biomass in the substrate. This approach has been applied to a wide range of substrates including plant tissue (Mat- cham et al., 1985; Mayama et al., I975; Ride and Drys- dale, 197I, I972; Toppan et al., 1976; Wu and Stahman,
I975), decayed wood (Gurusiddaiah et al., 1978; Swift, I973), mycorrhizae (Becker and Gerdemann, I977; Be-
thlenfalvay et al., 1981; Hepper, I977; Johnson and McGill, 1990; Toth et al., 1991), fermentations (Des- granges et al., I991), and food products (Arima and Uozumi, 1967; Sakurai et al., I977).
MATERIALS AND METHODS
Cultures.-The following fungal cultures were select- ed as representatives of white-, brown-, and soft-rot fungi: Trametes versicolor (491 -FS), Oligoporus placentus (Fr.) Gilbn. & Ryvarden (622), Bjerkandera adusta (Willd.: Fr.) P. Karst. (620), Gloeophyllum trabeum (Fr.) Murr. (621), and Phialocephala dimorphospora Kendrick (N-18; kindly provided by C. J. K. Wang). Fungi were cultured on malt extract agar (1.5%) and incubated at 25 C.
Decay tests. -Yellow birch (Betula alleghaniensis Brit- ton) and southern yellow pine (Pinus taeda L.) were subjected to decay by various fungi using a modified
MYCOLOGIA
soil-block procedure (Anonymous, I98i). Sufficient deionized water was added to each glass bottle to ob- tain a soil moisture content of 44.2 ml water per 100
g dry soil (equivalent to 130% of moisture-holding capacity). Approximately 240 cm3 (equivalent to 272
g dry soil) soil (sandy loam) were added to each bottle (500 ml capacity). Oven-dried (103 C, 24 h) and
weighed test blocks (20 x 10 x 5 mm) and wood feeder strips (3 x 25 x 33 mm) were soaked in deion- ized water for 5 min. Two feeder strips were then
placed side-by-side on top of the soil in each bottle. Six test blocks were placed on top of the feeder strips. Each bottle was capped, autoclaved for 75 min, cooled, and inoculated with six agar plugs of mycelium. Plugs (5 mm diam) were taken from actively growing margins of approximately 1-wk-old malt extract cultures. Seven bottles were used per treatment.
At the time of harvest (3, 6, 9, or 12 wk), surface
mycelium was removed from blocks with a razor blade and forceps. Mycelium collected from the surface of the test blocks in each chamber was lyophilized and stored at 4 C until analysis by high pressure liquid chromatography (HPLC). Test blocks were oven dried and weighed. Apparent mass loss (A) was calculated
using the following formula: A (%) = [(OW - DW) x
100]/OW, where OW = original dry mass and DW =
post-decay dry mass.
Sample preparation, hydrolysis, and glucosamine con- tent.-All decayed wood and mycelial samples were
ground in a Wiley mill to pass a 40-mesh screen (open- ing size 0.42 mm). Moisture content of a subsample was determined and samples of 200 +10 mg (equiv- alent dry mass) were dried overnight in a vacuum oven (38 C) in tared hydrolysis tubes. The dry mass of each
sample was then measured.
Hydrolysis followed the procedure for determina- tion of Klason (acid-insoluble) lignin (Kirk and Obst, 1988). This procedure was chosen because it would allow for simultaneous determination of glucosamine, lignin, and wood sugars. Each sample was hydrolyzed with 2 ml 72% (w/w) H2SO4 and stirred frequently in a water bath at 30 C. At the end of 1 h, each sample was diluted with 56 ml of water. Tubes were then covered with foil and autoclaved at 120 C for 1 h. One milliliter of glucosamine hydrochloride (Sigma) standard (1 mg/ml) was dried in the vacuum oven and
subjected to the identical hydrolysis procedure with each batch of samples.
Immediately after autoclaving, each sample was
poured and rinsed through a glass microfiber filter (Whatman 934-AH) in crucibles. One ml of fucose internal standard (20 mg/ml) was added to the filtrate, which was then diluted with water to a total volume of 100 ml. An aliquot was filtered through an On-
Guard-H cartridge (Dionex), followed by a 0.2-um ny- lon Acrodisc filter (Gelman Sciences). Three volumes of this filtered aliquot were diluted with 7 volumes of water to bring concentrations to a range appropriate for chromatography by HPLC.
Analytical conditions. -The HPLC equipment and con- ditions (Dionex) were similar to that of Pettersen and Schwandt (i991) and consisted of a gradient pump, pulsed amperometric detector, post-column reagent module, eluant degas module, 4400 integrator, and a CarboPac PA1 column and guard column. Working electrode potentials (pulse duration) were: El = 0.05 V (480 ms), E2 = 0.6 V (120 ms), E3 = -0.6 V (60 ms). Two hundred microliters of sample were flushed
through a 25-,l injection loop before sample injection into the eluant stream. The glucosamine standard was
injected initially and after every six samples. Glucosamine was quantified using 15 mM NaOH as
an eluant at a flow rate of 1 ml/min. The output range of the detector was 3000 nA after injection and was lowered to 100 nA for increased sensitivity after elu- tion of the internal standard. The total time of the
separation was 35 min, including 15 min of sample run after injection, 10 min of column regeneration, and 10 min of baseline stabilization with eluant. A
postcolumn addition of 300 mM NaOH (0.7 ml/min) was used to increase baseline stability. Each sample was injected three times and the mean was used in all calculations.
The ratio of glucosainine to dry mass in pure my- celium growing on the wood blocks in each chamber was determined and used to calculate fungal biomass in associated blocks. Glucosamine in sound yellow birch and sound southern yellow pine was quantified and subtracted from that in decayed samples to correct for minute amounts of glucosamine in sound wood.
RESULTS
Fungal analysis. -Glucosamine content of pure my- celia from wood surfaces ranged from 1.29% (w/w; P.
dimorphospora removed from birch) to 3.11% (G. tra- beum removed from birch) (TABLE I). Glucosamine content (mean ? standard error) of T. versicolor my- celia at 3, 6, 9, and 12 wk was 1.82 ? 0.02%, 1.58 + 0.06%, 1.70 + 0.07%, and 2.28 ? 0.06%, respectively. Trametes versicolor, when grown on malt extract broth and agar for 3 wk contained 0.33% and 0.53% glu- cosamine, respectively. Glucosamine content of T. ver- sicolor grown for 2 wk on potato dextrose agar was 1.31%.
Fungal biomass and mass loss.-Small amounts of glu- cosamine were detected in sound wood samples. Sound yellow birch had 0.024 + 0.003% glucosamine and
460
JONES AND WORRALL: FUNGAL BIOMASS MEASUREMENT
southern yellow pine had 0.017 + 0.002% glucosa- mine. Even a collection of sound Pinus palustris Mill., frozen immediately after felling of a live tree, had 0.009 + 0.001% glucosamine. These values for glu- cosamine in sound wood were subtracted from those in decayed samples.
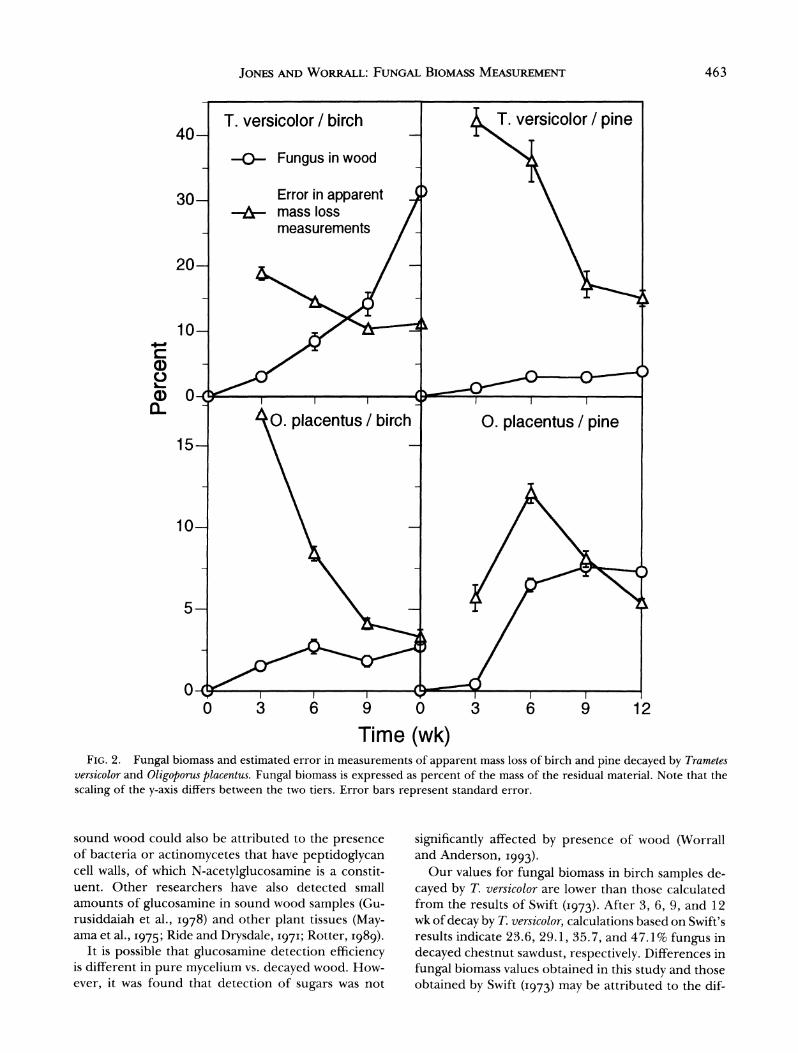
After 12 wk, biomass of three of the five fungi grown on birch (T. versicolor, B. adusta and G. trabeum) ex- ceeded 9.0% of the residual block mass (FIG. 1). Birch blocks decayed by T. versicolor for 12 wk contained 31.3% fungal biomass, the most of all decayed wood
samples analyzed (FIGS. 1, 2). Biomass of T. versicolor in birch and pine increased
with time, and that in birch was higher than that in
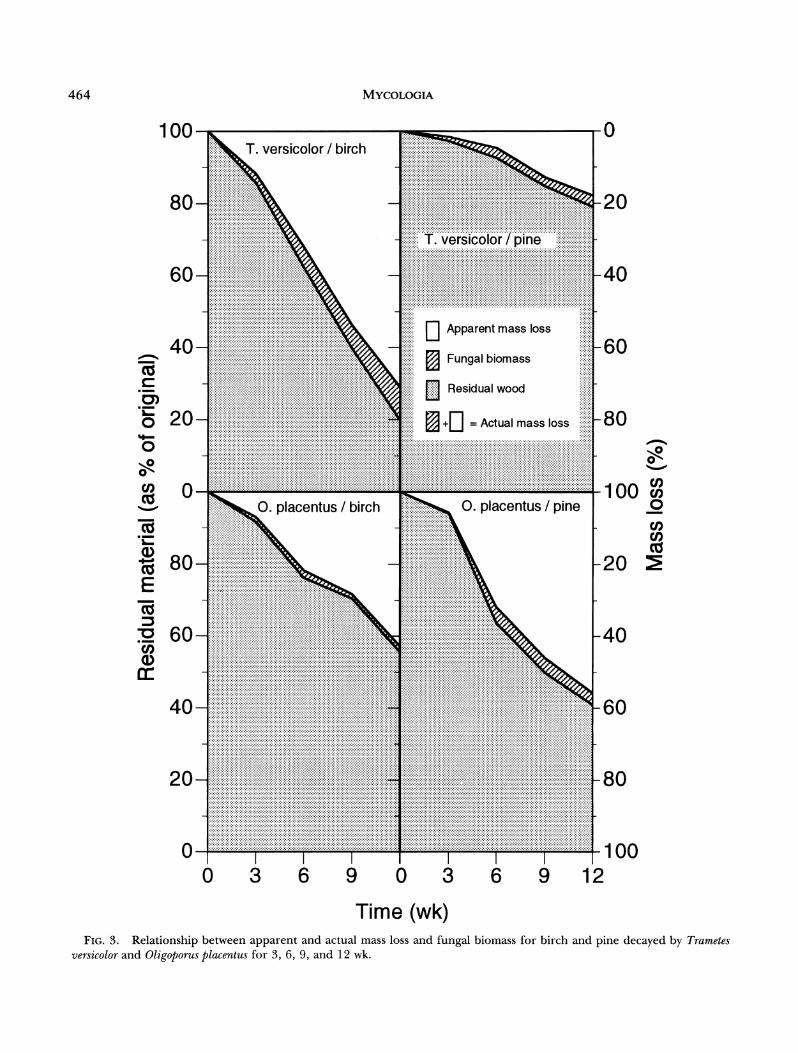
pine for all dates (FIG. 2). Similarly, apparent and actual mass losses of birch and pine decayed by T. versicolor increased with time, and values for birch were higher than those for pine at all dates (FIG. 3). Percent error in apparent mass loss measurements
(based on actual mass loss measurements) of pine and birch decayed by T. versicolor decreased during decay (FIG. 2).
In general, biomass of 0. placentus in wood also increased with time (FIG. 2). Oligoporus placentus bio- mass in pine exceeded that in birch for all dates except 3 wk (FIG. 2). Similarly, apparent and actual mass losses of pine decayed by 0. placentus were higher than that of birch samples for all dates except 3 wk (FIG. 3). As with T. versicolor, percent error in apparent mass loss measurements of birch decreased as decay increased
(FIG. 2). Percent error in apparent mass loss mea- surements of pine increased initially (up to 6 wk of
decay by 0. placentus), but decreased for the remainder of the decay study (FIG. 2).
DISCUSSION
Fungal analysis.-An assumption of this study is that
glucosamine content of mycelium in wood is the same as that in the pure mycelium that was analyzed. The use of chitin for estimation of fungal biomass has been
questioned by several researchers because of conflict-
ing reports regarding the variation of mycelial chitin content with age (Arima and Uozumi, 1967). Also, chi- tin content of mycelia in the natural substrate may be different from that in culture (Bartnicki-Garcia, 1968; Johnson and McGill, I990; Martin et al., 1990; Ride and Drysdale, 1972; Seitz et al., 1979; Sharma et al.,
1977). In this study, glucosamine concentrations in
mycelia remained relatively constant during fungal de-
velopment. These results agree with those of Des-
granges et al. (1991) and of Ride and Drysdale (1972) regarding shaken fungal cultures. The experimental design of the study provided realistic conditions for
comparative measurements because the aerial myce-
TABLE I. Percent glucosamine in various fungi grown on different substrates
No. Glucosamine of re- Age of in pli- Sub- mycelium mycelium
Fungus cates strate (wk) (%)a
T. versicolor 26 Birch 3, 6, 9, 12 1.87 ? 0.06 3 Pine 9, 12 1.97 ? 0.23
0. placentus 4 Birch 9, 12 2.72 ? 0.06 2 Pine 9, 12 2.16 + 0.61
G. trabeum 2 Birch 12 3.11 ? 0.09 B. adusta 9 Birch 12 1.71 + 0.03 P. dimorpho-
spora 1 Birch 12 1.29b
a Mean ? standard error. b Based on one replicate.
lium grown on the wood to be analyzed was harvested for each analysis. Thus, the nutritional source for the control mycelium was nearly identical to that in wood.
Also, mycelia grown on other media exhibited lower
glucosamine contents (TABLE I), so using the figures from wood-grown mycelia gives the most conservative estimate of fungal biomass in wood.
'he glucosamine content of T. versicolor mycelia removed from birch blocks (1.87%) was comparable to, but higher than, the glucosamine content measured in T. versicolor mycelia removed from chestnut sawdust
(1.2%) (Swift, 1973). The concentration of glucosamine in mycelia from T. versicolor removed from pine (1.97%, TABLE I) was also comparable to, but higher than, that calculated from earlier work by Gurusiddaiah et al.
(1978) (1.0% glucosamine in mycelia of T. versicolor removed from a coniferous wood substrate). In this
study, the brown rot fungus, 0. placentus, contained 2.16% glucosamine when removed from pine. As with T. versicolor, this value is higher than that calculated from the results of Gurusiddaiah et al. (1978) which indicated 0.56% glucosamine in mycelia from 0. pla- centus grown on a coniferous wood substrate. Differ- ences among the glucosamine values obtained in these studies could be attributed to the culture media used. Gurusiddaiah et al. (I978) used a wood chip mixture of western white pine, fir, spruce, and western red cedar, and Swift (1973) used chestnut sawdust as op-
posed to the southern yellow pine and yellow birch used in this study. Also, the analytical methods, which varied greatly among the studies, may differ in sensi-
tivity and glucosamine destruction during hydrolysis.
Fungal biomass and mass loss.-The small amounts of
glucosamine detected in sound wood samples may be a result of a minor wood component that contains
glucosamine or a small amount of fungus in the wood before it was harvested. Detection of glucosamine in
461

MYCOLOGIA
r Apparent mass loss
I. Fungal biomass
P[ Residual wood
I + = Actual mass loss ( ) = Percent error in apparent mass loss measurements
(12.7)
15.9+0.9 .......................
.................... . .' ' ' .. . . .. . . .. ." . .. . . . . .. . . . .
(7.3)
9.1+0.4 A...T:::::::::::
.. . . . . .. . . . .
(11.1)
31.3+2.....
....................... .:::::....!.:::::ii .i!
Z . .. . . . . .. . . . . .. . . . . .. . . . .
... .. .. .. .. .. .. . . . . . . . . . . . . . . . .
(3.3)
:::::::::::::::
- 1 0 a - a1 B- 1 - .1 - 0 a a a -1 I I A I IF - a1
cU la
E I (U
-o L.
o
0 .) L-
U1)
-0
-20
-40
-60
Co) Uc
cn CO
-80
-100 U) :3 r
I, o
0
FIG. 1. Relationship between apparent and actual mass loss and fungal biomass for birch decayed by five fungi for 12 wk. The stippled areas indicate fungal biomass as a percent of original wood mass; the value inside represents fungal biomass as a percent of residual material mass.
(20.6)
5.4?0.3 .................:.:..
.. . . .. . . .. . . . .. . .. . .. . .. . .
vir
100-
80-
CZ m
o
0)
mc:n
CZ
0
L_
E40-
O
on
co
a0
I m
CE:
20-
0 CL
C) 0 o
CL 0 E 'a .'
- - -~~~~~~~~~~~~~~~~~~~~~~~~~~~~~~~~~~~l
).i
462
I I I
!
5- 2.7 ?(
JONES AND WORRALL: FUNGAL BIOMASS MEASUREMENT
40
30
20
10
Q)
U) 0l
15
1
0 3 6 9 0
Time (wk) 3 6 9 12
FIG. 2. Fungal biomass and estimated error in measurements of apparent mass loss of birch and pine decayed by Trametes versicolor and Oligoporus placentus. Fungal biomass is expressed as percent of the mass of the residual material. Note that the scaling of the y-axis differs between the two tiers. Error bars represent standard error.
sound wood could also be attributed to the presence of bacteria or actinomycetes that have peptidoglycan cell walls, of which N-acetylglucosamine is a constit- uent. Other researchers have also detected small amounts of glucosamine in sound wood samples (Gu- rusiddaiah et al., 1978) and other plant tissues (May- ama et al., I975; Ride and Drysdale, I97I; Rotter, 1989).
It is possible that glucosamine detection efficiency is different in pure mycelium vs. decayed wood. How- ever, it was found that detection of sugars was not
significantly affected by presence of wood (Worrall and Anderson, I993).
Our values for fungal biomass in birch samples de- cayed by T. versicolor are lower than those calculated from the results of Swift (I973). After 3, 6, 9, and 12 wk of decay by T. versicolor, calculations based on Swift's results indicate 23.6, 29.1, 35.7, and 47.1% fungus in decayed chestnut sawdust, respectively. Differences in fungal biomass values obtained in this study and those obtained by Swift (I973) may be attributed to the dif-
463
MYCOLOGIA
.......... .......... ............ ............. ............... ................ .................. ................. ................... .................... ..................... ...................... ...................... ...................... ...................... ........................ ........................ ........................... .......................... ........................... .......................... ........................... ......................... ........................... .......................... ....................... ... ........................... -20
-40
Apparent mass loss
:..ii.-60 [ Fungal biomass
Residual wood
+| |= Actual massss loss 80
9
0
-20 S
-40
.......... 6 0
100
12
12::::
Time (wk) FIG. 3. Relationship between apparent and actual mass loss and fungal biomass for birch and pine decayed by Trametes
versicolor and Oligoporus placentus for 3, 6, 9, and 12 wk.
100
80-
60-
40-
20-
0-
80
60
0 _,
0
E
C1:
cn
'_ .)
E
cn a: Er
40-
20-
3 6 9 0 6
464

JONES AND WORRALL: FUNGAL BIOMASS MEASUREMENT
ferent species (birch vs. chestnut) and size (blocks vs. sawdust) of wood samples used in the decay studies. More mycelium may be expected to accumulate in
spaces between sawdust particles than in a solid block of the same wood.
In this study, pine blocks decayed by 0. placentus for 12 wk were found to contain 7.3% fungus. Pine
decayed by T. versicolor for 12 wk was found to contain 3.8% fungus (FIG. 2). These results are in the range of those calculated from results of Gurusiddaiah et al.
(1978) who found 11.8% and 5.4% fungus in conif- erous chips decayed by 0. placentus and T. versicolor, respectively, for 5 months. These differences may be attributed to the differences in length of decay and
decay substrates.
Fungal biomass contributed a substantial portion of the mass of decayed samples, introducing considerable errors in measurements of apparent mass loss of wood in many fungus-wood combinations. Percent error in
apparent mass loss measurements was highest at lower mass losses although errors were often substantial even at higher mass losses. Errors in apparent mass loss measurements of pine decayed by T. versicolor for 3 wk and 6 wk were 42.0 and 36.0%, respectively. Errors in apparent mass loss measurements of birch decayed by T. versicolor and 0. placentus for 3 wk exceeded 16% (FIG. 2). In all cases, actual mass loss was higher than the apparent mass loss of wood. Therefore, the ap- parent mass loss is a conservative estimate of wood
decay, which should be taken into account when in-
terpreting results of wood decay studies.
Fungal biomass contributes to the mass and there- fore to the chemical components of decayed samples. This implies that a) in chemical analyses of wood, com-
ponents in the mycelium (such as fungal carbohy- drates) are analyzed as wood components; b) for bio- mass conversion projects, mass of decayed wood over- estimates the amount of useful wood components; c) for wood decay studies related to wood products uti- lization, preservatives, utility pole lifespan, etc., mass loss during decay underestimates the degradation of wood components.
ACKNOWLEDGMENTS
We are grateful to R. Zabel for the donation of fresh-frozen pine and D. H. Griffin for helpful discussion. R. A. Blan- chette andJ. P. Nakas provided helpful reviews of the manu-
script. The study was supported in part by a grant from Niagara Mohawk Power Corporation.
LITERATURE CITED
Anonymous. 1986. Standard method of accelerated lab-
oratory test of natural decay resistance of woods. ASTM Design. D 2017-81. Pp. 446-451. In: ASTM book of
standards. 04.09, Wood. American Society of Testing and Materials, Philadelphia, Pennsylvania.
Arima, K., and T. Uozumi. 1967. A new method for esti- mation of the mycelial weight in Koji. Agric. Biol. Chem. 31: 119-123.
Bartnicki-Garcia, S. 1968. Cell wall chemistry, morpho- genesis, and taxonomy of fungi. Annual Rev. Microbiol. 22: 87-108.
Becker, W. N., andJ. W. Gerdemann. 1977. Colorimetric
quantification of vesicular-arbuscular mycorrhizae. New Phytol. 78: 289-295.
Bethlenfalvay, G.J., R. S. Pacovsky, and M. S. Brown. 1981. Measurement of mycorrhizal infection in soybeans. Soil Sci. 45: 871-875.
Cowling, E. B. 1961. Comparative biochemistry of the de-
cay of sweetgum sapwood by white-rot and brown-rot
fungi. U.S. Forest Serv. Techn. Bull. No. 1258. 79 pp. Desgranges, C., C. Vergoignan, M. Georges, and A. Durand.
1991. Biomass estimation in solid state fermentation: manual biochemical methods. Appl. Microbiol. Biotech- nol. 35: 200-205.
Gurusiddaiah, S., R. A. Blanchette, and C. G. Shaw. 1978. A modified technique for the determination of fungal mass in decayed wood. Canad. J. Forest Res. 8: 486-490.
Hepper, C. M. 1977. A colorimetric method for estimating vesicular-arbuscular mycorrhizal infection in roots. Soil Biol. Biochem. 9: 15-18.
Johnson, B. N., and W. B. McGill. 1990. Comparison of
ergosterol and chitin as quantitative estimates of my- corrhizal infection and Pinus contorta seedling response to inoculation. Canad. J. Forest Res. 20: 1125-1131.
Kirk, T. K., andJ. R. Obst. 1988. Lignin determination.
Pp. 87-101. In: Methods in enzymology. Vol. 161. Biomass, part b, lignin, pectin, and chitin. Eds., W. A. Wood, and S. T. Kellog. Academic Press, San Diego, California.
Martin, F., C. Dekaruelle, and J. L. Hilbert. 1990. An
improved ergosterol assay to estimate fungal biomass in ectomycorrhizas. Mycol. Res. 94: 1059-1064.
Matcham, S. E., B. R. Jordan, and D. A. Wood. 1985. Estimation of fungal biomass in a solid substrate by three independent methods. Appl. Microbiol. Biotechnol. 21:108-112.
Mayama, S., D. W. Rehfeld, andJ. M. Daly. 1975. A com-
parison of the development of Puccinia graminis tritici in resistant and susceptible wheat based on glucosamine content. Physiol. P1. Pathol. 7: 243-257.
Pettersen, R. C., and V. H. Schwandt. 1991. Wood sugar analysis by anion chromatography. J. Wood Chem. Tech- nol. 11: 495-501.
Ride,J. P., and R. B. Drysdale. 1971. A chemical method for estimating Fusarium oxysporum f. lycopersici in in- fected tomato plants. Physiol. Pl. Pathol. 1: 409-420.
, and . 1972. A rapid method for the chem- ical estimation of filamentous fungi in plant tissue. Phys- iol. Pl. Pathol. 2: 7-15.
Rotter, R. G., A. A. Frohloich, R. R. Marquardt, and P. A. Mills. 1989. Estimation of fungal contamination of cereal grains as determined by measuring glucosamine concentration. Canad. J. Anim. Sci. 69: 235-245.
465
466 MYCOLOGIA
Sakurai, Y., T. Ho Lee, and H. Shiota. 1977. On the con- venient method for glucosamine estimation in koji. Agric. Biol. Chem. 41: 619-624.
Seitz, L. M., D. B. Sauer, R. Burroughs, H. E. Mohr, andJ. D. Hubbard. 1979. Ergosterol as a measure of fungal growth. Phytopathology 69: 1202-1203.
Sharma, P. D., P.J. Fisher, andJ. Webster. 1977. Critique of the chitin assay technique for estimation of fungal biomass. Trans. Brit. Mycol. Soc. 69: 479-483.
Swift, M. J. 1973. The estimation of mycelial biomass by determination of the hexosamine content of wood de-
cayed by fungi. Soil Biol. Biochem. 5: 321-332. Toppan, A., M. T. Esquerre-Tugaye, and A. Touze. 1976.
An improved approach for the accurate determination of fungal pathogens in diseased plants. Physiol. Pl. Path- ol. 9: 241-251.
Toth, R., R. M. Miller, A. G. Jarstfer, T. Alexander, and E. L. Bennett. 1991. The calculation of intraradical fun-
gal biomass from percent colonization in vesicular-ar- buscular mycorrhizae. Mycologia 83: 553-558.
Worrall, J. J., and K. M. Anderson. 1993. Sample prepa- ration for analysis of wood sugars by anion chromatog- raphy.J. Wood Chem. Technol. 13: 429-437.
Wu, L., and M. A. Stahman. 1975. Chromatographic esti- mation of fungal mass in plant materials. Phytopathology 65:1032-1034.