Funding Agricultural Research - Farming Smarter · 2014-09-25 · Funding Agricultural Research...
32
Funding Agricultural Research Presentation Farming Smarter Conference Medicine Hat December 5, 2012 Richard Gray University of Saskatchewan
Transcript of Funding Agricultural Research - Farming Smarter · 2014-09-25 · Funding Agricultural Research...

Funding Agricultural Research
Presentation
Farming Smarter Conference
Medicine Hat
December 5, 2012
Richard Gray
University of Saskatchewan

Outline
• The producer returns to research
• Funding through Public-Producer-Private Partnerships
• The Australian research system
• Options for funding wheat research in Canada

Producer Returns to Research
• Where are the benefits?
– Private:
• Higher yields
• Lower costs
• Better quality
– Public
• Improved environment
• Improved health
• Improved food security

Who pays for research?
• Governments (Taxpayers)
• Producers and Consumers through check offs (levies)
• Producers through seed and other inputs

Stylized Representation of Research Benefits and Costs
0 5 10 15 20 25 30
Gross annual benefits (dollars per year)
R&D
Lag
Research Benefits
Research Costs
Adoption
Process
Year

The Measuring the Returns to Research
• Present Value recognizes that “time is money”
– Getting a dollar today is worth more that getting the dollar a year or five years from now. A 5% discount rate is used in most studies
• Benefit Cost Ratio = PV Benefits/PV Costs
• A B/C equal to implies a 5% rate of return
• A B/C ratio of 2:1 is a very good investment

The internal rate of return is the rate of return earned on the dollars
invested. • 5% is good do
• 10% is great
• 20% is fantastic

Meta Evidence from Literature Prior to 2000
Mean : 82.1
1,821 observations
292 studies
Source. Alston, J.M., C. Chan-Kang, M.C. Marra, P.G. Pardey, and T J Wyatt. A Meta-Analysis of the Rates of Return to Agricultural R&D: Ex Pede Herculem. IFPRI Research Report No. 113, 2000.

Persistence Pays: U.S. Agricultural Productivity Growth and the Benefits from Public R&D Spending.
J.M. Alston, M.A. Andersen, J.S. James, and P.G. Pardey
Springer, January 2010
New Evidence

Source: Persistence Pays – Alston et al. 2010
Returns to
Benefit-Cost Ratio
(3% real discount rate)
Own-State National
State R&E
ratio
48-State Average 21.0 32.1 48-State Minimum 2.4 9.9
48-State Maximum 57.8 69.2
USDA Research 17.5
Marginal Returns to U.S. Public Agricultural R&E

Canadian Returns to Research
• WGRF 2012
• Zero till 201)
• Regional Variety Trials
• Sask Pulse Growers 2008

The Returns to WGRF cereal research 1994-2030
Varietal Type/Class Benefit/Cost
Ratio Internal Rate of
Return %
All Wheat 20.40 36%
CWRS 31.13 42%
CWHW 2.22
CWAD 35.91 44%
CPS -
CWES 0.22
CWRW 1.26
CWSWS 28.42
All Barley 7.56 28%
2-R Malt 6.51 26%
Source: Gray Nagy Guzel (2012)

The Returns to Zero Tillage Research
• Gray and Nagy (2011) found:
– Public research expenditures 52 to 1 Benefit / Cost Ratio
– Machinery Sector $121 in sales for evert $1 invested in research

Benefits of Regional Variety Trials
0
20
40
60
80
100
120
140
160
180
200
Benefits of Regional Variety Trials 1971-2010 ($Million)

Benefits of Regional Variety Trials
0
20
40
60
80
100
120
140
160
180
200
Benefits of Regional Variety Trials 1971-2010 ($Million)
63:1 Benefit Cost Ratios

SPG Pulse Research (1984- 2024)
Genetics Development Total Research Acceleration Impact
Producer Ben/Cost 27.81 15.77 20.19 Producer IRR 39.5% 40.4% Industry Ben/Cost 26.91 23.29 24.6
Source: Gray, Galusko,Nagy and Weseen, 2008

The Underfunding of Research is
Problem #1
• High B/C ratios indicate many lost
opportunities
• research can increase economic growth while
addressing food security
• can learn from other Agricultural Knowledge
Systems

3 potential funding sources – 3 roles
• Private firms – can only provide excludable
private goods
• Producer (Industry) funding –can also
provide industry specific non-excludable
goods
• Public Research – can also provide (general
–non excludable) public goods

www.usask.ca/yoururl
Insert college, presentation title, and/or date as necessary
3 Types of Knowledge Inputs for Innovation
Public Goods (non-excludable)
Industry Goods (non-excludable)
Private Goods (excludable)
Basic Science Research Crop genomics, germplasm, unprotected varieties
IP Protected crop varieties/traits/processes
Science literacy/ ecology /chemistry/ biology
Agronomy/ best management practices
Protected production process
Business management
knowledge dissemination product, input testing
Patentable mechanical innovations
Human and model crop Genomics
Crop disease research, biological control systems
Chemical Pesticides Inoculants
Pathogen Research Quality standards/systems Market access
product and market development

A balanced “4P” approach is needed
• 4P: Private-Producer-Public Partnerships
• Balance is required for:
– greater overall funding
– to provide industry goods and public goods while
tapping into global IP

Avoid the UK wheat model
• IPRs are too weak - 53% of average royalty paid on saved seed, which also limits royalties
• $27 million revenue is split between six very small breeding programs with little or no private upstream research
• 15 year gap in partnership with public research
• “the get out of the way and they will come” approach did not work well – several elements were missing

Australia’s balanced approach
• Matched (1% + .5 %) (non- refundable) check-
off funding of Gross industry sales for grains
and most other ag products- GRDC became
the driver of the whole system
• Continued public support for basic research
• Strong IPRs and creation of three breeding
firms with private-producer-public
shareholders
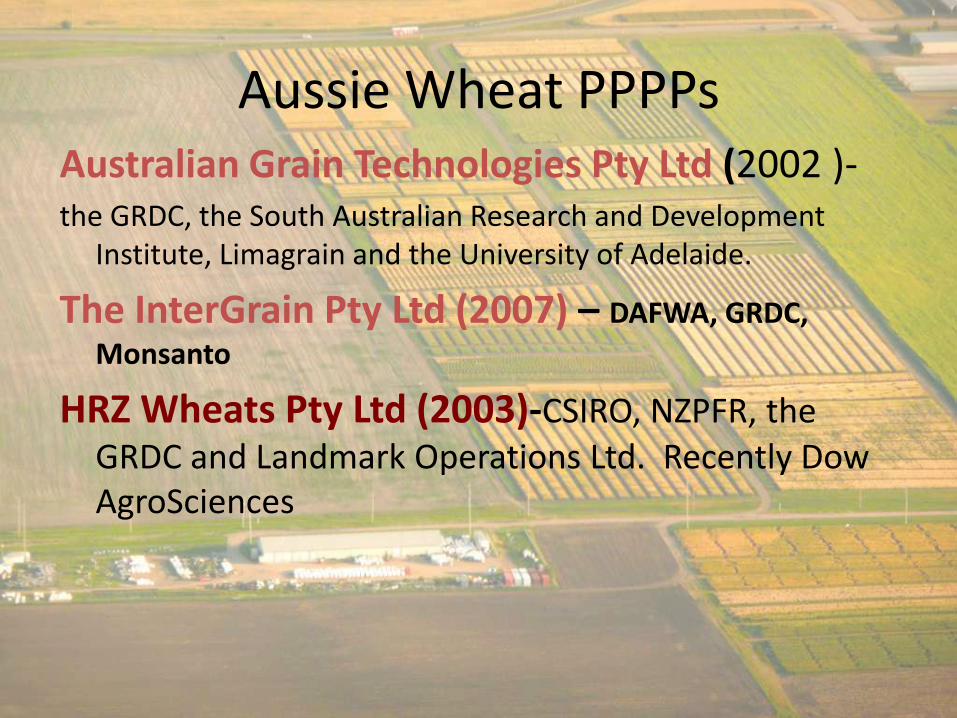
Aussie Wheat PPPPs Australian Grain Technologies Pty Ltd (2002 )- the GRDC, the South Australian Research and Development
Institute, Limagrain and the University of Adelaide.
The InterGrain Pty Ltd (2007) – DAFWA, GRDC,
Monsanto
HRZ Wheats Pty Ltd (2003)-CSIRO, NZPFR, the GRDC and Landmark Operations Ltd. Recently Dow AgroSciences

End Point Royalties
• End Point Royalties (EPRs) collected on the sale of harvested grain
• reduced producer risk
• Full royalties even with farm saved seed
• EPRs are now generating enough revenue to support 4 breeding firms but it took 15 years to get there
• Future EPRs will quickly exceed research funding requirements
• Long process of ramp up. An application of uniform EPRs to all varieties can generate immediate cash flow for breeders.
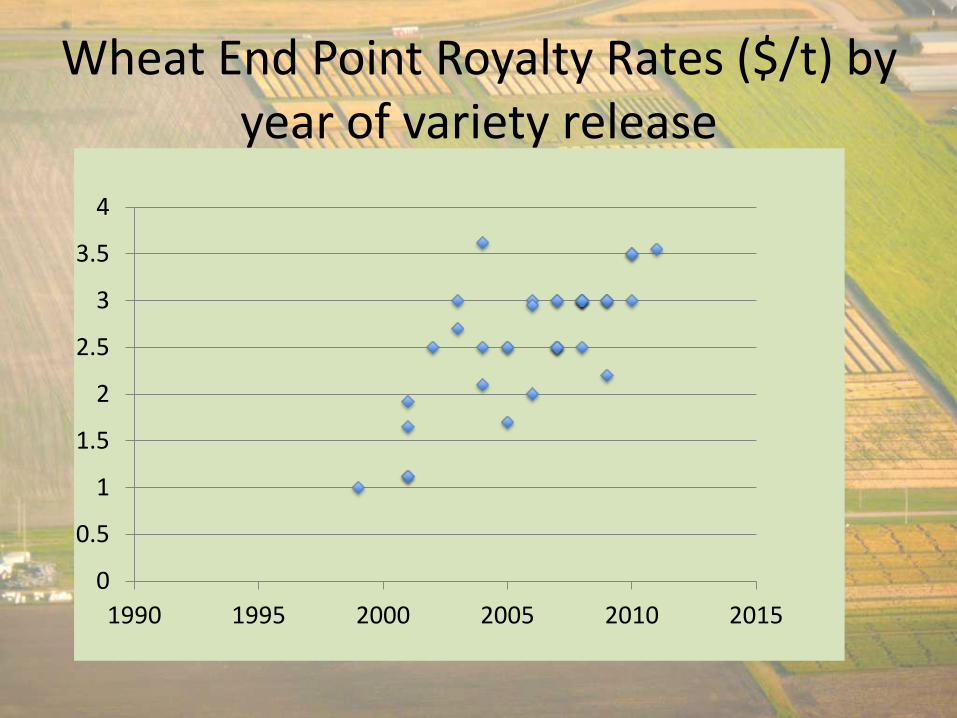
Wheat End Point Royalty Rates ($/t) by year of variety release
0
0.5
1
1.5
2
2.5
3
3.5
4
1990 1995 2000 2005 2010 2015

Comparison of Research Intensity (% of sales)
Across Funding Regimes

The 4P balanced approach - Part 1
• Governments should work with industry to
pass legislation that will create a one-percent
End Point Royalty on the sale of all crops that
would be paid to variety owners
– This would provide a large and immediate stream
of revenue for all successful crop breeders without
a long phase in period
– Could make Canada UPOV 91 compliant
The 4P balanced approach - Part 2
• The federal government should use its research mandate to create national producer-controlled, non-refundable check-off funded research corporations
– Accountability can be enhanced with a share structure
– The corporations similar to the Australian RDC models could undertake applied R&D and extension for the benefit of the sector
– As in Australia, these corporations would also be in a position to foster 4P partnerships with the private and public sector
The 4P balanced approach – Part 3
• Government should continue their public
support for basic and applied scientific
research

Summary
• High rates of return to research indicate lost opportunities to do more
• Uniform EPRs provide an immediate income stream
• Non-refundable producer check-off corporations can provide needed industry goods
• Public research can focus on public goods • System works the best through 4P partnerships • Widespread engagement and planning is required