FUNDAMENTALS OF ULTRASONIC FLOW METERSasgmt.com/wp-content/uploads/pdf-docs/2002/1/10.pdf ·...
10
PAGE 52 2002 PROCEEDINGS AMERICAN SCHOOL OF GAS MEASUREMENT TECHNOLOGY FUNDAMENTALS OF ULTRASONIC FLOW METERS Keven Conrad and Larry Lynnworth Panametrics, Inc. 7255 Langtry, Houston, TX 77040-6626 and 221 Crescent Street, Waltham, MA 02453-3497 ABSTRACT Ultrasonic contrapropagation methods have been used to measure the flow of natural gas since the 1970s, flare gases since the 1980s, and smokestack gases in cem (continuous emissions monitoring) since the 1990s. Since the early 2000s, ultrasonic clamp-on flow measurements, previously restricted mainly to liquids, were found effective in measuring in standard steel pipes, the flow of steam, natural gas and other gases and vapors, including air, as long as the flow velocity was not so high as to cause excessive beam drift or excessive turbulence (in other words, below about Mach 0.1), and provided the acoustic impedance of the gas was equivalent to air above about six bar and no important molecular absorption or scattering mechanisms were present. Although the flow of gases by ultrasonics has long been thought to be more difficult to measure than liquids, in fact the measurement is easier in two important respects. One is, for the contrapropagation method, the upstream - downstream time difference is generally much greater for gases, as a consequence of the much lower sound speeds in gases compared to liquids. The other significant factor that becomes important in mass flow metering (including scfm output) is the existence of theoretical and/or empirical relationships between ultrasonic propagation and density, where either of such relationships is easier to exploit for gases than for liquids. To provide an idea of the scope of applications addressable with ultrasonic technology that is commercially available now or likely to be available in the near future, this paper starts with an analysis from the point of view of acoustic impedance; considers designs as a function of the number of nozzles, from zero to a dozen; and lists factors conducive to high accuracy versus factors detrimental to high accuracy, i.e., conducive to uncertainty. INTRODUCTION Ultrasonic contrapropagation methods have been used to measure the flow of natural gas since the 1970s, flare gases since the 1980s, and smokestack gases in cem (continuous emissions monitoring) since the 1990s. Contrapropagation means sound waves are timed in a direction with the flow and later or simultaneously, against the flow. At low Mach number, <<1, the time difference is directly proportional to the flow velocity V PATH along the path. Even at Mach 0.1 the time difference is very nearly proportional to the velocity along the path. In any event, by timing upstream and downstream, the correct velocity can be computed along the path. Depending on the uncertainty in flow profile, the velocity along the path or paths can be converted to an area- averaged velocity V AVG . For a single path it is common to relate the path and area-averaged velocities by a meter factor K defined by K = V AVG /V PATH . The actual volumetric flowrate Q = V AVG × A where A = area of the conduit. This means Q = KV PATH . In certain multipath flowmeters the paths and weights assigned to the paths are such that the resulting integration of individual path measurements is largely independent of profile details. Of course, as the flow departs from ideal conditions, even a quadrature integration method becomes less accurate, but in many practical situations, accuracies better than 0.5% are routinely obtained. Since the early 2000s, ultrasonic clamp-on flow measurements, previously restricted mainly to liquids, were found effective in measuring in standard steel pipes, the flow of steam, natural gas and other gases and vapors, including air, as long as the flow velocity was not so high as to cause excessive beam drift or excessive turbulence (in other words, below about Mach 0.1), and provided the acoustic impedance of the gas was equivalent to air above about six bar and no important molecular absorption or scattering mechanisms were present. The caveats mean, avoid carbon dioxide; avoid some or all halogen vapors; and beware of mist or particulate-laden gases. Another limit: the gas (or steam) temperature T cannot exceed the T limit of the transducer or couplant, whichever is lower. [1, 12] Although the flow of gases by ultrasonics has long been thought to be more difficult to measure than liquids, in fact the measurement is easier in two important respects. One is, for the contrapropagation method, the upstream - downstream time difference is generally much greater for gases, as a consequence of the much lower sound speeds in gases compared to liquids. (Exception: hydrogen gas; its sound speed at 100˚C ~ speed of sound in ordinary water.) The other significant factor that becomes important in mass flow metering (including scfm output) is the existence of theoretical and/or empirical relationships between ultrasonic propagation (sound speed c and/or attenuation coefficient α) and molecular weight or density, where such relationships may be easier to exploit for gases than for liquids. Examples supporting the determination of gas density from ultrasonic measurements, after T compensation, include: the amplitude of the received signal in still gas is nearly proportional to gas pressure; the sound speed c is inversely proportional to the square root of MW (molecular weight), and gas density is proportional to
Transcript of FUNDAMENTALS OF ULTRASONIC FLOW METERSasgmt.com/wp-content/uploads/pdf-docs/2002/1/10.pdf ·...

PAGE 52 2002 PROCEEDINGSAMERICAN SCHOOL OF GAS MEASUREMENT TECHNOLOGY
FUNDAMENTALS OF ULTRASONIC FLOW METERSKeven Conrad and Larry Lynnworth
Panametrics, Inc.7255 Langtry, Houston, TX 77040-6626 and 221 Crescent Street, Waltham, MA 02453-3497
ABSTRACT
Ultrasonic contrapropagation methods have been usedto measure the flow of natural gas since the 1970s, flaregases since the 1980s, and smokestack gases in cem(continuous emissions monitoring) since the 1990s. Sincethe early 2000s, ultrasonic clamp-on flow measurements,previously restricted mainly to liquids, were foundeffective in measuring in standard steel pipes, the flowof steam, natural gas and other gases and vapors,including air, as long as the flow velocity was not so highas to cause excessive beam drift or excessive turbulence(in other words, below about Mach 0.1), and providedthe acoustic impedance of the gas was equivalent to airabove about six bar and no important molecularabsorption or scattering mechanisms were present.Although the flow of gases by ultrasonics has long beenthought to be more difficult to measure than liquids, infact the measurement is easier in two important respects.One is, for the contrapropagation method, the upstream- downstream time difference is generally much greaterfor gases, as a consequence of the much lower soundspeeds in gases compared to liquids. The othersignificant factor that becomes important in mass flowmetering (including scfm output) is the existence oftheoretical and/or empirical relationships betweenultrasonic propagation and density, where either of suchrelationships is easier to exploit for gases than for liquids.To provide an idea of the scope of applicationsaddressable with ultrasonic technology that iscommercially available now or likely to be available inthe near future, this paper starts with an analysis fromthe point of view of acoustic impedance; considersdesigns as a function of the number of nozzles, fromzero to a dozen; and lists factors conducive to highaccuracy versus factors detrimental to high accuracy,i.e., conducive to uncertainty.
INTRODUCTION
Ultrasonic contrapropagation methods have been usedto measure the flow of natural gas since the 1970s, flaregases since the 1980s, and smokestack gases in cem(continuous emissions monitoring) since the 1990s.Contrapropagation means sound waves are timed in adirection with the flow and later or simultaneously, againstthe flow. At low Mach number, <<1, the time differenceis directly proportional to the flow velocity VPATH alongthe path. Even at Mach 0.1 the time difference is verynearly proportional to the velocity along the path. In anyevent, by timing upstream and downstream, the correctvelocity can be computed along the path.
Depending on the uncertainty in flow profile, the velocityalong the path or paths can be converted to an area-averaged velocity VAVG. For a single path it is common torelate the path and area-averaged velocities by a meterfactor K defined by K = VAVG/VPATH. The actual volumetricflowrate Q = VAVG × A where A = area of the conduit. Thismeans Q = KVPATH. In certain multipath flowmeters thepaths and weights assigned to the paths are such thatthe resulting integration of individual path measurementsis largely independent of profile details. Of course, asthe flow departs from ideal conditions, even a quadratureintegration method becomes less accurate, but in manypractical situations, accuracies better than 0.5% areroutinely obtained.
Since the early 2000s, ultrasonic clamp-on flowmeasurements, previously restricted mainly to liquids,were found effective in measuring in standard steel pipes,the flow of steam, natural gas and other gases andvapors, including air, as long as the flow velocity wasnot so high as to cause excessive beam drift or excessiveturbulence (in other words, below about Mach 0.1), andprovided the acoustic impedance of the gas wasequivalent to air above about six bar and no importantmolecular absorption or scattering mechanisms werepresent. The caveats mean, avoid carbon dioxide; avoidsome or all halogen vapors; and beware of mist orparticulate-laden gases. Another limit: the gas (or steam)temperature T cannot exceed the T limit of the transduceror couplant, whichever is lower. [1, 12]
Although the flow of gases by ultrasonics has long beenthought to be more difficult to measure than liquids, infact the measurement is easier in two important respects.One is, for the contrapropagation method, the upstream- downstream time difference is generally much greaterfor gases, as a consequence of the much lower soundspeeds in gases compared to liquids. (Exception:hydrogen gas; its sound speed at 100˚C ~ speed of soundin ordinary water.) The other significant factor thatbecomes important in mass flow metering (including scfmoutput) is the existence of theoretical and/or empiricalrelationships between ultrasonic propagation (soundspeed c and/or attenuation coefficient α) and molecularweight or density, where such relationships may be easierto exploit for gases than for liquids. Examples supportingthe determination of gas density from ultrasonicmeasurements, after T compensation, include: theamplitude of the received signal in still gas is nearlyproportional to gas pressure; the sound speed c isinversely proportional to the square root of MW(molecular weight), and gas density is proportional to

2002 PROCEEDINGS PAGE 53AMERICAN SCHOOL OF GAS MEASUREMENT TECHNOLOGY
molecular weight times pressure. At high molecularweight and/or high pressure, these simple (linear)approximations are inadequate. Virial equations andsupercompressibility provide a remedy.
To provide an idea of the scope of applicationsaddressable with ultrasonic technology that iscommercially available now or likely to be available in thenear future, this paper starts with a short theoretical sectionin which the contrapropagation equations are derived. Thisis followed by profile considerations. Then we go toacoustic impedance. Lastly, we consider designs as afunction of the number of nozzles, from zero to a dozen;and list factors conducive to high accuracy versus factorsdetrimental to high accuracy, i.e., conducive to small orlarge uncertainty. There are other “fundamentals” besidesthese. However, to keep this paper to reasonable length,only these topics are treated. The references, particularlythe 2002 paper by Walters et al. [15] deal with aspectsbeyond the scope of this paper.
DISCUSSION
Theory
1. Equations for a Contrapropagation Flowmeter
In the contrapropagation method, ultrasonic (orsometimes audible) waves are transmitted upstream anddownstream. From the transit times t1 and t2 in eachdirection, and knowledge of the path and flow profile,the average flow velocity VA is determined. A rathersimple derivation of the basic flow-sensing equation ispossible if one imagines a fluid of sound speed c flowingat a uniform velocity V < c in a duct of cross-sectionalarea A, interrogated by two point sensors on the axisand spaced a distance L apart. The transit times in theupstream and downstream directions, respectively, are
t1 = L/(c – V) and t2 = L/(c + V). (1 & 1a)
The reciprocals of these transit times, when multipliedby the axial projection of the axial interaction path L, are
L/t1 = c – V and L/t2 = c + V. (2 & 2a)
Accordingly,
The upstream-downstream time difference can beobtained from Equation (1) as ∆t = 2LV/(c2-V2). This canbe expressed in terms of the Mach number MN=V/c forMN << 1:
∆t = 2LV / c2
= (2LV / c2) (1 + MN2 + MN
4 + ...) (5) 1 – MN
At sufficiently small Mach numbers, the followingapproximations are valid:
V ≈ c2∆t/2L and ∆t ≈ 2LV/c2 (6 & 6a)
2. Profile Considerations
As is well known [2], flow of any fluid in a pipe is lowernear the wall and higher near the center. Disturbancesupstream or downstream perturb the profile and mostreal profiles are not symmetrical about the axis. Gas flowprofiles can be more complicated than simple liquidprofiles for various reasons including: (a) gases arecompressible; (b) at high Mach number, MN 0.3, theflow itself becomes “compressible flow;” (c) condensateperturbs the boundary conditions and can materiallyaffect the duct area A available for gas flow. See Table 2.
Liquids. To deal with complex liquid flow patterns in sucha way that an accurate measure of total flow is obtaineddespite the complexity, manufacturers of ultrasonicflowmeters found that one diameter path did not suffice.Thus we find a progression from one diameter traversein [14] to crossed diameter paths in [13], and quadraturemultipath solutions in [2(b) or 7]. Essentially the samequadrature multipaths were utilized for high-accuracy(low-uncertainty) gas flow measurement. Midradius pathsare also used, but unlike the history for liquids, their firstuse (1975) by Roger C. Baker appears to be in air [citedin 7 & 15 ] , later in liquids and most recently, in naturalgas by Jan G. Drenthen and his colleagues. [See 2(b) or15 for these references].
3. Acoustic Impedance Z
The characteristic acoustic impedance Z = ρc where ρ =gas density and c = sound speed in the gas. Why is Zimportant? Because it determines the fraction of availableultrasonic energy from the transducer transmitted intothe gas, and vice versa. Figure 1(a) plots gases, liquidsand solids as a function of their ρ and c. As this is a log-log plot, lines having a slope of –1 are lines of constantZ. The Z for most solids, say steel, is orders of magnitudegreater than for methane or any other gas at ordinaryconditions of temperature T and pressure P. Solids arein the >10 megarayl range. Gases are in the 0.1 to 1kilorayl range. [Plots for gases only are given in Figs.1(b-d). When c yields average MW (molecular weight) ordensity, mass flowrate MF is not far behind.]
Entering a gas on such a chart requires that the gas’sound speed and density are known. Entries are usuallyassociated with STP (0˚ C, 760 mm Hg). The locus formethane, if examined carefully, reveals a slight increasein c as P increases, as well as the expected nearlyproportionate increase in density ρ as P increases.
]L 1 1 L t2 t2 t1 2 t1t2
] [c = =[
L 1 1 L ∆t2 t2 t1 2 t1t2
] [V = =[ ] (3)
and
(4)

PAGE 54 2002 PROCEEDINGSAMERICAN SCHOOL OF GAS MEASUREMENT TECHNOLOGY
The departure from linearity between density andpressure is often treated by a supercompressibility factor.See for example, pages 29-52 in the chapter by BillBuzzard in David W. Spitzer’s 2001 book cited in [2].
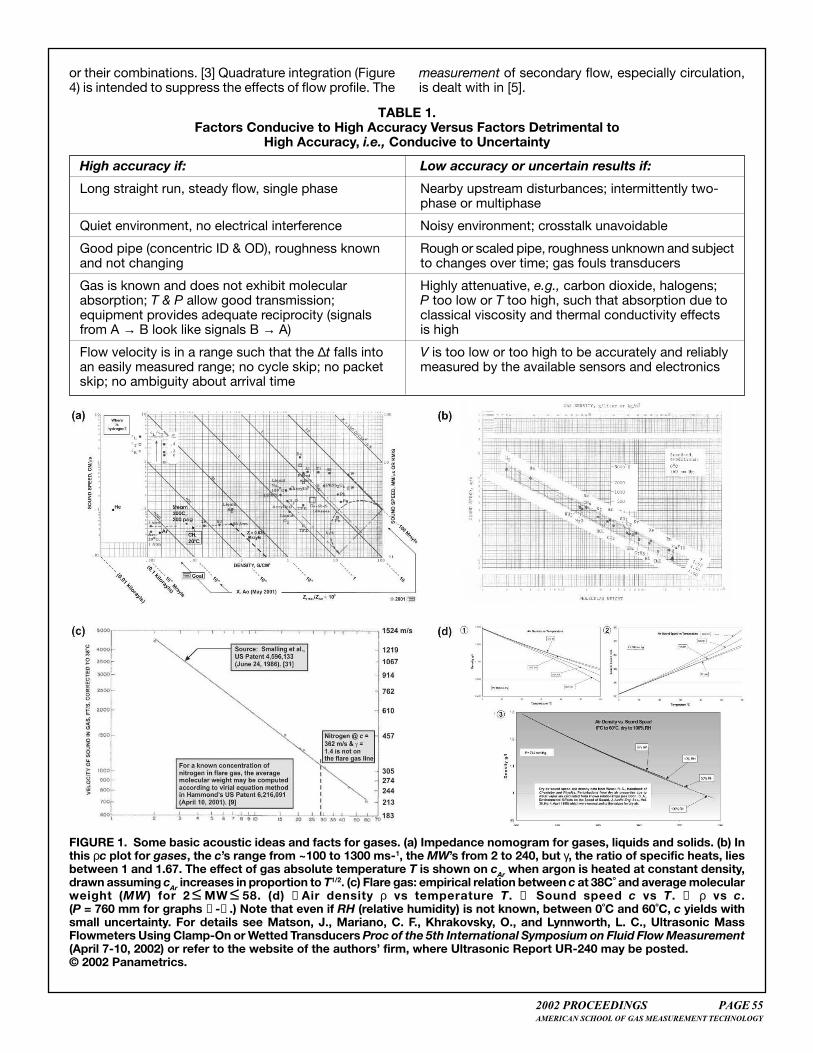
One of the ways of overcoming some of the largemismatch in impedances for gases at or near atmosphericpressure is to build the transducer with a quarterwaveimpedance matcher between the solid piezoelectric (ofhigh Z) and the gas. Figure 2(a) shows a T7 transducerbuilt this way. To preserve the transducer from unwantedeffects of the “gas,” a Ti, SS or other thin metal layersurrounds the piezo and matcher, in these designs [8; 8(b)].Sometimes, as in cem (continuous emissions monitoring),one transducer is not enough, so arrays are used [Fig. 2(b)].Fiberacoustic “BWT” bundled waveguides [6] have beenused in many gas applications (up to ~ 500˚C) withoutany matcher [Fig. 2 (c), (d)].
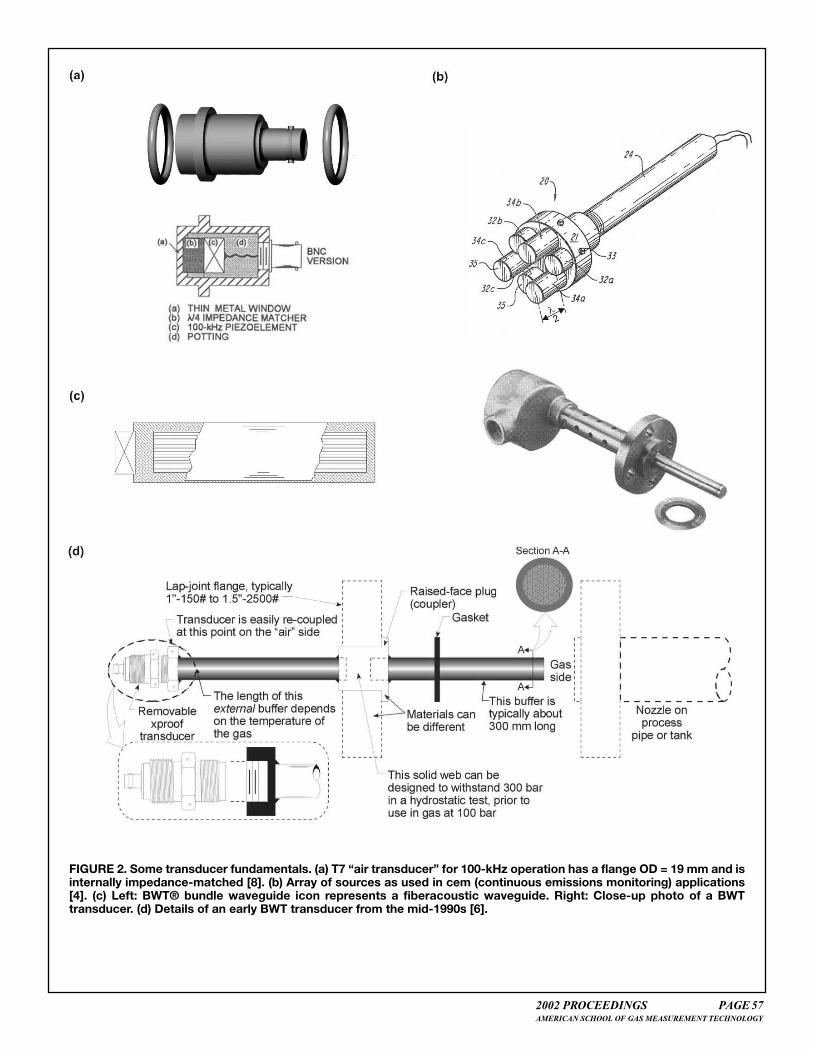
This matching idea works if the transducer is “wetted,”i.e., in contact with the gas as in Figure 2(a). In clamp-on(Figure 3) the transducer wedge contacts the steel (orother material), not the gas, so another solution isnecessary to overcome the mismatch. Clamp &installation details are given in Fig. 3(b-d).
One might say the low Z of a gas is mostly due to its lowdensity, compared to steel or other elastic solids. We canalso ask, are there special consequences of the low c of agas, say methane, compared to steel? One consequenceis, in clamp-on, the angle of the sound beam refractedinto the gas is small, say 5 to 8 deg, according to acalculation using Snell’s Law of Refraction. This implies,a V measurement along a path only a few degrees offnormal, is going to be very sensitive to crossflow. Ifcrossflow is significant, crossed clamp-on paths as shownin Figure 3(f) may be necessary. A second consequenceof low c and small refracted angle is that paths off thediameter (as seen in the end view) are not reachable withtoday’s technology. This means a clamp-on quadratureis out of reach. Exception: hybrid [Figure 4(g)].
The “good” news associated with low c is the timedifference ∆t between upstream and downstreaminterrogations is larger, typically in the many (tens of)microseconds range, compared to liquids, where ∆t maybe just a few microsences and must be resolved to 1 nsor less. On the other hand, the attenuation coefficient ingases is usually much higher than in liquids, and alongwith impedance mismatch, constrains the ultrasonicfrequency to be < 1 MHz for gases, whereas for liquids ƒ> 1 MHz is common.
How long have we waited for a practical clamp-onultrasonic flowmeter for gases to become availablecommercially? One answer is thirty-nine years. Thisanswer is based on (a) the GC868 announcement in [9],and on (b) the last paragraph in [14]. That 1966 patent isone of the earliest (perhaps the earliest) clamp-on U.S.patents for liquid flow, and claims a Japanese prioritydate of 1962.
4. Designs As a Function of the Number of Nozzles
Zero Nozzles. This means clamp-on (Figure 3). Fordetails see [1 & 9] or www.panametrics.com, PCI or PCIR&D pages, Ultrasonic Report UR-264. Accuraciesaround 2% have been achieved with one path. Crosseddiameters can improve the accuracy, as in [13]. As ofmid-2002, applications were restricted in general to metalpipes of diameter >3 inches (>75 mm) but less than about2 ft (600 mm). These are guidelines. At high pressure, ifV is not too high, gas flows in pipes as large as 30 incheshave been measured by clamp-on. Bad pipe, heavy wall,noisy environment, and/or access limited to one side,can frustrate the method. Success depends on a numberof factors, including the state of the equipment, e.g., itssoftware version, as well as pipe and flow conditions.
As has been the practice for liquids since the 1960s and1970s [11, 13, 14], measurements in ⊥ planes (X in endview) yield better accuracy than measurements in oneplane only. Unlike liquids [Fig. 3(a), parts (1) & (7)], thevee path, with both transducers on the same side of thepipe, is hard to use when the fluid is a gas, because oftoo much acoustic crosstalk. Sometimes crosstalk iscalled acoustic short circuit noise.
One Nozzle. Insertion probes can go in oblique ornormal. Some ultrasonic solutions use an intrusivereflector but the transducers themselves are flush to theID or recessed by up to a foot (300 mm) or so if the gasis hot. The advantages of the one-port compared to >1port are economy and ease of installation. Drawbacksare accuracy, to the extent the profile is uncertain. Theone-port samples only a small chord segment. If thereflector is located about 60% of the radius in from thewall, and to the extent the profile obeys a Nikuradsepower law, then the flow averaged from the wall to thatreflector nearly equals VAVG. However, the length of thechord segment, in the end view, is only 0.3D whereD = pipe inside diameter. This small sample may becontrasted with multipath sampling for a 12-nozzlespoolpiece referred to at the end of this section. One-ports are shown in [15].
Two Nozzles. Examples from the “flare gas world” aregiven in [10 & 15]. The bias 90 arrangement samples ashort chord segment but seems to provide adequateaccuracy. It is probably the most common hot-tapgeometry for flare gas flow measurements.
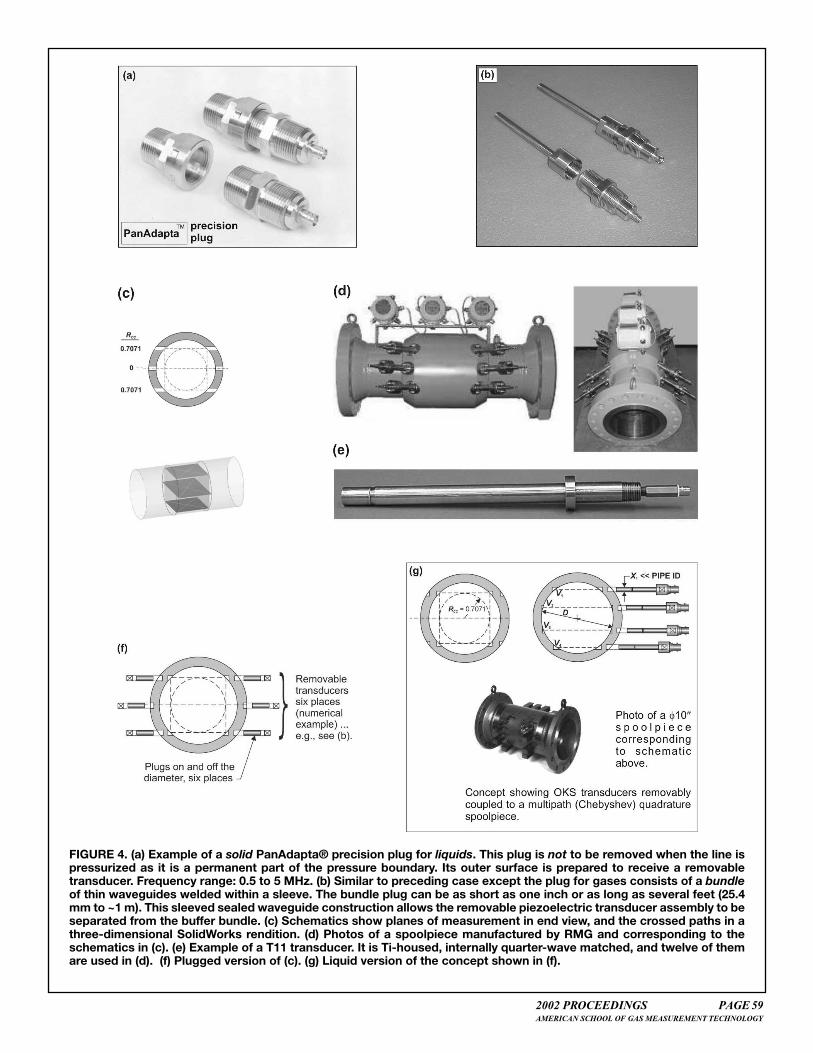
Twelve Nozzles. Custody transfer spoolpieces shownin Figure 4(d) use crossed paths (hence four transducersper plane) in each of three parallel planes (hence 12transducers total).
Accuracies (by which we mean uncertainties) are 0.5%or better, 0.3% in some tests. By using transducersshown in Figure 4(e), tests can be run in air at atmosphericpressure. Air calibration allows relatively economicaltesting under various disturbed-flow conditions such asupstream elbows, diameter changes, partly open valve,
2002 PROCEEDINGS PAGE 55AMERICAN SCHOOL OF GAS MEASUREMENT TECHNOLOGY
or their combinations. [3] Quadrature integration (Figure4) is intended to suppress the effects of flow profile. The
measurement of secondary flow, especially circulation,is dealt with in [5].
TABLE 1.Factors Conducive to High Accuracy Versus Factors Detrimental to
High Accuracy, i.e., Conducive to Uncertainty
High accuracy if: Low accuracy or uncertain results if:
Long straight run, steady flow, single phase Nearby upstream disturbances; intermittently two-phase or multiphase
Quiet environment, no electrical interference Noisy environment; crosstalk unavoidable
Good pipe (concentric ID & OD), roughness known Rough or scaled pipe, roughness unknown and subjectand not changing to changes over time; gas fouls transducers
Gas is known and does not exhibit molecular Highly attenuative, e.g., carbon dioxide, halogens;absorption; T & P allow good transmission; P too low or T too high, such that absorption due toequipment provides adequate reciprocity (signals classical viscosity and thermal conductivity effectsfrom A → B look like signals B → A) is high
Flow velocity is in a range such that the ∆t falls into V is too low or too high to be accurately and reliablyan easily measured range; no cycle skip; no packet measured by the available sensors and electronicsskip; no ambiguity about arrival time
FIGURE 1. Some basic acoustic ideas and facts for gases. (a) Impedance nomogram for gases, liquids and solids. (b) Inthis ρc plot for gases, the c’s range from ~100 to 1300 ms-1, the MW’s from 2 to 240, but γ, the ratio of specific heats, liesbetween 1 and 1.67. The effect of gas absolute temperature T is shown on cAr when argon is heated at constant density,drawn assuming cAr increases in proportion to T1/2. (c) Flare gas: empirical relation between c at 38C˚ and average molecularweight (MW) for 2 ≤ MW ≤ 58. (d) ① Air density ρ vs temperature T. ② Sound speed c vs T. ➂ ρ vs c.(P = 760 mm for graphs ① -➂ .) Note that even if RH (relative humidity) is not known, between 0˚C and 60˚C, c yields withsmall uncertainty. For details see Matson, J., Mariano, C. F., Khrakovsky, O., and Lynnworth, L. C., Ultrasonic MassFlowmeters Using Clamp-On or Wetted Transducers Proc of the 5th International Symposium on Fluid Flow Measurement(April 7-10, 2002) or refer to the website of the authors’ firm, where Ultrasonic Report UR-240 may be posted.© 2002 Panametrics.

PAGE 56 2002 PROCEEDINGSAMERICAN SCHOOL OF GAS MEASUREMENT TECHNOLOGY
TABLE 2.Diameter, midradii, their combination, tomographic and quadrature arrangements.Complex flow patterns, high-accuracy, motivate multipaths on or off the diameter.
2002 PROCEEDINGS PAGE 57AMERICAN SCHOOL OF GAS MEASUREMENT TECHNOLOGY
FIGURE 2. Some transducer fundamentals. (a) T7 “air transducer” for 100-kHz operation has a flange OD = 19 mm and isinternally impedance-matched [8]. (b) Array of sources as used in cem (continuous emissions monitoring) applications[4]. (c) Left: BWT® bundle waveguide icon represents a fiberacoustic waveguide. Right: Close-up photo of a BWTtransducer. (d) Details of an early BWT transducer from the mid-1990s [6].
PAGE 58 2002 PROCEEDINGSAMERICAN SCHOOL OF GAS MEASUREMENT TECHNOLOGY
FIGURE 3. (a) Refraction with clamp-on, calculated assuming a refracted angle θ2 of 60˚ for a shear wave in the steel pipe,depends on sound speed c3 in the fluid. Referring to items (1)-(3) commercial contrapropagation clamp-on flowmetersavailable since the early 1990s include the PT868 and 6068 for measuring the flow of liquids. In water, the vee path usuallyworks, and θ3 is about 25˚ at room temperature. In air, θ3.AIR is only about 6˚ and the transducers usually need to be placedon opposite sides of the pipe. (5) For liquid clamp-on, the vee path [shown in (1)] tends to cancel crossflow as well asdouble the sensitivity to flow compared to a single traverse. For gases, odd numbers of traverses are preferred, to reducecrosstalk. This means, if crossflow is significant, crossed paths are recommended. The velocities measured along thelegs of the X should be averaged. Best solution: find a long straight run far from disturbances and joints. For gases[diagrams (4) & (5)] the flowmeter instrument (6) introduced in 2001 is the GC868 (Ao, 1999; Ao, et al. (2002); Lynnworth2001). Diagram (7), drawn for LOX or LN2, shows the refracted angle θ3 ≈ 16˚, nearly midway between water (25˚) and air(6˚). (b) Clamp and gas paths, schematic. (c) Clamps and instrument for clamp-on gas flow measurement [1, 12]. (d)Application on steam.© 2001 Panametrics.
2002 PROCEEDINGS PAGE 59AMERICAN SCHOOL OF GAS MEASUREMENT TECHNOLOGY
FIGURE 4. (a) Example of a solid PanAdapta® precision plug for liquids. This plug is not to be removed when the line ispressurized as it is a permanent part of the pressure boundary. Its outer surface is prepared to receive a removabletransducer. Frequency range: 0.5 to 5 MHz. (b) Similar to preceding case except the plug for gases consists of a bundleof thin waveguides welded within a sleeve. The bundle plug can be as short as one inch or as long as several feet (25.4mm to ~1 m). This sleeved sealed waveguide construction allows the removable piezoelectric transducer assembly to beseparated from the buffer bundle. (c) Schematics show planes of measurement in end view, and the crossed paths in athree-dimensional SolidWorks rendition. (d) Photos of a spoolpiece manufactured by RMG and corresponding to theschematics in (c). (e) Example of a T11 transducer. It is Ti-housed, internally quarter-wave matched, and twelve of themare used in (d). (f) Plugged version of (c). (g) Liquid version of the concept shown in (f).
PAGE 60 2002 PROCEEDINGSAMERICAN SCHOOL OF GAS MEASUREMENT TECHNOLOGY
Schematic
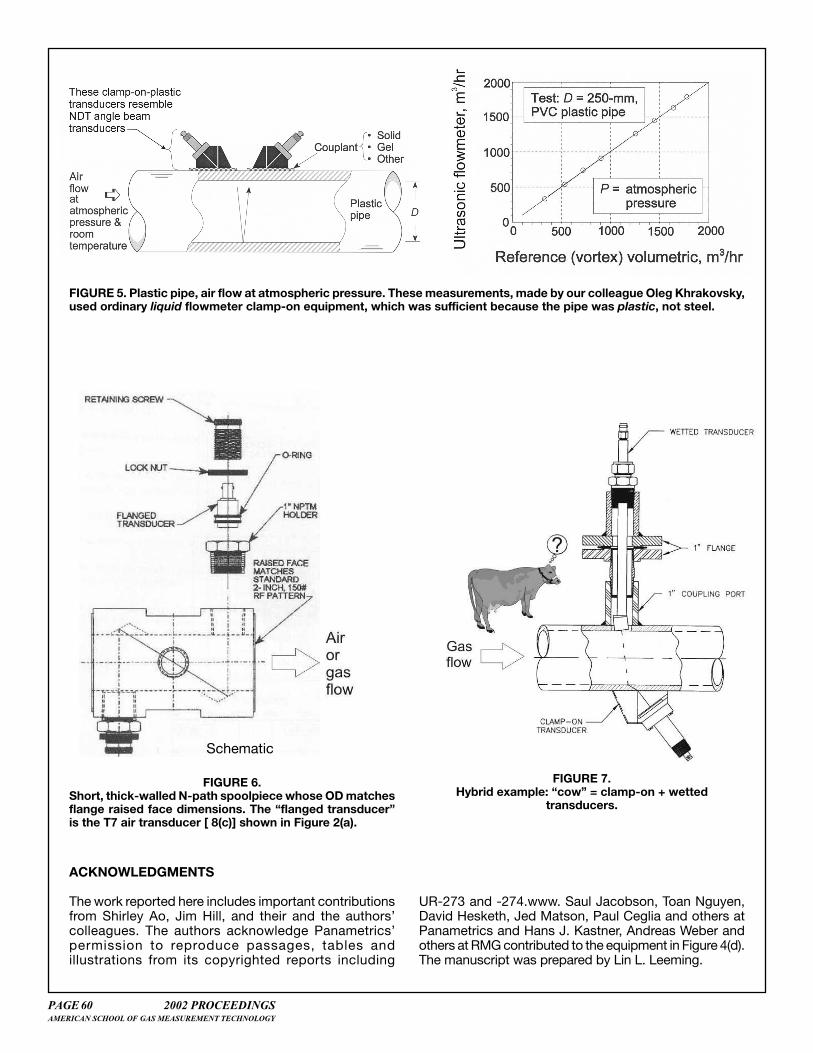
FIGURE 5. Plastic pipe, air flow at atmospheric pressure. These measurements, made by our colleague Oleg Khrakovsky,used ordinary liquid flowmeter clamp-on equipment, which was sufficient because the pipe was plastic, not steel.
FIGURE 6.Short, thick-walled N-path spoolpiece whose OD matchesflange raised face dimensions. The “flanged transducer”is the T7 air transducer [ 8(c)] shown in Figure 2(a).
FIGURE 7.Hybrid example: “cow” = clamp-on + wetted
transducers.
ACKNOWLEDGMENTS
The work reported here includes important contributionsfrom Shirley Ao, Jim Hill, and their and the authors’colleagues. The authors acknowledge Panametrics’permission to reproduce passages, tables andillustrations from its copyrighted reports including
UR-273 and -274.www. Saul Jacobson, Toan Nguyen,David Hesketh, Jed Matson, Paul Ceglia and others atPanametrics and Hans J. Kastner, Andreas Weber andothers at RMG contributed to the equipment in Figure 4(d).The manuscript was prepared by Lin L. Leeming.

2002 PROCEEDINGS PAGE 61AMERICAN SCHOOL OF GAS MEASUREMENT TECHNOLOGY
BIBLIOGRAPHY AND REFERENCES
1. Ao, X., Matson, J., Kucmas, P., Khrakovsky, O., andLi, X. S., Ultrasonic Clamp-On Flow Measurementof Natural Gas, Steam and Compressed Air,Proceedings of the 5th ISFFM (5th InternationalSymposium, Fluid Flow Measurement) (April 7-10,2002).
2. Brown, A. E., Ultrasonic Flowmeters, in Spitzer, D.W. (Editor): Flow Measurement, pp. 415-442, ISA(1991); (b) Brown, A., and Lynnworth, L., UltrasonicFlowmeters, in Spitzer, D. W. (Editor): FlowMeasurement - Practical Guides for MeasurementControl, 2nd Edition, Ch. 20, pp. 517-575, ISA (2001).
3. Hill, J., Weber, A., and Koyama, T., Qualification ofUltrasonic Flowmeters for Custody Transfer ofNatural Gas Using Atmospheric Air CalibrationFacilities, submitted for Proc. 20th North Sea FlowMeasurement Workshop, St. Andrews, Scotland(Oct. 22-25, 2002).
4. Jacobson, S. A., Flow Measurement SystemIncluding Ultrasonic Transducers, U. S. Patent5,460,047 (October 24, 1995).
5. Johari, H., and Durgin, W. W., Direct Measurementof Circulation Using Ultrasound, Experiments inFluids 25 pp. 445-454 (September 1998). (Later andearlier related references are in [15].)
6. Liu, Y., Lynnworth, L. C. and Zimmerman, M. A.,Buffer Waveguides for Flow Measurement in HotFluids, Ultrasonics, 36 (1-5) pp. 305-315 (February1998); (b) Liu, Y., and Lynnworth, L.C., U. S. Patent5,962,790 (October 5, 1999); (c) CIP (continuation-in-part) U. S. Patent 6,343,511 (February 5, 2002).
7. Lynnworth, L. C., Ultrasonic Flowmeters, Chap. 5,in Physical Acoustics - Principles and Methods,Mason, W. P., and Thurston, R. N., (Eds.), 14 pp.407-525, Academic Press (1979); (b) UltrasonicMeasurements for Process Control Theory,Techniques, Applications, Academic Press (1989);(c) with Magori, V., Industrial Process Control Sensorsand Systems, Chapter 4, pp. 275-470 in: Papadakis,E. P., (Guest Editor), Ultrasonic Instruments andDevices: Reference for Modern Instrumentation,Techniques, and Technology, 23 in the series PhysicalAcoustics, Academic Press (1999).
8. Lynnworth, L. C., Patch, D. R. and Mellish, W. C.,Impedance-Matched Metallurgically SealedTransducers, IEEE Transactions on Sonics andUltrasonics, SU-31 (2) pp. 101-104 (March 1984);(b) Lynnworth, L. C., Fowler, K. A. and Patch, D. R.,Sealed, Matched Piezoelectric Transducer, U. S.Patent 4,297,607 (Oct. 27, 1981); (c) LCL, UltrasonicTransducer System with Crosstalk Isolation, U. S.Patent 5,515,733 (May 14, 1996).
9. Scelzo, M., A Clamp-on Ultrasonic Flowmeter forGases, Flow Control 7 (9) pp. 34-37 (Sept. 2001).
10. Smalling, J. W., Braswell, L. D., Lynnworth, L. C. andWallace, D. R., Flare Gas Ultrasonic Flow Meter,Proceedings 39th Texas A&M Annual Symposium onInstrumentation for the Process Industries, pp. 27-38 (January 17-20, 1984); (b) Smalling, J. W.,Braswell, L. D. and Lynnworth, L. C., Apparatus andMethods for Measuring Fluid Flow Parameters, U.S. Patent 4,596,133 (June 24, 1986); (c) U. S. Patent4,754,650 (July 5, 1988); (d) U. S. Patent 4,856,321(August 15, 1989).
11. Suzuki, H., Nakabori, H., and Yamamoto, M.,“Ultrasonic Method of Flow Measurement in LargeConduits and Open Channels,” p. 11538 in C. G.Clayton (Ed.), Modern Developments in FlowMeasurement, Peregrinus, London (1972).
12. Ting, V. C. and Ao, X., Evaluation of Clamp-OnUltrasonic Gas Flowmeters for Natural GasApplications, Proc. 20th North Sea FlowMeasurement Workshop, St. Andrews, Scotland(Oct. 22-25, 2002).
13. Yamamoto, M. and Amano, A., Ultrasonic FlowQuantity Measuring System, U. S. Patent 3,555,899(Jan. 19, 1971).
14. Yamamoto, M., and Ito, K., Ultrasonic FlowmeterSystem, U. S. Patent 3,237,453 (March 1, 1966).
15. Walters, J., Smalling, J. W., Ao, S., Hill, J. andLynnworth, L. C., Transit-time Ultrasonic Flowmetersfor Gases, presented at and published in the Proc.41st Annual CGA (Canadian Gas Association) GasMeasurement School, Grand Okanagan, KelownaBC, Canada (June 4-6, 2002). See also,UR-274.www, a Panametrics website version of thispaper.
©2002 Panametrics. All rights reserved. Version May 2, 2002