Fundamentals of Real-Time Spectrum Analysis Tektronix DFT FFT Fourier
52
Funda m entals of R eal- T im e Spectrum A nalysis Prim er
-
Upload
mastelecentro -
Category
Documents
-
view
248 -
download
0
Transcript of Fundamentals of Real-Time Spectrum Analysis Tektronix DFT FFT Fourier

7/27/2019 Fundamentals of Real-Time Spectrum Analysis Tektronix DFT FFT Fourier
http://slidepdf.com/reader/full/fundamentals-of-real-time-spectrum-analysis-tektronix-dft-fft-fourier 1/52
Fundamentals of R eal-T ime
Spectrum Analysis
Primer

7/27/2019 Fundamentals of Real-Time Spectrum Analysis Tektronix DFT FFT Fourier
http://slidepdf.com/reader/full/fundamentals-of-real-time-spectrum-analysis-tektronix-dft-fft-fourier 2/52
22 w w w .t e k t r on i x.c om /r t s a
Table of Contents
Chapter 1: Introduction and Overview . . . . . . . . 3-8
The Evolution of RF Signals . . . . . . . . . . . . . . . . . . . . . . .3
Modern RF Measurement Challenges . . . . . . . . . . . . . . .4
A Brief Survey of Instrument Architectures . . . . . . . . . . .5 The Swept Spectrum Analyzer . . . . . . . . . . . . . . . . .5
Vector Signal Analyzers . . . . . . . . . . . . . . . . . . . . . .7
Real-Time Spectrum Analyzers . . . . . . . . . . . . . . . .7
Chapter 2: How Does the Real-Time Spectrum
Analyzer Work? . . . . . . . . . . . . . . . . . . . . . . . . . 9-37
RF/IF Signal Conditioning . . . . . . . . . . . . . . . . . . . . . . . .9
Input Switching and Routing Section . . . . . . . . . . .10
RF and Microwave Sections . . . . . . . . . . . . . . . . . .10
Frequency Conversion/IF Section . . . . . . . . . . . . . .11
Digital Signal Processing (DSP) Concepts . . . . . . . . . . .12
Digital Signal Processing Path in Real-TimeSpectrum Analyzers . . . . . . . . . . . . . . . . . . . . . . . .12
IF Digitizer . . . . . . . . . . . . . . . . . . . . . . . . . . . . . . .13
Corrections . . . . . . . . . . . . . . . . . . . . . . . . . . . . . .13
Digital Downconverter (DDC) . . . . . . . . . . . . . . . . .14
IQ Baseband Signals . . . . . . . . . . . . . . . . . . . . . . .14
Decimation . . . . . . . . . . . . . . . . . . . . . . . . . . . . . . .15
Decimation Filtering . . . . . . . . . . . . . . . . . . . . . . . .15
Transforming Time Domain Waveforms
to the Frequency Domain . . . . . . . . . . . . . . . . . . . . . . .16
Real-Time Spectrum Analysis . . . . . . . . . . . . . . . . .17
Discovering and Capturing Transient Events . . . . . .17
Relating RTSA to Swept Spectrum Analyzer . . . . .18RBW on the Real-Time Spectrum Analyzer . . . . . .18
Windowing . . . . . . . . . . . . . . . . . . . . . . . . . . . . . . .19
Discrete Fourier Transforms (DFT) in the
Real-Time Spectrum Analyzer . . . . . . . . . . . . . . . .20
Digital Filtering . . . . . . . . . . . . . . . . . . . . . . . . . . . . . . . .22
Finite Impulse Response (FIR) Filters . . . . . . . . . . .22
Frequency Response vs. Impulse Response . . . . .22
Numerical Convolution . . . . . . . . . . . . . . . . . . . . . .23
DPX ™ Technology: a Revolutionary Tool
for Signal Discovery . . . . . . . . . . . . . . . . . . . . . . . . . . . .25
Digital Phosphor Display . . . . . . . . . . . . . . . . . . . .26
The DPX Display Engine . . . . . . . . . . . . . . . . . . . . .27
The DPX Transform Engine . . . . . . . . . . . . . . . . . .30
Timing and Triggers . . . . . . . . . . . . . . . . . . . . . . . . . . . .30
Real-Time Triggering and Acquisition . . . . . . . . . . .31
Triggering in Systems with Digital Acquisition . . . . .32
Trigger Modes and Features . . . . . . . . . . . . . . . . . .33
RTSA Trigger Sources . . . . . . . . . . . . . . . . . . . . . .33
Constructing a Frequency Mask . . . . . . . . . . . . . . .34
Demodulation . . . . . . . . . . . . . . . . . . . . . . . . . . . . . . . .35
Amplitude, Frequency and Phase Modulation . . . .35
Digital Modulation . . . . . . . . . . . . . . . . . . . . . . . . . .36
Power Measurements and Statistics . . . . . . . . . . .37
Chapter 3: Real-Time Spectrum AnalyzerMeasurements . . . . . . . . . . . . . . . . . . . . . . . . . . . 38-46
Real-Time Spectrum Analyzer Measurement Types . . . .38
Frequency Domain Measurements . . . . . . . . . . . . .38
DPX Spectrum . . . . . . . . . . . . . . . . . . . . . . . . . . . .39
Time Domain Measurements . . . . . . . . . . . . . . . . .39
Modulation Domain Measurements . . . . . . . . . . . .42
Code Domain Measurements . . . . . . . . . . . . . . . . .44
Statistical Domain Measurements . . . . . . . . . . . . .45
Chapter 4: Applications Using the RTSA . . . . . . 47-49
Pulse Measurements . . . . . . . . . . . . . . . . . . . . . . . . . . .47
Radar . . . . . . . . . . . . . . . . . . . . . . . . . . . . . . . . . . .47
RFID . . . . . . . . . . . . . . . . . . . . . . . . . . . . . . . . . . . .47
Spectrum Management/Surveillance . . . . . . . . . . . . . . .48
Radio Communications . . . . . . . . . . . . . . . . . . . . . . . . .48
Power Amplifier Testing . . . . . . . . . . . . . . . . . . . . . . . . .49
Microphonics and Phase-Hits Analysis . . . . . . . . . . . . .49
Chapter 5: Terminology . . . . . . . . . . . . . . . . . . . . 50-51
Glossary . . . . . . . . . . . . . . . . . . . . . . . . . . . . . . . . . . . .50
Acronym Reference . . . . . . . . . . . . . . . . . . . . . . . . . . . .51
Fundamentals of Real-Time Spectrum AnalysisP rimer
7/27/2019 Fundamentals of Real-Time Spectrum Analysis Tektronix DFT FFT Fourier
http://slidepdf.com/reader/full/fundamentals-of-real-time-spectrum-analysis-tektronix-dft-fft-fourier 3/52
Fundamentals of R eal-Time Spectrum AnalysisPrimer
3ww w.te ktronix.co m/rtsa
C hapter 1: Introduction and O verview
The Evo lution o f RF S ig na ls
Engineers and scientists have been looking for innovative
uses for R F technology ever since the 1860s, when James
C lerk M axwell mathematically predicted the existence of electromagnetic waves capable of transporting energy
across empty space. Following H einrich Hertz’s physical
demonstration of “radio waves” in 1886, N ikola Tesla,
G uglielmo M arconi, and others pioneered ways of
manipulating these waves to enable long distance
communications. A t the turn of the century, the radio
had become the first practical application of RF signals.
O ver the next three decades, several research projects
were launched to investigate methods of transmitting
and receiving signals to detect and locate objects at great
distances. By the onset of World War II, radio detection
and ranging (also known as radar) had become anotherprevalent RF application.
Due in large part to sustained growth in the military and
communications sectors, technological innovation in R F
accelerated steadily throughout the remainder of the 20th
century and continues to do so today. To resist interference,
avoid detection, and improve capacity, modern radar
systems and commercial communications networks have
become extremely complex, and both typically employ
sophisticated combinations of RF techniques such as
complex and adaptive modulation, bursting and frequency
hopping. Designing these types of advanced R F equipment
and successfully integrating them into working systems are
extremely complicated tasks.
At the same time, the increasingly widespread success
of cellular technology and wireless data networks
combined with the advancing state of semiconductor
technology and packaging has caused the cost of basic
R F components to drop significantly over time. This has
enabled manufacturers outside of the traditional military
and communications realms to embed relatively simple
R F devices into all sorts of commodity products. R F
transmitters have become so pervasive that they can
be found in almost any imaginable location: consumer
electronics in homes, medical devices in hospitals, industrial
control systems in factories, and even tracking devices
implanted underneath the skin of livestock, pets, and people.
As RF signals have become ubiquitous in the modern world,
so too have problems with interference between the devices
that generate them. P roducts such as mobile phones that
operate in licensed spectrum must be designed not to
transmit R F power into adjacent frequency channels and
cause interference. T his is especially challenging for complex
multi-standard devices that switch between different modes
of transmission and maintain simultaneous links to different
network elements. Devices that operate in unlicensed
frequency bands must be designed to function properly in
the presence of interfering signals, and are legally required
to transmit in short bursts at low power levels. T hese newdigital R F technologies that involve the combination of
computers and R F include wireless LANs, cellular phones,
digital TV, R FID and others. These, combined with new
advances in Software Defined R adio (SDR ) and Cognitive
Radio (C R ) provide a new path forward and will fundamentally
change spectrum allocation methodologies resulting in
increased efficiency in the way that the RF spectrum,
one of the scarcest commodities, is utilized.
To overcome these evolving challenges, it is crucial for
today’s engineers and scientists to be able to reliably
detect and characterize RF signals that change over time,something not easily done with traditional measurement
tools. To address these problems, Tektronix has designed
the Real-T ime Spectrum A nalyzer (R TSA ), an instrument
that can discover elusive effects in R F signals, trigger on
those effects, seamlessly capture them into memory, and
analyze them in the frequency, time, modulation, statistical
and code domains.
This document describes how the R TSA works and provides
a basic understanding of how it can be used to solve many
measurement problems associated with modern RF signals.

7/27/2019 Fundamentals of Real-Time Spectrum Analysis Tektronix DFT FFT Fourier
http://slidepdf.com/reader/full/fundamentals-of-real-time-spectrum-analysis-tektronix-dft-fft-fourier 4/52
4 ww w.te ktronix.co m/rtsa
Modern RF Measurement Challenges
Given the challenge of characterizing the behavior of today’s
RF devices, it is necessary to understand how frequency,
amplitude, and modulation parameters behave over short
and long intervals of time. Traditional tools like Swept
Spectrum Analyzers (SA) and Vector Signal Analyzers (VSA)provide snapshots of the signal in the frequency domain
or the modulation domain. This is often not enough
information to confidently describe the dynamic nature
of modern RF signals.
Consider the following challenging measurement tasks:
Discovery of rare, short duration events
Seeing weak signals masked by stronger ones
Observing signals masked by noise
Finding and analyzing transient and dynamic signals
Capturing burst transmissions, glitches,
switching transients
Characterizing PLL settling times, frequency drift,
microphonics
Capturing spread-spectrum and frequency-hopping signals
Monitoring spectrum usage, detecting rogue transmissions
Testing and diagnosing transient EMI effects
Characterizing time-variant modulation schemes
Isolating software and hardware interactions
Each measurement involves RF signals that change over
time, often unpredictably. To effectively characterize these
signals, engineers need a tool that can discover elusive
events, effectively trigger on those events and isolate them
into memory so that the signal behavior can be analyzed
in the frequency, time, modulation, statistical, and
code domains.
Fundamentals of Real-Time Spectrum AnalysisPrimer
7/27/2019 Fundamentals of Real-Time Spectrum Analysis Tektronix DFT FFT Fourier
http://slidepdf.com/reader/full/fundamentals-of-real-time-spectrum-analysis-tektronix-dft-fft-fourier 5/52
A Brief Survey of Instrument Architectures
To learn how the RTSA works and understand the value of
the measurements it provides, it is helpful to first examine
two other types of traditional RF signal analyzers: the
Swept Spectrum Analyzers (SA) and the Vector Signal
Analyzer (VSA).
The Swept Spectrum Analyzer
The swept-tuned, superheterodyne spectrum analyzer is
the traditional architecture that first enabled engineers to
make frequency domain measurements several decades
ago. O riginally built with purely analog components, the SA
has since evolved along with the applications that it serves.
C urrent generation SAs include digital elements such as
ADC s, D SP s, and microprocessors. However, the basic
swept approach remains largely the same and is best suited
for observing controlled, static signals. T he SA mak es
power vs. frequency measurements by downconverting the
signal of interest and sweeping it through the passband of a
resolution bandwidth (R BW) filter. T he RBW filter is followed
by a detector that calculates the amplitude at each frequency
point in the selected span. While this method can provide
high dynamic range, its disadvantage is that it can only
calculate the amplitude data for one frequency point at a
time. This approach is based on the assumption that the
analyzer can complete at least one sweep without there
being significant changes to the signal being measured.
C onsequently, measurements are only valid for relatively
stable, unchanging input signals. I f there are rapid changes
in the signal, it is statistically probable that some changes
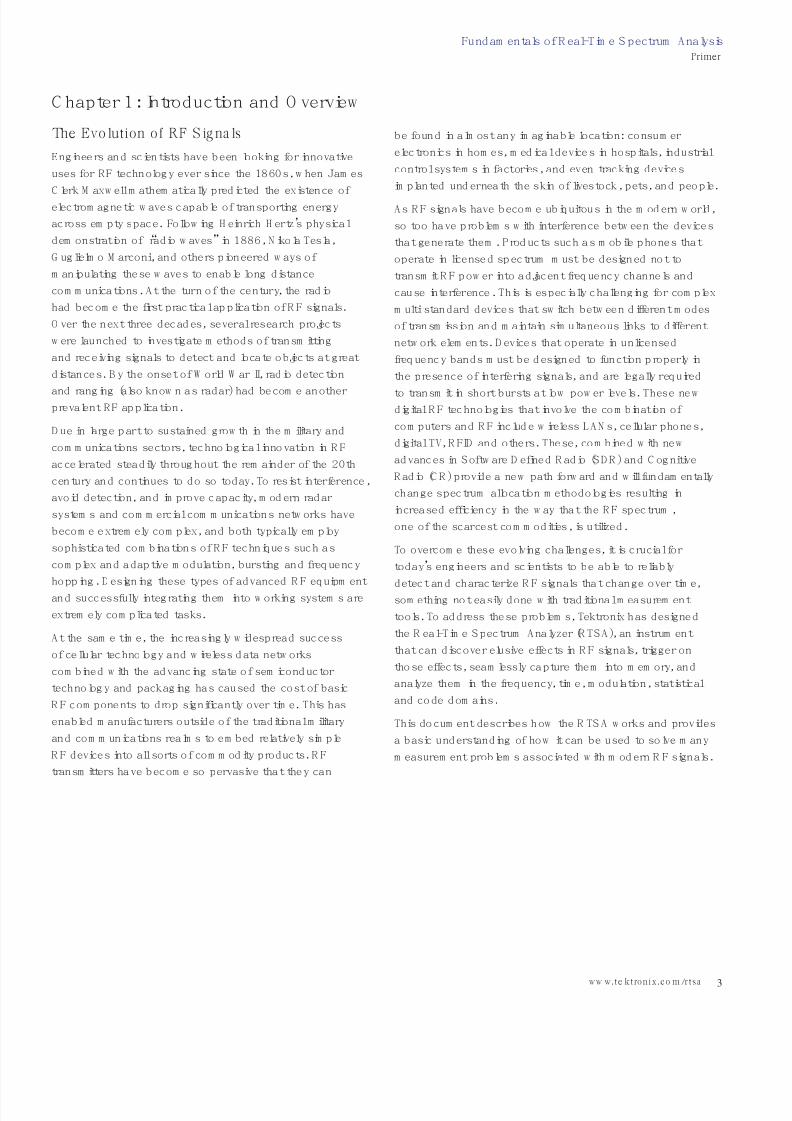
will be missed. As shown in Figure 1-1, the SA is looking
at frequency segment Fa while a momentary spectral event
occurs at Fb (diagram on left). By the time the sweep arrives
at segment Fb, the event has vanished and is not detected
(diagram on right). T he SA architecture does not provide a
reliable way to discover the existence of this kind of transient
signal, thus contributing to the long time and effort required to
troubleshoot many modern R F signals. In addition to missing
momentary signals, the spectrum of impulse signals such
as those used in modern communications and radar may be
misrepresented as well. S A architectures cannot represent
the occupied spectrum of an impulse without repetitive
sweeps. O ne also needs to pay special attention to sweep
rate and resolution bandwidth.
Fundamentals of R eal-Time Spectrum AnalysisPrimer
5ww w.te ktronix.co m/rtsa
Fa Fb Fa Fb
Figure 1-1. The Swept Spectrum Analyzer steps across a series of frequency segments, often missing important transient events that occur outside the current sweep band
highlighted in tan segment Fb on the right.

7/27/2019 Fundamentals of Real-Time Spectrum Analysis Tektronix DFT FFT Fourier
http://slidepdf.com/reader/full/fundamentals-of-real-time-spectrum-analysis-tektronix-dft-fft-fourier 6/52
6 w w w .t e k t r on i x.c om /r t s a
Figures 1-2 a, b, c. Simplified Block Diagram of Swept Spectrum Analyzer (a), Vector Signal Analyzer (b), and Real-Time Spectrum Analyzer (c).
a) Swept Tuned Spectrum Analyzer (SA)
b) Vector Signal Analyzer (VSA)
c) Real-Time Spectrum Analyzer (RSA6100 Series + Option 110)
Attenuator
Attenuator
Low-Pass
Low-Pass
RF Downconverter Real-Time Digital
Real-Time Bandwidth Display Processing
Post Capture
Live Signal
Processing
IF Filter
IF Filter Capture
Ext
DPX
Free
Run
Real-Time
IQ out
(option 05)
r
i
Displays
X-Y
X-Y
Digital
Filter
Downconvert
& Filter
P X-Y
Display
Acquisition Bandwidth Post Capture Processing
M o d e r nF F T -B a s e d A n a l y z e r s
Band-Pass
Input
YIGPre-Selector
Sweep
Swept Tuned
RF Downconverter
Resolution
Bandwidth
Filter
Envelope
Detector
(SLVA)
Video
Bandwidth
Filter
Display
Y
X
Local
Oscillator
Local
Oscillator
Local100 or 300 Msps
Acquisition Bandwidth
110 MHz
Oscillator
Generator
RF Downconverter
ADC
ADC Memory
Memory
Amp./Phase
Corrections
DDC/
Decimation
Micro-
Processor
M i c r o -
P r o c e s s o r
Display
trigger
Analysis
Real Time Engine
Input
Attenuator
Low-Pass
Band-Pass
Input
Fundamentals of Real-Time Spectrum AnalysisP rimer
7/27/2019 Fundamentals of Real-Time Spectrum Analysis Tektronix DFT FFT Fourier
http://slidepdf.com/reader/full/fundamentals-of-real-time-spectrum-analysis-tektronix-dft-fft-fourier 7/52
Fundamentals of R eal-Time Spectrum AnalysisPrimer
7ww w.te ktronix.co m/rtsa
Figure 1-2a depicts a typical modern SA architecture. Even
though modern S A have replaced analog functionality with
digital signal processing (DSP ), the fundamental architecture
and its limitations remain.
Vector Signal Analyzers
Analyzing signals carrying digital modulation requires vector
measurements that provide both magnitude and phase
information. A simplified VSA block diagram is shown in
Figure 1-2b.
A VS A digitizes all of the RF power within the passband
of the instrument and puts the digitized waveform into
memory. The waveform in memory contains both the
magnitude and phase information which can be used by
DSP for demodulation, measurements or display processing.
Within the VSA, an ADC digitizes the wideband IF signal, and
the downconversion, filtering, and detection are performed
numerically. Transformation from time domain to frequencydomain is done using FFT algorithms. The VSA measures
modulation parameters such as FM deviation, C ode Domain
Power, and Error Vector M agnitude (EVM and constellation
diagrams). It also provides other displays such as channel
power, power versus time, and spectrograms.
While the VSA has added the ability to store waveforms
in memory, it is limited in its ability to analyze transient
events. In the typical VS A free run mode, signals that
are acquired must be stored in memory before being
processed. The serial nature of this batch processing
means that the instrument is effectively blind to events
that occur between acquisitions. Single or infrequent
events cannot be discovered reliably. Triggering on these
types of rare events can be used to isolate these events
in memory. Unfortunately VSAs have limited triggering
capabilities. External triggering requires prior k nowledge
of the event in question which may not be practical. IF
level triggering requires a measurable change in the total
IF power and cannot isolate weak signals in the presence
of larger ones or when the signals change in frequency
but not amplitude. Both cases occur frequently in today’s
dynamic R F environment.
Real-Time Spectrum Analyzers
The term “ real-time” is derived from early work on digital
simulations of physical systems. A digital system simulation
is said to operate in real-time if its operating speed matches
that of the real system which it is simulating.
To analyze signals in real-time means that the analysisoperations must be performed fast enough to accurately
process all signal components in the frequency band of
interest. This definition implies that we must:
Sample the input signal fast enough to satisfy Nyquist
criteria. This means that the sampling frequency must
exceed twice the bandwidth of interest.
Perform all computations continuously and fast enough
such that the output of the analysis keeps up with the
changes in the input signal.
Discover, Trigger, Capture, Analyze
The Real-Time Spectrum A nalyzer (R TSA ) architecture is
designed to overcome the measurement limitations of the
SA and VSA to better address the challenges associated
with transient and dynamic R F signals as described in the
previous sections. The RTSA performs signal analysis using
real-time digital signal processing (DSP ) that is done prior
to memory storage as opposed to the post-acquisition
processing that is common in the VSA architecture. R eal
time processing allows the user to discover events that are
invisible to other architectures and to trigger on those events
allowing their selective capture into memory. T he data in
memory can then be extensively analyzed in multiple
domains using batch processing. T he real-time D SP
engine is also used to perform signal conditioning,
calibration and certain types of analysis.

7/27/2019 Fundamentals of Real-Time Spectrum Analysis Tektronix DFT FFT Fourier
http://slidepdf.com/reader/full/fundamentals-of-real-time-spectrum-analysis-tektronix-dft-fft-fourier 8/52
The heart of the RTSA is a real-time processing block as
shown in Figure 1-2c (on page 6). Similar to the VSA, a wide
capture bandwidth is digitized. U nlike the VS A, the real-time
engine operates fast enough to process every sample
without gaps as shown in Figure 1-3. Amplitude and phase
corrections that compensate for analog IF and R F responses
can be continuously applied. Not only can the data stored in
memory be fully corrected, but this enables all subsequentreal-time processing to operate on corrected data as well.
The real-time engine enables the following features that
address the needs of modern R F analysis:
R eal-time correction for imperfections in the analog
signal path
Triggering in the frequency domain with Frequency
M ask Trigger (FM T )
Triggering on user specified bandwidths with filtered
power trigger
DPX™ Live R F display allows the discovery of events
missed by swept SAs and VSAs
R eal-time demodulation allowing the user to “listen” to
a particular signal within a busy band
Digital IQ streaming of digitized data allows the uninterrupted
output of the signal for external storage and processing
The real-time engine not only enables signal discovery and
trigger, but it also performs many of the repetitive signal
processing tasks, freeing up valuable software-based
resources. Lik e the VSA, the RTSA offers post-acquisition
analysis using DS P. It can perform measurements in
multiple time-correlated domains that can be displayed
simultaneously.
Fundamentals of Real-Time Spectrum AnalysisPrimer
8 ww w.te ktronix.co m/rtsa
VSA
RTSA
Frame Frame Frame Frame
Frame
Real-Time
InputNot Real-Time Missed
Frame Frame Frame
Frame Frame Frame Frame
Frequency
Domain
FFT FFT FFT
Time Time Sampled
FFT
FFT FFT
Processing Time < Acquisition time!
Figure 1-3. VS A processing vs. R eal-T ime S pectrum Analyzers real-time engine processing.
7/27/2019 Fundamentals of Real-Time Spectrum Analysis Tektronix DFT FFT Fourier
http://slidepdf.com/reader/full/fundamentals-of-real-time-spectrum-analysis-tektronix-dft-fft-fourier 9/52
C hapter 2: How Does the Real-T ime
Spectrum Analyzer Work?
This chapter contains several architectural diagrams of the
main acquisition and analysis blocks of the Tektronix R eal-
T ime Spectrum Analyzer (R TSA ). Some ancillary functions
have been omitted to clarify the discussion.
M odern RTSA s can acquire a passband, or span, anywherewithin the input frequency range of the analyzer. At the heart
of this capability is an RF downconverter followed by a wide-
band intermediate frequency (IF) section. An AD C digitizes
the IF signal and the system carries out all further steps
digitally. DSP algorithms perform all signal conditioning
and analysis functions.
Several key characteristics distinguish a successful real-time
architecture:
RF signal conditioning that provides a wide-bandwidth IF
path and high dynamic range.
An ADC system capable of digitizing the entire real-time
BW with sufficient fidelity and dynamic range to support
the desired measurements.
A real-time digital signal processing (DSP ) engine enables
processing with no gaps.
Sufficient capture memory and DSP power to enable
continuous real-time acquisition over the desired time
measurement period.
An integrated signal analysis system that provides multiple
analysis views of the signal under test, all correlated
in time.
RF/IF S igna l Co nd itioning
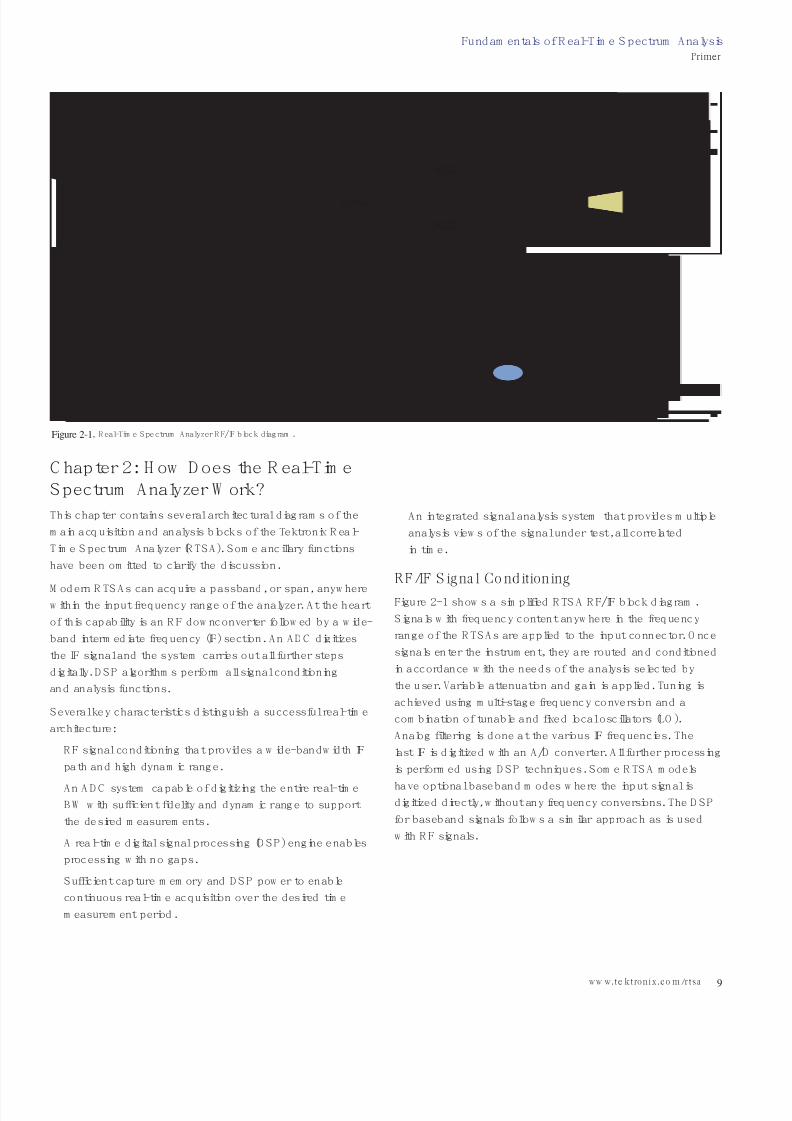
Figure 2-1 shows a simplified R TSA R F/IF block diagram.
Signals with frequency content anywhere in the frequency
range of the RT SAs are applied to the input connector. O nce
signals enter the instrument, they are routed and conditioned
in accordance with the needs of the analysis selected by
the user. Variable attenuation and gain is applied. Tuning is
achieved using multi-stage frequency conversion and a
combination of tunable and fixed local oscillators (LO ).
Analog filtering is done at the various IF frequencies. The
last IF is digitized with an A /D converter. A ll further processing
is performed using DS P techniques. S ome R TSA models
have optional baseband modes where the input signal isdigitized directly, without any frequency conversions. T he DSP
for baseband signals follows a similar approach as is used
with R F signals.
Fundamentals of R eal-Time Spectrum AnalysisPrimer
9ww w.te ktronix.co m/rtsa
IInput
QInput
LP Filter
RFInput
Internal Alignment
Source
Digitized
Baseband
LF Step Attenuator
Mixer
DigitizedIF
RF Step Attenuator
Image RejectFilters
Input Switching
LF or IQ section (if present)
Frequency Conversion/IF Section
LF/RF
Switch
Cal
Switch
ADC
Clock
Mixer Final IF
1st LO
1st IFFinal LO
Real-TimeBW ADC
Clock
ADC
LP Filter
ADC
ADC
RF/uW Section
Figure 2-1. Real-Time Spectrum A nalyzer RF/IF block diagram.

7/27/2019 Fundamentals of Real-Time Spectrum Analysis Tektronix DFT FFT Fourier
http://slidepdf.com/reader/full/fundamentals-of-real-time-spectrum-analysis-tektronix-dft-fft-fourier 10/52
Input Switching and Routing Section
The input switching and routing section distributes the input
waveforms to the various signal paths within the instrument.
Some R TSA models include a separate DC coupled base-
band path for increased dynamic range and accuracy when
analyzing low frequency signals as well as DC coupled IQbaseband paths. R TSAs also include internal alignment
sources. T hese alignment sources, which produce signals
with properties that are specifically tailored for the RTSA
(P RBS, calibrated sinusoids, modulation references, etc.)
are used in self-alignment procedures that correct for
temperature variations in system parameters such as:
G ain
Amplitude flatness across the acquisition bandwidth
Phase linearity across the acquisition bandwidth
T ime alignment
Trigger delay calibration
The self-alignment processes, when combined with calibrations
using external equipment performed at the factory or the
service center, are at the heart of all critical measurement
specifications of RTSA s.
RF and Microwave Sections
The RF/M icrowave section contains the broadband circuitry that
conditions the input signals so that they have the proper level
and frequency content for optimal downstream processing.
Step Attenuator
The step attenuator is a device composed of resistive
attenuator pads and RF/µW switches that decreases the
level of broadband signals by a programmed amount.
The step attenuator performs two functions:
1. It reduces the level of RF and microwave signals at the
input to a level that is optimum for processing. T he step
attenuator also protects the input from damage due to
very high level signals by absorbing excessive R F power.
2. It presents a broadband impedance match over the entire
frequency range of the instrument. T his impedance match
is crucial in maintaining accuracy in measuring RF signals.
For this reason, most instrument specifications are stated
for the condition of 10 dB or more input attenuation.
Step attenuators used by RTSAs vary by model in their
design. They typically can be programmed to attenuate
from 0 to greater than 50 dB in steps of 5 or 10 dB.
Image Reject Filter
R TSAs provide image-free frequency conversion from the R F
and microwave signals at their input to the final IF. This is
accomplished by placing a variety of filters in front of the first
mixer. T he various RT SA models use multi-stage mixing
schemes incorporating broadband filters that allow image-
free conversion of the entire acquisition bandwidth with
repeatable, specified amplitude flatness and phase linearity.
Preamplifier
Some R TSA models include options for a selectable
preamplifier that adds gain to the signal path prior to the
image reject filter. T his option improves the noise figure of the
R TSAs and is useful for analyzing very weak signals. A dding
gain at the input, of course, limits the largest signal that can
be analyzed. Switching this amplifier out of the signal path
returns the analyzer’s range to normal.
Fundamentals of Real-Time Spectrum AnalysisPrimer
10 ww w.te ktronix.co m/rtsa
7/27/2019 Fundamentals of Real-Time Spectrum Analysis Tektronix DFT FFT Fourier
http://slidepdf.com/reader/full/fundamentals-of-real-time-spectrum-analysis-tektronix-dft-fft-fourier 11/52
Frequency Conversion/IF Section
All R TSA models can analyze a broad band of frequencies
centered anywhere in the analyzer’s frequency range. T his is
done by converting the band of interest to a fixed IF where it
is filtered, amplified and scaled. This IF signal is then digitized.
R eal-time and batch processing are then used to perform
multi-domain analysis on the signals of interest.
Multi-Stage Frequency Conversion
The goal of the frequency conversion section is to faithfully
convert signals in the desired band of frequencies to an IF
suitable for analog-to-digital conversion. Tuning is accom-
plished by selecting the frequencies of local oscillators (LO )
in a multiple conversion superheterodyne architecture as
shown in Figure 2-1 (on page 9). Each frequency conversion
stage contains a mixer (analog multiplier) followed by IF
filtering and amplification. T he choices of IF frequencies, filter
shapes, gains, and levels differ depending on RTSA model
and indeed are changed within each model as a function
of instrument settings in order to optimize performance in
several areas as listed below:
Spurious responses due to mixer and filter imperfections
Dynamic range (smallest and largest signals that can be
viewed simultaneously without errors)
Amplitude flatness across the real-time bandwidth
Phase linearity across the real-time bandwidth
Delay match between the signal and trigger paths
Internal Alignment Sources
The performance achieved in R TSAs for some characteristics
mentioned in the previous bulleted list far exceeds what is
practical with analog components. Filter responses, delays
and gains vary over temperature and can be different for
individual instruments. R TSAs performance is achieved by
actually measuring gains, filter shapes and delays and using
DSP to compensate for the measured performance. T he
frequency response and gain variations of the wideband
RF components is measured at the factory with calibrated
equipment, traceable to N ational M etrology Institutes such
as NIST, N PL, PTB. T his equipment is also used to calibrate
the internal alignment sources which in turn provide signals
that adjust for the signal path conditions at the time and
place where the RTSA is used. R TSA s use two kinds of
internal signals:
A highly accurate, temperature stable sinusoidal signal is
used to set the signal path gain at a reference frequency,
typically 100 M Hz. This signal is the internal R F level
reference. It sets the accuracy in measuring RF power
at the center of the acquisition bandwidth.
A calibrated broadband signal is used to measure the
amplitude and phase response across the real-time
acquisition BW. This signal is the internal channel
response reference. It provides the information that
allows DS P to compensate for the amplitude, phase
and delay variations across the acquisition bandwidth.
Fundamentals of R eal-Time Spectrum AnalysisPrimer
11ww w.te ktronix.co m/rtsa
7/27/2019 Fundamentals of Real-Time Spectrum Analysis Tektronix DFT FFT Fourier
http://slidepdf.com/reader/full/fundamentals-of-real-time-spectrum-analysis-tektronix-dft-fft-fourier 12/52
Digital Signal Processing (DSP) Concepts
This section contains several architectural diagrams of the
main acquisition and analysis blocks typical of Tektronix
R TSAs. Specific implementations vary by model number
and by specific measurement function. Some ancillary
functions have been omitted to clarify the discussion.
Digital Signal Processing Path in Real-Time
Spectrum Analyzers
Tektronix R TSA s use a combination of analog and digital
signal processing (DSP ) to convert R F signals into calibrated,
time-correlated multi-domain measurements. This section
deals with the digital portion of the R TSAs signal
processing flow.
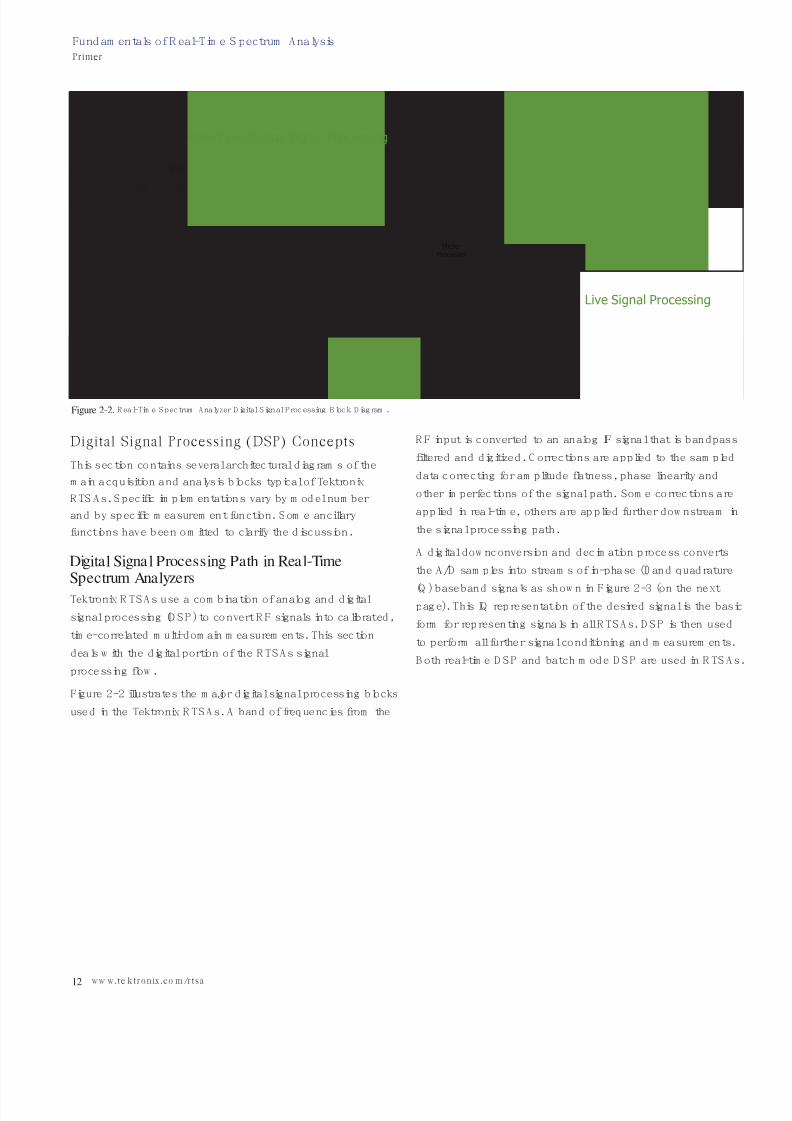
Figure 2-2 illustrates the major digital signal processing blocks
used in the Tektronix R TSAs. A band of frequencies from the
R F input is converted to an analog IF signal that is bandpass
filtered and digitized. C orrections are applied to the sampled
data correcting for amplitude flatness, phase linearity and
other imperfections of the signal path. Some corrections are
applied in real-time, others are applied further downstream in
the signal processing path.
A digital downconversion and decimation process converts
the A/D samples into streams of in-phase (I) and quadrature
(Q ) baseband signals as shown in Figure 2-3 (on the nextpage). This IQ representation of the desired signal is the basic
form for representing signals in all R TSAs. D SP is then used
to perform all further signal conditioning and measurements.
Both real-time DSP and batch mode DSP are used in R TSA s.
Fundamentals of Real-Time Spectrum AnalysisPrimer
12 ww w.te ktronix.co m/rtsa
DPX
ADC Correction Capture
External
Amp/PhaseDown-
converter
Real-Time
IQ Out
(Option)
Free
Run
Filtered
Power
Level
Freq
Mask
DPX Pixel
Buffer
Trigger
DDC/
Decimation
Micro-Processor
Post Acquistion
Display
AnalysisSW
Live Signal Processing
Real-Time Digital Signal Processing
Figure 2-2. Real-Time Spectrum Analyzer Digital Signal Processing Block D iagram.
7/27/2019 Fundamentals of Real-Time Spectrum Analysis Tektronix DFT FFT Fourier
http://slidepdf.com/reader/full/fundamentals-of-real-time-spectrum-analysis-tektronix-dft-fft-fourier 13/52
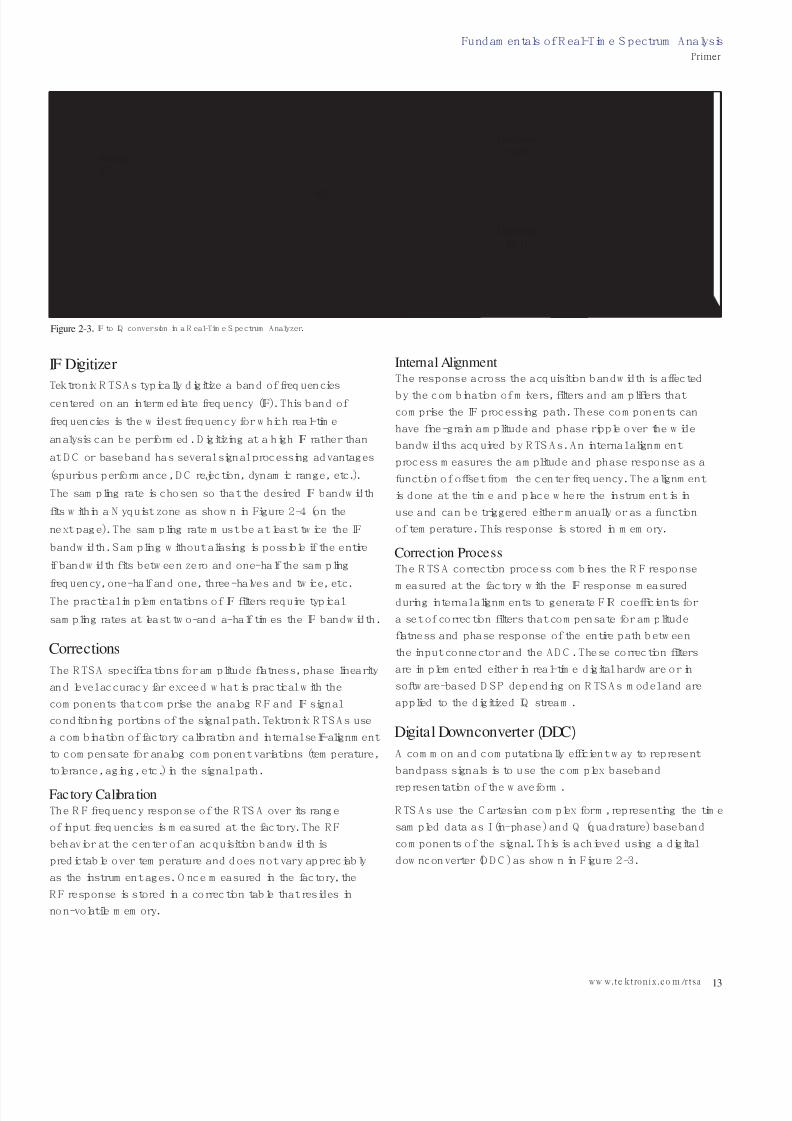
Figure 2-3. IF to IQ conversion in a Real-T ime Spectrum Analyzer.
Fundamentals of R eal-Time Spectrum AnalysisPrimer
13ww w.te ktronix.co m/rtsa
ADCCorrections
(if used)
Numeric
Oscillator
Decimation
Filters
IQ Representation of
Baseband Time
Domain Data
Digital Downconverter
Q
I
Analog
IF
Decimate
by N
Decimate
by N
90°
IF Digitizer
Tektronix R TSAs typically digitize a band of frequencies
centered on an intermediate frequency (IF). This band of
frequencies is the widest frequency for which real-time
analysis can be performed. D igitizing at a high IF rather than
at DC or baseband has several signal processing advantages
(spurious performance, D C rejection, dynamic range, etc.).
The sampling rate is chosen so that the desired IF bandwidth
fits within a N yquist zone as shown in Figure 2-4 (on the
next page). The sampling rate must be at least twice the IF
bandwidth. Sampling without aliasing is possible if the entire
if bandwidth fits between zero and one-half the sampling
frequency, one-half and one, three-halves and twice, etc.The practical implementations of IF filters require typical
sampling rates at least two-and-a-half times the IF bandwidth.
Corrections
The RTSA specifications for amplitude flatness, phase linearity
and level accuracy far exceed what is practical with the
components that comprise the analog R F and IF signal
conditioning portions of the signal path. Tek tronix RTSAs use
a combination of factory calibration and internal self-alignment
to compensate for analog component variations (temperature,
tolerance, aging, etc.) in the signal path.
Factory Calibration
The RF frequency response of the RTSA over its range
of input frequencies is measured at the factory. The RF
behavior at the center of an acquisition bandwidth is
predictable over temperature and does not vary appreciably
as the instrument ages. O nce measured in the factory, the
RF response is stored in a correction table that resides in
non-volatile memory.
Internal Alignment
The response across the acquisition bandwidth is affected
by the combination of mixers, filters and amplifiers that
comprise the IF processing path. T hese components can
have fine-grain amplitude and phase ripple over the wide
bandwidths acquired by R TSAs. An internal alignment
process measures the amplitude and phase response as a
function of offset from the center frequency. The alignment
is done at the time and place where the instrument is in
use and can be triggered either manually or as a function
of temperature. T his response is stored in memory.
Correction Process
The RTSA correction process combines the RF response
measured at the factory with the IF response measuredduring internal alignments to generate FIR coefficients for
a set of correction filters that compensate for amplitude
flatness and phase response of the entire path between
the input connector and the AD C . These correction filters
are implemented either in real-time digital hardware or in
software-based DSP depending on RTSA s model and are
applied to the digitized IQ stream.
Digital Downconverter (DDC)
A common and computationally efficient way to represent
bandpass signals is to use the complex baseband
representation of the waveform.
R TSAs use the Cartesian complex form, representing the time
sampled data as I (in-phase) and Q (quadrature) baseband
components of the signal. T his is achieved using a digital
downconverter (DDC ) as shown in Figure 2-3.
7/27/2019 Fundamentals of Real-Time Spectrum Analysis Tektronix DFT FFT Fourier
http://slidepdf.com/reader/full/fundamentals-of-real-time-spectrum-analysis-tektronix-dft-fft-fourier 14/52
Fundamentals of Real-Time Spectrum AnalysisPrimer
14 ww w.te ktronix.co m/rtsa
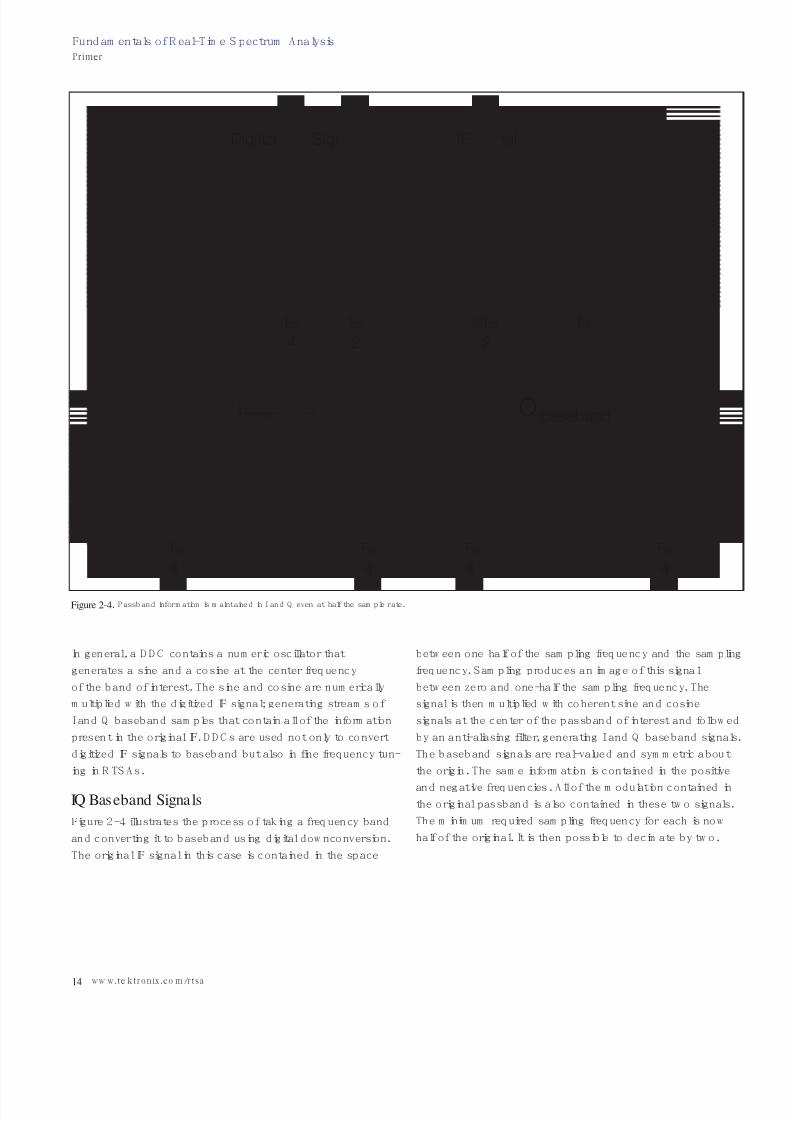
In general, a D DC contains a numeric oscillator that
generates a sine and a cosine at the center frequency
of the band of interest. T he sine and cosine are numerically
multiplied with the digitized IF signal; generating streams of
I and Q baseband samples that contain all of the information
present in the original IF. DDC s are used not only to convert
digitized IF signals to baseband but also in fine frequency tun-
ing in R TS As.
IQ Baseband Signals
Figure 2-4 illustrates the process of taking a frequency band
and converting it to baseband using digital downconversion.
The original IF signal in this case is contained in the space
between one half of the sampling frequency and the sampling
frequency. S ampling produces an image of this signal
between zero and one-half the sampling frequency. The
signal is then multiplied with coherent sine and cosine
signals at the center of the passband of interest and followed
by an anti-aliasing filter, generating I and Q baseband signals.
The baseband signals are real-valued and symmetric about
the origin. T he same information is contained in the positive
and negative frequencies. A ll of the modulation contained in
the original passband is also contained in these two signals.
The minimum required sampling frequency for each is now
half of the original. It is then possible to decimate by two.
Digitized IF Signal IF Signal
basebandI basebandQ
Fs3Fs
2
Fs
2
Fs
4
-Fs
4
-Fs
4
Fs
4
Fs
4
Figure 2-4. Passband information is maintained in I and Q even at half the sample rate.
7/27/2019 Fundamentals of Real-Time Spectrum Analysis Tektronix DFT FFT Fourier
http://slidepdf.com/reader/full/fundamentals-of-real-time-spectrum-analysis-tektronix-dft-fft-fourier 15/52
Decimation
The Nyquist theorem states that for baseband signals
one need only sample at a rate equal to twice the highest
frequency of interest. For bandpass signals one needs to
sample at a rate at least twice the bandwidth. The sample
rate can be reduced when the needed bandwidth is less thanthe maximum. Sample rate reduction, or decimation, can be
used to balance bandwidth, processing time, record length
and memory usage. T he Tektronix R SA6100 Series, for
example, uses a 100 M S/s sampling rate at the A/D converter
to digitize a 40 M Hz acquisition bandwidth, or span. The I
and Q records that result after DD C , filtering and decimation
for this 40 M Hz acquisition bandwidth are at an effective
sampling rate of half the original, that is, 50 M S/s. The total
number of samples is unchanged: we are left with two sets
of samples, each at an effective rate of 50 M S/s instead of
a single set at 100 M S/s. Further decimation is made fornarrower acquisition bandwidths or spans, resulting in
longer time records for an equivalent number of samples.
The disadvantage of the lower effective sampling rate is a
reduced time resolution. The advantages of the lower
effective sampling rate are fewer computations for analysis
and less memory usage for a given time record.
Decimation Filtering
The Nyquist requirements must also be observed when
decimating. If the data rate is reduced by a factor of two,
then the bandwidth of the digital signal also must be reduced
by a factor of two. T his must be done with a digital filter
prior to the reduction in sample rate to prevent aliasing.
M any levels of decimation are used in Tektronix RTSAs.
Each level contains a digital filter followed by a reduction
in the number of samples. An additional advantage of
decimation and filtering is a reduction in noise with the
reduced bandwidth. This reduction in noise is often called
processing gain.
Fundamentals of R eal-Time Spectrum AnalysisPrimer
15ww w.te ktronix.co m/rtsa

7/27/2019 Fundamentals of Real-Time Spectrum Analysis Tektronix DFT FFT Fourier
http://slidepdf.com/reader/full/fundamentals-of-real-time-spectrum-analysis-tektronix-dft-fft-fourier 16/52
Trans forming Time Doma in Wa vefo rms to theFrequency Domain
Spectrum analysis, also called Fourier analysis, separates the
various frequency components of an input signal. T he typical
spectrum analyzer display plots the level of the individual
frequency components versus frequency. The difference
between the start and stop frequencies of the plot is the
span. Spectrum analysis is said to be real-time when
repetitive D iscrete Fourier Transforms (D FTs) are performed
as shown in Figure 2-5 is such a way that signal processing
keeps up with the input signal. Repetitive Fourier transforms
can also be used to discover, capture and analyze infrequent
transient events in the frequency domain even when the
requirements for real-time are not strictly met.
Fundamentals of Real-Time Spectrum AnalysisPrimer
16 ww w.te ktronix.co m/rtsa
M/ ΘM/ ΘM/
Θ
Complex
Envelope
Detection
* The Fast Fourier Transform (FFT) is a common
implementation of a Discrete Fourier Transform (DFT).
DFT-Based Spectrum Analysis*
Equivalent Bank of Filters
Input Signal
ADC DFT Engine
Memory Contents
Time
Time Samples
Input Signal
Time
Bank of N Bandpass
filters with centers
separated by one FFT
frequency bin width
M/ Θ
Figure 2-5. A DFT-based Spectrum Analyzer and an equivalent implementation using a bank of bandpass filters.
7/27/2019 Fundamentals of Real-Time Spectrum Analysis Tektronix DFT FFT Fourier
http://slidepdf.com/reader/full/fundamentals-of-real-time-spectrum-analysis-tektronix-dft-fft-fourier 17/52
Fundamentals of R eal-Time Spectrum AnalysisPrimer
17ww w.te ktronix.co m/rtsa
Real-Time Spectrum Analysis
For spectrum analysis to be classified real-time, all information
contained within the span of interest must be processed
indefinitely without gaps. An RTSA must take all information
contained in time domain waveform and transform it into
frequency domain signals. To do this in real-time requires
several important signal processing requirements:
Enough capture bandwidth to support analysis of the
signal of interest
A high enough ADC clock rate to exceed the Nyquist
criteria for the capture bandwidth
A long enough analysis interval to support the narrowest
resolution bandwidth (R BW) of interest
A fast enough DFT transform rate to exceed the Nyquist
criteria for the RBW of interest
DFT rates exceeding the Nyquist criteria for RBW require
overlapping DFT frames:
The amount of overlap depends on the window function
The window function is determined by the RBW
Today’s RTSAs meet the real-time requirements listed above
for Frequency M ask Trigger (FM T ) for spans up to their
maximum real-time acquisition bandwidth. Triggering on
frequency domain events, therefore, considers all the
information contained in the selected acquisition bandwidth.
Discovering and Capturing Transient Events
Another application of fast and repetitive Fourier transforms
is the discovery, capture and observation of rare events in
the frequency domain. A useful specification is the minimum
event duration for 100% probability of capturing a single
non-repetitive event. A minimum event is defined as the
narrowest rectangular pulse that can be captured with 100%
certainty at the specified accuracy. Narrower events can be
detected, but the accuracy and probability may degrade.
Discovering, capturing and analyzing transients requires:
Enough capture bandwidth to support analysis of the
signal of interest
A high enough ADC clock rate to exceed the Nyquist
criteria for the capture bandwidth
A long enough analysis interval to support the narrowest
resolution bandwidth (R BW) of interest
A fast enough DFT transform rate to support the minimumevent duration
At 48000 spectrums per second, the DPX S pectrum mode
in the RSA6100 Series can detect RF pulses as short as
24 microseconds with the full accuracy specifications with
100% probability. A Swept Spectrum A nalyzer (SA ) with
50 sweeps per second requires pulses longer than
20 milliseconds for 100% probability of detection with
full accuracy.

7/27/2019 Fundamentals of Real-Time Spectrum Analysis Tektronix DFT FFT Fourier
http://slidepdf.com/reader/full/fundamentals-of-real-time-spectrum-analysis-tektronix-dft-fft-fourier 18/52
Relating RTSA to Swept Spectrum Analyzer
C onsider a R TSA system as described on the previous
page. A passband of interest is downconverted to an IF and
digitized. The time domain samples are digitally converted to
a baseband record composed of a sequence of I (in-phase)
and Q (quadrature) samples. D FTs are sequentially performed
on segments of the IQ record generating a mathematical
representation of frequency occupancy over time, as shown
in Figure 2-5 (on page 16).
Taking sequential equally spaced DFTs over time ismathematically equivalent to passing the input signal
through a bank of bandpass filters and then sampling
the magnitude and phase at the output of each filter. T he
frequency domain behavior over time can be visualized as
a spectrogram as shown in Figure 2-6, where frequency is
plotted horizontally, time is plotted vertically and the amplitude
is represented as a color. The real-time D FT effectively
samples the entire spectrum of the incoming signal at the
rate with which new spectrums are computed. Events
occurring between the time segments on which the FFTs
are performed are lost. R TSAs minimize or eliminate the
“dead time” by performing hardware-based DFTs, often
performing transforms on overlapping time segments at
the fastest sample rate.
An SA, in contrast, is tuned to a single frequency at any given
time. T he frequency changes as the sweep advances tracing
the diagonal line in Figure 2-6. The slope of the line becomes
steeper as the sweep slows so that the function of a spec-
trum analyzer in zero-span can be represented as a vertical
line indicating that the instrument is tuned to a single frequen-
cy as time advances. Figure 2-6 also shows how a sweep
can miss transient events such as the single frequency hop
depicted.
RBW on the Real-Time Spectrum Analyzer
Frequency resolution is an important spectrum analyzer
specification. When we try to measure signals that are close
in frequency, frequency resolution determines the capability
of the spectrum analyzer to distinguish between them. O n
traditional SA s, the IF filter bandwidth determines the ability
to resolve adjacent signals and is also called the resolution
bandwidth (R BW). For example, in order to resolve two
signals of equal amplitude and 100 kHz apart in frequency,
R BW needs to be less than 100 kH z.
For spectrum analyzers based on the DFT technique, the
R BW is inversely proportional to the acquisition time. G iven
the same sampling frequency, more samples are required to
achieve a smaller RBW. In addition, windowing also affects
the RB W.
Fundamentals of Real-Time Spectrum AnalysisPrimer
18 ww w.te ktronix.co m/rtsa
Spectrum
Spectrogram
Frequency
S w e e p
T i m e
C ol or S c a l e
Figure 2-6. Spectrum, Spectrogram and Sweep.

7/27/2019 Fundamentals of Real-Time Spectrum Analysis Tektronix DFT FFT Fourier
http://slidepdf.com/reader/full/fundamentals-of-real-time-spectrum-analysis-tektronix-dft-fft-fourier 19/52
Windowing
There is an assumption inherent in the mathematics of
D iscrete Fourier Transform (D FT ) analysis that the data to be
processed is a single period of a periodically repeating signal.
Figure 2-7 depicts a series of time domain samples. When
DFT processing is applied to Frame 2 in Figure 2-7, for
example, the periodic extension is made to the signal. T he
discontinuities between successive frames will generally
occur as shown in Figure 2-8.
These artificial discontinuities generate spectral artifacts
not present in the original signal. This effect produces an
inaccurate representation of the signal and is called spectral
leakage. Spectral leakage not only creates signals in the
output that were not present in the input, but also reduces
the ability to observe small signals in the presence of nearby
large ones.
Tektronix Real-T ime S pectrum A nalyzers apply a windowing
technique to reduce the effects of spectral leakage. Before
performing the DFT, the DFT frame is multiplied by a window
function with the same length sample by sample. T he window
functions usually have a bell shape, reducing or eliminating
the discontinuities at the ends of the DFT frame.
The choice of window function depends on its frequency
response characteristics such as side-lobe level, equivalent
noise bandwidth, and amplitude error. The window shape
also determines the effective RBW filter.
Lik e other spectrum analyzers, the R TSAs allow the user to
select the RBW filter. The RTSAs also allow the user to selectamong many common window types. The added flexibility
to directly specify the window shape enables the users to
optimize for specific measurements. Special attention, for
example, should be paid to the spectrum analysis of pulse
signals. If the pulse duration is shorter than the window
length, uniform window (no windowing) should be used to
avoid de-emphasizing effects on both ends of the DFT frame.
For further information on this topic, please refer to the
Tektronix P rimer, “U nderstanding FFT O verlap P rocessing on
the Real-Time Spectrum A nalyzer” (37W-18839).
Fundamentals of R eal-Time Spectrum AnalysisPrimer
19ww w.te ktronix.co m/rtsa
Frame 1 Frame 2 Frame 3
Figure 2-7. Three frames of a sampled time domain signal.
Frame 2 Frame 2 Frame 2
Figure 2-8. Discontinuities caused by periodic extension of samples in a single frame.

7/27/2019 Fundamentals of Real-Time Spectrum Analysis Tektronix DFT FFT Fourier
http://slidepdf.com/reader/full/fundamentals-of-real-time-spectrum-analysis-tektronix-dft-fft-fourier 20/52
The magnitude of the frequency response of the window
function determines the RBW shape. For example, the RBW
on RSA6100 is defined as the 3 dB bandwidth and is related to
the sampling frequency and samples in the DFT as follows:
Equation 1
or
Equation 2
Where k is a window-related coefficient, N is the number of
time-domain samples used in the DFT calculation, and Fs
is the sampling frequency. For the Kaiser window with beta1
16.7, k is about 2.23. T he RB W shape factor, defined as
the frequency ratio between the spectrum amplitude at
60 dB and 3 dB, is about 4:1. O n the RSA 6100, the spec-
trum analysis measurement uses Equation 2 to calculate the
required number of samples for the DFT based on the input
span and R BW settings.
The time domain and the spectrum of the Kaiser window
used for R SA6100 spectrum analysis is shown in Figure
2-9 and Figure 2-10. This is the default window used in the
RSA6100 for spectrum analysis. O ther windows (such as
Blackman-Harris, Uniform, Hanning) may be user-selected
to meet special measurement requirements, and may beused by the instrument when performing some of the
measurements available in the instrument.
Discrete Fourier Transforms (DFT) in the Real-Time
Spectrum AnalyzerThe DFT is defined below:
This is the basis of a real-time spectrum analyzer and it is
used to estimate the individual frequency components x(k)
from the input sequence x(n). The DFT is block-based and N
is the total sample number of each DFT block (or Frame). The
input sequence x(n) is a sampled version of the input signal
x(t). Although the input sequence is only defined for integervalues of n, the output is a continuous function of k, where
k=(NW)/(2P) and W is the radian frequency. T he magnitude of
X[k] represents the magnitude of the frequency component at
frequencyW that is present in the input sequence x(n).
There are various efficient methods to compute the DFT.
Examples include the Fast Fourier Transform (FFT ) and the
C hirp-Z Transform (C ZT ). The choice of implementation
method depends on the particular needs of the application.
The CZT, for example, has greater flexibility in choosing the
frequency range and the number of output points than the
FFT. T he FFT is less flexible but requires fewer computations.
Both the CZT and the FFT are used in RT SA s.
Fundamentals of Real-Time Spectrum AnalysisPrimer
20 ww w.te ktronix.co m/rtsa
-8 -6 -4 4 6 8-2 20-200
-180
-160
-140
-120
-100
-80
-60
-40
-20
0
Vertical Linear Scale
Figure 2-10. The spectrum of a K aiser window (beta 16.7). The horizontal scale unit is
the frequency bin (Fs/N ). T he vertical scale is in dB.
1
0.9
0.8
0.7
0.6
0.5
0.4
0.3
0.2
0.1
050 100 150 200 250
Figure 2-9. K aiser Window (beta 16.7) in T ime Domain (H orizontal is time sample,
Vertical is linear scale).
RBW = k * F s
N
N = k * F s
RBW
[R eference 1] Oppenheim, A .V. and R .W S chafer, D iscrete-time Signal Processing, Prentice-Hall, 1989, p. 453.

7/27/2019 Fundamentals of Real-Time Spectrum Analysis Tektronix DFT FFT Fourier
http://slidepdf.com/reader/full/fundamentals-of-real-time-spectrum-analysis-tektronix-dft-fft-fourier 21/52
The ability to resolve frequency components is not dependenton the particular implementation of the DFT and is determined
by the time length of the input sequence or the R BW.
To illustrate the relationship of the DFT to the FFT and the
C ZT, a sampled C ontinuous Waveform (C W) signal will be
analyzed. For illustration purposes a real-valued sine wave
x(t) will be used as the input signal (Figure 2-11). T he sample
version of x(t) is x(n). In this case N = 16 and the sample
rate is 20 Hz.
Figure 2-12 shows the result of evaluating the DFT for
0 ≤ k < N. Note that the magnitude of X[k] for W > P
(f > 10 Hz) is a mirror image of the first half. T his is the resultfor a real-valued input sequence x(n). In practice, the results
from P < W < 2 P are discarded (or not computed) when a
real input signal is analyzed. For a complex input, a unique
result can be obtained for 0 ≤ W < 2 P (0 ≤ f < 20 Hz).
A FFT returns N-equally spaced frequency domain samplesof X[k ]. T he magnitude of X[k ] is shown in Figure 2-13. N ote
that the samples returned by the FFT might miss the peaks
of magnitude of X[k].
A C ZT can return M frequency domain samples with an
arbitrary start and stop frequency (Figure 2-14). Notice that
the CZT does not change the underlying frequency domain
output of the DFT. It only takes a different set of frequency
domain samples than the FFT.
An advantage of using the CZT is that the frequency of
the first and last sample in the frequency domain can be
arbitrarily selected and does not depend on the input samplerate. The same result can also be achieved by arbitrarily
controlling the input sample rate so that the output of the
FFT produces the same output samples as the CZT. The
end result is the same in both cases. The choice is purely
an implementation issue, and depending on the requirements
and available HW, one or the other will be a more
optimal solution.
Fundamentals of R eal-Time Spectrum AnalysisPrimer
21ww w.te ktronix.co m/rtsa
0 5
(X[k])DFT
10
Frequency (Hz)
DFT (X[k])
M a g
n i t u d e
15 200
8
1
7
6
2
3
5
4
Figure 2-12. DFT of x(n) evaluated continuously.
0 4
x(t)x(n)
8
Sample Number (n)
Input Signal: Frequency = 4.7222 Hz : Sample Frequency = 20 Hz
A m p l i t u d e
12-1
1
-0.8
0.8
-0.6
0.6
-0.4
0.4
-0.2
0.2
0
Figure 2-11. Input Signal.
0 5
(X[k])DFT CZT
10
Frequency (Hz)
CZT: Start Frequency = 2.5 Hz : Stop Frequency = 7.4 Hz
M a g n i t u d e
15 200
8
1
7
6
2
3
5
4
Figure 2-14. C ZT of x(n).
0 5
(X[k])DFT
FFT
10
Frequency (Hz)
FFT
M a g n i t u d e
15 200
8
1
7
6
2
3
5
4
Figure 2-13. FFT of x(n), length of FFT = N = length of x(n).
7/27/2019 Fundamentals of Real-Time Spectrum Analysis Tektronix DFT FFT Fourier
http://slidepdf.com/reader/full/fundamentals-of-real-time-spectrum-analysis-tektronix-dft-fft-fourier 22/52
Digita l Filtering
Finite Impulse Response (FIR) Filters
Frequency filters are used in many applications to select
some frequencies and reject others. While traditional filters
are implemented using analog circuit elements (R LC ),
DSP selects the frequencies to be
enhanced or attenuated mathematically.
A common mathematical implementa-
tion is the Finite Impulse R esponse
(FIR ) filter. R TSA s make extensive
use of FIR filters. In addition to the
usual signal conditioning applications
requiring the passage or rejection of
specific bands, FIR filters are also used
to adjust for analog signal path imper-
fections. Internally generated alignment
data is combined with stored factory
calibration data to create FIR filters
with a response that compensates
for the analog signal path frequency
response, making the cascade of the
analog and digital paths have flat
amplitude response and linear phase.
Frequency Response vs.
Impulse Response
The theory of Fourier transforms shows
an equivalency between the frequency
domain and the time domain. It further
tells us that the transfer function of
a device, usually expressed as its
amplitude and phase response over
frequency, is equivalent to the impulse
response over time. A FIR filter emulates
the impulse response of the desired
filter transfer function with a discrete-
time approximation that has finite time-
duration. Signal filtering is then performed by convolving the
input signal with the impulse response of the filter.
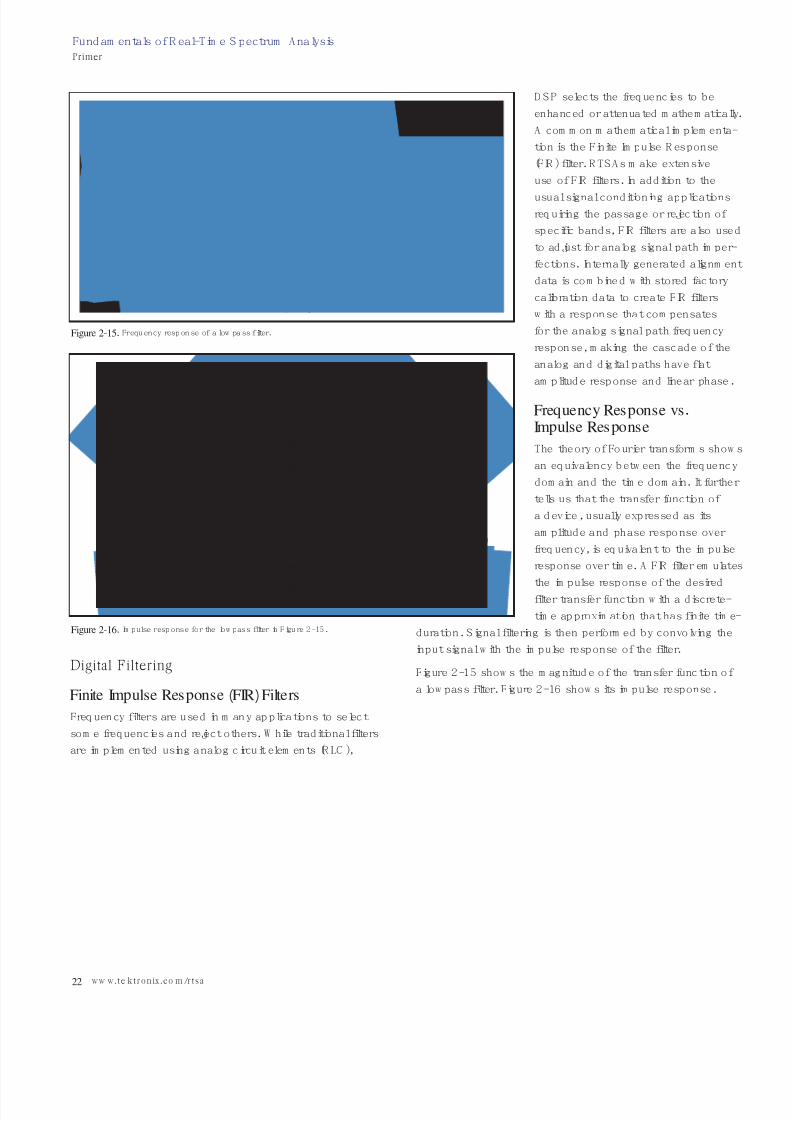
Figure 2-15 shows the magnitude of the transfer function of
a lowpass filter. Figure 2-16 shows its impulse response.
Fundamentals of Real-Time Spectrum AnalysisPrimer
22 ww w.te ktronix.co m/rtsa
Frequency
A m p l i t u d e
Frequency Response
0 10 20 30 40 50 60 700
0.2
0.4
0.6
0.8
1
1.2
Figure 2-15. Frequency response of a lowpass filter.
Impulse Response
Time
V a l u e
-100 -80 -60 -40 -20 0
0
0.2
20 40 60 80 100
-0.2
-0.4
0.4
0.6
0.8
1
1.2
Figure 2-16. Impulse response for the lowpass filter in Figure 2-15.
7/27/2019 Fundamentals of Real-Time Spectrum Analysis Tektronix DFT FFT Fourier
http://slidepdf.com/reader/full/fundamentals-of-real-time-spectrum-analysis-tektronix-dft-fft-fourier 23/52
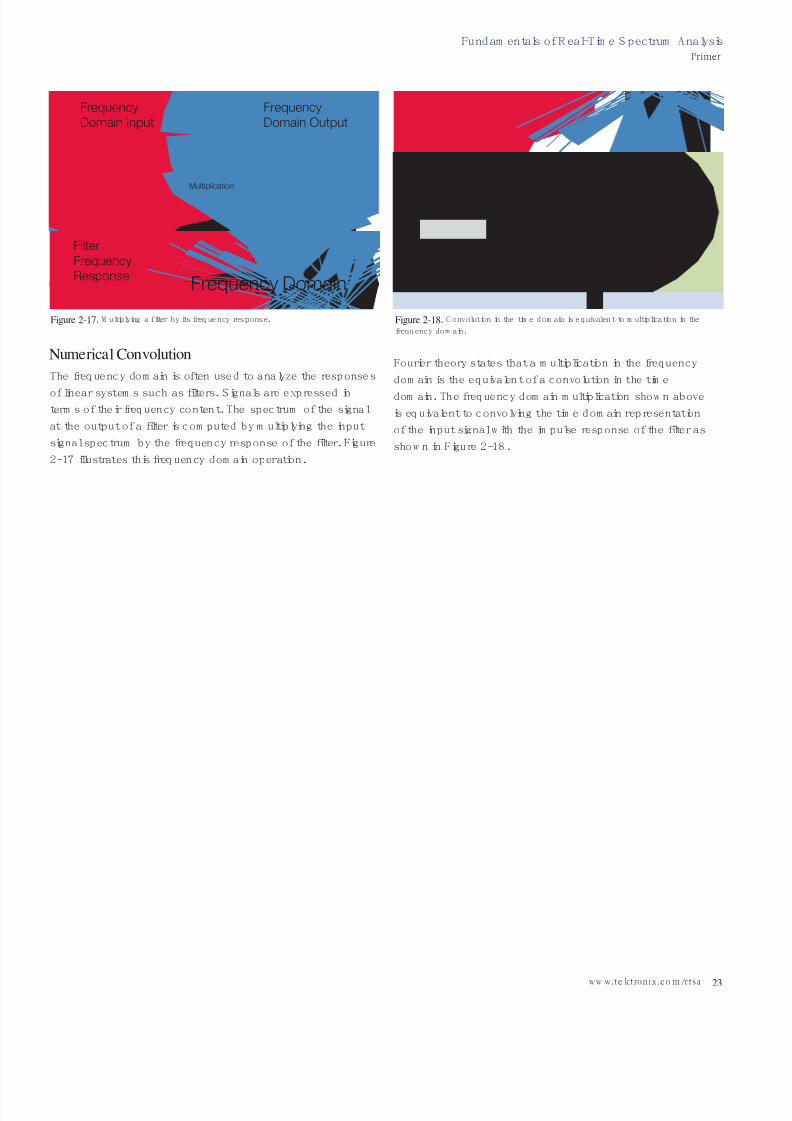
Numerical Convolution
The frequency domain is often used to analyze the responses
of linear systems such as filters. Signals are expressed interms of their frequency content. The spectrum of the signal
at the output of a filter is computed by multiplying the input
signal spectrum by the frequency response of the filter. Figure
2-17 illustrates this frequency domain operation.
Fourier theory states that a multiplication in the frequency
domain is the equivalent of a convolution in the time
domain. The frequency domain multiplication shown above
is equivalent to convolving the time domain representation
of the input signal with the impulse response of the filter as
shown in Figure 2-18.
Fundamentals of R eal-Time Spectrum AnalysisPrimer
23ww w.te ktronix.co m/rtsa
Frequency
A m p l i t u d e
Frequency Response
0 10 20 30 40 50 60 700
0.2
0.4
0.6
0.8
1
1.2
Frequency
Domain Input
Multiplication
Filter
FrequencyResponse
Frequency Domain
Frequency
Domain Output
Figure 2-17. M ultiplying a filter by its frequency response.
Input TimeSamples
Output TimeSamples
Sampled FilterImpulse Response Discrete Time
Impulse Response
Time
V a l u e
-100 -80 -60 -40 -20 0
0
0.2
20 40 60 80 100
-0.2
-0.4
0.4
0.6
0.8
1
1.2
Convolution
Figure 2-18. C onvolution in the time domain is equivalent to multiplication in the
frequency domain.
7/27/2019 Fundamentals of Real-Time Spectrum Analysis Tektronix DFT FFT Fourier
http://slidepdf.com/reader/full/fundamentals-of-real-time-spectrum-analysis-tektronix-dft-fft-fourier 24/52
Input time
samples
Output time
samples
Sampled filter
impulse response
stored in registers
Time samples shifted each clock cycle
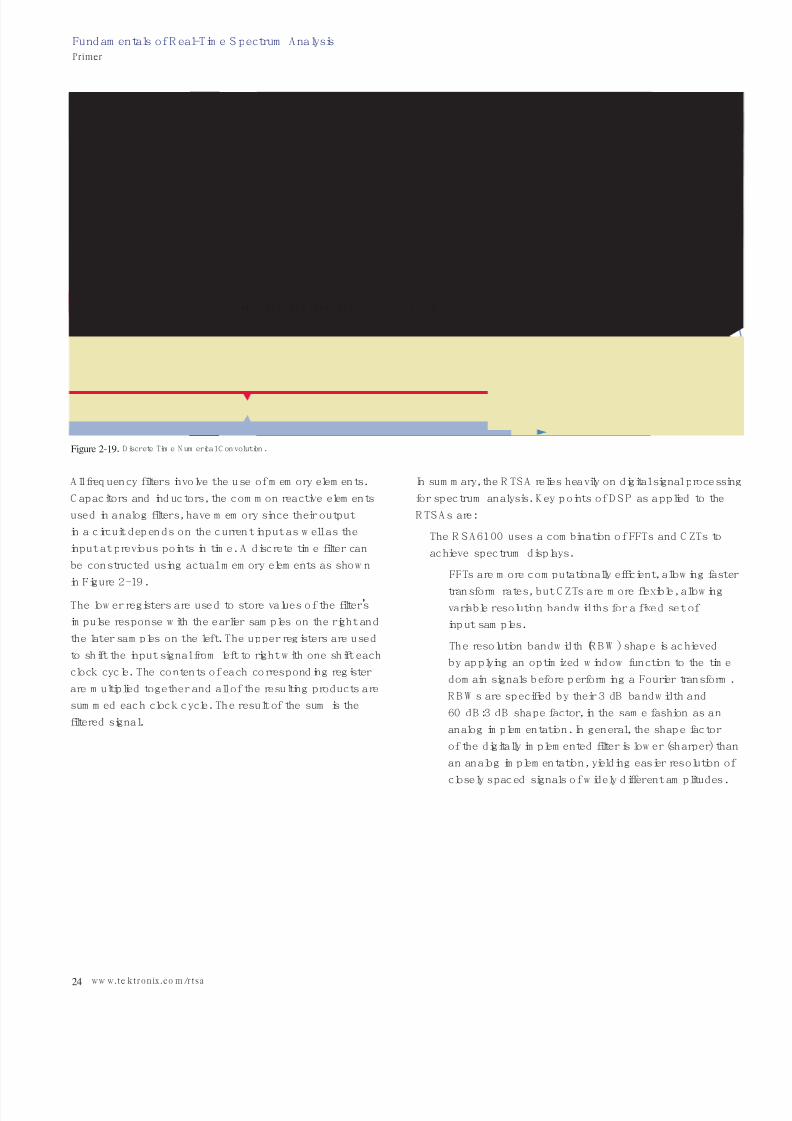
Numerical Convolution
ImpulseResponse
Time
V a l u e
-100 -80 -60 -40 -20 0
0
0.2
20 40 60 80 100
-0.2
-0.4
0.4
0.6
0.8
1
1.2
M-1 M-2 M-3 M-4 M-5 1 0
Figure 2-19. Discrete T ime Numerical C onvolution.
All frequency filters involve the use of memory elements.
C apacitors and inductors, the common reactive elements
used in analog filters, have memory since their output
in a circuit depends on the current input as well as the
input at previous points in time. A discrete time filter can
be constructed using actual memory elements as shown
in Figure 2-19.
The lower registers are used to store values of the filter’s
impulse response with the earlier samples on the right and
the later samples on the left. The upper registers are used
to shift the input signal from left to right with one shift each
clock cycle. The contents of each corresponding register
are multiplied together and all of the resulting products are
summed each clock cycle. The result of the sum is the
filtered signal.
In summary, the RTSA relies heavily on digital signal processing
for spectrum analysis. K ey points of DS P as applied to the
RTSAs are:
The RSA 6100 uses a combination of FFTs and CZTs to
achieve spectrum displays.
FFTs are more computationally efficient, allowing faster
transform rates, but C ZTs are more flexible, allowing
variable resolution bandwidths for a fixed set of
input samples.
The resolution bandwidth (R BW) shape is achieved
by applying an optimized window function to the time
domain signals before performing a Fourier transform.
R BWs are specified by their 3 dB bandwidth and
60 dB:3 dB shape factor, in the same fashion as an
analog implementation. In general, the shape factor
of the digitally implemented filter is lower (sharper) than
an analog implementation, yielding easier resolution of
closely spaced signals of widely different amplitudes.
Fundamentals of Real-Time Spectrum AnalysisPrimer
24 ww w.te ktronix.co m/rtsa
7/27/2019 Fundamentals of Real-Time Spectrum Analysis Tektronix DFT FFT Fourier
http://slidepdf.com/reader/full/fundamentals-of-real-time-spectrum-analysis-tektronix-dft-fft-fourier 25/52
• Offset:
0.00 dBm
• dB/div:
10.00 dB
• RBW
91KHz
-100.0 dBm
• Span: 10.00 MHz• CF: 2.445 GHz
O ther shape factors can be used for special applications
by applying optimized window functions.
The R SA 3000 Series R TSA uses a combination of
methods when performing spectrum analysis.
In Spectrum mode, the result of a windowed FFT is
convolved with a R BW shape to yield Spectrum traces
with a specified R BW, similar to an analog spectrum
analyzer. T his process yields a slightly wider shape
factor of approximately 5:1, compared to 4.1:1
for the RS A6100.
In D PX mode, C ZTs are used for resolution
bandwidth flexibility.
In R TSA mode, windowed FFTs are used, specified
in the classical method for FFT analysis, that
of the Noise Bandwidth. T he Noise Bandwidth is
approximately 6% (0.25 dB) greater than the RBW.
As we have seen in this section, digitally implemented
corrections and filtering are a key factor in implanting the
high transform rate required of a RTSA. T he next section
looks at the practical use of these filters in one of the unique
displays available in the RT SA, the Digital Phosphor
Spectrum Display.
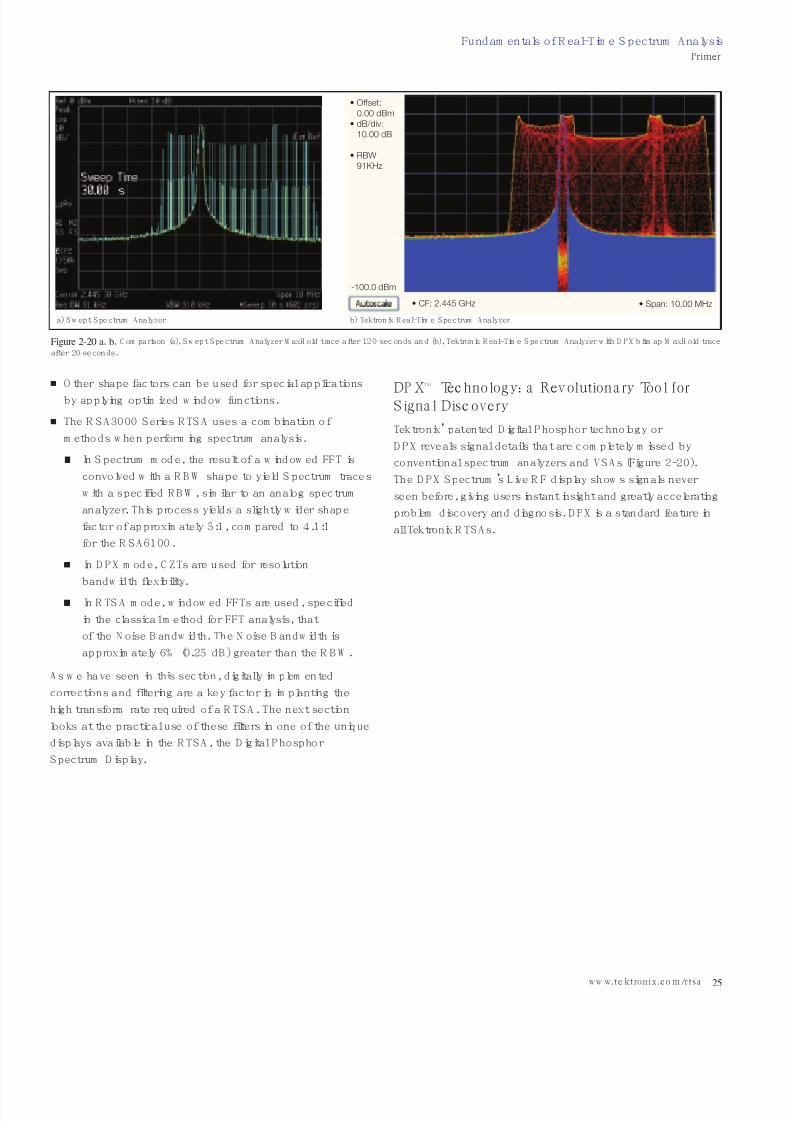
DP X™ Tec hno log y: a Revolutiona ry Too l forS igna l Disc overy
Tektronix’ patented D igital Phosphor technology or
DPX reveals signal details that are completely missed by
conventional spectrum analyzers and VSAs (Figure 2-20).
The DP X S pectrum’s Live R F display shows signals never
seen before, giving users instant insight and greatly accelerating
problem discovery and diagnosis. D PX is a standard feature in
all Tektronix RTSA s.
Fundamentals of R eal-Time Spectrum AnalysisPrimer
25ww w.te ktronix.co m/rtsa
Figure 2-20 a, b. C omparison (a), Swept Spectrum A nalyzer MaxHold trace after 120 seconds and (b), Tektronix R eal-Time S pectrum Analyzer with DP X bitmap M axHold trace
after 20 seconds.
a) Swept Spectrum Analyzer b) Tektronix Real-T ime Spectrum Analyzer

7/27/2019 Fundamentals of Real-Time Spectrum Analysis Tektronix DFT FFT Fourier
http://slidepdf.com/reader/full/fundamentals-of-real-time-spectrum-analysis-tektronix-dft-fft-fourier 26/52
Digital Phosphor Display
The name “Digital Phosphor” derives from the phosphor
coating on the inside of cathode ray tubes (CR Ts) used as
displays in older televisions, computer monitors and test
equipment where the electron beam is directly controlled
by the input waveform. When the phosphor is excited by
an electron beam, it fluoresces, lighting up the path drawn
by the stream of electrons.
Liquid C rystal Displays (LC Ds) replaced C R Ts in many
applications due to their smaller depth and lower power
requirements, among other advantages. H owever, the
combination of phosphor coatings and vector drawing in
CR Ts provided several valuable benefits.
Persistence: Phosphor continues to glow even after the
electron beam has passed by. G enerally, the fluorescence
fades quickly enough that viewers don’t perceive it lingering,
but even a small amount of persistence will allow the human
eye to detect events that would otherwise be too short
to see.
Proportionality: The slower the electron beam passes
through a point on the phosphor-coated screen, the brighter
the resulting light. Brightness of a spot also increases as the
beam hits it more frequently. U sers intuitively know how to
interpret this z-axis information: a bright section of the trace
indicates a frequent event or slow beam motion, and a dim
trace results from infrequent events or fast-moving beams.
In the D PX display, both color and brightness provide
z-axis emphasis.
Persistence and proportionality do not come naturally to
instruments with LC Ds and a digital signal path. Tektronix
developed D igital Phosphor technology so the analog
benefits of a variable persistence CR T could be achieved,
and even improved upon, in our industry-leading digital
oscilloscopes and now in our RT SAs. D igital enhancements
such as intensity grading, selectable color schemes and
statistical traces communicate more information in less time.
Fundamentals of Real-Time Spectrum AnalysisPrimer
26 ww w.te ktronix.co m/rtsa

7/27/2019 Fundamentals of Real-Time Spectrum Analysis Tektronix DFT FFT Fourier
http://slidepdf.com/reader/full/fundamentals-of-real-time-spectrum-analysis-tektronix-dft-fft-fourier 27/52
Fundamentals of R eal-Time Spectrum AnalysisPrimer
27ww w.te ktronix.co m/rtsa
A m p
l i t u d e
Frequency
1 1 1 1 1 1
1 1
1 1
1
A m p
l i t u d e
Frequency
9 9 9 9 9 9
7
1
1
8
1
5
1
1
2
7
1
1
2
4
1
1
1
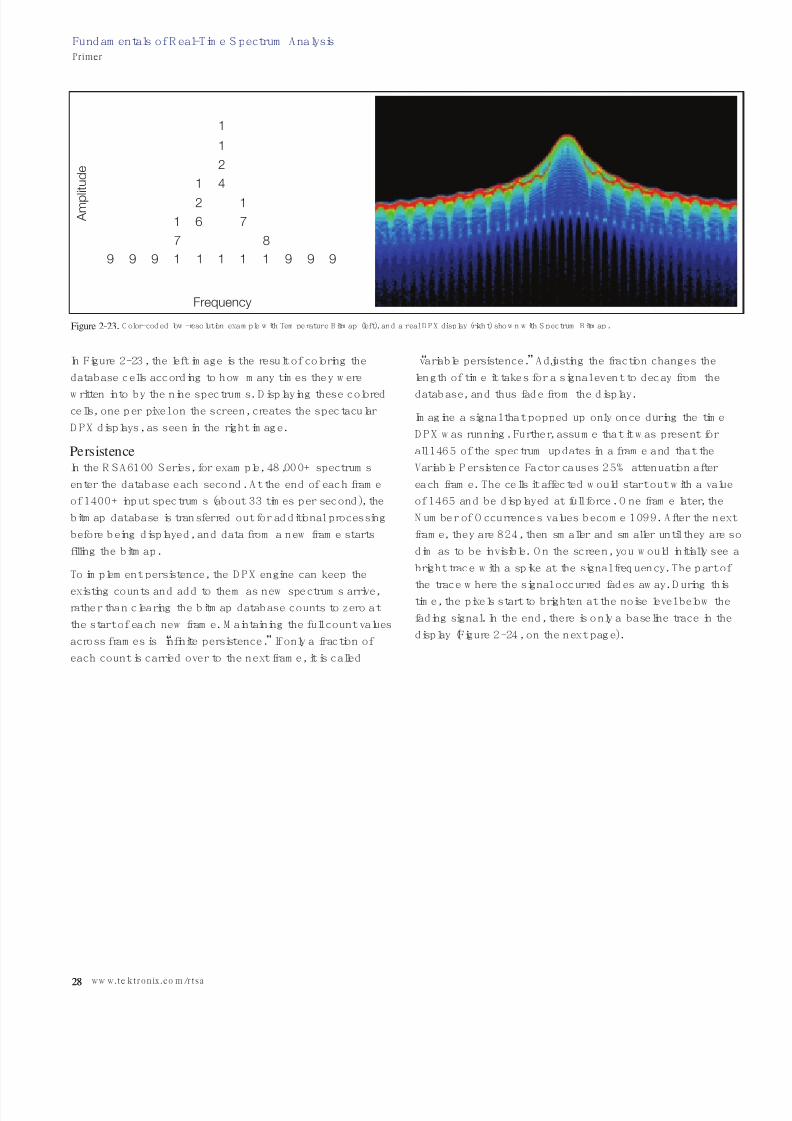
Figure 2-21. Example 3-D B itmap D atabase after 1 (left) and 9 (right) updates. Note that each column contains the same total number of “hits.”
The DPX Display Engine
Performing thousands of spectral measurements per second
and updating the screen at a live rate is an oversimplified
description of the role DP X technology performs in an RTSA.
Thousands of acquisitions are taken and transformed into
spectrums every second. T his high transform rate is the key
to detecting infrequent events, but it is far too fast for the
LC D to keep up with, and it is well beyond what human eyes
can perceive. So the incoming spectrums are written into a
bitmap database at full speed then transferred to the screen
at a viewable rate. P icture the bitmap database as a dense
grid created by dividing a spectrum graph into rows
representing trace amplitude values and columns for
points on the frequency axis. Each cell in this grid containsthe count of how many times it was hit by an incoming
spectrum. Tracking these counts is how D igital Phosphor
implements proportionality, so you can visually distinguish
rare transients from normal signals and background noise.
The actual 3-D database in an RTSA contains hundreds
of columns and rows, but we will use an 11X10 matrix to
illustrate the concept. The picture on the left in Figure 2-21
shows what the database cells might contain after a single
spectrum is mapped into it. Blank cells contain the value
zero, meaning that no points from a spectrum have fallen
into them yet.
The grid on the right shows values that our simplified
database might contain after an additional eight spectral
transforms have been performed and their results stored
in the cells. O ne of the nine spectrums happened to be
computed at a time during which the signal was absent,
as you can see by the string of “1” values at the noise floor.
When we map the Number of O ccurrences values to a color
scale, data turns into information. T he table found in Figure
2-22 shows the color-mapping algorithm that will be used
for this example. Warmer colors (red, orange, yellow) indicate
more occurrences. O ther intensity-grading schemes can also
be used.
Number of Occurrences Color
0 black
1 blue
2 light blue
3 cyan
4 green blue
5 green
6 yellow
7 orange
8 red orange
9 red
Figure 2-22. Example C olor-M apping Algorithm.
7/27/2019 Fundamentals of Real-Time Spectrum Analysis Tektronix DFT FFT Fourier
http://slidepdf.com/reader/full/fundamentals-of-real-time-spectrum-analysis-tektronix-dft-fft-fourier 28/52
28
Fundamentals of Real-Time Spectrum AnalysisPrimer
28 ww w.te ktronix.co m/rtsa
In Figure 2-23, the left image is the result of coloring the
database cells according to how many times they were
written into by the nine spectrums. D isplaying these colored
cells, one per pixel on the screen, creates the spectacular
DPX displays, as seen in the right image.
Persistence
In the RSA 6100 Series, for example, 48,000+ spectrums
enter the database each second. At the end of each frame
of 1400+ input spectrums (about 33 times per second), the
bitmap database is transferred out for additional processing
before being displayed, and data from a new frame starts
filling the bitmap.
To implement persistence, the DPX engine can keep the
existing counts and add to them as new spectrums arrive,
rather than clearing the bitmap database counts to zero at
the start of each new frame. M aintaining the full count values
across frames is “infinite persistence.” If only a fraction of
each count is carried over to the next frame, it is called
“variable persistence.” Adjusting the fraction changes the
length of time it takes for a signal event to decay from the
database, and thus fade from the display.
Imagine a signal that popped up only once during the time
DPX was running. Further, assume that it was present for
all 1465 of the spectrum updates in a frame and that the
Variable Persistence Factor causes 25% attenuation after
each frame. The cells it affected would start out with a value
of 1465 and be displayed at full force. O ne frame later, the
Number of O ccurrences values become 1099. After the next
frame, they are 824, then smaller and smaller until they are so
dim as to be invisible. O n the screen, you would initially see a
bright trace with a spik e at the signal frequency. The part of
the trace where the signal occurred fades away. During thistime, the pixels start to brighten at the noise level below the
fading signal. In the end, there is only a baseline trace in the
display (Figure 2-24, on the next page).
A m p l i t u d e
Frequency
9 9 9 9
87
9 91
1 6 7
1 1 1
12
1 4
2
1
1
1
Figure 2-23. C olor-coded low-resolution example with Temperature Bitmap (left), and a real DP X display (right) shown with Spectrum Bitmap.
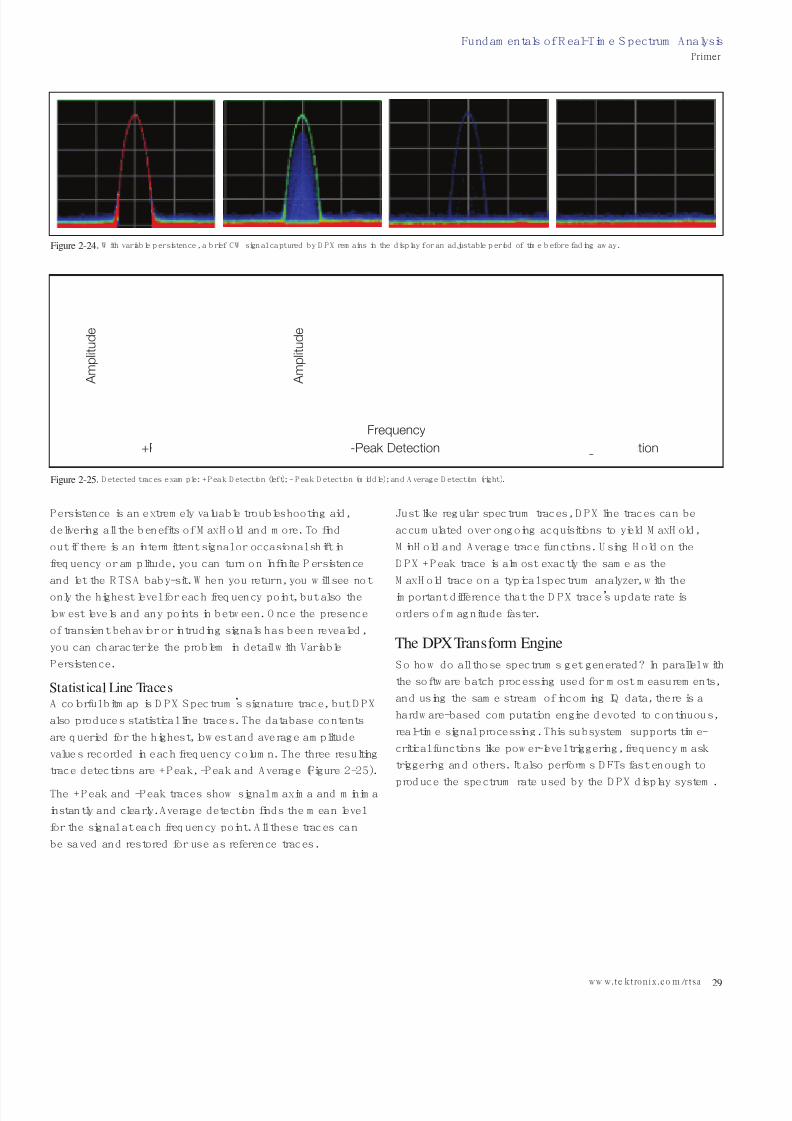
7/27/2019 Fundamentals of Real-Time Spectrum Analysis Tektronix DFT FFT Fourier
http://slidepdf.com/reader/full/fundamentals-of-real-time-spectrum-analysis-tektronix-dft-fft-fourier 29/52
Fundamentals of R eal-Time Spectrum AnalysisPrimer
29ww w.te ktronix.co m/rtsa
Persistence is an extremely valuable troubleshooting aid,
delivering all the benefits of M axH old and more. To find
out if there is an intermittent signal or occasional shift in
frequency or amplitude, you can turn on Infinite Persistence
and let the RTSA baby-sit. When you return, you will see not
only the highest level for each frequency point, but also the
lowest levels and any points in between. O nce the presence
of transient behavior or intruding signals has been revealed,
you can characterize the problem in detail with Variable
Persistence.
Statistical Line Traces
A colorful bitmap is DPX Spectrum’s signature trace, but DPX
also produces statistical line traces. The database contents
are queried for the highest, lowest and average amplitude
values recorded in each frequency column. The three resulting
trace detections are +P eak, -Peak and Average (Figure 2-25).
The +P eak and -Peak traces show signal maxima and minima
instantly and clearly. Average detection finds the mean level
for the signal at each frequency point. All these traces can
be saved and restored for use as reference traces.
Just like regular spectrum traces, DPX line traces can be
accumulated over ongoing acquisitions to yield M axH old,
M inHold and Average trace functions. Using Hold on the
DPX + P eak trace is almost exactly the same as the
M axH old trace on a typical spectrum analyzer, with the
important difference that the DPX trace’s update rate is
orders of magnitude faster.
The DPX Transform Engine
So how do all those spectrums get generated? In parallel with
the software batch processing used for most measurements,
and using the same stream of incoming IQ data, there is a
hardware-based computation engine devoted to continuous,
real-time signal processing. This subsystem supports time-
critical functions like power-level triggering, frequency mask
triggering and others. It also performs DFTs fast enough to
produce the spectrum rate used by the DP X display system.
Figure 2-24. With variable persistence, a brief C W signal captured by DP X remains in the display for an adjustable period of time before fading away.
A m p l i t u d e
Frequency
+Peak Detection
A m p l i t u d e
Frequency
+Average Detection
A m p l i t u d e
Frequency
-Peak Detection
Figure 2-25. Detected traces example: +Peak Detection (left); - Peak D etection (middle); and Average Detection (right).
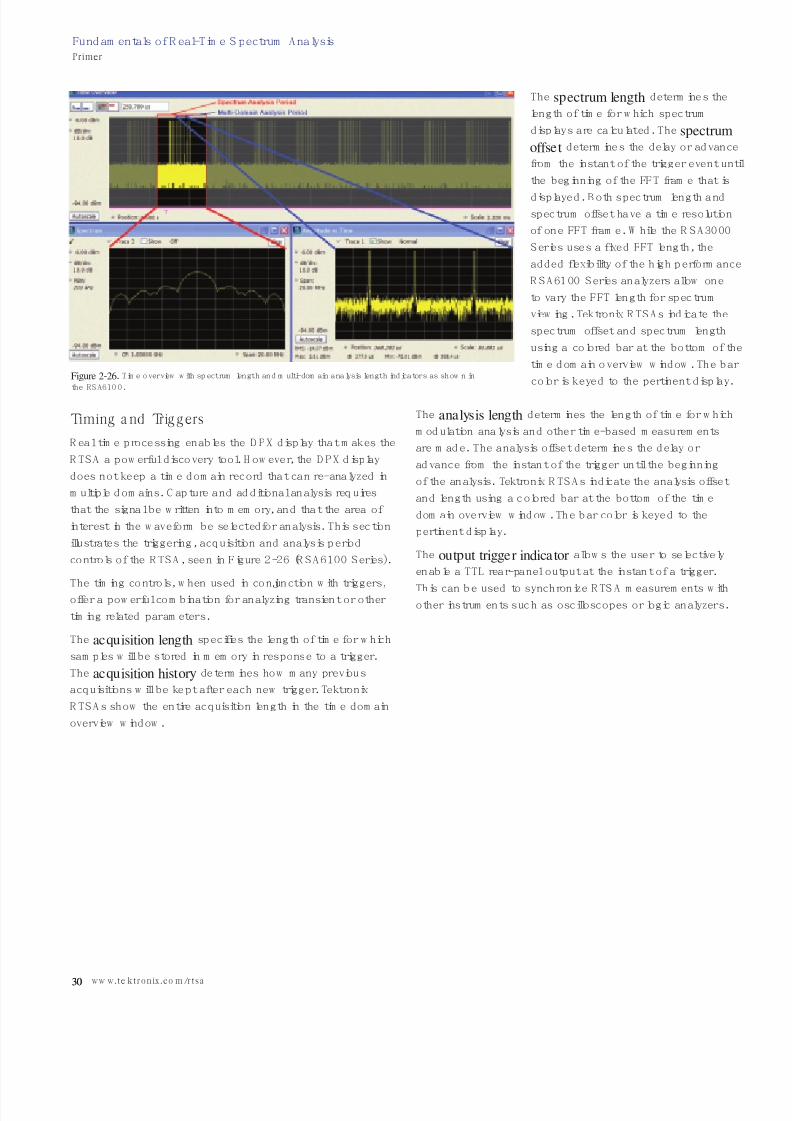
7/27/2019 Fundamentals of Real-Time Spectrum Analysis Tektronix DFT FFT Fourier
http://slidepdf.com/reader/full/fundamentals-of-real-time-spectrum-analysis-tektronix-dft-fft-fourier 30/52
30
Fundamentals of Real-Time Spectrum AnalysisPrimer
30 ww w.te ktronix.co m/rtsa
Timing a nd Trig g ers
R eal-time processing enables the DP X display that mak es the
R TSA a powerful discovery tool. However, the DP X display
does not keep a time domain record that can re-analyzed in
multiple domains. C apture and additional analysis requires
that the signal be written into memory, and that the area of
interest in the waveform be selectedfor analysis. T his section
illustrates the triggering, acquisition and analysis period
controls of the RTSA, seen in Figure 2-26 (RSA6100 Series).
The timing controls, when used in conjunction with triggers,offer a powerful combination for analyzing transient or other
timing related parameters.
The acquisition length specifies the length of time for which
samples will be stored in memory in response to a trigger.
The acquisition history determines how many previous
acquisitions will be kept after each new trigger. Tektronix
R TSAs show the entire acquisition length in the time domain
overview window.
The spectrum length determines the
length of time for which spectrum
displays are calculated. T he spectrum
offset determines the delay or advance
from the instant of the trigger event until
the beginning of the FFT frame that is
displayed. Both spectrum length and
spectrum offset have a time resolution
of one FFT frame. While the RSA 3000
Series uses a fixed FFT length, the
added flexibility of the high performance
R SA6100 Series analyzers allow one
to vary the FFT length for spectrum
viewing. Tektronix RTSAs indicate the
spectrum offset and spectrum length
using a colored bar at the bottom of the
time domain overview window. T he bar
color is keyed to the pertinent display.
The analysis length determines the length of time for which
modulation analysis and other time-based measurements
are made. The analysis offset determines the delay or
advance from the instant of the trigger until the beginning
of the analysis. Tektronix R TSAs indicate the analysis offset
and length using a colored bar at the bottom of the time
domain overview window. The bar color is keyed to the
pertinent display.
The output trigger indicator allows the user to selectively
enable a TTL rear-panel output at the instant of a trigger.
This can be used to synchronize RTSA measurements withother instruments such as oscilloscopes or logic analyzers.
Figure 2-26. T ime overview with spectrum length and multi-domain analysis length indicators as shown in
the RSA 6100.

7/27/2019 Fundamentals of Real-Time Spectrum Analysis Tektronix DFT FFT Fourier
http://slidepdf.com/reader/full/fundamentals-of-real-time-spectrum-analysis-tektronix-dft-fft-fourier 31/52
Fundamentals of R eal-Time Spectrum AnalysisPrimer
31ww w.te ktronix.co m/rtsa
Real-Time Triggering and Acquisition
The RT SA is capable of performing time, spectrum, and
modulation analysis. Triggering is critical to capturing time
domain information. T he RTSA offers unique trigger functionality,
providing power and FM Ts as well as the usual power, external
and level-based triggers.
The most common trigger system is the one used in most
oscilloscopes. In traditional analog oscilloscopes, the signal
to be observed is fed to one input while the trigger is fed to
another. The trigger event causes the start of a horizontal
sweep while the amplitude of the signal is shown as a vertical
displacement superimposed on a calibrated graticule. In its
simplest form, analog triggering allows events that happen
after the trigger to be observed, as shown in Figure 2-27.
Input
Signal
Trigger
Oscilloscope
Display
Figure 2-27. Traditional oscilloscope triggering.
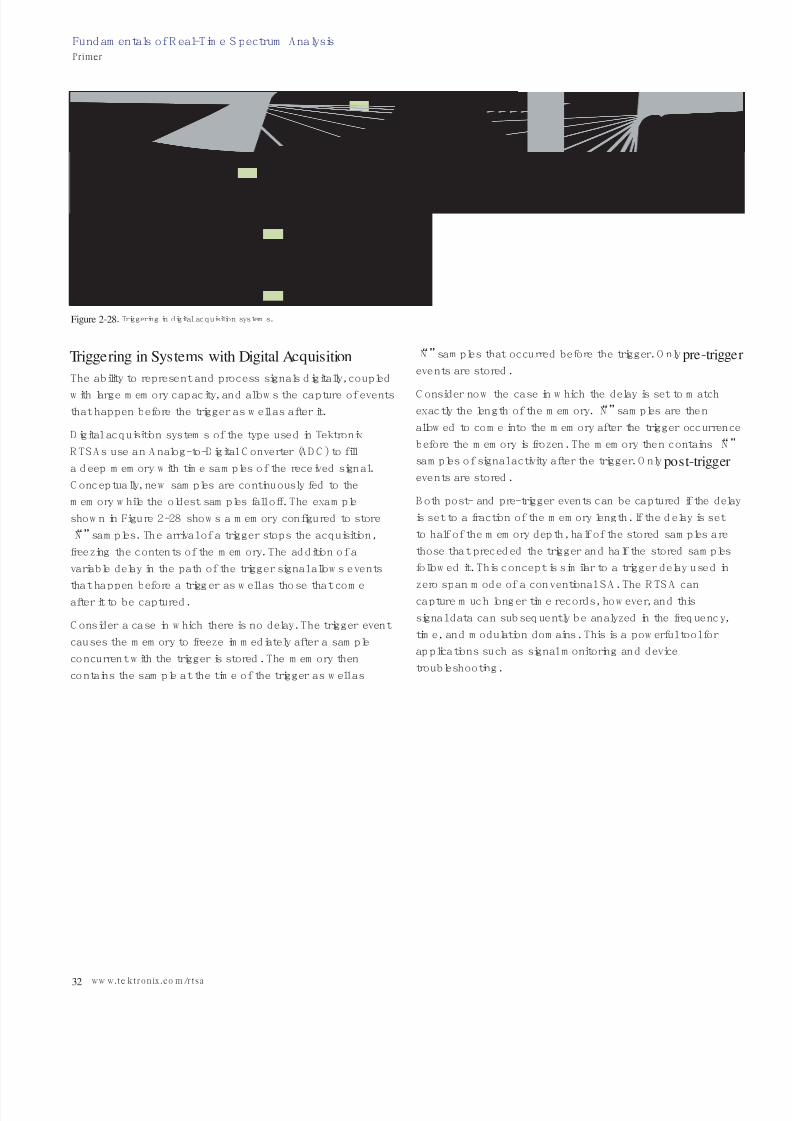
7/27/2019 Fundamentals of Real-Time Spectrum Analysis Tektronix DFT FFT Fourier
http://slidepdf.com/reader/full/fundamentals-of-real-time-spectrum-analysis-tektronix-dft-fft-fourier 32/52
Triggering in Systems with Digital Acquisition
The ability to represent and process signals digitally, coupled
with large memory capacity, and allows the capture of events
that happen before the trigger as well as after it.
D igital acquisition systems of the type used in Tektronix
R TSA s use an Analog-to-Digital C onverter (ADC ) to fill
a deep memory with time samples of the received signal.
C onceptually, new samples are continuously fed to the
memory while the oldest samples fall off. The example
shown in Figure 2-28 shows a memory configured to store
“N ” samples. The arrival of a trigger stops the acquisition,
freezing the contents of the memory. T he addition of a
variable delay in the path of the trigger signal allows events
that happen before a trigger as well as those that comeafter it to be captured.
C onsider a case in which there is no delay. The trigger event
causes the memory to freeze immediately after a sample
concurrent with the trigger is stored. The memory then
contains the sample at the time of the trigger as well as
“N ” samples that occurred before the trigger. O nly pre-trigge
events are stored.
C onsider now the case in which the delay is set to match
exactly the length of the memory. “N” samples are then
allowed to come into the memory after the trigger occurrence
before the memory is frozen. T he memory then contains “N”
samples of signal activity after the trigger. O nly post-trigger
events are stored.
Both post- and pre-trigger events can be captured if the delay
is set to a fraction of the memory length. If the delay is set
to half of the memory depth, half of the stored samples are
those that preceded the trigger and half the stored samples
followed it. This concept is similar to a trigger delay used in
zero span mode of a conventional SA. T he RT SA cancapture much longer time records, however, and this
signal data can subsequently be analyzed in the frequency,
time, and modulation domains. This is a powerful tool for
applications such as signal monitoring and device
troubleshooting.
Fundamentals of Real-Time Spectrum AnalysisPrimer
32 ww w.te ktronix.co m/rtsa
0
Fs
Trigger
Freeze T = 0 Pre-trigger samples only
Post-trigger samples only= Memory length
Half pre-trigger, half post-trigger= 50% Memory length
D
T Variable delay0 to N clocks
D
Most recent sample Older samples
First In/First Out (FIFO) Memory
Memory Control
ADC 1 2 3 4 5 6 7 8 9 10 11N-3
N NN
-2 -1
Figure 2-28. Triggering in digital acquisition systems.
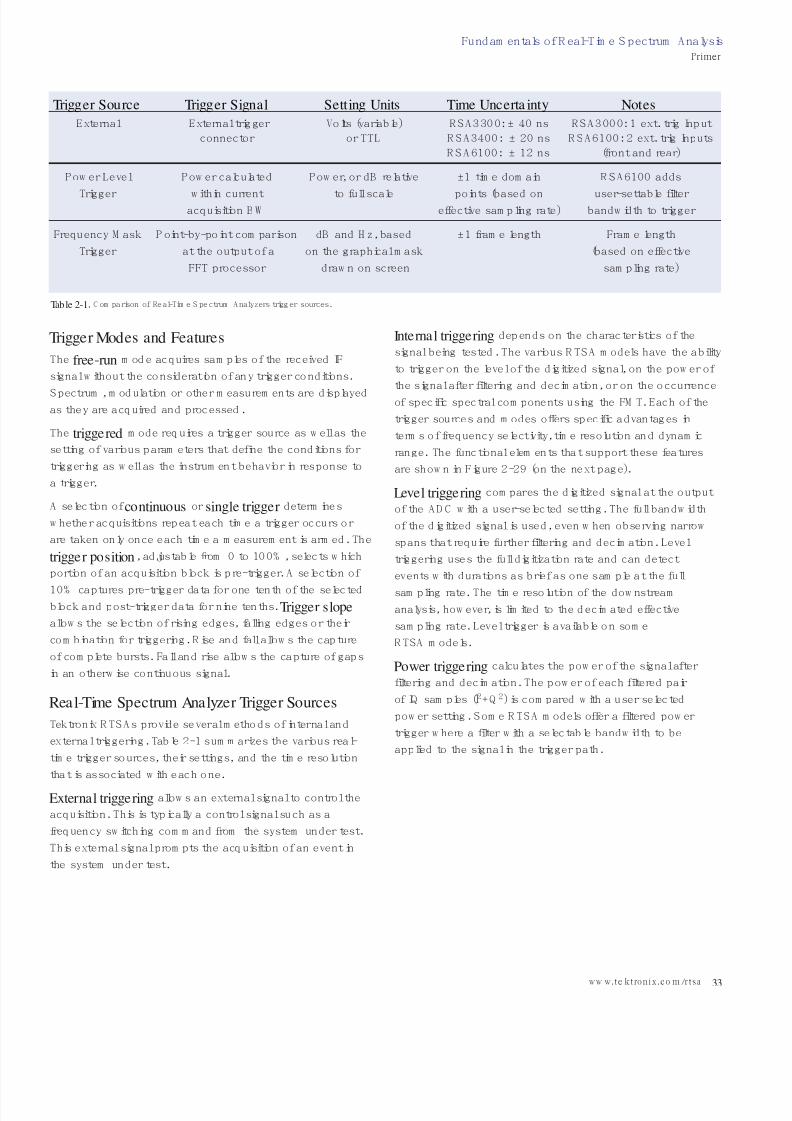
7/27/2019 Fundamentals of Real-Time Spectrum Analysis Tektronix DFT FFT Fourier
http://slidepdf.com/reader/full/fundamentals-of-real-time-spectrum-analysis-tektronix-dft-fft-fourier 33/52
Trigger Modes and Features
The free-run mode acquires samples of the received IF
signal without the consideration of any trigger conditions.
Spectrum, modulation or other measurements are displayedas they are acquired and processed.
The triggered mode requires a trigger source as well as the
setting of various parameters that define the conditions for
triggering as well as the instrument behavior in response to
a trigger.
A selection of continuous or single trigger determines
whether acquisitions repeat each time a trigger occurs or
are taken only once each time a measurement is armed. The
trigger position, adjustable from 0 to 100% , selects which
portion of an acquisition block is pre-trigger. A selection of
10% captures pre-trigger data for one tenth of the selectedblock and post-trigger data for nine tenths. Trigger slope
allows the selection of rising edges, falling edges or their
combination for triggering. R ise and fall allows the capture
of complete bursts. Fall and rise allows the capture of gaps
in an otherwise continuous signal.
Real-Time Spectrum Analyzer Trigger Sources
Tektronix RTSAs provide several methods of internal and
external triggering. Table 2-1 summarizes the various real-
time trigger sources, their settings, and the time resolution
that is associated with each one.
External triggering allows an external signal to control the
acquisition. This is typically a control signal such as a
frequency switching command from the system under test.
This external signal prompts the acquisition of an event in
the system under test.
Internal triggering depends on the characteristics of the
signal being tested. T he various R TSA models have the ability
to trigger on the level of the digitized signal, on the power of
the signal after filtering and decimation, or on the occurrence
of specific spectral components using the FM T. Each of the
trigger sources and modes offers specific advantages in
terms of frequency selectivity, time resolution and dynamic
range. The functional elements that support these features
are shown in Figure 2-29 (on the next page).
Level triggering compares the digitized signal at the output
of the ADC with a user-selected setting. T he full bandwidth
of the digitized signal is used, even when observing narrow
spans that require further filtering and decimation. Level
triggering uses the full digitization rate and can detect
events with durations as brief as one sample at the full
sampling rate. The time resolution of the downstream
analysis, however, is limited to the decimated effective
sampling rate. Level trigger is available on some
R TSA models.
Power triggering calculates the power of the signal after
filtering and decimation. The power of each filtered pair
of IQ samples (I2+Q 2) is compared with a user-selected
power setting. Some R TSA models offer a filtered power
trigger where a filter with a selectable bandwidth to be
applied to the signal in the trigger path.
Trigger Source Trigger Signal Setting Units Time Uncertainty Notes
External External trigger Volts (variable) R SA 3300: ± 40 ns R SA 3000: 1 ext. trig Input
connector or TTL R SA3400: ± 20 ns R SA6100: 2 ext. trig Inputs
R SA 6100: ± 12 ns (front and rear)
Power Level Power calculated Power, or dB relative ±1 time domain R SA6100 adds
Trigger within current to full scale points (based on user-settable filteracquisition BW effective sampling rate) bandwidth to trigger
Frequency M ask Point-by-point comparison dB and Hz, based ±1 frame length Frame length
Trigger at the output of a on the graphical mask (based on effective
FFT processor drawn on screen sampling rate)
Table 2-1. C omparison of R eal-T ime S pectrum Analyzers trigger sources.
Fundamentals of R eal-Time Spectrum AnalysisPrimer
33ww w.te ktronix.co m/rtsa

7/27/2019 Fundamentals of Real-Time Spectrum Analysis Tektronix DFT FFT Fourier
http://slidepdf.com/reader/full/fundamentals-of-real-time-spectrum-analysis-tektronix-dft-fft-fourier 34/52
Frequency mask triggering compares the spectrum shape
to a user-defined mask. T his powerful technique allows
changes in a spectrum shape to trigger an acquisition. FM Ts
can reliably detect signals far below full-scale even in the
presence of other signals at much higher levels. This ability
to trigger on weak signals in the presence of strong ones
is critical for detecting intermittent signals, the presence of
inter-modulation products, transient spectrum containment
violations and much more. A full DFT is required to compare
a signal to a mask, requiring a complete frame. The time
resolution for FM T is roughly one DFT frame. Trigger events
are determined in the frequency domain using a dedicated
hardware DFT processor, as shown in the block diagram in
Figure 2-29.
Constructing a Frequency Mask
Like other forms of mask testing, the FM T (also known
as frequency domain trigger) starts with a definition of
an on-screen mask. This definition is done with a set of
frequency points and their amplitudes. The mask can be
defined point-by-point or graphically by drawing it with a
mouse or other pointing device. Triggers can be set to occur
when a signal outside the mask boundary “breaks in,” or
when a signal inside the mask boundary “breaks out.”
Figure 2-30 shows a frequency mask defined to allow
the passage of the normal spectrum of a signal but not
momentary aberrations. O n the next page, Figure 2-31 shows
a spectrogram display for an acquisition that was triggered
when the signal momentarily exceeded the mask. Figure 2-32
shows the spectrum for the first frame where the mask was
exceeded. N ote that pre-trigger and post-trigger data were
collected and are both shown in the spectrogram.
34
Fundamentals of Real-Time Spectrum AnalysisPrimer
34 ww w.te ktronix.co m/rtsa
Memory Control
ADC
Freeze
Mask
Power
Fs effective
Fs
Fs
Level
Trigger Processing Block External
Trigger
MemoryDDC/
Decimator
Trigger
Timing and
ControlPower
FrequencyMask
HW FFT
I + Q2 2
Figure 2-29. Real-T ime S pectrum Analyzer trigger processing.
Figure 2-30. Frequency mask definition.

7/27/2019 Fundamentals of Real-Time Spectrum Analysis Tektronix DFT FFT Fourier
http://slidepdf.com/reader/full/fundamentals-of-real-time-spectrum-analysis-tektronix-dft-fft-fourier 35/52
Fundamentals of R eal-Time Spectrum AnalysisPrimer
35ww w.te ktronix.co m/rtsa
Demodulation
M odulation is the means through which R F signals carry
information. M odulation analysis using the Tektronix RTSA
not only extracts the data being transmitted but also
measures the accuracy with which signals are modulated.
M oreover, it quantifies many of the errors and impairments
that degrade modulation quality.
M odern communications systems have dramatically
increased the number of modulation formats in use. The
R TSA is capable of analyzing the most common formatsand has an architecture that allows for the analysis of new
formats as they emerge.
Amplitude, Frequency and Phase Modulation
R F carriers can transport information in many ways based on
variations in the amplitude or phase of the carrier. Frequency
is the time derivative of phase. Frequency M odulation (FM )
is therefore the time derivative of Phase M odulation (P M ).
Q uadrature Phase Shift Keying (Q PSK ) is a digital modulation
format in which the symbol decision points occur at multiples
of 90 degrees of phase. Q uadrature Amplitude M odulation
(Q AM ) is a high-order modulation format in which both
amplitude and phase are varied simultaneously to provide
multiple states. Even highly complex modulation formats
such as Orthogonal Frequency Division M ultiplexing (O FDM )
can be decomposed into magnitude and phase components.
M agnitude and phase can be thought of as the length and
the angle of a vector in a polar coordinate system. Thesame point can be expressed in Cartesian or rectangular
coordinates (X,Y ). The IQ format of the time samples stored
in memory by the RTSA are mathematically equivalent to
C artesian coordinates with I representing the horizontal or
X component and Q the vertical or Y component.
Figure 2-31. Spectrogram showing a transient signal adjacent to the carrier. The
cursor is set to the trigger point, so pre-trigger data is displayed above the cursor line,
and post-trigger data is displayed below the cursor line. The narrow white line at the
left of the blue area denotes post-trigger data.
Figure 2-32. O ne frame of the spectrogram showing the trigger event where the
transient signal breaks the boundary of the frequency mask.
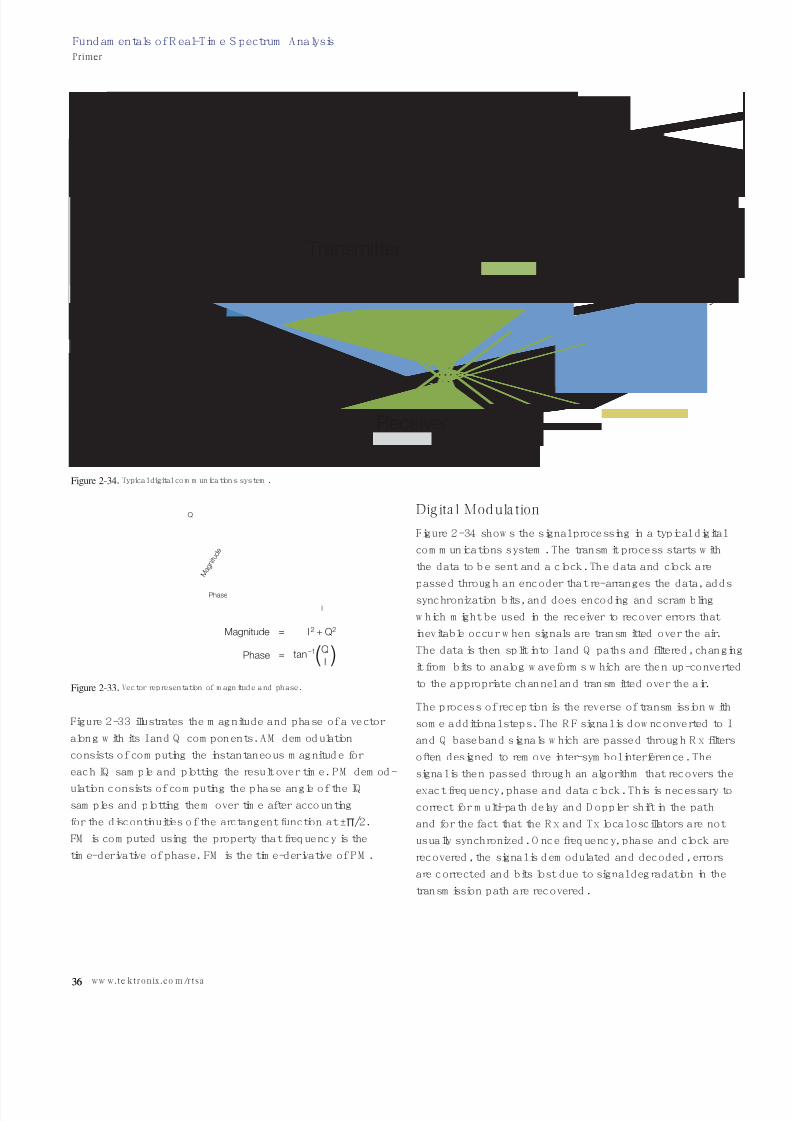
7/27/2019 Fundamentals of Real-Time Spectrum Analysis Tektronix DFT FFT Fourier
http://slidepdf.com/reader/full/fundamentals-of-real-time-spectrum-analysis-tektronix-dft-fft-fourier 36/52
36
Fundamentals of Real-Time Spectrum AnalysisPrimer
36 ww w.te ktronix.co m/rtsa
Figure 2-33 illustrates the magnitude and phase of a vector
along with its I and Q components. AM demodulation
consists of computing the instantaneous magnitude for
each IQ sample and plotting the result over time. P M demod-
ulation consists of computing the phase angle of the IQ
samples and plotting them over time after accounting
for the discontinuities of the arctangent function at ±P/2.
FM is computed using the property that frequency is the
time-derivative of phase. FM is the time-derivative of PM .
Dig ita l Modula tion
Figure 2-34 shows the signal processing in a typical digital
communications system. T he transmit process starts with
the data to be sent and a clock. The data and clock are
passed through an encoder that re-arranges the data, addssynchronization bits, and does encoding and scrambling
which might be used in the receiver to recover errors that
inevitable occur when signals are transmitted over the air.
The data is then split into I and Q paths and filtered, changing
it from bits to analog waveforms which are then up-converted
to the appropriate channel and transmitted over the air.
The process of reception is the reverse of transmission with
some additional steps. T he RF signal is downconverted to I
and Q baseband signals which are passed through R x filters
often designed to remove inter-symbol interference. T he
signal is then passed through an algorithm that recovers the
exact frequency, phase and data clock. This is necessary to
correct for multi-path delay and D oppler shift in the path
and for the fact that the Rx and T x local oscillators are not
usually synchronized. O nce frequency, phase and clock are
recovered, the signal is demodulated and decoded, errors
are corrected and bits lost due to signal degradation in the
transmission path are recovered.
Data
Clock
Data
Clock
Encoder Demux
Demod
Symbol
Symbol
Clock
Decoder
I
Q
I
Q
Mod Filter TX Signal
I n t e
r f e r e
n c e
D o p p l e r
S h i f t
Noise
O t h e r E r r o r s
IQUp-Conversion
LocalOscillator
LocalOscillator
Mod Filter
Rx Filter
Rx Filter
IQDown-
conversion
FrequencyPhase &
Clock Recovery
Receiver
Transmitter
Figure 2-34. Typical digital communications system.
Q
I
Phase
Magnitude = I
I( )
2
–1
2+ Q
Q= tanPhase
M a g
n i t u
d e
Figure 2-33. Vector representation of magnitude and phase.
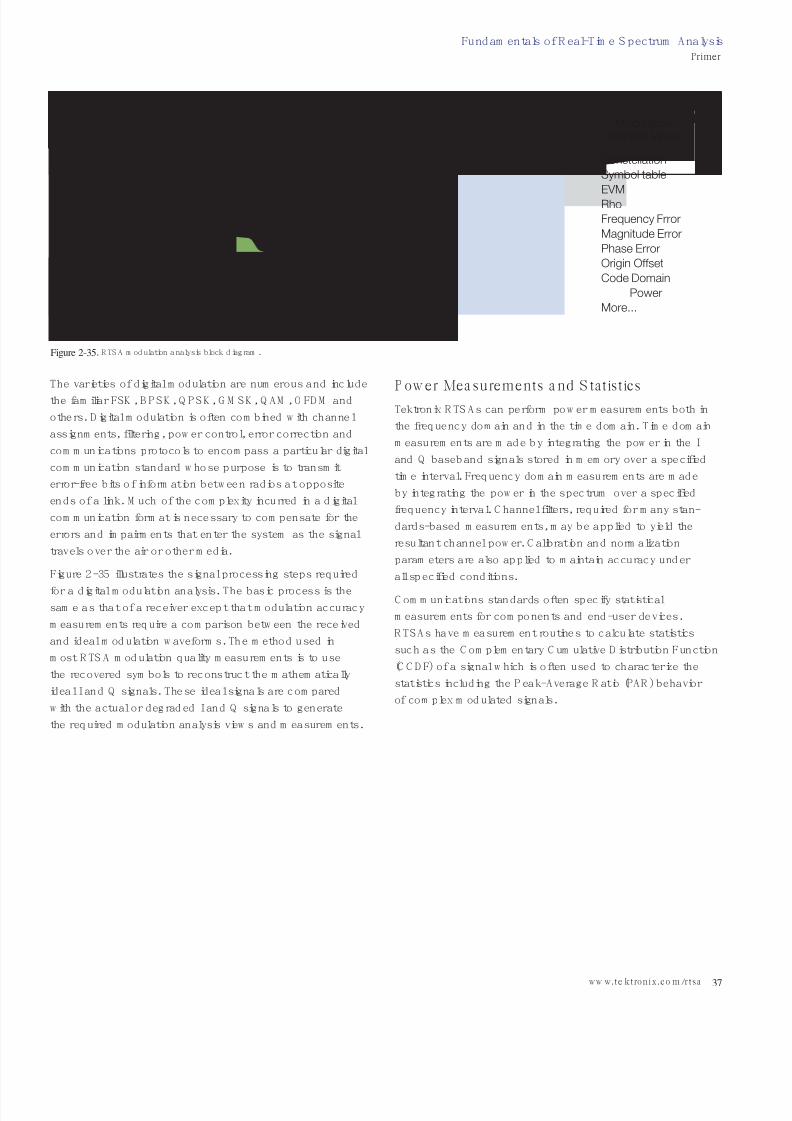
7/27/2019 Fundamentals of Real-Time Spectrum Analysis Tektronix DFT FFT Fourier
http://slidepdf.com/reader/full/fundamentals-of-real-time-spectrum-analysis-tektronix-dft-fft-fourier 37/52
Fundamentals of R eal-Time Spectrum AnalysisPrimer
37ww w.te ktronix.co m/rtsa
The varieties of digital modulation are numerous and include
the familiar FSK , BPSK , Q PSK , G M SK , Q AM , O FDM and
others. D igital modulation is often combined with channel
assignments, filtering, power control, error correction and
communications protocols to encompass a particular digital
communication standard whose purpose is to transmit
error-free bits of information between radios at opposite
ends of a link. M uch of the complexity incurred in a digital
communication format is necessary to compensate for the
errors and impairments that enter the system as the signal
travels over the air or other media.
Figure 2-35 illustrates the signal processing steps required
for a digital modulation analysis. The basic process is the
same as that of a receiver except that modulation accuracy
measurements require a comparison between the received
and ideal modulation waveforms. T he method used in
most RTSA modulation quality measurements is to use
the recovered symbols to reconstruct the mathematically
ideal I and Q signals. T hese ideal signals are compared
with the actual or degraded I and Q signals to generate
the required modulation analysis views and measurements.
P ow er Mea surements a nd S tatisticsTektronix R TSAs can perform power measurements both in
the frequency domain and in the time domain. T ime domain
measurements are made by integrating the power in the I
and Q baseband signals stored in memory over a specified
time interval. Frequency domain measurements are made
by integrating the power in the spectrum over a specified
frequency interval. C hannel filters, required for many stan-
dards-based measurements, may be applied to yield the
resultant channel power. C alibration and normalization
parameters are also applied to maintain accuracy under
all specified conditions.
C ommunications standards often specify statistical
measurements for components and end-user devices.
R TSAs have measurement routines to calculate statistics
such as the Complementary C umulative Distribution Function
(C C DF) of a signal which is often used to characterize the
statistics including the Peak -Average R atio (PA R ) behavior
of complex modulated signals.
Demod
Compare
IQUp-Conversion
LocalOscillator
Rx Filter
RTSA Modulation Analysis
Rx Filter
Actual Q
Actual I
Ideal I Ideal Q
Q
I
Frequency,Phase &
Clock Recovery
Ideal SignalReconstruction
Constellation
Symbol table
EVM
Rho
Frequency Frror
Magnitude Error
Phase Error
Origin Offset
Code Domain
Power
More...
Modulation Analysis Views
Figure 2-35. R TS A modulation analysis block diagram.
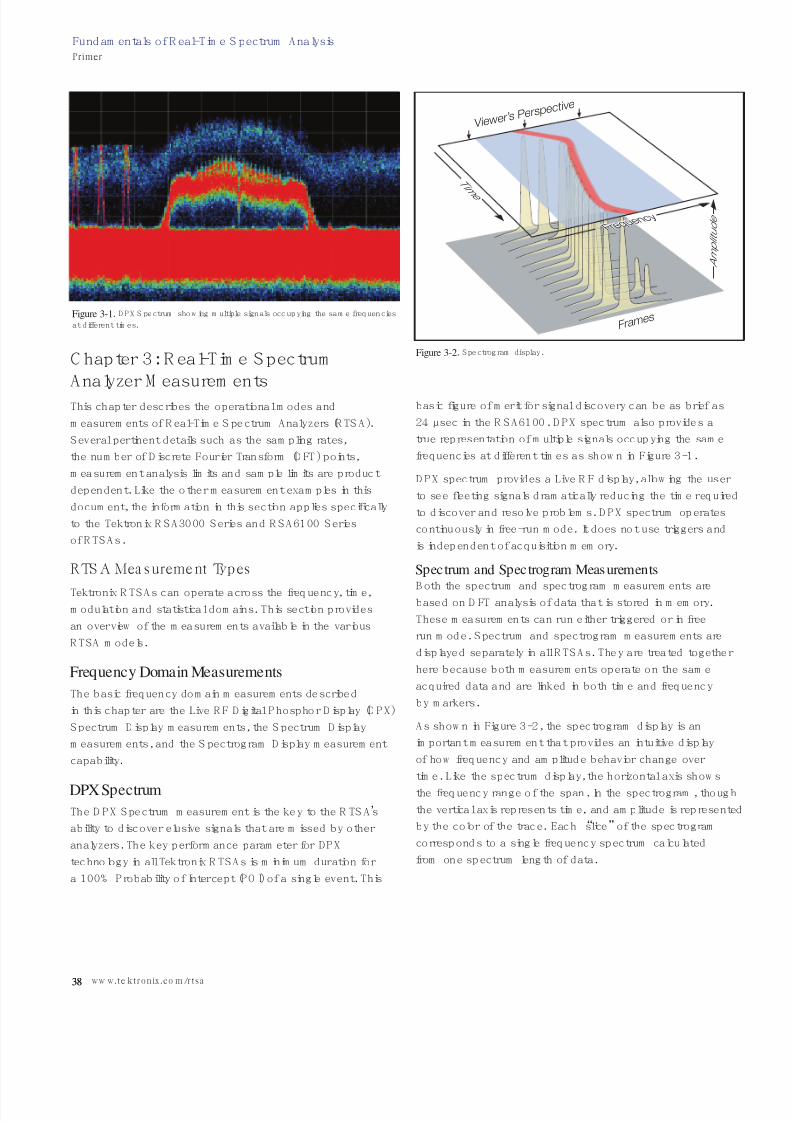
7/27/2019 Fundamentals of Real-Time Spectrum Analysis Tektronix DFT FFT Fourier
http://slidepdf.com/reader/full/fundamentals-of-real-time-spectrum-analysis-tektronix-dft-fft-fourier 38/52
38
Fundamentals of Real-Time Spectrum AnalysisPrimer
38 ww w.te ktronix.co m/rtsa
C hapter 3: R eal-T ime Spectrum
Analyzer M easurements
This chapter describes the operational modes and
measurements of R eal-Time Spectrum Analyzers (RTSA ).
Several pertinent details such as the sampling rates,
the number of D iscrete Fourier Transform (D FT ) points,
measurement analysis limits and sample limits are product
dependent. Like the other measurement examples in this
document, the information in this section applies specifically
to the Tektronix R SA 3000 Series and RSA 6100 Series
of RTSAs.
RTS A Mea sureme nt Types
Tektronix R TSAs can operate across the frequency, time,
modulation and statistical domains. T his section provides
an overview of the measurements available in the various
RTSA models.
Frequency Domain Measurements
The basic frequency domain measurements described
in this chapter are the Live R F Digital Phosphor Display (D PX)
Spectrum D isplay measurements, the Spectrum D isplay
measurements, and the Spectrogram Display measurement
capability.
DPX Spectrum
The DP X S pectrum measurement is the key to the R TSA’s
ability to discover elusive signals that are missed by other
analyzers. T he key performance parameter for DPX
technology in all Tektronix RTSAs is minimum duration for
a 100% Probability of Intercept (PO I) of a single event. This
basic figure of merit for signal discovery can be as brief as
24 µsec in the RSA6100. DPX spectrum also provides a
true representation of multiple signals occupying the same
frequencies at different times as shown in Figure 3-1.
DPX spectrum provides a Live R F display, allowing the user
to see fleeting signals dramatically reducing the time required
to discover and resolve problems. D PX spectrum operates
continuously in free-run mode. It does not use triggers and
is independent of acquisition memory.
Spectrum and Spectrogram Measurements
Both the spectrum and spectrogram measurements arebased on D FT analysis of data that is stored in memory.
These measurements can run either triggered or in free
run mode. Spectrum and spectrogram measurements are
displayed separately in all RTSAs. T hey are treated together
here because both measurements operate on the same
acquired data and are linked in both time and frequency
by markers.
As shown in Figure 3-2, the spectrogram display is an
important measurement that provides an intuitive display
of how frequency and amplitude behavior change over
time. L ike the spectrum display, the horizontal axis shows
the frequency range of the span. In the spectrogram, though
the vertical axis represents time, and amplitude is represented
by the color of the trace. Each “slice” of the spectrogram
corresponds to a single frequency spectrum calculated
from one spectrum length of data.
Figure 3-1. DP X S pectrum showing multiple signals occupying the same frequencies
at d ifferent times.
Figure 3-2. Spectrogram display.
V iewer’s Perspect
ive
T i m
e
A m p l i t u d e
Frames
F r e q u e n
c y
Freque
ncy
F r e q u e n
c y
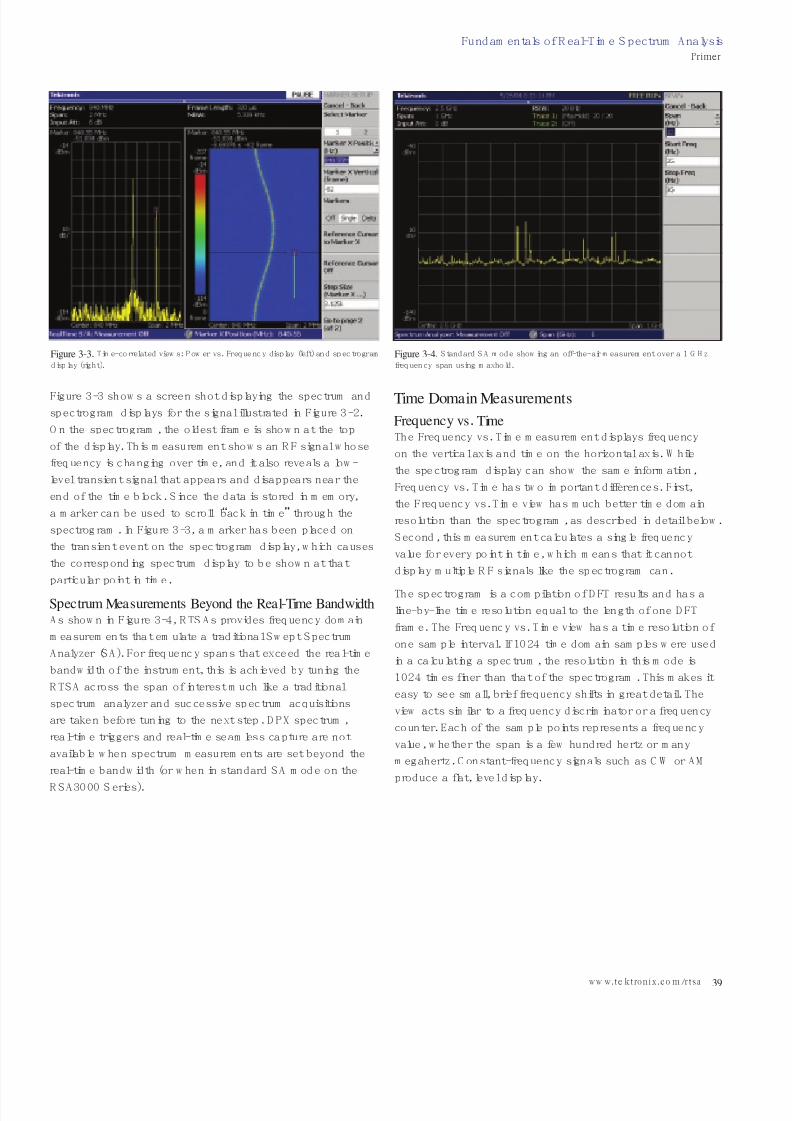
7/27/2019 Fundamentals of Real-Time Spectrum Analysis Tektronix DFT FFT Fourier
http://slidepdf.com/reader/full/fundamentals-of-real-time-spectrum-analysis-tektronix-dft-fft-fourier 39/52
Fundamentals of R eal-Time Spectrum AnalysisPrimer
39ww w.te ktronix.co m/rtsa
Figure 3-3 shows a screen shot displaying the spectrum and
spectrogram displays for the signal illustrated in Figure 3-2.
O n the spectrogram, the oldest frame is shown at the top
of the display. This measurement shows an RF signal whose
frequency is changing over time, and it also reveals a low-
level transient signal that appears and disappears near the
end of the time block. S ince the data is stored in memory,
a marker can be used to scroll “back in time” through the
spectrogram. In Figure 3-3, a marker has been placed on
the transient event on the spectrogram display, which causes
the corresponding spectrum display to be shown at that
particular point in time.
Spectrum Measurements Beyond the Real-Time Bandwidth
As shown in Figure 3-4, R TSAs provides frequency domain
measurements that emulate a traditional Swept Spectrum
Analyzer (SA ). For frequency spans that exceed the real-time
bandwidth of the instrument, this is achieved by tuning the
R TSA across the span of interest much like a traditional
spectrum analyzer and successive spectrum acquisitions
are taken before tuning to the next step. D PX spectrum,
real-time triggers and real-time seamless capture are not
available when spectrum measurements are set beyond the
real-time bandwidth (or when in standard SA mode on the
R SA 3000 Series).
Time Domain Measurements
Frequency vs. Time
The Frequency vs. T ime measurement displays frequency
on the vertical axis and time on the horizontal axis. While
the spectrogram display can show the same information,
Frequency vs. T ime has two important differences. First,
the Frequency vs. T ime view has much better time domain
resolution than the spectrogram, as described in detail below.
Second, this measurement calculates a single frequency
value for every point in time, which means that it cannot
display multiple RF signals like the spectrogram can.
The spectrogram is a compilation of DFT results and has a
line-by-line time resolution equal to the length of one D FT
frame. T he Frequency vs. T ime view has a time resolution of
one sample interval. If 1024 time domain samples were used
in a calculating a spectrum, the resolution in this mode is
1024 times finer than that of the spectrogram. This makes it
easy to see small, brief frequency shifts in great detail. The
view acts similar to a frequency discriminator or a frequency
counter. Each of the sample points represents a frequency
value, whether the span is a few hundred hertz or many
megahertz. C onstant-frequency signals such as CW or AM
produce a flat, level display.
Figure 3-3. T ime-correlated views: P ower vs. Frequency display (left) and spectrogram
display (right).
Figure 3-4. Standard SA mode showing an off-the-air measurement over a 1 GH z
frequency span using maxhold.
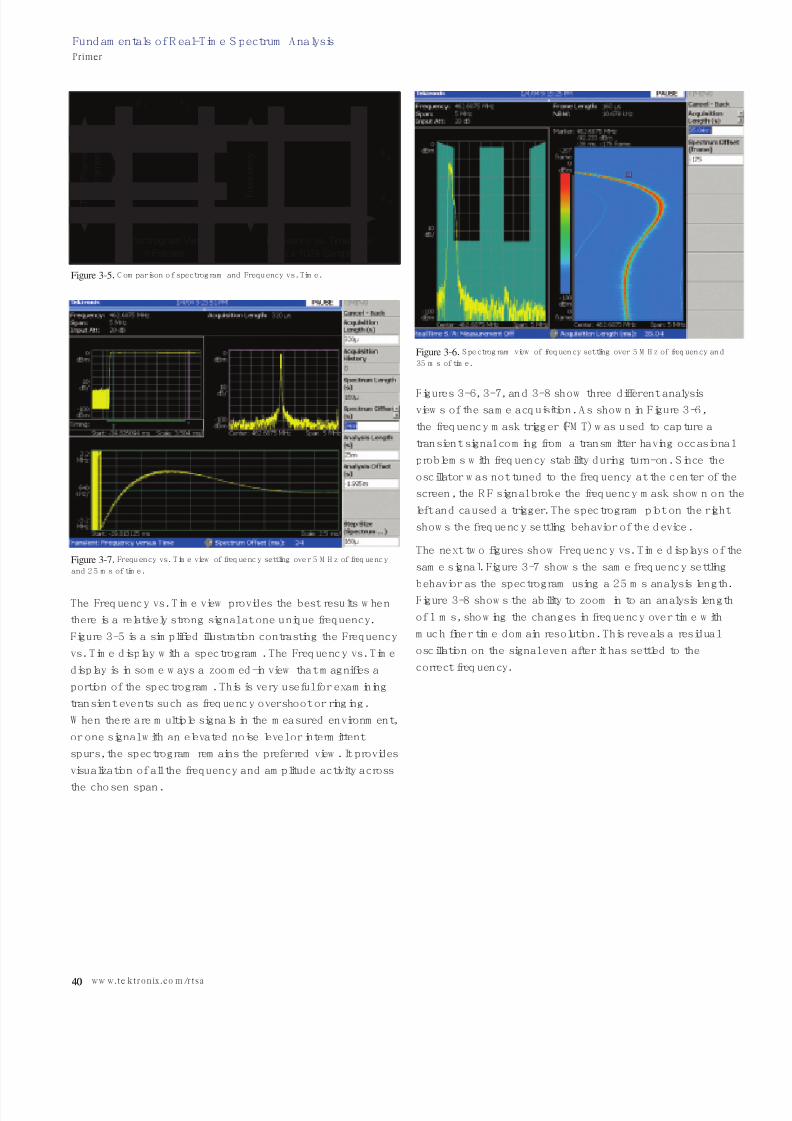
7/27/2019 Fundamentals of Real-Time Spectrum Analysis Tektronix DFT FFT Fourier
http://slidepdf.com/reader/full/fundamentals-of-real-time-spectrum-analysis-tektronix-dft-fft-fourier 40/52
The Frequency vs. T ime view provides the best results when
there is a relatively strong signal at one unique frequency.
Figure 3-5 is a simplified illustration contrasting the Frequency
vs. T ime display with a spectrogram. The Frequency vs. T ime
display is in some ways a zoomed-in view that magnifies a
portion of the spectrogram. This is very useful for examining
transient events such as frequency overshoot or ringing.
When there are multiple signals in the measured environment,
or one signal with an elevated noise level or intermittent
spurs, the spectrogram remains the preferred view. It provides
visualization of all the frequency and amplitude activity across
the chosen span.
Figures 3-6, 3-7, and 3-8 show three different analysisviews of the same acquisition. A s shown in Figure 3-6,
the frequency mask trigger (FM T ) was used to capture a
transient signal coming from a transmitter having occasional
problems with frequency stability during turn-on. Since the
oscillator was not tuned to the frequency at the center of the
screen, the R F signal broke the frequency mask shown on the
left and caused a trigger. T he spectrogram plot on the right
shows the frequency settling behavior of the device.
The next two figures show Frequency vs. T ime displays of the
same signal. Figure 3-7 shows the same frequency settling
behavior as the spectrogram using a 25 ms analysis length.Figure 3-8 shows the ability to zoom in to an analysis length
of 1 ms, showing the changes in frequency over time with
much finer time domain resolution. This reveals a residual
oscillation on the signal even after it has settled to the
correct frequency.
40
Fundamentals of Real-Time Spectrum AnalysisPrimer
40 ww w.te ktronix.co m/rtsa
F 1
F 1
2F
Frequency
F
r e q u e n c y
T i m
e ( F r a m e s )
m
F r a m e s
Spectrogram View
n Frames
Frequency vs. Time View
m x 1024 Samples
Time (Samples)
2F
Figure 3-5. C omparison of spectrogram and Frequency vs. T ime.
Figure 3-6. Spectrogram view of frequency settling over 5 M Hz of frequency and
35 ms of time.
Figure 3-7. Frequency vs. T ime view of frequency settling over 5 M Hz of frequency
and 25 ms of time.
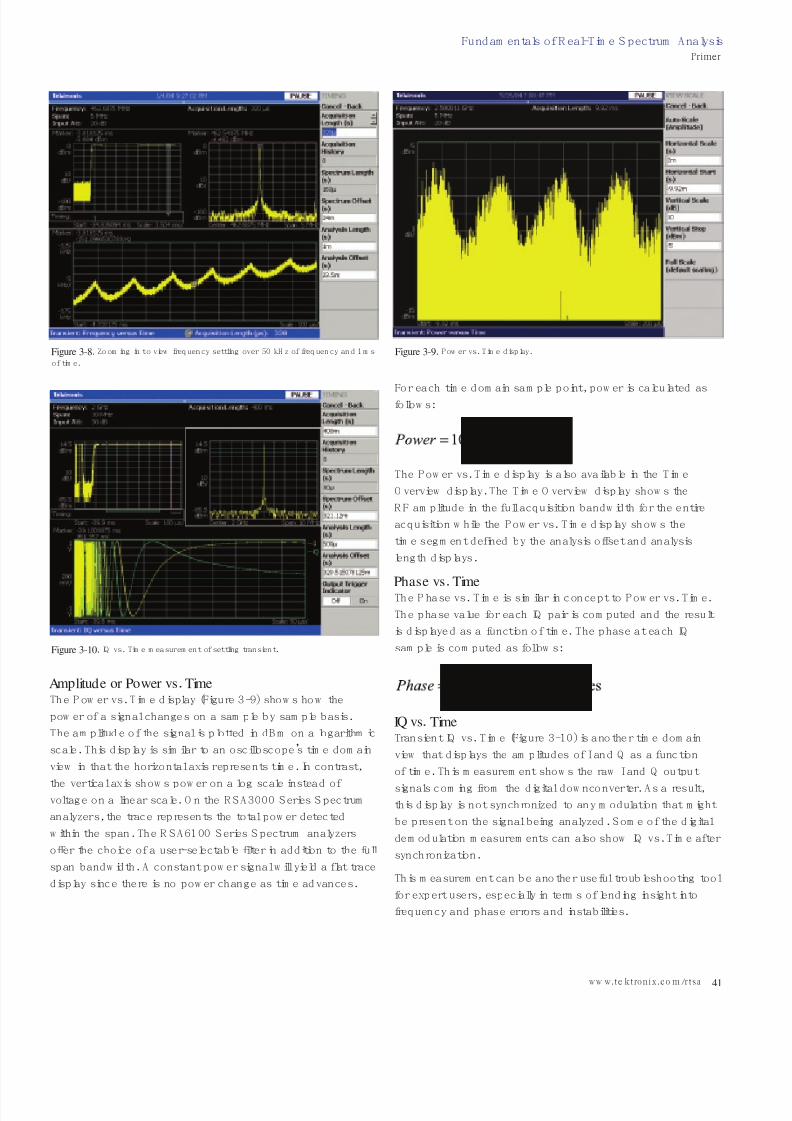
7/27/2019 Fundamentals of Real-Time Spectrum Analysis Tektronix DFT FFT Fourier
http://slidepdf.com/reader/full/fundamentals-of-real-time-spectrum-analysis-tektronix-dft-fft-fourier 41/52
Amplitude or Power vs. Time
The Power vs. T ime display (Figure 3-9) shows how the
power of a signal changes on a sample by sample basis.
The amplitude of the signal is plotted in dBm on a logarithmic
scale. T his display is similar to an oscilloscope’s time domain
view in that the horizontal axis represents time. In contrast,
the vertical axis shows power on a log scale instead of voltage on a linear scale. O n the RS A3000 Series Spectrum
analyzers, the trace represents the total power detected
within the span. T he RSA6100 Series Spectrum analyzers
offer the choice of a user-selectable filter in addition to the full
span bandwidth. A constant power signal will yield a flat trace
display since there is no power change as time advances.
For each time domain sample point, power is calculated asfollows:
The Power vs. T ime display is also available in the Time
O verview display. The T ime O verview display shows the
RF amplitude in the full acquisition bandwidth for the entire
acquisition while the Power vs. T ime display shows the
time segment defined by the analysis offset and analysis
length displays.
Phase vs. Time
The Phase vs. T ime is similar in concept to Power vs. T ime.
The phase value for each IQ pair is computed and the result
is displayed as a function of time. The phase at each IQ
sample is computed as follows:
IQ vs. Time
Transient IQ vs. T ime (Figure 3-10) is another time domain
view that displays the amplitudes of I and Q as a function
of time. This measurement shows the raw I and Q output
signals coming from the digital downconverter. As a result,
this display is not synchronized to any modulation that might
be present on the signal being analyzed. Some of the digital
demodulation measurements can also show IQ vs. T ime after
synchronization.
This measurement can be another useful troubleshooting tool
for expert users, especially in terms of lending insight into
frequency and phase errors and instabilities.
Fundamentals of R eal-Time Spectrum AnalysisPrimer
41ww w.te ktronix.co m/rtsa
Figure 3-8. Zooming in to view frequency settling over 50 kH z of frequency and 1ms
of time.
Figure 3-9. Power vs. T ime display.
Figure 3-10. IQ vs. T ime measurement of settling transient.
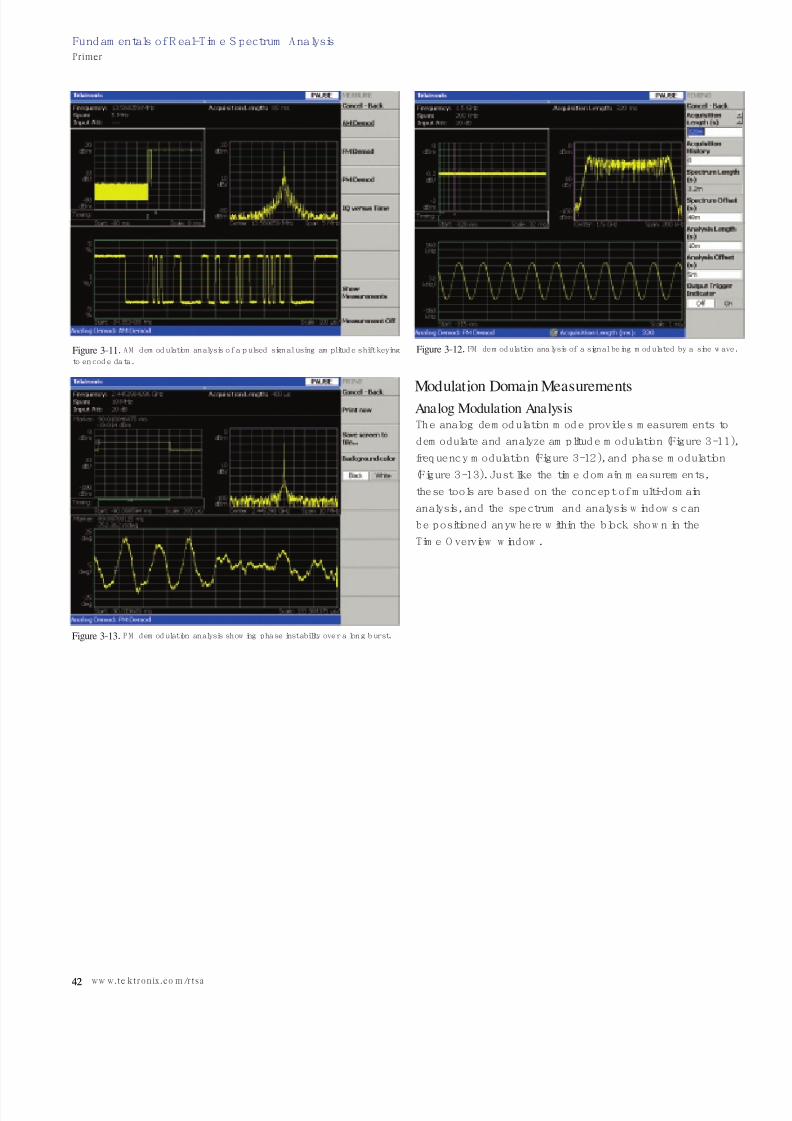
7/27/2019 Fundamentals of Real-Time Spectrum Analysis Tektronix DFT FFT Fourier
http://slidepdf.com/reader/full/fundamentals-of-real-time-spectrum-analysis-tektronix-dft-fft-fourier 42/52
42
Fundamentals of Real-Time Spectrum AnalysisPrimer
42 ww w.te ktronix.co m/rtsa
Modulation Domain MeasurementsAnalog Modulation Analysis
The analog demodulation mode provides measurements to
demodulate and analyze amplitude modulation (Figure 3-11),
frequency modulation (Figure 3-12), and phase modulation
(Figure 3-13). Just like the time domain measurements,
these tools are based on the concept of multi-domain
analysis, and the spectrum and analysis windows can
be positioned anywhere within the block shown in the
T ime O verview window.
Figure 3-11. AM demodulation analysis of a pulsed signal using amplitude shift keying
to encode data.
Figure 3-12. FM demodulation analysis of a signal being modulated by a sine wave.
Figure 3-13. PM demodulation analysis showing phase instability over a long burst.
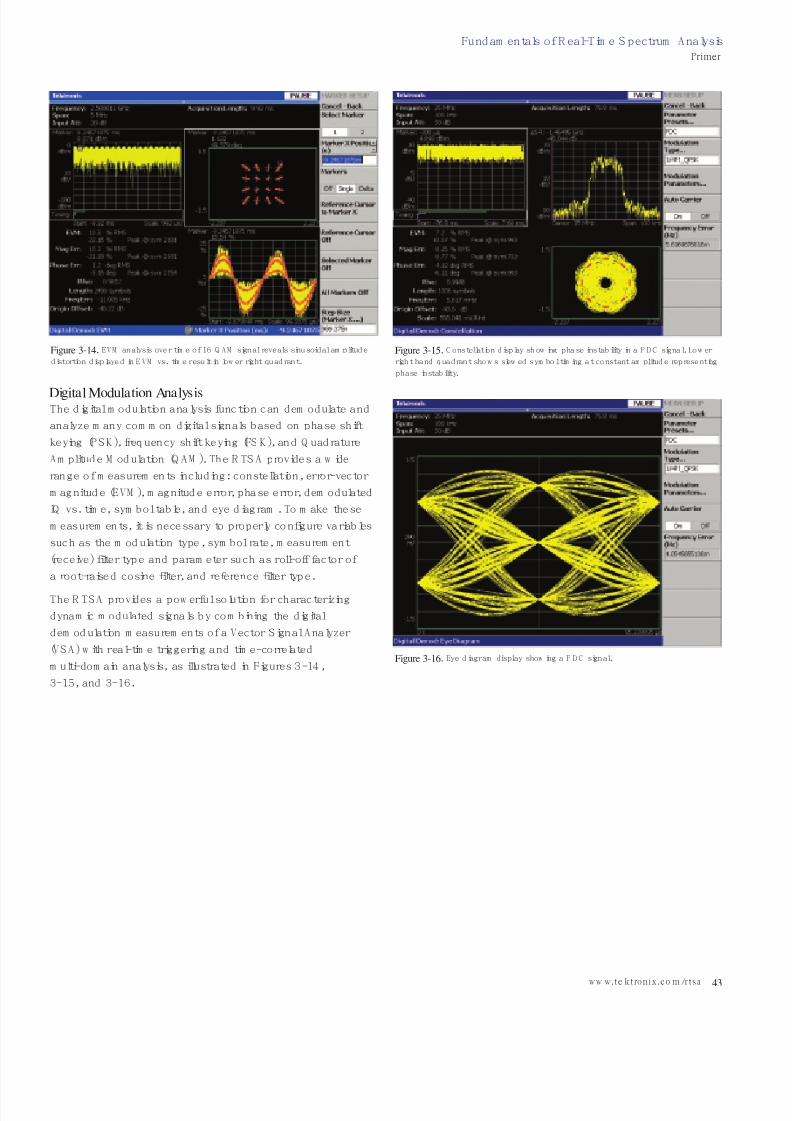
7/27/2019 Fundamentals of Real-Time Spectrum Analysis Tektronix DFT FFT Fourier
http://slidepdf.com/reader/full/fundamentals-of-real-time-spectrum-analysis-tektronix-dft-fft-fourier 43/52
Fundamentals of R eal-Time Spectrum AnalysisPrimer
43ww w.te ktronix.co m/rtsa
Digital Modulation AnalysisThe digital modulation analysis function can demodulate and
analyze many common digital signals based on phase shift
keying (P SK ), frequency shift keying (FSK ), and Q uadrature
Amplitude M odulation (Q AM ). The R TSA provides a wide
range of measurements including: constellation, error-vector
magnitude (EVM ), magnitude error, phase error, demodulated
IQ vs. time, symbol table, and eye diagram. To make these
measurements, it is necessary to properly configure variables
such as the modulation type, symbol rate, measurement
(receive) filter type and parameter such as roll-off factor of
a root-raised cosine filter, and reference filter type.
The RTSA provides a powerful solution for characterizing
dynamic modulated signals by combining the digital
demodulation measurements of a Vector Signal Analyzer
(VSA) with real-time triggering and time-correlated
multi-domain analysis, as illustrated in Figures 3-14,
3-15, and 3-16.
Figure 3-15. C onstellation display showing phase instability in a P DC signal. Lower
right hand quadrant shows slewed symbol timing at constant amplitude representing
phase instability.
Figure 3-14. EVM analysis over time of 16 Q AM signal reveals sinusoidal amplitude
distortion displayed in EVM vs. time result in lower right quadrant.
Figure 3-16. Eye diagram display showing a PD C signal.
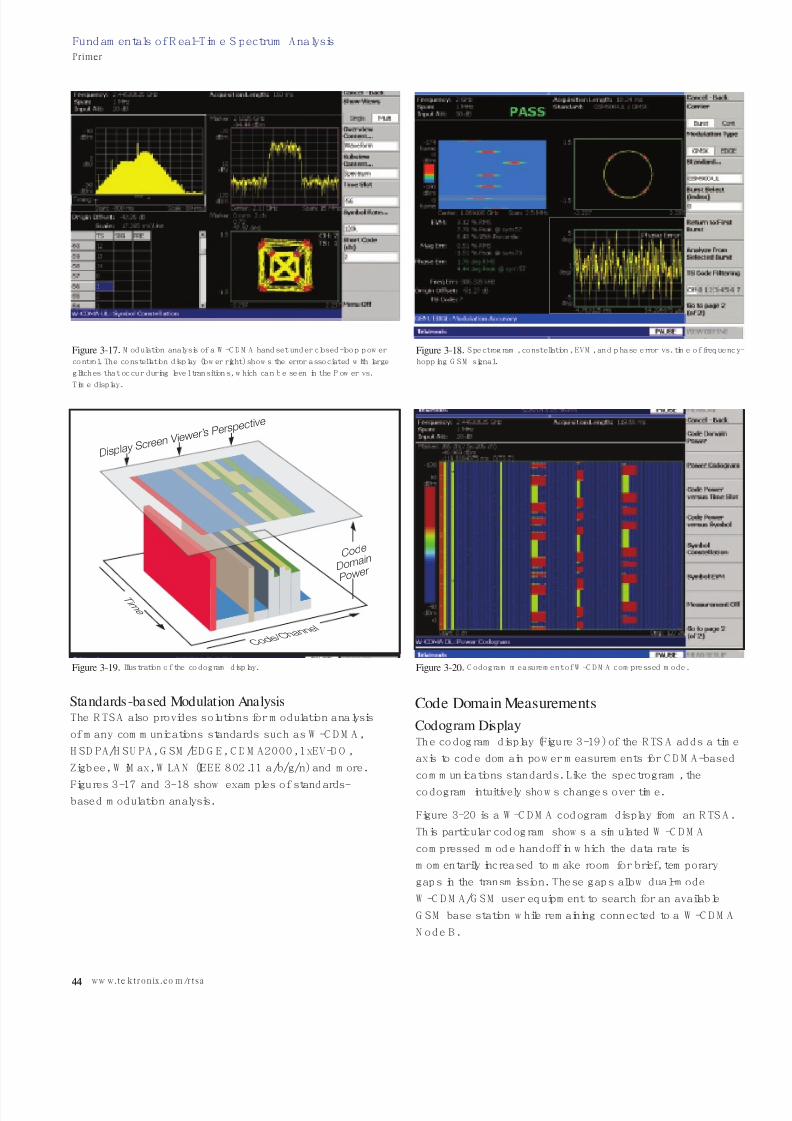
7/27/2019 Fundamentals of Real-Time Spectrum Analysis Tektronix DFT FFT Fourier
http://slidepdf.com/reader/full/fundamentals-of-real-time-spectrum-analysis-tektronix-dft-fft-fourier 44/52
44
Fundamentals of Real-Time Spectrum AnalysisPrimer
44 ww w.te ktronix.co m/rtsa
Standards-based Modulation Analysis
The RTSA also provides solutions for modulation analysis
of many communications standards such as W-CDM A,
HSDPA/HSUPA, G SM /EDG E, C DM A2000, 1xEV-DO ,
Zigbee, WiM ax, WL AN (IEEE 802.11 a/b/g/n) and more.
Figures 3-17 and 3-18 show examples of standards-based modulation analysis.
Code Domain Measurements
Codogram Display
The codogram display (Figure 3-19) of the R TSA adds a time
axis to code domain power measurements for CDM A-based
communications standards. Like the spectrogram, the
codogram intuitively shows changes over time.
Figure 3-20 is a W-CDM A codogram display from an RTSA.
This particular codogram shows a simulated W-C DM A
compressed mode handoff in which the data rate is
momentarily increased to make room for brief, temporary
gaps in the transmission. These gaps allow dual-mode
W-CDM A/G SM user equipment to search for an available
G SM base station while remaining connected to a W-CDM A
Node B.
Figure 3-18. Spectrogram, constellation, EVM , and phase error vs. time of frequency-
hopping G SM signal.
Figure 3-17. M odulation analysis of a W-CD M A handset under closed-loop power
control. T he constellation display (lower right) shows the error associated with large
glitches that occur during level transitions, which can be seen in the Power vs.
T ime display.
Code
Domain
Power
T i m
e
C o d e / C
h a n n e l
Display Scree
n V iewer’s Pe
rspective
Figure 3-19. Illustration of the codogram display. Figure 3-20. C odogram measurement of W-CD M A compressed mode.
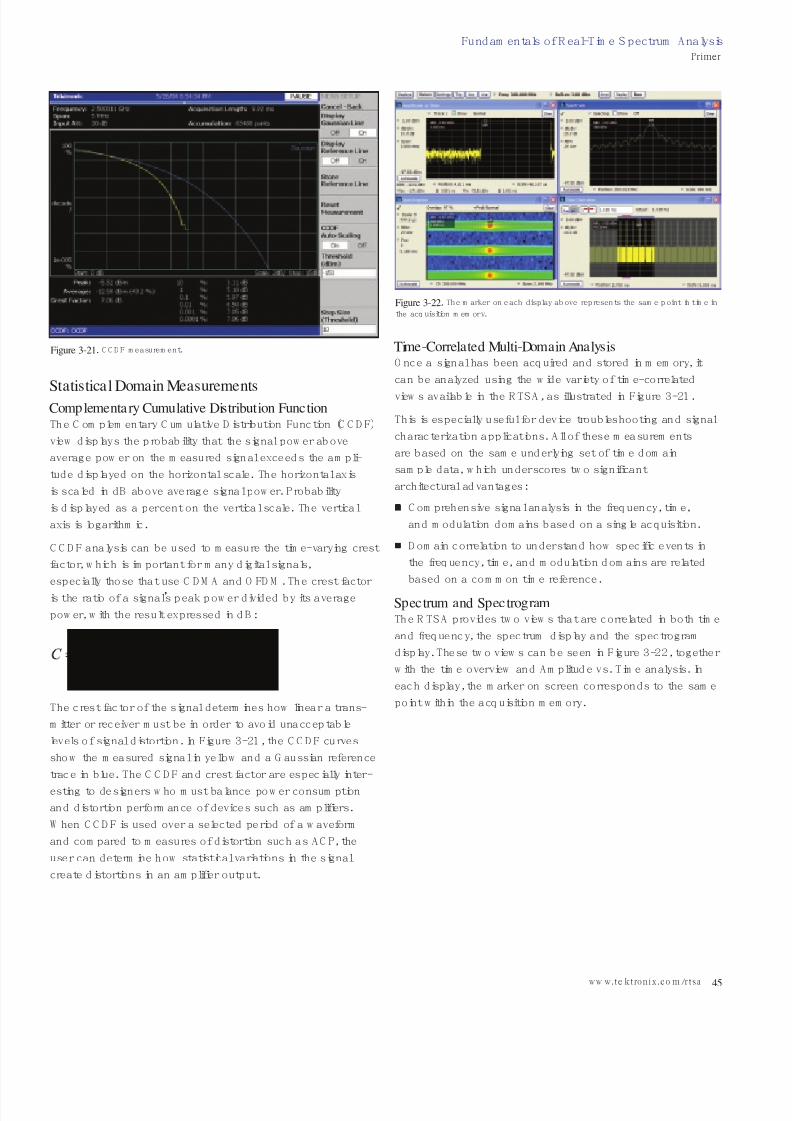
7/27/2019 Fundamentals of Real-Time Spectrum Analysis Tektronix DFT FFT Fourier
http://slidepdf.com/reader/full/fundamentals-of-real-time-spectrum-analysis-tektronix-dft-fft-fourier 45/52
Fundamentals of R eal-Time Spectrum AnalysisPrimer
45ww w.te ktronix.co m/rtsa
Statistical Domain MeasurementsComplementary Cumulative Distribution Function
The Complementary C umulative Distribution Function (CC DF)
view displays the probability that the signal power above
average power on the measured signal exceeds the ampli-
tude displayed on the horizontal scale. T he horizontal axis
is scaled in dB above average signal power. P robability
is displayed as a percent on the vertical scale. The vertical
axis is logarithmic.
C C DF analysis can be used to measure the time-varying crest
factor, which is important for many digital signals,
especially those that use CDM A and O FDM . T he crest factor
is the ratio of a signal’s peak power divided by its average
power, with the result expressed in dB :
The crest factor of the signal determines how linear a trans-
mitter or receiver must be in order to avoid unacceptable
levels of signal distortion. In Figure 3-21, the C C DF curves
show the measured signal in yellow and a G aussian reference
trace in blue. The CC DF and crest factor are especially inter-
esting to designers who must balance power consumption
and distortion performance of devices such as amplifiers.
When C C DF is used over a selected period of a waveform
and compared to measures of distortion such as AC P, the
user can determine how statistical variations in the signal
create distortions in an amplifier output.
Time-Correlated Multi-Domain Analysis
O nce a signal has been acquired and stored in memory, it
can be analyzed using the wide variety of time-correlated
views available in the RT SA, as illustrated in Figure 3-21.
This is especially useful for device troubleshooting and signal
characterization applications. A ll of these measurements
are based on the same underlying set of time domain
sample data, which underscores two significant
architectural advantages:
C omprehensive signal analysis in the frequency, time,
and modulation domains based on a single acquisition.
Domain correlation to understand how specific events in
the frequency, time, and modulation domains are related
based on a common time reference.
Spectrum and Spectrogram
The RTSA provides two views that are correlated in both time
and frequency, the spectrum display and the spectrogram
display. These two views can be seen in Figure 3-22, together
with the time overview and Amplitude vs. T ime analysis. In
each display, the marker on screen corresponds to the same
point within the acquisition memory.
Figure 3-22. The marker on each display above represents the same point in time in
the acquisition memory.
Figure 3-21. C C DF measurement.

7/27/2019 Fundamentals of Real-Time Spectrum Analysis Tektronix DFT FFT Fourier
http://slidepdf.com/reader/full/fundamentals-of-real-time-spectrum-analysis-tektronix-dft-fft-fourier 46/52
46
Fundamentals of Real-Time Spectrum AnalysisPrimer
46 ww w.te ktronix.co m/rtsa
Correlating Modulation and Time Domain Results
In the other real-time measurement modes for time domain
analysis and modulation domain analysis, the RTSAs shows
multiple views of the captured signal as illustrated in
Figure 3-23.
The window in the lower right in Figure 3-23 displays T ime
O verview (Power vs. T ime) for the entire acquisition. T his
overview shows all of the data that was acquired in the block,
and it serves as the index for the other analysis windows.
The window in the upper right in Figure 3-24 shows the
spectrum or Power vs. Frequency for one frame of the
spectrogram shown on the upper left. Just like the display
in Figure 3-23, this is the spectrum of one frame of data,
and it is possible to scroll through the entire time record
to see the spectrum at any point in time. This is done by
adjusting the spectrum offset. A lso note that there is a
purple bar in the spectrogram window that indicates
position in time that corresponds to the frequency domain
display in the spectrum window.
The window in the bottom half of the screen (outlined ingreen) displays the results of the selected time or modulation
analysis measurement.
Figure 3-23 shows an example of frequency modulation
analysis, and Figure 3-24 shows an example of transient
Power vs. T ime analysis. The green analysis window can be
positioned anywhere within the time record shown in the T ime
O verview, which has corresponding green bars to indicate its
position. In addition, the width and position of the analysis
window can be adjusted using the analysis length and
analysis offset controls.
Figure 3-23. T ime O verview, EVM vs. T ime, C onstellation and Spectrum with time-
correlated markers.
Figure 3-24. M ulti-domain view showing Spectrogram, power vs. frequency, and
power vs. time.

7/27/2019 Fundamentals of Real-Time Spectrum Analysis Tektronix DFT FFT Fourier
http://slidepdf.com/reader/full/fundamentals-of-real-time-spectrum-analysis-tektronix-dft-fft-fourier 47/52
Fundamentals of R eal-Time Spectrum AnalysisPrimer
47ww w.te ktronix.co m/rtsa
C hapter 4: Applications Using the
R eal-T ime Spectrum Analyzer
Pulse Measurements
Tektronix Real-T ime Spectrum Analyzers (R TSAs) are ideally
suited for making pulse measurements. A utomatic pulsemeasurement software can be included on all models of
R TSA. Extensive analysis on individual and pulse trend infor-
mation can be selected. U nlike traditional spectrum analyzers,
the various models of R TSA are specified for system rise-
time/falltime (to 10 ns), minimum pulse duration (as short
as 50 ns), and modulation bandwidths to 110 M Hz. For
faster risetimes, pulses, and wider modulation bandwidths,
the RTSA off-line software can be use in conjunction with
Tektronix D PO 70000 and D SA 70000 Series oscilloscopes
for automatic pulse measurements in the 10s of picoseconds
and bandwidths up to 20 G Hz.
Individual pulse information for carrier frequency, risetime,
falltime, droop, ripple, occupied spectrum, and pulsewidth
are among the many pulse measurements that can be
selected and characterized on the pulse measurement
analysis software.
Pulse trend statistics information includes PR F, duty cycle,
and pulse-to-pulse phase information. In addition, on the
R SA6100 Series, statistical information can be displayed
as a trend, or Fast Fourier Transforms (FFTs) can be per-
formed over the sampled data to reveal important
diagnostic information.
Radar
Integration of pulse measurements into a single tool for
time and frequency domain simplifies radar testing and
improves test reproducibility. The RTSA has the combined
test capability that replaces several common tools used
in radar transmitter test analysis (oscilloscopes, spectrum
analyzers, vector analyzers, power meters, and peak -power
meters). In addition, the Digital Phosphor Display (DPX) can
display interference components and the products non-
linearities that go undetected with other tools.
There are several application notes and white papersavailable from Tektronix on using the R TSA to test radars:
37W-20229 Advanced Radar Testing with the Real-Time
Spectrum Analyzer
37W-19190 Radar P ulse M easurements with the
Real-T ime Spectrum Analyzer
For the latest information on radar test solutions from
Tektronix, visit the web: http://www.tektronix.com/radar
RFID
RFID systems are used for a variety of applications: N ear-
Field C ommunications (N FC ) for transaction information
on cellular telephones; recently mandated T ire P ressure
M onitoring Systems (TPM S) for vehicle safety; R eal-Time
Location Systems (RTLS ) for the tracking of goods, and even
the asset tracking systems for commercial goods, with the
ePC G lobal initiatives. R FID systems operate over a wide
range of frequencies from HF frequencies (135 kH z) to
microwave (2.4 G Hz) and at various power levels for both
passive and active modes. However, as many RFID sys-
tems also operate in the unlicensed Industrial Scientific and
M edical (ISM ) bands, these systems become susceptible
to collisions of other RFID systems and communications
operating in the same bands.
The ability to automate pulse measurements is important fordesigning to the function of all R FID systems. The RT SAs
have the most comprehensive support of industry, interna-
tional, and proprietary RFID standards. Tag and reader/inter-
rogator performance and interaction can be completely ana-
lyzed with quick , easy, and repeatable measurement setups
and deep memory capture
There are several application notes and white papers avail-
able from Tektronix on using the RTSA to test RFID systems:
37W-19258 RFID and NFC M easurements with the
R eal-Time Spectrum Analyzer
37W-18055 R adio Frequency Identification(RFID) O verview
37W-17155 Evaluating and O ptimizing R FID Systems
Using the RT SA
For the latest information on R FID testing solutions from
Tektronix, visit the web: http://www.tektronix.com/rfid

7/27/2019 Fundamentals of Real-Time Spectrum Analysis Tektronix DFT FFT Fourier
http://slidepdf.com/reader/full/fundamentals-of-real-time-spectrum-analysis-tektronix-dft-fft-fourier 48/52
48
Fundamentals of Real-Time Spectrum AnalysisPrimer
48 ww w.te ktronix.co m/rtsa
S pec trum Mana g eme nt/S urveilla nce
Whether you are securing a facility or protecting your
spectrum investment, interference must be mitigated.
The detection of low-level and intermittent interference
in the presence of larger signals and the characterization
of impulsive noise are not possible with any certaintyusing most spectrum analyzer tools.
With DP X displaying Live R F, you will see signals you never
knew existed. R TSAs will change the way you search and
discover elusive signals. With industry-leading performance
for combined bandwidth and dynamic range, R TSAs are the
only spectrum analyzers specified with a 100% probability of
detecting signals within a band of interest.
Frequency M ask Trigger (FM T ) enables the R TSA to trigger
on low-level signals or impulses with a 100% probability for
capture and analysis.
There are several application notes and white papers
available from Tek tronix on using the RTSA in spectrum
management and surveillance applications:
37W-20120 Advanced Spectrum M anagement using
the Real-Time Spectrum Analyzer
37W-18576 Signal M onitoring and Surveillance using
the RT SA
For the latest information on spectrum management and
surveillance solutions from Tektronix, visit the web:
http://www.tektronix.com/surveillance
Radio CommunicationsM ore and more of the control and operation of modern radio
communications are controlled by software. D igital circuits
are replacing analog functions for dynamic operation of
modulation, power, channel control, and channel loading.
These modern radios can change power, frequency,
modulation, coding, and statistics rapidly over time.
By eliminating the need to switch modes between time and
frequency analysis, R TSAs have the ability to time-correlate
capture data and analyze in the multi-domains of time,
frequency, modulation, code, and statistics. C apture your
data once, and analyze completely.
The combination of DP X Spectrum and FM T provide a
powerful and unique capability for Radio Debug. D PX can
discover unusual transient events such as impulse noise
caused by software faults or other low-level spectrum noise
while the FM T can be set up to isolate those events. U sing
the external trigger output in conjunction with the FM T allows
you to trigger other instruments. Triggering oscilloscopes and
logic analyzers enables you to isolate events deep into your
block diagram so that the root cause can be isolated.
Tektronix iV iew capability and M ixed-Signal O scilloscopes
allow for the accurate time alignment and display of analog
and digital signals to with picosecond accuracy. S ubroutines
and lines of code can be time correlated to the actual spec-trum event of interest.
There are several application notes and white papers
available from Tektronix on using the R TSA for radio
communications applications:
37W-18369 Software Defined Radio: Integrated M ethod
for Designing SC A compliant radios
37W-19680 Software Defined Radio Testing Using
the Real-Time Spectrum Analyzers
37W-19295 RTSA Baseband M easurements White Paper
For more information on Tektronix solutions for radiocommunications and radio debug solutions, visit the web:
http://www.tektronix.com/radiocomms

7/27/2019 Fundamentals of Real-Time Spectrum Analysis Tektronix DFT FFT Fourier
http://slidepdf.com/reader/full/fundamentals-of-real-time-spectrum-analysis-tektronix-dft-fft-fourier 49/52
Fundamentals of R eal-Time Spectrum AnalysisPrimer
49ww w.te ktronix.co m/rtsa
P ow er Amplifier Tes ting
Voice communications in mobile communications tend to
operate at some level of steady traffic state. A s high rate
data services become integrated into modern radio
communication standards, (H SD PA/HS UPA , 1xEV, WiM ax),
the output power needs to be rapidly adapt to the changing
load. M odulation quality, spectral regrowth, and power
efficiency are a constant trade-off in amplifier design.
Whether advances in linearization are drive by the need for
better efficiency, reduced cost, or performance, various digital
techniques using some for of adaptive digital predistortion
(D PD) have become common in cellular amplifier design.
These designs are susceptible to memory effects, bias feed
through, and other transient spectral regrowth abnormalities.
With the ability to reveal the existence of memory effects
using DP X S pectrum, the R TSA can provide unique insight
for amplifier designers. Add the capability of correlated multi-domain analysis for amplitude statistics (CC DF), modulation
quality (EVM ), and Adjacent C hannel Power (AC P ) analysis,
and the RTSAs provides invaluable insight for amplifier
designers.
Learn more about the characterization of modern amplifiers
with the application note:
37W-19560 Troubleshooting and C haracterizing Wide
Band R F S ystems Using the Real-T ime Spectrum
Analyzers
Microphonics a nd P has e-Hits Ana lys is
M icrophonics and phase-hit problems have a reputation for
disrupting development programs and stopping production
lines. A s more of today’s modern communications systems
and electronics have become portable, these systems have
become very sensitive to these unintentional, internally
generated sources of modulation. C ompounding the
problem, the intermittent nature of these disturbances
has traditionally made the detection and isolation of these
events difficult and time consuming.
The Real-T ime S pectrum A nalyzers have unique ability to
display the presence of these events with certainty using DPX
spectrum display at >48,000 spectrum updates per second.
Isolation, characterization, measurement, and correlation to
root cause can be simplified using a combination of the
unique Frequency M ask Trigger and External Trigger output
on the Real-T ime S pectrum A nalyzers.
Learn more about the phenomena and how to capture
and measure microphonics and phase-hits with the
application note:
37W-18577 C apturing and M easuring M icrophonics
and P hase-H its with the Real-Time Spectrum A nalyzers
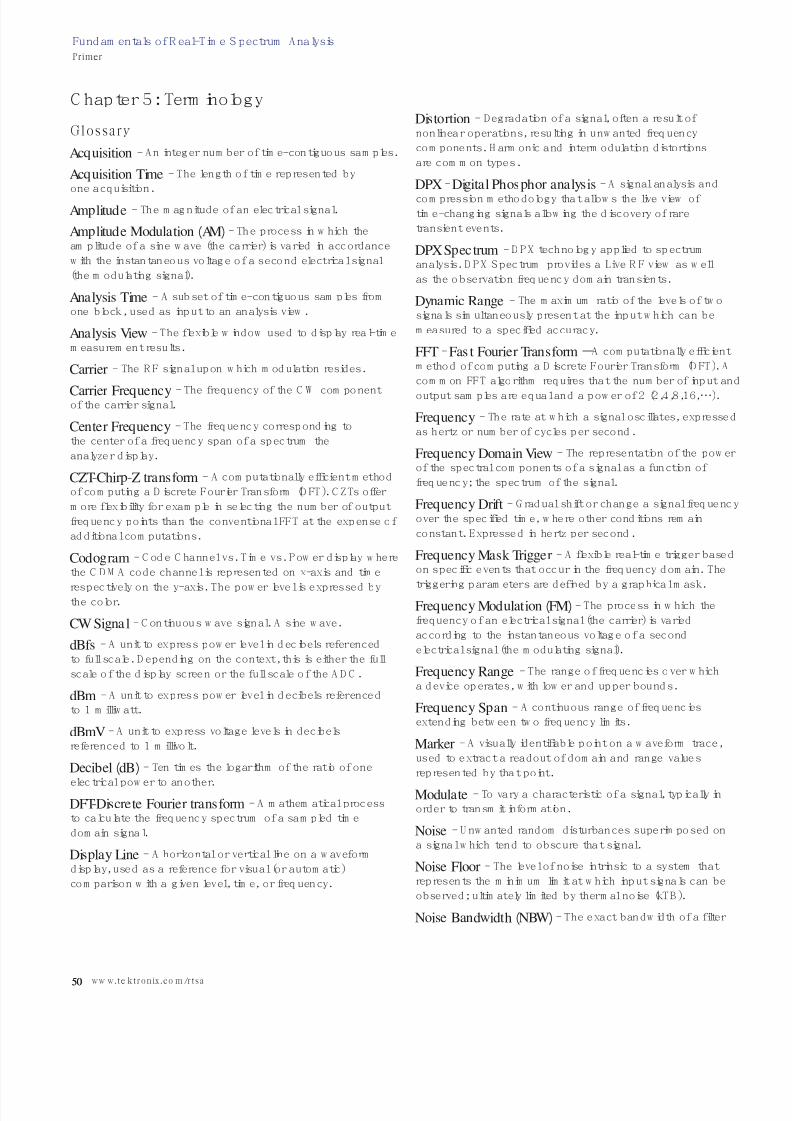
7/27/2019 Fundamentals of Real-Time Spectrum Analysis Tektronix DFT FFT Fourier
http://slidepdf.com/reader/full/fundamentals-of-real-time-spectrum-analysis-tektronix-dft-fft-fourier 50/52
50
Fundamentals of Real-Time Spectrum AnalysisPrimer
50 ww w.te ktronix.co m/rtsa
C hapter 5: Terminology
Glossary
Acquisition - An integer number of time-contiguous samples.
Acquisition Time - The length of time represented by
one acquisition.
Amplitude - The magnitude of an electrical signal.
Amplitude Modulation (AM) - The process in which the
amplitude of a sine wave (the carrier) is varied in accordance
with the instantaneous voltage of a second electrical signal
(the modulating signal).
Analysis Time - A subset of time-contiguous samples from
one block, used as input to an analysis view.
Analysis View - The flexible window used to display real-time
measurement results.
Carrier - The RF signal upon which modulation resides.
Carrier Frequency - The frequency of the CW componentof the carrier signal.
Center Frequency - The frequency corresponding to
the center of a frequency span of a spectrum the
analyzer display.
CZT-Chirp-Z transform - A computationally efficient method
of computing a Discrete Fourier Transform (D FT ). C ZTs offer
more flexibility for example in selecting the number of output
frequency points than the conventional FFT at the expense of
additional computations.
Codogram - Code C hannel vs. T ime vs. P ower display where
the CDM A code channel is represented on x-axis and time
respectively on the y-axis. The power level is expressed bythe color.
CW Signal - Continuous wave signal. A sine wave.
dBfs - A unit to express power level in decibels referenced
to full scale. D epending on the context, this is either the full
scale of the display screen or the full scale of the ADC .
dBm - A unit to express power level in decibels referenced
to 1 milliwatt.
dBmV - A unit to express voltage levels in decibels
referenced to 1 millivolt.
Decibel (dB) - Ten times the logarithm of the ratio of one
electrical power to another.
DFT-Discrete Fourier t ransform - A mathematical process
to calculate the frequency spectrum of a sampled time
domain signal.
Display Line - A horizontal or vertical line on a waveform
display, used as a reference for visual (or automatic)
comparison with a given level, time, or frequency.
Distortion - Degradation of a signal, often a result of
nonlinear operations, resulting in unwanted frequency
components. H armonic and intermodulation distortions
are common types.
DPX - Digital Phosphor analysis - A signal analysis and
compression methodology that allows the live view of time-changing signals allowing the discovery of rare
transient events.
DPX Spect rum - DPX technology applied to spectrum
analysis. D PX S pectrum provides a Live RF view as well
as the observation frequency domain transients.
Dynamic Range - The maximum ratio of the levels of two
signals simultaneously present at the input which can be
measured to a specified accuracy.
FFT - Fast Fourier Transform – A computationally efficient
method of computing a Discrete Fourier Transform (DFT ). A
common FFT algorithm requires that the number of input and
output samples are equal and a power of 2 (2,4,8,16,… ).
Frequency - The rate at which a signal oscillates, expressed
as hertz or number of cycles per second.
Frequency Domain View - The representation of the power
of the spectral components of a signal as a function of
frequency; the spectrum of the signal.
Frequency Drift - Gradual shift or change a signal frequency
over the specified time, where other conditions remain
constant. Expressed in hertz per second.
Frequency Mask Trigger - A flexible real-time trigger based
on specific events that occur in the frequency domain. The
triggering parameters are defined by a graphical mask.Frequency Modulation (FM) - The process in which the
frequency of an electrical signal (the carrier) is varied
according to the instantaneous voltage of a second
electrical signal (the modulating signal).
Frequency Range - The range of frequencies over which
a device operates, with lower and upper bounds.
Frequency Span - A continuous range of frequencies
extending between two frequency limits.
Marker - A visually identifiable point on a waveform trace,
used to extract a readout of domain and range values
represented by that point.
Modulate - To vary a characteristic of a signal, typically in
order to transmit information.
Noise - Unwanted random disturbances superimposed on
a signal which tend to obscure that signal.
Noise Floor - The level of noise intrinsic to a system that
represents the minimum limit at which input signals can be
observed; ultimately limited by thermal noise (kT B).
Noise Bandwidth (NBW) - The exact bandwidth of a filter

7/27/2019 Fundamentals of Real-Time Spectrum Analysis Tektronix DFT FFT Fourier
http://slidepdf.com/reader/full/fundamentals-of-real-time-spectrum-analysis-tektronix-dft-fft-fourier 51/52
Fundamentals of Real-Time Spectrum AnalysisP rimer
51w w w.te ktronix .c om/rtsa
Noise Bandwidth (NBW) - The exact bandwidth of a filter
that is used to calculate the absolute power of noise or
noise-like signals in dBm/Hz.
Probability of Intercept - The certainty to which a signal
can be detected within defined parameters.
Real-Time Bandwidth - The frequency span over which
real-time seamless capture can be performed, which is a
function of the digitizer and the IF bandwidth of a Real-Time
Spectrum Analyzer.
Real-Time Seamless Capture - The ability to acquire and
store an uninterrupted series of time domain samples that
represent the behavior of an RF signal over a long period
of time.
Real-Time Spect rum Analysis - A spectrum analysis
technique based on Discrete Fourier Transforms (DFT) that
is capable of continuously analyzing a bandwidth of interest
without time gaps. Real-Time Spectrum Analysis provides
100% probability of display and trigger of transient signal
fluctuations within the specified span, resolution bandwidthand time parameters.
Real-Time Spect rum Analyzer - Instrument capable
of measuring elusive RF events in RF signals, triggering
on those events, seamlessly capturing them into memory,
and analyzing them in the frequency, time, and
modulation domains.
Reference Level - The signal level represented by the
uppermost graticule line of the analyzer display.
Resolution Bandwidth (RBW) - The width of the narrowest
measurable band of frequencies in a spectrum analyzer
display. The RBW determines the analyzer’s ability to
resolve closely spaced signal components.
Sensitivity - Measure of a spectrum analyzer’s ability to
display minimum level signals, usually expressed as
Displayed Average Noise Level (DANL).
Spectrogram - Frequency vs. Time vs. amplitude display
where the frequency is represented on x-axis and time on
the y-axis. The power is expressed by the color.
Spectrum - The frequency domain representation of a
signal showing the power distribution of its spectral
component versus frequency.
Spectrum Analysis - Measurement technique for
determining the frequency content of an RF signal.
Vector Signal Analysis - Measurement technique for
charactering the modulation of an RF signal. Vector
analysis takes both magnitude and phase into account.
Acronym Re ferenc e
ACP: Adjacent Channel Power
ADC: Analog-to-Digital Converter
AM: Amplitude Modulation
BH4B: Blackman-Harris 4B Window
BW: Bandwidth
CCDF: Complementary Cumulative Distribution Function
CDMA: Code Division Multiple Access
CW: Continuous Wave
dB: Decibel
dBfs: dB Full Scale
DDC: Digital Downconverter
DFT: Discrete Fourier Transform
DPX: Digital Phosphor Display, Spectrum, etc.
DSP: Digital Signal ProcessingEVM: Error Vector Magnitude
FFT: Fast Fourier Transform
FM: Frequency Modulation
FSK: Frequency Shift Keying
IF: Intermediate Frequency
IQ: In-Phase Quadrature
LO: Local Oscillator
NBW: Noise Bandwidth
OFDM: Orthogonal Frequency Division Multiplexing
PAR: Peak-Average Ratio
PM: Phase Modulation
POI: Probability of Intercept
PRBS: Pseudorandom Binary Sequence
PSK: Phase Shift Keying
QAM: Quadrature Amplitude Modulation
QPSK: Quadrature Phase Shift Keying
RBW: Resolution Bandwidth
RF: Radio Frequency
RMS: Root Mean SquareRTSA: Real-Time Spectrum Analyzer
SA: Spectrum Analyzer
VSA: Vector Signal Analyzer
7/27/2019 Fundamentals of Real-Time Spectrum Analysis Tektronix DFT FFT Fourier
http://slidepdf.com/reader/full/fundamentals-of-real-time-spectrum-analysis-tektronix-dft-fft-fourier 52/52
C opyright © 2008, Tek tronix. A ll rights reserved. Tektronix products are covered
by U.S . and foreign patents, issued and pending. Information in this publication
supersedes that in all previously published material. Specification and price
change privileges reserved. TE K TR O NIX and TEK are registered trademarks
of Tektronix, Inc. A ll other trade names referenced are the service marks,
trademark s or registered trademark s of their respective companies.
02/08 EA/BT 37W-17249-3
Contact Tektronix:
ASEAN / Australasia (65) 6356 3900
Austria +41 52 675 3777
Balkans, Israel, South Africa and ot her ISE Countries +41 52 675 3777
Belgium 07 81 60166
Brazil & South America (11) 40669400
Canada 1 (800) 661-5625
Central East Europe, Ukraine and the Baltics +41 52 675 3777
Central Europe & Greece +41 52 675 3777
Denmark +45 80 88 1401
Finland +41 52 675 3777
France +33 (0) 1 69 86 81 81
Germany +49 (221) 94 77 400
Hong Kong (852) 2585-6688
India (91) 80-22275577
Italy +39 (02) 25086 1
Japan 81 (3) 6714-3010
Luxembourg +44 (0) 1344 392400
Mexico, Central America & Caribbean 52 (55) 5424700
Middle East, Asia and North Africa +41 52 675 3777
The Netherlands 090 02 021797
Norway 800 16098
People’s Republic of China 86 (10) 6235 1230
Poland +41 52 675 3777
Portugal 80 08 12370
Republic of Korea 82 (2) 6917-5000
Russia & CIS +7 (495) 7484900
South Africa +27 11 206 8360
Spain (+ 34) 901 988 054
Sweden 020 08 80371
Switzerland +41 52 675 3777
Taiwan 886 (2) 2722-9622
United Kingdom & Eire +44 (0) 1344 392400
USA 1 (800) 426-2200
For other areas contact Tektronix, Inc. at: 1 (503) 627-7111
Updated 12 N ovember 2007
For Further Information
Tektronix maintains a comprehensive, constantly expanding
collection of application notes, technical briefs and other
resources to help engineers working on the cutting edge of
technology. P lease visit www.tektronix.com