
FUNDAMENTALS OF PHOTONICS Module 1 - spie.org STEP Module 09.pdfassumption is that the image will be...
32
349 F UNDAMENTALS OF P HOTONICS Module 1.9 Photonic Devices for Imaging, Display, and Storage Harley R. Myler University of Central Florida Orlando, Florida Electronic and electro-optic devices are frequently used to display images obtained from the computer processing of data. Images, or digital pictures, are generally two-dimensional data structures that convey spatial information to the viewer. Images are collected through various means, from digital cameras to laser radar scanning systems and, once stored in a computer, can be manipulated mathematically to accomplish many different objectives. The improvement of images for viewing or analysis and computer interpretation of image content are among those objectives. This module explains the terminology associated with images, how images are acquired and stored, and how images are displayed. Prerequisites Before starting this module, you should have completed Modules 1-1, Nature and Properties of Light; 1-2, Light Sources and Safety; and 1-3, Basic Geometrical Optics. Specifically, you should have knowledge of fundamental optics to include lenses, apertures, and image formation. You will also require a basic knowledge of electronic device physics.
Transcript of FUNDAMENTALS OF PHOTONICS Module 1 - spie.org STEP Module 09.pdfassumption is that the image will be...
349
FUNDAMENTALS OF PHOTONICS
Module 1.9
Photonic Devices for Imaging, Display, and Storage Harley R. Myler University of Central Florida Orlando, Florida
Electronic and electro-optic devices are frequently used to display images obtained from the computer processing of data. Images, or digital pictures, are generally two-dimensional data structures that convey spatial information to the viewer. Images are collected through various means, from digital cameras to laser radar scanning systems and, once stored in a computer, can be manipulated mathematically to accomplish many different objectives. The improvement of images for viewing or analysis and computer interpretation of image content are among those objectives. This module explains the terminology associated with images, how images are acquired and stored, and how images are displayed.
Prerequisites Before starting this module, you should have completed Modules 1-1, Nature and Properties of Light; 1-2, Light Sources and Safety; and 1-3, Basic Geometrical Optics. Specifically, you should have knowledge of fundamental optics to include lenses, apertures, and image formation. You will also require a basic knowledge of electronic device physics.
F U N D A M E N T A L S O F P H O T O N I C S
350
Objectives
When you complete this module you will be able to:
• Define imaging, pixel, quantization, sampling, and bandwidth.
• Explain the relationship between resolution and spatial frequency.
• Calculate the resolution of an imaging device.
• Describe the basic parts of a camera and explain how it is used to record images.
• List the different types of scanners, e.g., flying spot, flatbed, and drum, and explain their operation.
• Understand how computer files store images for archival purposes.
• Explain the difference between lossless and lossy image-compression schemes.
• Describe the structure, operation and capabilities of a CCD camera, a vidicon, and an image intensifier.
• Describe the structure, operation, and capabilities of a CRT display.
• List and define the phases of liquid crystal materials.
• Describe the parts and operation of a basic LCD.
• Explain the difference between active and passive LCD technologies.
• List and define the two addressing modes for passive LCDs.
• Define electroluminescence.
• Describe the operation of an electroluminescent display and explain how it differs from an LCD.
• Describe the operation of an LED display and explain how it differs from an LCD.
P H O T O N I C D E V I C E S F O R I M A G I N G , D I S P L A Y , A N D S T O R A G E
351
Scenario—recording and displaying images in the workplace A company that develops and manufactures optical products using state-of-the-art technologies for the medical, display, instrument, and other industries has hired Jennifer Watley to assist optical product development engineers in the prototyping laboratory. During her interview for the position, Jennifer was told that the successful candidate needed a background in display technologies and image acquisition, which were areas of study that she had particularly enjoyed at school. Shortly after accepting the photonics technician position, Jennifer discovered that all of the fundamentals of displays and image storage that she learned are useful in her work. Her daily activities involve working closely with engineers and technicians to determine what data must be recorded from their experiments and the best ways to display and store the images produced. Jennifer has discovered that high tech companies like the one for which she works have sophisticated equipment and software that allow very-high-resolution images to be recorded, manipulated, and stored. Her background training has allowed her to quickly “come up to speed” on the latest technology and to understand the complex details of operating and maintaining imaging devices. Jennifer has just been told that her company is sending her to a special training course on a new high-resolution thermal imaging system that they will be purchasing for her lab. She finds the continual learning opportunities on high-tech state-of-the-art equipment one of the aspects of her job that she especially enjoys. Jennifer knows that her training and motivation are the reason her company continues to invest in her education.
Opening Demonstration Using an optics bench and a simple lens system, image an object, such as a golf ball on tee, doll, or toy car, onto the CCD array of an inexpensive circuit board “pinhole” camera. You will have to remove the lens of the camera to expose the CCD “chip,” which should be about 1⁄4" square and located just behind the lens. Display the output of the camera on an LCD screen. Compare the object being imaged to the image displayed. Are any of the object’s details not displayed? For example, if your object is a doll’s head, does the doll have fine eyelashes that cannot be distinguished in the displayed picture? The ability to acquire and display fine detail is dependent on the resolution of the imaging system. The CCD camera documentation should state the resolution of the camera in lines. We will define resolution in terms of lines per length. If the CCD has 380 lines (very common) and is 1⁄4" square, the resolution will be 1520 lines per inch. If the image of the object has lines that are finer than that, they will not be observed at the output, provided that the optics can image the object to the size of the CCD array. The display also has a resolution associated with it, and, if the display resolution is less than that of the camera, the display will not be able to accurately reproduce what the camera acquires.
F U N D A M E N T A L S O F P H O T O N I C S
352
Basic Concepts
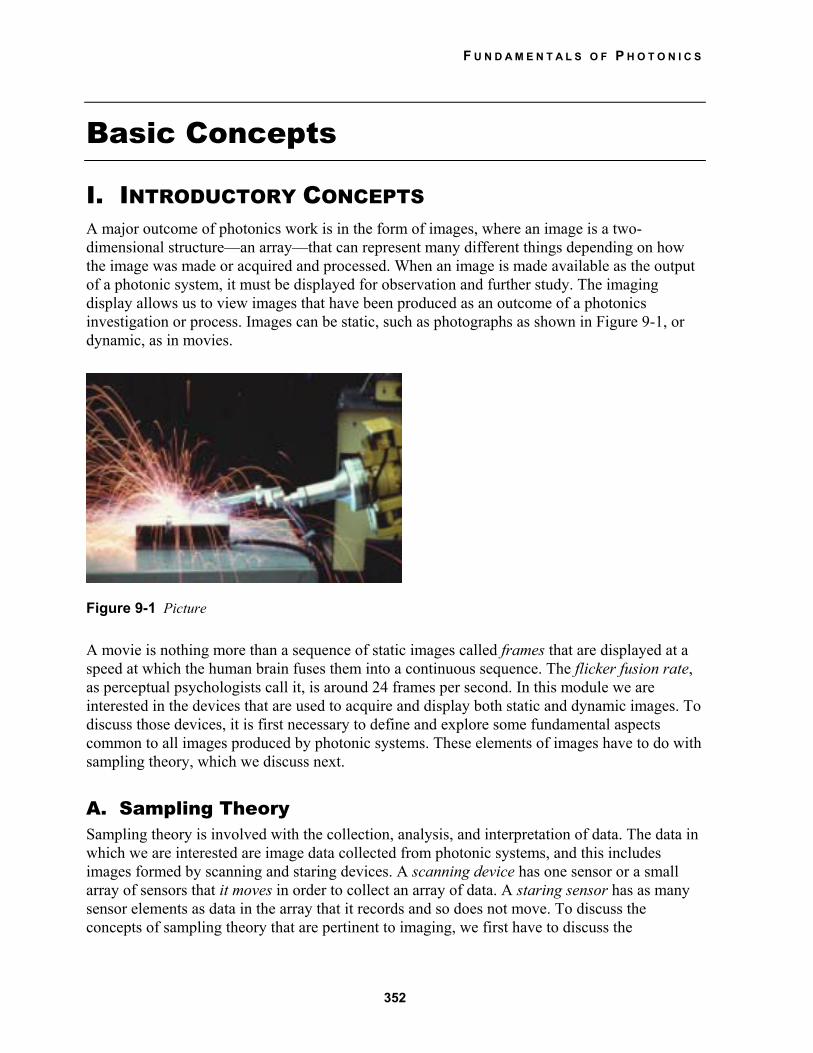
I. INTRODUCTORY CONCEPTS A major outcome of photonics work is in the form of images, where an image is a two-dimensional structure—an array—that can represent many different things depending on how the image was made or acquired and processed. When an image is made available as the output of a photonic system, it must be displayed for observation and further study. The imaging display allows us to view images that have been produced as an outcome of a photonics investigation or process. Images can be static, such as photographs as shown in Figure 9-1, or dynamic, as in movies.
Figure 9-1 Picture
A movie is nothing more than a sequence of static images called frames that are displayed at a speed at which the human brain fuses them into a continuous sequence. The flicker fusion rate, as perceptual psychologists call it, is around 24 frames per second. In this module we are interested in the devices that are used to acquire and display both static and dynamic images. To discuss those devices, it is first necessary to define and explore some fundamental aspects common to all images produced by photonic systems. These elements of images have to do with sampling theory, which we discuss next.
A. Sampling Theory Sampling theory is involved with the collection, analysis, and interpretation of data. The data in which we are interested are image data collected from photonic systems, and this includes images formed by scanning and staring devices. A scanning device has one sensor or a small array of sensors that it moves in order to collect an array of data. A staring sensor has as many sensor elements as data in the array that it records and so does not move. To discuss the concepts of sampling theory that are pertinent to imaging, we first have to discuss the

P H O T O N I C D E V I C E S F O R I M A G I N G , D I S P L A Y , A N D S T O R A G E
353
fundamental elements of an image and their relationship to each other and to the image overall. These elements are called pixels.
Pixels A pixel is a conjunction of the words picture element, in which the term picture is synonymous with image. Imagine a set of white marbles set into holes on a wooden board. The holes have been drilled to form a square array, and so a view of the marbles would look something like Figure 9-2.
Figure 9-2 “Marble” array
Now imagine that we have 256 marbles and they are arranged as 16 rows by 16 columns. If we replace some of the white marbles with black ones, we can produce an image using the marbles, like that shown in Figure 9-3.
Figure 9-3 “Marble” array image
F U N D A M E N T A L S O F P H O T O N I C S
354
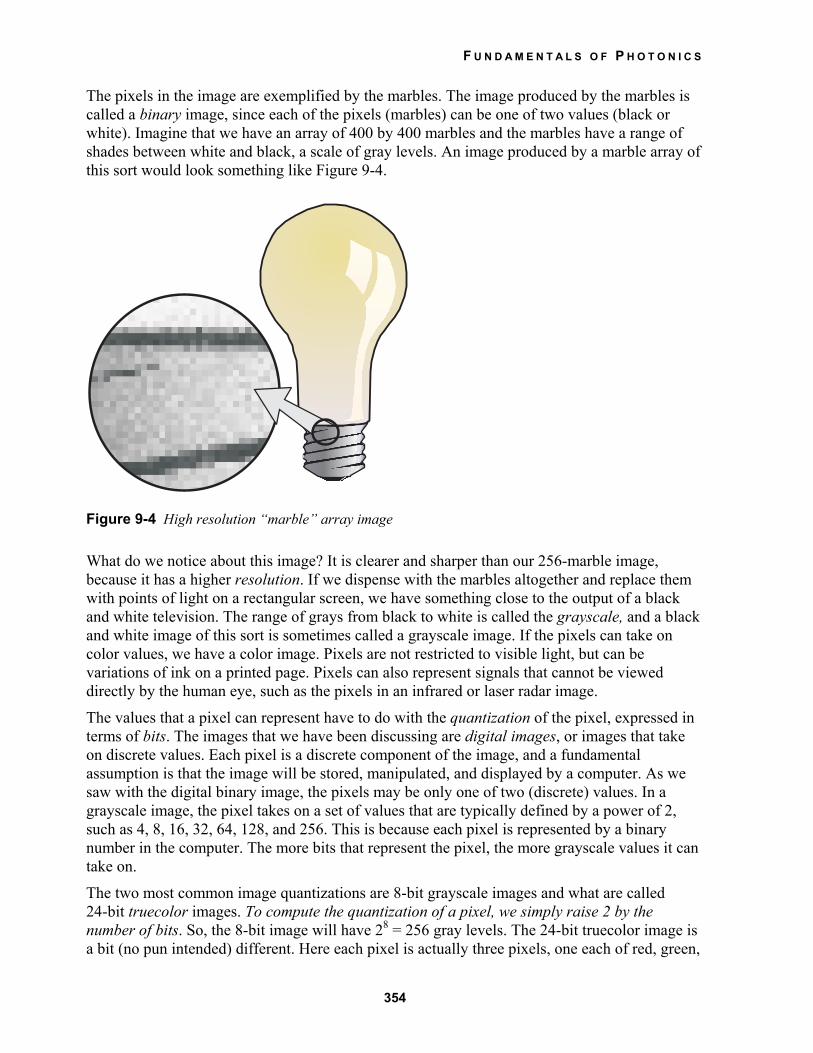
The pixels in the image are exemplified by the marbles. The image produced by the marbles is called a binary image, since each of the pixels (marbles) can be one of two values (black or white). Imagine that we have an array of 400 by 400 marbles and the marbles have a range of shades between white and black, a scale of gray levels. An image produced by a marble array of this sort would look something like Figure 9-4.
Figure 9-4 High resolution “marble” array image
What do we notice about this image? It is clearer and sharper than our 256-marble image, because it has a higher resolution. If we dispense with the marbles altogether and replace them with points of light on a rectangular screen, we have something close to the output of a black and white television. The range of grays from black to white is called the grayscale, and a black and white image of this sort is sometimes called a grayscale image. If the pixels can take on color values, we have a color image. Pixels are not restricted to visible light, but can be variations of ink on a printed page. Pixels can also represent signals that cannot be viewed directly by the human eye, such as the pixels in an infrared or laser radar image.
The values that a pixel can represent have to do with the quantization of the pixel, expressed in terms of bits. The images that we have been discussing are digital images, or images that take on discrete values. Each pixel is a discrete component of the image, and a fundamental assumption is that the image will be stored, manipulated, and displayed by a computer. As we saw with the digital binary image, the pixels may be only one of two (discrete) values. In a grayscale image, the pixel takes on a set of values that are typically defined by a power of 2, such as 4, 8, 16, 32, 64, 128, and 256. This is because each pixel is represented by a binary number in the computer. The more bits that represent the pixel, the more grayscale values it can take on.
The two most common image quantizations are 8-bit grayscale images and what are called 24-bit truecolor images. To compute the quantization of a pixel, we simply raise 2 by the number of bits. So, the 8-bit image will have 28 = 256 gray levels. The 24-bit truecolor image is a bit (no pun intended) different. Here each pixel is actually three pixels, one each of red, green,
P H O T O N I C D E V I C E S F O R I M A G I N G , D I S P L A Y , A N D S T O R A G E
355
and blue. Color images are more complex than black and white images because they require a combination of the three primary colors, red, green, and blue. The three pixels of a color digital image are so small and closely spaced that their combination is fused by the eye into a single pixel whose color is the additive combination of three individual pixels. You can see this by looking at a color computer monitor with a magnifying glass. Each pixel is just like a grayscale pixel except that, instead of varying from black to white through shades of gray, the pixel varies from black to either red, green, or blue, with varying intensities of each color. The 24-bit truecolor image has 256 reds, 256 blues, and 256 greens. Collectively, they can produce 256 × 256 × 256 colors, or 16,777,216 million colors, that is, 224 colors. People can distinguish between only about 64 different shades of gray, but we do better with colors, where the number jumps into the millions.
We can conclude that the pixel is simply the fundamental unit of an image, like a brick is the unit of a wall or a grain is the unit of a sandpile. The pixel can take on various values that constitute the quantization of the image, like a brick or grain of sand can have a color or a shade of gray. We will now discuss how the image is defined in terms of resolution and spatial frequency.
Resolution and Spatial Frequency Resolution has to do with the fineness of detail the image can represent, or the fineness of detail the camera can record or the display system display. The more pixels per unit area an image has, the higher the resolution. The term resolution comes from the word resolve, which the dictionary defines as “to break up into constituent parts.” There are a number of ways to define resolution in terms of imaging. One way is by using the following equation:
Resolution = number of pixels/area.
For an image that is 3 × 3 inches square and contains 900 by 900 pixels, the resolution is (900 × 900)/(3 × 3) = 9000 pixels per square inch. This sort of measure is difficult to visualize and so an alternative expression that is more common defines resolution in terms of lines per distance. When you purchase a CCD camera or a television, the resolution is stated in terms of lines. Many inexpensive CCD cameras have 380 lines; this means that the sensor array has 380 rows of sensors. If the CCD array—the electronic chip—is 1⁄4" wide, we can calculate:
Resolution = number of lines/length = 380 lines/0.25 inch = 1520 lines per inch.
If we were to draw a one-inch square on a piece of paper and then draw lines on the square, we could draw lines as thin as 1⁄1520 of an inch and the CCD could resolve them. This assumes, however, that a 1⁄4" subsquare is imaged onto the CCD array due to the size of the array. Also, we could resolve only 760 lines, which is one-half of 1520. The reason for this is that we need to have a black line then a white line, then a black, and so on. To display a line, we need a sensor for the line and a sensor for the space between that line and the next line. Hence, we need two sensors per line, which gives rise to the division by two of the resolution. In sampling theory, the Nyquist rate is the rate at which you must sample a signal in order to capture all of its frequencies, and this rate is twice the highest frequency that must be sampled! Frequency has to do with how often something changes in time. When something changes in distance, like pixels or lines per inch, we call this spatial frequency. Spatial frequency is a more specific term
F U N D A M E N T A L S O F P H O T O N I C S
356
than resolution, even though they share the same units. Typically, images have resolutions that are represented as pairs of numbers, indicating the number of rows and columns in pixels of the image—although the actual size in terms of length or area of the image is not mentioned. Common computer display resolutions are 512 by 512, 1024 by 1024, and 2048 by 2048 for square images and 640 by 480, 800 by 600, and 1024 by 768 for rectangular images. High definition television, or HDTV, is 1080 by 1920 pixels.
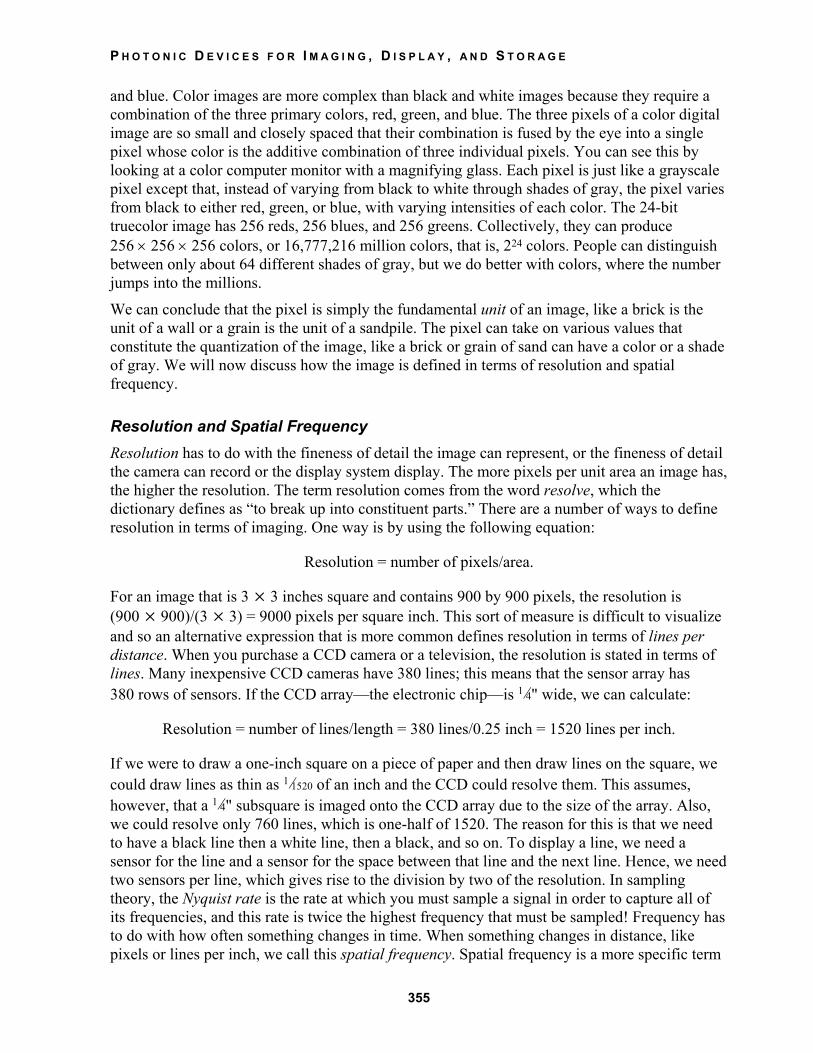
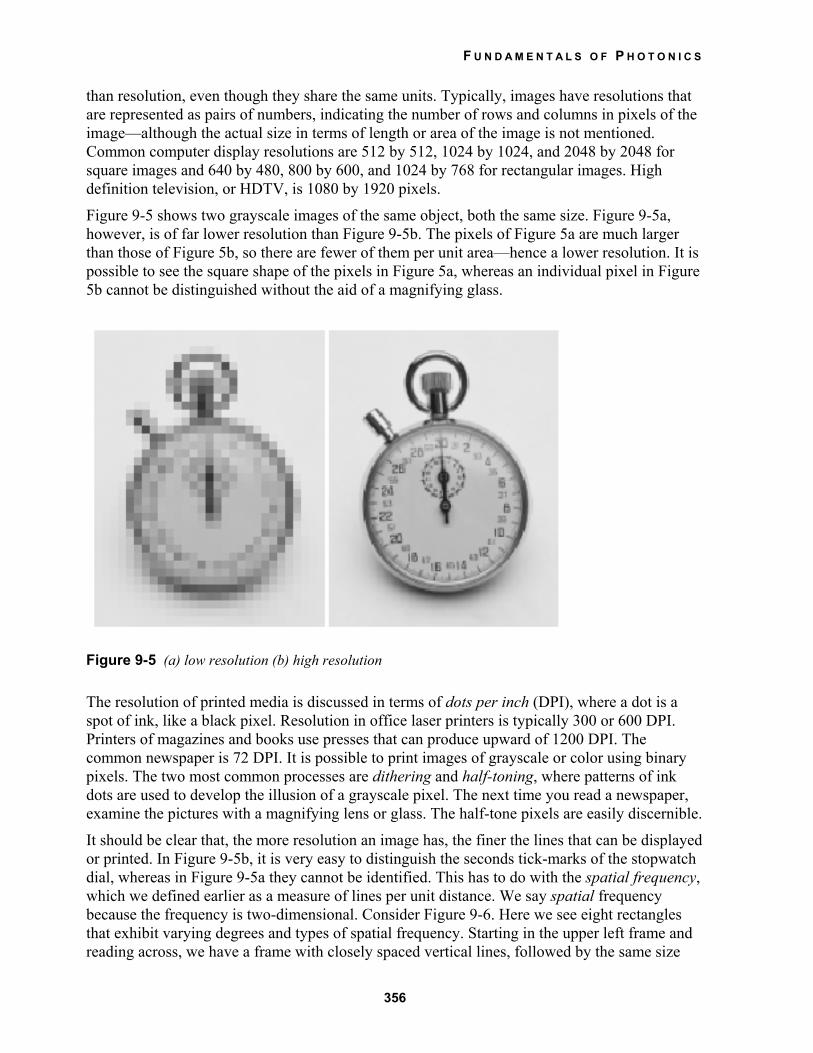
Figure 9-5 shows two grayscale images of the same object, both the same size. Figure 9-5a, however, is of far lower resolution than Figure 9-5b. The pixels of Figure 5a are much larger than those of Figure 5b, so there are fewer of them per unit area—hence a lower resolution. It is possible to see the square shape of the pixels in Figure 5a, whereas an individual pixel in Figure 5b cannot be distinguished without the aid of a magnifying glass.
Figure 9-5 (a) low resolution (b) high resolution
The resolution of printed media is discussed in terms of dots per inch (DPI), where a dot is a spot of ink, like a black pixel. Resolution in office laser printers is typically 300 or 600 DPI. Printers of magazines and books use presses that can produce upward of 1200 DPI. The common newspaper is 72 DPI. It is possible to print images of grayscale or color using binary pixels. The two most common processes are dithering and half-toning, where patterns of ink dots are used to develop the illusion of a grayscale pixel. The next time you read a newspaper, examine the pictures with a magnifying lens or glass. The half-tone pixels are easily discernible.
It should be clear that, the more resolution an image has, the finer the lines that can be displayed or printed. In Figure 9-5b, it is very easy to distinguish the seconds tick-marks of the stopwatch dial, whereas in Figure 9-5a they cannot be identified. This has to do with the spatial frequency, which we defined earlier as a measure of lines per unit distance. We say spatial frequency because the frequency is two-dimensional. Consider Figure 9-6. Here we see eight rectangles that exhibit varying degrees and types of spatial frequency. Starting in the upper left frame and reading across, we have a frame with closely spaced vertical lines, followed by the same size

P H O T O N I C D E V I C E S F O R I M A G I N G , D I S P L A Y , A N D S T O R A G E
357
frame with fewer verticals. The first frame has a higher spatial frequency content than the second. The last two frames of the first row have high and low spatial frequency, respectively, but with horizontal lines. The second row at left shows a grid pattern where the vertical spatial frequency is equal to the horizontal. The frame next to it shows a square with very small dots. That square has high spatial frequency horizontally, vertically, and diagonally. The last two images show random textures. Can you tell which one has higher spatial frequency? If you said the first one, you were correct, because there is greater detail in the pattern. The spatial frequency is related directly to the resolution. In fact, the resolution of which a display is capable determines the maximum spatial frequency that can be displayed.
Figure 9-6 Examples of different spatial frequencies
As we saw earlier, if we have a resolution of 300 DPI, we can display a spatial frequency no greater than 150 lines per inch, or one-half the resolution. We can consider resolution to be a measure of sampling capability, where each pixel is a sample. The maximum number of lines that can be represented, i.e. the maximum spatial frequency, is measured in lines per unit distance and is just one-half the resolution. This can be expressed analytically as:
Maximum spatial frequency (lines/distance) = 1/2 resolution (lines/distance).

F U N D A M E N T A L S O F P H O T O N I C S
358
LAB 1: Resolution Using a “pin art” module (see Other Resources on where to obtain) produce reliefs of different objects (calculator, golf ball, stapler, etc.) like that shown in the illustration. Now imagine that the movable pins in the module are pixels. Instead of values of light intensity, the pin depth determines the pixel values of the pins. Use a ruler to determine the size of the pin area, then count the number of pins and calculate the resolution of the module. Find an object with physical features that are smaller than the resolution of the pin art. Can the module reproduce the object features?
Bandwidth Bandwidth is defined as the amount of information that can be transmitted across a channel in a fixed amount of time. See Module 1-8, Fiber Optic Telecommunication. Bandwidth is a term from communication theory, but here we can consider an image to be a channel and can discuss image bandwidth in terms of spatial frequency. We replace time with distance and say that the bandwidth of an image is the maximum spatial frequency that the image can contain. This was computed earlier and can now be rewritten as the image bandwidth expression:
Image bandwidth (lines/distance) = 1⁄2 resolution (lines/distance).
Certainly, an image where all the pixels are of the same value does not convey much information. However, a very complex scene with a great amount of detail can reveal a good deal of information. Like we saw with the stopwatch in Figure 9-5, the image in 9-5b with the higher resolution and higher spatial frequency is the image with the greater bandwidth.
When images are transmitted over communication channels, the bandwidth of the channel will have a substantial effect on the speed at which images can be passed. Images are, by nature, high-information-content data structures. To illustrate this, consider the fact that a single frame of an HDTV image is roughly 6.2 billion pixels and to generate a 30-frame-per-second image sequence we need a channel capable of processing 186 billion pixels per second. With HDTV, it is necessary to reduce the amount of data (not information!) using compression techniques so that a channel of lesser bandwidth may be used. Nevertheless, a channel bandwidth of 8 MHz is needed. We can contrast this to analog TV, which requires only 4 MHz.
B. Imaging systems Imaging systems include devices and methods used to capture and store images. These systems can capture images live from natural scenes or copy images that have been stored to a medium such as film or paper. Imaging refers to the methodologies associated with capturing, storing, and computer-processing images. Some clarification in terminology is now required. Images formed optically are referred to simply as images, and images that have been captured onto film are called pictures. These two terms are used interchangeably when the images are captured or

P H O T O N I C D E V I C E S F O R I M A G I N G , D I S P L A Y , A N D S T O R A G E
359
scanned electronically for input, storage, and processing by a computer. The formal terms are digital images and digital pictures to indicate that we are talking about computer imaging. However, we will remain with convention and allow the context of use to define the type of images being discussed. When the potential for confusion arises, we will specify computer image or picture to clarify.
Cameras A camera is a photonic device that uses a lens system to form the image of a natural scene onto a recording medium. The first cameras employed various chemical compounds to record scenes onto paper, polymer sheets, or other inert substrates—called the film—such as glass or plastic. The basic parts of a camera are illustrated in Figure 9-7. The film responds to light through chemical change. Light-sensitive compounds change in varying degrees depending on the intensity and wavelength of the light. Other chemicals are used to develop the film and reveal the image as it was recorded to the film.
Figure 9-7 Parts of a camera
Light enters the camera through the lens system and is imaged onto the medium. The medium responds to the light proportionally, so some means must be provided to control the length of time that the image is allowed to illuminate the film. This time is controlled by the shutter, which is nothing more than a mechanical window that stays closed until it is time to expose the film. When that time arrives, the shutter opens for a preset amount of time, the exposure time. Exposure times vary depending on the lighting conditions, the camera optics, and the film. There are three critical aspects to camera photography: f-stop, shutter speed, and film speed.
The f-stop is the ratio of the focal length of the lens to the diameter of the lens opening, or aperture. The size of the aperture is controlled by turning a collar typically located at the base of the lens. Typical values may be f 2, f 2.8, f 5.6, and f 16 where the “f” denotes the f-stop, sometimes referred to as f-numbers. Smaller f-numbers—f 2, f 2.8, etc.—represent larger apertures, and higher f-numbers—f 11, f 16, f 22, etc.—give smaller apertures. The f-stops are
F U N D A M E N T A L S O F P H O T O N I C S
360
arranged so that each f-number allows exactly half as much light through as the previous one and twice as much light through as the next. For example:
f-number 1.4 2 2.8 4 5.6 8 11 16 relative brightness 1 1⁄2 1⁄4 1⁄8 1⁄16 1⁄32 1⁄64 1⁄128
Shutter speed is a measure of how long the shutter remains open when the picture is taken. On manual cameras, it is usually set by means of a dial on the top of the camera or, less commonly, a ring around the base of the lens. Typical shutter speeds are 1⁄1000, 1⁄500, 1⁄250, 1⁄15 and 1 second. Note that, like f-stop, shutter speeds differ by factors of 2. This makes it easier for photographers to judge camera settings for the subjects or scenes they are trying to photograph. It is for this reason that much of photography is considered to be an art.
Film speed is a measure of how sensitive the film is to light and is measured by an International Standards Organization (ISO) number. High-sensitivity films are often called fast, and low-sensitivity films are called slow. Standard film speeds are ISO 100, ISO 200, and ISO 400. A film rated at ISO 200 needs half as much light to form the same image density as one rated at ISO 100. Note that ISO 400 is one stop faster than ISO 200 and two stops faster than ISO 100. Generally, if you need to take pictures in low light conditions, you need a faster film. You also need a fast film if your subject is in motion because, to freeze the motion, the shutter speed must be set very short. This, in turn, limits the total amount of light available to expose the film.
Automatic cameras have mechanisms, both electronic and mechanical, that simplify the setting of camera parameters. They also restrict the flexibility of the camera and sometimes limit the types of film and lenses that may be used. The photonics laboratory often includes cameras that are designed to interface with other components found on a well-equipped optical bench. A camera is called for when the optical signals produced are images and a permanent, hard-copy record is desired. Cameras are also useful for recording experimental setups and for recording the data from sequences of complex experiments. The photonics technician is typically responsible for camera setup and operation as well as for obtaining film and camera supplies. Operation of laboratory cameras used to record experimental data can be complex, and in all cases the instruction manuals must be consulted prior to use. Inexpensive automatic cameras are adequate for recording experimental setups for archive or documentation use. Inexpensive Polaroid cameras are also useful for these tasks because the film can develop itself quickly into a print or negative.
After images are acquired, the film is sent for processing into final form. This form may be slides, photographs, or negatives. Some film processing facilities offer the option of receiving film images in digital form on compact disks. Photonics experiments may require the use of specially prepared slides for use in later experiments (such as holography). Cameras have appeared recently that use electronic CCD arrays in place of the chemical film media. These cameras store images in electronic computer memories and the results are available nearly instantaneously. However, the availability of “hard copy,” or printed results, is dependent on whether a printer is available to produce the prints. Printers capable of high-resolution, high-quality output comparable to that obtainable from chemical film technologies can be prohibitively expensive. CCD cameras are discussed in greater detail in Section II A.
P H O T O N I C D E V I C E S F O R I M A G I N G , D I S P L A Y , A N D S T O R A G E
361
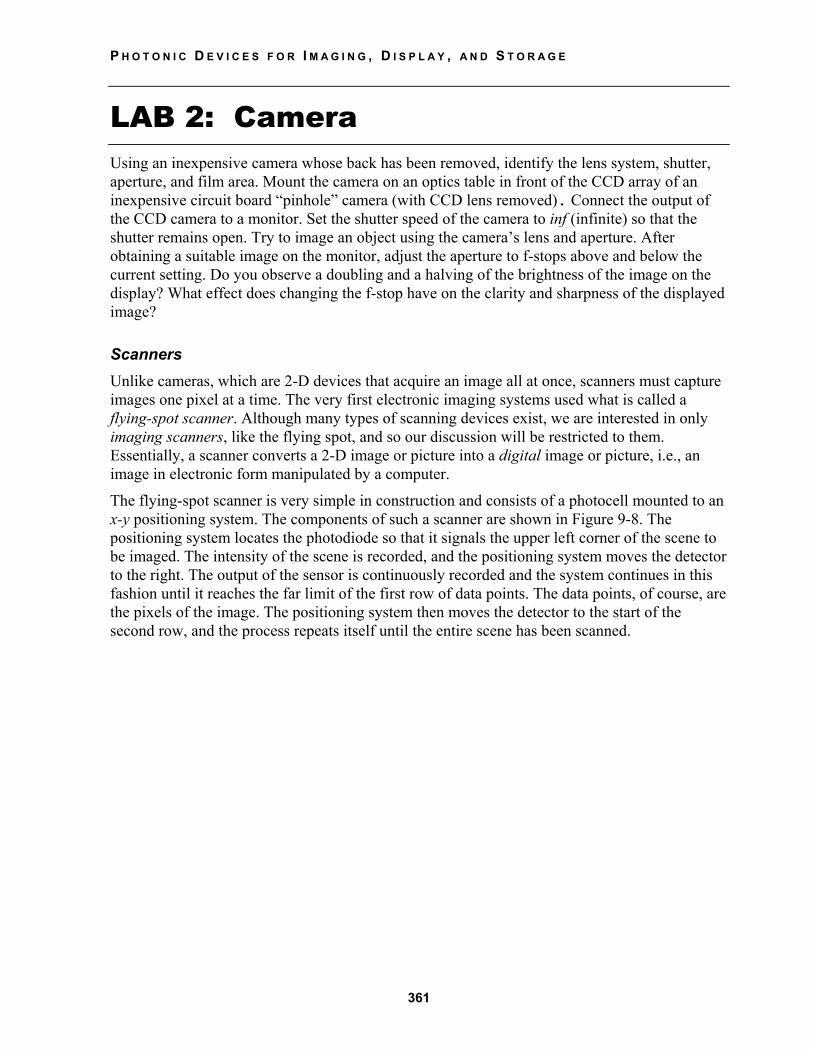
LAB 2: Camera Using an inexpensive camera whose back has been removed, identify the lens system, shutter, aperture, and film area. Mount the camera on an optics table in front of the CCD array of an inexpensive circuit board “pinhole” camera (with CCD lens removed). Connect the output of the CCD camera to a monitor. Set the shutter speed of the camera to inf (infinite) so that the shutter remains open. Try to image an object using the camera’s lens and aperture. After obtaining a suitable image on the monitor, adjust the aperture to f-stops above and below the current setting. Do you observe a doubling and a halving of the brightness of the image on the display? What effect does changing the f-stop have on the clarity and sharpness of the displayed image?
Scanners Unlike cameras, which are 2-D devices that acquire an image all at once, scanners must capture images one pixel at a time. The very first electronic imaging systems used what is called a flying-spot scanner. Although many types of scanning devices exist, we are interested in only imaging scanners, like the flying spot, and so our discussion will be restricted to them. Essentially, a scanner converts a 2-D image or picture into a digital image or picture, i.e., an image in electronic form manipulated by a computer.
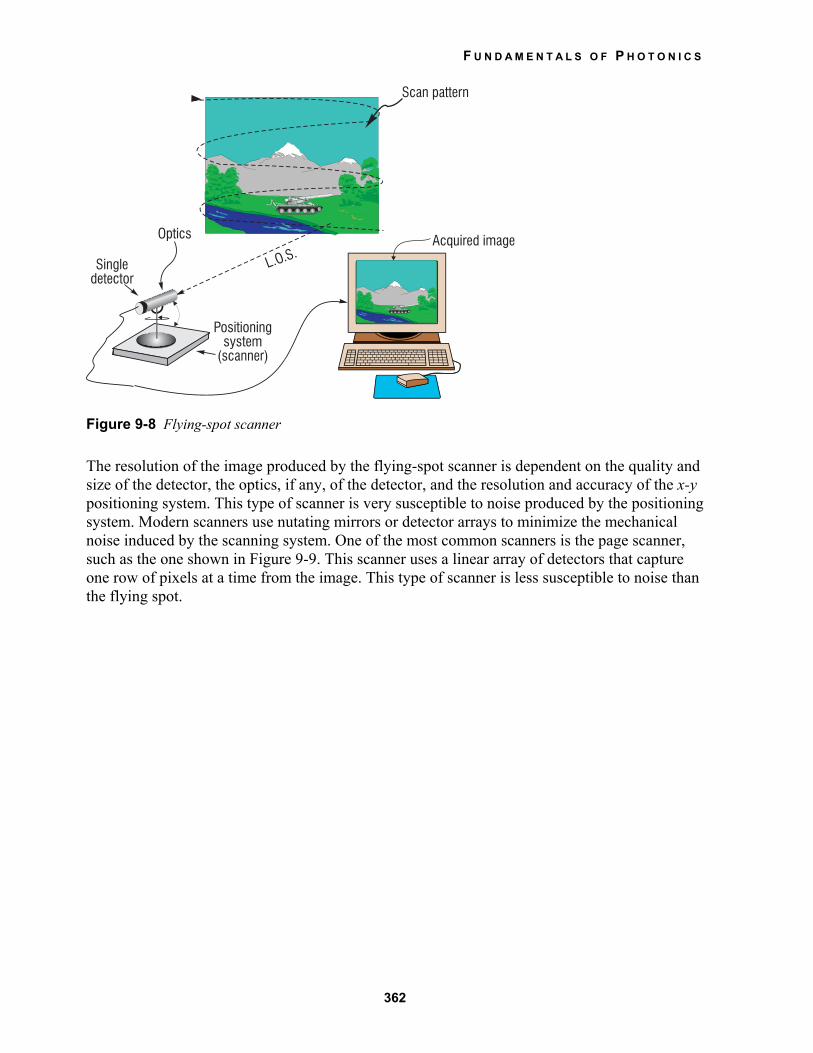
The flying-spot scanner is very simple in construction and consists of a photocell mounted to an x-y positioning system. The components of such a scanner are shown in Figure 9-8. The positioning system locates the photodiode so that it signals the upper left corner of the scene to be imaged. The intensity of the scene is recorded, and the positioning system moves the detector to the right. The output of the sensor is continuously recorded and the system continues in this fashion until it reaches the far limit of the first row of data points. The data points, of course, are the pixels of the image. The positioning system then moves the detector to the start of the second row, and the process repeats itself until the entire scene has been scanned.
F U N D A M E N T A L S O F P H O T O N I C S
362
Figure 9-8 Flying-spot scanner
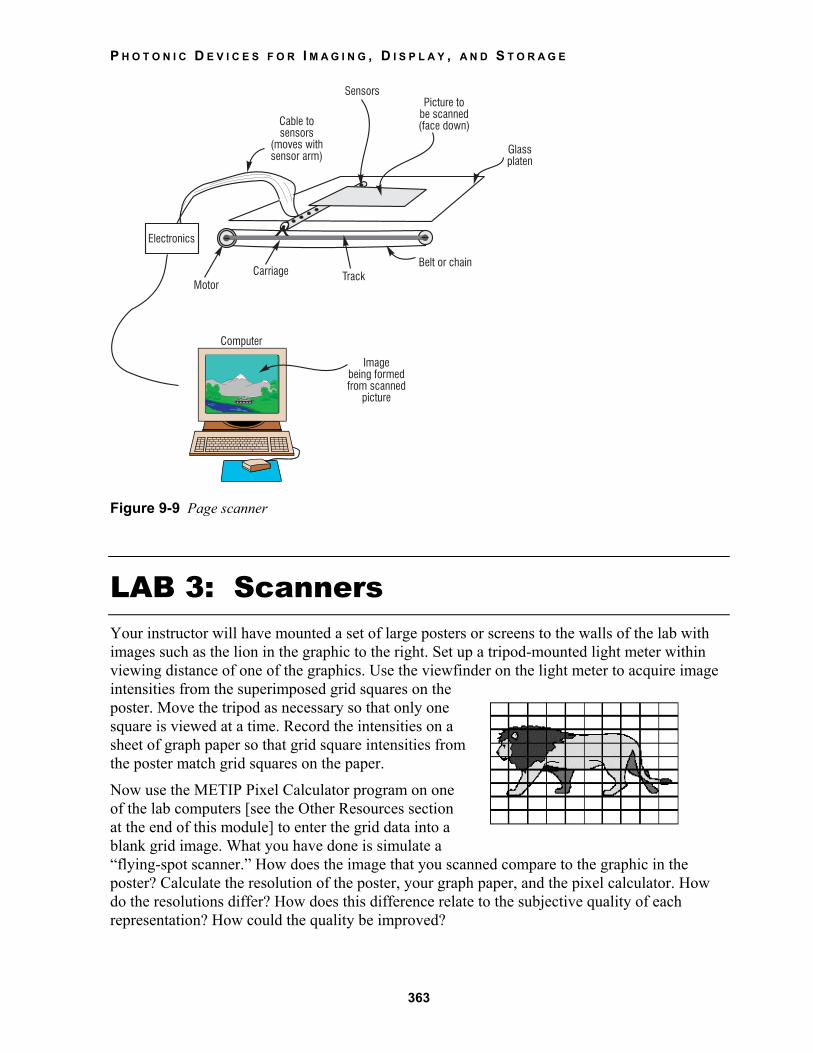
The resolution of the image produced by the flying-spot scanner is dependent on the quality and size of the detector, the optics, if any, of the detector, and the resolution and accuracy of the x-y positioning system. This type of scanner is very susceptible to noise produced by the positioning system. Modern scanners use nutating mirrors or detector arrays to minimize the mechanical noise induced by the scanning system. One of the most common scanners is the page scanner, such as the one shown in Figure 9-9. This scanner uses a linear array of detectors that capture one row of pixels at a time from the image. This type of scanner is less susceptible to noise than the flying spot.
P H O T O N I C D E V I C E S F O R I M A G I N G , D I S P L A Y , A N D S T O R A G E
363
Figure 9-9 Page scanner
LAB 3: Scanners Your instructor will have mounted a set of large posters or screens to the walls of the lab with images such as the lion in the graphic to the right. Set up a tripod-mounted light meter within viewing distance of one of the graphics. Use the viewfinder on the light meter to acquire image intensities from the superimposed grid squares on the poster. Move the tripod as necessary so that only one square is viewed at a time. Record the intensities on a sheet of graph paper so that grid square intensities from the poster match grid squares on the paper.
Now use the METIP Pixel Calculator program on one of the lab computers [see the Other Resources section at the end of this module] to enter the grid data into a blank grid image. What you have done is simulate a
“flying-spot scanner.” How does the image that you scanned compare to the graphic in the poster? Calculate the resolution of the poster, your graph paper, and the pixel calculator. How do the resolutions differ? How does this difference relate to the subjective quality of each representation? How could the quality be improved?

F U N D A M E N T A L S O F P H O T O N I C S
364
Files When images have been acquired, by either a camera or a scanner, they must be stored for easy access and cataloging. Print images are easily stored using standard office filing procedures, although care must be take to ensure that proper environmental conditions—such as temperature and humidity—are maintained. Also, some print media are light sensitive even after processing, and these images should be filed in special opaque envelopes designed for photographic storage.
Images captured electronically may be filed on disk or tape for archival purposes. For many years magnetic tape was the medium of choice for archiving image files, but today the removable diskette has replaced tape systems. Two issues of great importance must be addressed when storing image data to files—the resolution of the image and the file storage format. Both of these issues will impact the size of the storage medium required to archive the images. Resolution affects the gross size of the image in terms of computer memory requirements.
A grayscale image with a matrix of 1024 × 1024 pixels that uses one byte per pixel will require 1 megabyte of storage if the image data are stored in raw form with no further processing. Table 9-1 shows a comparison between common digital storage media in terms of how many raw 1024 × 1024 images can be archived, the access rate of the device that reads and writes the medium, and the relative stability of the medium. This chart is crude because the capacities may change dramatically in a very short time.
Nevertheless, you can see how choice of medium for archiving images is no trivial task. If the images are data collected from rare events, highly stable media will be best, such as CD-ROM or DVD diskettes. If there is a lot of data, a tape medium may be the best choice. Computer memory has no longevity because the data are lost upon removal of power. Hard disks can be useful for image archiving if the data are used often, since they are the fastest method (short of computer memory) for storing and retrieving data. Hard-disk data are easily backed up using one of the less volatile media to ensure that a device failure does not cause loss of data.
Table 9-1 Storage Medium Capacities Media Number of Images* Speed Longevity
Computer memory 128 Very Fast None Hard disk 10,000 Fast Low CD-ROM 600 Medium Extreme DVD 5,000 Medium Extreme Tape 20,000 Slow High
*1024-×-1024-pixel images (1 byte per pixel)
Like film media, digital media must be stored carefully according to the manufacturer instructions. Magnetic media such as tapes must be kept away from strong magnetic fields. Power supplies for high-powered laser systems can generate damaging electromagnetic fields, and so caution must be exercised when using or transporting magnetic computer media near these devices. This type of negative influence is called electromagnetic interference (EMI) or radio-frequency interference (RFI), and commercial equipment must be shielded from these fields. However, some special-purpose laboratory equipment may not be adequately shielded and so caution must be exercised.

P H O T O N I C D E V I C E S F O R I M A G I N G , D I S P L A Y , A N D S T O R A G E
365
Digital images are stored as computer files. Files are groupings of data that are kept on digital storage media like those described above. When the digital image is stored directly as pixels, the file that holds the data is called a raw image file. These files can be quite large and the storage of a large number of them can be difficult and time consuming. Some files use a compression scheme to reduce the amount of data that must be stored, but one must be very careful in the selection of the technique used. Compression schemes take advantage of the repetition in pixel characteristics, e.g., color, brightness, etc., that occurs in large collections of data or in the features that make up the image.
Figure 9-10 Simple graphic image
Imagine an image such as that shown in Figure 9-10. This could be an image requiring a large amount of data storage, or we could just store the phrase “A large circle with horizontal lines through it.” Likewise, we could have an image that used only a few different pixel values. For this sort of image, we could make up very short codes to represent the pixel data. These shortened codes could be stored along with a code key to allow us to reconstruct the original pixel values when we want the image restored. In both cases, we could store a very small encoded image or description rather than the original large one. With the latter approach, we could get back our original image with no degradation or loss of original pixels. But not so for the first approach, where how the reconstructed image would look would depend completely on the artistic and drawing skill of the individual tasked with recreating “a large circle with horizontal lines through it.” The point of this discussion is that compression schemes may be lossless or lossy. In almost all cases the lossy schemes give the best data reduction. This is why we say that you must be cautious in using image file formats, since some may give excellent compression but the cost of the compression will be paid in data loss. Table 9-2 lists a few popular file formats and the types of compression schemes that they employ.
F U N D A M E N T A L S O F P H O T O N I C S
366
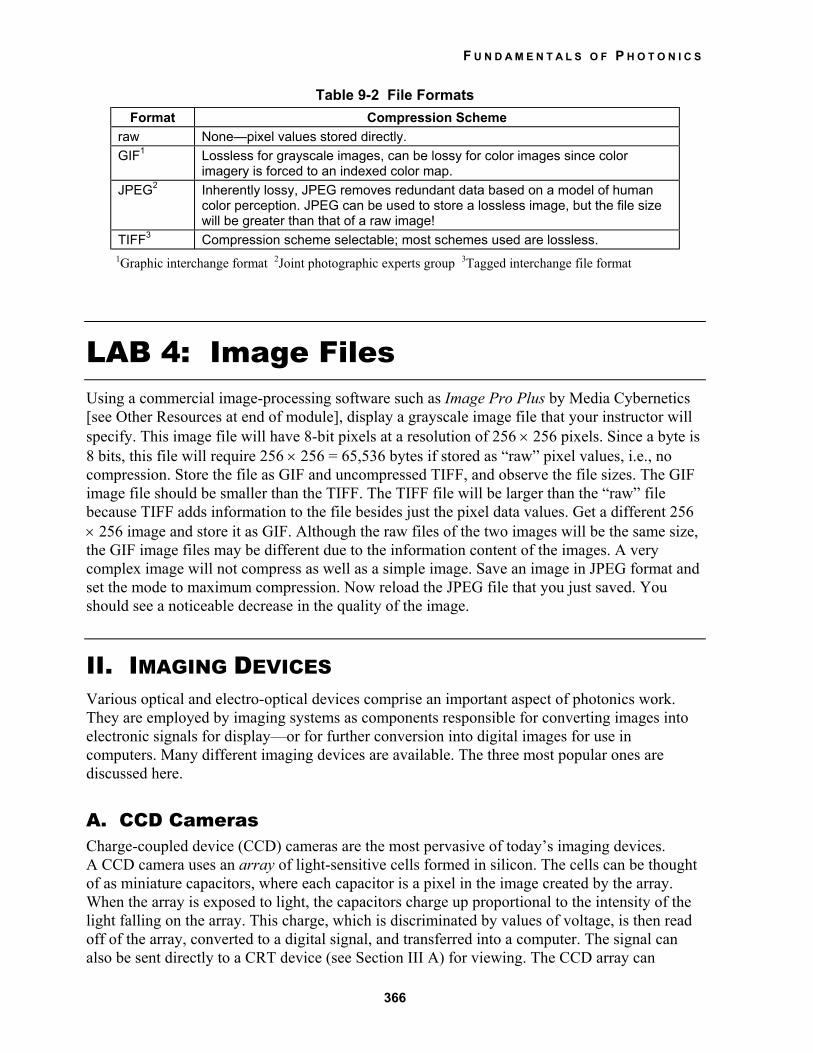
Table 9-2 File Formats Format Compression Scheme
raw None—pixel values stored directly. GIF1 Lossless for grayscale images, can be lossy for color images since color
imagery is forced to an indexed color map. JPEG2 Inherently lossy, JPEG removes redundant data based on a model of human
color perception. JPEG can be used to store a lossless image, but the file size will be greater than that of a raw image!
TIFF3 Compression scheme selectable; most schemes used are lossless. 1Graphic interchange format 2Joint photographic experts group 3Tagged interchange file format
LAB 4: Image Files Using a commercial image-processing software such as Image Pro Plus by Media Cybernetics [see Other Resources at end of module], display a grayscale image file that your instructor will specify. This image file will have 8-bit pixels at a resolution of 256 × 256 pixels. Since a byte is 8 bits, this file will require 256 × 256 = 65,536 bytes if stored as “raw” pixel values, i.e., no compression. Store the file as GIF and uncompressed TIFF, and observe the file sizes. The GIF image file should be smaller than the TIFF. The TIFF file will be larger than the “raw” file because TIFF adds information to the file besides just the pixel data values. Get a different 256 × 256 image and store it as GIF. Although the raw files of the two images will be the same size, the GIF image files may be different due to the information content of the images. A very complex image will not compress as well as a simple image. Save an image in JPEG format and set the mode to maximum compression. Now reload the JPEG file that you just saved. You should see a noticeable decrease in the quality of the image.
II. IMAGING DEVICES Various optical and electro-optical devices comprise an important aspect of photonics work. They are employed by imaging systems as components responsible for converting images into electronic signals for display—or for further conversion into digital images for use in computers. Many different imaging devices are available. The three most popular ones are discussed here.
A. CCD Cameras Charge-coupled device (CCD) cameras are the most pervasive of today’s imaging devices. A CCD camera uses an array of light-sensitive cells formed in silicon. The cells can be thought of as miniature capacitors, where each capacitor is a pixel in the image created by the array. When the array is exposed to light, the capacitors charge up proportional to the intensity of the light falling on the array. This charge, which is discriminated by values of voltage, is then read off of the array, converted to a digital signal, and transferred into a computer. The signal can also be sent directly to a CRT device (see Section III A) for viewing. The CCD array can
P H O T O N I C D E V I C E S F O R I M A G I N G , D I S P L A Y , A N D S T O R A G E
367
replace the film medium in a camera, where the camera optics form an image on the array instead of on the usual film.
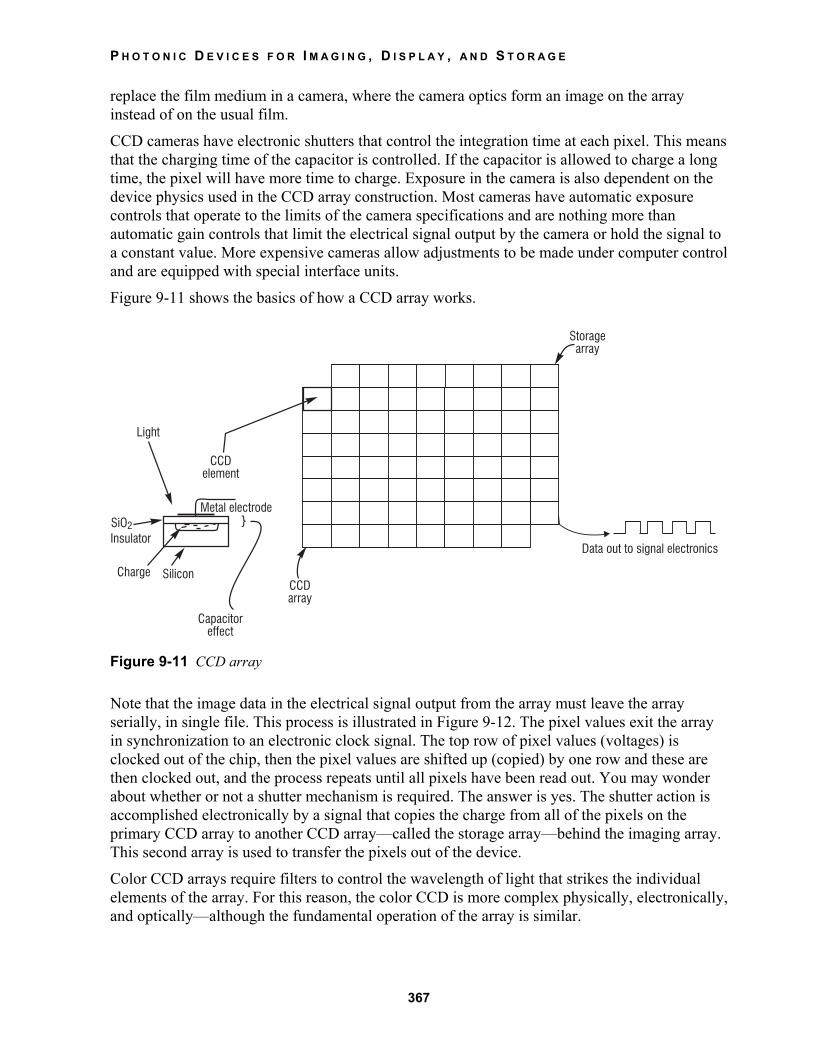
CCD cameras have electronic shutters that control the integration time at each pixel. This means that the charging time of the capacitor is controlled. If the capacitor is allowed to charge a long time, the pixel will have more time to charge. Exposure in the camera is also dependent on the device physics used in the CCD array construction. Most cameras have automatic exposure controls that operate to the limits of the camera specifications and are nothing more than automatic gain controls that limit the electrical signal output by the camera or hold the signal to a constant value. More expensive cameras allow adjustments to be made under computer control and are equipped with special interface units.
Figure 9-11 shows the basics of how a CCD array works.
Figure 9-11 CCD array
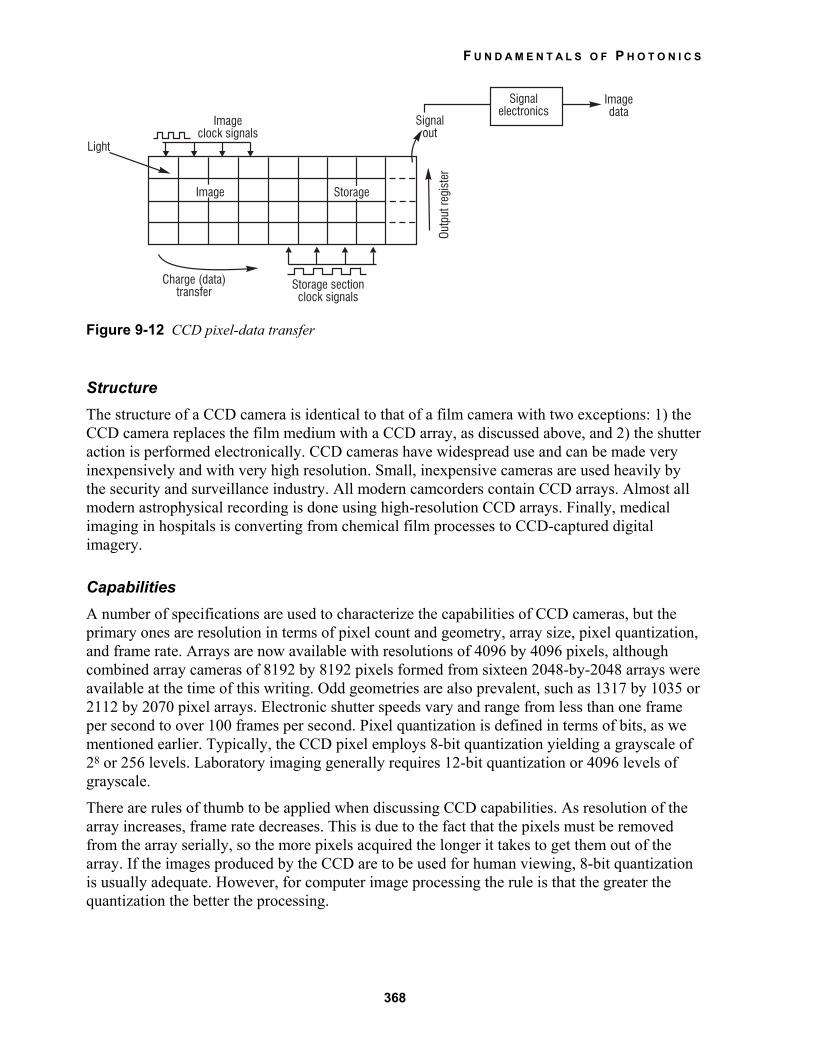
Note that the image data in the electrical signal output from the array must leave the array serially, in single file. This process is illustrated in Figure 9-12. The pixel values exit the array in synchronization to an electronic clock signal. The top row of pixel values (voltages) is clocked out of the chip, then the pixel values are shifted up (copied) by one row and these are then clocked out, and the process repeats until all pixels have been read out. You may wonder about whether or not a shutter mechanism is required. The answer is yes. The shutter action is accomplished electronically by a signal that copies the charge from all of the pixels on the primary CCD array to another CCD array—called the storage array—behind the imaging array. This second array is used to transfer the pixels out of the device.
Color CCD arrays require filters to control the wavelength of light that strikes the individual elements of the array. For this reason, the color CCD is more complex physically, electronically, and optically—although the fundamental operation of the array is similar.
F U N D A M E N T A L S O F P H O T O N I C S
368
Figure 9-12 CCD pixel-data transfer
Structure The structure of a CCD camera is identical to that of a film camera with two exceptions: 1) the CCD camera replaces the film medium with a CCD array, as discussed above, and 2) the shutter action is performed electronically. CCD cameras have widespread use and can be made very inexpensively and with very high resolution. Small, inexpensive cameras are used heavily by the security and surveillance industry. All modern camcorders contain CCD arrays. Almost all modern astrophysical recording is done using high-resolution CCD arrays. Finally, medical imaging in hospitals is converting from chemical film processes to CCD-captured digital imagery.
Capabilities A number of specifications are used to characterize the capabilities of CCD cameras, but the primary ones are resolution in terms of pixel count and geometry, array size, pixel quantization, and frame rate. Arrays are now available with resolutions of 4096 by 4096 pixels, although combined array cameras of 8192 by 8192 pixels formed from sixteen 2048-by-2048 arrays were available at the time of this writing. Odd geometries are also prevalent, such as 1317 by 1035 or 2112 by 2070 pixel arrays. Electronic shutter speeds vary and range from less than one frame per second to over 100 frames per second. Pixel quantization is defined in terms of bits, as we mentioned earlier. Typically, the CCD pixel employs 8-bit quantization yielding a grayscale of 28 or 256 levels. Laboratory imaging generally requires 12-bit quantization or 4096 levels of grayscale.
There are rules of thumb to be applied when discussing CCD capabilities. As resolution of the array increases, frame rate decreases. This is due to the fact that the pixels must be removed from the array serially, so the more pixels acquired the longer it takes to get them out of the array. If the images produced by the CCD are to be used for human viewing, 8-bit quantization is usually adequate. However, for computer image processing the rule is that the greater the quantization the better the processing.

P H O T O N I C D E V I C E S F O R I M A G I N G , D I S P L A Y , A N D S T O R A G E
369
B. Vidicons The vidicon is an electron tube that has been designed to capture images and convert them to electrical signals. The signals produced by a vidicon are similar to those generated by a CCD array, but they are produced from an electron beam as opposed to a silicon charge system. The vidicon tube was invented in 1951 and has seen little change in basic design since that time. It was used extensively in the broadcast (TV) industry until the advent of the CCD. Likewise, the CCD camera is slowly replacing the vidicon in both scientific and medical imaging as CCD technology improves and vidicon technology ages. The two greatest drawbacks to the vidicon are the delicacy of the vacuum tube and the high voltage requirements for the electron scanning beam.
Structure The components of the vidicon tube are diagrammed in Figure 9-13. A cylindrical glass tube is constructed with a flat glass plate window at one end. Inside the tube and behind this window is a photoconductive target. The material from which this target is made has the property that electrical resistance varies according to the intensity of illumination that strikes it. An external lens system is used to image a scene onto the window of the vidicon, which then charges the target material to varying intensities depending on the illumination. An electrode is placed at the other end of the tube. The electrode produces an electron beam when the glass tube is sealed under a vacuum. The beam is focused and deflected by a set of coils that surround the tube. The beam is scanned across the target, and an electrical signal is developed that is then output from the target. The voltage of this signal is proportional to the resistance of the target at the position of the beam and to the light intensity striking the target at that location. The signal output is then synchronized to the electron beam and output as the electronic image.
Figure 9-13 Vidicon tube
F U N D A M E N T A L S O F P H O T O N I C S
370
Capabilities As discussed earlier, vidicons are becoming obsolete as the capabilities of CCD arrays are improved. At one time they were the system of choice for medical and scientific imagery because of their high speed and high resolution. But now the CCD array camera has exceeded these capabilities. So companies have formed that offer CCD replacement units for vidicon tube cameras.
The delicacy of the glass vidicon tubes and the complexity of the electronics required to drive them have contributed to their demise. The resolution of the vidicon is dependent on the construction of the glass envelope, the type of photoconductive material used, and the complexity of the electronics. If the electronics are susceptible to noise or suffer from thermal drift, the scanning beam will not accurately track the image formed by the phosphors and final image quality will be degraded.
C. Image Intensifiers The image intensifier is a vacuum-tube device (similar to the vidicon) that accepts an image at one end and produces an image of higher intensity at the other. The image intensifier can be considered an image amplifier that uses energy to achieve the necessary amplification. These devices are used in low-light-level situations such as night vision and astronomy. Image intensifiers were first developed to work with vidicons and other early electronic camera technologies and were often manufactured as components of these cameras. Modern image intensifiers are used as adapter to cameras or by themselves as night-vision devices under starlight conditions.
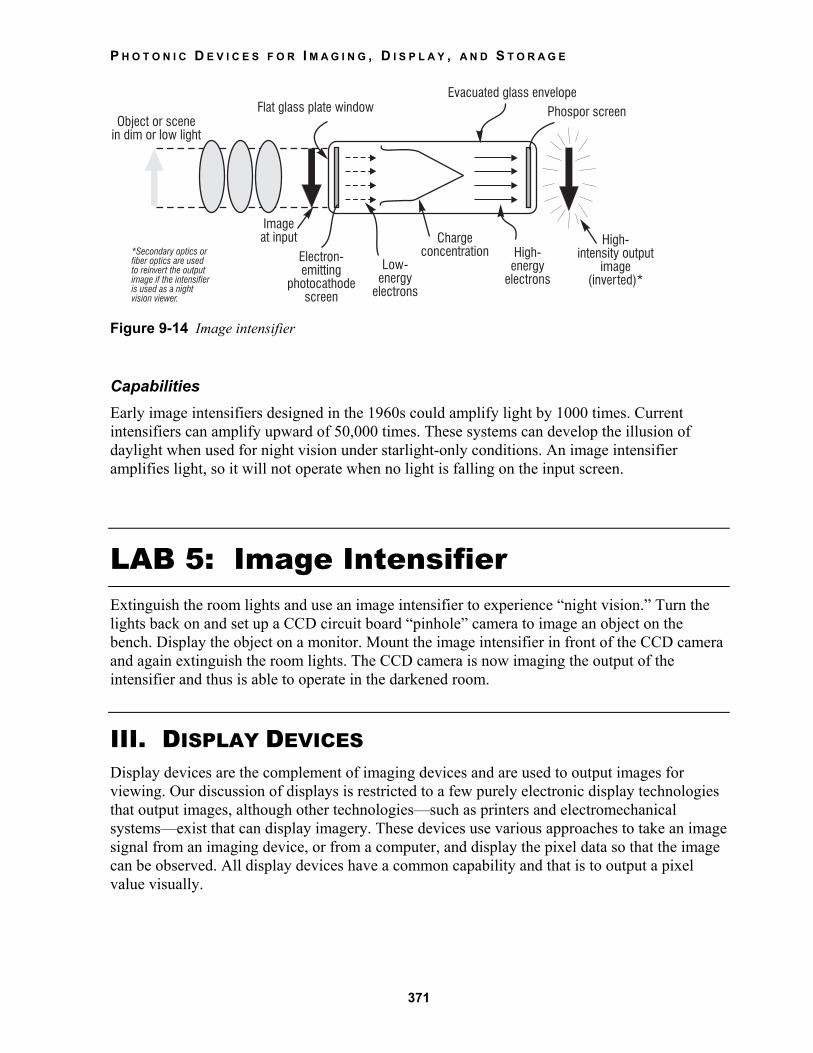
Structure The image-intensifier tube has a photocathode screen at one end and a phosphor screen at the other end as shown in Figure 9-14. The photocathode is a material, such as gallium arsenide, that emits electrons when exposed to light. An optical system is used to image a scene onto the photocathode, and electrons are emitted in proportion to the amount of light imaged. The electrons are accelerated by an electric field, which produces a gain in terms of number of electrons at the phosphor screen. When the electrons strike the phosphor screen, the screen emits visible light and produces an intensified image on the photocathode screen of the scene formed at the input end of the tube.
P H O T O N I C D E V I C E S F O R I M A G I N G , D I S P L A Y , A N D S T O R A G E
371
Figure 9-14 Image intensifier
Capabilities Early image intensifiers designed in the 1960s could amplify light by 1000 times. Current intensifiers can amplify upward of 50,000 times. These systems can develop the illusion of daylight when used for night vision under starlight-only conditions. An image intensifier amplifies light, so it will not operate when no light is falling on the input screen.
LAB 5: Image Intensifier Extinguish the room lights and use an image intensifier to experience “night vision.” Turn the lights back on and set up a CCD circuit board “pinhole” camera to image an object on the bench. Display the object on a monitor. Mount the image intensifier in front of the CCD camera and again extinguish the room lights. The CCD camera is now imaging the output of the intensifier and thus is able to operate in the darkened room.
III. DISPLAY DEVICES Display devices are the complement of imaging devices and are used to output images for viewing. Our discussion of displays is restricted to a few purely electronic display technologies that output images, although other technologies—such as printers and electromechanical systems—exist that can display imagery. These devices use various approaches to take an image signal from an imaging device, or from a computer, and display the pixel data so that the image can be observed. All display devices have a common capability and that is to output a pixel value visually.

F U N D A M E N T A L S O F P H O T O N I C S
372
A. Introduction to Cathode-Ray Tubes The cathode-ray tube (CRT) is the oldest electronic display technology and—unlike vidicons and flying-spot scanners—is in little danger of becoming technologically extinct in the near term. The CRT is a vacuum tube, much like a combination of a vidicon and an image intensifier. The image signal to be displayed is input as a serial sequence of pixel data, and these data are displayed through the use of luminous phosphors at the viewing end of the tube.
Construction Figure 9-15 shows a schematic drawing of how a basic CRT is constructed. The principal component parts are labeled. At one end is the electron gun. This unit produces a stream of electrons that are modulated in intensity by the image signal as it is accessed. The electrons are accelerated toward the opposite end of the tube by electromagnetic coils. The coils also play a role in focusing the beam, which also passes through opposing x-y charged plates that are used to electronically sweep the beam across a phosphor-coated screen at the far end. The electronics required to synchronize the beam to the input signal stream and to perform the scanning operation are quite sophisticated. At the end of the scan, the electronics must cause the beam to shut down while it is sent back to the start point of the scan.
Figure 9-15 Cathode-ray tube (CRT)
Capabilities CRT displays are capable of very-high-resolution output and can display very large images. They can also handle very high frame rates and can output black and white (intensity only) images or color images. Modern CRT displays are equipped with electronic controls so that they can automatically adjust to various resolutions and color requirements of images output from computers or received as television signals.
B. Flat-Panel Liquid-Crystal Displays Liquid crystals are substances whose material state is somewhere between crystals and liquids. They appear to be like a gel and have very interesting and useful properties. Liquid crystals are light-polarizing substances, and their polarization can be modified by the application of an
P H O T O N I C D E V I C E S F O R I M A G I N G , D I S P L A Y , A N D S T O R A G E
373
electric field. This property makes them useful in display technologies. The advantages of LCD displays include low cost, small size, and low power consumption. Their primary disadvantage is that they modulate light and so require external light sources to operate. The light source used to illuminate a large LCD display, such as those used for computer or television screens, is typically supplied from behind the display itself and is called a backlight.
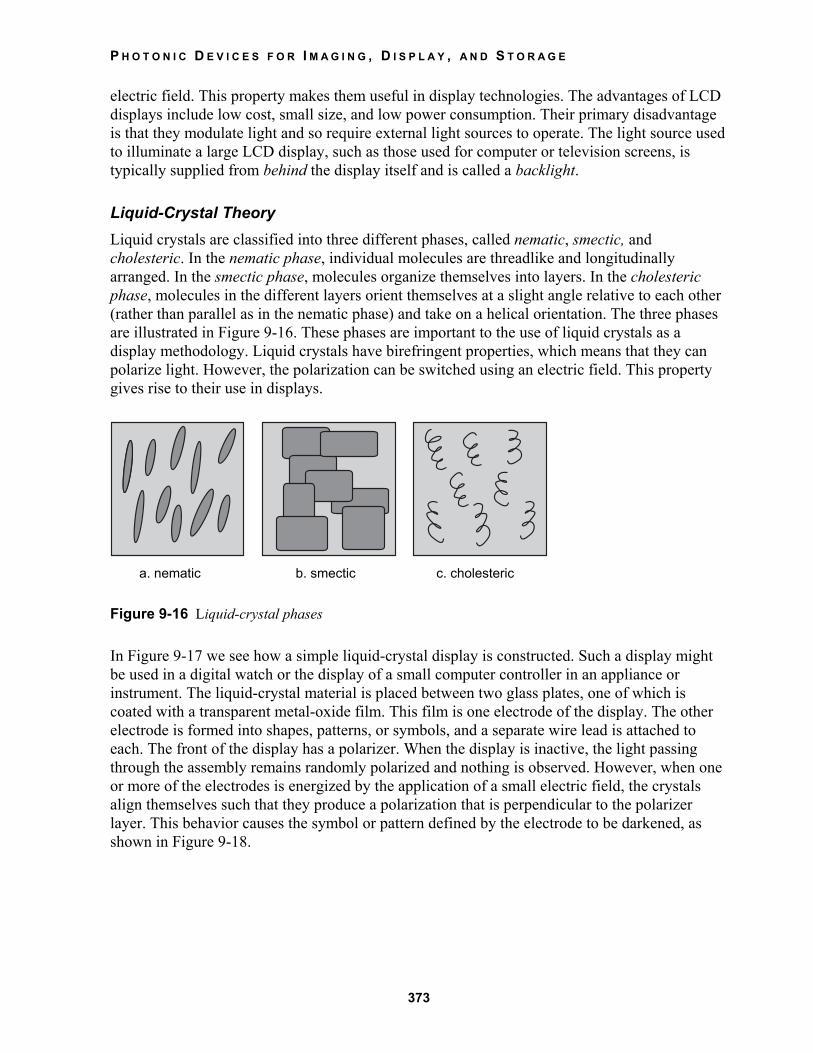
Liquid-Crystal Theory Liquid crystals are classified into three different phases, called nematic, smectic, and cholesteric. In the nematic phase, individual molecules are threadlike and longitudinally arranged. In the smectic phase, molecules organize themselves into layers. In the cholesteric phase, molecules in the different layers orient themselves at a slight angle relative to each other (rather than parallel as in the nematic phase) and take on a helical orientation. The three phases are illustrated in Figure 9-16. These phases are important to the use of liquid crystals as a display methodology. Liquid crystals have birefringent properties, which means that they can polarize light. However, the polarization can be switched using an electric field. This property gives rise to their use in displays.
a. nematic b. smectic c. cholesteric
Figure 9-16 Liquid-crystal phases
In Figure 9-17 we see how a simple liquid-crystal display is constructed. Such a display might be used in a digital watch or the display of a small computer controller in an appliance or instrument. The liquid-crystal material is placed between two glass plates, one of which is coated with a transparent metal-oxide film. This film is one electrode of the display. The other electrode is formed into shapes, patterns, or symbols, and a separate wire lead is attached to each. The front of the display has a polarizer. When the display is inactive, the light passing through the assembly remains randomly polarized and nothing is observed. However, when one or more of the electrodes is energized by the application of a small electric field, the crystals align themselves such that they produce a polarization that is perpendicular to the polarizer layer. This behavior causes the symbol or pattern defined by the electrode to be darkened, as shown in Figure 9-18.

F U N D A M E N T A L S O F P H O T O N I C S
374
Figure 9-17 Simple LCD construction
Figure 9-18 LCD operation
The LCD can produce a grayscale effect depending on the amount of charge placed on the electrodes. The strength of the charge controls the degree of alignment of the crystals, hence the amount of light blockage by the polarization effect. Color can also be incorporated into these displays by the addition of red, green, and blue filters.
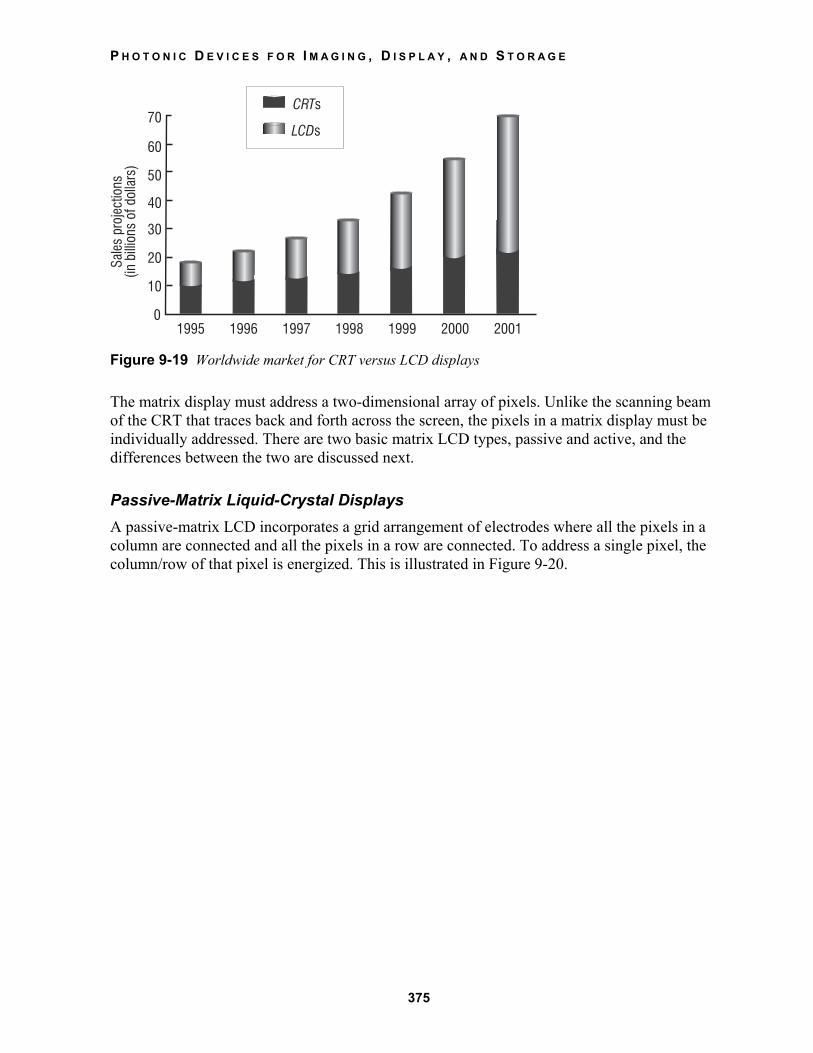
LCDs capable of displaying images, where a pixel array is required, are called matrix LCDs since the image array is a matrix of pixels. These displays are considerably more complex than the simple displays described above. However, they represent the future of imaging display technology and will eventually displace CRTs, as indicated in Figure 9-19. This figure shows the displacement of CRT technology by LCD in terms of sales volume.
P H O T O N I C D E V I C E S F O R I M A G I N G , D I S P L A Y , A N D S T O R A G E
375
Figure 9-19 Worldwide market for CRT versus LCD displays
The matrix display must address a two-dimensional array of pixels. Unlike the scanning beam of the CRT that traces back and forth across the screen, the pixels in a matrix display must be individually addressed. There are two basic matrix LCD types, passive and active, and the differences between the two are discussed next.
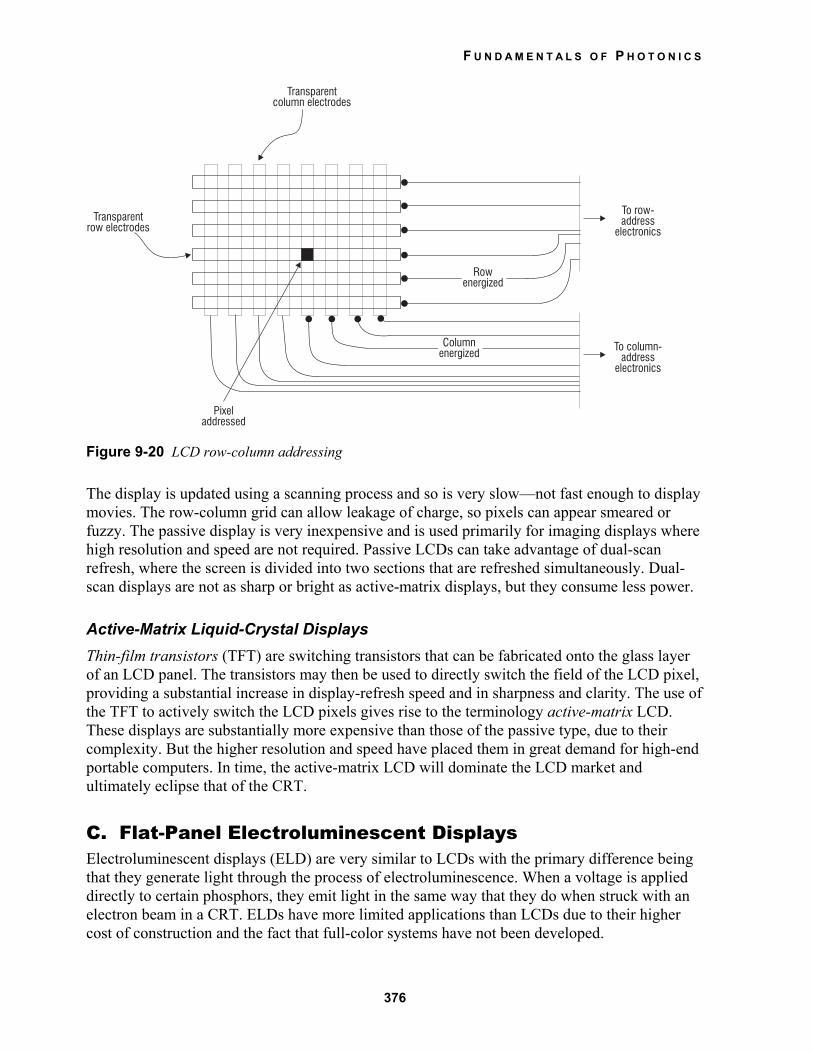
Passive-Matrix Liquid-Crystal Displays A passive-matrix LCD incorporates a grid arrangement of electrodes where all the pixels in a column are connected and all the pixels in a row are connected. To address a single pixel, the column/row of that pixel is energized. This is illustrated in Figure 9-20.
F U N D A M E N T A L S O F P H O T O N I C S
376
Figure 9-20 LCD row-column addressing
The display is updated using a scanning process and so is very slow—not fast enough to display movies. The row-column grid can allow leakage of charge, so pixels can appear smeared or fuzzy. The passive display is very inexpensive and is used primarily for imaging displays where high resolution and speed are not required. Passive LCDs can take advantage of dual-scan refresh, where the screen is divided into two sections that are refreshed simultaneously. Dual-scan displays are not as sharp or bright as active-matrix displays, but they consume less power.
Active-Matrix Liquid-Crystal Displays Thin-film transistors (TFT) are switching transistors that can be fabricated onto the glass layer of an LCD panel. The transistors may then be used to directly switch the field of the LCD pixel, providing a substantial increase in display-refresh speed and in sharpness and clarity. The use of the TFT to actively switch the LCD pixels gives rise to the terminology active-matrix LCD. These displays are substantially more expensive than those of the passive type, due to their complexity. But the higher resolution and speed have placed them in great demand for high-end portable computers. In time, the active-matrix LCD will dominate the LCD market and ultimately eclipse that of the CRT.
C. Flat-Panel Electroluminescent Displays Electroluminescent displays (ELD) are very similar to LCDs with the primary difference being that they generate light through the process of electroluminescence. When a voltage is applied directly to certain phosphors, they emit light in the same way that they do when struck with an electron beam in a CRT. ELDs have more limited applications than LCDs due to their higher cost of construction and the fact that full-color systems have not been developed.
P H O T O N I C D E V I C E S F O R I M A G I N G , D I S P L A Y , A N D S T O R A G E
377
D. Flat-Panel LED Displays LED stands for light emitting diode, and these electronic components are true photonic devices. LEDs are now available in almost any visible wavelength. Single, high-power, high-output LED units are replacing tungsten-filament light bulbs in many applications. An LED display is formed from an array of LEDs where each LED serves as a pixel. The modulation of current to the LED varies the light output and thus produces varying intensity levels. If clusters of red, green, and blue LEDs are used at each pixel position, a color image can be produced. LED displays are simpler in construction than either LCD or ELD systems. However, they are as yet incapable of the resolution of these displays and are very expensive to produce. Like the ELD, however, they produce light and so do not require an external light source for viewing. The LED display does require a greater amount of power to operate than does an LCD or an ELD.
Looking Toward the Future Image-processing and -display technology is changing daily, and these changes will impact the photonics technician of the future. One major aspect of imaging that is guaranteed to change is the resolution of displays. The two fields of work most likely to be impacted by this will be medical and military imaging. Both of these areas use photonics heavily and both are increasingly interested in capturing, displaying, and analyzing images with high information content. Systems of the future will have resolutions that exceed the capability of human sight and will place great demands on the computing systems that analyze these images. The installation and maintenance of these systems will be demanding for the photonics technician as well. In the future, display systems will place more reliance on optics and it will not be uncommon to see 3-D holographic displays and head-mounted displays of great resolution and speed so that the wearer is immersed in the image. Much of this virtual-reality work relies heavily on display technology, and the photonics technician will play a critical role in that field.
Laboratory In this laboratory you will determine the resolution of a CCD camera.
Equipment List The following equipment is needed to complete this laboratory:
1 Logitech QuickCam™ CCD camera
1 computer to support QuickCam™
1 table-tripod or holder for camera
1 ruler marked in tenths of an inch or millimeters
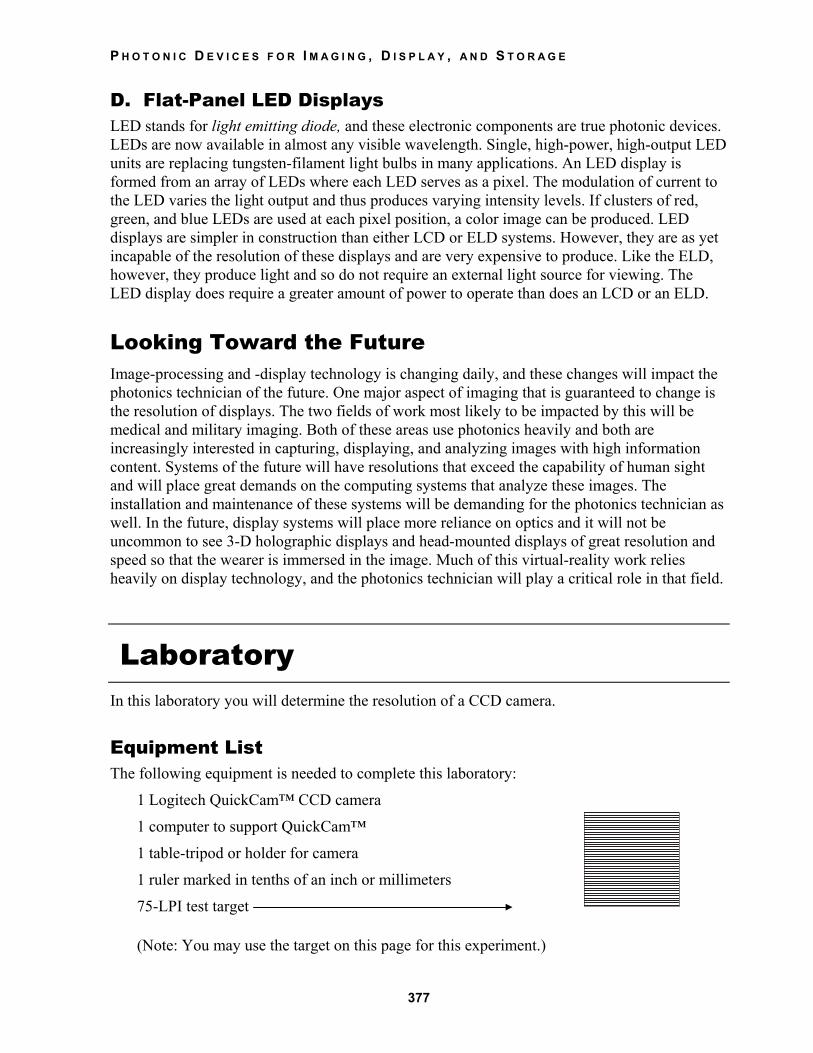
75-LPI test target
(Note: You may use the target on this page for this experiment.)

F U N D A M E N T A L S O F P H O T O N I C S
378
Procedure 1. Verify that the target has a resolution of 75 lines/inch. Do this by first measuring the
target with the ruler. The target should be 1" square. Now count the lines in the target, which should be 75. Remember to include the white lines when counting.
1. Connect the camera to the video monitor. Set the camera so that the target is imaged on the monitor with the lines on the target oriented vertically. Adjust the focus so that the lines are clearly distinguishable.
2. Move the camera (or the target) back until the lines are no longer clear, but keep the camera in focus. The goal is to stop moving the camera at just the point before the lines are no longer distinguishable. This is the point at which the camera sensors can just resolve the lines and we are at the resolution limit. The camera now has one line per pixel imaged onto the CCD array.
3. Measure the width in inches of the target appearing on the monitor and measure the width of the image displayed. The software that accompanies the QuickCam™ allows you to display the image in a window. This window should be at maximum size.
4. Compute the number of (horizontal) pixels of the camera using the following formula:
Number of pixels = (75 lines/size of target in window) × size of window.
5. To determine the resolution of the camera in lines per inch (LPI), we need to know the size of the CCD array. These data should be listed in the camera. The specifications will also list the number of pixels in the CCD, so that you can compare your experimental result to the actual specifications of the array.
6. Now turn the target so that the lines are horizontal and repeat the experiment to determine the vertical pixels. Many CCDs (like the QuickCam™) have different numbers of horizontal and vertical pixels.
Student Project (optional) Choose a recently unveiled display technology that has not been covered in the course (examples: Seiko Chip-on-Glass© or Phillips 3D-LCD). Obtain vendor literature and possibly the demo kits. Report on how the new technology is improving on current state-of-the-art devices. Determine the resolution of these products and draw a cost-per-pixel bar chart.
Other Resources Associated Available Software
• METIP Pixel Calculator, University of Washington Math Experiences Through Image Processing Program—http://www.cs.washington.edu/research/metip/metip.html
• Image Pro Plus by Media Cybernetics—http://www.mediacy.com/ippage.htm

P H O T O N I C D E V I C E S F O R I M A G I N G , D I S P L A Y , A N D S T O R A G E
379
• MATLAB Image Processing Toolkit by Math Works, Inc.—http://www.mathworks.com/products/image/
References
Textbooks Andrews, Harry C. Computer Techniques in Image Processing. New York: Academic Press, 1970. Myler, H. R. Fundamentals of Machine Vision. Bellingham: SPIE Press, 1998. Myler, H. R., and A. R. Weeks. Computer Imaging Recipes in C. Englewood Cliffs: Prentice Hall, 1993. Ono, Y. A. Electroluminescent Displays. World Scientific, 1995. Russ, John C. The Image Processing Handbook. Boca Raton: CRC Press, 1992. Tsukada, Toshihisa. TFT/LCD: liquid-crystal displays addressed by thin-film transistors. Amsterdam: Gordon and Breach, 1996.
Articles Musa, S. “Active-Matrix Liquid-Crystal Displays,” Scientific American, November 1997.
Equipment
LCD/LED Displays Digi-Key Corporation, 701 Brooks Avenue South, Thief River Falls, MN 56701. Jameco Electronics, 1355 Shoreway Road, Belmont, CA 94002.
Image Intensifiers ITT Industries Night Vision, 7671 Enon Drive, Roanoke, VA 24019.
“Pin Art” Action Products International, Inc. , 390 North Orange Avenue, Orlando, FL 32801
CCD “Pinhole” Cameras Hosfelt Electronics, 2700 Sunset Boulevard, Steubenville, OH 43952.
Logitech QuickCam Camera Logitech, Inc., 6505 Kaiser Drive, Fremont, CA 94555.

F U N D A M E N T A L S O F P H O T O N I C S
380
Problem Exercises 1. A CCD sensor array is 8.5 mm by 8.5 mm with 300 rows by 300 columns of sensors.
What is the resolution of this array in lines per inch?
2. A computer monitor can produce 4096 colors using red, green, and blue pixels. Can you explain this in terms of bits per pixel?
3. A computer monitor is 15" by 15" with a resolution of 1024 by 1024 pixels. If a binary image is displayed on the monitor, what will be the result if the image is printed on an 8.5" by 11" sheet of paper by a laser printer capable of 300 DPI?
4. Photographs taken during a recent experiment have turned out to be too light. What action should be taken to correct the problem?
5. List advantages and disadvantages between flying-spot scanners and flatbed scanners.
6. A high-resolution CCD camera produces RGB color images that are 1024 × 1024 pixels with a bit-depth of 24 bits. Assuming that the images are stored in raw format, how many of these images could a CD-ROM hold?
7. You have been given a floppy disk for analysis. The disk contains image files produced by a high-resolution camera. Upon listing the disk files you note that they are in JPEG format. Does this present a problem?
8. You have just finished installing a new CCD camera into an imaging system in the lab, BUT the system cannot maintain the frame rate that it had before. What could be the problem?
9. An experiment that you are conducting generates very-low-intensity images and your CCD camera set at the widest possible aperture still produces unacceptably dark images. What might correct this problem?
10. An LCD display has a dead row of pixels. What could explain this?
11. An LCD has a resolution of 640 by 480 pixels. Will an image from a CCD camera with 380 lines of resolution be displayed at full resolution?
12. An LCD display is used to display images from a CCD camera. You notice that fine detail is missing from objects in the image. What could explain this?