Fundamentals: CAL-PASS SMART TOOL · Success (Cal-Pass) is a data consortium with participation...
26
Fundamentals: CAL PASS SMART TOOL CAL-PASS SMART TOOL Fall 2011 Fall 2011 1
Transcript of Fundamentals: CAL-PASS SMART TOOL · Success (Cal-Pass) is a data consortium with participation...

Fundamentals:CAL PASS SMART TOOLCAL-PASS SMART TOOL
Fall 2011Fall 2011
1

SMC Office of Institutional Research
Workshop OverviewWorkshop Overview
Your Research QuestionsYour Research QuestionsLearning outcomesBackgroundBackgroundData variables/elementsB iBasicsFunctionsWorked out examplesPractice
2

SMC Office of Institutional Research
Your Research QuestionsYour Research Questions
3

SMC Office of Institutional Research
Learning OutcomesLearning Outcomes
• By the end of the session workshop By the end of the session, workshop participants will…• Be able to access Cal-Pass data• Be able to access Cal-Pass data• Be familiar with the data variables/elements
in the SMART toolin the SMART tool• Be able to query data tables to answer
research questionsresearch questions
4

SMC Office of Institutional Research
BackgroundBackground
• California Partnership for Achieving Student p gSuccess (Cal-Pass) is a data consortium with participation from 6,800 K-12, community college and four year institutionscollege, and four-year institutions
• Improves student outcomes, preparation, instruction, articulation, and statewide instruction, articulation, and statewide accountability
• Contains• SMART tool (standard queries)• Data-sharing with participating K-12 and 4-years
5

SMC Office of Institutional Research
Background (continued)Background (continued)
• SMART: Standardized Metrics for Analysis, SMART: Standardized Metrics for Analysis, Reporting, and Tracking
• Dynamic and interactive data cubesy• Institution-specific data• Data source: Chancellor’s Office Management Data source: Chancellor s Office Management
Information System (COMIS)• Data are lagged by one year: most recent data
reflects last year’s data
6

SMC Office of Institutional Research
Data Variables MeasuresData Variables - Measures
What’s being measuredgCourse Enrollment CountCourse Enrollment Count Column PercentCourse Enrollment Count Row PercentDistinct Student Count
SFTESRetention RateSuccess RateSuccess RateAward Count
7

SMC Office of Institutional Research
Data Variables DimensionsData Variables - Dimensions
Variables that group, Disabilityg p,disaggregates, filters, and organizes the measuresAccounting Method
yEthnicityGenderG dAccounting Method
Age at TermBasic Skills Status
GradeLevels Below TransferSAM Code
CollegeCourse HierarchyCredit Status
SAM CodeTime PeriodTOP Code
Credit StatusDay Evening StatusDepartment
Transfer Status
8
SMC Office of Institutional Research
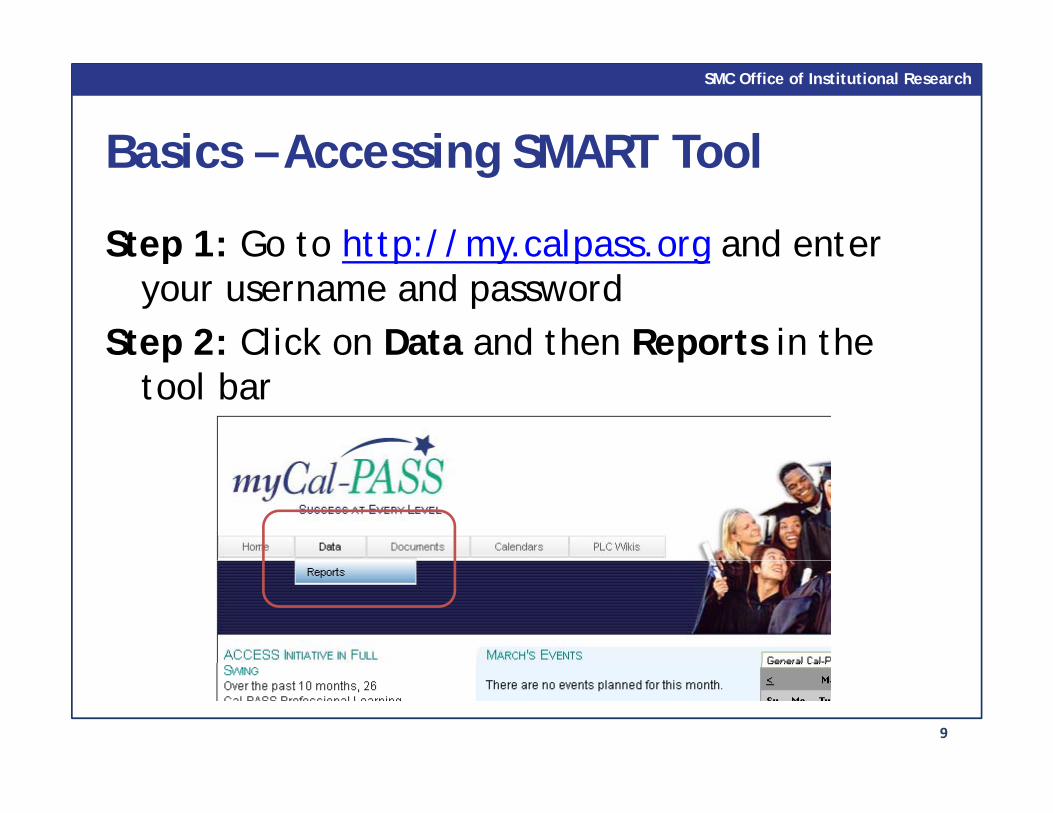
Basics Accessing SMART ToolBasics – Accessing SMART Tool
Step 1: Go to http://my.calpass.org and enter Step 1: Go to http://my.calpass.org and enter your username and password
Step 2: Click on Data and then Reports in the p : ptool bar
9

SMC Office of Institutional Research
Basics Accessing SMART Tool
Step 3: Click on SMART Tool
Basics – Accessing SMART Tool
Step 3: Click on SMART Tool
10

SMC Office of Institutional Research
Basics Accessing SMART ToolBasics – Accessing SMART Tool
Step 4: Click on one of the following “I Step 4: Click on one of the following I would like to know” options, depending on your research questionon your research question
11
SMC Office of Institutional Research
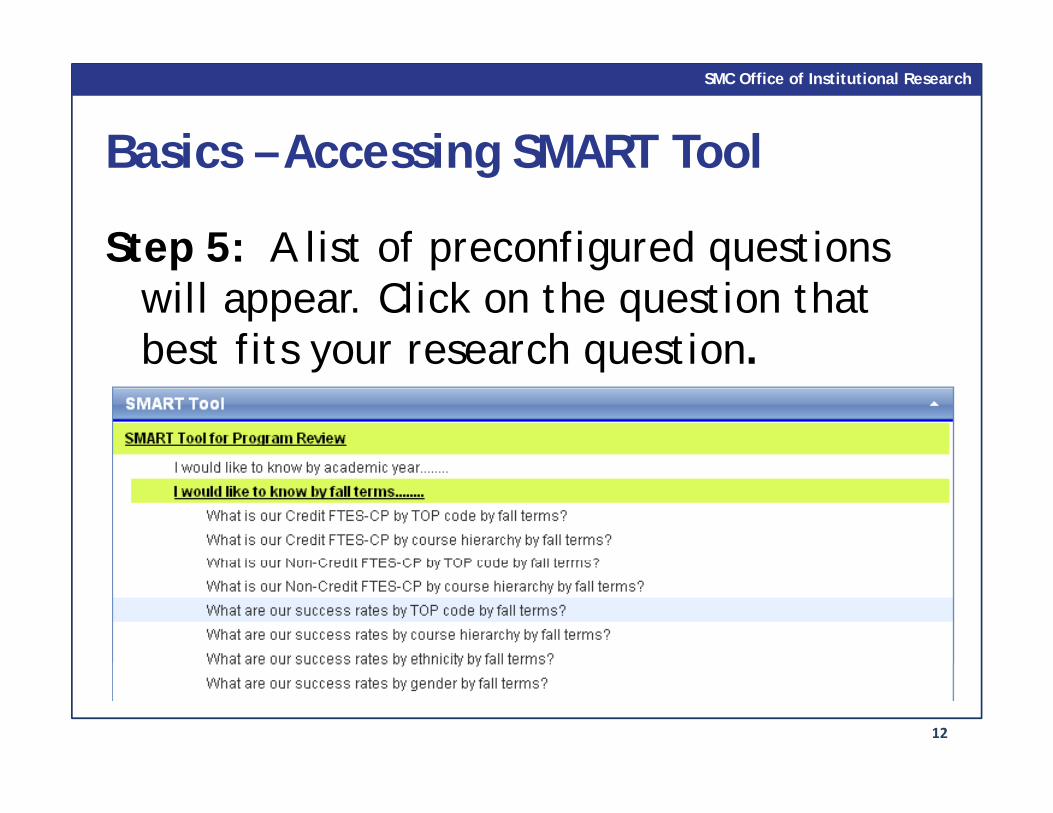
Basics Accessing SMART ToolBasics – Accessing SMART Tool
Step 5: A list of preconfigured questions Step 5: A list of preconfigured questions will appear. Click on the question that best fits your research questionbest fits your research question.
12

SMC Office of Institutional Research
Basics Accessing SMART ToolBasics – Accessing SMART Tool
Step 6: If you agree to the data sharing & Step 6: If you agree to the data sharing & reporting rules, click on “I Agree”
13

SMC Office of Institutional Research
Functions: Changing Page SizeFunctions: Changing Page Size
Control how much of the data table you want to see by pulling d h idown the page size
14

SMC Office of Institutional Research
Functions: Access ResourcesFunctions: Access Resources
Access resources by clicking on the yellow titles Access resources by clicking on the yellow titles, including:
• Data Element Description• Training Manual• Technical Notes
15

SMC Office of Institutional Research
Functions: Change the Preconfigured Research QuestionPull down the menu on top to select a Pull down the menu on top to select a
different preconfigured research question
Click on to revert to original question
16

SMC Office of Institutional Research
Functions: Drag & Drop Functions: Drag & Drop
You are able to drag and drop any of the variables into one of three boxes:
• Filter/Slicer: Filters the entire table• Series: Column/horizontal axis• Categories: Row/vertical axis• Measure can be put into series or categories boxes
17

SMC Office of Institutional Research
Functions: Drag & DropFunctions: Drag & Drop
Or drag and drop variables into the table itself Or drag and drop variables into the table itself (columns or rows) • You should see a green check mark confirming
where the variable will be moving
18

SMC Office of Institutional Research
Functions: Remove VariablesFunctions: Remove Variables
Drag variable back into the Measures & Dimensions menug
19
SMC Office of Institutional Research
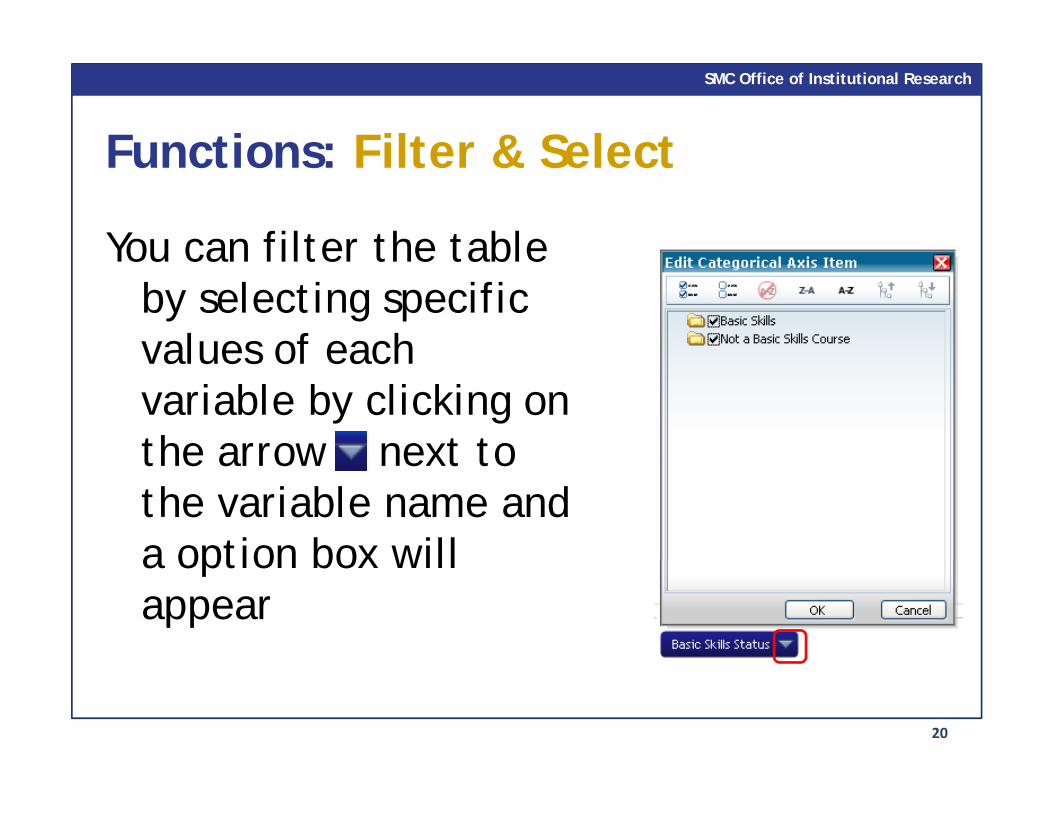
Functions: Filter & SelectFunctions: Filter & Select
You can filter the table You can filter the table by selecting specific values of each values of each variable by clicking on the arrow next to the arrow next to the variable name and a option box will a option box will appear
20
SMC Office of Institutional Research
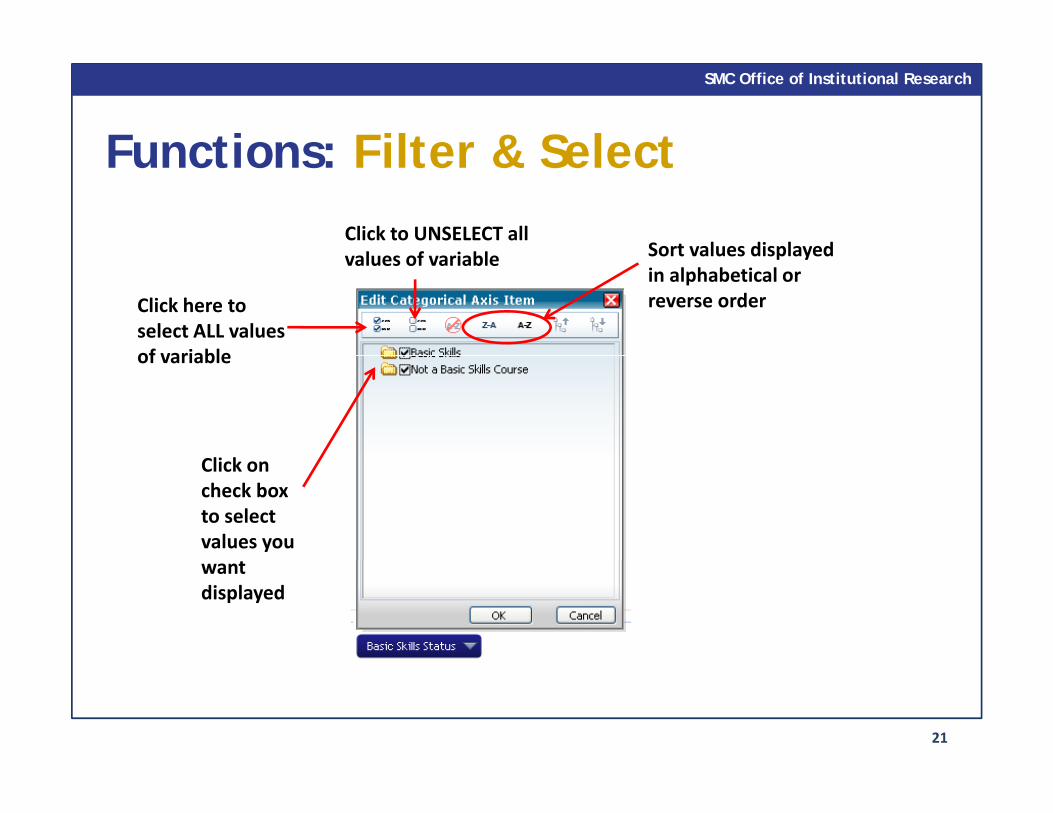
Functions: Filter & SelectFunctions: Filter & SelectClick to UNSELECT all l f i bl Sort values displayed
Click here to select ALL values of variable
values of variable Sort values displayed in alphabetical or reverse order
Cli k
of variable
Click on check box to select values you want displayed
21

SMC Office of Institutional Research
Functions: Choose Variable LevelsFunctions: Choose Variable Levels
• The following variables have gmultiple levels that can be viewed by clicking the button:• Course Hierarchy• Course Hierarchy• Disability• Time Period• TOP Code
• To condense the view, click the
22

SMC Office of Institutional Research
Functions: Chart ViewFunctions: Chart View
Data can be viewed in a chart format by clicking Data can be viewed in a chart format by clicking on the ‘Chart’ icon
23

SMC Office of Institutional Research
Functions: ToolbarFunctions: Toolbar
C idToggle chart (move
Revert to original report (revert to data based on question listed)
Copy grid
Print preview grid
gg (horizontal axis to vertical axis and vice versa)
Grid orientationPivots table
Switch to simple question listed) p g Switch to simple view
Save chart image
Print grid
Select chart type
Chart properties (able to change
Color palette
Show grid total
24
(able to change colors & names)

SMC Office of Institutional Research
Worked Out Examples & PracticeWorked Out Examples & Practice
25

SMC Office of Institutional Research
Additional AssistanceAdditional Assistance
• http://www smc edu/EnrollmentDevelophttp://www.smc.edu/EnrollmentDevelopment/InstitutionalResearch/Pages/Staff-Development-Resources aspxDevelopment Resources.aspx
• (310) 434-4556
26