FUNDAMENTALS AND APPLICATION OF POROUS MEDIA...
160
Fundamentals and Application of Porous Media Filtration for the Removal of Nanoparticles from Industrial Wastewater Item Type text; Electronic Dissertation Authors Rottman, Jeffrey J. Publisher The University of Arizona. Rights Copyright © is held by the author. Digital access to this material is made possible by the University Libraries, University of Arizona. Further transmission, reproduction or presentation (such as public display or performance) of protected items is prohibited except with permission of the author. Download date 14/07/2018 22:54:58 Link to Item http://hdl.handle.net/10150/255157
-
Upload
trinhduong -
Category
Documents
-
view
219 -
download
0
Transcript of FUNDAMENTALS AND APPLICATION OF POROUS MEDIA...

Fundamentals and Application of Porous Media Filtration forthe Removal of Nanoparticles from Industrial Wastewater
Item Type text; Electronic Dissertation
Authors Rottman, Jeffrey J.
Publisher The University of Arizona.
Rights Copyright © is held by the author. Digital access to this materialis made possible by the University Libraries, University of Arizona.Further transmission, reproduction or presentation (such aspublic display or performance) of protected items is prohibitedexcept with permission of the author.
Download date 14/07/2018 22:54:58
Link to Item http://hdl.handle.net/10150/255157

FUNDAMENTALS AND APPLICATION OF POROUS MEDIA FILTRATION FOR
THE REMOVAL OF NANOPARTICLES FROM INDUSTRIAL WASTEWATER
by
Jeffrey Joseph Rottman
____________________
A Dissertation Submitted to the Faculty of the
DEPARTMENT OF CHEMICAL AND ENVIRONMENTAL ENGINEERING
In Partial Fulfillment of the Requirements
For the Degree of
DOCTOR OF PHILOSOPHY
WITH A MAJOR IN CHEMICAL ENGINEERING
In the Graduate College
THE UNIVERSITY OF ARIZONA
2012

2
THE UNIVERSITY OF ARIZONA
GRADUATE COLLEGE
As members of the Dissertation Committee, we certify that we have read the dissertation
prepared by Jeffrey Joseph Rottman entitled FUNDAMENTALS AND APPLICATION
OF POROUS MEDIA FILTRATION FOR THE REMOVAL OF NANOPARTICLES
FROM INDUSTRIAL WASTEWATER and recommend that it be accepted as fulfilling
the dissertation requirement for the Degree of Doctor of Philosophy
_________________________________________________ Date: 11/7/12
Farhang Shadman
_________________________________________________ Date: 11/7/12
Reyes Sierra-Alvarez
_________________________________________________ Date: 11/7/12
Craig Aspinwall
Final approval and acceptance of this dissertation is contingent upon the candidate’s
submission of the final copies of the dissertation to the Graduate College.
I hereby certify that I have read this dissertation prepared under my direction and
recommend that it be accepted as fulfilling the dissertation requirement.
_________________________________________________ Date: 11/7/12
Dissertation Director: Farhang Shadman

3
STATEMENT BY AUTHOR
This dissertation has been submitted in partial fulfillment of requirements for an
advanced degree at the University of Arizona and is deposited in the University Library
to be made available to borrowers under rules of the Library.
Brief quotations from this dissertation are allowable without special permission, provided
that accurate acknowledgment of source is made. Requests for permission for extended
quotation from or reproduction of this manuscript in whole or in part may be granted by
the author.
SIGNED: Jeffrey Joseph Rottman

4
ACKNOWLEDGEMENTS
This accomplishment would not have been possible if it were not for the support of many
people. First, I would like to thank my advisor, Dr. Farhang Shadman, for all his support
and guidance over the past years. He has been instrumental in my development as an
engineer and researcher; ever pressing for fundamental understanding and critical
evaluation. I would also like to thank Dr. Reyes Sierra for her tireless instruction and
direction in experimental design and effective communication. The two of you have
provided an excellent example of principled scientific inquiry and have personally been
both encouraging and caring over the course of my studies. I would also like to thank Dr.
Roberto Guzman and Dr. Craig Aspinwall for their probing questions and helpful
direction as members of my graduate committee. I am very thankful for all those at SRC
who were always available for questions and who work diligently to support us graduate
students. Thank you to all of my fellow graduate students, especially Anand, Rahul,
Ming, David, Janae, and Dave, whom I have been able to both celebrate and commiserate
with over the past years. Finally, thank you to all the staff from the ERC and Chemical
Engineering Department, namely Karen, Ali, Jo and Arla for their friendship and their aid
in all of my complicated administrative matters.
I would specifically like to thank the many friends outside of the University who have
loved and supported me: Ryan & Yunuen Jankowski, Liam & Natalie Grimes, Luke &
Marianne Evans, Ben & Lis Richards, Matt & Dana McReynolds, Tim & Nikki
Finnegan, Bret & Val Holley, Dave & Christina Jorg and David Ritsema. You have all
been like family. I would also like to thank Rincon Mountain Presbyterian Church and
Pastor Phil Kruis for all the worship and fellowship shared over my time here in Tucson.
To my parents, Greg and Suzanne, and my brother and sister, Steven and Kim, thank you
for all your encouragement. Finally, I would like to thank my loving wife, Beth, and our
daughter, Clara, without whom this would not have been possible. I have enjoyed
sharing every minute of this with you.
Above all, I give thanks and glory to my Heavenly Father, whom through His Son, Jesus,
has given me life. I am as grass and my glories are as the flowers of the field; the grass
withers and the flowers fall, but the word of our Lord stands forever.

5
DEDICATION
To my wonderful wife, Beth, and little Clara
I love you more each day

6
TABLE OF CONTENTS
LIST OF TABLES ....................................................................................................................... 10
LIST OF FIGURES ..................................................................................................................... 11
ABSTRACT .................................................................................................................................. 16
CHAPTER I INTRODUCTION ................................................................................................ 19
1.1. Introduction to Nanoparticles .......................................................................................... 19
1.2. Nanoparticle Release and Exposure ................................................................................ 20
1.3. Human Toxicity and Ecotoxicity of Nanoparticles ........................................................ 21
1.4. Nanoparticle Stability in Aqueous Medium ................................................................... 23
1.5. Nanoparticle Abatement .................................................................................................. 30
1.5.1. Targeted Nanoparticle Abatement ............................................................................... 30
1.5.2. Primary Wastewater Treatment ................................................................................... 31
1.5.3. Secondary Wastewater Treatment ............................................................................... 33
1.5.4. Porous Media Filtration ............................................................................................... 35
1.6. Scope of the Work ............................................................................................................. 39
CHAPTER II REAL-TIME MONITORING OF NANOPARTICLE RETENTION IN
POROUS MEDIA ........................................................................................................................ 41
Abstract ..................................................................................................................................... 41
2.1. Introduction ....................................................................................................................... 42
2.2. Experimental ..................................................................................................................... 44

7
2.2.1. Materials ...................................................................................................................... 44
2.2.2. Experimental Setup ...................................................................................................... 44
2.2.3. Analysis........................................................................................................................ 46
2.3. Results and Discussion ...................................................................................................... 47
2.3.1. TiO2 Nanoparticles ....................................................................................................... 47
2.3.2. Apparatus Performance ................................................................................................ 47
2.4. Conclusions ........................................................................................................................ 53
CHAPTER III APPLICATION OF FLUORESCENT CORE-SHELL SILICA
NANOPARTICLES AS TRACERS IN POROUS MEDIA FILTRATION ........................... 54
Abstract ..................................................................................................................................... 54
3.1. Introduction ....................................................................................................................... 56
3.2. Materials and Methods ..................................................................................................... 59
3.2.1. Fluorescent Nanoparticle Synthesis ............................................................................. 59
3.2.2. Filtration Media ........................................................................................................... 61
3.2.3. Column Experiments ................................................................................................... 61
3.2.4. Imaging of Nanoparticles ............................................................................................. 62
3.2.5. Particle Size Distribution and Zeta Potential ............................................................... 63
3.2.6. Analysis ........................................................................................................................ 63
3.2.7. Chemicals ..................................................................................................................... 63
3.3. Results and Discussion ...................................................................................................... 64
TABLE OF CONTENTS - Continued

8
3.3.1. Nanoparticle Synthesis ................................................................................................. 64
3.3.2. Fluorescent SiO2 Nanoparticles as Tracers in Porous Media Column Experiments:
Effect of Particle Size and Concentration .............................................................................. 72
3.3.3. Fluorescent SiO2 Nanoparticles as Tracers in Porous Media Column Experiments:
Effect of Porous Media and Flow Rate .................................................................................. 76
3.4 Conclusions ......................................................................................................................... 79
CHAPTER IV REMOVAL OF TiO2 NANOPARTICLES BY POROUS MEDIA: EFFECT
OF FILTRATION MEDIA AND WATER CHEMISTRY ...................................................... 80
Abstract ..................................................................................................................................... 80
4.1. Introduction ....................................................................................................................... 82
4.2. Materials and Methods ..................................................................................................... 85
4.2.1. Materials ...................................................................................................................... 85
4.2.2. Porous Media and Nano-TiO2 Characterization ........................................................... 86
4.2.3. Adsorption Isotherms ................................................................................................... 87
4.2.4. Flow-through Column Experiments ............................................................................. 88
4.2.5. Chemical Analysis ....................................................................................................... 90
4.3. Results and Discussion ...................................................................................................... 90
4.3.1. Porous Media and Nano-TiO2 Characterization ........................................................... 90
4.3.2. Adsorption Isotherms ................................................................................................... 99
4.3.3. Effect of Porous Media on Nano-TiO2 Transport ...................................................... 102
TABLE OF CONTENTS - Continued

9
4.3.4. Effect of Solution Contaminants on Nano-TiO2 Transport ........................................ 106
4.3.5. Environmental and Industrial Implications ................................................................ 108
4.4. Conclusions ...................................................................................................................... 110
CHAPTER V MODELING NANOPARTICLE TRANSPORT AND RETENTION IN
POROUS MEDIA ...................................................................................................................... 111
Abstract ................................................................................................................................... 111
5.1. Introduction ..................................................................................................................... 112
5.2. Model Description ........................................................................................................... 114
5.3. Results and Discussion .................................................................................................... 119
5.3.1. Porous Media Column ............................................................................................... 119
5.3.2 Modeling Results ........................................................................................................ 121
5.4. Conclusions ...................................................................................................................... 129
CHAPTER VI ACTIVATED SLUDGE TREATMENT OF NANOPARTICLES ............. 130
6.1. Introduction ..................................................................................................................... 130
6.2. Materials and Methods ................................................................................................... 133
6.3. Results and Discussion .................................................................................................... 135
6.4. Conclusions ...................................................................................................................... 144
CHAPTER VII CONCLUSIONS ............................................................................................. 145
CHAPTER VIII CONTINUATION OF WORK .................................................................... 148
REFERENCES ........................................................................................................................... 149
TABLE OF CONTENTS - Continued

10
LIST OF TABLES
Table 4.1. Material characteristics for porous media used in column experiments .........93
Table 4.2. Zeta potential of TiO2 nanoparticles in tested dispersions at pH 7.0. .............97
Table 4.3. Fit constants for batch isotherms of TiO2 nanoparticles on selected
filtration media. ...........................................................................................................101
Table 5.1. Physical parameters of the porous media columns .......................................117
Table 5.2. Model constants for best fit approximation of NP transport in varying
porous media. ..............................................................................................................122
Table 6.1. Fitting constants for Freundlich and Langmuir NP association isotherms,
including goodness of fit as determined by the coefficient of determination, R2. ......140

11
LIST OF FIGURES
Figure 1.1. Illustration of the electric double layer surrounding particles in
aqueous solution. ...........................................................................................................23
Figure 1.2. Interaction energy as a function of separation distance as predicted by
the DLVO theory. Upper inset denotes critical points of the force curve. Lower
inset displays the shape of the curve for varying conditions: (a) highly charged
surface, weak ionic strength; (b) highly charged surface, stronger ionic strength;
(c) moderate surface charge, stronger ionic strength; (d) moderate surface
charge, high ionic strength; (e) little to no surface charge. Obtained from
Israelachvili [1]. ............................................................................................................28
Figure 1.3. Mechanisms of nanoparticle removal in primary (left) and secondary
(right) wastewater treatment. ........................................................................................33
Figure 1.4. Mechanisms of nanoparticle capture in porous media filtration:
sedimentation (a), interception (b), straining (c), and diffusion/adsorption (d). ...........36
Figure 2.1. Online experimental apparatus including continuously-stirred
nanoparticle suspension [1], peristaltic pump [2], UV-Vis spectrophotometer
[3], flow through cuvettes for influent [4] and effluent [6], and glass column
packed with porous media [5]. This apparatus provides fully online data of
nanoparticle retention in the column without the need for sampling or further
sample preparation prior to measurement. ....................................................................45
Figure 2.2. Particle size distribution of the TiO2 nanoparticle dispersions with no
additive (—) and with synthetic dispersant, Dispex (- - -). ...........................................48

12
LIST OF FIGURES - Continued
Figure 2.3. Transmission electron microscopy image of the TiO2 nanoparticles
utilized in this study. .....................................................................................................49
Figure 2.4. Breakthrough curves of TiO2 NPs with no additives (A) and with the
presence of a synthetic dispersant Dispex (B) in beds packed with sand (○) and
GAC (□). NP dispersion (pH 7) was introduced at 2.6 mL min-1
. Error bars
indicate standard deviation for three runs. ....................................................................50
Figure 3.1. Fluorescent dyes, NHSF (a) and RITC (b), and their respective
conjugations with APTES, (c) and (d). .........................................................................61
Figure 3.2. TEM images (left) and the corresponding particle size distributions
(right) of first generation n-SiO2 synthesized with NHSF dye shown for Fl-S
(A), Fl-L (B), and Fl-XL (C). ........................................................................................66
Figure 3.3. Zeta potential of silica dispersions as a function of pH for a
commercial n-SiO2 (♦) and for the synthesized Fl-S (●), Fl-L (▲), and Fl-XL
(■) n-SiO2 particles.......................................................................................................67
Figure 3.4. Fluorescence calibration curves for Fl-L (▲) and Fl-XL (■) particles
are best fit by (R2 = 0.9996) and
(R2 = 0.9993), respectively. ..........................................................................................67
Figure 3.5. TEM images (left) and the corresponding particle size distributions
(right) of first generation synthesized n-SiO2 with RITC dye shown for Rh-S
(A), Rh-L (B), and Rh-XL (C). .....................................................................................71

13
LIST OF FIGURES - Continued
Figure 3.6. Zeta potential of silica dispersions as a function of pH for a
commercial n-SiO2 (♦) and for the synthesized Rh-S (●), Rh-L (▲), and Rh-XL
(■) particles. ..................................................................................................................71
Figure 3.7. Fluorescence calibration curves for Rh-S (●), Rh-L (▲), and Rh-XL
(■) particles are best fit by (R2 = 0.995),
(R2 = 0.999), and (R
2 = 0.999), respectively. .............71
Figure 3.8. Relative effluent concentration of fluorescent-core n-SiO2 as a function
of the number of DE bed volumes processed for the synthesized Rh-S at 1 mg-
SiO2 L-1
(●), Rh-L at 10 mg-SiO2 L-1
(■), Rh-L at 50 mg-SiO2 L-1
(▲), and Rh-
XL at 10 mg-SiO2 L-1
(♦) particles. The n-SiO2 dispersions were introduced at
2.6 mL min-1
. Error bars represent the standard deviation of duplicate
measurements. ...............................................................................................................74
Figure 3.9. Bed capacities of DE for Rh-S at 1 mg-SiO2 L-1
(■), Rh-L at 10 (■)
and 50 mg-SiO2 L-1
(■) and Rh-XL at 10 mg-SiO2 L-1
(■) based on mass
concentration (A) and number concentration (B). Error bars represent the
standard deviation of duplicate measurements. .............................................................75
Figure 3.10. Column effluent concentration as a function of bed volumes
processed for fluorescent n-SiO2 (Fl-L, 109±1 nm) at 84 mg-SiO2 L-1
introduced
at 2.6 mL min-1
in both activated carbon (—) and sand (- - -). .....................................77
14
LIST OF FIGURES - Continued
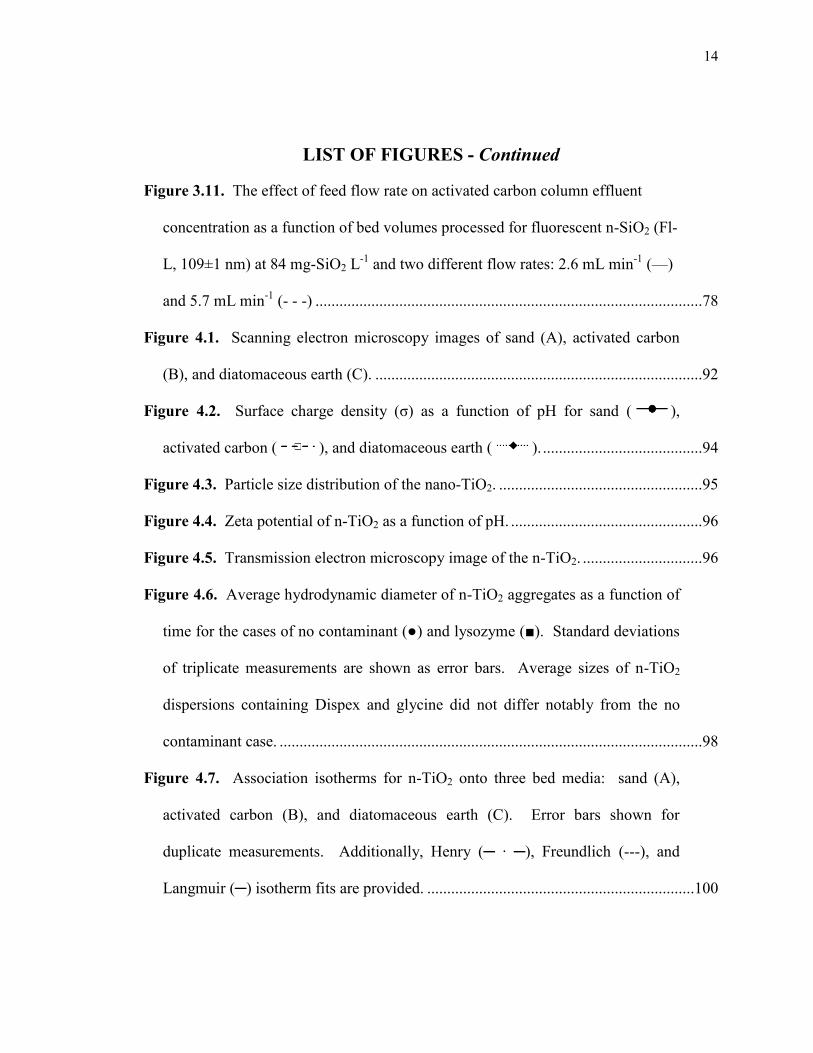
Figure 3.11. The effect of feed flow rate on activated carbon column effluent
concentration as a function of bed volumes processed for fluorescent n-SiO2 (Fl-
L, 109±1 nm) at 84 mg-SiO2 L-1
and two different flow rates: 2.6 mL min-1
(—)
and 5.7 mL min-1
(- - -) .................................................................................................78
Figure 4.1. Scanning electron microscopy images of sand (A), activated carbon
(B), and diatomaceous earth (C). ..................................................................................92
Figure 4.2. Surface charge density (σ) as a function of pH for sand ( ),
activated carbon ( ), and diatomaceous earth ( ). ........................................94
Figure 4.3. Particle size distribution of the nano-TiO2. ...................................................95
Figure 4.4. Zeta potential of n-TiO2 as a function of pH. ................................................96
Figure 4.5. Transmission electron microscopy image of the n-TiO2. ..............................96
Figure 4.6. Average hydrodynamic diameter of n-TiO2 aggregates as a function of
time for the cases of no contaminant (●) and lysozyme (■). Standard deviations
of triplicate measurements are shown as error bars. Average sizes of n-TiO2
dispersions containing Dispex and glycine did not differ notably from the no
contaminant case. ..........................................................................................................98
Figure 4.7. Association isotherms for n-TiO2 onto three bed media: sand (A),
activated carbon (B), and diatomaceous earth (C). Error bars shown for
duplicate measurements. Additionally, Henry (─ ∙ ─), Freundlich (---), and
Langmuir (─) isotherm fits are provided. ...................................................................100

15
LIST OF FIGURES - Continued
Figure 4.8. Relative effluent n-TiO2 concentration as a function of the number of
bed volumes processed for sand (A), activated carbon (B) and diatomaceous
earth (C). Plots for dispersions with no contaminant (─) and for dispersions
amended with Dispex (---), lysozyme (─ ∙ ─), and glycine (∙∙∙). Dispersions at
pH 7 were introduced at 2.6 mL min-1
. .......................................................................103
Figure 4.9. TiO2 nanoparticle concentrations associated with porous media as a
function of bed depth for sand (A), activated carbon (B), and diatomaceous earth
(C). Four cases shown: no contaminant ( ), dispex ( ), lysozyme (
) and glycine ( ). All suspensions (pH 7) were introduced at 2.6 mL
min-1
............................................................................................................................104
Figure 5.1. NP effluent concentration relative to the inlet concentration as a
function of bed volumes processed for sand (●), AC (■), and DE (▲). NP
dispersions at pH 7 were introduced at 2.6 mL min-1
. Error bars indicate
standard deviation for triplicate measurements...........................................................119
Figure 5.2. Retained NP concentration as a function of relative bed length for sand
( ), AC ( ), and DE ( ). Error bars indicate standard deviation for
triplicate measurements. ..............................................................................................121
Figure 5.3. Sand model results for the relative effluent NP concentration (C),
above, and the relative retained NP concentration (S), below. Data (○) is shown
alongside the model (—). Error bars indicate standard deviation for triplicate
measurements ..............................................................................................................125

16
LIST OF FIGURES - Continued
Figure 5.4. AC model results for the relative effluent NP concentration (C), above,
and the relative retained NP concentration (S), below. Data (□) is shown
alongside the model (—). Error bars indicate standard deviation for triplicate
measurements. .............................................................................................................126
Figure 5.5. DE model results for the relative effluent NP concentration (C), above,
and the relative retained NP concentration (S) at 30 bed volumes processed,
below. Data (∆) is shown alongside the model (—). Error bars indicate
standard deviation for triplicate measurements...........................................................127
Figure 5.6. DE model results (—) for the relative retained NP concentration (S)
after 485 bed volumes processed. ...............................................................................128
Figure 6.1. TEM images of Al2O3 (A), CeO2 (B), and SiO2 (C) nanoparticles. ............136
Figure 6.2. Association isotherms for Al2O3 (A), CeO2 (B), and SiO2 (C).
Experimental results (♦) are presented along with graphical representations of
the Freundlich (—) and Langmuir (---) isotherms. Error bars included but not
visible due to size of points .........................................................................................137
Figure 6.3. TEM (left) and SEM (right) images of microorganisms in activated
sludge after exposure to Al2O3 (A), CeO2 (B), and SiO2 (C) nanoparticles
(denoted by arrows).....................................................................................................142
Figure 6.4. SEM-EDS analysis of microorganisms in activated sludge after
exposure to Al2O3 (A) and CeO2 (B) NPs. Red or blue dots represent presence
of Al or Ce, respectively. ............................................................................................143

17
ABSTRACT
Increasing use of engineered nanomaterials presents concerns as some
nanoparticles appear to be harmful to both human health and the environment. Effective
treatment methods are required to remove problematic nanoparticles from (waste)water
streams. Porous media filtration, commonly used for the removal of particulate matter,
shows promise for nanoparticle treatment. The goal of this work is to investigate the
potential of porous media filtration for the abatement of nanoparticles from aqueous
waste streams. To this end, an automated method was developed that allows real-time
and in-situ monitoring of nanoparticle transport and retention in porous media using
online measurement of UV-visible absorbance or fluorescence.
Development of fluorescent-core nano-silica (n-SiO2) in controllable sizes
provided an excellent tracer for nanoparticle transport in porous media. Measurement of
n-SiO2 by destructive techniques is complicated by high natural Si background levels.
Fluorescence monitoring enables real-time measurement, facilitating rapid evaluation of
n-SiO2 transport. Synthesized n-SiO2 remain in their primary sizes making an evaluation
of the behavioral change of particles due to transition into the “nano” range possible. A
comparison of the role of particle size on transport in porous media displayed the
importance of particle number concentration as the dominance of site-specific adsorption
may be obscured by simple mass concentration evaluation.
The effectiveness of different bed materials, namely, sand, activated carbon (AC),
and diatomaceous earth (DE), for the removal of TiO2 nanoparticles (n-TiO2) from
aqueous streams was investigated. DE proved promising for n-TiO2 capture shown by its
18
high bed capacity (33.8 mg TiO2 g-1
medium) compared to AC (0.23 mg TiO2 g-1
medium) or
sand (0.004 mg TiO2 g-1
medium). The presence of organic and synthetic contaminants
produced varying effects on n-TiO2 retention, mostly due to either enhanced electrostatic
or steric interactions.
Application of a process simulator combining physical straining with site-specific
interactions, delineating physisorption from chemisorption and diffusion limited
interactions, enabled the accurate fit of n-TiO2 transport in sand, AC and DE. The fitting
process revealed the advantage of DE due to increased physisorption and physical
straining of n-TiO2. Modeling of this system afforded the elucidation of controlling
retention mechanisms and provides a basis for future scaling and system design.

19
CHAPTER I
INTRODUCTION
1.1. Introduction to Nanoparticles
Nanotechnology is the utilization and manipulation of matter in the nanoscale.
Nanoparticles, defined as particles with at least one dimension in the range of 1 to 100
nm, form an important sector of nanotechnology [2]. Nanoparticles draw such interest
from their unique properties which result from their size approaching atomic dimensions.
As opposed to their larger counterparts, nanoparticles have a much larger surface area,
are typically much more reactive, and have properties that are adjustable with size [3-5].
Controlling these properties at such small scales, nearing the atomic, is what provides for
their applicability to various industries and technologies. Development in the
understanding and control of nano-properties has allowed for many advances in
consumer technology including nano-additives enabling lighter weight polymers and
better performing cosmetics [2]. Nanomaterials are also integral to the electronics
industry, with nano-scale transistors enabling smaller, more efficient devices and
nanoparticles allowing precise semiconductor manufacturing [6-7].
Nanotechnology has many environmental benefits including material weight
reduction, which leads to lighter airplanes and vehicles and thus less energy consumption,
enhancement of energy generation, such as improving photovoltaic efficiency or battery
capacity, and replacement of hazardous materials, such as the use of nano-titanium
dioxide or nano-silicon dioxide as flame retardants in place of bromine [8].

20
Nanoparticles may also aid in water purification, especially through the use of
nanosorbents which have been shown to have a high capacity for metal ions [9]. The
applications of nanoparticles continues to increase, with uses ranging from textiles to bio-
medical applications [10].
Nanoparticles are generally classified into two groups: carbon-based structures
such as fullerenes and carbon nanotubes and inorganic nanoparticles such as quantum
dots, metals and metal oxides. Metal oxide nanoparticles, such as titanium dioxide
(TiO2), cerium dioxide (CeO2) and silicon dioxide (SiO2), are of particular interested due
to their wide commercial and industrial application, from use in sunscreens and cosmetics
to use as abrasives in slurries used for semiconductor manufacturing [10-11].
1.2. Nanoparticle Release and Exposure
Nanoparticles (NPs) are released to the environment in a variety of ways, both
intentionally and unintentionally. One such example of intentional NP release is the
injection of nano-sized zero-valent iron into wells of groundwater contaminated with
chlorinated solvents [12]. Unintentional release is of much greater concern; resulting both
from point and non-point sources. Non-point sources are typically found from
commercial products. These products might include brake pads on cars, paint, fabrics,
sunscreen and cosmetics; the associated NP release is dependent on their use [13-14]. NP
point sources are typically industrial manufacturing facilities, but also include landfills
and wastewater treatment plants [13, 15-16]. Modeling of environmental concentrations
of TiO2 NPs produced an estimate of over 1,500 tons per year entering sewage treatment
plants, with the majority of release being divided between the soil (~48%) and surface

21
water (~24%) [17]. These levels of release are expected to only increase with continued
increase in production. A recent study puts the upper bounds of yearly TiO2 NP
production at approximately 2.5 million metric tons by 2025 [18]. In fact, the “nano”
market is expected to be worth approximately $1 trillion annually by 2015 [19-20].
Understanding how these releases and exposures influence both human and ecological
heath is critical.
1.3. Human Toxicity and Ecotoxicity of Nanoparticles
While NPs offer many positive contributions [21], concerns arise over their
increasing application due to the potential negative effects of NPs on human and
environmental health [22]. Metal and metal oxide NPs have been shown to have
inflammatory and toxic effects on cells [23-25]. Human bronchoalveolar carcinoma-
derived cells were exposed to SiO2 NPs of 15 nm and 46 nm and the cytotoxicity due to
oxidative stress was found to be essentially equal [26]. This finding seems to be in
opposition to the commonly held theory that smaller particles are more toxic [27-28],
however the particles were significantly aggregated (590 and 617 nm, respectively)
which may explain the similarity in toxicity. Zinc oxide (ZnO) NPs were shown to
reduce MTT function in mitochondrial cells [29] as well as reduce cell functions at only
3.75 mg L-1
, likely attributable to the release of Zn2+
ions [30]. Iron oxide (Fe2O3) NPs
have been shown to be lethal to human mesothelioma cells at 7.5 mg L-1
; showing similar
toxicity to asbestos [30]. Investigation of the effect of 20 nm CeO2 NPs on human lung
cancer cells revealed a time-dependent and dose-dependent toxic effect due to oxidative
stress as well as lipid peroxidation and cell membrane damage [31]. TiO2 NPs displayed
22
photogenotoxicity as DNA damage occurred during light exposure but no damage was
observed in protected samples [32]. Additionally, TiO2 NPs have added to these previous
concerns about human interaction by displaying neuro-toxicity toward dorsal root
ganglion cells, even with commonly applied inorganic coatings [33]. Human toxicity is
not the only concern, as the environmental impact of engineered nanomaterials is also of
interest.
Ecotoxicity is also concerning as the influence these new nanomaterials have on
natural systems is still being determined [15]. As a basis of ecosystems, microorganisms
are of great importance and the effect of NPs on them may provide insight on the total
environmental impact. TiO2 NPs have been found to be damaging toward both Bacillus
subtilis and Escherichia coli, possibly due to the generation of reactive oxygen species
[34]. CeO2 has also been shown to have an antimicrobial effect on E. coli [35]. Daphnia
magna, a fresh water crustacean, is commonly used as a target organism in ecotoxicity
testing. It has been found that TiO2 (25 nm) was more toxic to D. magna than its 100 nm
counterpart [36]. Also, 30-nm TiO2 NPs induced 100% mortality of D. magna at 10 mg
L-1
and a LC50 (median lethal concentration) of 5.5 mg L-1
[37]. The effect of TiO2 NPs
on larger rainbow trout was studied and exposure was found to cause decreased Na+K
+-
ATPase activity in the gills and intestine but overall is not expected to be a major
ionoregulatory toxicant for concentrations less than 1.0 mg L-1
[38]. A study on the
phytotoxicity of alumina (Al2O3) NPs displayed root growth inhibition for 13 nm samples
but not for the larger 200 – 300 nm sample [39]. It is debated whether surface free
hydroxyl groups [39] or aluminum solubility [40] is the cause of this inhibition.
23
These results highlight the need to understand NP behavior in the environment as
these NPs have potentially far reaching effects for both human health and environmental
sustainability. Understanding NP behavior in water establishes the principles by which
evaluation of NP transport in the environment as well as efficiencies of treatment
technologies may be accomplished.
1.4. Nanoparticle Stability in Aqueous Medium
In order to effectively design a treatment technique for NPs and to evaluate
efficiencies of current treatment strategies, an understanding of the principles governing
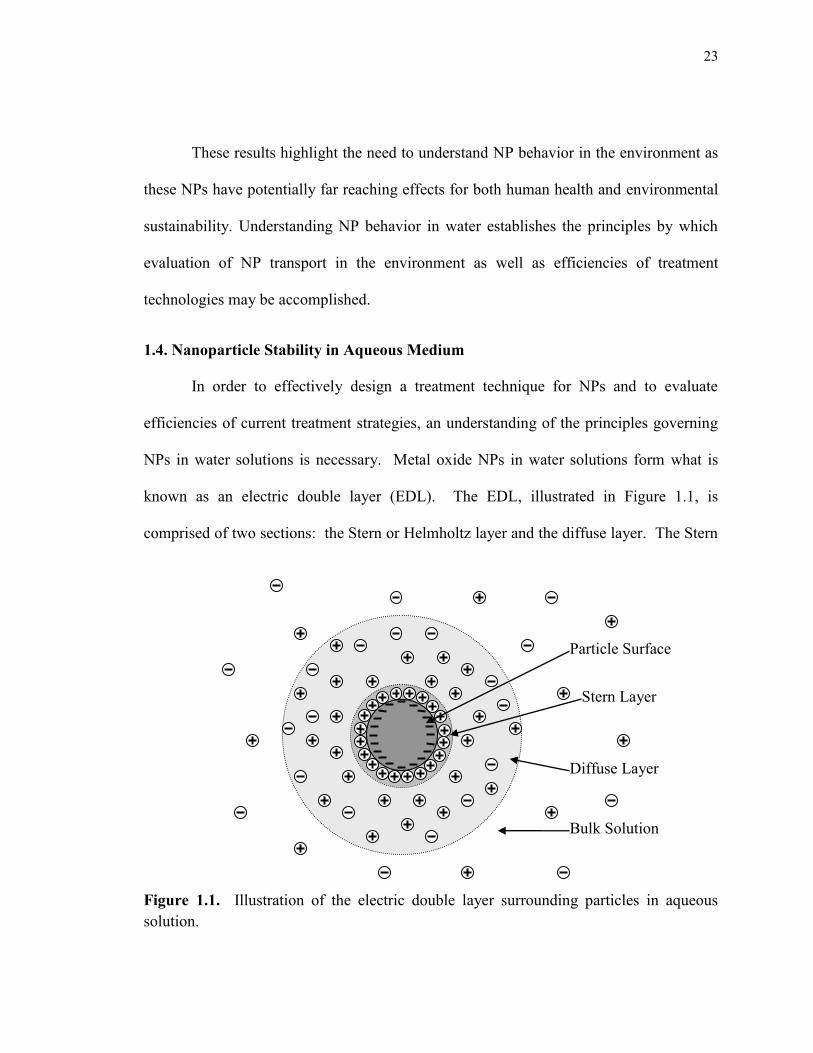
NPs in water solutions is necessary. Metal oxide NPs in water solutions form what is
known as an electric double layer (EDL). The EDL, illustrated in Figure 1.1, is
comprised of two sections: the Stern or Helmholtz layer and the diffuse layer. The Stern
Stern Layer
Particle Surface
Diffuse Layer
Bulk Solution
Figure 1.1. Illustration of the electric double layer surrounding particles in aqueous
solution.

24
or Helmholtz layer is the layer of ions of opposite charge than the particle surface which
adhere to the surface via electrostatic and physical adsorption. Beyond this layer there is
a concentrated cloud of ions, the majority of which are charge opposites of the particle,
which serve to satisfy electroneutrality. A common measurement used to characterize the
EDL thickness is the Debye length, which is the distance from the particle surface at
which the apparent charge is about 37% that of the surface [41]. While this is just an
appoximation of the EDL, it does provide information on how far into solution the
particle’s charge will be “felt” thus influencing stability. Larger Debye lengths are
associated with enhanced stability.
In order to measure surface charge a zeta potential value is often used. The zeta
potential is the potential between the shear (or slipping) plane and the bulk solution. The
shear plane exists in the diffuse layer just beyond the Stern layer and is defined as the
division between those ions which travel with the particle and the bulk solution. This
surface charge measurement is highly useful in determining NP stability, as high-
magnitude like-charges produce strong repulsive forces between the NPs. Zeta potentials
greater than 20 mV and less than -20 mV are expected to produce highly stable NP
dispersions [42]. The zeta potential of the NPs, and by extension the dispersion stability,
is determined by many factors including pH, ionic strength, and counterion valence.
Metal oxides can become charged by adsorption of hydrogen (H+) or hydroxide
ions (OH־) and the relative amounts is influenced by the pH of the solution. Recall that a
zeta potential of large magnitude (either positive or negative) will result in a highly stable
solution. However, the zeta potential decreases from positive to negative values with

25
increasing pH thus implying a point at which the zeta potential reaches zero, known as
the isoelectric point (pHIEP) or point of zero charge (pHPZC). Zeta potential measurements
as a function of pH have been performed for a variety of metal oxide NPs including FeO
(20 nm) [43], SiO2 (15 nm) [44], Al2O3 (11, 44, and 190 nm) [45], and CeO2 (24.5 nm)
[46]. The IEP of each was determined to be ~7.8, 1.6, ~9, and ~8, respectively. The pH
region immediately surrounding the pHIEP therefore is a region of low stability and high
agglomeration rates.
According to the Sogami-Ise theory an increase in the ionic strength (salt
concentration) results in a decrease in the Debye length and interparticle distance through
a condensing of the diffuse layer [47]. This compression of the diffuse layer retards the
interparticle repulsion resulting in agglomeration [48]. French and coworkers studied the
aggregation of titanium dioxide NPs (4-5 nm) at ionic strengths similar to those
characteristic of soils and found that even at low ionic strengths (1 mM), aggregation was
enhanced [48]. The observed effect of ionic strength change on zeta potential is a
reduction in zeta potential magnitude at pH values far above and below the IEP, lending
the solution toward aggregation in a wider range of pH [45]. Many studies have been
performed on various NPs and have yielded similar results [45-46, 48-50].
The contribution of cation valence to the aggregation characteristics of NPs
relates closely with ionic strength effects. A study of cation valence in solution and its
effects on NP aggregation, specifically TiO2 (4-5 nm), was performed by French and
coworkers [48]. The study monitored the particle size distribution when NaCl or CaCl2
salt was added while pH was held relatively constant at 4.5 – 4.8. The particles reached

26
micron-sized aggregates in less time in the solution containing Ca2+
(ionic strength of
12.8 mM) than in the solution containing Na+ (ionic strength of 12.5 mM). Also, the
final aggregates in the calcium solution showed similar size to those in the 16.5 mM Na+
solution which proves that the enhanced aggregation is due to other factors than mere
ionic strength. Their conclusion was that the divalent ions caused a shortening of the
Debye length and thus reduced the electrostatic repulsion.
Thus far, only electrostatic or double-layer forces have been addressed. Another
significant force that must be taken into consideration is the van der Waals force. The
van der Waals force is a combination of dipole-dipole, dipole-induced dipole, and
induced dipole-induced dipole interactions. The last of these, induced dipole-induced
dipole or dispersion force, is typically dominant and results in strong attraction. This
force, however, is an inverse function of the sixth power of distance from the particle and
thus is only relevant over short distances. Normally van der Waals attraction is
dominated by electrostatic repulsion due to the EDL reaching further into solution;
particles are repelled before they are close enough for attractive van der Waals forces to
take over. The combination of the van der Waals force and the electrostatic force is
common, and has resulted in a centralized theory of particle stability.
This centralized theory is known as the DLVO theory after the originators
Derjaguin and Landau [51] and Verwey and Overbeek [52] who later improved upon it.
The DLVO theory allows for the prediction of NP stability from intrinsic properties of
the materials. A typical force curve produced from DLVO calculations is shown in
Figure 1.2. The main force curve displays the summation of electrostatic repulsion and
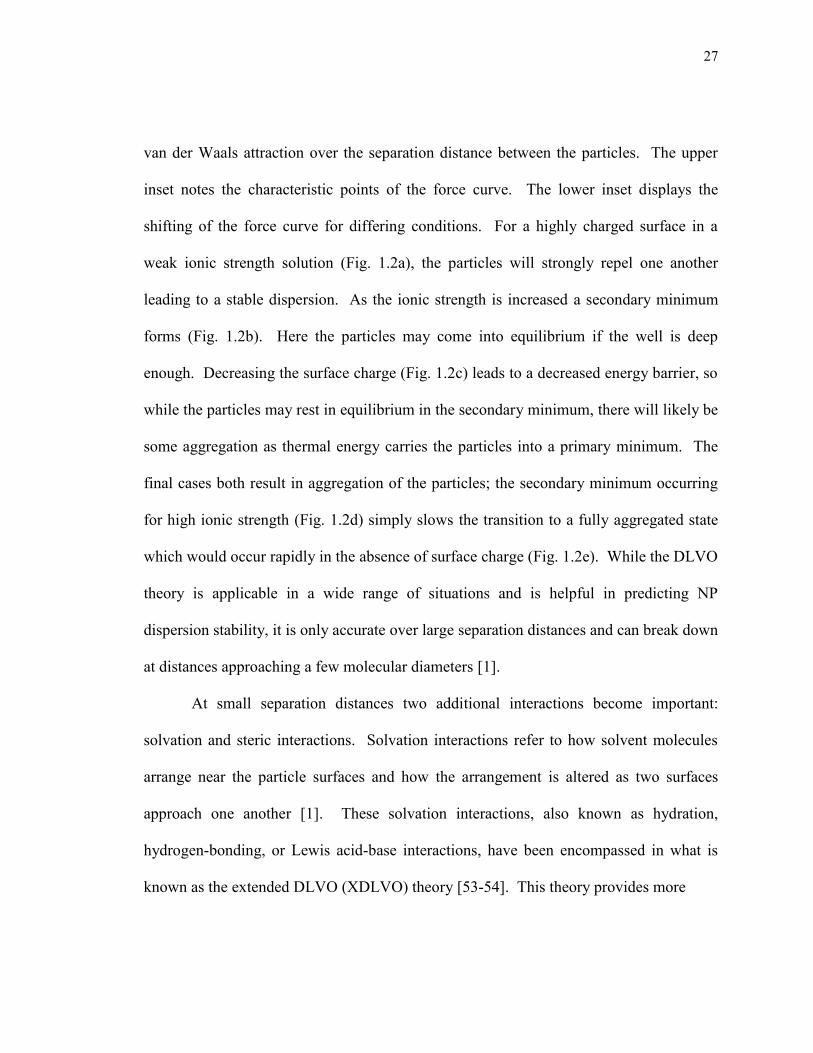
27
van der Waals attraction over the separation distance between the particles. The upper
inset notes the characteristic points of the force curve. The lower inset displays the
shifting of the force curve for differing conditions. For a highly charged surface in a
weak ionic strength solution (Fig. 1.2a), the particles will strongly repel one another
leading to a stable dispersion. As the ionic strength is increased a secondary minimum
forms (Fig. 1.2b). Here the particles may come into equilibrium if the well is deep
enough. Decreasing the surface charge (Fig. 1.2c) leads to a decreased energy barrier, so
while the particles may rest in equilibrium in the secondary minimum, there will likely be
some aggregation as thermal energy carries the particles into a primary minimum. The
final cases both result in aggregation of the particles; the secondary minimum occurring
for high ionic strength (Fig. 1.2d) simply slows the transition to a fully aggregated state
which would occur rapidly in the absence of surface charge (Fig. 1.2e). While the DLVO
theory is applicable in a wide range of situations and is helpful in predicting NP
dispersion stability, it is only accurate over large separation distances and can break down
at distances approaching a few molecular diameters [1].
At small separation distances two additional interactions become important:
solvation and steric interactions. Solvation interactions refer to how solvent molecules
arrange near the particle surfaces and how the arrangement is altered as two surfaces
approach one another [1]. These solvation interactions, also known as hydration,
hydrogen-bonding, or Lewis acid-base interactions, have been encompassed in what is
known as the extended DLVO (XDLVO) theory [53-54]. This theory provides more

28
accurate prediction for strongly hydrophobic or hydrophilic surfaces in water. In water,
the hydration forces arise due to the binding of water molecules to surface groups and
Figure 1.2. Interaction energy as a function of separation distance as predicted by the
DLVO theory. Upper inset denotes critical points of the force curve. Lower inset
displays the shape of the curve for varying conditions: (a) highly charged surface,
weak ionic strength; (b) highly charged surface, stronger ionic strength; (c) moderate
surface charge, stronger ionic strength; (d) moderate surface charge, high ionic
strength; (e) little to no surface charge. Obtained from Israelachvili [1].

29
thus the repulsion between two surfaces is due to the breaking of this water structure and
essential dehydration of the two surfaces [1]. A study of the stability of TiO2 (rutile)
colloids showed that at ionic strengths greater than 20 mM the repulsive hydration force
produced greater stability than expected by the simple DLVO theory and that the energy
barrier could be calculated over a wide range of ionic strengths [55]. Similarly, a study
of SiO2 proved that the dispersion remained relatively stable even in highly unfavorable
conditions such as the pHIEP, and this was attributed to a hydration force inherent to the
SiO2 [56]. Additionally, the solvation forces between oxide surfaces are dependent on
the specific counter-ions in solution, not simply the charge of those ions [57].
Steric interactions arise from polymer or organic adsorption onto the surface.
When two coated surfaces are in close proximity, the polymer or organic structures begin
to overlap. This typically results in repulsion due to the free energy of compression of
these structures to the surface [1]. This stabilization has been shown to be the case for
fulvic acid adsorbed onto TiO2 NPs [58], a non-ionic surfactant adsorbed onto TiO2 NPs
[59], and zero-valent iron NPs coated with guar gum [60]. In some circumstances,
typically at low coverages, the attached structures can produce an attractive force
attributable to interparticle bridging as was the case for Al2O3 NPs with the addition of
humic acids at acidic pH [61]. Comprehension of these competing forces provides a
basis for the evaluation and enhancement of treatment technologies for NP abatement.

30
1.5. Nanoparticle Abatement
1.5.1. Targeted Nanoparticle Abatement
There are very few studies on targeted removal of NPs from aqueous waste
streams. Two common techniques used to remove particulate matter are coagulation and
membrane filtration. Coagulation can be accomplished by a variety of means: chemical
coagulation, electrocoagulation, or thermal coagulation. Chemical coagulation involves
the addition of an ionic species, typically cationic, to induce aggregation of negatively
charged particles. Flocculants, polymeric structures, are then added to bridge the
coagulants and aid in sedimentation. An investigation of the effluents from an industrial
park in Taiwan showed the addition of polyaluminum chloride (3-5 mg L-1
as Al) was
ineffective in removing NPs of 90 nm but effective for the 2 nm particles [62]. This
result was not altered by increasing the coagulant dose, but was aided by increased
residence times. An evaluation of colloidal silica removal by coagulation and
flocculation provided low specific silica removal capacities for both polyaluminum
chloride and alum and no significant removal for the cationic and anionic flocculants:
polydiallyl dimethylammonium chloride and polyacrylamide, respectively [63].
Electrocoagulation has had limited application but shows some promise for NP removal.
A study of SiO2 NPs (68 – 120 nm) treated by electrocoagulation with an Al/Fe electrode
produced an average particle size of 16.8 μm with no discernible particles less than 100
nm [64].
Membrane filtration is a process by which particles are separated by allowing
water to pass through a membrane with a pore size smaller than the particles.

31
Ultrafiltration is the term given to membrane filtration processes which operate in a size
range applicable to NP retention. Membrane filtration is more complicated than simple
size exclusion; NP interaction with the membrane structure and filtration orientation
(either dead-end or cross flow) are significant factors. A study using a Pall Corporation
ultrafiltration system called Microza observed complete removal of solids from a NP-
containing semiconductor processing effluent by the double-skinned hollow fiber
membrane [65]. Another study evaluated the removal of Au, Ag, and SiO2 NPs ranging
from 5 – 150 nm by a filter made of carbonaceous nanofibers and provided a highly
selective size cutoff dependant on the filter structure which retained all but the 5 nm
particles [66]. The main drawback of NP treatment by membrane filtration is the
decreased permeability due to membrane fouling. A study of polystyrene and magnetite
NPs (20 – 250 nm) concluded that the permeability drop was significantly more
substantial for the 20 – 30 nm particles compared to the 100 – 250 nm equivalents [67].
This fouling is a significant hindrance to membrane filtration applications for NP
abatement. As there are little to no currently utilized NP-specific treatment techniques,
an evaluation of common wastewater treatment for the removal of NPs is necessary.
1.5.2. Primary Wastewater Treatment
One major point source for NP release to the environment is the wastewater
treatment plant. It has been noted that many industrially utilized NPs proceed to
municipal wastewater treatment [68]. Wastewater treatment plants have two main
segments: primary and secondary treatment. Primary treatment consists of
sedimentation of suspended solids sometimes with the addition of coagulants to aid in the
32
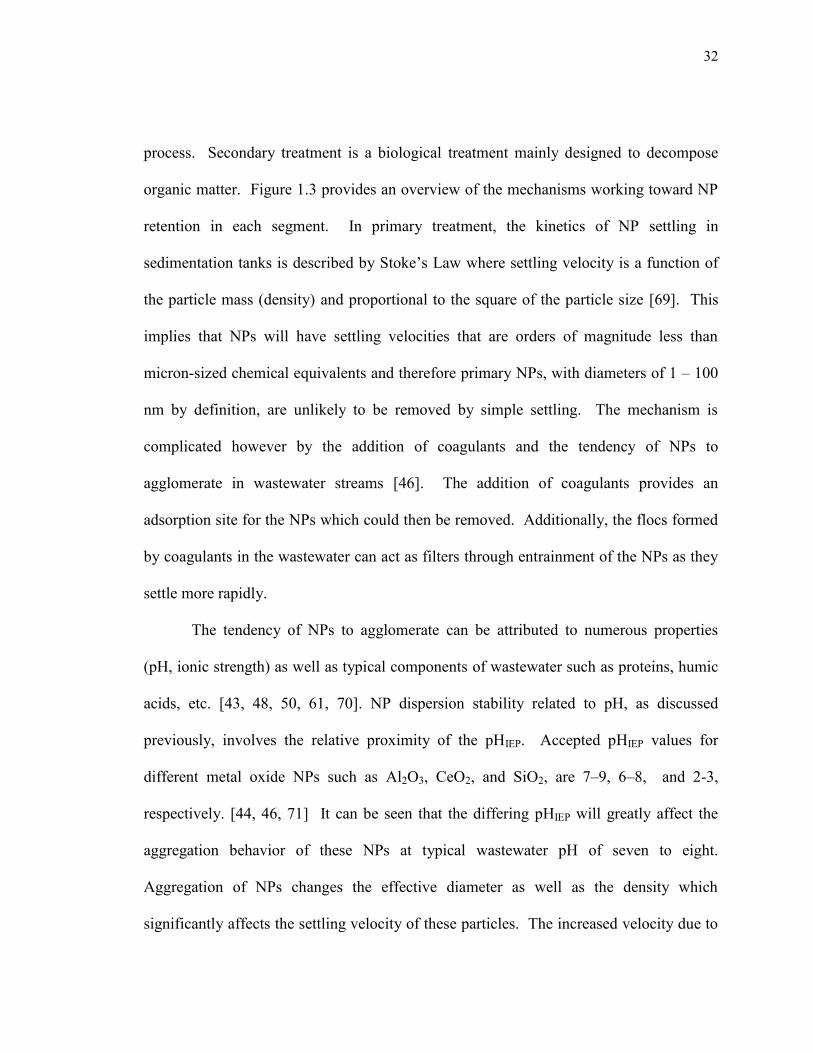
process. Secondary treatment is a biological treatment mainly designed to decompose
organic matter. Figure 1.3 provides an overview of the mechanisms working toward NP
retention in each segment. In primary treatment, the kinetics of NP settling in
sedimentation tanks is described by Stoke’s Law where settling velocity is a function of
the particle mass (density) and proportional to the square of the particle size [69]. This
implies that NPs will have settling velocities that are orders of magnitude less than
micron-sized chemical equivalents and therefore primary NPs, with diameters of 1 – 100
nm by definition, are unlikely to be removed by simple settling. The mechanism is
complicated however by the addition of coagulants and the tendency of NPs to
agglomerate in wastewater streams [46]. The addition of coagulants provides an
adsorption site for the NPs which could then be removed. Additionally, the flocs formed
by coagulants in the wastewater can act as filters through entrainment of the NPs as they
settle more rapidly.
The tendency of NPs to agglomerate can be attributed to numerous properties
(pH, ionic strength) as well as typical components of wastewater such as proteins, humic
acids, etc. [43, 48, 50, 61, 70]. NP dispersion stability related to pH, as discussed
previously, involves the relative proximity of the pHIEP. Accepted pHIEP values for
different metal oxide NPs such as Al2O3, CeO2, and SiO2, are 7–9, 6–8, and 2-3,
respectively. [44, 46, 71] It can be seen that the differing pHIEP will greatly affect the
aggregation behavior of these NPs at typical wastewater pH of seven to eight.
Aggregation of NPs changes the effective diameter as well as the density which
significantly affects the settling velocity of these particles. The increased velocity due to

33
the enlarged size outweighs the decrease due to the reduced density caused by the loose
packing of the aggregate thus resulting in increased removal of the NPs. Uncoated SiO2
NPs, in fact, have been shown to not settle during typical residence times, while those
coated with a non-ionic surfactant were more effectively removed [7]. The expectation
of NPs to mostly pass through primary treatment unretained shifts the potential of
removal to biological treatment.
1.5.3. Secondary Wastewater Treatment
Interactions of NPs with the biosolids present in secondary wastewater treatment
can be investigated in three parts: physical, electrostatic and chemical interactions.
Physically, due to their small size, NPs preferentially diffuse to surfaces more readily
than their larger counterparts [72]. This can be generalized by evaluating the diffusion
coefficient, which is inversely proportional to particle diameter. Additionally, the NPs
Figure 1.3. Mechanisms of nanoparticle removal in primary (left) and secondary
(right) wastewater treatment.
Settling
Aggregation
Flocculation
Primary Treatment
Secondary Treatment
Physical
Diffusion or
Entrapment
Electrostatic Chemical
34
could become physically entrapped in biological flocs. Secondly, bacteria commonly
used in wastewater treatment have a net negative surface charge which may lead to
electrostatic interactions contributing to the removal of certain NPs [35, 73]. Inorganic
oxides have varying surface charges in solution at circum-neutral pH and thus will show
varying degrees of attraction to the biological surface. It has been shown, for example
with CeO2 NPs, that the electrostatic interactions play a main role in their adhesion to E.
coli [35]. Finally, interferences of other wastewater components on the partitioning play
a key role in NP removal. Studies of the influence of polyelectrolytes on the adsorption
of NPs to bacteria show the order of addition of the two components strongly affects the
adsorption of the NPs [74-75]. Few studies have been performed on the ability of
biological wastewater treatment to remove NPs from waste streams. Two studies have
been performed on CeO2 NPs in model secondary treatment with similar results of
significant retention greater than 94% [46, 76]. This retention though, was found to be
highly dependent on NP destabilization due to wastewater conditions. Another study
investigated titanium nanomaterial removal in wastewater treatment and found that only
23% of TiO2 NPs were removed during exposure to wastewater biomass [77]. Biological
aeration has been shown to be ineffective at removing NPs from true wastewater at an
industrial park in Taiwan, showing no change in the particle size distribution post
treatment [62]. The high variability of NP retention as well as the influence of the
myriad of contaminants found in wastewater streams highlights the importance of
improved NP treatment.

35
1.5.4. Porous Media Filtration
The study of the transport of NPs in porous media is important in understanding
their environmental fate. Porous media is used to model soil systems, helping to
determine NP impact on the food chain and groundwater. Additionally, porous media
can be used as a depth filter to remove particulate matter. Comprehension and
subsequent manipulation of dominant transport mechanisms can allow for the targeted
removal of NPs from aqueous waste streams. Porous media filtration is a process mainly
utilized in water treatment but its use is increasing in wastewater treatment schemes [69].
It is designed to remove colloidal substances, which by definition are those between one
and 1,000 nm, thus showing potential for targeted NP treatment.
1.5.4.1. Mechanisms of Nanoparticle Capture in Porous Media
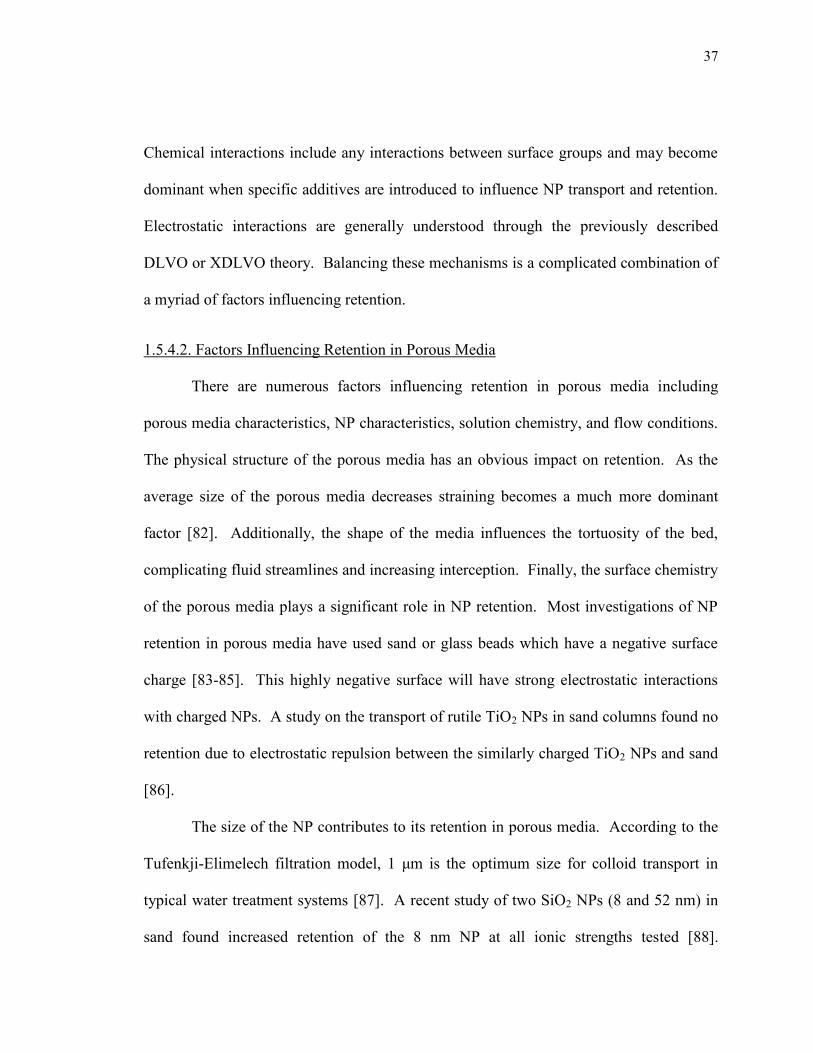
There are four main mechanisms of NP capture in porous media filtration outlined
in Figure 1.4: sedimentation, interception, straining, and diffusion/adsorption. The first
three are physical interactions having to do with the structure and packing of the porous
material. Sedimentation involves heavy particle breaking from streamlines and settling
onto the porous media [78]. Sedimentation (Fig. 1.4a) is governed by the Stokes settling
velocity of a spherical particle which has a 2nd
order dependence on particle diameter.
Therefore, sedimentation is unlikely to play a significant role in NP capture as small size
of the particles precludes them from settling across streamlines. Interception (Fig. 1.4b)
is a process by which particulate matter comes into contact with the porous media surface
simply because the streamline it is traveling in passes in close enough proximity to the
media surface [78]. Interception is a function of the tortuosity of the porous media bed

36
and is controlled by the average size of that media. Straining (Fig. 1.4c) is a mechanism
by which particulate matter is retained due to its size relative to the pore space [79].
Straining is a function of the relative sizes of the colloidal matter (dc) and porous media
(dpm) with a critical dc/dpm ratio of 0.0017 [80], above which straining occurs, and
straining increasing with increasing dc/dpm [81].
Diffusion is the final capture mechanism in porous media filtration, and is often
paired with adsorption. Diffusion (Fig. 1.4d) is the transport across streamlines due to
Brownian motion of the particles [78]. Diffusion is expected to be the most significant
mechanism for NP capture as it is inversely related to particle size. After moving to the
surface, the colloidal matter may be held by chemical or electrostatic interactions.
Figure 1.4. Mechanisms of nanoparticle capture in porous media filtration:
sedimentation (a), interception (b), straining (c), and diffusion/adsorption (d).
(a)
(b)
(c)
(d)
Collector
Media
Collector
Media
Collector
Media
Collector
Media
37
Chemical interactions include any interactions between surface groups and may become
dominant when specific additives are introduced to influence NP transport and retention.
Electrostatic interactions are generally understood through the previously described
DLVO or XDLVO theory. Balancing these mechanisms is a complicated combination of
a myriad of factors influencing retention.
1.5.4.2. Factors Influencing Retention in Porous Media
There are numerous factors influencing retention in porous media including
porous media characteristics, NP characteristics, solution chemistry, and flow conditions.
The physical structure of the porous media has an obvious impact on retention. As the
average size of the porous media decreases straining becomes a much more dominant
factor [82]. Additionally, the shape of the media influences the tortuosity of the bed,
complicating fluid streamlines and increasing interception. Finally, the surface chemistry
of the porous media plays a significant role in NP retention. Most investigations of NP
retention in porous media have used sand or glass beads which have a negative surface
charge [83-85]. This highly negative surface will have strong electrostatic interactions
with charged NPs. A study on the transport of rutile TiO2 NPs in sand columns found no
retention due to electrostatic repulsion between the similarly charged TiO2 NPs and sand
[86].
The size of the NP contributes to its retention in porous media. According to the
Tufenkji-Elimelech filtration model, 1 μm is the optimum size for colloid transport in
typical water treatment systems [87]. A recent study of two SiO2 NPs (8 and 52 nm) in
sand found increased retention of the 8 nm NP at all ionic strengths tested [88].
38
However, a study of latex colloids (50, 110, and 1500 nm) found that attachment
efficiency increased with increasing particle size defying the DLVO theory [89]. While
the effect of primary particle size is still being determined, another complicating factor is
the proclivity of NPs to aggregate in aqueous solutions [61, 90]. The aggregation of TiO2
NPs, in one study, had competing effects as the aggregated particles were better retained,
however, size exclusion prevents the aggregated particles from a large fraction of the
media surface area [84]. The NP surface chemistry is also important, but this is often
controlled by solution chemistry, especially for metal oxide NPs.
The role of surface chemistry in NP retention can be generally divided into three
segments: pH, ionic strength and contaminants. The pH of the solution dominates the
electrostatic interactions between the NP and porous media. Metal oxide NPs have a
wide range of pHIEP, which is the pH at which the surface charge of the NP approaches
zero. At a pH above the pHIEP the surface will be negatively charged and the opposite
below. Therefore NPs such as SiO2, with a pHIEP around 2 – 3 [46], and TiO2, with a
pHIEP around 4 – 5 [91], will generally be negatively charged at circumneutral pH.
Alternatively, Al2O3 (pHIEP = 7.9) and ZnO (pHIEP = 9.2) will be positively charged at
environmental pH values [50, 61]. The influence of ionic strength on the electrostatic
interactions of the NPs, as discussed previously, shortens the Debye length, reducing the
distance into solution the charge effects are observed. An investigation of TiO2 NPs in
quartz sand found a strong correlation between increased ionic strength and increased NP
elution [92]. Similar results were found for other metal oxide NPs (Fe3O4, TiO2, CuO
and ZnO) with increasing ionic strength leading to enhanced NP deposition [83].
39
Increasing ionic strength has the added complication of enhancing aggregation of NPs
leading to retention by many other mechanisms including straining and interception [48].
Organic contaminants can affect NP transport in a variety of ways. Various surfactants
have been shown to produce a stabilizing effect either due to electrostatic stabilization or
steric hindrances, increasing NP elution from porous media columns [59, 85, 93].
Similarly natural organic matter has been shown to decrease retention of NPs in porous
media [83, 89, 94].
Finally, flow conditions can influence NP deposition. Increased flow velocity
may aid in the elution of NPs [59, 95]. This, however, might not be a general rule as
fullerene-based NPs were found to have a slight increase in retention with increased flow
rate while SiO2 and TiO2 NPs showed no change, with no hypothetical mechanism
provided [96]. Overall, numerous factors influence NP retention in porous media and the
interdependence of these factors should be an area of focused study.
1.6. Scope of the Work
The scope of this work stems from a desire to develop treatment schemes
specifically designed for removing NPs from aqueous waste streams. As current
treatment techniques have shortcomings regarding NP retention, porous media filtration
shows promise as a simple yet robust technique for targeted NP treatment. In order to
evaluate the application of porous media filtration to NP abatement, a four-fold approach
was developed.
First, a system was developed to rapidly evaluate NP transport behavior in porous
media with varying solution and bed media conditions. This system was then

40
implemented to determine granular materials and conditions under which NP retention
can be optimized. Thirdly, fluorescent-cored silica NPs were developed and tested as
tracer NPs in system evaluation. Finally, a process model was proposed to further
elucidate controlling mechanisms as well as provide information necessary for process
optimization and industrial scaling.
41
CHAPTER II
REAL-TIME MONITORING OF NANOPARTICLE RETENTION IN
POROUS MEDIA
Abstract
Nanoparticles are not specifically targeted in conventional treatment schemes;
consequently, typical wastewater treatment systems are ineffective for nanoparticles
removal. With rapidly increasing concern over their health effects, improved
understanding of nanoparticle transport and retention in porous media filters is critical
because of its application in new wastewater treatment methods and for assessment of the
fate of the discharged nanoparticles in soil. In this study a unique and robust integrated
method is developed and validated. Experimentally, this approach uses an on-line, real-
time, and in-situ method for measuring nanoparticle retention dynamics, eliminating the
laborious and less accurate sampling and off-line analysis. The data analysis part is a
process simulator which provides both kinetic properties of the retention process as well
as the overall capacity and loading. This technique is validated by application to the
transport and retention of TiO2 nanoparticles in two vastly different porous filtration
media – activated carbon and sand. TiO2 retained concentrations ranged from 0.24-0.37
mg/g for activated carbon and 0.01-0.014 mg/g for sand. The integrated method
presented here is useful for both comparison of the filtration effectiveness of various
42
porous materials as well as for process optimization and scale-up for industrial
applications.
2.1. Introduction
The use of nanoparticles in manufacturing continues to increase [97], raising
concerns over their environmental and health effects [22, 98]. Inorganic oxide
nanoparticles, in particular, have growing applications in catalysis, polymers, coatings,
etc. A large amount of these nanoparticles are contained in wastewater streams [68].
Released nanoparticles can be exposed to porous media through water treatment
techniques, such as slow or rapid sand filtration, or during transport through soil or
sediments. Understanding transport and removal mechanisms in porous media is of
utmost importance to develop treatment technologies specifically designed for the
removal of nanomaterials as well as to determine environmental fate.
The transport, deposition, and retention of nanoparticles in saturated porous media
have been examined in recent studies [83-84, 99-100]. Nanoparticle behavior is highly
influenced by solution chemistry, such as pH, ionic strength, and valence and
concentration of ionic species [48, 101]. Mechanistic studies have shown that electrical
double layer interactions strongly influence the retention of inorganic oxide
nanoparticles. With the significant variance of influencing factors, a fast, simple,
accurate technique for the measurement of nanoparticle retention in porous media would
be highly profitable.
The most common technique for measuring the concentration of nanoparticles in
porous media filtration experiments are UV-Vis spectrophotometry [96, 102-103] or

43
inductively coupled plasma atomic emission spectroscopy (ICP-AES) analysis of acid-
digested samples [83-84]. A common problem associated with both of these techniques
is sample collection and time-consuming preparation and analysis procedures. Sampling
provides opportunities for error in mass balance, especially in the case of ICP-AES
measurement, as a digestion step is often necessary prior to analysis. Measurement delay
could also result in the aggregation or settling of nanoparticles which could interfere with
UV-Vis measurements. Finally, sampling adds unnecessary complexity to the
experiment and digestion and ICP-AES analysis is laborious and more costly. Online
measurement is advantageous due to its simplicity and improved accuracy.
In this work, an approach to monitoring nanoparticle retention in porous media
utilizing online UV-Vis absorbance measurements is proposed and demonstrated. The
ability to rapidly obtain data on nanoparticle transport under various conditions using the
proposed apparatus, provides a basis for developing more effective strategies for the
treatment of effluents containing nanoparticles.
44
2.2. Experimental
2.2.1. Materials
Nano-TiO2 (Aeroxide P25, average primary particle size = 25 nm) was obtained
from Evonik Industries (Essen, Germany). Two types of porous media were used, sand
and granular activated carbon (GAC). The quartz sand (Acros Organics, Geel, Belgium)
had a size range of 149 to 400 µm. Sand particles were washed prior to use with 10%
HNO3, rinsed with deionized water and dried at 105˚C. The GAC (KCI-40 AD, KC
International, Thousand Palms, CA) ranged in particle size from 400 to 1,680 µm. The
GAC was rinsed thoroughly with deionized water under ultrasonic agitation to remove
fines and then saturated with deionized water prior to column packing.
TiO2 suspensions (50 mg L-1
) were prepared in a phosphate buffer (0.5 mM, pH 7,
1 mM ionic strength). Dispersions were sonicated before the start of an experiment using
a Cole-Parmer ultrasonic processor (Vernon Hills, IL) at 65% intensity for 5 min.
2.2.2. Experimental Setup
Figure 2.1 shows a framework of the experimental apparatus. The glass column
(Diameter = 15 mm, Length = 150 mm, Omnifit Benchmark, Diba Industries, Danbury,
CT) was connected to flow-through quartz cuvettes (10 mm path length, Starna Cells
Inc., Atascadero, CA) using PTFE tubing. The nanoparticle dispersion was fed using a
Micropuls3 peristaltic pump (Gilson Inc., Middleton, WI). Absorbance at 300 nm was
monitored for the inlet and outlet of the column at 10 sec intervals using a UV-Vis
spectrophotometer (UV 1800, Shimadzu Corporation, Kyoto, Japan).

45
Column preparation varied slightly between sand and activated carbon. Sand
columns were dry packed with 36.5 g of sand under agitation from an ultrasonic bath.
The sand column was then filled from the bottom with deionized water to ensure wetting
of the bed and facilitate removal of trapped air. GAC columns were wet packed using
previously rinsed GAC (10.5 g dry weight). The columns were then rinsed with
deionized water in an ultrasonic bath to ensure elution of any remaining fines. Column
Figure 2.1. Online experimental apparatus including continuously-
stirred nanoparticle suspension [1], peristaltic pump [2], UV-Vis
spectrophotometer [3], flow through cuvettes for influent [4] and
effluent [6], and glass column packed with porous media [5]. This
apparatus provides fully online data of nanoparticle retention in the
column without the need for sampling or further sample preparation
prior to measurement.
Pump Waste
[1]
[2] [3]
[4] [6]
[5]
46
porosity was determined by measuring the entrained water mass after rinsing. A
phosphate buffer (0.5 mM, pH 7, 1 mM ionic strength) was prepared and ammonium
polyacrylate dispersant (Dispex A40, BASF Chemical Co., Freeport, TX), if used, was
added at 0.1 g L-1
prior to final pH adjustment. A portion of this solution was then
separated to pre-rinse the column, displacing 5 bed volumes, so that the pore solution in
the column was identical to that used in the nanoparticle suspension.
The nanoparticle suspension was pumped through the column at a rate of 2.6 mL
min-1
for 30 bed volumes. Inlet and outlet dispersion samples were collected at 10 bed
volume intervals and tested for size distribution and zeta potential.
2.2.3. Analysis
TiO2 NPs were imaged by transmission electron microscope (TEM) using a
Hitachi H8100 (Hitachi High-Technologies Corp., Tokyo, Japan) at 200 keV. The zeta
potential of nanoparticle dispersions was measured immediately after sampling by a
ZetaSizer Nano ZS (Malvern, Inc., Sirouthborough, MA) using laser doppler
velocimetry. Particle size distribution measurements were conducted by dynamic light
scattering using the same instrument. Elemental analysis of the samples for titanium
content was performed in two steps. First, the samples were digested with equal parts
HNO3 (70%) and H2SO4 (95%) in a microwave-assisted extraction system (120˚C, 45
min, MARS Xpress, CEM Corp, Matthews, NC). The samples were then diluted and
analyzed by ICP-AES (334.94 nm, Optima 2100DV, Perkin Elmer, Waltham, MA).

47
2.3. Results and Discussion
2.3.1. TiO2 Nanoparticles
TiO2 nanoparticle size distributions were obtained in the buffer solution with and
without added dispersant. The average particle sizes came to 194 and 200 nm, as seen in
the particle size distributions shown in Figure 2.2. Additionally, particle morphology
was determined by TEM imaging. The particles are nearly spherical and crystalline as
shown in Figure 2.3.
2.3.2. Apparatus Performance
The proposed technique allows rapid, simultaneous measurement of the
nanoparticle concentration in both the influent and effluent of the column by utilizing
flow-through cuvettes in the reference and measurement cells of a UV-Vis
spectrophotometer. The absorption difference between the two cells is constantly
measured, resulting in detailed breakthrough curves, as shown in Figure 2.4A for
nanoparticles in columns packed with clean sand or GAC. The small standard deviation
of the triplicate measurements emphasizes the high reproducibility and precision of the
technique.
Sand showed a very poor affinity for the nanoparticles and complete breakthrough
was observed in just over two bed volumes. This is likely due to the large electrostatic
repulsion between the similarly charged nanoparticles and sand. The surface charge of
the TiO2 dispersion was highly negative, with a zeta potential of -45 mV. Sand also has a
highly negative surface charge at pH 7, thus making it a poor sorbent. This result

48
matches well with the findings of other investigations of inorganic oxide interaction with
sand, with total breakthrough attained around two bed volumes [84, 99]. Activated
carbon, alternatively, showed a higher affinity for nano-TiO2.
Figure 2.2. Particle size distribution of the TiO2 nanoparticle dispersions with no
additive (—) and with synthetic dispersant, Dispex (- - -).
0
2
4
6
8
10
12
14
1 10 100 1000 10000
Inte
ns
ity %
Diameter (nm)

49
Figure 2.3. Transmission electron microscopy image of the TiO2 nanoparticles
utilized in this study.

50
Figure 2.4. Breakthrough curves of TiO2 NPs with no additives (A) and with
the presence of a synthetic dispersant Dispex (B) in beds packed with sand (○)
and GAC (□). NP dispersion (pH 7) was introduced at 2.6 mL min-1
. Error bars
indicate standard deviation for three runs.
-0.2
0
0.2
0.4
0.6
0.8
1
1.2
0 2 4 6 8 10
Rela
tive
Co
nce
ntr
ati
on
(C
/Co)
-0.2
0
0.2
0.4
0.6
0.8
1
1.2
0 2 4 6 8 10
Rela
tive
Co
nce
ntr
ati
on
(C
/Co)
Bed Volumes

51
After an initial steep rise to approximately 60% influent concentration, a much slower
retention mechanism became dominant. This increased capture affinity is likely due to
the complex pore network typical of GAC. Nanoparticles may be able to diffuse into the
GAC pore network; however, this hypothesis would require further investigation.
Currently there are no published studies considering the use of activated carbon as an
adsorptive media for nanoparticles.
The addition of a dispersant, Dispex A40, effectively stabilized the nanoparticles
through increasing the negative charge density on the surface and led to rapid
nanoparticle breakthrough both in sand and GAC packed columns (Figure 2.4B). The
zeta potential of the TiO2 dispersions supplied with Dispex decreased to -52 mV, thus
further diminishing the association of the nanoparticles with sand. In the case of GAC,
the increased electrostatic repulsion between the nanoparticles likely hindered their
migration into the more constricted pore space. Coating of the nanoparticle surface with a
highly hydrophilic dispersant may have also contributed to reduce nanoparticle affinity
for the hydrophobic GAC, resulting in full breakthrough in fewer than two bed volumes.
The negative impact of synthetic dispersants on NP retention by porous media has been
reported in previous studies [85, 93, 104]. This result displays the sensitivity of
nanoparticle retention resulting from a change in solution characteristics.
Overall, it is shown that the online measurement of nanoparticle retention is
highly sensitive, allowing for detailed contours of the breakthrough curve, as well as
rapid and highly repeatable, as evidenced by the low standard deviations between
replicates. The retention measurements at short time intervals also allow this technique

52
to fully capture the dynamics of NP capture, which is often difficult with off-line
sampling as a preset sampling frequency often limits the number of data points obtained
during the important transition from full retention to full breakthrough. Characterization
of the capture dynamics is of utmost importance for future system design. The basis of
this technique, online monitoring of inlet and outlet NP concentrations, has the added
benefit of providing the flexibility to adapt to the evaluation other treatment techniques
such as membrane filtration. Finally, the rapid evaluation of the effect of numerous flow
and solution conditions eases parameter studies necessary for model development,
another key aspect of system design and scaling. This method provides a foundation for
enhanced comprehension of transport and retention of NPs in porous media systems,
which enables the design of enhanced abatement technologies and the prediction of NP
fate in the environment.

53
2.4. Conclusions
The method developed and validated in this study provides a rapid, robust
approach for monitoring nanoparticle retention in porous media. The major advantage
and uniqueness of this method is in using an on-line, real-time, and in-situ method for
measuring nanoparticle transport and retention dynamics; this eliminates the complexity
and errors of sampling and off-line analysis. The method was applied and tested for TiO2
nanoparticles in two porous filtration media, GAC and sand, which provided retained
concentrations of 0.24-0.37 mg/g and 0.01-0.014 mg/g, respectively. The method is
useful for determining the role of various transport mechanisms, process bottlenecks, and
values of fundamental process parameters.
54
CHAPTER III
APPLICATION OF FLUORESCENT CORE-SHELL SILICA
NANOPARTICLES AS TRACERS IN POROUS MEDIA
FILTRATION
Abstract
Engineered nanomaterials have provided many benefits for manufacturing but
their increased utilization has also led to environmental and health issues as some
nanoparticles appear to be harmful to both human health and the environment. The
release of nanoparticles into the environment highlights the importance of understanding
the transport and retention of nanoparticles in porous media as these will govern the fate
of engineered nanomaterials in the subsurface soil environment and will also determine
the potential application of granular filtration as a targeted technique for nanoparticle
removal. Despite the increased usage of silica nanoparticles (n-SiO2) little is known
about their behavior in porous media, likely due to the lack of suitable methods that
would allow their detection in real time. Utilization of fluorescent-cored n-SiO2 provides
a rapid method of determining transport in porous media. Presented is the synthesis and
application of custom, fluorescent, core-shell n-SiO2 in three sizes: 20-25 nm, 110-120
nm, and 700-850 nm. The selection of the fluorescent dye proved important as
rhodamine isothiocyanate was found to avoid the dye leakage problem associated with
NHS-fluorescein. A thorough understanding of the impact of nanoparticle size is critical
55
in the evaluation of how transport differs for nanoparticles as opposed to their larger
counterparts. A comparison of the transport of the three types of n-SiO2 in diatomaceous
earth columns displayed the importance of evaluation of particle number capacity as well
as mass capacity. Results indicate that the interaction between the SiO2 nanoparticles and
diatomaceous earth is governed by site-specific adsorption.

56
3.1. Introduction
Many industries have benefited greatly from the advent of nanotechnology and
the use of engineered nanoparticles (NPs) [6-7, 16]. Nano-sized silicon dioxide (n-SiO2)
has become one of the most commonly used nanoparticles, with applications ranging
from fabric additive to abrasive in semiconductor manufacturing [105]. Utilization of n-
SiO2 is also increasing in biomedical applications including cancer therapy and drug
delivery [106-107]. Increased usage potentially results in a greater release of n-SiO2,
with the international Organization for Economic Cooperation and Development (OECD)
listing n-SiO2 as a nanoscale material of interest.
Limited studies of n-SiO2 transport in porous media have been performed.
Torkzaban and coworkers investigated the n-SiO2 transport in quartz sand columns and
found insignificant deposition at both 5 and 10 mM Ca2+
unlike the quantum dots and
carboxylate-modified latex NPs, which were adsorbed via bridging by the Ca2+
[108].
Another study by Wang and coworkers evaluated n-SiO2 (8 and 52 nm) retention in sand
by fraction collection and inductively coupled plasma – optical emission spectroscopy
(ICP-OES) [88]. They found that the smaller NPs were better retained than the larger
particles due to enhanced energetics of the interaction between the smaller NPs with the
sand. Both studies relied on fraction collection and offline analysis of the n-SiO2
concentration.
Investigation of the environmental release of n-SiO2 is difficult due to the
omnipresence of SiO2 in the environment. Destructive analysis techniques, such as ICP-
OES, therefore, require very clean samples with low levels of background silicon in order

57
to obtain good results. Light absorption techniques have been shown to be applicable for
nanoparticles (NPs) with a high optical density, such as zero-valent iron and titanium
dioxide [102-103]. However, for less opaque NPs such as SiO2, a large concentration is
necessary for adequate detection. The use of fluorescently modified n-SiO2 provides
increased sensitivity according to dye concentration and flexibility in that numerous
fluorescent dyes may be utilized.
Attaching amine-reactive fluorescent tags onto the surface of n-SiO2 is a
relatively simple process involving the silanization of the silica surface followed by
reaction with the dye [109]. However, the large fluorescent molecule on the surface may
greatly influence the n-SiO2 behavior in the environment as seen with other large organic
molecules [89, 110]. Embedding the fluorescent dye within the framework of the NP
provides increased photo-stability, leading to greater sensitivity, and allows for natural
SiO2 surface chemistry to dictate environmental behavior.
The sol-gel synthesis of colloidal SiO2 was introduced by the ground-breaking
work of Stöber and his coworkers in 1968 [111]. This process, which takes place in a
water-doped ethanol solution using ammonia as a catalyst, produces electrostatically
stabilized particles ranging from hundreds of nanometers to single micrometers by
hydrolysis (Eq. 3.1) and condensation (Eq. 3.2) of tetraethoxysilane. Later, van
Blaaderen and coworkers expanded this work to include the addition of organic
Si(OR)4 + 4H2O → Si(OH)4 + 4ROH (3.1)
Si(OH)4 → SiO2 + 4H2O (3.2)
58
molecules in different locations from the surface to throughout the entirety of the particle
[112]. This group introduced fluorescein isothiocyanate as a fluorescent marker and
found that any amine-reactive fluoropore could be adequately substituted. The Weisner
group has since furthered the production of fluorescent-core n-SiO2 to provide for the
synthesis of fluorescent NPs, pushing the applicable size range down to the order of 10-
15 nm [113]. These particles had an incorporated fluoropore in the “core” of the particle
and a “shell” of pure SiO2. This particle structure, notably the siliceous shell, provided
enhanced photo-stability as well as increased brightness. Since then, SiO2 NPs of
varying sizes with imbedded dyes have been produced using numerous colored and
fluorescent dyes [114-116].
The purpose of this work is to demonstrate the applicability of custom synthesized
fluorescent core SiO2 NPs as tracers for NP transport in porous media. This was
accomplished first by the synthesis of multiple sizes of fluorescent cored n-SiO2. These
fluorescent NPs were utilized to investigate NP transport in porous media under varying
conditions. The simple SiO2 surface chemistry along with the ability to be tracked at low
concentrations provided a basis for their use as representative nanoparticles for
environmental analysis.

59
3.2. Materials and Methods
3.2.1. Fluorescent Nanoparticle Synthesis
Three sizes of n-SiO2 (S, L, and XL) were synthesized with target sizes of 25, 100
and 850 nm, and they are named for the fluorescent dye used, either N-
hydroxysuccinimide fluorescein (NHSF) or rhodamine B isothiocyanate (RITC), as Fl- or
Rh-. All particles were synthesized at room temperature (23±2°C). The smallest
nanoparticles, Fl-S and Rh-S, were synthesized by initial conjugation of the selected
fluorescent dye with 3-aminopropyl-triethoxysilane (APTES) at a molar ratio of 1:50.5
(dye:APTES) in ethanol for a final dye concentration of 4.2 mM. This conjugation is
illustrated in Figure 3.1. An aliquot (1.01 mL) of the conjugated dye solution was then
added to a 250 mL core-formation solution with an ethanol base and 0.20 M ammonia,
0.86 M deionized (DI) water, and 0.05 M tetraethyl orthosilicate (TEOS). The
components were added in the following order: ammonia, DI water, conjugated dye,
TEOS. The solution was then stirred for at least 8 h using a magnetic stir bar at 300 rpm.
In order to coat the NPs with a shell of pure silica, 12-0.5 mL aliquots of TEOS were
added every 15 min, allowing 30 min after the final addition.
The larger nanoparticles, Fl-L and Rh-L, were synthesized by conjugation of the
selected dye with APTES at a molar ratio of 1:3.8 (dye:APTES) in ethanol. The core
preparation was accomplished by addition of the following, in the same order as above, to
final concentrations of 0.995 M ammonium hydroxide, 1.272 M DI water, 0.173 M
TEOS as well as 5.0 mL of the conjugated dye. This solution was stirred for at least 8 h
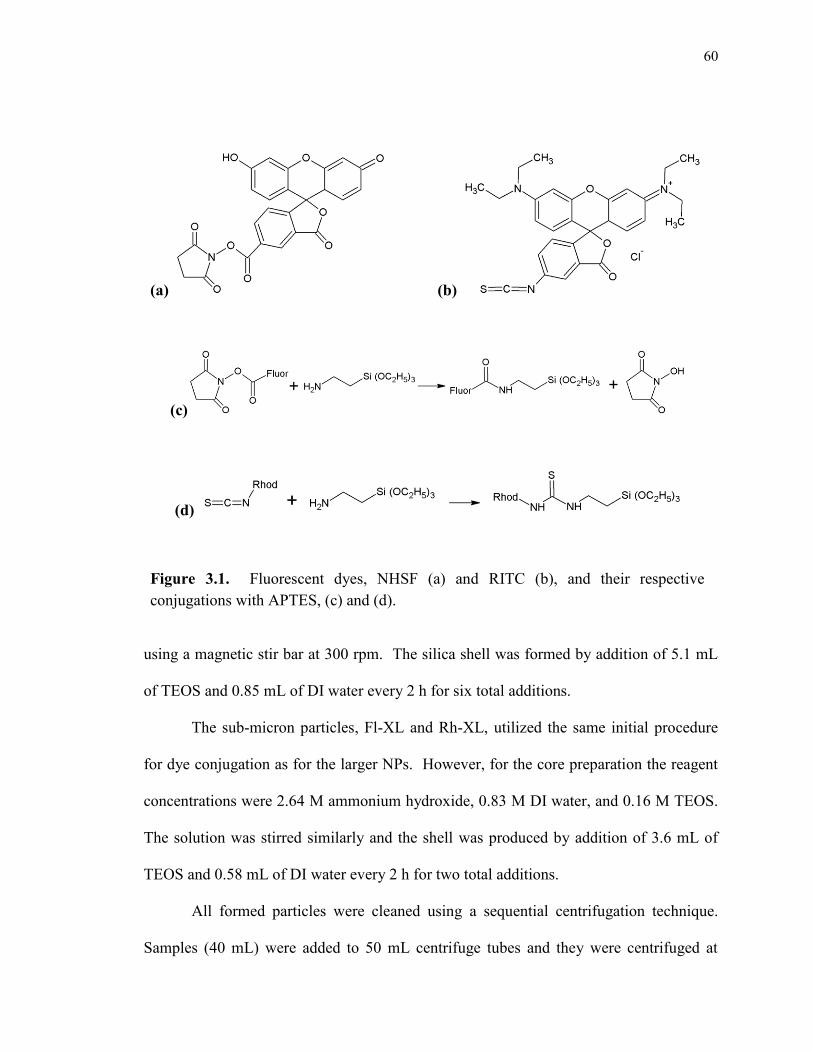
60
using a magnetic stir bar at 300 rpm. The silica shell was formed by addition of 5.1 mL
of TEOS and 0.85 mL of DI water every 2 h for six total additions.
The sub-micron particles, Fl-XL and Rh-XL, utilized the same initial procedure
for dye conjugation as for the larger NPs. However, for the core preparation the reagent
concentrations were 2.64 M ammonium hydroxide, 0.83 M DI water, and 0.16 M TEOS.
The solution was stirred similarly and the shell was produced by addition of 3.6 mL of
TEOS and 0.58 mL of DI water every 2 h for two total additions.
All formed particles were cleaned using a sequential centrifugation technique.
Samples (40 mL) were added to 50 mL centrifuge tubes and they were centrifuged at
(a) (b)
(c)
(d)
Figure 3.1. Fluorescent dyes, NHSF (a) and RITC (b), and their respective
conjugations with APTES, (c) and (d).

61
5,000 rpm for 8 h. The supernatant was discarded and the particles were resuspended in
40 mL ethanol by sonication using an ultrasonic processor (Cole-Parmer, Vernon Hills,
IL, USA, 70% intensity, 5 min). Centrifugation and resuspension were repeated once
using ethanol and twice resuspending in water. The final resuspension was done using
only 20 mL of DI water in order to obtain a concentrated stock solution.
3.2.2. Filtration Media
Three column bed materials were examined: quartz sand (Acros Organics, Geel,
Belgium) with an average diameter of 190 μm, activated carbon (AC) (KCI-40AD, KC
International, Thousand Palms, CA, USA), an acid washed activated carbon with 1,000
μm average diameter, and diatomaceous earth (DE) (Celite 545, Sigma Aldrich, St.
Louis, MO, USA) with a reported size of < 125.3 μm. DE is a siliceous compound with
varied deposits of other compounds. According to the manufacturer, the batch of DE
utilized contained: silicon dioxide (89.0%), aluminum oxide (1.0%), calcium oxide
(6.7%), ferric oxide (0.46%), as well as sodium oxide and potassium oxide (1.9%
combined). The DE was sieved and the material retained on a 200 mesh (74 μm) sieve
was separated for use. Sand and DE were washed prior to use: soaked in diluted
hydrochloric acid (HCl, 5%), rinsed by deionized water, and dried in an oven for 8 h
(105˚C). The AC was rinsed with deionized water to remove associated fines.
3.2.3. Column Experiments
Experiments were performed using a glass column (diameter = 15 mm, length =
62
150 mm, Omnifit Benchmark, Diba Industries, Danbury, CT, USA) packed with the
porous medium. A flow-through quartz cuvette with a 10 mm path length, 4 x 11 mm
excitation window, and 10 x 11 mm emission window (Starna Cells, Inc., Atascadero,
CA, USA) was connected to the column effluent using 0.159-cm diameter PTFE tubing.
A fluorescence spectrophotometer (LS 55, Perkin Elmer, Waltham, MA, USA) provided
fluorescence data, at 494/518 nm (excitation/emission) for NHSF and at 530/580 nm
(excitation/emission) for RITC, monitored by an attached computer at 1 sec intervals. All
measurements were taken with 10-mm excitation and emission slit widths. All
experiments were performed at room temperature (23±2°C) and flow rate, 2.6 mL min-1
unless otherwise noted, was achieved using a peristaltic pump (Micropuls3, Gilson, Inc.,
Middleton, WI, USA).
Sand or DE columns were dry-packed with 36.5 g or 8.5 g of pre-washed sand or
DE, respectively, under agitation from an ultrasonic bath. The column was then filled
from the bottom with deionized water at a rate of 2.6 mL min-1
for 30 min in an ultrasonic
bath to ensure wetting of the bed. AC columns were wet packed using previously rinsed
AC to a final dry activated carbon weight of 10.5 g. The AC columns were then rinsed
with deionized water for 30 min in an ultrasonic bath to ensure elution of any remaining
fines.
3.2.4. Imaging of Nanoparticles
The synthesized NPs were imaged by transmission electron microscope (TEM) using a
Hitachi H8100 (Hitachi High-Technologies Corp., Tokyo, Japan) at 200 keV. Samples
were placed on Formvar coated copper grids and allowed to dry prior to imaging.
63
3.2.5. Particle Size Distribution and Zeta Potential
The zeta potential and particle size distribution of NP dispersions were measured with a
ZetaSizer Nano ZS (Malvern, Inc., Sirouthborough, MA, USA) using laser doppler
velocimetry and dynamic light scattering, respectively. The refractive index used for
SiO2 was 1.475 and all size distributions were obtained from light intensity distributions.
The isoelectric point (pHIEP) of the synthesized nanoparticles was determined using the
above instrument with pH control provided by an autotitrator accessory (MPT-2,
Malvern, Inc.) using 1.0 M HCl and NaOH solutions.
3.2.6. Analysis
Elemental analysis of the samples for silicon content was performed in two steps. First,
the samples were digested with HF (1%) in a microwave-assisted extraction system
(MARS Xpress, CEM Corp, Matthews, NC) for 45 min at 120˚C. The samples were then
diluted to 0.1% HF and analyzed by ICP-AES (251.611 nm, Optima 2100DV, Perkin
Elmer).
3.2.7. Chemicals
The fluorescent dyes used included NHSF (Thermo-Scientific, Waltham, MA, USA) and
RITC (Sigma Aldrich, St. Louis, MO, USA). The APTES (≥ 98%), ethanol (200 proof,
anhydrous) and TEOS (reagent grade, 98%) were all obtained from Sigma Aldrich.
Ammonia addition for the smallest nanoparticles was achieved using a pre-diluted
ammonia solution (2.0 M in ethanol, Sigma Aldrich), while ammonium hydroxide (ACS

64
reagent, Sigma Aldrich) was used for the larger particles. Commercial n-SiO2 (10-20
nm) was obtained from Sigma Aldrich.
3.3. Results and Discussion
3.3.1. Nanoparticle Synthesis
The first generation of the core-shell SiO2 NPs utilized NHSF as the fluorescent
dye. Nanoparticles with three different sizes were successfully produced. The average
particle sizes determined by dynamic light scattering were 24±1 nm (Fl-S), 109±1 nm
(Fl-L), and 848±20 nm (Fl-XL). The polydispersity of the Fl-S, L and XL particles was
0.122, 0.189, and 0.103, respectively. TEM images of each of these batches of particles,
along with their corresponding particle size distributions, are shown in Figure 3.2.
Determination of the average particle size by TEM analysis resulted in sizes for Fl-S, L
and XL of 21±3 nm, 69±10 nm, and 634±36 nm, respectively. All particles presented
smaller in TEM analysis due to the fact that light scattering methods determine the
hydrodynamic diameter of the particles. Dehydration of the samples for TEM imaging
eliminates this hydrated layer. One notable feature of these particles is the relative
uniformity in size as all distributions had less than 3% standard deviation, and the smaller
two batches had standard deviations less than 0.6%. To compare the surface behavior of
the synthesized n-SiO2 in comparison to commercial n-SiO2, their zeta potential was
determined as a function of pH. The resulting titration curves are shown in Figure 3.3.
While the pHIEP was not fully reached, the value can be safely assumed to be close to 2

65
for all samples. All synthesized particles showed remarkable agreement with the
commercial SiO2 sample implying a successful coating of the surface with pure silica.
The calibration curves fluorescence (Fl) vs. concentration (C, mg-SiO2 L-1
) for the
Fl-L and Fl-XL particles are shown in Figure 3.4. For the Fl-L particles, a calibration
curve can be plotted ( , R2
= 0.9996) providing a limit of detection
of 10 mg-SiO2/L. Similarly the calibration curve for the Fl-XL particles (
, R2 = 0.9993) provides a limit of detection of approximately 10 mg-SiO2 L
-1.
Fl-S NPs were not included in this calibration due to significant dye leakage. On
average, approximately 80% of the fluorescein dye leaked from the Fl-S particle matrix
after only 5 d. The Fl-L and Fl-XL particles were not immune from this effect, with
average dye leakage amounts of approximately 30% after 5 d.

66
Figure 3.2. TEM images (left) and the corresponding particle size distributions (right)
of first generation n-SiO2 synthesized with NHSF dye shown for Fl-S (A), Fl-L (B),
and Fl-XL (C).
0
4
8
12
16
1 100 10000
Inte
nsi
ty %
Diameter (nm)
0
2
4
6
8
10
12
14
1 100 10000
Inte
nsi
ty %
Diameter (nm)
0
5
10
15
20
1 100 10000
Inte
nsi
ty %
Diameter (nm)
A
B
C

67
Figure 3.3. Zeta potential of silica dispersions as a function of pH for a commercial
n-SiO2 (♦) and for the synthesized Fl-S (●), Fl-L (▲), and Fl-XL (■) n-SiO2 particles.
-60
-50
-40
-30
-20
-10
0
1 3 5 7 9 11 13
Zet
a P
ote
nti
al
(mV
)
pH
Figure 3.4. Fluorescence calibration curves for Fl-L (▲) and Fl-XL (■) particles are
best fit by (R2
= 0.9996) and (R2 =
0.9993), respectively.
0
100
200
300
400
500
600
700
0 20 40 60 80 100
Flu
ore
scen
ce
Concentration (mg-SiO2/L)
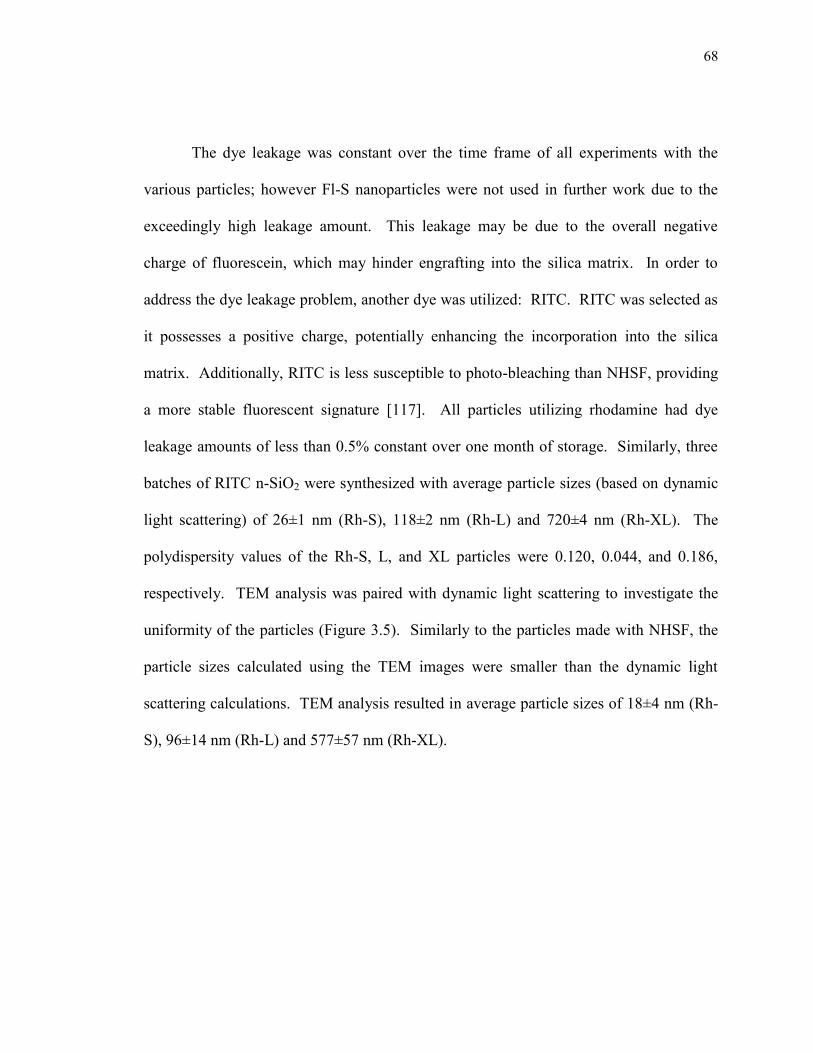
68
The dye leakage was constant over the time frame of all experiments with the
various particles; however Fl-S nanoparticles were not used in further work due to the
exceedingly high leakage amount. This leakage may be due to the overall negative
charge of fluorescein, which may hinder engrafting into the silica matrix. In order to
address the dye leakage problem, another dye was utilized: RITC. RITC was selected as
it possesses a positive charge, potentially enhancing the incorporation into the silica
matrix. Additionally, RITC is less susceptible to photo-bleaching than NHSF, providing
a more stable fluorescent signature [117]. All particles utilizing rhodamine had dye
leakage amounts of less than 0.5% constant over one month of storage. Similarly, three
batches of RITC n-SiO2 were synthesized with average particle sizes (based on dynamic
light scattering) of 26±1 nm (Rh-S), 118±2 nm (Rh-L) and 720±4 nm (Rh-XL). The
polydispersity values of the Rh-S, L, and XL particles were 0.120, 0.044, and 0.186,
respectively. TEM analysis was paired with dynamic light scattering to investigate the
uniformity of the particles (Figure 3.5). Similarly to the particles made with NHSF, the
particle sizes calculated using the TEM images were smaller than the dynamic light
scattering calculations. TEM analysis resulted in average particle sizes of 18±4 nm (Rh-
S), 96±14 nm (Rh-L) and 577±57 nm (Rh-XL).
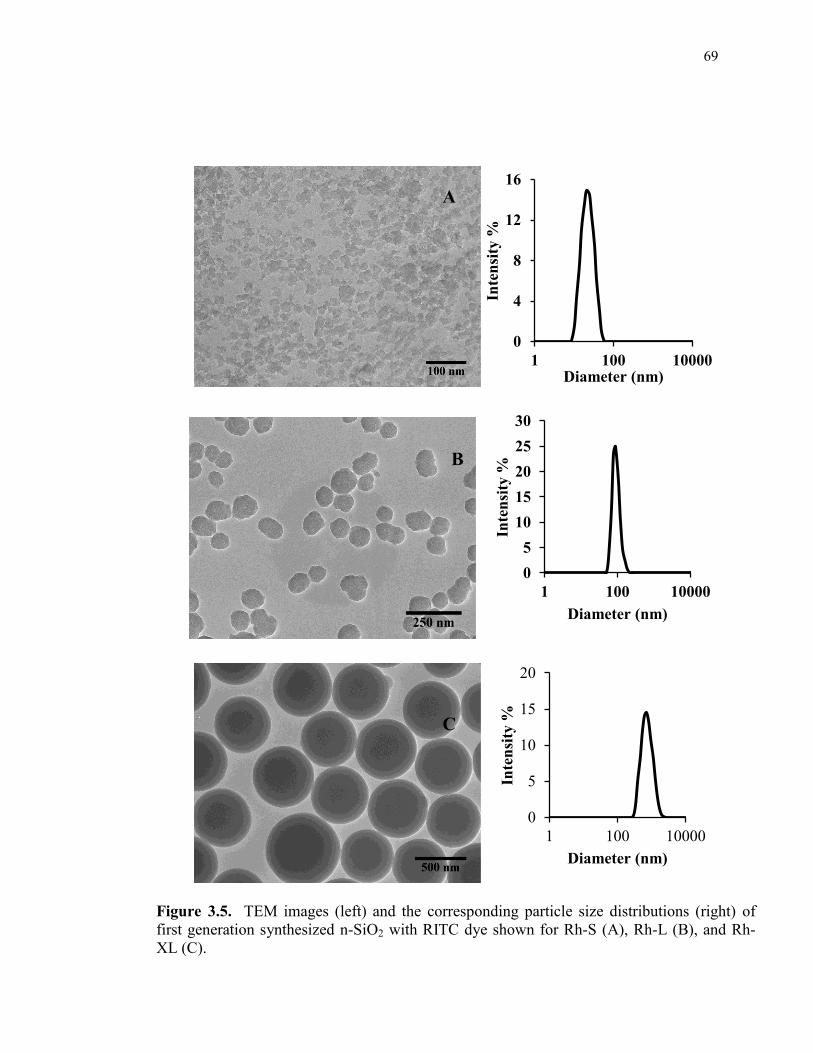
69
Figure 3.5. TEM images (left) and the corresponding particle size distributions (right) of
first generation synthesized n-SiO2 with RITC dye shown for Rh-S (A), Rh-L (B), and Rh-
XL (C).
0
4
8
12
16
1 100 10000
Inte
nsi
ty %
Diameter (nm)
0
5
10
15
20
25
30
1 100 10000
Inte
nsi
ty %
Diameter (nm)
0
5
10
15
20
1 100 10000
Inte
nsi
ty %
Diameter (nm)
A
B
C

70
Characterization of the SiO2 surface was done by zeta potential titration. The
titration of Rh-S, Rh-L and Rh-XL was shown to be in agreement with the commercially
obtained standard (Figure 3.6), again leading to the conclusion that the surface properties
of these NPs were similar to that of SiO2. The pHIEP of the Rh-S, L and XL particles
were 2.94, 2.85, and 2.96, respectively. A detection limit of these particles was
determined via a fluorescent calibration curve shown in Figure 3.7. The Rh-S NPs
produced the most steep calibration curve ( , R2 = 0.995)
incurring a detection limit of just 1 mg-SiO2 L-1
. Rh-L particles produced a higher
detection limit of 5 mg SiO2 L-1
with its calibration curve ( , R2 =
0.999). Rh-XL particles resulted in a higher still limit of detection of 10 mg SiO2 L-1
with
its calibration curve ( , R2 = 0.999). The high sensitivity and low
detection limit of the Rh-S NPs is due to a larger dye concentration relative to SiO2 in the
particles. The transition to RITC as the fluorescent dye produced highly stable particles,
eliminating the issue of dye leakage.

71
Figure 3.6. Zeta potential of silica dispersions as a function of pH for a commercial
n-SiO2 (♦) and for the synthesized Rh-S (●), Rh-L (▲), and Rh-XL (■) particles.
-70
-60
-50
-40
-30
-20
-10
0
10
1 3 5 7 9 11 13
Zet
a P
ote
nti
al
(mV
)
pH
Figure 3.7. Fluorescence calibration curves for Rh-S (●), Rh-L (▲), and Rh-XL (■)
particles are best fit by (R2 = 0.995),
(R2 = 0.999), and (R
2 = 0.999), respectively.
0
100
200
300
400
500
600
700
800
900
0 50 100 150 200
Flu
ore
scen
ce
Concentration (mg-SiO2/L)

72
3.3.2. Fluorescent SiO2 Nanoparticles as Tracers in Porous Media Column Experiments:
Effect of Particle Size and Concentration
An important question in the field of NP research is how the reduction in size into
the “nano” range changes the behavior of the otherwise well characterized bulk material.
One of the major benefits of these synthesized fluorescent-core SiO2 nanoparticles is that
they remain as primary particles in solution. This is due to the fact that they are never
dried and thus avoid the agglomeration issues with re-exposure to water which plague
most NP investigations [50]. Breakthrough curves for Rh-S, L, and XL NPs in columns
packed with DE are shown in Figure 3.8. Rh-S NPs were introduced at 1 mg-SiO2/L and
Rh-XL particles were introduced at 10 mg-SiO2 L-1
. Rh-L NPs were introduced at two
different concentrations in order to facilitate capacity comparisons: 10 and 50 mg-SiO2
L-1
. Rh-XL particles escaped the column starting at approximately 140 bed volumes, but
took until 300 bed volumes to come to full breakthrough. Rh-L NPs at 10 mg-SiO2 L-1
began breakthrough at 150 bed volumes reaching completion around 260 bed volumes
while at 50 mg-SiO2 L-1
initial escape began at 130 bed volumes and full breakthrough
occurred at approximately 230 bed volumes, a similar transition time. The steeper
breakthrough curves for the smaller particles is not consistent with a change in
dispersion, which is typically a function of fluid velocity and porous media grain size, but
may be explained by differences in surface interactions. The breakthrough curve for Rh-
S NPs, produced a different shape. There was an initial steep rise to approximately 70%
followed by a more gradual approach to full breakthrough. This is similar to results
obtained for TiO2 NPs in activated carbon columns [118]. This curve was explained by a

73
diffusion limited adsorption into the pore network of the activated carbon. This may
explain the current situation, as the DE pores are possibly smaller and thus this
interaction only became evident with the Rh-S NPs. While evaluation of the curves
provides a modicum of insight into the NP transport mechanisms, assessment of the bed
capacities produced insightful comparisons.
Comparison of the DE bed capacities, calculated from mass balances on the
breakthrough curves, for the fluorescent n-SiO2 is presented in Figure 3.9. The mass
capacities (Figure 3.9A) are relatively constant between the Rh-L at 10 mg-SiO2 L-1
(15±1 g-SiO2 g-1
DE) and Rh-XL (18±1 g-SiO2 g-1
DE), but show a steep decrease for the
Rh-S NPs (2±1 g-SiO2 g-1
DE). This finding is consistent with other studies evaluating the
effect of particle size on retention: smaller NPs display less retention than their larger
counterparts [101, 103, 119]. This conclusion breaks down, however with evaluation of
the number capacities (Figure 3.9B). The number concentrations were determined
assuming uniformly spherical particles of constant density. Comparing the same three
curves shows greater numbers of Rh-S NPs (9.5±0.4 x 10¹⁵
particles g-1
DE) retained than
that of Rh-L at 10 mg-SiO2 L-1
(9.1±0.6 x 10¹⁴
particles g-1
DE) or Rh-XL (7.9±0.3 x 10¹²
particles g-1
DE). To further evaluate the role of particle number as opposed to mass
concentration additional experiments were performed utilizing the Rh-L NPs at 50 mg-
SiO2/L, which produces a similar number concentration to that of the Rh-S NPs (3.1 x
1012
vs. 5.7 x 10¹²
particles L-1
, respectively). A comparison of these trials shows highly
similar number capacities and highly disparate mass capacities. This result indicates that
the interaction of n-SiO2 with DE is largely dominated by site-specific interactions with a

74
limited number of sites throughout the porous media. Thus, an evaluation of solely the
superior mass capacity of the Rh-L NPs at 50 mg-SiO2 L-1
over that of the Rh-S NPs may
lead to the inaccurate conclusion that the Rh-L NPs are better retained. A study of n-
SiO2 transport in sand columns has found that evaluations of NP retention in porous
media must be careful to inspect number concentrations as well as mass concentrations
before drawing conclusions on relative utility [88]. The site-specific adsorption of n-
SiO2 on DE also aids in the modeling of this system for scale-up and design.
Figure 3.8. Relative effluent concentration of fluorescent-core n-SiO2 as a function of
the number of DE bed volumes processed for the synthesized Rh-S at 1 mg-SiO2 L-1
(●), Rh-L at 10 mg-SiO2 L-1
(■), Rh-L at 50 mg-SiO2 L-1
(▲), and Rh-XL at 10 mg-
SiO2 L-1
(♦) particles. The n-SiO2 dispersions were introduced at 2.6 mL min-1
. Error
bars represent the standard deviation of duplicate measurements.
0
0.2
0.4
0.6
0.8
1
1.2
0 50 100 150 200 250 300 350 400 450
Rel
ati
ve
Con
cen
trati
on
(C
/Co)
Bed Volumes Processed

75
Figure 3.9. Bed capacities of DE for Rh-S at 1 mg-SiO2 L-1
(■), Rh-L at 10 (■) and
50 mg-SiO2 L-1
(■) and Rh-XL at 10 mg-SiO2 L-1
(■) based on mass concentration (A)
and number concentration (B). Error bars represent the standard deviation of duplicate
measurements.
0
10000
20000
30000
40000
50000
60000
70000
Rh-S Rh-L-10 Rh-L-50 Rh-XL
Cap
aci
ty (
mg
-SiO
2/g
DE
)
1E+10
1E+11
1E+12
1E+13
1E+14
1E+15
1E+16
1E+17
1E+18
Rh-S Rh-L-10 Rh-L-50 Rh-XL
Cap
aci
ty (
#/g
DE
)
A
B

76
3.3.3. Fluorescent SiO2 Nanoparticles as Tracers in Porous Media Column Experiments:
Effect of Porous Media and Flow Rate
As the utilization of the fluorescent NPs as tracers in porous media filtration was
the goal of the synthesis, application of the particles involved passing them through
various porous media columns while monitoring the effluent fluorescence signal.
Preliminary experiments comparing NP transport in two different porous media, namely
AC and sand, provided information on the retention of the NPs and the sensitivity of the
technique (Figure 3.10). Note that all concentration data regarding Fl-L and Fl-XL
particles is corrected for 30% dye leakage. It is readily apparent that there was increased
NP retention in the AC column, as the sand column attained full breakthrough almost
immediately. The difference in these curves may be due to the complex pore network of
the AC and the slow diffusion of the NPs into the pores. Additionally, there is
electrostatic repulsion between the n-SiO2 and the sand surface limiting adsorption as
seen in other studies [108]. The smooth nature of both curves indicated a strong signal to
noise ratio, giving credence to the results.
The effect of feed flow rate in AC columns is displayed in Figure 3.11. A study
on the velocity effects of NP deposition in porous media noted the importance of the
relative transport rates [96]. The slow diffusion of NPs into the AC pore structure is
dominated by convective transport down the column length under higher flow rates thus
decreasing the time to breakthrough. Similarly, another study of flow rate of ferrihydrite
NPs in sand found that generally as flow rate increased, retention decreased [120].
Observed again is the sensitivity of the technique and the applicability of the synthesized

77
particles for investigation of n-SiO2 retention in porous media. Continued application of
these particles may contribute to understanding the transport of n-SiO2 in porous media
as well as aid in the modeling of this complex system.
Figure 3.10. Column effluent concentration as a function of bed volumes processed for
fluorescent n-SiO2 (Fl-L, 109±1 nm) at 84 mg-SiO2 L-1
introduced at 2.6 mL min-1
in
both activated carbon (—) and sand (- - -).
0
0.2
0.4
0.6
0.8
1
1.2
0 10 20 30 40 50
Rel
ati
ve
Con
cen
trati
on
(C
/Co)
Bed Volumes Processed
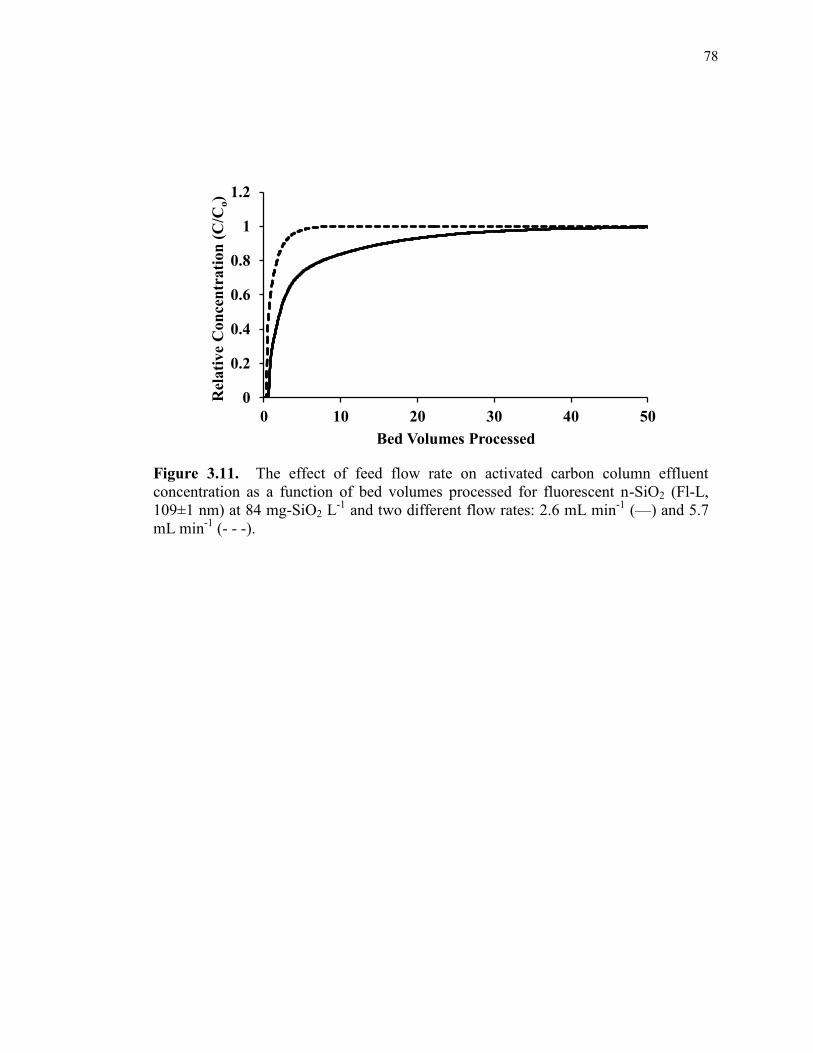
78
Figure 3.11. The effect of feed flow rate on activated carbon column effluent
concentration as a function of bed volumes processed for fluorescent n-SiO2 (Fl-L,
109±1 nm) at 84 mg-SiO2 L-1
and two different flow rates: 2.6 mL min-1
(—) and 5.7
mL min-1
(- - -).
0
0.2
0.4
0.6
0.8
1
1.2
0 10 20 30 40 50
Rel
ati
ve
Con
cen
trati
on
(C
/Co)
Bed Volumes Processed
79
3.4 Conclusions
Fluorescent, core-shell silica NPs have been synthesized in selectable sizes with
tight distributions. The fluorescent dye selection was displayed to be of significant
importance as substantial leaking of NHSF from the silica structure was observed with
time. Replacement with the fluorescent dye RITC solved this problem and additionally
provided enhanced photostability. One of the main advantages of these particles is the
propensity to remain in an unagglomerated state in water which allowed for a true size
comparison and elucidation of the “nano” effect. These synthesized NPs allowed for a
rapid, in-situ, and real-time assessment of the fate of n-SiO2 in porous media.
Comparisons of retention based on NP size showed that in the nano-range the particle
number concentration is important in drawing conclusions on the value of a particular
porous media. While larger NPs displayed vastly greater mass capacities, the particle
number capacities were very similar leading to the conclusion of site-specific adsorption
on the DE surface. This insight provides a basis for future media evaluation as well as
supports the modeling of this process for future scale-up and application.

80
CHAPTER IV
REMOVAL OF TiO2 NANOPARTICLES BY POROUS MEDIA:
EFFECT OF FILTRATION MEDIA AND WATER CHEMISTRY
Abstract
The use of nanoparticles in manufacturing as well as commercial products
continues to rise despite concerns over the environmental release and potentially negative
ecological and health effects. Some aqueous waste streams carry a large fraction of
released nanoparticles and thus should be targeted for treatment. Conventional porous
media filtration has focused on sand as the bed material with discouraging results. This
study investigated the effectiveness of three different bed materials, namely, sand,
activated carbon, and diatomaceous earth, on the removal of nano-TiO2 from aqueous
streams. Additionally, the impact of solution chemistry (a commercial dispersant and the
two organic compounds lysozyme and glycine) on nanoparticle retention by the various
bed materials was evaluated. Diatomaceous earth displayed great promise in nanoparticle
capture, providing full retention of a 50 mg TiO2 L-1
stream for the 30 bed volumes tested
as compared to zero and only 20% TiO2 capture for sand and activated carbon,
respectively. Batch isotherms showed that diatomaceous earth, with specific loading
capacities exceeding 25 mg TiO2 g-1
medium, has a high affinity for nano-TiO2. This
loading capacity is 20- and 1000-fold higher compared to activated carbon and sand,
respectively. The solution contaminants investigated had varying effects on nano-TiO2
81
retention depending on the bed material, indicating the need for investigation of co-
contaminants and their role on nanoparticle filtration. This study demonstrates the
superiority of DE as a filtration material compared to conventional sand and indicates its
suitability as a new material for the removal of nanoparticles in porous media filtration.
82
4.1. Introduction
Nanoparticles (NP) form the basis for development of new nano-enabled
technology, which is expected to be worth approximately $1 trillion annually by 2015
[1]. Metal oxide NPs, such as nano-titanium dioxide (n-TiO2), are of particular interest
due to their use in varied commercial products, from sunscreens and cosmetics to
abrasives in slurries used for semiconductor manufacturing [2]. A recent study puts the
upper bounds of yearly n-TiO2 production at approximately 2.5 million metric tons by
2025 [3]. Evaluating the health and environmental risks of these emerging contaminants
is an active area of research [4]. Effects on human health are of great concern with n-
TiO2 being shown to display neuro-toxicity toward dorsal root ganglion cells, even with
commonly applied inorganic coatings [5] and to bring about apoptosis and necrotic death
in human umbilical vein endothelial cells [6]. Ecotoxicity is also concerning as n-TiO2
has been found to be damaging toward both B. subtilis and E. coli, possibly due to
reactive oxygen species production [7]. The numerous exposure pathways and potential
toxicity leads to concerns about the release of these nanomaterials [8-9].
Wastewater streams have been specifically found to be potential point sources of
NP release [10]. A recent modeling of environmental concentrations of n-TiO2 produced
an estimate of over 1,500 tons of n-TiO2 per year entering sewage treatment plants in the
United States, with the majority of release being divided between the soil (~48%) and
surface water (~24%) [11]. While no current treatment techniques are utilized that
primarily target NP removal, the effectiveness of standard wastewater treatment
operations has been evaluated in a few studies. Flocculation and sedimentation processes

83
used in primary wastewater treatment were shown to be ineffective in removing SiO2
NPs due to their stability and slow settling rate [12]. Treatment by activated sludge, the
most common element of secondary wastewater treatment, was shown to be more
effective at removing NPs, however significant amounts of n-TiO2 remain in effluents of
these conventional wastewater treatment plants [13]. Additional procedures must be
instated to address the treatment of this emerging nano-scale contaminant. Porous media
filtration is a standard treatment technique for removing colloidal and particulate matter
from water streams and is becoming more common for wastewater treatment [14]. The
effectiveness of porous media filtration to remove colloidal substances, which by
definition are those between 1 and 1,000 nm, indicates the potential of this technique to
remove engineered nanomaterials. Understanding the role of this established technique
in NP removal is important for potential optimization and targeted use.
The most common type of porous media filtration used in wastewater treatment is
sand filtration [14]. The majority of research performed on NP removal has focused on
the use of sand as the bed material [15-17]. Investigations of NP retention in saturated
sand media have shown the importance of solution chemistry and its effects on
electrostatic interactions between the NPs and the sand surface. Quartz sand typically has
a point of zero charge (pHpzc) of approximately 3 and thus will be negatively charged at
circumneutral pH values [18]. The pHpzc of TiO2 ranges from 3.9 to 7.2 [19], thus the
surface of n-TiO2 typically carries a negative to near neutral charge near pH 7. This
electrostatic repulsion typically leads to significant and rapid elution of TiO2 NPs in sand
columns [16, 20-21]. In addition to pH, ionic strength and cation valence can have a

84
great impact on NP aggregation and NP retention by porous media filtration. Deposition
of TiO2 NPs onto sand has been shown to increase with both ionic strength and cation
valence [20]. A mechanistic study of TiO2 NPs in sand columns determined that
electrostatic interactions between the NPs and the sand surface were a significant factor
in NP capture. However, site blocking due to adsorbed NPs contributed significantly in
electrostatically favorable conditions and physical straining was notable during
aggregation inducing conditions [22]. These studies illustrate significant NP elution as
well as low loading capacities for the tested sand bed material.
The majority of studies have investigated NP retention in columns packed with
glass beads or quartz sand. Investigation of more efficient adsorptive media capable of
attaining high loading capacities is necessary to promote the potential use of porous
media filtration as a technique for NP abatement in aqueous waste streams. The
objective of this study is to determine a suitable bed media for the abatement of TiO2 NPs
and determine the major mechanisms guiding NP-media interactions, ultimately leading
to an improved treatment design. In order to attain this objective, this study evaluated
three different filtration materials including sand as a reference material, as well as
activated carbon and diatomaceous earth, which have never previously been applied to
NP filtration schemes. In addition, the impact of three model water contaminants, an
anionic dispersant and two organic compounds with disparate points of zero charge, on n-
TiO2 fate and transport in porous media was evaluated in order to evaluate potential
aqueous contaminants.

85
4.2. Materials and Methods
4.2.1. Materials
The NPs used were TiO2 (Aeroxide P25, Evonik Industries, Essen, Germany)
with a reported primary particle size of 21 nm. Aeroxide P25 is a well documented
composite of both anatase and rutile forms. A recent study found that composition
ranged from 73 - 85 % anatase, 14 - 17 % rutile and 0 - 18 % amorphous TiO2 [23].
Three bed materials were examined: quartz sand (Acros Organics, Geel,
Belgium) with an average diameter of 190 μm, activated carbon (AC) (KCI-40AD, KC
International, Thousand Palms, CA, USA), an acid washed activated carbon with 1,000
μm average diameter, and diatomaceous earth (DE) (Celite 545, Sigma Aldrich, St.
Louis, MO, USA) with a reported size of < 125.3 μm. DE is a siliceous compound with
varied deposits of other compounds. According to the manufacturer, the batch of DE
utilized contained: silicon dioxide (89.0%), aluminum oxide (1.0%), calcium oxide
(6.73%), ferric oxide (0.46%), as well as sodium oxide and potassium oxide (1.88%
combined). The DE was sieved and the material retained on a 200 mesh (74 μm) sieve
was separated for use. Sand and DE were washed prior to use: soaked in diluted
hydrochloric acid (HCl, 5%), rinsed by deionized water, and dried in an oven for 8 h
(105˚C). The AC was rinsed with deionized water to remove associated fines.
Three contaminants were used to simulate varying contaminants commonly found
in aqueous streams. An ammonium polyacrylate surfactant (Dispex A40, BASF,
Freeport, TX, USA) was selected as a model surfactant and dispersant. Lysozyme and

86
glycine, both obtained from Sigma Aldrich, are two model organic compounds with
disparate pHpzc: 9.60 and 5.97, respectively [24-25].
4.2.2. Porous Media and Nano-TiO2 Characterization
Scanning electron microscopy imaging of the porous media was done on a Hitachi
S-4800 field-emission SEM (Hitachi, Ltd., Tokyo, Japan) at 5 keV after fixing as
previously reported [26]. TiO2 NPs were imaged by transmission electron microscope
using a Hitachi H8100 at 200 keV. Surface area measurements were obtained by nitrogen
gas adsorption using a Beckman Coulter SA 3100 (Beckman Coulter, Inc., Brea, CA) and
the pore distribution data was deduced using a cylindrical pore model.
The measurement of net surface charge of the various media in relation to pH was
determined using an acidimeteric-alkalimeteric titration [27]. Vials with a 50 mL
capacity were filled with 20 mL of 0.01 M NaCl solution and 0.2 g of media. Seven vials
had aliquots of HCl (0.1 M) ranging from 0.05 to 1.5 mL added and equal additions of
NaOH (0.1 M) were added to seven additional vials. One vial was left with no addition
giving a total of 15 samples. The equilibrium pH was measured after 24 h shaking at
room temperature (23±2°C). The surface charge was determined using a site balance
[27].
The zeta potential and particle size distribution of NP dispersions was measured
immediately after sampling with a ZetaSizer Nano ZS (Malvern, Inc., Sirouthborough,
MA, USA) using laser doppler velocimetry and dynamic light scattering (DLS),
respectively. The hydrodynamic diameter of the NPs was calculated as the intensity
mean. The pHpzc of n-TiO2 was determined using the above instrument with pH control

87
provided by an autotitrator accessory (MPT-2, Malvern, Inc.). All measurements were
conducted at 25°C.
4.2.3. Adsorption Isotherms
Batch experiments for determining equilibrium isotherms of the TiO2 NPs with
the three bed materials were conducted in duplicate using a weak phosphate buffer
solution (0.5 mM, pH 7, 1.0 mM ionic strength) in glass serum flasks (166 mL) at room
temperature (23±2°C). The solution volume was 50 mL and the initial NP concentration
ranged from 5 – 200 mg L-1
. From 0.1 to 1.0 g of bed material was added to each flask.
NP-free and porous media-free controls were performed concurrently to account for any
titanium (Ti) leached from the porous media and for any TiO2 removal mechanisms not
mediated by the media, respectively. Samples were taken of the supernatant both initially
and after 3 days of stirring at 150 rpm, which a kinetic study proved to be sufficient time
to reach equilibrium. Samples for titanium analysis were taken after allowing the
suspensions to rest for 30 min to ensure the settling of the adsorptive media. The amount
of TiO2 adsorbed was determined by mass balance upon correction for any TiO2 settling
observed in the media-free control. An alternate method was used for DE due to
significant settling which occurred in these batches. The amount of n-TiO2 associated
with DE was determined by direct analysis. This was accomplished by filtering the
settled DE through a 0.45-µm membrane filter. This filtration ensured the elution of any
suspended n-TiO2 while capturing the DE, which was subsequently dried, weighed and
digested. Samples were then analyzed for Ti content. Settling of n-TiO2 in assays
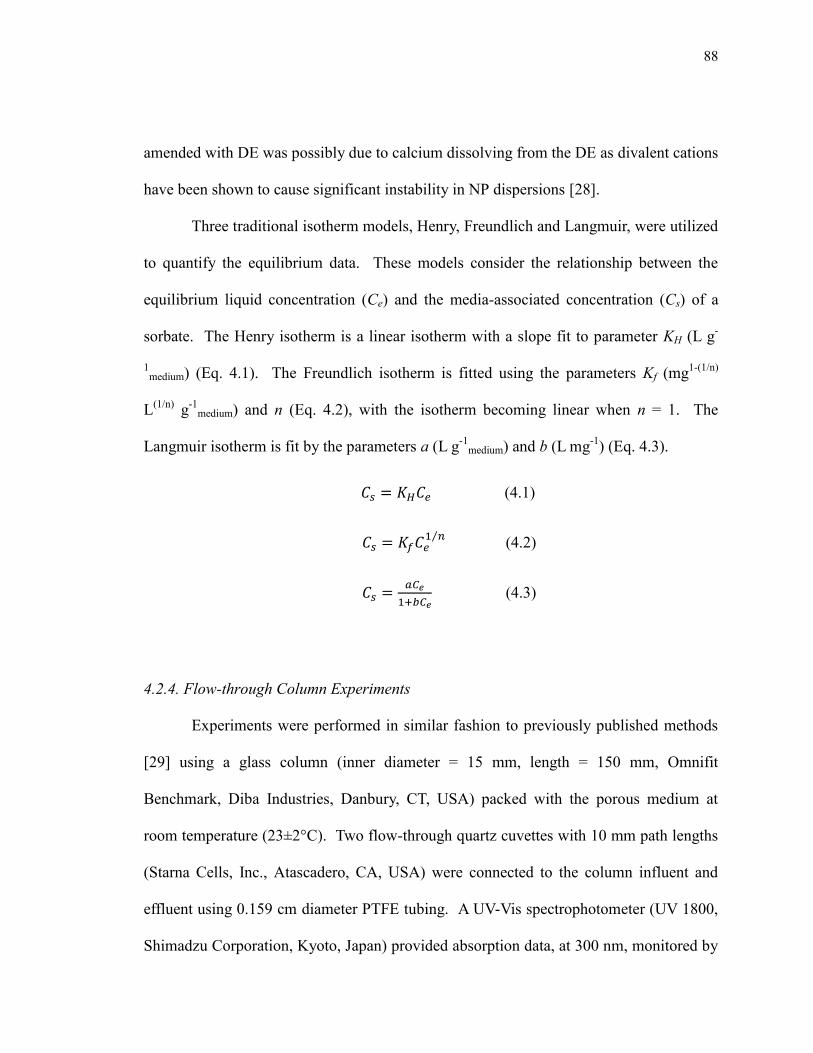
88
amended with DE was possibly due to calcium dissolving from the DE as divalent cations
have been shown to cause significant instability in NP dispersions [28].
Three traditional isotherm models, Henry, Freundlich and Langmuir, were utilized
to quantify the equilibrium data. These models consider the relationship between the
equilibrium liquid concentration (Ce) and the media-associated concentration (Cs) of a
sorbate. The Henry isotherm is a linear isotherm with a slope fit to parameter KH (L g-
1medium) (Eq. 4.1). The Freundlich isotherm is fitted using the parameters Kf (mg
1-(1/n)
L(1/n)
g-1
medium) and n (Eq. 4.2), with the isotherm becoming linear when n = 1. The
Langmuir isotherm is fit by the parameters a (L g-1
medium) and b (L mg-1
) (Eq. 4.3).
4.2.4. Flow-through Column Experiments
Experiments were performed in similar fashion to previously published methods
[29] using a glass column (inner diameter = 15 mm, length = 150 mm, Omnifit
Benchmark, Diba Industries, Danbury, CT, USA) packed with the porous medium at
room temperature (23±2°C). Two flow-through quartz cuvettes with 10 mm path lengths
(Starna Cells, Inc., Atascadero, CA, USA) were connected to the column influent and
effluent using 0.159 cm diameter PTFE tubing. A UV-Vis spectrophotometer (UV 1800,
Shimadzu Corporation, Kyoto, Japan) provided absorption data, at 300 nm, monitored by
⁄
(4.2)
(4.3)
(4.1)

89
an attached computer at 10 sec intervals. Flow rate control was achieved using a
peristaltic pump (Micropuls3, Gilson, Inc., Middleton, WI, USA).
Sand or DE columns were dry-packed with 36.5 g or 8.5 g of pre-washed sand or
DE, respectively, under agitation from an ultrasonic bath. The column was then filled
from the bottom with deionized water at a rate of 2.6 mL min-1
for 30 min in an ultrasonic
bath to ensure wetting of the bed. AC columns were wet packed using previously rinsed
AC to a final dry activated carbon weight of 10.5 g. The AC columns were then rinsed
with deionized water for 30 min in an ultrasonic bath to ensure elution of any remaining
fines.
A weak phosphate buffer (0.5 mM, pH 7, 1 mM ionic strength) was prepared and
any contaminants, when applicable, were added prior to final pH adjustment. Both pH
and conductivity measurements were taken for each preparation. A portion of this
solution was then separated to pre-rinse the column, displacing 5 bed volumes, so that the
conditions on the column were identical to those in the NP suspension.
Suspensions of n-TiO2 (50 mg L-1
) were prepared in the previously prepared
buffer solution by adding the appropriate amount of NPs to 50 mL centrifuge tubes filled
with approximately 45 mL of the background solution. These were then sonicated
(Ultrasonic Processor, Cole-Parmer, Vernon Hills, IL, USA, 65% intensity, 5 min) and
recombined under constant stirring. Both pH and conductivity measurements were again
performed to ensure continuity between experimental runs.
The NP suspension was pumped through the column at a rate of 2.6 mL min-1
for
30 bed volumes. Concurrently, samples were taken at 10 bed volume intervals and tested

90
for size distribution and zeta potential. After 30 bed volumes, the column was rinsed for
5 bed volumes with the background solution. Samples of the column media were then
taken at five locations equidistant throughout the column starting at the inlet in order to
determine the amount of retained NPs associated with the column media. These
experiments were performed in triplicate.
4.2.5. Chemical Analysis
Elemental analysis of the samples for titanium content was performed in two
steps. First, the samples were digested with equal parts HNO3 (70%) and H2SO4 (95%)
in a microwave assisted extraction system (MARS Xpress, CEM Corp, Matthews, NC,
USA, 120˚C, 45 min). The samples were then diluted and analyzed by ICP-AES (334.94
nm, Optima 2100DV, Perkin Elmer, Waltham, MA, USA). The detection limit for Ti was
0.1 μg L-1
.
4.3. Results and Discussion
4.3.1. Porous Media and Nano-TiO2 Characterization
4.3.1.1. Media Properties
In porous media filtration, the physical structure of the media is a major factor in
determination of retention mechanisms. A more porous material may allow for
additional surface area or more dead volume for the NPs to become trapped in. Also, a
rougher material provides a more tortuous path for the NPs which increases physical
entrapment. Figure 3.1 shows a scanning electron microscopy image of the bed materials
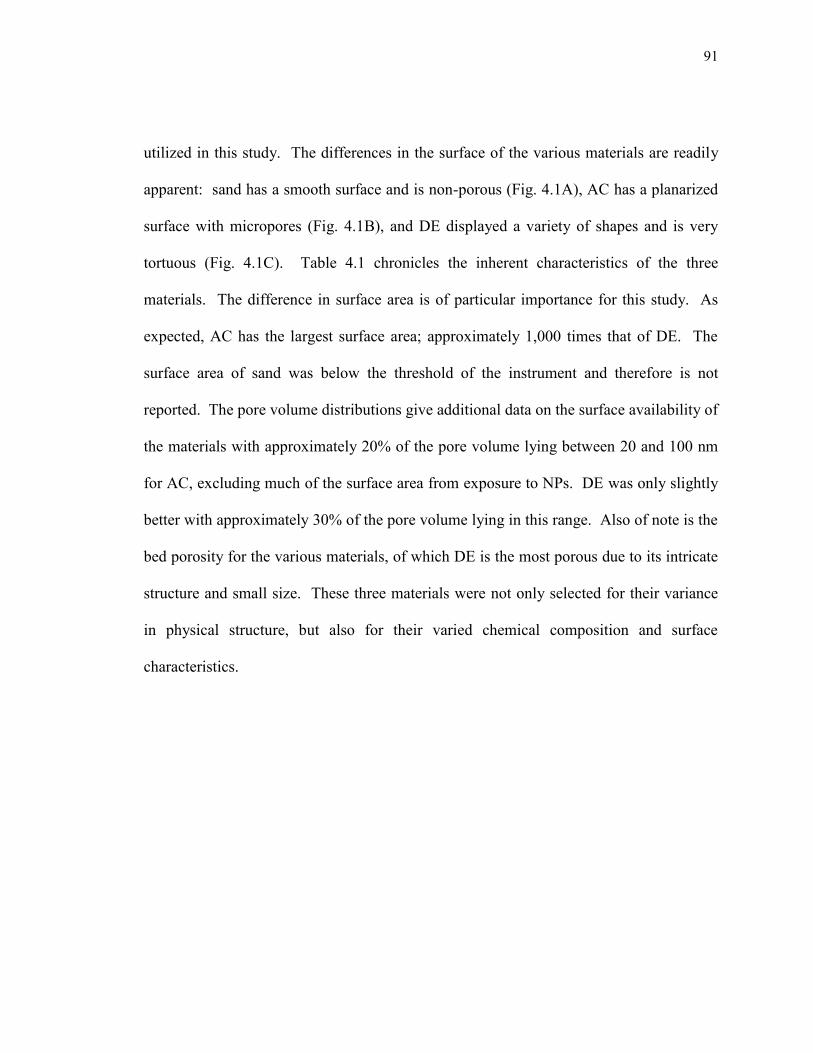
91
utilized in this study. The differences in the surface of the various materials are readily
apparent: sand has a smooth surface and is non-porous (Fig. 4.1A), AC has a planarized
surface with micropores (Fig. 4.1B), and DE displayed a variety of shapes and is very
tortuous (Fig. 4.1C). Table 4.1 chronicles the inherent characteristics of the three
materials. The difference in surface area is of particular importance for this study. As
expected, AC has the largest surface area; approximately 1,000 times that of DE. The
surface area of sand was below the threshold of the instrument and therefore is not
reported. The pore volume distributions give additional data on the surface availability of
the materials with approximately 20% of the pore volume lying between 20 and 100 nm
for AC, excluding much of the surface area from exposure to NPs. DE was only slightly
better with approximately 30% of the pore volume lying in this range. Also of note is the
bed porosity for the various materials, of which DE is the most porous due to its intricate
structure and small size. These three materials were not only selected for their variance
in physical structure, but also for their varied chemical composition and surface
characteristics.

92
Figure 4.1. Scanning electron microscopy images of sand (A), activated carbon (B),
and diatomaceous earth (C).

93
Table 4.1. Material characteristics for porous media used in column experiments.
Material
Average
Diameter
(µm)
pHIEP
Surface
Chargea
(C m-2
)
Surface
Area, BET
(m2 g
-1)
VPore
<20nm
(%)
VPore
<100nm
(%)
Column
Porosity
Sand 190 3.5 -21.7 <0.05 - - 0.214
Activated
Carbon 1000 8.5 +0.02 965±13 78.3 97.2 0.482
Diato-
maceous
Earth
100 8.7 +1.8 1.0±0.1 61.4 93.5 0.660
a Surface charge measured at pH 7.
The pHpzc of each material was determined from the surface charge curves given
in Figure 4.2. Here it is seen that the apparent surface charge of sand is negative across
circumneutral and high pH ranges, while DE follows a classic profile with an extended
range near neutral between pH 4 and 9, and AC is relatively neutral across the entire
tested range. The surface charge at pH 7 is of particular interest as that is the operating
pH of the column experiments. At that pH value, sand has a highly negative surface
charge (-21.7 C m-2
), while AC is essentially neutral (0.02 C m-2
), and DE is only slightly
positive (1.8 C m-2
).

94
4.3.1.2. Nanoparticle Properties
The size and zeta potential of the n-TiO2 greatly affects their transport in porous
media. NPs have been shown to readily aggregate in water [21, 28, 30] and the average
aggregate size of the NPs helps to determine the elution or retention proclivity by
determining the effective retention mechanisms [20, 22]. The zeta potential of the NPs
allows for determination of interactions between the NPs and porous media typically
governed by the conventional Derjaguin-Landau-Verwey-Overbeek (DLVO) theory of
colloidal stability [31-32]. This theory combines electrostatic interactions with attractive
van der Waals interactions to produce a unified force curve and has been extensively
applied to NP interaction with porous media [20, 33-34]. The particle size distribution of
n-TiO2 in aqueous solution at pH 7 is provided in the Figure 4.3. At the same pH, the
Figure 4.2. Surface charge density (σ) as a function of pH for sand ( ), activated
carbon ( ), and diatomaceous earth ( ).
-100
-80
-60
-40
-20
0
20
40
60
2 4 6 8 10 12
σ (
C m
-2)
pH

95
average particle size of n-TiO2 was 200 ± 2 nm, and the zeta potential -42 ± 4 mV. The
pH dependence of the zeta potential (Fig. 4.4) was measured and the pHpzc was
determined to be 4.1. Transmission electron microscopy imaging of the n-TiO2 displayed
crystalline and nearly spherical particles (Fig 4.5).
Figure 4.3. Particle size distribution of the nano-TiO2.
0
2
4
6
8
10
12
14
1 10 100 1000 10000
Inte
nsi
ty %
Diameter (nm)

96
Figure 4.4. Zeta potential of n-TiO2 as a function of pH.
-60-50-40-30-20-10
01020
2 7 12
Zet
a P
ote
nti
al
(mV
)
pH
Figure 4.5. Transmission electron microscopy image of the n-TiO2.
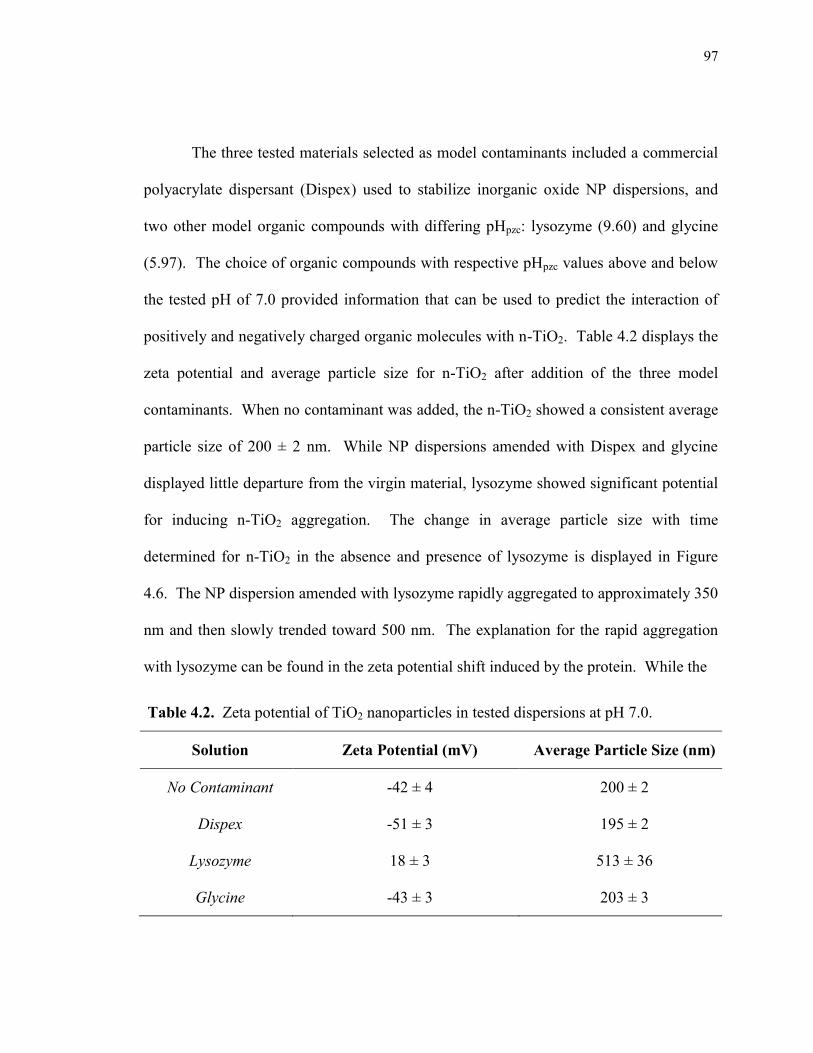
97
The three tested materials selected as model contaminants included a commercial
polyacrylate dispersant (Dispex) used to stabilize inorganic oxide NP dispersions, and
two other model organic compounds with differing pHpzc: lysozyme (9.60) and glycine
(5.97). The choice of organic compounds with respective pHpzc values above and below
the tested pH of 7.0 provided information that can be used to predict the interaction of
positively and negatively charged organic molecules with n-TiO2. Table 4.2 displays the
zeta potential and average particle size for n-TiO2 after addition of the three model
contaminants. When no contaminant was added, the n-TiO2 showed a consistent average
particle size of 200 ± 2 nm. While NP dispersions amended with Dispex and glycine
displayed little departure from the virgin material, lysozyme showed significant potential
for inducing n-TiO2 aggregation. The change in average particle size with time
determined for n-TiO2 in the absence and presence of lysozyme is displayed in Figure
4.6. The NP dispersion amended with lysozyme rapidly aggregated to approximately 350
nm and then slowly trended toward 500 nm. The explanation for the rapid aggregation
with lysozyme can be found in the zeta potential shift induced by the protein. While the
Table 4.2. Zeta potential of TiO2 nanoparticles in tested dispersions at pH 7.0.
Solution Zeta Potential (mV) Average Particle Size (nm)
No Contaminant -42 ± 4 200 ± 2
Dispex -51 ± 3 195 ± 2
Lysozyme 18 ± 3 513 ± 36
Glycine -43 ± 3 203 ± 3

98
zeta potential was -42 ± 4 mV for no contaminant, for lysozyme there was a positive shift
to 18 ± 3 mV due to its high pHpzc of 9.60 which produces a net positive charge over the
particle with absorbed lysozyme. It is generally held that NP suspensions with a zeta
potential less than 20 mV in magnitude will readily aggregate [35]. The instability
caused by the adsorption of lysozyme onto the surface of the NPs induces aggregation.
Dispex caused only a small reduction in the average size of TiO2, 195 ± 2 nm, which
corresponds to the further reduction in zeta potential, -51 ± 3 mV. Glycine addition only
caused a slight decrease in zeta potential (-43 ± 3 mV). This decrease corresponds with
the pHpzc of glycine, 5.97, which would be slightly negative at pH 7. Thus, the net charge
on the NP with absorbed glycine would be slightly reduced.
Figure 4.6. Average hydrodynamic diameter of n-TiO2 aggregates as a function of
time for the cases of no contaminant (●) and lysozyme (■). Standard deviations of
triplicate measurements are shown as error bars. Average sizes of n-TiO2 dispersions
containing Dispex and glycine did not differ notably from the no contaminant case.
0
200
400
600
0 50 100 150 200Av
era
ge
Pa
rtic
le D
iam
eter
(nm
)
Time (min)

99
4.3.2. Adsorption Isotherms
There are four major mechanisms for NP capture in porous media: sedimentation,
interception, straining, and diffusion or selective adsorption [36]. The first three are
physical interactions having to do with the structure and packing of the porous material,
while diffusion or selective adsorption is controlled by surface interactions. In order to
separate physical interactions from surface adsorption, batch isotherms were performed
with n-TiO2 and the three tested bed materials. Figure 4.7 shows these batch isotherms
for each of the three materials, plotting the surface concentration of n-TiO2 as a function
of equilibrium liquid concentration. The differences between the materials can clearly be
seen in the vertical scale of the graphs. For example, at an equilibrium concentration of
approximately 50 mg TiO2 L-1
, the n-TiO2 loadings determined for sand, AC and DE
were approximately 0.02, 0.7, and 10 mg TiO2 g-1
medium, respectively. DE displayed a
much greater affinity for the n-TiO2 under batch conditions which indicates a superior
retention capacity in dynamic column filtration as the inherent association between the n-
TiO2 and DE is supplemented by physical interactions or straining. The isotherm
equation fits also illuminate the superiority of DE in the capture of n-TiO2 (Fig. 4.7C).

100
B
Figure 4.7. Association isotherms for n-TiO2 onto three bed media: sand (A),
activated carbon (B), and diatomaceous earth (C). Error bars shown for duplicate
measurements. Additionally, Henry (─ ∙ ─), Freundlich (---), and Langmuir (─)
isotherm fits are provided.
0
0.01
0.02
0.03
0 20 40 60 80
Cs
(mg T
iO2 g
-1m
ed
ium
)
0
0.3
0.6
0.9
1.2
1.5
0 50 100 150 200 250
Cs
(mg T
iO2 g
-1m
ed
ium
)
0
10
20
30
0 50 100 150 200 250
Cs (m
g T
iO2 g
-1m
ed
ium
)
Ce (mg TiO2/L)
A
B
C

101
Table 4.3 provides the isotherm fit data for each material with three isotherm
types, i.e., Langmuir, Freundlich and Henry models as described in Section 4.2.3.
Adsorption onto sand and AC are both fit best by the Langmuir isotherm, with AC also
being fit equally well by the Freundlich curve. This fit provides for the conclusion that
an adsorption maximum is very near or has been met, limiting the usefulness of sand and
AC. DE, however, is fit best by a Henry isotherm. The near linear isotherm determined
for DE even at aqueous equilibrium concentrations as high as 235 mg TiO2 L-1
suggests a
very high maximum absorbance capacity, providing great promise for use of this granular
material in the capture of NPs. As all isotherms approach Henry’s isotherm at low
concentration, it is likely that absorption of n-TiO2 onto DE follows a Langmuir isotherm
similar to sand or AC, but the equilibrium concentrations evaluated did not reach the
maximum absorbed concentration. Considering the slightly positively charged DE
surface at pH 7, electrostatic interactions may be important in the retention of the highly
Table 4.3. Fit constants for batch isotherms of TiO2 nanoparticles on selected filtration
media.
Material
Henry Freundlich Langmuir
KHa
R2 Kf
b n R
2 a
c b
d R
2
Sand 0.001 -3.53 0.01 7.96 0.32 0.002 0.09 0.94
Activated
Carbon 0.006 0.44 0.12 2.26 0.99 0.05 0.03 0.98
Diatomaceous
Earth 0.098 0.88 0.04 0.82 0.83 0.16 0.003 0.84
a KH [L g
-1medium]
b Kf [mg
1-(1/n) L
(1/n) g
-1medium]
c a [L g
-1medium]
d b [L mg
-1]
A

102
negative n-TiO2. This surface charge may provide additional information into n-TiO2
capture. Since the DE was primarily SiO2 (89.0%), the surface charge would be expected
to be similar to that of sand. Instead, DE is slightly positive at pH 7, which may be due
to the Al2O3 and Fe2O3 impurities that have pHpzc of 8-9 and 6.5-6.8, respectively [19].
The influence of these impurities elucidates the importance of surface heterogeneity, as
this likely determines the abundance of active sites suitable for NP capture. DE has been
shown to be better equipped for n-TiO2 capture due to enhanced surface reactions and
adsorption, likely due to its heterogeneous composition.
4.3.3. Effect of Porous Media on Nano-TiO2 Transport
In order to compare the effectiveness of the three selected media to remove n-
TiO2 from aqueous streams, flow-through column experiments were performed and the
effluent concentration of n-TiO2 was monitored for 30 bed volumes after which the bed
was sampled for retained n-TiO2. Figure 4.8 compares the relative effluent NP
concentration with respect to time determined for n-TiO2 dispersions in flow-through
column experiments using sand, AC or DE. Plots of the NP concentrations associated
with the filtration medium as a function of relative bed depth are shown in Figure 4.9.
Sand was highly ineffective as an absorbent material, with breakthrough being reached in
less than two bed volumes (Fig. 4.8A). Sand had a very small surface area and very little
surface roughness, so physical interactions are unlikely to play a major role in retention
under these conditions. This curve does match well with DLVO predictions, with the
repulsive electrostatic interaction between the negatively charged n-TiO2 and the
negatively charged sand surface greatly outweighing the attractive van der Waals

103
Figure 4.8. Relative effluent n-TiO2 concentration as a function of the number of bed
volumes processed for sand (A), activated carbon (B) and diatomaceous earth (C).
Plots for dispersions with no contaminant (─) and for dispersions amended with
Dispex (---), lysozyme (─ ∙ ─), and glycine (∙∙∙). Dispersions at pH 7 were introduced
at 2.6 mL min-1
.
0.0
0.2
0.4
0.6
0.8
1.0
0 10 20 30
Rel
ati
ve
Eff
luen
t
Con
cen
trati
on
(C
/Co)
0.0
0.2
0.4
0.6
0.8
1.0
0 10 20 30
Rel
ati
ve
Eff
luen
t
Con
cen
trati
on
(C
/Co)
-0.2
0.0
0.2
0.4
0.6
0.8
1.0
0 10 20 30
Rel
ati
ve
Eff
luen
t
Con
cen
trati
on
(C
/Co)
Bed Volumes
A
B
C

104
Figure 4.9. TiO2 nanoparticle concentrations associated with porous media as a
function of bed depth for sand (A), activated carbon (B), and diatomaceous earth (C).
Four cases shown: no contaminant ( ), dispex ( ), lysozyme ( ) and
glycine ( ). All suspensions (pH 7) were introduced at 2.6 mL min-1
.
0.001
0.01
0.1
1
0 0.2 0.4 0.6 0.8 1
Ass
oci
ate
d N
P
Con
cen
trati
on
(m
g T
iO2 g
-1m
ed
ium
)
0.01
0.1
1
0 0.2 0.4 0.6 0.8 1
Ass
oci
ate
d N
P
Con
cen
trati
on
(mg T
iO2 g
-1m
ed
ium
)
0.01
0.1
1
10
100
0 0.2 0.4 0.6 0.8 1
Ass
oci
ate
d N
P
Con
cen
trati
on
(mg T
iO2 g
-1m
ed
ium
)
Relative Bed Depth
A
B
C

105
interactions. The captured NP concentration is extremely low; around 0.01 mg TiO2 g-
1sand for the entire bed length (Fig. 4.9A). Overall, the physical characteristics of sand do
not aid in the retention of the n-TiO2 and the repulsive electrostatic interactions dominate
resulting in essentially zero retention [16, 20-21].
The effluent concentration curve of n-TiO2 in an AC bed displayed a distinct
behavior with an initial steep rise to just over 60% effluence followed by a slow approach
to breakthrough (Fig. 4.8B). This is possibly attributable to the slow diffusion of the NPs
into the complex pore structure of the AC. Taking into regard the charge profile for AC
which displays essential neutrality around pH 7 (Fig. 4.2), it is unlikely that electrostatic
interactions play a significant role in NP retention on AC. Physical interactions are likely
to be the major cause of any NP capture by AC due to the large surface area and intricate
pore network. NP retention profiles in AC beds are mostly flat and lay in the range of
approximately 0.01 to 0.10 mg TiO2 g-1
AC (Fig. 4.9B). The flat profile supports the
theorem that diffusion plays a significant role as retention is very steady down the length
of the column. AC showed marked improvement in n-TiO2 retention in this novel
application, exemplified by a larger NP retention capacity. AC enhanced physical
interactions while eliminating the repulsive electrostatic hindrances; however, it still
lacked the ability to achieve full retention.
The effluent concentration profile of n-TiO2 for DE is in stark contrast to those
obtained for sand or AC beds (Fig. 4.8C). Here full retention was achieved over the entire
30 bed volumes tested. DE adsorption of n-TiO2 is also significantly higher, with
retention generally ranging between 0.1 and 1.0 mg TiO2 g-1
DE (Fig. 4.9C). The

106
exponential decay observed in the linear decrease across the bed length lends to the idea
that physical straining plays a significant role. DE provides a large surface area like AC,
but a pore size distribution more available to n-TiO2. Additionally, the highly porous bed
provides a tortuous path through the filtration media. The enhanced physical
contributions to retention provided by DE taken with its increased surface adsorption
displayed in the batch isotherms show the superiority of DE as an adsorbent material for
porous media filtration.
4.3.4. Effect of Solution Contaminants on Nano-TiO2 Transport
As no true filtration process runs solely under ideal conditions, investigation of
the role of solution chemistry on NP retention is necessary for all real-world applications
of porous media filtration. The model dispersant, Dispex, proved to be very effective in
reducing n-TiO2 retention during bed filtration. In Figure 3.8, the effluent concentration
of n-TiO2 in dispersions amended with Dispex may be compared to that of unamended n-
TiO2. No departure from the baseline lacking Dispex can be observed for the sand bed
(Fig. 4.8A) due to the overall poor retention of sand. The impact of Dispex on NP
retention can be more clearly observed in the AC bed, with immediate full breakthrough
for n-TiO2 dispersions amended with the dispersant (Fig. 4.8B). This may be due to
steric hindrances to pore diffusion caused by the adsorbed dispersant, or by resistance due
to the dispersant’s hydrophilicity as compared to the hydrophobic AC surface. Other
dispersants have been shown to decrease NP retention [33, 37] and studies have
concluded this to be due to steric hindrances due to the adsorbed species [21, 38]. Dispex
was even able to prevent retention in the highly effective DE bed enabling full

107
breakthrough in just under five bed volumes (Fig. 4.8C). Figure 4.9 displays the profiles
of n-TiO2 retained in the bed. This data supports the effluent concentration curves as the
dispersant-contaminated n-TiO2 is consistently the least retained in all bed materials.
The organic molecules provided interesting influences on n-TiO2 capture in the
various beds. Addition of glycine did not lead to significant departure from the baseline
case without contaminants in size or zeta potential, nor did it change the retention
behavior in sand or AC beds. In the DE bed, however, glycine supplementation
increased the mobility of n-TiO2 and lead to NP breakthrough around 10 bed volumes. In
contrast, lysozyme greatly influenced n-TiO2 retention in all beds. Results for lysozyme
addition to the NP dispersion with sand as the filtration medium provide an excellent
model case for filter ripening (Fig. 4.8A). Here, as the lysozyme-coated NPs associate
with the sand surface, the NPs themselves, destabilized by the addition of lysozyme onto
their surface, become more efficient collectors than the bare sand surface, providing the
characteristic “hump” in the breakthrough curve. While destabilization due to lysozyme
addition did add to NP retention, a significant fraction of the n-TiO2 eluted from the
column. The retained n-TiO2 bed profile for lysozyme contamination on the sand bed
displayed a linear decrease over the bed length (Fig. 4.9A), which exposes an exponential
decay characteristic of strong interactions between adsorbent and adsorbate. This could
be either due to capture approaching capacity before moving down the column in the
classical “front” or due to physical straining occurring near the inlet of the column. Due
to the highly aggregated state of the lysozyme coated n-TiO2 (> 500 nm); physical
straining is the more likely cause. Lysozyme addition aided in NP capture in the AC bed

108
(Fig. 4.8B) due likely to NP destabilization and physical straining. Lysozyme,
interestingly, did not aid in NP retention with DE (Fig. 4.8C). Instead, there is gradual
progress toward breakthrough possibly due to steric hindrances of the aggregated n-TiO2
coated with a large organic molecule. This steric hindrance and subsequent increased
mobility due to absorbed organic material has been shown for addition of humic acid [34,
39]. An exponential decay is again observed in the retained n-TiO2 bed profile for
lysozyme on DE, providing further support for the hypothesis that physical straining is
likely the dominant mechanism (Fig. 4.9C). The combined results of the contaminants
and the variability in their effects displays the importance of a comprehensive
investigation of any targeted waste stream to determine the competing roles the varying
contaminants contained will play.
4.3.5. Environmental and Industrial Implications
The results of n-TiO2 transport in porous media display the variation in mobility
of NPs in different media. This variation will have a major impact on natural soil
systems exposed to NP-contaminated groundwater. A more thorough understanding of
capture mechanisms, delineating the role of physical capture from surface adsorption,
enables the prediction of the transport behavior in common sediments and soils. The
stabilization and elution differences due to solution chemistry also display the sensitivity
of NP transport in regard to absorbed species. It is unlikely that released NPs will have
bare surfaces and results indicate a significant disparity in behavior of n-TiO2 dispersions
amended with two common contaminants: a dispersant and lysozyme. Thus, the history
of the released NP is a large factor in determining its environmental fate.

109
A recent study has predicted that almost 3,000 tons of n-TiO2 are released yearly
from production, manufacturing and consumption in the United States alone [11]. This,
combined with the desire of the EPA to regulate NP release [40], bolsters the importance
of addressing NP release in industry. The development of simple, inexpensive, easily
implemented techniques for NP removal from aqueous waste streams is necessary. This
study furthers the investigation into suitable materials for porous media filtration,
demonstrating the superiority of DE for NP retention. Continued evaluation and design
of this treatment scheme will provide for future system implementation.

110
4.4. Conclusions
In conclusion, this study confirmed that both solution chemistry and the choice of
filtration media have a strong impact on the transport and retention of TiO2 NPs during
porous media filtration. DE displayed great promise in the capture of n-TiO2, providing
full NP retention of a dispersion containing 50 mg TiO2 L-1
for over 30 bed volumes.
The potential of DE as a granular media for the removal of NPs was also confirmed by
batch isotherm results which confirmed the high NP loading capacity of DE (> 25 mg
TiO2 g-1
DE) in comparison to that of the classic adsorbent sand (0.025 mg TiO2 g-1
sand).
The presence of organic and synthetic contaminants drastically altered the retention of n-
TiO2 in porous media filtration. Continued investigation of common contaminants as
well as competing effects is necessary to propel the introduction of porous media
filtration as a NP-targeted treatment technique. This study has demonstrated the
applicability of DE as a promising new material for the removal of NPs as well as the
inferiority of conventional filtration materials such as sand and AC. The optimization of
DE could potentially provide a superior material for the implementation of porous media
filtration in the treatment of NPs in aqueous waste streams.

111
CHAPTER V
MODELING NANOPARTICLE TRANSPORT AND RETENTION IN
POROUS MEDIA
Abstract
With the continued rise in the use of nanoparticles in manufacturing, concerns
arise over the associated environmental exposure due to the lack of targeted treatment
techniques. Many of the released nanoparticles exist in aqueous waste streams, thus
modification of a conventional particulate matter removal technique, porous media
filtration, may provide a simple, easily implemented nanoparticle specific treatment
system. Necessary for the design of such a system is a comprehensive kinetic model of
nanoparticle retention for various media types. Herein, an amalgam of physisorption and
chemisorption deposition including the influence of physical straining is applied to the
filtration of titanium dioxide nanoparticles through three porous media: sand, activated
carbon, and diatomaceous earth. Diatomaceous earth proved to be the superior material,
as evaluation of the best fit (R2 ≥ 0.97) model parameters show that it displays both
increased physisorption and straining. Application of this model provides vital
information on the dominant interaction mechanisms which enable future enhancement of
the technique for nanoparticle abatement.
112
5.1. Introduction
The use of nanoparticles (NPs) in manufacturing initiatives continues to increase
[97], thus raising concerns over the environmental, safety, and health effects of these
materials. It has been shown that a large amount of these NPs exit to the environment
through wastewater streams [68, 121]. Understanding the transport and retention
mechanisms of NPs in porous media provides a two-fold benefit. First, it provides
information on how NPs released to the environment would interact with soils. Second,
it provides a basis upon which a targeted treatment technique could be established for the
specific retention of NPs in aqueous waste streams. A fundamental element of the latter
benefit is the development of a process model to elucidate dominant mechanisms and
enable process design.
Modeling of NP transport in porous media is a developing field. The basic
filtration model developed by Yao, et al. [78] has been the basis of this work.
Improvements in the form of accounting for effects of neighboring media and van der
Waals forces as well as including Happel’s sphere-in-cell approach [122] were
introduced by Rajagopalan and Tien [123]. Tufenkji and Elimelech further added to the
field by incorporating the effect of hydrodynamic retardation on the diffusion coefficient
using a purely numerical solution [87]. While these formulations are effective at
predicting attachment to porous media under favorable conditions, each is limited by its
inability to predict deposition under repulsive (unfavorable) conditions.
In order to account for removal under these conditions, removal due to wedging
or straining, Bradford developed a model utilizing a clean-bed filtration model [124] as

113
well as a first-order, depth dependent straining factor [125]. This formulation provided
improved fit of the bed profiles of the retained colloids. These utilize a constant first-
order attachment rate coefficient to describe NP retention. While these models
adequately describe attachment to clean, homogeneous porous media, a process model
must provide information for more complex porous media selections as well as
interactions as bed saturation is approached.
This work details a conceptual model which incorporates porous media site
heterogeneity and kinetic differences in transport processes. This formulation is then
applied to breakthrough curves of TiO2 NPs (n-TiO2) in three vastly different porous
media: sand, activated carbon, and diatomaceous earth.
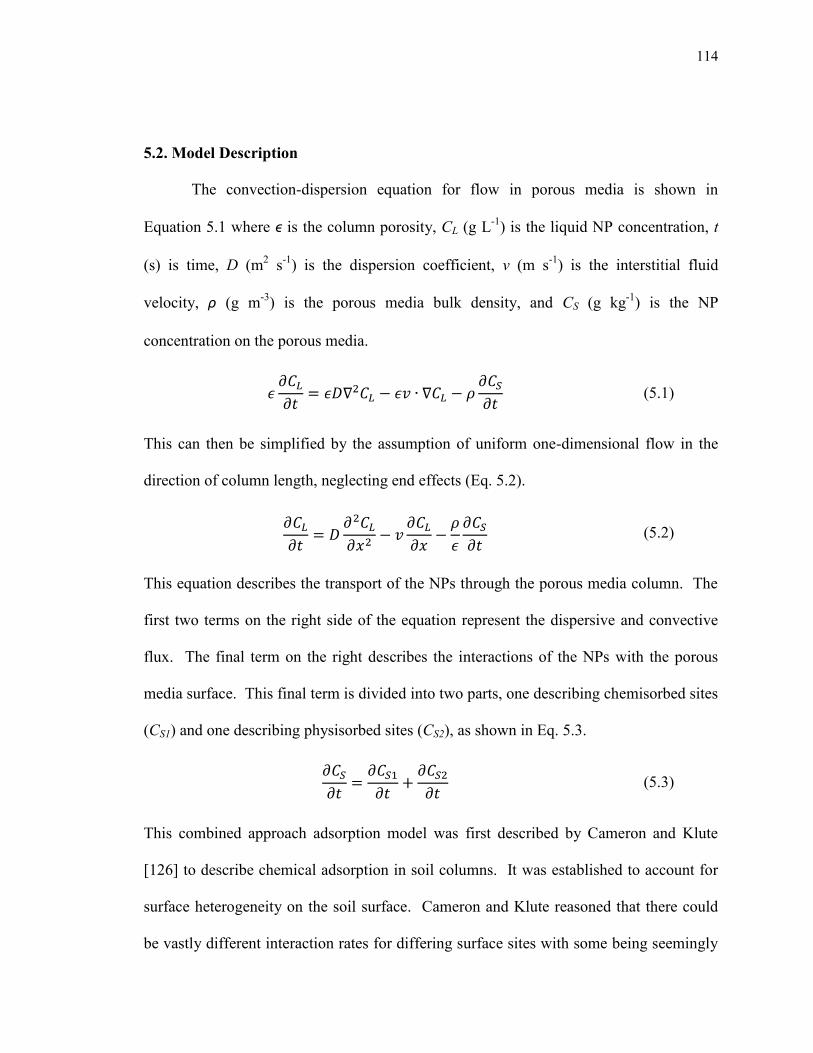
114
5.2. Model Description
The convection-dispersion equation for flow in porous media is shown in
Equation 5.1 where ϵ is the column porosity, CL (g L-1
) is the liquid NP concentration, t
(s) is time, D (m2 s
-1) is the dispersion coefficient, v (m s
-1) is the interstitial fluid
velocity, ρ (g m-3
) is the porous media bulk density, and CS (g kg-1
) is the NP
concentration on the porous media.
This can then be simplified by the assumption of uniform one-dimensional flow in the
direction of column length, neglecting end effects (Eq. 5.2).
This equation describes the transport of the NPs through the porous media column. The
first two terms on the right side of the equation represent the dispersive and convective
flux. The final term on the right describes the interactions of the NPs with the porous
media surface. This final term is divided into two parts, one describing chemisorbed sites
(CS1) and one describing physisorbed sites (CS2), as shown in Eq. 5.3.
This combined approach adsorption model was first described by Cameron and Klute
[126] to describe chemical adsorption in soil columns. It was established to account for
surface heterogeneity on the soil surface. Cameron and Klute reasoned that there could
be vastly different interaction rates for differing surface sites with some being seemingly
(1)
(5.3)
(1)
(5.2)
(1)
(5.1)

115
instantaneous (physisorbed) and some reacting much slower (chemisorbed). The
interactions of the latter type also may include any physisorption interactions inhibited by
slow diffusion into pore structures. A linear Freundlich equilibrium model was utilized
(Eq. 5.4) where k4 is an equilibrium constant, however any equilibrium model may be
substituted.
The kinetic portion of the surface interactions is defined in Equation 5.5. It is divided
into three parts.
The first defining is a first order approximation of the combined non-equilibrium surface
reactions and diffusion inhibited physisorption reactions (k1, s-1
), and the third governs
desorption (k3, s-1
), which make up a first order reversible kinetic model. The second
term describing NP retention due to straining was described by Bradford [125] where k2
(s-1
) is a first order straining coefficient (Eq. 5.6) and Ψ2 is a dimensionless straining
function (Eq. 5.7) [81].
In these equations dC (m) is the average NP diameter and d50 (m) is the average porous
media grain diameter. The term β is a fitting parameter determined to be 0.432. Taking
the derivative of (5.4) with respect to time and inserting it, along with (5.5), into (5.3)
produces the combined surface interactions (Eqn. 5.8).
(
)
(1)
(5.7)
( )
(1)
(5.6)
(1)
(5.5)
(1)
(5.4)

116
Combining (5.8) with (5.2) and simplifying:
These two equations, (5.12) and (5.5), form a system of equations describing NP
transport in the porous media with the following boundary conditions:
Here CL0 (g m-3
) is the inlet NP concentration and L (m) is the length of the column.
In order to facilitate numerical solving of the above set of equations, COMSOL
Multiphysics 4.3 was utilized. COMSOL Multiphysics is simulation software which uses
finite element analysis discretized by backward differentiation to solve the coupled
partial differential equations. The selection of a 2D model with axial symmetry provided
the basis to build a representation of the porous media column. Two interfaces were
selected to model the system: the Transport of Diluted Species interface provided the
(5.16)
(5.15)
(5.14)
(5.13)
( )
(1)
(5.12)
( )
[
]
(1)
(5.11)
[
]
(1)
(5.10)
[
]
(1)
(5.9)
(1)
(5.8)

117
convective-dispersive equation (5.12) and the General Form PDE interface was edited for
the surface concentration (5.5). The constants used to model the various systems are
described in Table 1. For all systems the average NP diameter (dc) was set at 2.0 x 10⁻⁷
m. The effect of straining was determined by (5.6) and (5.7). The model was fit to the
effluent curve and bed concentration data by manipulating four variables: D, k1, k3, and
k4.
Table 5.1. Physical parameters of the porous media columns
Sand Activated Carbon Diatomaceous
Earth
ϵ 0.21 0.48 0.66
ρ (kg m-3) 1922 480 2300
d50 (m) 1.9 x 10⁻⁴
1.0 x 10⁻³
1.0 x 10⁻⁴
v (m s-1
) 1.15 x 10⁻³
5.09 x 10⁻⁴
3.72 x 10⁻⁴
In order to simplify the equations, they can be made dimensionless by substituting
the following variables:
(5.24)
(5.23)
(5.22)
(5.21)
(5.20)
(5.19)
(5.18)
(5.17)

118
Substituting equations (5.17-26) into equations (5.12), (5.5), and (5.13-16) results in the
following:
(5.32)
(5.31)
(5.30)
(5.29)
(1)
(5.28)
( )
(5.27)
(5.26)
(5.25)
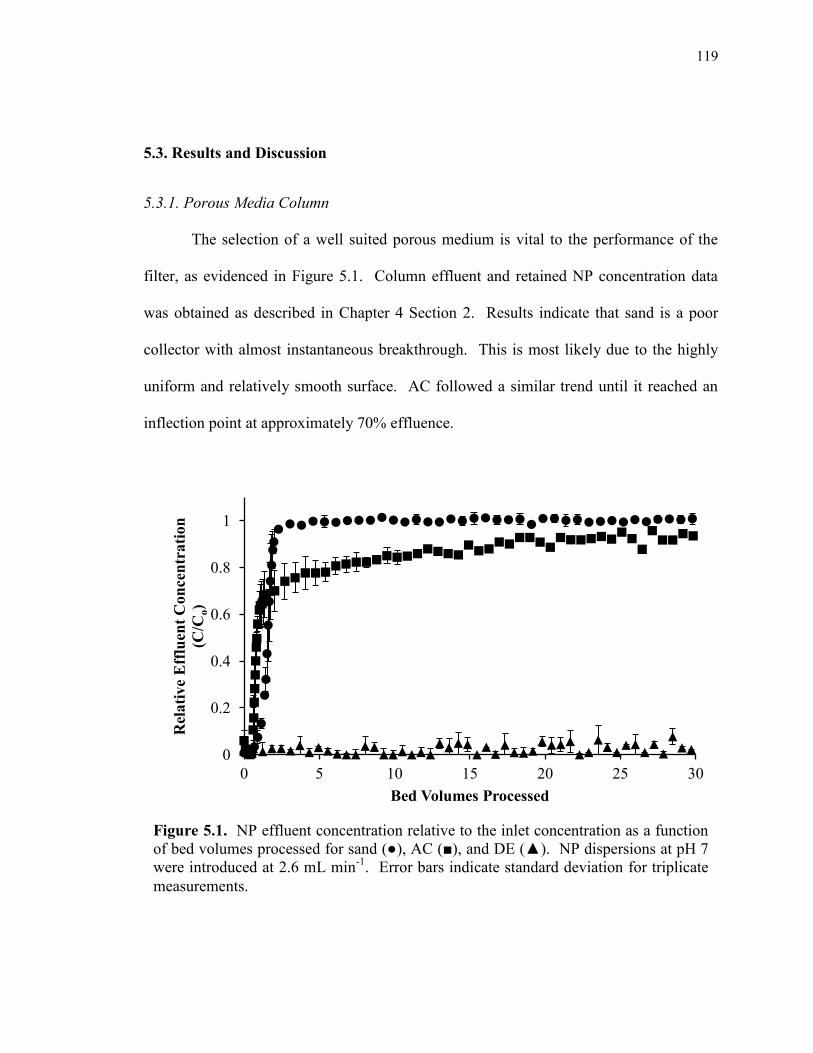
119
5.3. Results and Discussion
5.3.1. Porous Media Column
The selection of a well suited porous medium is vital to the performance of the
filter, as evidenced in Figure 5.1. Column effluent and retained NP concentration data
was obtained as described in Chapter 4 Section 2. Results indicate that sand is a poor
collector with almost instantaneous breakthrough. This is most likely due to the highly
uniform and relatively smooth surface. AC followed a similar trend until it reached an
inflection point at approximately 70% effluence.
Figure 5.1. NP effluent concentration relative to the inlet concentration as a function
of bed volumes processed for sand (●), AC (■), and DE (▲). NP dispersions at pH 7
were introduced at 2.6 mL min-1
. Error bars indicate standard deviation for triplicate
measurements.
0
0.2
0.4
0.6
0.8
1
0 5 10 15 20 25 30
Rel
ati
ve
Eff
luen
t C
on
cen
trati
on
(C/C
o)
Bed Volumes Processed

120
After this inflection, there was a slow, steady climb toward full breakthrough
likely due to the delayed transport of the NPs into the complex pore structure. DE
presented full retention of the NPs over the entire 30 bed volumes tested. This is
hypothesized to be due to the heterogeneous nature of the DE surface, allowing for site-
specific preferential adsorption.
Evaluation of the retained NP bed profiles (Fig. 5.2) shows that adsorption is
uniform across the column length for both sand and AC. The superior retention of AC
over sand is, again, likely due to the complexity of the AC pore network providing
increased number of entrapment sites. DE displayed different retention with an
exponential decay from the inlet of the column. This curvature suggests that straining is
a significant factor in NP retention in DE. This is to be expected as it has the smallest
porous media grain diameter and the highest porosity which provides for a highly
tortuous flow path. Modeling of these curves further elucidates the retention mechanisms
of each media type.

121
5.3.2 Modeling Results
Application of the previously described model to the data obtained from the three
porous media selected provided the results outlined in Table 5.2. The effect of straining
was calculated utilizing equations (6-7) for DE systems as it was the only where dc/d50
was above 0.0017, which is a critical ratio determined by Bradford [80]; for sand and AC
k2 was set to zero.
Figure 5.2. Retained NP concentration as a function of relative bed length for sand
( ), AC ( ), and DE ( ). Error bars indicate standard deviation for
triplicate measurements.
1
10
100
1000
10000
100000
0 0.25 0.5 0.75 1
Ret
ain
ed N
P C
on
cen
trati
on
(m
g/k
g)
Relative Bed Distance

122
Table 5.2. Model constants for best fit approximation of NP transport in varying porous
media.
Sand AC DE
Pe 421 38 5580
K1 0.01 0.35 8.06
K3 0.005 0.074 0.323
K4 0.7 0.0 300
Porous media columns packed with sand provided the least retention at less than
2%. Results from the best fit model for this system are provided in Figure 5.3. The
model provides a highly accurate fit of the effluent NP concentration curve (R2 = 0.990)
but underestimates the retained NP concentration (R2 = -7.805). The best fit constants
help explain the poor retention observed. Adsorption is controlled mainly by
physisorption as K4 is more than an order of magnitude greater than K1, which represents
chemisorption and diffustion-limited physisorption processes. Desorption is only slightly
influential with K3 being about half the value of K1. The model is able to accurately
predict adsorption along the full length of the column with straining not being a
significant retention mechanism. Due to these results, sand, with some affinity for n-
TiO2, could be useful as a prefilter but would be expected to be ineffective as a primary
filtration material.
Modeling results for AC as the porous media are shown in Figure 5.4. AC
columns retained a greater fraction of NPs from the inlet stream than sand as shown by
the 4 – 5 fold increase in the relative retained NP concentration, S. This increase,

123
however, was not due to an increase in preferential adsorption as the physisorbtion
interactions, represented by K4, were decreased to zero. The increased adsorption was
due to an increase in non-equilibrium deposition, K1. This fits with the theory that the NP
retention in AC columns was due to diffusion into the porous structure and not due to
site-specific adsorption as posited previously. The slow transport into the pore network
would be encompassed in K1. While desorption, K3, is greater than in the case of sand, it
remains an order of magnitude less than the forward adsorption process, K1. The model
is able to accurately describe (R2 = 0.977) the non-equilibrium process which produces a
slow approach to full breakthrough. Again, the retained NP (S) profile is relatively flat
showing no significant straining, and the model is able to reflect this (R2 = 0.965). AC
was more successful at retaining the n-TiO2 than sand, however the dominance of a non-
equilibrium retention mechanism (large K1) paired with no specific surface affinity (K4 =
0) presents little promise for application in a targeted NP treatment filter.
In order to model the DE curve, identical experiments were run at longer times in
order to find the breakthrough point. Figure 5.5 shows the model fit of the breakthrough
curve for DE. Figure 5.5 also shows the retained NP bed profile at 30 bed volumes
processed as well as the model fit. The model provided an excellent fit for both the
effluent NP curuve (R2 = 0.971) and retained bed profile (R
2 = 0.997) well. It can be seen
in the comparison of the interaction constants that the interaction of the n-TiO2 with DE
is dominated by physisorption with K4 having a value almost four orders of magnitude
greater than that of sand. There is also larger adsorptive and desorptive constants (K1 and
K3) suggesting that there may be pore space that can retain NPs however that pore space

124
does not adequately prevent desorption as was the case in AC. Examination of the
retained bed profile shows that straining is also dominant at the entrance to the column
early in the process. Comparing this with the model prediction for the full breakthrough
time in Figure 5.6 shows that physisorption equilibrium dominates in all other areas of
the column.
In conclusion, DE shows great promise for application as a porous media
designed for NP retention. The large physisorption, presumably due to site-specific
adsorption of the n-TiO2, should be further evaluated to exploit the interaction and
increase the number of active sites on the DE surface. The large straining component
may be a concern as it may lead to significant pressure drops as the streamlines become
clogged with NPs. This may be alleviated by the aforementioned use of sand as a
prefilter to aid in the removal of any aggregated NPs, lessening their exposure to the
more tortuous DE.
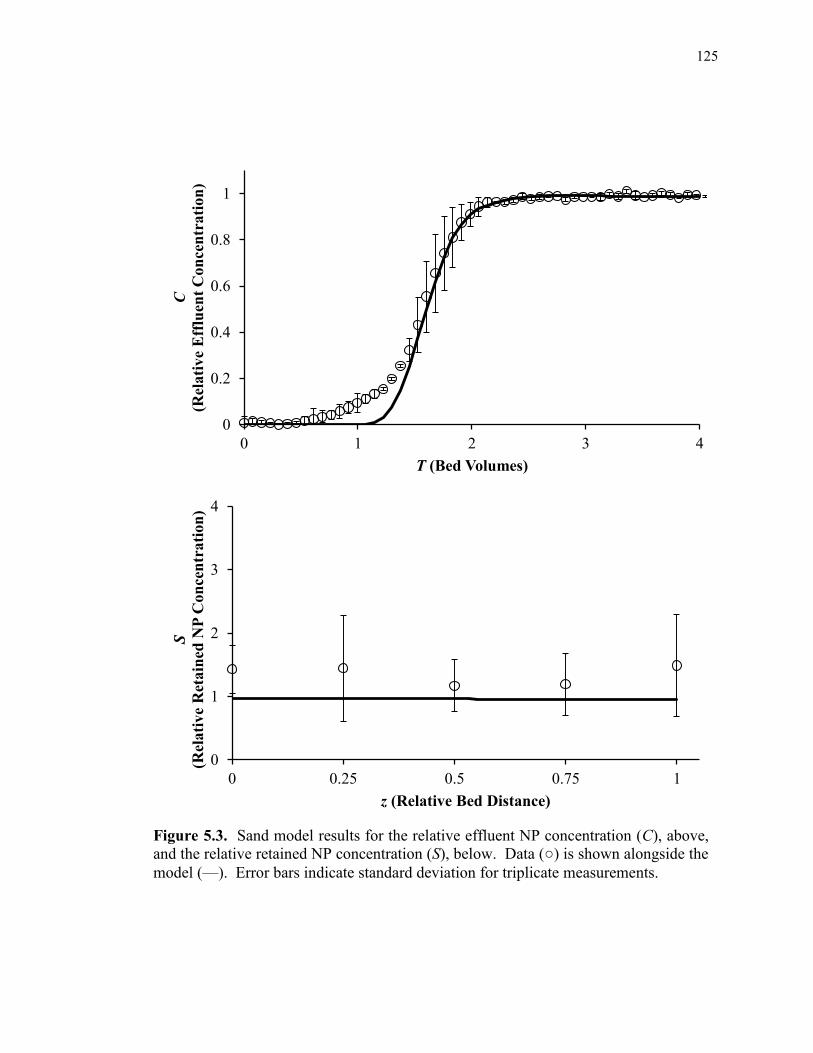
125
Figure 5.3. Sand model results for the relative effluent NP concentration (C), above,
and the relative retained NP concentration (S), below. Data (○) is shown alongside the
model (—). Error bars indicate standard deviation for triplicate measurements.
0
0.2
0.4
0.6
0.8
1
0 1 2 3 4
C
(Rel
ati
ve
Eff
luen
t C
on
cen
trati
on
)
T (Bed Volumes)
0
1
2
3
4
0 0.25 0.5 0.75 1
S
(Rel
ati
ve
Ret
ain
ed N
P C
on
cen
trati
on
)
z (Relative Bed Distance)

126
Figure 5.4. AC model results for the relative effluent NP concentration (C), above,
and the relative retained NP concentration (S), below. Data (□) is shown alongside the
model (—). Error bars indicate standard deviation for triplicate measurements.
0
0.2
0.4
0.6
0.8
1
0 2 4 6 8 10
C
(Rel
ati
ve
Eff
luen
t C
on
cen
trati
on
)
T (Bed Volumes)
0
2
4
6
8
10
0 0.25 0.5 0.75 1
S
(Rel
ati
ve
Ret
ain
ed N
P C
on
cen
trati
on
)
z (Relative Bed Distance)

127
Figure 5.5. DE model results for the relative effluent NP concentration (C), above,
and the relative retained NP concentration (S) at 30 bed volumes processed, below.
Data (∆) is shown alongside the model (—). Error bars indicate standard deviation for
triplicate measurements.
0
0.2
0.4
0.6
0.8
1
0 100 200 300 400 500
C
(Rel
ati
ve
Eff
luen
t C
on
cen
trati
on
)
T (Bed Volumes)
0
400
800
1200
1600
0 0.25 0.5 0.75 1
S
(Rel
ati
ve
Ret
ain
ed N
P C
on
cen
trati
on
)
z (Relative Bed Distance)

128
Figure 5.6. DE model results (—) for the relative retained NP concentration (S) after
485 bed volumes processed.
0
400
800
1200
1600
2000
2400
0 0.25 0.5 0.75 1
S
(Rel
ati
ve
Ret
ain
ed N
P C
on
cen
trati
on
)
z (Relative Bed Distance)

129
5.4. Conclusions
The model developed in this study provided an accurate formulation for
describing NP retention in porous media. The flexibility of the method is shown in its
applicability to three vastly different materials: sand, AC, and DE. Separation of
physisorption interactions and physical straining from the typical first order adsorption-
desorption model provides a basis for more accurate fitting of both the effluent
breakthrough curves and the retained NP bed profiles. Coefficients of determination (R2)
for all curves were greater than 0.96 with the exception of the sand bed profile.
Investigation into the best fit parameters displayed the superiority of DE for targeted NP
retention in porous media as it provided the greatest physisorbed interactions and
enhanced straining due to its small size and high porosity. Further refinement of this
model will provide an accurate foundation for future system design.

130
CHAPTER VI
ACTIVATED SLUDGE TREATMENT OF NANOPARTICLES
6.1. Introduction
The commercial production of nanoparticles (NPs), defined as particles with at
least one dimension in the range of 1 to 100 nm, is rising [97], with an expected market
value for nano-products in 2011 to 2015 of around $1 trillion yearly [20]. Facilitating
this growth is the diversity of use in a variety of fields, from textiles to semiconductor
manufacturing [10]. While nanomaterials offer many positive contributions [21],
concerns arise over their increasing application due to the potential negative effects of
NPs on human and environmental health [22]. In fact, many nanomaterials have been
labeled as possible emerging contaminants by the Organization for Economic
Cooperation and Development (OECD), for example, cerium oxide (CeO2), aluminum
oxide (Al2O3), and silicon oxide (SiO2), among others. Due to these developments,
understanding the potential impact of these materials on environmental and human health
is of utmost importance.
Nanoparticles (NPs) may be introduced to the environment in many ways
including purposefully, such as the use of zero-valent iron NPs in remediation [102], or
through waste streams, both industrial [127] and municipal [16]. Many NPs used
industrially proceed to municipal water treatment [68]. Additionally, studies have shown
that significant amounts of TiO2 [128] as well as CeO2 NPs [46] remain in effluents of
conventional wastewater treatment plants (WWTPs) and that the removed fraction is

131
concentrated in the settled solids which are typically applied agriculturally, disposed of in
landfills, or incinerated [129]. Therefore, WWTPs are a potentially large point source of
NPs. Determining the fate of NPs in common wastewater treatment operations will help
direct further research into the impact of these novel materials.
Activated sludge, the most commonly applied process in secondary wastewater
treatment, involves a bioreactor filled with bacterial biosolids or “sludge”, with a main
function of degrading organic matter. NPs can interact with biosolids both physically and
chemically. In general, NPs diffuse to surfaces more readily than their larger
counterparts due to their small size [72]. Secondly, microorganisms commonly found in
WWTPs have a net negative surface charge which leads to electrostatic interactions
contributing to the removal of NPs [35, 73]. Inorganic oxides have varying surface
charges in solution at circum-neutral pH and thus will show varying degrees of attraction
to the biological surface. It has been shown, for example with CeO2 NPs, that the
electrostatic interactions play a main role in their adhesion to E. coli [35]. Additionally,
the influence of background constituents may greatly affect the association of NPs with
biosolids, shown by the effect of the order of addition of polyelectrolytes and bacteria on
NP partitioning [74-75]. Finally, NPs may undergo physical entrapment during the
settling phase of treatment and thus the settling process step is important in the evaluation
of NP removal. Understanding the interactions of NPs with biosolids will significantly
add to the work regarding the fate of NPs in waste streams.
This work will study the interactions of three inorganic oxide nanoparticles,
CeO2, Al2O3, and SiO2, with sewage biosolids. The goal is to elucidate the significance

132
of biosorption as a mechanism contributing to the removal of NPs during activated sludge
treatment.

133
6.2. Materials and Methods
CeO2 (50 nm, 99.95% purity), Al2O3 (< 50 nm, 99%), and SiO2 (10-20 nm,
99.5%) NPs were obtained from Sigma-Aldrich (St. Louis, MO). Stock dispersions (2 g
NP/L) were prepared in deionized water. For alumina and ceria, the pH was titrated to
4.5 with 2 mM HCl to enhance dispersion stability. All dispersions were sonicated using
an ultrasonic processor (DEX® 130, 130 Watts, 20 kHz) at 65% amplitude for 5 min, and
then allowed to settle for 4 d. Next, the supernatant was transferred into 50-mL vials for
future use. Dispersions were stored at 4°C and sonicated for 5 min before use.
Sorption isotherm experiments were conducted in duplicate using glass flasks
(166 mL) supplemented with return activated sludge and a known volume of 2 mM
phosphate buffer (pH 7.5) spiked with the target nanomaterial. The solution volume was
50 mL and the final NP concentrations ranged from 0.5-200 mg L-1
. The concentration of
sludge was 0.50, 0.33, and 0.19 g-volatile suspended solids (VSS) L-1
for the CeO2,
Al2O3 and SiO2 isotherms, respectively. Controls lacking either NP or sludge addition
were run in parallel in order to correct for the background levels of Si, Ce or Al in the
sludge and for potential NP losses not mediated by interactions with the sludge. All flasks
were sealed and stirred at 22±1°C in an orbital shaker (150 rpm) for 24 h. Kinetic
measurements demonstrated that 24 h was sufficient to attain equilibrium. Subsequently,
they were allowed to settle for 1 hour. Samples of the supernatant were taken for
analysis and associated concentrations were determined by mass balance. Sludge was
obtained from a local municipal WWTP. The sludge was rinsed in order to minimize
interference by background contaminants.
134
Particle size distribution measurements were determined by dynamic light
scattering using a Zetasizer Nano ZS (Malvern Inc., Sirouthborough, MA). Samples for
analysis of CeO2, SiO2 and Al2O3 were digested by microwave assisted extraction
(MDS2100, CEM Corp., Matthews, NC). CeO2 samples (1 mL) were mixed with 8 mL
of nitric acid (70%) and 2 mL of H2O2(30%) and digested at 70 psi for 30 min. SiO2 or
Al2O3 digestion utilized 10 mL HF (10%) or 10 mL HCl (6.75 M), respectively, at 70 psi
for 45 min. Concentrations were then determined by inductively coupled plasma optical
emission spectroscopy using an 2100DV Optima instrument (Perkin Elmer, Shelton, CT).
All other chemical analysis, including pH and VSS, were conducted according to
standardized methods [130].
NPs were examined by transmission electron microscopy (TEM) to gain
information on particle morphology and size. TEM images were acquired on a Hitachi
H8100 (Hitachi High Technologies, Schaumburg, IL). Biosolids exposed to NPs were
imaged by TEM and scanning electron microscopy-electron dispersion spectroscopy
(SEM-EDS). Samples of the biosolids and NP suspensions were filtered through 0.2 µm
polycarbonate filter (Whatman, Kent, UK) and fixed prior to SEM-EDS analysis as
previously reported [76]. SEM imaging was done on a Hitachi S-4800 field-emission
SEM at 5 keV. Sample preparation for TEM imaging was accomplished by fixing,
following the procedure above for SEM, and then embedding prior to imaging.
135
6.3. Results and Discussion
TEM images of the Al2O3, CeO2, and SiO2 NPs utilized in this study are shown in
Figure 6.1. Al2O3 NPs exhibited a rod-like structure and CeO2 displayed sharper edges,
primarily triangular or rectangular in shape, while the SiO2 was more spherical, slightly
amorphous, and almost cloudlike. All images support the particle sizes reported by the
manufacturer. The average particle size of Al2O3, CeO2 and SiO2 was 175, 132 and 368
nm, respectively. These values are 3-30 times higher compared to the primary particle
size values determined by TEM imaging of the NPs in dry form. This disharmony shows
the rapid tendency of these particles to agglomerate in aqueous solution, even in
conditions favorable for stability (Zhang et al., 2008).
The interaction behavior of Al2O3, CeO2, and SiO2 with the sludge varied widely as
shown in Figure 6.2. These isotherm plots compare the concentration of the NPs
associated with the biosolids (Cs) with the concentration of NPs free in solution (Ce) at
equilibrium. Al2O3 was the only nanomaterial tested that displayed any settling apart
from interaction with the biosolids. On average, approximately 29% of the Al2O3 NPs
settled out of dispersion. Other than this, the behavior of the Al2O3 and CeO2 NPs was
relatively similar, both showing a strong tendency to associate with the sludge. CeO2 had
the highest affinity for the biosolids, as evidenced by the large amount of this
nanomaterial associated with the biosolids at similar solution concentrations and the
steepness of the curve. SiO2 NPs, on the other hand, showed a very low affinity for the
biosolids. On average, SiO2 NP association was 5-10 times less than that of Al2O3 or
CeO2 at similar equilibrium concentrations in dispersion. As an example, at the

136
maximum Ce values tested (75 to 92 mg L-1
, depending on the NP), the concentration of
Al2O3, CeO2 and SiO2 in the sludge (Cs) was 137, 238, and 28 mg g-1
VSS.
Figure 6.1. TEM images of Al2O3 (A), CeO2 (B), and SiO2 (C) nanoparticles.
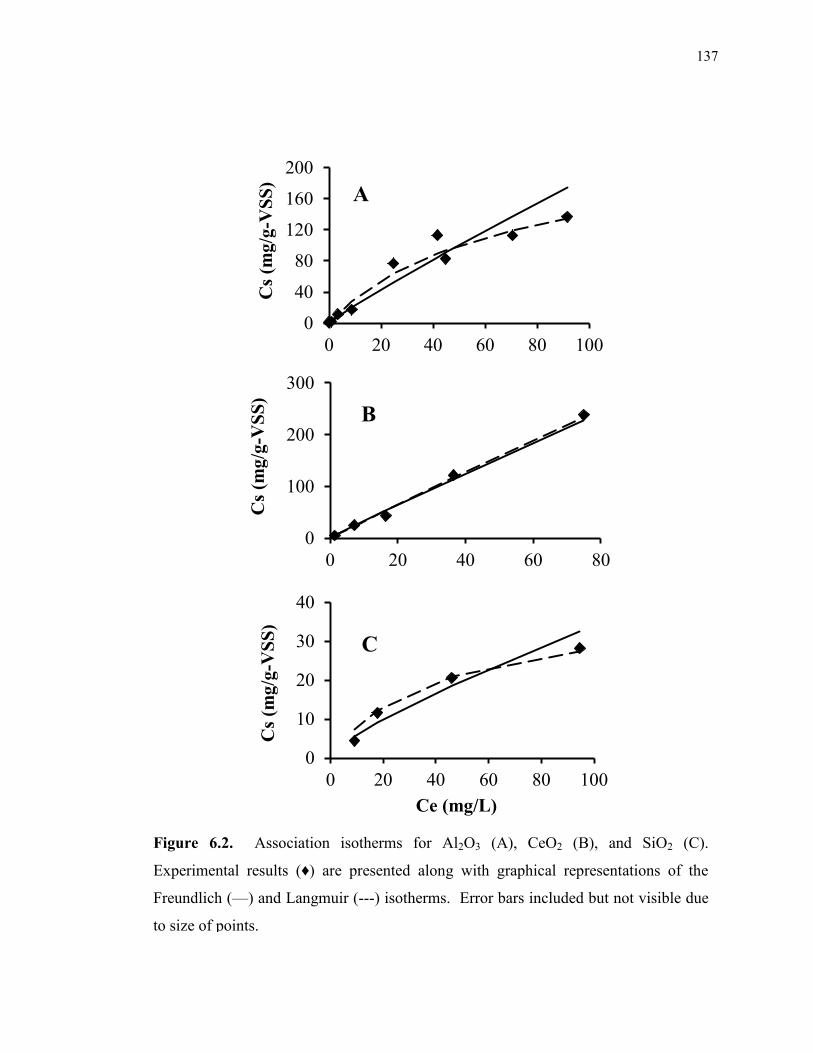
137
Figure 6.2. Association isotherms for Al2O3 (A), CeO2 (B), and SiO2 (C).
Experimental results (♦) are presented along with graphical representations of the
Freundlich (—) and Langmuir (---) isotherms. Error bars included but not visible due
to size of points.
0
40
80
120
160
200
0 20 40 60 80 100
Cs
(mg
/g-V
SS
)
A
0
100
200
300
0 20 40 60 80
Cs
(mg
/g-V
SS
)
B
0
10
20
30
40
0 20 40 60 80 100
Cs
(mg
/g-V
SS
)
Ce (mg/L)
C
138
The different behavior observed for these NPs can be attributed to electrostatic
interactions between the NPs and biosolids, as seen in other studies [35, 131]. As
mentioned previously, biosolids typically have a negative surface charge. The surface
charge of the three oxides is mainly a factor of pH, as the pH being above or below their
respective isoelectric points (IEPs) will cause the NPs to have either a negative or
positive surface charge, respectively. The IEPs of Al2O3, CeO2, and SiO2 generally range
from 7-9, 6-8, and 2-3, respectively [44, 46, 71]. Therefore, at the tested pH of 7.5 both
Al2O3 and CeO2 are expected to have a neutral to slightly positive surface charge, while
SiO2 will have a strongly negative surface charge. The similar and disparate charge
interactions account for the variation between the poorly adsorbed SiO2 and the more
strongly adsorbed Al2O3 and CeO2, respectively.
The calculated removal efficiencies, i.e., the amount of NPs associated with the
sludge as a percentage of the total NP concentration, averaged across the tested values
were 30±5, 51±3, and 8±2% for Al2O3, CeO2, and SiO2, respectively. Moderately higher
removal levels (21%) were found in a study with fluorescently-labeled SiO2 NPs after
exposure to activated sludge [77]. High levels of CeO2 removal (95-98%) were also
reported in a model WWTP fed with synthetic wastewater [46]. While this study focused
on primary interactions between NPs and sewage sludge, further investigation is needed
to evaluate the effects of solution chemistry, as this will greatly affect NP aggregation
behavior. Two studies have been done integrating the effects of background constituents;
however both used synthetic wastewater [46, 128]. Synthetic wastewater is unlikely to
fully reproduce the complex chemistry in municipal wastewater.
139
Two traditional isotherm models, Freundlich and Langmuir, were utilized to
analyze experimental equilibrium results. These models consider the relationship between
the equilibrium liquid concentration (Ce) and the biosolid-associated concentration (Cs) of
a sorbate. The Freundlich isotherm is fitted using the parameters Kf (mg1-(1/n)
L g-1
VSS)
and n (Eq. 6.1), with the isotherm becoming linear when n = 1. The Langmuir isotherm
is fit by the parameters a (L mg-1
) and b (gVSS mg-1
) (Eq. 6.2). The fit constants
determined using these models, as well as the R2 values are shown in Table 6.1, while the
graphical representations of the models for Al2O3, CeO2, and SiO2 are shown in Figure
6.2(A-C).
Overall, the Langmuir model more closely described the interaction behavior of
NPs and biosolids, being both visually and statistically superior in the case of Al2O3 and
SiO2. While for CeO2 both models were equally accurate due to the high linearity
(Freundlich n = 1.04) across the equilibrium concentrations evaluated (up to 75 mg L-1
).
The Langmuir model suggests monolayer adsorption; however, additional inspection with
electron microscopy provides a clearer image of the NPs on the biosolid surface.
⁄
(6.1)
(6.2)

140
Figure 6.3 shows the SEM and TEM images of activated sludge after exposure to
the various NPs. The majority of the filtrate imaged was in the form of biological flocs
with NPs entrained within the extracellular material; however the selected images of the
individual bacteria help to elucidate the nature of the interaction between the NPs and the
sludge. The NPs seemed to interact only with the surface of the microorganisms and no
definitive evidence of internalization is observed. Generally, the NPs appeared to
associate with the microbial surface in the form of aggregates. This is expected as the
common state of NPs in solution is aggregated. Figure 6.4 shows SEM-EDS analysis of
biosolid samples exposed to Al2O3 or CeO2 NPs and gives further information into the
mode of association between NPs and biosolids. SEM-EDS results for biosolids exposed
to SiO2 NPs were not conclusive due to interference of background silicon with the
detection of the added SiO2. Figure 6.4 clearly indicates that both cerium and aluminum
Table 6.1. Fitting constants for Freundlich and Langmuir NP association isotherms,
including goodness of fit as determined by the coefficient of determination, R2.
Nano-
particle
Freundlich Fit Langmuir Fit
Kf
(mg1-(1/n)
L
g-1
VSS)
n R2
a
(L mg-1
)
b
(gVSS mg-1
) R
2
Al2O3 2.8±0.7 1.1±0.1 0.85 0.02±0.01 0.004±0.002 0.96
CeO2 3.6±0.5 1.0±0.1 0.99 0.001±0.003 0.0002±0.0008 0.99
SiO2 1.0±3.4 1.3±0.2 0.91 0.03±0.02 0.03±0.01 0.97

141
appear to be ubiquitous; however there appears no difference in concentration between
the surface of the bacteria and that of the background filter on which the samples were
fixed. This leads to the determination that the coverage of NPs across the sample was
due to the post-run filtering process and not to preferential association. Thus, the
previous assertion that the NPs are predominately associated with the biosolids as large
aggregates is maintained.

142
Figure 6.3. TEM (left) and SEM (right) images of microorganisms in activated sludge
after exposure to Al2O3 (A), CeO2 (B), and SiO2 (C) nanoparticles (denoted by
arrows).

143
Figure 6.4. SEM-EDS analysis of microorganisms in activated sludge after exposure
to Al2O3 (A) and CeO2 (B) NPs. Red or blue dots represent presence of Al or Ce,
respectively.

144
6.4. Conclusions
The significance of activated sludge-nanoparticle interactions as a removal
mechanism for NPs released into municipal WWTPs was evaluated. The removal
efficiency of three common nanomaterials, Al2O3, CeO2, and SiO2, varied widely. Due to
the high removal efficiency and shape of the association isotherm, CeO2 and Al2O3 are
expected to be significantly removed by activated sludge treatment. In contrast, poor
removal of SiO2 is anticipated given the low affinity of this oxide for association with the
biosolids. In conclusion, these results show that sludge-nanoparticle interactions play an
important role in the removal of NPs from aqueous waste streams, and that activated
sludge treatment is reasonably effective in retaining certain NPs.

145
CHAPTER VII
CONCLUSIONS
The method developed and validated in this study provides a rapid, robust
approach for monitoring nanoparticle retention in porous media. The major advantage
and uniqueness of this method is in using an online, real-time and in-situ method for
measuring nanoparticle transport and retention dynamics; this eliminates the complexity
and errors of sampling and off-line analysis.
Additionally, fluorescent, core-shell silica nanoparticles (n-SiO2) were
synthesized in sizes ranging from 25 to 850 nm. These particles were shown to be highly
useful as tracers in porous media filtration. Their application provided for a retention
comparison based on size alone. Evaluation of the breakthrough curves displayed the
importance of particle number concentration on retention in diatomaceous earth (DE)
beds. Larger n-SiO2 provided significantly larger mass capacities, which would normally
lead to the conclusion that they were better retained by the porous media. However,
evaluation of the number capacities showed similar values. The dependence on particle
number concentration suggests site-specific adsorption on the DE surface.
The method was applied to evaluate TiO2 nanoparticles (n-TiO2) in three varying
porous media: sand, activated carbon (AC), and DE. DE displayed great promise in the
capture of n-TiO2, providing full NP retention of a dispersion containing 50 mg TiO2 L-1
for over 250 bed volumes. The potential of DE as a granular media for the removal of
nanoparticles was also confirmed by batch isotherm results which confirmed the high
146
nanoparticle loading capacity of DE (> 25 mg TiO2 g-1
DE) in comparison to that of the
classic filtration material sand (0.025 mg TiO2 g-1
sand). In fact, evaluation of the bed
capacities after full breakthrough bolstered the superiority of DE as its capacity was
determined to be 33.8 mg TiO2 g-1
DE as compared to that of AC (0.23 mg TiO2 g-1
AC) or
sand (0.004 mg TiO2 g-1
sand). The presence of organic and synthetic contaminants
drastically altered the retention of n-TiO2 in porous media filtration. In conclusion, DE
has been presented by this study to be a promising material for the retention of
nanoparticles while conventional filtration materials such as sand and AC have been
proven to be lacking. Isolation and optimization of specific surface interactions of DE
could provide an avenue for the implementation of porous media filtration for the
treatment of nanoparticles in aqueous waste streams. Continued investigation of common
contaminants as well as competing effects is necessary to propel the introduction of
porous media filtration as a nanoparticle-targeted treatment technique.
Modeling of this system utilized a combination of site delineation, which
separates physisorbed sites from chemisorbed, and physical straining. This enabled the
accurate fitting of the breakthrough curves and retained nanoparticle concentration
profiles for sand, AC and DE with coefficients of determination (R2) greater than 0.96 for
all curves save that for the nanoparticles retained in the sand bed. Best fit parameters of
this model indicated that DE provided superior retention mostly due to increased
physisorption, confirming the previous hypothesis of site-specific adsorption. Continued
refinement will lead to a process model useful in both system scaling and design.
147
Evaluation of the interactions of three nanoparticles, cerium oxide (n-CeO2),
aluminum oxide (n-Al2O3), and n-SiO2, with activated sewage sludge displayed the
disparity of retention based on nanoparticle type. The n-CeO2 and n-Al2O3 were both
significantly retained by the sludge while n-SiO2 was poorly removed. This was largely
due to electrostatic interactions between the sludge and nanoparticles as n-SiO2 was
highly negatively charged at circumneutral pH while n-CeO2 and n-Al2O3 were neutral to
slightly positively charged. This result reinforces the need for targeted nanoparticle
retention techniques, as conventional treatment techniques may be very ineffective for
nanoparticle abatement.
The use of porous media filtration has been shown to be effective for the purpose
of removing nanoparticles from aqueous waste streams. A novel technique for
monitoring retention of n-TiO2 and the synthesis of fluorescent-cored n-SiO2 provided
pathways for rapid evaluation of nanoparticle transport in porous media under varying
conditions. DE was proved to be an effective material which may be combined with
other materials such as sand to form a composite porous media filtration apparatus which
could be designed to perform under specific stream conditions and to target specific
nanoparticles. Application of a process simulator clarified controlling retention
mechanisms and enables future scale-up and process design. Continued investigation
into the role of solution contaminants as well as optimization of the porous media may
provide an easily implemented, nanoparticle-specific porous media treatment technique
for the abatement of nanoparticles.
148
CHAPTER VIII
CONTINUATION OF WORK
In the continuation of this study, the active site or sites on diatomaceous earth
(DE) which are conducive to nanoparticle capture must be conclusively determined. This
will allow for a selection of a DE which has an abundance of these sites. The role of DE
grain size must also be established in order to balance nanoparticle retention with
pressure drop across the column. This will be very important when scaling to industrial
dimensions. Integration of different fluorescent dyes into the n-SiO2 may allow for
simultaneous monitoring of multiple nanoparticles, providing the ability to study site
competition between nanoparticle sizes. It would also allow for concurrent studies of
nanoparticles coated with a contaminant versus the virgin nanoparticles. Finally, further
refinement of the process model is necessary. The more accurate Danckwert’s boundary
condition should be used at the column inlet as opposed to the simpler constant-
concentration condition used. Delineation between the chemisorbed and diffusion-
limited physisorbed interactions would also be helpful for determining regeneration
capability.

149
REFERENCES
1. Israelachvili, J.N. Intermolecular and surface forces. 1985, London: Academic Press Inc.
2. National Nanotechnology Initiative. Nanotechnology 101. 2012. www.nano.gov.
3. Schmid, G. Nanoparticles: From theory to application. 2nd ed. 2010, Weinheim: Wiley-
VCH.
4. Poole, C.P. and F.J. Owens. Introduction to nanotechnology. 2003, Hoboken, NJ: J.
Wiley.
5. Niemeyer, C.M. Nanoparticles, proteins, and nucleic acids: Biotechnology meets
materials science. Angewandte Chemie-International Edition, 2001. 40(22): 4128-4158.
6. Guzman, K.A.D., M.R. Taylor, and J.F. Banfield. Environmental risks of
nanotechnology: National nanotechnology initiative funding, 2000-2004. Environmental
Science & Technology, 2006. 40(5): 1401-1407.
7. Jarvie, H.P., H. Al-Obaidi, S.M. King, M.J. Bowes, M.J. Lawrence, A.F. Drake, M.A.
Green, and P.J. Dobson. Fate of silica nanoparticles in simulated primary wastewater
treatment. Environmental Science & Technology, 2009. 43(22): 8622-8628.
8. GreBler, S. and M. Nentwich. Nano and the environment - part 1: Potential
environmental benefits and sustainablity effects. NanoTrust-Dossier, 2012(26).
9. Li, Y.H., J. Ding, Z.K. Luan, Z.C. Di, Y.F. Zhu, C.L. Xu, D.H. Wu, and B.Q. Wei.
Competitive adsorption of Pb2+
, Cu2+
and Cd2+
ions from aqueous solutions by
multiwalled carbon nanotubes. Carbon, 2003. 41(14): 2787-2792.
10. Tsuzuki, T. Commercial scale production of inorganic nanoparticles. International
Journal of Nanotechnology, 2009. 6(5-6): 567-578.
11. Ju-Nam, Y. and J.R. Lead. Manufactured nanoparticles: An overview of their chemistry,
interactions and potential environmental implications. Science of the Total Environment,
2008. 400(1-3): 396-414.
12. Zhang, W.X. Nanoscale iron particles for environmental remediation: An overview.
Journal of Nanoparticle Research, 2003. 5(3-4): 323-332.
13. Wiesner, M.R., G.V. Lowry, P. Alvarez, D. Dionysiou, and P. Biswas. Assessing the
risks of manufactured nanomaterials. Environmental Science & Technology, 2006.
40(14): 4336-4345.
14. Biswas, P. and C.Y. Wu. 2005 critical review: Nanoparticles and the environment.
Journal of the Air & Waste Management Association, 2005. 55(6): 708-746.

150
15. Klaine, S.J., P.J.J. Alvarez, G.E. Batley, T.F. Fernandes, R.D. Handy, D.Y. Lyon, S.
Mahendra, M.J. McLaughlin, and J.R. Lead. Nanomaterials in the environment:
Behavior, fate, bioavailability, and effects. Environmental Toxicology and Chemistry,
2008. 27(9): 1825-1851.
16. Nowack, B. and T.D. Bucheli. Occurrence, behavior and effects of nanoparticles in the
environment. Environmental Pollution, 2007. 150(1): 5-22.
17. Gottschalk, F., T. Sonderer, R.W. Scholz, and B. Nowack. Modeled environmental
concentrations of engineered nanomaterials (TiO2, ZnO, Ag, CNT, fullerenes) for
different regions. Environmental Science & Technology, 2009. 43(24): 9216-9222.
18. Robichaud, C.O., A.E. Uyar, M.R. Darby, L.G. Zucker, and M.R. Wiesner. Estimates of
upper bounds and trends in nano-TiO2 production as a basis for exposure assessment.
Environmental Science & Technology, 2009. 43(12): 4227-4233.
19. Navarro, E., A. Baun, R. Behra, N.B. Hartmann, J. Filser, A.J. Miao, A. Quigg, P.H.
Santschi, and L. Sigg. Environmental behavior and ecotoxicity of engineered
nanoparticles to algae, plants, and fungi. Ecotoxicology, 2008. 17(5): 372-386.
20. Roco, M.C. Environmentally responsible development of nanotechnology.
Environmental Science & Technology, 2005. 39(5): 106A-112A.
21. Savage, N. and M.S. Diallo. Nanomaterials and water purification: Opportunities and
challenges. Journal of Nanoparticle Research, 2005. 7(4-5): 331-342.
22. Handy, R.D. and B.J. Shaw. Toxic effects of nanoparticles and nanomaterials:
Implications for public health, risk assessment and the public perception of
nanotechnology. Health Risk & Society, 2007. 9(2): 125-144.
23. Peters, K., R.E. Unger, C.J. Kirkpatrick, A.M. Gatti, and E. Monari. Effects of nano-
scaled particles on endothelial cell function in vitro: Studies on viability, proliferation
and inflammation. Journal of Materials Science-Materials in Medicine, 2004. 15(4): 321-
325.
24. Cheng, M.D. Effects of nanophase materials (<= 20 nm) on biological responses. Journal
of Environmental Science and Health Part a-Toxic/Hazardous Substances &
Environmental Engineering, 2004. 39(10): 2691-2705.
25. Rahman, Q., M. Lohani, E. Dopp, H. Pemsel, L. Jonas, D.G. Weiss, and D. Schiffmann.
Evidence that ultrafine titanium dioxide induces micronuclei and apoptosis in syrian
hamster embryo fibroblasts. Environmental Health Perspectives, 2002. 110(8): 797-800.
26. Lin, W., Y.-w. Huang, X.-D. Zhou, and Y. Ma. In vitro toxicity of silica nanoparticles in
human lung cancer cells. Toxicology and Applied Pharmacology, 2006. 217(3): 252-259.
151
27. Kipen, H.M. and D.L. Laskin. Smaller is not always better: Nanotechnology yields
nanotoxicology. American Journal of Physiology - Lung Cellular and Molecular
Physiology, 2005. 289(5): L696-L697.
28. Nel, A., T. Xia, L. Mädler, and N. Li. Toxic potential of materials at the nanolevel.
Science, 2006. 311(5761): 622-627.
29. Jeng, H.A. and J. Swanson. Toxicity of metal oxide nanoparticles in mammalian cells.
Journal of Environmental Science and Health Part a-Toxic/Hazardous Substances &
Environmental Engineering, 2006. 41(12): 2699-2711.
30. Brunner, T.J., P. Wick, P. Manser, P. Spohn, R.N. Grass, L.K. Limbach, A. Bruinink, and
W.J. Stark. In vitro cytotoxicity of oxide nanoparticles: Comparison to asbestos, silica,
and the effect of particle solubility. Environmental Science & Technology, 2006. 40(14):
4374-4381.
31. Lin, W., Y.-w. Huang, X.-D. Zhou, and Y. Ma. Toxicity of cerium oxide nanoparticles in
human lung cancer cells. International Journal of Toxicology, 2006. 25(6): 451-457.
32. Nakagawa, Y., S. Wakuri, K. Sakamoto, and N. Tanaka. The photogenotoxicity of
titanium dioxide particles. Mutation Research-Genetic Toxicology and Environmental
Mutagenesis, 1997. 394(1-3): 125-132.
33. Bolis, V., C. Busco, M. Ciarletta, C. Distasi, J. Erriquez, I. Fenoglio, S. Livraghi, and S.
Morel. Hydrophilic/hydrophobic features of TiO2 nanoparticles as a function of crystal
phase, surface area and coating, in relation to their potential toxicity in peripheral nervous
system. Journal of Colloid and Interface Science, 2012. 369: 28-39.
34. Adams, L.K., D.Y. Lyon, and P.J.J. Alvarez. Comparative eco-toxicity of nanoscale
TiO2, SiO2, and ZnO water suspensions. Water Research, 2006. 40(19): 3527-3532.
35. Thill, A., O. Zeyons, O. Spalla, F. Chauvat, J. Rose, M. Auffan, and A.M. Flank.
Cytotoxicity of CeO2 nanoparticles for escherichia coli. Physico-chemical insight of the
cytotoxicity mechanism. Environmental Science & Technology, 2006. 40(19): 6151-
6156.
36. Hund-Rinke, K. and M. Simon. Ecotoxic effect of photocatalytic active nanoparticles
TiO2 on algae and daphnids. Environmental Science and Pollution Research, 2006. 13(4):
225-232.
37. Lovern, S.B. and R. Klaper. Daphnia magna mortality when exposed to titanium dioxide
and fullerene (C-60) nanoparticles. Environmental Toxicology and Chemistry, 2006.
25(4): 1132-1137.
38. Federici, G., B.J. Shaw, and R.D. Handy. Toxicity of titanium dioxide nanoparticles to
rainbow trout (oncorhynchus mykiss): Gill injury, oxidative stress, and other
physiological effects. Aquatic Toxicology, 2007. 84(4): 415-430.

152
39. Yang, L. and D.J. Watts. Particle surface characteristics may play an important role in
phytotoxicity of alumina nanoparticles. Toxicology Letters, 2005. 158(2): 122-132.
40. Murashov, V. Comments on "Particle surface characteristics may play an important role
in phytotoxicity of alumina nanoparticles" By Yang, L., Watts, D.J., Toxicology Letters,
2005, 158, 122-132. Toxicology Letters, 2006. 164(2): 185-187.
41. Debye, P. and E. Huckel. The theory of the electrolyte II - The border law for electrical
conductivity. Physikalische Zeitschrift, 1923. 24: 305-325.
42. Riddick, T.M. Control of colloid stability through zeta potential. 1968, New York: Zeta-
Meter, Inc.
43. Baalousha, M. Aggregation and disaggregation of iron oxide nanoparticles: Influence of
particle concentration, pH and natural organic matter. Science of the Total Environment,
2009. 407(6): 2093-2101.
44. Fisher, M.L., M. Colic, M.P. Rao, and F.F. Lange. Effect of silica nanoparticle size on
the stability of alumina/silica suspensions. Journal of the American Ceramic Society,
2001. 84(4): 713-718.
45. Jailani, S., G.V. Franks, and T.W. Healy. Zeta potential of nanoparticle suspensions:
Effect of electrolyte concentration, particle size, and volume fraction. Journal of the
American Ceramic Society, 2008. 91(4): 1141-1147.
46. Limbach, L.K., R. Bereiter, E. Mueller, R. Krebs, R. Gaelli, and W.J. Stark. Removal of
oxide nanoparticles in a model wastewater treatment plant: Influence of agglomeration
and surfactants on clearing efficiency. Environmental Science & Technology, 2008.
42(15): 5828-5833.
47. Sogami, I. and N. Ise. On the electrostatic interaction in macroionic solutions. Journal of
Chemical Physics, 1984. 81(12): 6320-6332.
48. French, R.A., A.R. Jacobson, B. Kim, S.L. Isley, R.L. Penn, and P.C. Baveye. Influence
of ionic strength, pH, and cation valence on aggregation kinetics of titanium dioxide
nanoparticles. Environmental Science & Technology, 2009. 43(5): 1354-1359.
49. Lu, J.J., X.M. Yan, Y.M. Zhou, B.Y. Shi, X.P. Ge, and H.X. Tang. Comparative study of
the adsorption capacity of peat humic acid (PHA) and soil humic acid on nano-SiO2 and
nano-kaolin. Fresenius Environmental Bulletin, 2009. 18(3): 346-352.
50. Zhang, Y., Y.S. Chen, P. Westerhoff, K. Hristovski, and J.C. Crittenden. Stability of
commercial metal oxide nanoparticles in water. Water Research, 2008. 42(8-9): 2204-
2212.
51. Derjaguin, B.V. and L. Landau. Theory of the stability of strongly charged lyophobic sols
and of the adhesion of strongly charged particles in solution of electrolytes. Acta
Physicochim URSS, 1941. 14: 633-662.

153
52. Verwey, E. and J. Overbeek. Theory of stability of lyophobic colloids. 1948, Amsterdam:
Elsevier.
53. van Oss, C.J. Acid-base interfacial interactions in aqueous-media. Colloids and Surfaces
a-Physicochemical and Engineering Aspects, 1993. 78: 1-49.
54. van Oss, C.J. Interfacial forces in aqueous media. 1994, New York: Marcel Dekker.
55. Yotsumoto, H. and R.H. Yoon. Application of extended DLVO theory 1. Stability of
rutile suspensions. Journal of Colloid and Interface Science, 1993. 157(2): 426-433.
56. Yotsumoto, H. and R.H. Yoon. Application of extended DLVO theory 2. Stability of
silica suspensions. Journal of Colloid and Interface Science, 1993. 157(2): 434-441.
57. Bostrom, M., V. Deniz, G.V. Franks, and B.W. Ninham. Extended DLVO theory:
Electrostatic and non-electrostatic forces in oxide suspensions. Advances in Colloid and
Interface Science, 2006. 123: 5-15.
58. Domingos, R.F., N. Tufenkji, and K.J. Wilkinson. Aggregation of titanium dioxide
nanoparticles: Role of a fulvic acid. Environmental Science & Technology, 2009. 43(5):
1282-1286.
59. Godinez, I.G. and C.J.G. Darnault. Aggregation and transport of nano-TiO2 in saturated
porous media: Effects of pH, surfactants and flow velocity. Water Research, 2011. 45(2):
839-851.
60. Tiraferri, A. and R. Sethi. Enhanced transport of zerovalent iron nanoparticles in
saturated porous media by guar gum. Journal of Nanoparticle Research, 2009. 11(3):
635-645.
61. Ghosh, S., H. Mashayekhi, B. Pan, P. Bhowmik, and B.S. Xing. Colloidal behavior of
aluminum oxide nanoparticles as affected by pH and natural organic matter. Langmuir,
2008. 24(21): 12385-12391.
62. Chang, M.R., D.J. Lee, and J.Y. Lai. Nanoparticles in wastewater from a science-based
industrial park - coagulation using polyaluminum chloride. Journal of Environmental
Management, 2007. 85(4): 1009-1014.
63. Chuang, S.H., T.C. Chang, C.F. Ouyang, and J.M. Leu. Colloidal silica removal in
coagulation processes for wastewater reuse in a high-tech industrial park. Water Science
and Technology, 2007. 55(1-2): 187-195.
64. Lai, C.L. and S.H. Lin. Treatment of chemical mechanical polishing wastewater by
electrocoagulation: System performances and sludge settling characteristics.
Chemosphere, 2004. 54(3): 235-242.
154
65. Browne, S., V. Krygier, J. O'Sullivan, and E.L. Sandstrom. Treating wastewater from
CMP using ultrafiltration. Micro, 1999. 17(3): 77.
66. Liang, H.W., L. Wang, P.Y. Chen, H.T. Lin, L.F. Chen, D.A. He, and S.H. Yu.
Carbonaceous nanofiber membranes for selective filtration and separation of
nanoparticles. Advanced Materials, 2010. 22(42): 4691.
67. Lippa, P., U. Muller, B. Hetzer, and T. Wagner. Characterization of nanoparticulate
fouling and breakthrough during low-pressure membrane filtration. Desalination and
Water Treatment, 2009. 9(1-3): 234-240.
68. Boxall, A.B., K. Tiede, and Q. Chaudhry. Engineered nanomaterials in soils and water:
How do they behave and could they pose a risk to human health? Nanomedicine, 2007.
2(6): 919-927.
69. Metcalf & Eddy., G. Tchobanoglous, F.L. Burton, and H.D. Stensel. Wastewater
engineering : Treatment and reuse. 4th ed. McGraw-Hill series in Civil and
Environmental Engineering. 2003, Boston: McGraw-Hill. xxviii, 1819 p.
70. Chen, K.L. and M. Elimelech. Influence of humic acid on the aggregation kinetics of
fullerene (C-60) nanoparticles in monovalent and divalent electrolyte solutions. Journal
of Colloid and Interface Science, 2007. 309(1): 126-134.
71. Hosokawa, M. Nanoparticle technology handbook. 2007, Amsterdam, Netherlands;
Boston, Mass.: Elsevier.
72. Brar, S.K., M. Verma, R.D. Tyagi, and R.Y. Surampalli. Engineered nanoparticles in
wastewater and wastewater sludge - evidence and impacts. Waste Management, 2010.
30(3): 504-520.
73. Neal, A.L. What can be inferred from bacterium-nanoparticle interactions about the
potential consequences of environmental exposure to nanoparticles? Ecotoxicology, 2008.
17(5): 362-371.
74. Wang, Z.S., M.T. Hung, and J.C. Liu. Sludge conditioning by using alumina
nanoparticles and polyelectrolyte. Water Science & Technology, 2007. 56(8): 125-132.
75. Sennerfors, T. and F. Tiberg. Adsorption of polyelectrolyte and nanoparticles at the
silica-aqueous solution interface: Influence of the history of additions of the two
components. Journal of Colloid and Interface Science, 2001. 238(1): 129-135.
76. Gómez-Rivera, F., J.A. Field, D. Brown, and R. Sierra-Alvarez. Fate of cerium dioxide
(CeO2) nanoparticles in municipal wastewater during activated sludge treatment.
Bioresource Technology, 2012. 108: 300-304.
77. Kiser, M.A., H. Ryu, H.Y. Jang, K. Hristovski, and P. Westerhoff. Biosorption of
nanoparticles to heterotrophic wastewater biomass. Water Research, 2010. 44(14): 4105-
4114.

155
78. Yao, K.M., M.M. Habibian, and C.R. Omelia. Water and waste water filtration - concepts
and applications. Environmental Science & Technology, 1971. 5(11): 1105.
79. McDowellboyer, L.M., J.R. Hunt, and N. Sitar. Particle-transport through porous-media.
Water Resources Research, 1986. 22(13): 1901-1921.
80. Bradford, S.A., S.R. Yates, M. Bettahar, and J. Simunek. Physical factors affecting the
transport and fate of colloids in saturated porous media. Water Resources Research,
2002. 38(12): 12.
81. Bradford, S.A. and M. Bettahar. Concentration dependent transport of colloids in
saturated porous media. Journal of Contaminant Hydrology, 2006. 82(1–2): 99-117.
82. Bradford, S.A., J. Simunek, M. Bettahar, M.T. van Genuchten, and S.R. Yates.
Significance of straining in colloid deposition: Evidence and implications. Water
Resources Research, 2006. 42(12): 16.
83. Ben-Moshe, T., I. Dror, and B. Berkowitz. Transport of metal oxide nanoparticles in
saturated porous media. Chemosphere, 2010. 81(3): 387-393.
84. Solovitch, N., J. Labille, J. Rose, P. Chaurand, D. Borschneck, M.R. Wiesner, and J.Y.
Bottero. Concurrent aggregation and deposition of TiO2 nanoparticles in a sandy porous
media. Environmental Science & Technology, 2010. 44(13): 4897-4902.
85. Tian, Y.A., B. Gao, C. Silvera-Batista, and K.J. Ziegler. Transport of engineered
nanoparticles in saturated porous media. Journal of Nanoparticle Research, 2010. 12(7):
2371-2380.
86. Chen, G., X. Liu, and C. Su. Transport and retention of TiO2 rutile nanoparticles in
saturated porous media under low-ionic-strength conditions: Measurements and
mechanisms. Langmuir, 2011. 27(9): 5393-5402.
87. Tufenkji, N. and M. Elimelech. Correlation equation for predicting single-collector
efficiency in physicochemical filtration in saturated porous media. Environmental
Science & Technology, 2004. 38(2): 529-536.
88. Wang, C., A.D. Bobba, R. Attinti, C.Y. Shen, V. Lazouskaya, L.P. Wang, and Y. Jin.
Retention and transport of silica nanoparticles in saturated porous media: Effect of
concentration and particle size. Environmental Science & Technology, 2012. 46(13):
7151-7158.
89. Pelley, A.J. and N. Tufenkji. Effect of particle size and natural organic matter on the
migration of nano- and microscale latex particles in saturated porous media. Journal of
Colloid and Interface Science, 2008. 321(1): 74-83.

156
90. Hotze, E.M., T. Phenrat, and G.V. Lowry. Nanoparticle aggregation: Challenges to
understanding transport and reactivity in the environment. Journal of Environmental
Quality, 2010. 39(6): 1909-1924.
91. Kosmulski, M. Chemical properties of material surfaces. 2001: Marcel Dekker, Inc.
92. Chowdhury, I., Y. Hong, R.J. Honda, and S.L. Walker. Mechanisms of TiO2 nanoparticle
transport in porous media: Role of solution chemistry, nanoparticle concentration, and
flowrate. Journal of Colloid and Interface Science, 2011. 360(2): 548-555.
93. Jeong, S.W. and S.D. Kim. Aggregation and transport of copper oxide nanoparticles in
porous media. Journal of Environmental Monitoring, 2009. 11(9): 1595-1600.
94. Jaisi, D.P., N.B. Saleh, R.E. Blake, and M. Elimelech. Transport of single-walled carbon
nanotubes in porous media: Filtration mechanisms and reversibility. Environmental
Science & Technology, 2008. 42(22): 8317-8323.
95. Weronski, P., J.Y. Walz, and M. Elimelech. Effect of depletion interactions on transport
of colloidal particles in porous media. Journal of Colloid and Interface Science, 2003.
262(2): 372-383.
96. Lecoanet, H.F. and M.R. Wiesner. Velocity effects on fullerene and oxide nanoparticle
deposition in porous media. Environmental Science & Technology, 2004. 38(16): 4377-
4382.
97. U.S.EPA. Nanotechnology whitepaper (Report No. EPA 100/b-07/001). Science Policy
Council, Nanotechnology Workgroup, U.S. Environmental Protection Agency, 2007.
98. Auffan, M., J. Rose, J.Y. Bottero, G.V. Lowry, J.P. Jolivet, and M.R. Wiesner. Towards a
definition of inorganic nanoparticles from an environmental, health and safety
perspective. Nature Nanotechnology, 2009. 4(10): 634-641.
99. Chen, G.X., X.Y. Liu, and C.M. Su. Transport and retention of TiO2 rutile nanoparticles
in saturated porous media under low-ionic-strength conditions: Measurements and
mechanisms. Langmuir, 2011. 27(9): 5393-5402.
100. Godinez, I.G. and C.J.G. Darnault. Aggregation and transport of nano-TiO2 in saturated
porous media: Effects of pH, surfactants and flow velocity. Water Research, 2011. 45(2):
839-851.
101. Dunphy Guzman, K.A., M.P. Finnegan, and J.F. Banfield. Influence of surface potential
on aggregation and transport of titania nanoparticles. Environmental Science &
Technology, 2006. 40(24): 7688-7693.
102. Kim, H.J., T. Phenrat, R.D. Tilton, and G.V. Lowry. Fe-0 nanoparticles remain mobile in
porous media after aging due to slow desorption of polymeric surface modifiers.
Environmental Science & Technology, 2009. 43(10): 3824-3830.

157
103. Lecoanet, H.F., J.Y. Bottero, and M.R. Wiesner. Laboratory assessment of the mobility
of nanomaterials in porous media. Environmental Science & Technology, 2004. 38(19):
5164-5169.
104. Lin, D.H., X.L. Tian, F.C. Wu, and B.S. Xing. Fate and transport of engineered
nanomaterials in the environment. Journal of Environmental Quality, 2010. 39(6): 1896-
1908.
105. Napierska, D., L.C.J. Thomassen, D. Lison, J.A. Martens, and P.H. Hoet. The nanosilica
hazard: Another variable entity. Particle and Fibre Toxicology, 2010. 7.
106. Hirsch, L.R., R.J. Stafford, J.A. Bankson, S.R. Sershen, B. Rivera, R.E. Price, J.D. Hazle,
N.J. Halas, and J.L. West. Nanoshell-mediated near-infrared thermal therapy of tumors
under magnetic resonance guidance. Proceedings of the National Academy of Sciences of
the United States of America, 2003. 100(23): 13549-13554.
107. Slowing, II, J.L. Vivero-Escoto, C.W. Wu, and V.S.Y. Lin. Mesoporous silica
nanoparticles as controlled release drug delivery and gene transfection carriers. Advanced
Drug Delivery Reviews, 2008. 60(11): 1278-1288.
108. Torkzaban, S., J.M. Wan, T.K. Tokunaga, and S.A. Bradford. Impacts of bridging
complexation on the transport of surface-modified nanoparticles in saturated sand.
Journal of Contaminant Hydrology, 2012. 136: 86-95.
109. Jung, H.S., D.S. Moon, and J.K. Lee. Quantitative analysis and efficient surface
modification of silica nanoparticles. Journal of Nanomaterials, 2012.
110. Chen, G.X., X.Y. Liu, and C.M. Su. Distinct effects of humic acid on transport and
retention of TiO2 rutile nanoparticles in saturated sand columns. Environmental Science
& Technology, 2012. 46(13): 7142-7150.
111. Stober, W., A. Fink, and E. Bohn. Controlled growth of monodisperse silica spheres in
micron size range. Journal of Colloid and Interface Science, 1968. 26(1): 62.
112. Van Blaaderen, A. and A. Vrij. Synthesis and characterization of colloidal dispersions of
fluorescent, monodisperse silica spheres. Langmuir, 1992. 8(12): 2921-2931.
113. Ow, H., D.R. Larson, M. Srivastava, B.A. Baird, W.W. Webb, and U. Wiesner. Bright
and stable core-shell fluorescent silica nanoparticles. Nano Letters, 2005. 5(1): 113-117.
114. Burns, A., H. Ow, and U. Wiesner. Fluorescent core-shell silica nanoparticles: Towards
"Lab on a particle" Architectures for nanobiotechnology. Chemical Society Reviews,
2006. 35(11): 1028-1042.
115. Song, X., F. Li, J. Ma, N. Jia, J. Xu, and H. Shen. Synthesis of fluorescent silica
nanoparticles and their applications as fluorescence probes. Journal of Fluorescence,
2011. 21(3): 1205-1212.

158
116. Choi, J.H., A.A. Burns, R.M. Williams, Z.X. Zhou, A. Flesken-Nikitin, W.R. Zipfel, U.
Wiesner, and A.Y. Nikitin. Core-shell silica nanoparticles as fluorescent labels for
nanomedicine. Journal of Biomedical Optics, 2007. 12(6).
117. Feng, W., T. Wee Beng, Z. Yong, F. Xianping, and W. Minquan. Luminescent
nanomaterials for biological labelling. Nanotechnology, 2006. 17(1).
118. Rottman, J., R. Sierra-Alvarez, and F. Shadman. Real-time monitoring of nanoparticle
retention in porous media. Environmental Chemistry Letters, (in press).
119. Darlington, T.K., A.M. Neigh, M.T. Spencer, O.T. Nguyen, and S.J. Oldenburg.
Nanoparticle characteristics affecting environmental fate and transport through soil.
Environmental Toxicology and Chemistry, 2009. 28(6): 1191-1199.
120. Tosco, T., J. Bosch, R.U. Meckenstock, and R. Sethi. Transport of ferrihydrite
nanoparticles in saturated porous media: Role of ionic strength and flow rate.
Environmental Science & Technology, 2012. 46(7): 4008-4015.
121. Tiede, K., M. Hassellov, E. Breitbarth, Q. Chaudhry, and A.B.A. Boxall. Considerations
for environmental fate and ecotoxicity testing to support environmental risk assessments
for engineered nanoparticles. Journal of Chromatography A, 2009. 1216(3): 503-509.
122. Happel, J. Viscous flow in multiparticle systems - slow motion of fluids relative to beds
of spherical particles. Aiche Journal, 1958. 4(2): 197-201.
123. Rajagopalan, R. and C. Tien. Trajectory analysis of deep-bed filtration with sphere-in-
cell porous-media model. Aiche Journal, 1976. 22(3): 523-533.
124. Logan, B.E., D.G. Jewett, R.G. Arnold, E.J. Bouwer, and C.R. Omelia. Clarification of
clean-bed filtration models. Journal of Environmental Engineering-Asce, 1995. 121(12):
869-873.
125. Bradford, S.A., J. Simunek, M. Bettahar, M.T. Van Genuchten, and S.R. Yates. Modeling
colloid attachment, straining, and exclusion in saturated porous media. Environmental
Science & Technology, 2003. 37(10): 2242-2250.
126. Cameron, D.R. and A. Klute. Convective-dispersive solute transport with a combined
equilibrium and kinetic adsorption model. Water Resources Research, 1977. 13(1): 183-
188.
127. Benn, T.M. and P. Westerhoff. Nanoparticle silver released into water from commercially
available sock fabrics. Environmental Science & Technology, 2008. 42(11): 4133-4139.
128. Kiser, M.A., P. Westerhoff, T. Benn, Y. Wang, J. Pe̕rez-Rivera, and K. Hristovski.
Titanium nanomaterial removal and release from wastewater treatment plants.
Environmental Science & Technology, 2009. 43(17): 6757-6763.

159
129. Ozsoy, G., F.B. Dilek, and F.D. Sanin. An investigation of agricultural use potential of
wastewater sludges in Turkey - case of heavy metals. Water Science and Technology,
2006. 54(5): 155-161.
130. APHA. Standard methods for the examination of water and wastewater. 20th ed. 1998,
Washington, DC: American Public Health Association.
131. Morones, J.R., J.L. Elechiguerra, A. Camacho, K. Holt, J.B. Kouri, J.T. Ramirez, and
M.J. Yacaman. The bactericidal effect of silver nanoparticles. Nanotechnology, 2005.
16(10): 2346-2353.