Understanding the components of the fundamental sampling error

1
FUNDAMENTAL UNDERSTANDING OF SURFACE CHARACTERSITIC AND CHROMIUM CONTAMINATION ON SOLID OXIDE FUEL CELL CATHODES
By
DONGJO OH
A DISSERTATION PRESENTED TO THE GRADUATE SCHOOL OF THE UNIVERSITY OF FLORIDA IN PARTIAL FULFILLMENT
OF THE REQUIREMENTS FOR THE DEGREE OF DOCTOR OF PHILOSOPHY
UNIVERSITY OF FLORIDA
2010

2
© 2010 Dongjo Oh

3
To my parents; wife, Chanyoung; and daughter, Narae

4
ACKNOWLEDGMENTS
I would like to thank my advisor, Dr. Eric Wachsman for his support and guidance
throughout this experience. I really appreciate the opportunity that he has provided me. I
also would like to thank Dr. Juan Nino, Dr. Susan Sinnott, Dr. Scott Perry, and Dr. Mark
Orazem for their advice and participation as my committee member. I acknowledge Dr.
Hee Sung Yun and Dr. Jiho Yoo for sharing their invaluable experience and guiding me
toward a critical thinking and fundamental understanding of materials. Finally, my wife,
Chanyoung, I always appreciate your support and generosity. You and our baby, Narae
are the greatest gift for me that Jesus has sent to me.

5
TABLE OF CONTENTS page
ACKNOWLEDGMENTS ...................................................................................................... 4
LIST OF TABLES ................................................................................................................ 8
LIST OF FIGURES .............................................................................................................. 9
LIST OF ABBREVIATIONS .............................................................................................. 14
ABSTRACT........................................................................................................................ 16
CHAPTER
1 INTRODUCTION ........................................................................................................ 18
1.1 Dual Challenges of Energy and Climate Change ............................................ 18
1.2 Solid Oxide Fuel Cell (SOFC) .......................................................................... 18
1.3 Objectives ......................................................................................................... 19
2 BACKGROUND .......................................................................................................... 21
2.1 Basic Components and Operation Principle of SOFC .................................... 21
2.2 SOFC Performance .......................................................................................... 22
2.2.1 Equilibrium Voltage ................................................................................. 22
2.2.2 Activation Overpotential .......................................................................... 23
2.2.3 Ohmic Overpotential ............................................................................... 25
2.2.4 Concentration Overpotential ................................................................... 26
2.2.5 Other Losses ........................................................................................... 29
2.3 Efficiency and Degradation .............................................................................. 29
2.4 Overview of Cathode ........................................................................................ 31
2.4.1 Requirements .......................................................................................... 31
2.4.2 Oxygen Reduction Process .................................................................... 31
2.4.3 Mixed Ionic Electronic Conductor ........................................................... 32
2.4.4 La1-xSrxCoyFe1-yO3-δ (LSCF) ................................................................... 34
2.5 Summary ........................................................................................................... 35
3 EXPERIMENTAL ........................................................................................................ 45
3.1 Electrical Conductivity Relaxation .................................................................... 45
3.1.1 Theoretical Background .......................................................................... 45
3.1.2 Electrical Conductivity Measurement ..................................................... 48
3.1.3 Effect of Surface Roughness .................................................................. 48
3.2 Electrochemical Impedance ............................................................................. 49
3.3 Temperature Programmed Isotopic Exchange ................................................ 50
3.4 Materials Characterizations .............................................................................. 51

6
4 MECHANISTIC UNDERSTANDING OF LSCF DEGRADATION ............................. 57
4.1 Introduction ....................................................................................................... 57
4.2 Experimental ..................................................................................................... 57
4.2.1 Sample preparation ................................................................................. 57
4.2.2 Heat treatment ......................................................................................... 58
4.2.3 Characterization ...................................................................................... 58
4.3 Results and Discussion .................................................................................... 60
4.4 Conclusions ...................................................................................................... 67
5 IMPACT OF CO IMPREGNATION INTO LSCF CATHODE ON SOFC PERFORMANCE ........................................................................................................ 74
5.1 Introduction ....................................................................................................... 74
5.2 Experimental ..................................................................................................... 75
5.2.1 AC Impedance Analysis .......................................................................... 75
5.2.2 Electrical Conductivity Relaxation .......................................................... 76
5.2.3 Button Cell Fabrication and Tests .......................................................... 77
5.2.4 Catalyst Impregnation ............................................................................. 79
5.2.5 Characterization ...................................................................................... 79
5.3 Results and Discussion .................................................................................... 79
5.3.1 Effect of Co Impregnation on Electrode Impedance .............................. 79
5.3.2 Effect of Co Impregnation on Power Density of a Single Cell ............... 81
5.3.3 Characteristic Dependence of Kchem on Oxygen Partial Pressure ..... 83
5.4 Conclusions ...................................................................................................... 85
6 MECHANISM OF CR VAPOR DEPOSITION ON SOFC CATHOES ....................... 94
6.1 Introduction ....................................................................................................... 94
6.2 Experimental ..................................................................................................... 95
6.2.1 Sample Preparation ................................................................................ 95
6.2.2 Heat Treatment ....................................................................................... 96
6.2.3 Characterization. ..................................................................................... 96
6.3. Results and Discussion .................................................................................... 97
6.3.1 XRD ......................................................................................................... 97
6.3.2 Cr Vapor Deposition on LSCF ................................................................ 97
6.3.3 Dependence of A-site ions on Cr Vapor Deposition ............................ 101
6.3.4 Dependence of B-site ions on Cr Vapor Deposition ............................ 103
6.4. Conclusions .................................................................................................... 107
7 DEGRADATION MECHANISM AND THEIR IMPACT ON OXYGEN REDUCTION KINETICS OF LSCF .......................................................................... 117
7.1. Introduction ..................................................................................................... 117
7.2. Experimental. .................................................................................................. 117
7.2.1 AC Impedance ....................................................................................... 117
7.2.2 Electrical Conductivity Relaxation ........................................................ 118

7
7.2.3 Temperature Programmed Isotopic Exchange (TPX) ......................... 119
7.2.4 Characterization .................................................................................... 120
7.3 Results and Discussion .................................................................................. 120
7.3.1 AC Impedance ....................................................................................... 120
7.3.2 Electrical Conductivity Relaxation ........................................................ 121
7.3.3 Temperature Programmed Isotopic Exchange .................................... 123
7.3.4 Post ECR Characterization ................................................................... 126
7.4 Conclusions .................................................................................................... 128
8 VAPORIZATION OF DOPED ALKALINE EARTH METAL OXIDE ........................ 137
8.1 Introduction ..................................................................................................... 137
8.2 Experimental ................................................................................................... 138
8.3 Results and Discussion .................................................................................. 138
8.4 Conclusions .................................................................................................... 140
9 CONCLUSIONS........................................................................................................ 145
APPENDIX
A THEORETIC EQUILIBRIUM VOLTAGE .................................................................. 147
B MEASUREMENT EFFECT OF NON-IDEAL STEP CHANGE IN ECR .................. 149
C MEASUREMENT OF THE SURFACE SENSITIVE RATE COEFFICIENT USING ISOTHERMAL ISOTOPIC SWITCHING ..................................................... 152
C.1 Introduction ..................................................................................................... 152
C.2 Background ..................................................................................................... 153
C.3 Experimental ................................................................................................... 154
C.4 Results and Discussion .................................................................................. 155
C.5 Conclusions .................................................................................................... 157
D TAPE CASTING SLURRY COMPOSITION ............................................................ 161
E CR CONTAMINATION ON LSM82 .......................................................................... 162
F Kchem and Dchem at 750C ........................................................................................... 163
G SURFACE VARIATION OF LCCF AND LBCF ........................................................ 165
H COBALT OXIDE DISPERSION ON LSCF SURFACE ............................................ 166
LIST OF REFERENCES ................................................................................................. 167
BIOGRAPHICAL SKETCH.............................................................................................. 175

8
LIST OF TABLES
Table page 3-1 List of instruments for material characterizations.................................................. 56
5-1 Thermodynamic factors and (3-δ)/ δ of LSCF values at 800oC.52, 94 .................... 93
5-2 Characteristic dependencies of the apparent rate coefficients on pO2.95 ............ 93
6-1 Summary of tested ABO3 perovskite materials ................................................... 115
6-2 Chemical composition of Crofer22APU ............................................................... 115
6-3 Elemental atomic percents (%) of LSCF after heat treatment at 800oC for 50 hrs in the presence of Crofer22APU obtained using EDS .................................. 115
6-4 AES atomic percents of LSCF after heat treatment(HT) at 800oC for 50 hours 115
6-5 Elemental atomic percents of non-heat treated and heat treated samples* ...... 116
7-1 Samples tested in TPX......................................................................................... 136
7-2 Elemental atomic percents (%) of LSCF obtained using EDS ........................... 136
7-3 Elemental atomic percents (%) of LSCF after ECR test at 800oC for 400 hours obtained using AES ................................................................................... 136
A-1 Thermodynamic properties at 298.15K and 1bar................................................ 148
D-1 Tape casting slurry composition. ......................................................................... 161

9
LIST OF FIGURES
Figure page 2-1 Schematic diagram of the cross section of a planar type SOFC. ......................... 37
2-2 Typical current density and voltage characteristic of SOFC. jL is the limiting current density.43 .................................................................................................... 37
2-3 Contribution of chemical and electrical potential gradients to the equilibrium state at the electrochemical system. ..................................................................... 38
2-4 The electrochemical energy change from equilibrium state as a result of applying activation overpotential. .......................................................................... 39
2-5 Activation overpotential (ηact) as a function of current density and the effect of exchange current density (jo) on activation overpotential. .................................... 40
2-6 Schematic diagram of the cross section for (a) electrolyte and (b) anode supported cell. ........................................................................................................ 40
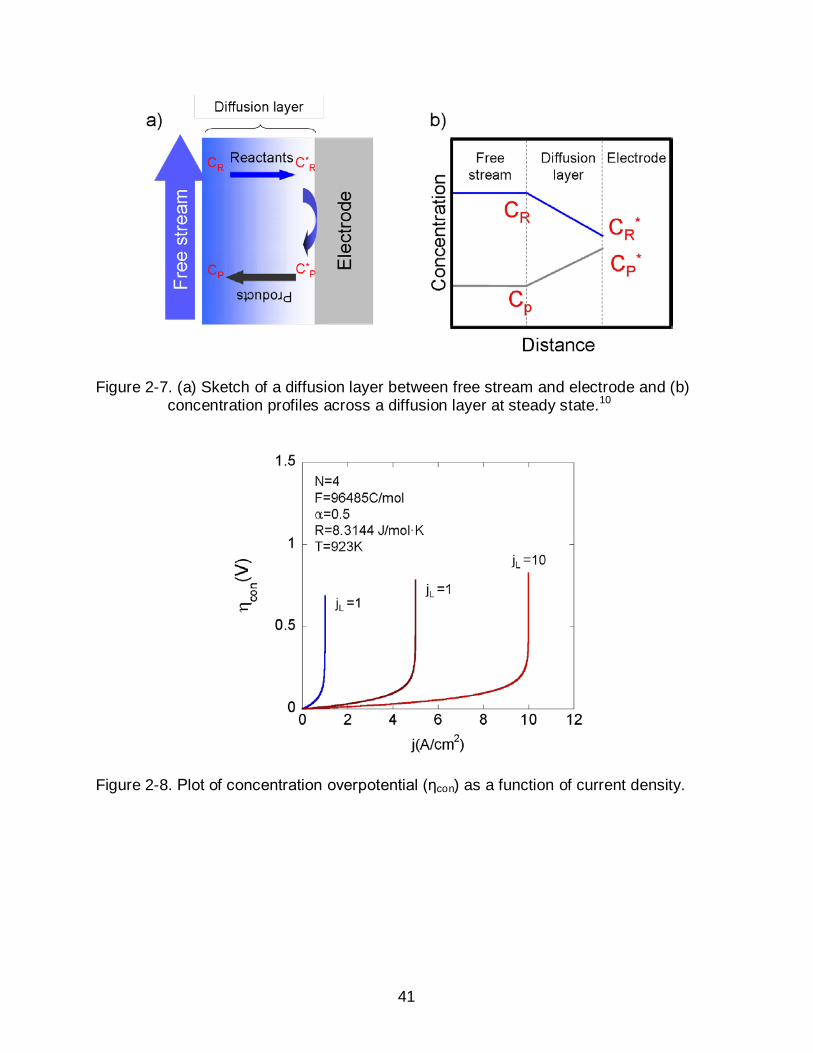
2-7 (a) Sketch of a diffusion layer between free stream and electrode and (b) concentration profiles across a diffusion layer at steady state.10 ......................... 41
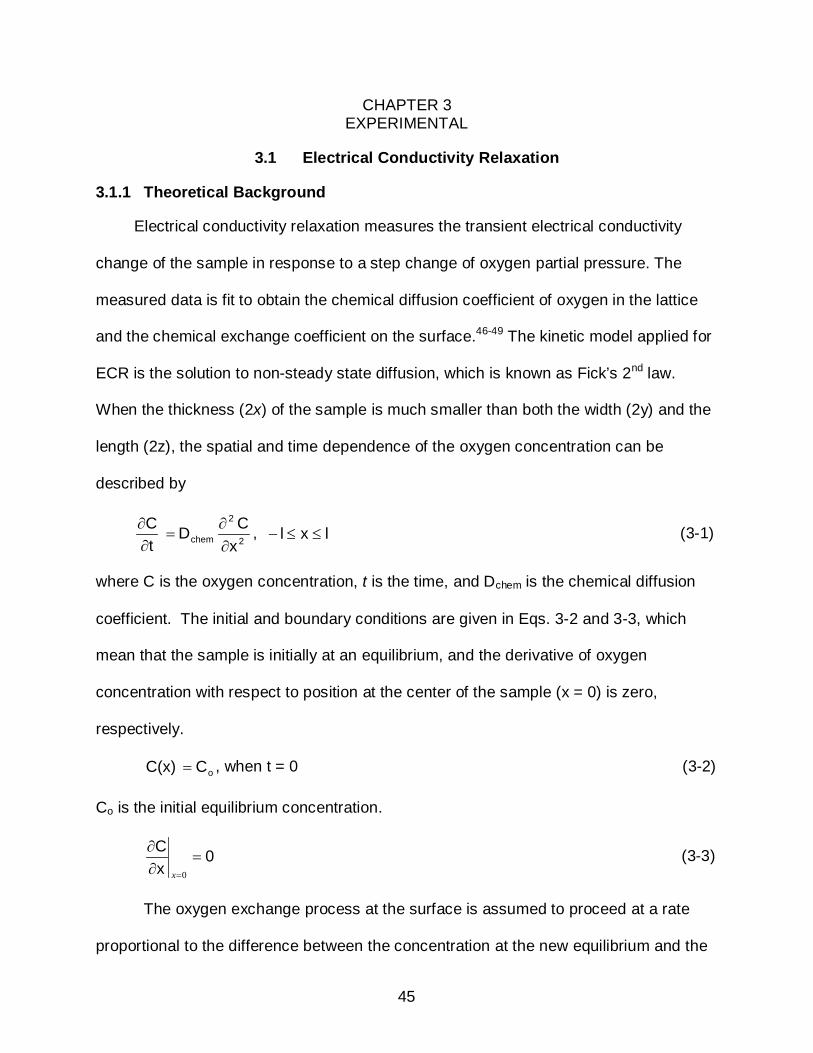
2-8 Plot of concentration overpotential (ηcon) as a function of current density. .......... 41
2-9 The efficiency (ε) and fuel utilization curve of an SOFC as a function of cell voltage (Ecell) at 800oC. 20 ...................................................................................... 42
2-10 Active reaction sites (painted in red) for oxygen reduction. (a) Pure electronic conductors and (b) mixed ionic and electronic conductors.23 ............................... 42
2-11 Unit cell of pseudo cubic perovskite of ABO3 perovskite ...................................... 43
2-12 Surface exchange coefficients of La0.7Ca0.3CrO3-δ as a function of mole fraction of oxygen vacancy.30................................................................................. 43
2-13 Effect of B site transition metals on La0.7Sr0.3BO3 cathode over potential.44 ........ 44
2-14 Oxygen nonstoichiometry (δ) of different LSCF composition as a function of temperature.45 ........................................................................................................ 44
3-1 Sample dimension and electrical connection between the sample and Lock in Amplifier. ................................................................................................................. 53
3-2 Schematic of the effect of a rough surface on the boundary conditions. ............. 53
3-3 The effect of roughness on the measurement of Dchem and Kchem (top), and surface roughness and actual surface area of samples (bottom). ....................... 54

10
3-4 Nyquist plot of an RC circuit................................................................................... 54
3-5 Core shell ionization and subsequent de-excitation via (c) Auger process and (d) characteristic X-ray emission.58........................................................................ 55
3-6 Schematic diagram of escape depth of Auger electron and characteristic X-ray.58 ....................................................................................................................... 55
4-1 Brief description of sample preparation procedure. .............................................. 68
4-2 Heat treatment set-up. ........................................................................................... 68
4-3 SEM micrographs of LSCF of (a) before heat treatment and after heat treatment at (b) 600oC, (c) 700oC, (d) 800oC and (e) 900oC for 50 hours in the absence of Fe-Cr alloy. .................................................................................... 69
4-4 Magnified images of the precipitates on LSCF surfaces after heat treatment at (a) 900oC for 50 hours, (b) 900oC for 50hours,(c) 860oC for 100 hours, and (d) 890oC for 100 hours.......................................................................................... 70
4-5 Differentiated Auger electron spectra of the (a) LaMLL, (b) SrLMM, (c) CoLMM, (d) FeLMM, and (e) OKLL before(blue solid line) and after (red dotted line) heat treatment at 800oC for 50 hours. ........................................................................... 71
4-6 TEM bright field image of the cross section of precipitate (left side) and EDS line scan of selected elements (right side) ............................................................ 71
4-7 SEM micrographs of LSCF surfaces after heat treatment for 50 hours at (a) 800oC/ N2, (b) 800oC/0.1% O2 (c) 890oC/N2 and (d) 890oC/0.1% O2 ................... 72
4-8 Schematic diagram of (a) the formation of oxygen vacancies and (b) formation of cation and anion vacancies simultaneously. .................................... 72
5-1 Sketch of deposition of nano size particles on cathode surface via wet impregnation. .......................................................................................................... 86
5-2 Schematic of AC impedance measurements. ....................................................... 86
5-3 Equivalent circuit to fit the measured impedance data. ........................................ 87
5-4 Current density and voltage measurement setup ................................................. 87
5-5 AC Impedance spectra of LSCF/GDC/LSCF symmetric cell. ............................... 88
5-6 Impedance plots for symmetric cell of plain LSCF electrode and Co impregnated LSCF electrode at 800oC in air. ....................................................... 88
5-7 Comparison of total electrode ASRs as a function of temperatures .................... 89

11
5-8 Measurement of cell voltage as a function current density at (a) 600oC, (b) 550oC and (c) 500oC. (d) Maximum power densities as a function of temperatures. ......................................................................................................... 90
5-9 Impedance of a button cell for plain LSCF and Co impregnated cathode at 600oC ...................................................................................................................... 90
5-10 The area specific resistance of electrode and electrolyte for plain and Co impregnated LSCF cathode cells. ......................................................................... 91
5-11 (a) SEM micrograph of LSCF/GDC/Ni-GDC button cell and (b) magnified images of Co impregnated LSCF after cell test. ................................................... 91
5-12 (a) Dchem and Kchem, (b) Dself and Ko, and (c) Dv at 800oC as a function of pO2. ... 92
6-1 Schematic of experimental design for heat treatment. ....................................... 109
6-2 XRD patterns of tested perovskite materials ....................................................... 109
6-3 Surfaces of LSCF (a) before and (b-d) after heat treatment in the presence of Crofer22APU at 800oC 50 hrs. The leading edge distances between LSCF and Crofer22APU sheets were (b) direct contact, (c) 0.1 cm, and (d) 0.5 cm. All images are the same scale. ............................................................................ 110
6-4 XRD patterns of fresh and heat treated LSCF on Crofer22APU sheet at 800oC for 50hours. (b ~ d) Enlarged patterns for better comparison. * is the XRD pattern measured using a low angle mode. ............................................... 111
6-5 Surfaces of LCCF, LBCF, LSCF and SCF after heat treatment in the presence of Crofer22APU at 800oC for 50 hours. The leading edge distances between samples and Crofer22APU sheet were 0.1 cm and 0.5 cm for the left and right hand sides, respectively. ................................................................ 112
6-6 Surfaces of tested after heat treatment in the presence of Crofer22APU at 600oC and 400oC (Leading edge distance 0.1 cm)............................................. 113
6-7 SEM micrographs of LSM surfaces of (a) before and (b) after heat treatment at 800oC for 50 hours in the presence of Crofer22APU (Leading edge distance 0.1 cm). .................................................................................................. 113
6-8 (a) SEM micrograph of LSM after heat treatment in the presence of Crofer22APU at 1050oC for 50 hours, and EDS spectra for (b) the flat region and (c) particle (Leading edge distance 0.1 cm). ................................................ 114
7-1 Equivalent circuit to fit the measured impedance data ....................................... 130
12
7-2 (a) A schematic of the experimental set up used for temperature programmed isotopic exchange and (b) the pre-heat treatment and measurement conditions ...................................................................................... 130
7-3 AC Impedance spectra of LSCF/GDC/LDCF in air at 800oC.............................. 131
7-4 Area specific resistance of LSCF at 800oC in air as a function of aging time (a) in the (a) presence and (b) absence of K type thermocouple in the reactor. .................................................................................................................. 131
7-5 (a) Normalized electrical conductivity relaxation curve after switching oxygen partial pressure from 43 to 67% at t =0 and (b) variation of relaxation curves with aging at 800oC. ............................................................................................. 132
7-6 Degradation of Kchem and Dchem in Cr contaminated environment at 800oC 132
7-7 Effect of total surface area on oxygen exchange profiles which are measured by TPX. SA refers to the surface area. ................................................................ 133
7-8 TPX result of heat treated LSCF at 800oC for 400 hours with and without exposure to Crofer22APU in comparison to fresh LSCF. ................................... 134
7-9 SEM micrographs of polished LSCF surfaces (a) before and (b) after ECR at 800oC for 400 hours. ............................................................................................ 135
8-1 Schematic of experimental set up. ...................................................................... 142
8-2 SEM micrographs of (a) as-polished and (b) heat treated LSCF in the presence of Crofer22APU. ................................................................................... 142
8-3 (a) LSM surface after heat treatment at 1050oC for 50 hours in the presence of Crofer22APU sheet. EDS spectra for (b) the newly formed particle after heat treatment and (c) as polished LSM sample. ............................................... 143
8-4 (a) Surface of LSM after heat treatment at 800oC for 50 hours in the presence of BaO powder and Crofer22APU. (b) Spot mode EDS spectra for the particle. ........................................................................................................... 144
B-1 Reactor flush time measurement set up using mass spectrometer. The flow from ECR to mass spec was limited to 30 sccm by the ball flow meter. ............ 150
B-2 Measured reactor flush time using mass spectrometer (a) and a fit using Eq B-3 (b). .................................................................................................................. 151
C-1 Time dependent relaxation profile of normal oxygen (16O), oxygen isotope (18O) and scrambled oxygen (16O+18O) at 700oC................................................ 158

13
C-2 Normalized concentrations of desorbed oxygen from the sample and incorporated oxygen ............................................................................................. 158
C-3 Kchem measured by ECR in this study and literatures 52, 94, converted using the thermodynamic factor, at 800oC. ................................................................... 159
C-4 Normalized relaxation curves of incorporated oxygen isotope at different temperatures. ....................................................................................................... 159
C-5 Arrhenius plot of surface exchange coefficient (pO2= 0.01) ............................... 160
E-1 (a) As-polished LSM82 surface and (b) heat treated LSM82 at 800oC for 50hrs in the presence of Crofer22APU. .............................................................. 162
F-1 Dchem and Kchem at 750oC as a function of pO2. ................................................... 163
F-2 Degradation of Kchem at 750oC. ............................................................................ 164
G-1 Differentiated Auger electron spectra for pre (blue) and post (red) heat treated samples at 800oC for 50 hrs. (a) LCCF and (b) LBCF ........................... 165

14
LIST OF ABBREVIATIONS
AES Auger electron spectroscopy
AFM Atomic force microscopy
ASR Area specific resistance
BET Brunauer, Emmett, and Teller surface area measurement
BOP Balance of Plant
DPB Di-n butyl phthalate
ECR Electrical conductivity relaxation
EDS Energy dispersive spectroscopy
FIB Focused Ion beam
GDC Gd2O3 doped CeO2
LBCF La0.6Ba0.4Co0.2Fe0.8O3
LCCF La0.6Ca0.4Co0.2Fe0.8O3
LSCF La0.6Sr0.4Co0.2Fe0.8O3
LSM La0.6Sr0.4MnO3
MIEC Mixed ionic and electronic conductor
PEG Polyethylene glycol
PVB Polyvinyl butyral
SCF SrCo0.2Fe0.8O3
SECA Annual solid state energy conversion alliance
SEM Scanning electron microscopy
SOFC Solid oxide fuel cell
TEM Transmission electron microscopy
TPB Three phase boundary
TPX Temperature programmed isotopic exchange
15
XRD X-ray diffraction
YSZ Y2O3 stabilized ZrO2
Δ pO2 Oxygen partial pressure gradient
ηact Activation overpotential
ηcon Concentration overpotential
ηohm Ohmic overpotential

16
Abstract of Dissertation Presented to the Graduate School of the University of Florida in Partial Fulfillment of the Requirements for the Degree of Doctor of Philosophy
FUNDAMENTAL UNDERSTANDING OF SURFACE CHARACTERSITIC AND CHROMIUM CONTAMINATION ON SOLID OXIDE FUEL CELL CATHODES
By
DONGJO OH
May 2010
Chair: Eric. D Wachsman Major: Materials Science and Engineering
A solid oxide fuel cell (SOFC) is a highly efficient and environmental-friendly
energy conversion device. But the progress toward commercialization continues to be a
slow struggle mostly due to high operation temperatures (800~1000oC). Lowering
operation temperatures can bring manufacturing costs down and provide high
conversion efficiency, and less difficulty in sealing and heat management. However,
substantial increase in internal losses, especially activation overpotential, lowers SOFC
performance with reduced operation temperatures. Because the activation overpotential
is mostly attributed to the oxygen reduction reaction (ORR) on the cathode, tremendous
works have been done in order to improve the cathode performance and understand the
ORR mechanisms and degradation mechanisms.
A heterogeneous reaction is primarily affected by the interaction between surface
and adsorbed species. Therefore, the surface composition and structure are one of the
most important factors affecting the cathode performance. Nevertheless, compositional
and structural variations of cathode surfaces at high temperatures have not gained
much attention. The objective of this study is, firstly, to better understand the surface

17
structure of cathode materials at high temperatures, and, secondly, to improve the
SOFC cathode performance based on this knowledge.
La0.6Sr0.4Co0.2Fe0.8O3 has been widely used for SOFC cathodes. Chemical and
structural variations of La0.6Sr0.4Co0.2Fe0.8O3 (LSCF) surfaces under oxidizing
environment were investigated. Cr contamination free LSCF showed the formation of
submicron-sized SrOx precipitates on the grain surface. This caused the reduced
concentration of transition metals in B sites. The addition of cobalt oxide on the surface
of LSCF was found to improve the cathode performance.
In contrast, Cr vapor deposition caused the formation of larger SrCrO4 particles on
the LSCF surface along grain boundaries, and Sr-deficient matrix. The structural
analysis identified the phase transition from rhombohedral to cubic perovskite in due to
Sr deficiency. A defect chemistry model was presented based on observed phenomena.
Electrical conductivity relaxation, AC impedance spectroscopy and temperature
programmed isotopic exchange (TPX) were conducted to study the impacts of Cr
contamination on the cathode performance.
It was found that Cr contamination was a chemical process for Co-Fe based
materials and an electrochemical process for Mn based materials. Unstable Co4+ and
Fe4+ lead to the formation of a nucleation agent for the chemical reaction. By contrast,
stable Mn4+ does not lead to the formation of a nucleation agent. At last, a new
hypothesis for the vaporization of Sr from La0.6Sr0.4Co0.2Fe0.8O3-δ (LSCF) was proposed
based on previous observations, and the evidence for Sr vaporization was provided.

18
CHAPTER 1 INTRODUCTION
1.1 Dual Challenges of Energy and Climate Change
The development of clean and sustainable energy sources has recently gained
speed due to increased worldwide attention on decreasing oil supplies and climate
change.1-3 Due to the potential worldwide impact from these problems, global efforts
are required. For example, there was an historic Summit on Climate Change in
Copenhagen in December 2009. 115 world leaders participated in the summit and
recognized the catastrophic impacts of climate change. The summit, however, ended in
failure without a strong agreement to reduce green house gas emission because of the
conflict of national interests. Decades of activities of wealthy countries are most likely
responsible for current climate change while the impacts from the regulations of green
house gas emission are more profound for poor countries. Green house gas emissions
are closely tied to national economic growth. Poor countries do not want to kick away
the ladder to reach wealthy countries by reducing emissions. Political efforts are the
best option to slow down the momentum for global warming in the short term. Long-
term solutions will require the development of clean and sustainable energy technology.
1.2 Solid Oxide Fuel Cell (SOFC)
A fuel cell is an energy conversion device that converts chemical fuels directly into
electrical energy, thus providing high efficiency and reduced emission of pollutants,
including green house gases.4-8 In addition, the absence of moving parts allows quiet
operation and long life times. The fuel cell is different from the rechargeable battery
since its size can range from small to large and it can be recharged quickly by refueling.
There are various fuel cell types such as polymers, aqueous alkalis, phosphoric acids,

19
molten carbonates, and solid oxides. The solid oxide fuel cell (SOFC), which uses a
solid oxide electrolyte, are marked by fewer problems in electrolyte management,
extended life time, highest efficiencies, low materials costs, fuel flexibility, and a high
grade of waste heat.9, 10 The SOFC has a high potential for application in stationary
power plants and auxiliary power units of vehicles.
There have been several successful demonstrations.6, 11 However, the progress
toward a commercialization of the SOFC is a slow struggle. One of the biggest hurdles
is high manufacturing costs. The high cost of SOFC stack is in part due to high
operating temperatures. SOFCs operate at higher temperatures than the other types
due to the solid oxide electrolyte, which leads to high material costs. The cost
breakdown model shows that the SOFC stack is the one of the major components,
while the remaining balance of plant (BoP) equipment such as fuel and air supply and
power electronic control system holds a minor share of the manufacturing cost.12 Below
800oC LaCrO3 based ceramic interconnects, which contributes over 80% of material
cost for the stack, can be replaced with cheaper metallic interconnects.13 Furthermore,
reduced operation temperatures improves thermodynamic conversion efficiency for
reformed gas and improves the sealing and heat management situation.9 However, a
rapid decrease in SOFC performance must be overcome in order to reduce operation
temperatures.
1.3 Objectives
A heterogeneous reaction is primarily determined by interaction between surface
and gas phases. As a result, surface chemical composition is an important factor
affecting the oxygen reduction reaction on cathodes. The chemical composition of metal
oxide surfaces may significantly differ from that of a bulk due to broken bonding at the

20
surface. The chemical variation of the surface of La0.6Sr0.4Co0.2Fe0.8O3-δ (LSCF), which
has been widely used for intermediate temperature (600-800oC) range SOFCs, was
investigated. It was found that the catalytically inactive elements tended to segregate to
the surface or near-surface region under oxidizing condition. Based on these results,
additional catalyst material was dispersed on the surface by impregnation and the effect
was examined.
In the meanwhile, utilization of metallic interconnects is advantageous for cost
reduction. However, most interconnects contain high concentration of Cr (10~30%) and
out-diffused Cr is known to be evaporated into CrO3 or CrO2(OH)2 at high temperatures
under oxidizing conditions.14 As these Cr vapor species are transported into the cathode
or electrolyte, they may affect the catalytic activity of cathodes. This study investigated
the effect of Cr contamination on the performance of La0.6Sr0.4Co0.2Fe0.8O3 cathode, and
the reaction mechanism between cathodes and Cr vapor species in order to provide
fundamental knowledge on the long term stability of SOFC.
21
CHAPTER 2 BACKGROUND
2.1 Basic Components and Operation Principle of SOFC
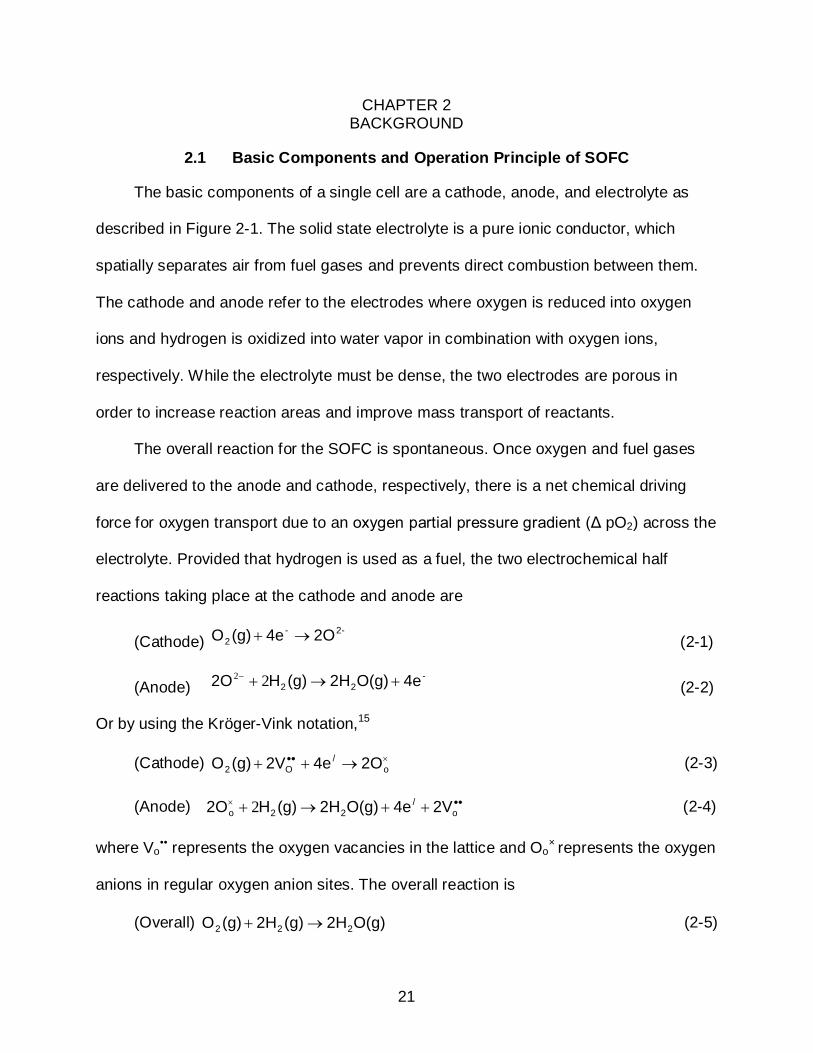
The basic components of a single cell are a cathode, anode, and electrolyte as
described in Figure 2-1. The solid state electrolyte is a pure ionic conductor, which
spatially separates air from fuel gases and prevents direct combustion between them.
The cathode and anode refer to the electrodes where oxygen is reduced into oxygen
ions and hydrogen is oxidized into water vapor in combination with oxygen ions,
respectively. While the electrolyte must be dense, the two electrodes are porous in
order to increase reaction areas and improve mass transport of reactants.
The overall reaction for the SOFC is spontaneous. Once oxygen and fuel gases
are delivered to the anode and cathode, respectively, there is a net chemical driving
force for oxygen transport due to an oxygen partial pressure gradient (Δ pO2) across the
electrolyte. Provided that hydrogen is used as a fuel, the two electrochemical half
reactions taking place at the cathode and anode are
(Cathode) -2-
2 2O4e(g)O →+ (2-1)
(Anode) -
22 4eO(g)2H(g)H2O +→+− 22 (2-2)
Or by using the Kröger-Vink notation,15
(Cathode) ו• →++ o/
O2 2O4e2V(g)O (2-3)
(Anode) ••× ++→+ o/
22o 2V4eO(g)2H(g)H2O 2 (2-4)
where Vo•• represents the oxygen vacancies in the lattice and Oo
× represents the oxygen
anions in regular oxygen anion sites. The overall reaction is
(Overall) O(g)2H(g)2H(g)O 222 →+ (2-5)

22
The internal flow of oxygen ions through the electrolyte must be balanced by the flow of
electronic charge through an external circuit, providing useful work.
2.2 SOFC Performance
2.2.1 Equilibrium Voltage
Theoretical thermodynamics limits the maximum voltage that a single cell can
produce. The chemical free energy change (ΔG) during the overall reaction in Eq. 2-5 is
(g)O(g)HO(g)HReactantProductRxn 222G2G2GGGΔG −−=−= ∑∑ (2-6)
where G is the chemical energy of corresponding species. Under a non-standard state,
G can be written as
p lnTRGG o ⋅⋅+= (2-7)
Go is the chemical energy at standard state, R is the gas constant, T is the absolute
temperature, and p is the pressure. The chemical energy change is associated with
electrical energy by
ΔGFnE ⋅⋅= (2-8)
where E is the voltage, n is the number of electron transferred during the reaction, and
F is Faraday’s constant. Thus the equilibrium voltage (EEq) can be written as16
⋅−= 2
HO
2OH0
Eq22
2T
ppp
lnnFRTEE
(2-9)
where ET0 is the voltage at standard state and temperature T, and T is the absolute
temperature. Eq. 2-9 is known as the Nernst equation. EEq has been also called
Nernstian voltage or open circuit voltage (OCV). At 800oC, the equilibrium voltage of a
singe cell is approximately 1.13 V (Appendix A).

23
At equilibrium, the SOFC produces the maximum output voltage but no current.
The cell voltage starts to decrease from the equilibrium voltage as the current density
increases due to losses from internal cell resistances. Figure 2-2 summarizes the
theoretic behavior of the current density and voltage. The key performance of an SOFC
is given by its power density, which is how much electrical energy an SOFC can
produce per unit time and unit area. There are four major internal losses: the activation
overpotential (ηact), the ohmic overpotential (ηohm), the concentration overpotential (ηcon),
and the loss (EL) due to the partial electronic conductivity of electrolytes or imperfect
gas sealing. The output voltage measured (V) can be written as
V= EEq - ηact- ηohm- ηcon-EL (2-10)
In the following section, the nature of internal losses is explained.
2.2.2 Activation Overpotential
Activation overpotential is attributed to the limit of electrode reaction kinetics. Even
though the reaction spontaneous (ΔGRxn < 0), the rate is finite because of the activation
barrier (EA). Only species that have gained sufficiently high energies to overcome the
activation threshold are able to jump to the next state as Figure 2-3a describes.17
According to statistical thermodynamics, the probability of finding a species (P) in the
activated state at temperature T is given by
RTEA
eP−
= (2-11)
where EA is the activation energy, R is the gas constant, and T is the absolute
temperature. The forward (JF) and backward reaction (JB) rate can be written by
RTE
FRF
A
efCJ−
⋅⋅= (2-12)

24
RTΔGE
BPB
RxnA
efCJ−
−⋅⋅= (2-13)
where CR and CP are the concentration of reactants and products at the surface,
respectively. fF and fB are the frequency of activated species moving forward and
backward, respectively. ΔGRxn is the chemical free energy change. The net reaction rate
(J) is
RTΔGE
BPRTE
FRBF
RxnAA
efCefCJJJ−
−−⋅⋅−⋅⋅=−= (2-14)
Since the reaction at electrode involves charge transfer, the rate is connected to current
density (j) by Faraday’s law (Eq. 2-15)
RTΔGE
BPRTE
FR
RxnAA
efCFnefCFnJFnj−
−−⋅⋅⋅⋅−⋅⋅⋅⋅=⋅⋅= (2-15)
where j is the current density, n is the number of electron transferred during the
reaction, and F is Faraday’s constant. In an electrochemical system, the accumulation
or depletion of charged species creates the electrical potential gradient (ΔΦ), and exerts
additional force on charged species as seen in Figure 2-3b by
ΔΦFnΔGGΔ ⋅⋅+=~
(2-16)
where G~ is the electrochemical potential. Eq. 2-15 then becomes
RTGnFΔGE
BPRTE
FR
RxnAA
efCFnefCFnJFnj∆+−
−−⋅⋅⋅⋅−⋅⋅⋅⋅=⋅⋅= (2-17)
When –ΔGRxn+ nFΔΦ = 0, the system reaches the equilibrium as Figure 2-3c describes
and no current flows as the rates of forward and backward reactions are the same. The
current density at equilibrium state is called the exchange current density (jo). That is,
RTE
FRbfo
A
efCFnjjj−
⋅⋅⋅⋅=== (2-18)

25
The rate of forward and backward reaction can be manipulated by adjusting the
electrical potential as described in Figure 2-4. The applied potential for the reduction of
the forward reaction is called activation overpotential (ηact). The current density as a
result of applying activation overpotential can be written as
−⋅=
⋅⋅⋅−−
⋅⋅⋅RT
ηFnα)(1RT
ηFnα
o
actact
eejj (2-19)
where α is the transfer coefficient, of which the value depends on the symmetry of the
activation barrier. Eq. 2-19 is known as the Butler-Volmer equation, which defines the
relation between the activation overpotential and current density. Figure 2-5 plots the
activation overpotential as a function of current density according to Eq. 2-19. In the
figure an increase in exchange current reduces the activation overpotential. Since the
exchange current density is a function of the reactant and activation barriers in Eq. 2-18,
improvement of the exchange current density can be achieved by using appropriate
catalysts and increasing reactant concentrations.
2.2.3 Ohmic Overpotential
The origin of ohmic overpotential is the ohmic resistances of cell components
against the transport of charged species. The overall ohmic overpotential can be
expressed by
ηohmic = ( ASRelectrodes + ASRelectrolyte + ASRcontact ) · j (2-20)
where j is the current density and ASR are the area specific resistances, which refers to
the resistance normalized by area. Generally the electrode is a good electronic
conductor, and so ohmic overpotential mostly arises from electrolyte. There is a
relationship between ASR, sample dimension and resistivity (Eq. 2-21).
ASR = R·A = ρ · L = (1/σ) · L (2-21)

26
where R is the resistance, A is the area, ρ is the resistivity, L is the thickness and σ is
the conductivity. Two approaches have been widely employed to reduce ohmic losses:
(1) reducing electrolyte thickness via thin film technique and anode supported cell
design (2) reducing resistivity by using faster oxygen ionic conductor. In an anode
supported cell, the anode provides the mechanical support so the electrolyte thickness
can be much thinner compared to an electrolyte supported cell as described in Figure 2-
6. In addition, some materials such as doped CeO2 and doped Bi2O3 have higher ionic
conductivity compared to stabilized ZrO2.18 Application of those materials for the
electrolyte has been demonstrated for high performance SOFC in the intermediate
temperature range.
Recently contact resistance has received growing attention. In the level of small
size cell test, the magnitude of contact resistance is insignificant. However, with larger
area stacked cell, the use of metal interconnects can lead to the formation of less
conductive secondary phases at the interface between electrode and interconnect.19
Moreover, unbalanced compressive pressure over a large area due to warpage may
lead to poor contact and a substantial increase in contact resistance. Proper system
design and development of contact materials to provide uniform and reliable electrical
contact is important to keep contact resistance mitigated in the large scale cell.
2.2.4 Concentration Overpotential
The theoretical calculation of activation overpotential and equilibrium voltage
assumes that the reactant concentration remains constant. However, as Figure 2-7a
decribes, the concentration in the region in the vicinity of electrode surface varies due to
electrode reaction, which consumes reactants and produces products. The loss due to
reduced concentration of reactants is the origin of concentration overpotential. Mass

27
transport through the diffusion layer is governed by a concentration gradient and
diffusivity. At a steady state condition as described in Figure 2-7b, the diffusion flux (Jdiff)
can be described using Fick’s 1st law (Eq. 2-22).
δCCD
ΔxΔCDJ R
*R
Diff−
−=−= (2-22)
where D is the apparent diffusivity of reactants in the diffusion layer, CR and CR* are the
concentrations of reactants in the free stream and at the electrode surface respectively,
and δ is the thickness of the diffusion layer.10
The diffusion flux reaches maximum value when CR* approaches zero. Since the
diffusion flux is associated with current density by Faraday’s law, the maximum or
limiting current density (jL) is
δCDFnj R
L ⋅⋅⋅= (2-23)
jL refers to the theoretical limit of current density that SOFC can produce.
Reduced concentration of reactants at the electrode surface leads to an increase
in activation overpotential and equilibrium voltage. The magnitude of the increase in
activation overpotential is
)(Cη)(Cη(act)η Ract*Ractcon −= (2-24)
Inputting the CR* into Eq. 2-19 gives
RTηFnα)(1
P
*P
oRT
ηFnα
R
*R
o
actact
eCCje
CCjj
⋅⋅⋅−−
⋅⋅⋅
⋅⋅−⋅⋅= (2-25)
At high current density, where depletion of reactants is significant when the forward
reaction on the electrode surface is substantially fast, 1RT
ηFnα act >>⋅⋅⋅
28
So Eq. 2-33 can be simplified into
⋅
⋅
⋅⋅⋅
≈ *Ro
Ract Cj
Cjln
FnαTRη (2-26)
Inputting Eq. 2-26 into 2-24 yields
⋅⋅⋅
= *R
Rcon C
ClnFnα
TR(act)η (2-27)
This can be expressed in terms of jL based on the relation ship between CR and jL in Eq.
2-22 and 2-23.
−⋅⋅
⋅=
jjjln
FnαTR(act)η
L
Lcon (2-28)
Meanwhile, equilibrium voltage also drops due to reduced concentration of
reactant. In the same manner above, this provides
−⋅
⋅=−=
jjjln
FnTR)(CE)(CE)(Eη
L
L*ReqReqeqcon (2-29)
The summation of Eq. 2-28 and 2-29 provides the overall concentration overpotential,
which can be written as
−
+
⋅⋅
=jj
jlnα11
FnTRη
L
Lcon (2-30)
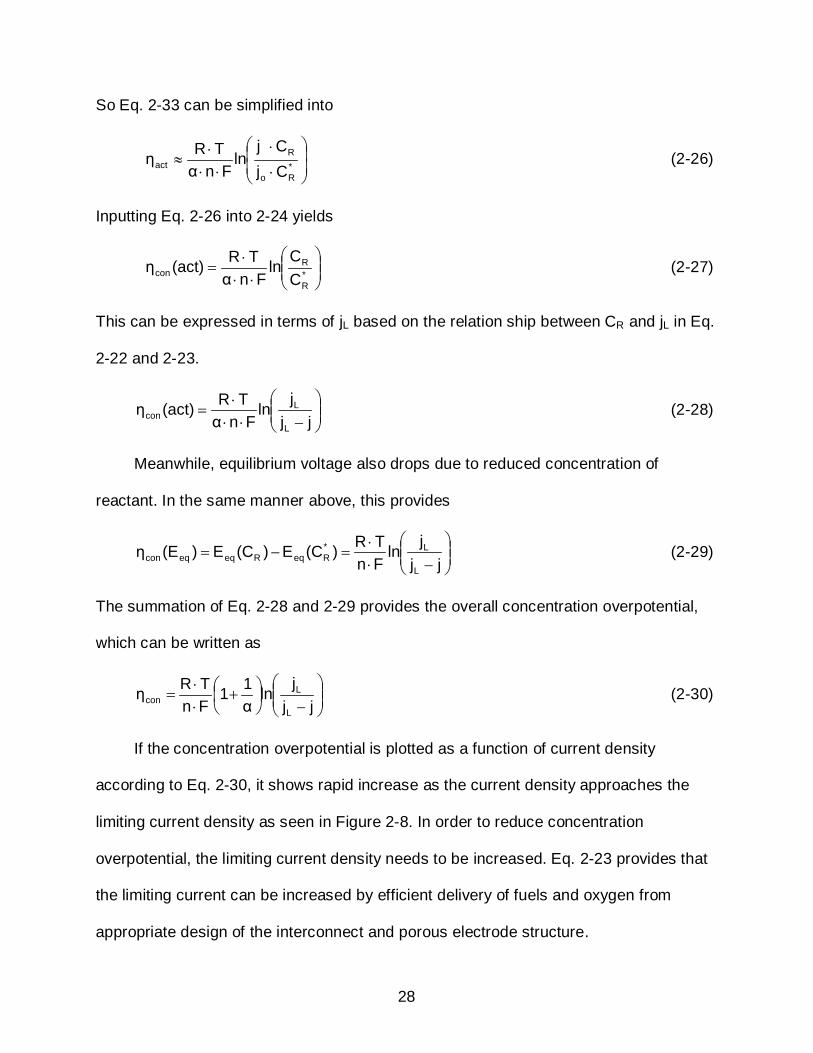
If the concentration overpotential is plotted as a function of current density
according to Eq. 2-30, it shows rapid increase as the current density approaches the
limiting current density as seen in Figure 2-8. In order to reduce concentration
overpotential, the limiting current density needs to be increased. Eq. 2-23 provides that
the limiting current can be increased by efficient delivery of fuels and oxygen from
appropriate design of the interconnect and porous electrode structure.
29
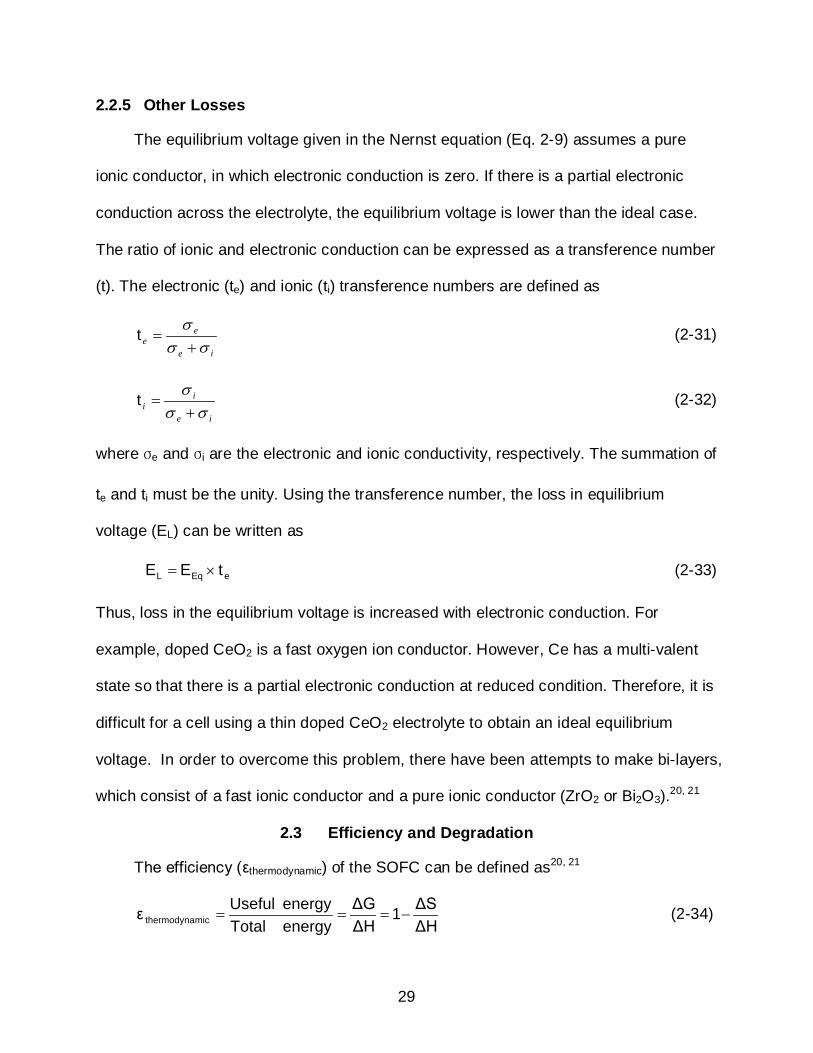
2.2.5 Other Losses
The equilibrium voltage given in the Nernst equation (Eq. 2-9) assumes a pure
ionic conductor, in which electronic conduction is zero. If there is a partial electronic
conduction across the electrolyte, the equilibrium voltage is lower than the ideal case.
The ratio of ionic and electronic conduction can be expressed as a transference number
(t). The electronic (te) and ionic (ti) transference numbers are defined as
ie
ee σσ
σ+
=t (2-31)
ie
ii σσ
σ+
=t (2-32)
where σe and σi are the electronic and ionic conductivity, respectively. The summation of
te and ti must be the unity. Using the transference number, the loss in equilibrium
voltage (EL) can be written as
eEqL tEE ×= (2-33)
Thus, loss in the equilibrium voltage is increased with electronic conduction. For
example, doped CeO2 is a fast oxygen ion conductor. However, Ce has a multi-valent
state so that there is a partial electronic conduction at reduced condition. Therefore, it is
difficult for a cell using a thin doped CeO2 electrolyte to obtain an ideal equilibrium
voltage. In order to overcome this problem, there have been attempts to make bi-layers,
which consist of a fast ionic conductor and a pure ionic conductor (ZrO2 or Bi2O3).20, 21
2.3 Efficiency and Degradation
The efficiency (εthermodynamic) of the SOFC can be defined as20, 21
ΔHΔS1
ΔHΔG
energy Totalenergy Usefulε micthermodyna −=== (2-34)

30
Using thermodynamic data in Table A-1, the efficiency of electrochemical conversion is
approximately 0.8 at 800oC. However, the efficiency in practical SOFC operation is
lower than that because of fuel utilization. When the cell voltage approaches EEq, fuel
consumption is reduced and unused fuels in the exhaust reduce the fuel-cell efficiency.
The fuel utilization efficiency (εfuel) can be written as
fuelfuel J
nFj/ ε = (2-35)
where j is the current density, Jfuel is the rate at which fuel is supplied to the cell. The
overpotential is .another factor affecting the efficiency. In the previous section, the cell
voltage was shown to decrease due to the overpotential. As a result the efficiency of the
SOFC is further decreased. The voltage efficiency (εvoltage) is defined as
Eqvoltage E
Vε = (2-36)
Generally the total cell efficiency is represented by the product of the thermodynamic,
fuel utilization, and voltage efficiency (Eq. 2-37).
ε= εthermodynamic · εvoltage · εfuel (2-37)
This indicates that the conversion efficiency depends on the operating conditions such
as current density or voltage. Figure 9 shows the efficiency of the cell as a function of
cell voltage. As the output voltage is close to the equilibrium voltage. The ideal
efficiency (εthermodynamic•εvoltage ) increases with increasing output voltage but the fuel
utilization efficiency drops as the voltage approaches to the equilibrium voltage.
Therefore, SOFC operation conditions need to be carefully decided to get high
efficiency.

31
The long term stability of the system is of the utmost importance for practical
application. Solid State Energy Conversion Alliance, which is initiated by Department of
Energy, has set 2.0% per 1000 hours as a degradation rate of SOFC system by 2010
and planned to further reduce the degradation rate. The power density of the cell is
current density multiplied by voltage. Therefore, the degradation rate of the cell is
proportional to increase in internal losses in constant current density mode. Since the
activation overpotential is the dominant factor affecting the overall internal loss,
reducing the degradation of cathodes is necessary to minimize the degradation of
SOFC.
2.4 Overview of Cathode
2.4.1 Requirements
The requirements for a SOFC cathode are22
• High catalytic activity for oxygen reduction. • High electronic and ionic conductivity under oxidizing condition • Chemical compatibility with neighboring cell components • Matched thermal expansion coefficient • Good stability at high temperature • Good adhesion to electrolyte surfaces • Simple fabrication • Adequate porosity • Low cost 2.4.2 Oxygen Reduction Process
In order for oxygen reduction to occur, reactants, electron (e-), oxygen vacancies
(Vo••) and oxygen gas molecule (O2), must be supplied simultaneously according to Eq.
2-3. Thus, reduction of oxygen takes place at the three phase boundary (TPB) of air,
cathode, and electrolyte phase as Figure 2-10a shows. The overall reaction of oxygen
reduction may involve a number of elementary steps such as

32
• Gas phase diffusion • Adsorption of molecular oxygen (O2(g)+Sad→O2 (ad) ) • Dissociation into atomic oxygen (O2(ad)→2O (ad) ) • Charge transfer (O(ad)+2e/→2O// (ad) ) • Incorporation of oxygen ions (O// + VO
••→Oox )
Determining the rate limiting step for the oxygen reduction reaction may provide
guidelines for improving catalytic activity. A number of papers have been devoted to the
mechanistic study of oxygen reduction.23-25 However, there still remains uncertainty and
disagreement about the sequence of steps as well as the rate determining step. This is
in part due to differences in cathode compositions and microstructure, complex reaction
process, heterogeneity of surface, and experimental conditions between different
research groups.25, 26
2.4.3 Mixed Ionic Electronic Conductor
For a pure electronic conductor such as Pt or La1-xSrxMnO3 (LSM), the number of
active reaction sites is proportional to three phase boundary (TPB) length. One method
to reduce cathode overpotential is to extend the TPB length by mixing the electronically
conductive cathode and ionically conductive electrolyte, which is called a composite
cathode. Another method is to replace the electronic conductor with a mixed ionic and
electronic conductor (MIEC) material which conducts oxygen ions as well as electrons.
Due to the large amount of oxygen vacancies of the electrodes, oxygen gas can be
reduced into ions over the electrode surface, giving rise to extensive active reaction
sites (Figure 2-10b). A composite cathode between the MIEC and electrolyte was found
to further improve oxygen reduction kinetics.27
ABO3 perovskite-structured oxides are typical MIECs, wherein A site and B site
cations have 12 and 6 coordination to oxygen ions, respectively. The ideal structure of
33
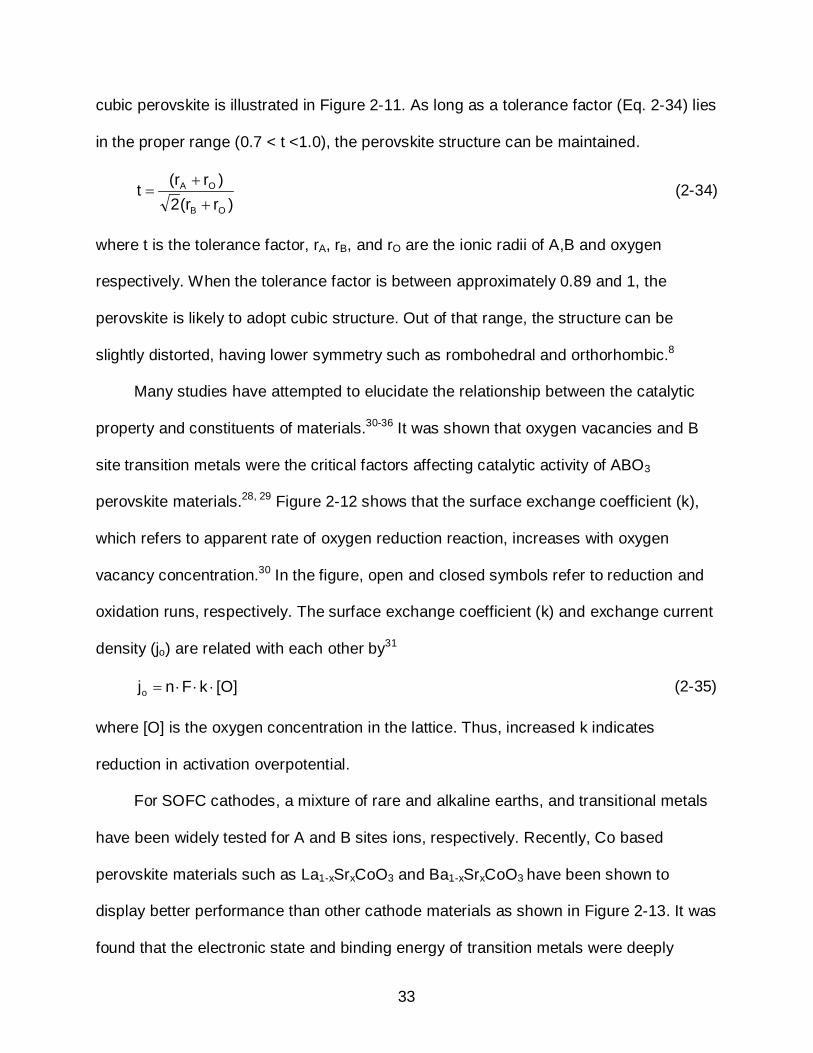
cubic perovskite is illustrated in Figure 2-11. As long as a tolerance factor (Eq. 2-34) lies
in the proper range (0.7 < t <1.0), the perovskite structure can be maintained.
)r(r2)r(rtOB
OA
+
+= (2-34)
where t is the tolerance factor, rA, rB, and rO are the ionic radii of A,B and oxygen
respectively. When the tolerance factor is between approximately 0.89 and 1, the
perovskite is likely to adopt cubic structure. Out of that range, the structure can be
slightly distorted, having lower symmetry such as rombohedral and orthorhombic.8
Many studies have attempted to elucidate the relationship between the catalytic
property and constituents of materials.30-36 It was shown that oxygen vacancies and B
site transition metals were the critical factors affecting catalytic activity of ABO3
perovskite materials.28, 29 Figure 2-12 shows that the surface exchange coefficient (k),
which refers to apparent rate of oxygen reduction reaction, increases with oxygen
vacancy concentration.30 In the figure, open and closed symbols refer to reduction and
oxidation runs, respectively. The surface exchange coefficient (k) and exchange current
density (jo) are related with each other by31
[O]kFnjo ⋅⋅⋅= (2-35)
where [O] is the oxygen concentration in the lattice. Thus, increased k indicates
reduction in activation overpotential.
For SOFC cathodes, a mixture of rare and alkaline earths, and transitional metals
have been widely tested for A and B sites ions, respectively. Recently, Co based
perovskite materials such as La1-xSrxCoO3 and Ba1-xSrxCoO3 have been shown to
display better performance than other cathode materials as shown in Figure 2-13. It was
found that the electronic state and binding energy of transition metals were deeply
34
correlated to catalytic activities.24, 32, 33 There is no chemical reaction between Co based
perovskite cathodes and Gd doped CeO2 (GDC) electrolytes, but a higher thermal
expansion coefficient (TEC) than GDC electrolyte is a critical problem.34-36 The TEC
mismatch can lead to a substantial increase in interfacial resistance due to de-
lamination. In order to match the TEC between the cathode and electrolyte while
maintaining the catalytic activity, a mixture of Co and Fe in B site has been tested.
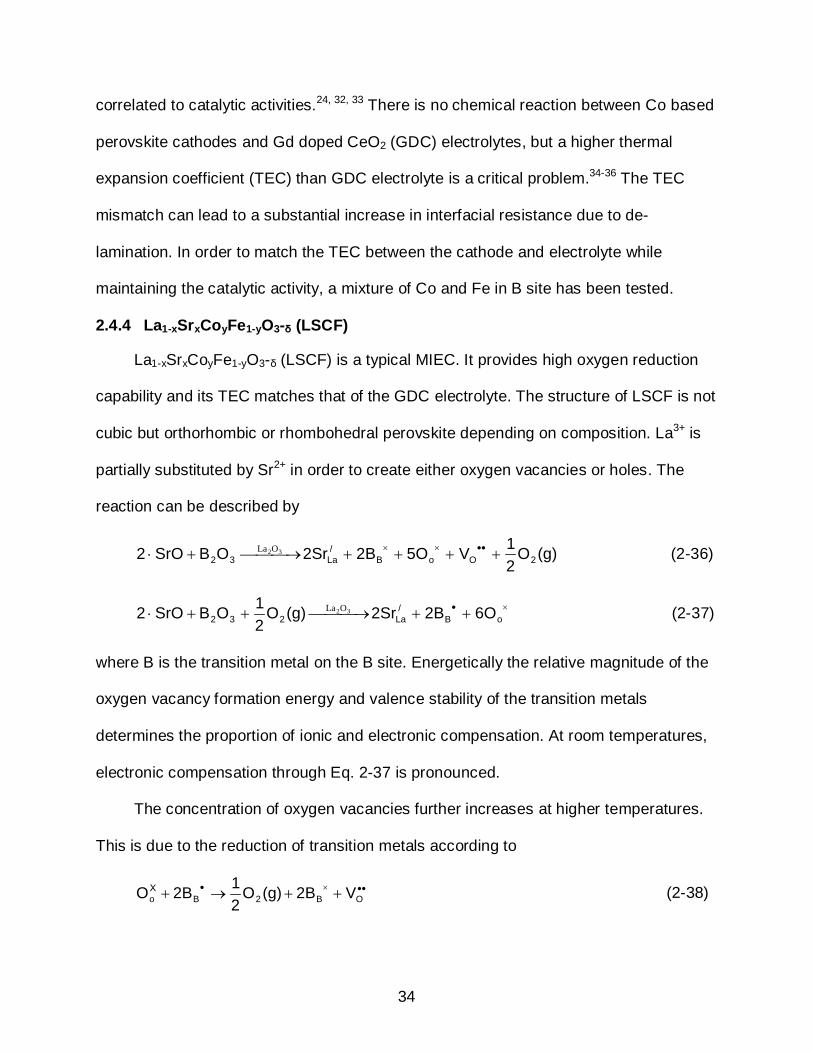
2.4.4 La1-xSrxCoyFe1-yO3-δ (LSCF)
La1-xSrxCoyFe1-yO3-δ (LSCF) is a typical MIEC. It provides high oxygen reduction
capability and its TEC matches that of the GDC electrolyte. The structure of LSCF is not
cubic but orthorhombic or rhombohedral perovskite depending on composition. La3+ is
partially substituted by Sr2+ in order to create either oxygen vacancies or holes. The
reaction can be described by
(g)O21V5O2B2SrOBSrO2 2OoB
/La32 ++++ →+⋅ ••××32OLa (2-36)
ו ++ →++⋅ oB/
La232 6O2B2Sr(g)O21OBSrO2 32OLa (2-37)
where B is the transition metal on the B site. Energetically the relative magnitude of the
oxygen vacancy formation energy and valence stability of the transition metals
determines the proportion of ionic and electronic compensation. At room temperatures,
electronic compensation through Eq. 2-37 is pronounced.
The concentration of oxygen vacancies further increases at higher temperatures.
This is due to the reduction of transition metals according to
••×• ++→+ OB2BΧo V2B(g)O
212BO (2-38)

35
The stability of the transition metals and bonding strength between metal-oxide ions
determines the onset temperatures at which oxygen nonstoichiometry rapidly
increases.37 The effect from the amount of dopant on the A and B sites on the
concentration of oxygen vacancies is shown in Figure 2-14. It shows that oxygen
vacancy concentration in LSCF increases with amount of the Sr dopant. An increase
with temperatures represents the reduction of transition metals.
While LSCF offers improved power densities than pure electronic conductors, it
does not exhibit stable performance over long term period of time. Simner el al.38 found
the degradation of cell performance during 500 hours at 750oC as a result of substantial
increase in electrode resistance. Similar degradation behavior of LSCF cathode was
also reported by Kim et al.39 In a practical application, SOFCs need to be operated in
“stack”, in which metal interconnects connects several single cells in series to produce
higher voltage. Since such metal interconnects contain high concentration of Cr, the
interaction between LSCF cathode and Cr vapor from metal interconnects can lead to
more significant degradation in cathode performance.40
2.5 Summary
This chapter covers basic background and operation principle of SOFCs. The key
performance of SOFC is explained by voltage and current density characteristic,
followed by various overpotentials. During SOFC operation, the activation overpotential,
which is primarily determined by the oxygen reduction reaction on cathodes, is the
dominant loss. Therefore, improvement of catalytic activity and stability of cathode
materials can contribute to enhancement in cell performance. As s mixed ionic
electronic conductor (MIEC), LSCF cathodes have been widely used for a solid oxide
fuel cell cathode due to the high ionic and electronic conducing properties22, 41 They

36
have also exhibited enhanced catalytic activity for oxygen reduction compared to the
pure electronic conductor.42 However, an attempt to reduce operating temperatures
causes the reduced rate of oxygen reduction reaction (ORR), which results in a
substantial increase in activation overpotential. In addition, LSCF cathodes exhibited
substantial degradation during the long term test.
Materials performance and properties are deeply related to materials structures.
Especially, a heterogeneous reaction is primarily affected by surface structure and
composition. Therefore, investigation of the chemical and structural variations of LSCF
at high temperatures can contribute to better understand degradation mechanisms and
improve cathode performance.

37
Figure 2-1. Schematic diagram of the cross section of a planar type SOFC.
Figure 2-2. Typical current density and voltage characteristic of SOFC. jL is the limiting current density.43
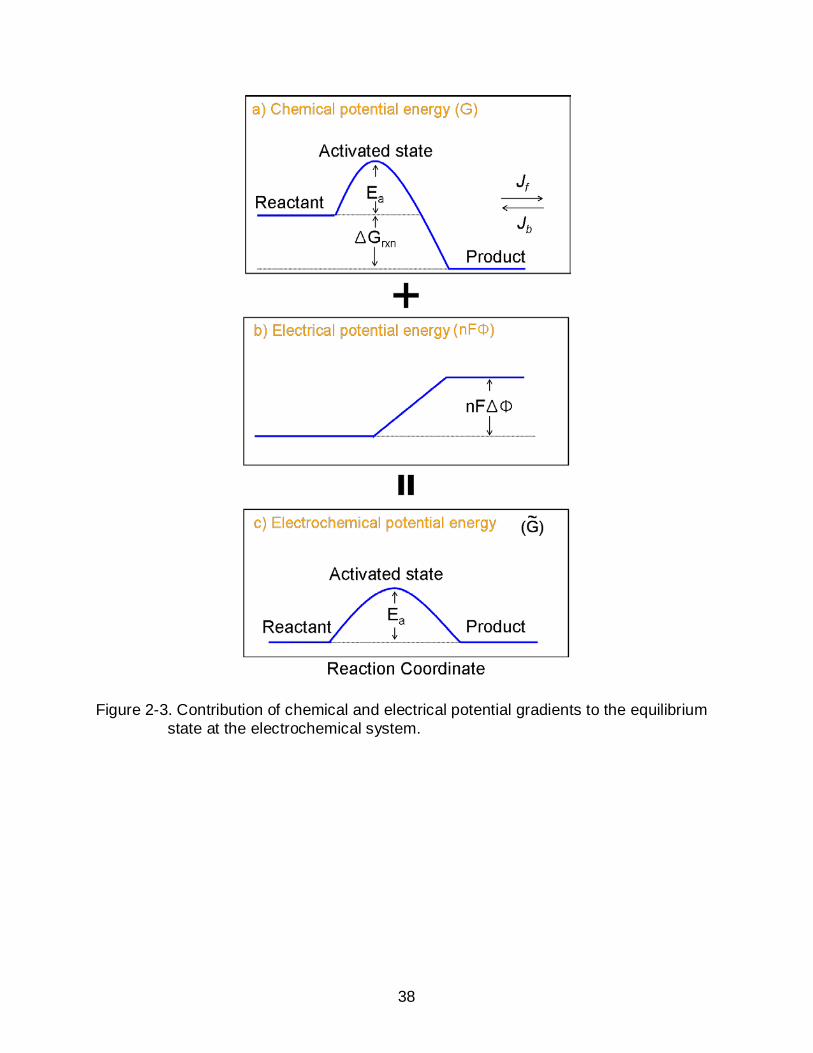
38
Figure 2-3. Contribution of chemical and electrical potential gradients to the equilibrium state at the electrochemical system.

39
Figure 2-4. The electrochemical energy change from equilibrium state as a result of applying activation overpotential.

40
Figure 2-5. Activation overpotential (ηact) as a function of current density and the effect of exchange current density (jo) on activation overpotential.
Figure 2-6. Schematic diagram of the cross section for (a) electrolyte and (b) anode supported cell.
41
Figure 2-7. (a) Sketch of a diffusion layer between free stream and electrode and (b) concentration profiles across a diffusion layer at steady state.10
Figure 2-8. Plot of concentration overpotential (ηcon) as a function of current density.

42
Figure 2-9. The efficiency (ε) and fuel utilization curve of an SOFC as a function of cell voltage (Ecell) at 800oC. 20
Figure 2-10. Active reaction sites (painted in red) for oxygen reduction. (a) Pure electronic conductors and (b) mixed ionic and electronic conductors.23

43
Figure 2-11. Unit cell of pseudo cubic perovskite of ABO3 perovskite
Figure 2-12. Surface exchange coefficients of La0.7Ca0.3CrO3-δ as a function of mole fraction of oxygen vacancy.30

44
Figure 2-13. Effect of B site transition metals on La0.7Sr0.3BO3 cathode over potential.44
Figure 2-14. Oxygen nonstoichiometry (δ) of different LSCF composition as a function of temperature.45
45
CHAPTER 3 EXPERIMENTAL
3.1 Electrical Conductivity Relaxation
3.1.1 Theoretical Background
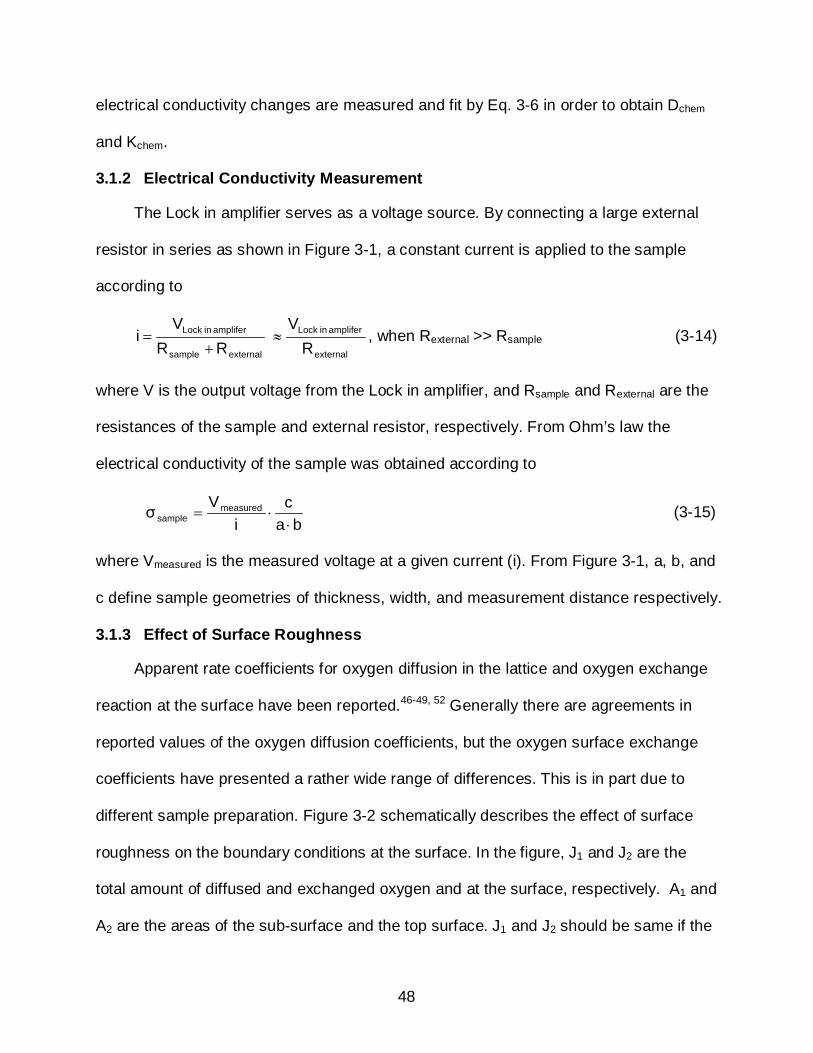
Electrical conductivity relaxation measures the transient electrical conductivity
change of the sample in response to a step change of oxygen partial pressure. The
measured data is fit to obtain the chemical diffusion coefficient of oxygen in the lattice
and the chemical exchange coefficient on the surface.46-49 The kinetic model applied for
ECR is the solution to non-steady state diffusion, which is known as Fick’s 2nd law.
When the thickness (2x) of the sample is much smaller than both the width (2y) and the
length (2z), the spatial and time dependence of the oxygen concentration can be
described by
2
2
chem xCD
tC
∂∂
=∂∂ , lxl ≤≤− (3-1)
where C is the oxygen concentration, t is the time, and Dchem is the chemical diffusion
coefficient. The initial and boundary conditions are given in Eqs. 3-2 and 3-3, which
mean that the sample is initially at an equilibrium, and the derivative of oxygen
concentration with respect to position at the center of the sample (x = 0) is zero,
respectively.
oC C(x) = , when t = 0 (3-2)
Co is the initial equilibrium concentration.
0xC
=∂∂
=0x
(3-3)
The oxygen exchange process at the surface is assumed to proceed at a rate
proportional to the difference between the concentration at the new equilibrium and the

46
transient surface concentration. This provides boundary condition at the surface (Eq. 3-
4).
)C(CKxCD tchem
lx
chem −=∂∂
− ∞
±=
(3-4)
Kchem is the chemical exchange coefficient that refers to the apparent surface reaction
coefficient. On the basis of initial and boundary conditions, the mathematical solution to
Eq. 3-1 is given by50
m22
m
2chem
2mm
1m0
0t
α cos)LL(α
)l
tDα( exp)l
xα( cosL2 - 1
C - CC - C
⋅++
⋅⋅−⋅
⋅⋅⋅
⋅= ∑∞
=∞
(3-5)
l is half the thickness of the sample. Subscripts 0, t, and ∞ represent initial, transient
and final equilibrium times, respectively. mα is the positive root of the transcendental
equation LDKltanαα
chem
chemmm =
⋅= . The integration of Eq. 3-5 in the range of -l ≤ x ≤ l
provides the total amount of diffusing oxygen species over the entire sample.
αL)L(α
)l
tDα( expL2 - 1
MMg(t) 2
m22
m
2chem
2m2
1m
t
⋅++
⋅−⋅⋅
⋅== ∑∞
=∞
(3-6)
tM and ∞M are the total amount of diffused components up to time t, and at the new
equilibrium, respectively.
For (A3+1-xA2+
x)BO3 (B=Co, Fe, Ni), the relative mass change can be correlated
to the electrical conductivity change via defect chemistry. The overall electro-neutrality
condition is
][Vp][V][V][Dn O///
B///A
/3
••+=+++ + (3-7)

47
where n and p are the electron and hole concentrations, respectively. [D/], [VA3+///],
[VB///], and [Vo
••] are the concentrations of A site dopant, A site vacancy, B site vacancy
and oxygen vacancy, respectively. In the high pO2 egion, where [D/] >> n+[VA3+///]+
[VB///], Eq. 3-7 can be written in a simpler form.51
][Vp][D O/ ••+= (3-8)
Since [D/] is constant, the following equation is satisfied.
ppp
0
0t
po]
o[V]
o[V
o]
o[V
t]
o[V
−−
=−
−
∞••
∞••
••••
(3-9)
The electrical conductivity of a p-type conductor is defined as
μFpσ ⋅⋅= (3-10)
where σ is the electrical conductivity, F is Faraday’s constant, and μ is the mobility.
Assuming that the mobility is constant in small Δ pO2 ranges, Eq. 3-9 can be written as
ppp
0
0t
0
0t
po
]o
[V]o
[V
o]
o[V
t]
o[V
σσ
σσ
−−
=−−
=−
−
∞∞••
∞••
••••
(3-11)
From the site relationship of oxygen vacancies and oxygen in the lattice (Eq. 3-12),
[Vo••]+ [Oo
x] = 3 (3-12)
Mt / M∞ can be re-written in terms of an electrical conductivity change as given by
ppp
MM
0
0t
0
0tt
σσ
σσ
po
]o
[V]o
[V
o]
o[V
t]
o[V
o]
o[O]
o[O
o]
o[O
t]
o[O
−−
=−−
=−
−=
−
−=
∞∞••
∞••
••••
×∞
×
××
∞
(3-13)
Technically measurement of electrical conductivity changes is easier and more accurate
compared to measurement of small mass changes at high temperatures. Therefore, the
48
electrical conductivity changes are measured and fit by Eq. 3-6 in order to obtain Dchem
and Kchem.
3.1.2 Electrical Conductivity Measurement
The Lock in amplifier serves as a voltage source. By connecting a large external
resistor in series as shown in Figure 3-1, a constant current is applied to the sample
according to
external
amplifer in Lock
externalsample
amplifer in Lock
RV
RR
Vi ≈
+= , when Rexternal >> Rsample (3-14)
where V is the output voltage from the Lock in amplifier, and Rsample and Rexternal are the
resistances of the sample and external resistor, respectively. From Ohm’s law the
electrical conductivity of the sample was obtained according to
bac
iVσ measured
sample ⋅⋅= (3-15)
where Vmeasured is the measured voltage at a given current (i). From Figure 3-1, a, b, and
c define sample geometries of thickness, width, and measurement distance respectively.
3.1.3 Effect of Surface Roughness
Apparent rate coefficients for oxygen diffusion in the lattice and oxygen exchange
reaction at the surface have been reported.46-49, 52 Generally there are agreements in
reported values of the oxygen diffusion coefficients, but the oxygen surface exchange
coefficients have presented a rather wide range of differences. This is in part due to
different sample preparation. Figure 3-2 schematically describes the effect of surface
roughness on the boundary conditions at the surface. In the figure, J1 and J2 are the
total amount of diffused and exchanged oxygen and at the surface, respectively. A1 and
A2 are the areas of the sub-surface and the top surface. J1 and J2 should be same if the

49
desorption is neglect. For a flat surface, the area of A1 and A2 are equivalent, and
therefore this requirement is same as the boundary condition used in the derivation of
kinetic model for electrical conductivity relaxation (Eq. 3-4). By contrast, A2 is much
larger than A1 when the surface is rough. In this case, Eq. 3-4 is no longer adequate but
the boundary condition needs to include the contribution of the higher surface area. As
a result, when the sample having a rough surface is tested, it is likely to be an
overestimated value in the form of K·A2/A1.
Figure 3-3 compares Dchem and Kchem of polished and unpolished LSCF samples at
800oC. The sample dimension was approximately 2x2x20 mm3, therefore the two
dimensional diffusion model was applied to fit the data. The pO2 steps were
10→21→44% with a total flow rate of 500 ccm. While Dchem is roughly constant between
the two samples, Kchem from the unpolished sample is approximately five times higher
than that of the polished sample. The surface area of the unpolished sample, which was
measured using atomic force microscope, was five times larger than that of the polished
sample. It shows that an overestimated value due to surface roughness is close to a
factor of A2/A1. Therefore, for accurate measurement of the apparent oxygen exchange
coefficient, the sample must have a flat surface, or the surface roughness and area
need to be measured.
3.2 Electrochemical Impedance
Electrochemical impedance spectroscopy is a widely used technique for de-
convoluting different reaction processes.53 It measures a time dependent current in
response to a small sinusoidal voltage perturbation. In a complex plane, impedance (Z)
is given by

50
imgrealoiφ
o ZZ ) isinφ(cosφZeZZ +=+== (3-16)
where Zo is the ratio of Vo and io, the amplitude of voltage and current, respectively. Φ is
the phase shift, Zo·cosϕ is a real component, and i·Zosinϕ is an imaginary component.
A plot of Zreal on the x-axis and Zimg on the y-axis is called a Nyquist plot. Figure 3-4
shows an example of a Nyquist plot for an electric circuit, in which a resistor and a
capacitor are connected in parallel. The capacitor and resistor are pure imaginary and
real components, respectively. The capacitor works as a short circuit at high
frequencies and current flows via the resistor at low frequencies. In the intermediate
frequency range, impedance is the sum of imaginary and real components. It is
important to understand the behavior of an RC circuit because many electrochemical
reactions exhibit similar behavior.
3.3 Temperature Programmed Isotopic Exchange
In a dynamic equilibrium, the net flux of oxygen exchange between metal oxide
and surrounding gas is zero, but there is continuous exchange. Temperature
programmed isotopic exchange technique (TPX) is designed to distinguish lattice
oxygen, which comes out of a sample, from gaseous oxygen, which incorporates into a
sample, in a dynamic equilibrium condition. This is done by using oxygen isotope (18O2)
in conjunction with a mass spectrometry (MS). One can assume that a pre-heat treated
sample in normal oxygen (16O2) possesses only 16O in the lattice and surface. If the feed
stream is switched from 16O2 to 18O2 at room temperature, 18O2 incorporates into the
sample while 16O2 comes out of the lattice. However, due to slow exchange kinetics,
essentially no change in MS signals is observed at room temperatures, and thereby the
input concentration of 18O2 is the same as the output concentration of 18O2. Since the

51
oxygen exchange kinetics are a function of temperature, oxygen exchange reaction
increases with increasing temperatures. The onset temperature is called the
temperature where the concentration of 18O2 substantially drops. At this temperature, the
MS signal of 16O2 and 16O18O (scrambled species) starts to increase. In TPX analysis,
comparison of the catalytic activity for oxygen reduction is made by comparing the onset
temperature. A lower onset temperature implies a higher catalytic activity. Details of
theoretical background can be found elsewhere.54 Note that TPX tests a powder
sample. Therefore, it can avoid the impact of electrical connections and sintering, which
may affect surface catalytic activity.55 In addition, TPX is a surface sensitive technique
due to high surface area of powder sample.
3.4 Materials Characterizations
The instruments which were used in this study for material characterizations and
their purpose of usage are listed in Table 3-1. Two chemical analyses were applied in
this study: Energy dispersive spectroscopy and Auger electron spectroscopy. While the
former provides the chemical composition of a bulk, the latter gives a surface
composition. As the Core-level electron is removed by X-ray photo ionization or
electron-impact ionization (Figure 3-5a), the atom is left in an excited state, and
subsequently de-excitation occurs (Figure 3-5b). The energies of electrons in the shells
are quantized and therefore, the energy difference between electron shells is a specific
value for each element. In the Auger process, an outer level electron fills the core level
and the excess energy ejects another electron in an outer level with a specific kinetic
energy (Figure 3-5c). This electron is called Auger electron.56-58 In the characteristic X-
ray process, the difference in the energy level is emitted as a photon of electromagnetic
radiation (Figure 3-5d). The Auger electron and characteristic X-ray present

52
substantially different escape depth as illustrated in Figure 3-6. As an Auger electron
has low kinetic energy, an escape depth of Auger electron is less than a few nano
meters. Therefore, Auger electron spectroscopy, which is based on Auger process, is a
surface sensitive technique. And Energy dispersive spectroscopy, which is based on
characteristic X-ray process, provides bulk composition.

53
Figure 3-1. Sample dimension and electrical connection between the sample and Lock in Amplifier.
Figure 3-2 Schematic of the effect of a rough surface on the boundary conditions.

54
Figure 3-3. The effect of roughness on the measurement of Dchem and Kchem (top), and
surface roughness and actual surface area of samples (bottom).
Figure 3-4. Nyquist plot of an RC circuit.

55
Figure 3-5. Core shell ionization and subsequent de-excitation via (c) Auger process
and (d) characteristic X-ray emission.58
Figure 3-6. Schematic diagram of escape depth of Auger electron and characteristic X-ray.58

56
Table 3-1. List of instruments for material characterizations. Instrument Purpose Model and company
AES Chemical analysis of top surface Perkin-Elmer PHI 660 Scanning Auger Multiprobe
AFM Surface roughness Digital Instruments Dimension 3100
BET Surface area of powder Quantachrome NOVA 1200
FIB Preparation of TEM specimen Dual Beam - Focused Ion Beam (FIB) Strata DB 235
SEM Surface morphology JEOL JSM 6400 / 6335F
TEM Analysis of the cross section for nano precipitate JEOL TEM 2010F
EDS Chemical analysis
XRD Crystal structure of secondary phases and synthesized powders
XRD Philips APD 3720 Philips MRD X'Pert System

57
CHAPTER 4 MECHANISTIC UNDERSTANDING OF LSCF DEGRADATION
4.1 Introduction
La0.6Sr0.4Co0.2Fe0.8O3 (LSCF) has been widely used as a solid oxide fuel cell
cathode. Due to partial substitution of Sr for La and reduction of transition metals, it has
a substantial oxygen vacancy concentration at high temperatures, and therefore exhibits
high ionic and electronic conductivity. However, several studies report that Sr in LSCF
tends to segregate to electrode surfaces or interfaces. 38, 59-61 As a result, the transition
metal concentration was found to substantially decrease in the outermost surface
layers. It is generally believed that B site transition metals play a critical role for catalytic
activity of ABO3 perovskite materials,26, 66-68 and heterogeneous interaction is primarily
determined by surface composition and structure.62 Consequently, the formation of Sr
enriched layer on LSCF surfaces can be a potential degradation mechanism of LSCF
cathode-based cells.
Long-term stability is an important requirement for the commercialization of
SOFCs. Thus, the development of LSCF for a practical SOFC cathode requires an
understanding of Sr enrichment behavior on the surface. In the work presented herein,
surface chemical compositional changes of LSCF at high temperatures were
investigated by Auger electron spectroscopy (AES) and transmission electron
microscopy (TEM). Dense and polished LSCF samples were examined to clearly
identify surface morphological changes.
4.2 Experimental
4.2.1 Sample preparation
Figure 4-1 describes the sample preparation procedure. A dense LSCF sample
58
was prepared for analysis. It was prepared by pressing La0.6Sr0.4Co0.2Fe0.8O3-δ powder
(Praxair Specialty Ceramics, USA) uni-axially and sintering a pellet at 1400oC for 4
hours in air. The density of the sintered body measured by the Archimedes method was
~ 97% of the theoretical value (6.36 g/cm3). The sintered body was cut and then
polished with a series of SiC papers and diamond abrasives (Leco) down to 1 μm.
Several samples were mounted on a holder, which has a flat surface, using crystal bond.
Crystal bond is an adhesive that melts at around 100oC, so it needed to be heated on a
hot plate prior to application. After polishing, samples were detached either by re-
heating above 100oC or submerging in acetone. By doing so, sample handling was
much easier and multiple samples were polished simultaneously. All samples were
cleaned with DI water and acetone before heat treatments. Final sample thicknesses
were around 1 mm.
4.2.2 Heat treatment
Samples were located on a quartz plate in the middle of a quart reactor as seen in
Figure 4-2. They were exposed to stagnant air between 600-900oC in the absence of
Fe-Cr alloy. As K-type thermocouples (TC) could be a source of Cr contamination, the
thermocouple was placed outside of the quartz reactor. Heat treatment was conducted
for 50 hours and 100 hours in air, and heating and cooling rates were established at
5oC/min. LSCF was also heat treated in N2 and 0.1% O2 for 50 hrs at 800 and 890oC.
Gas flow rate was controlled by mass flow controller (MKS) and the total flow rate was
fixed at 10 SCCM.
4.2.3 Characterization
X-ray diffraction patterns of the samples before and after heat treatment were
measured (Philips APD 3720) with Cu-Kα radiation (λ=1.54 Å). Low angle mode XRD
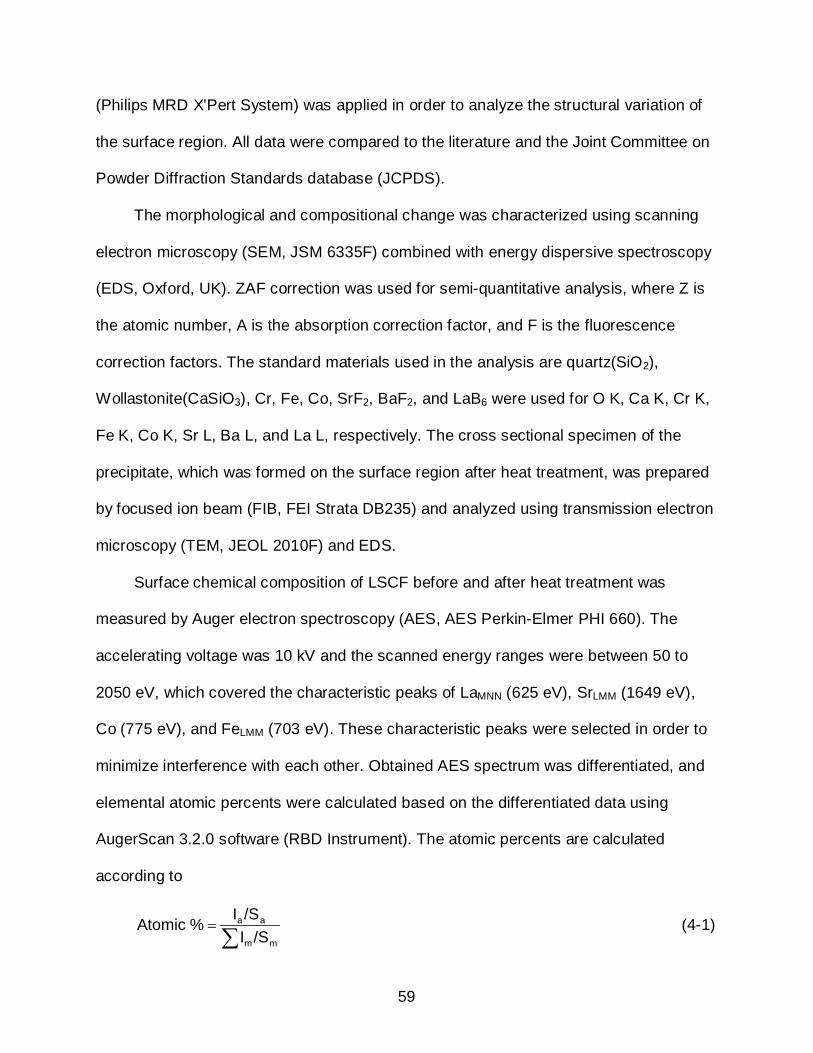
59
(Philips MRD X'Pert System) was applied in order to analyze the structural variation of
the surface region. All data were compared to the literature and the Joint Committee on
Powder Diffraction Standards database (JCPDS).
The morphological and compositional change was characterized using scanning
electron microscopy (SEM, JSM 6335F) combined with energy dispersive spectroscopy
(EDS, Oxford, UK). ZAF correction was used for semi-quantitative analysis, where Z is
the atomic number, A is the absorption correction factor, and F is the fluorescence
correction factors. The standard materials used in the analysis are quartz(SiO2),
Wollastonite(CaSiO3), Cr, Fe, Co, SrF2, BaF2, and LaB6 were used for O K, Ca K, Cr K,
Fe K, Co K, Sr L, Ba L, and La L, respectively. The cross sectional specimen of the
precipitate, which was formed on the surface region after heat treatment, was prepared
by focused ion beam (FIB, FEI Strata DB235) and analyzed using transmission electron
microscopy (TEM, JEOL 2010F) and EDS.
Surface chemical composition of LSCF before and after heat treatment was
measured by Auger electron spectroscopy (AES, AES Perkin-Elmer PHI 660). The
accelerating voltage was 10 kV and the scanned energy ranges were between 50 to
2050 eV, which covered the characteristic peaks of LaMNN (625 eV), SrLMM (1649 eV),
Co (775 eV), and FeLMM (703 eV). These characteristic peaks were selected in order to
minimize interference with each other. Obtained AES spectrum was differentiated, and
elemental atomic percents were calculated based on the differentiated data using
AugerScan 3.2.0 software (RBD Instrument). The atomic percents are calculated
according to
∑=
mm
aa
/SI/SI%Atomic (4-1)

60
where I is the peak intensity and S is the relative elemental sensitivity factor for the
Auger line used. Relative sensitivity factors, which are provided by RBD instruments,
are 0.06, 0.045, 0.19, 0.13, and 0.35 for LaMNN, SrLMM, FeLMM, CoLMM and OKLL,
respectively. This study calculated the relative change based on the ratio of atomic
percents before and after heat treatment which were normalized by oxygen
concentration. The enrichment factor was calculated according to
HT preoxygencation
HT postoxygencation
]X/ [X]X/ [X
(E.F.) Factor Enrichment = (4-2)
4.3 Results and Discussion
In Figure 4-3 are representative SEM micrographs of the LSCF surfaces before
and after heat treatment in air. Before heat treatment, LSCF exhibited dense and flat
surfaces as shown in Figure 4-3a. However, after heat treatment, submicron
precipitates were formed on the surfaces. These precipitates were more pronounced
and exhibited higher areal density with increasing heat treatment temperatures from
600-900oC. Interestingly, in the figure, the precipitates were not formed along the grain
boundaries but on grain surfaces at 800 and 900oC. The magnified images in Figure 4-4
show more clearly the shapes of the precipitates, which are different from grain to grain.
The typical shapes of precipitates are rods, triangles, or irregular polygons. For the rod
type, the direction of the precipitate was either well-aligned in one direction or vertically
crossed. The precipitates were found not only on polished surfaces but also on
unpolished surfaces as shown in Figure 4-4d. It shows that the direction of precipitates
was well aligned along the facets of the grains. This observation indicates that the
formation of precipitates corresponds to the surface orientation of the underlying grains.
The characteristic of rod type precipitates is close to the Widmanstatten morphology, of

61
which an incoherent curved interface exhibits a fast growth rate while a semi-coherent
facet has slower growth.63 However, the formation of precipitates observed in this study
is different from the Widmanstatten morphology in that the precipitates grow out of the
surface.
Chemical analysis was conducted using EDS after heat treatment and the results
were compared to the as-fresh sample. As Table 4-1 shows, EDS data indicates
roughly constant atomic percents of all elements before and after heat treatment. This
indicates that the bulk composition remains unchanged and the formation of precipitates
is limited to the top surface or near the surface region. AES analysis was performed to
investigate the compositional change of the surface region. Figure 4-5 shows
differentiated AES spectra of LaMNN, SrLMM, CoLMM, FeLMM and OKLL for as-fresh and heat
treated LSCF. After heat treatment, a substantial increase in peak intensity was
observed in Sr while that of La, Co and Fe was decreased. The elemental atomic
percents obtained from AES are given in Table 4-1. While the concentration of cations
varied, the oxygen concentration remained essentially constant after heat treatment.
The enrichment factor, which represents the relative change of concentrations in the
surface region, is calculated based on Eq. 4-2. Sr concentration doubled while Fe
concentration halved. It should be stressed that the concentration of Co, which has
been thought to be catalytically active, was not detected on the surface.
Chemical analysis of the precipitate was conducted using transmission electron
microscopy (TEM). Figure 4-6a is a bright field image of the cross section of the
precipitate on the LSCF surface. The TEM micrograph shows the presence of a
transition region below the precipitate on the top surface, which is marked by the

62
brightest region in the figure. The EDS line scan was performed from the inner bulk
region to the precipitate on the surface as shown in Figure 4-6a. It shows that the
intensity of Sr peak increases in the precipitate region compared to that in bulk and the
oxygen peak decreases slightly. By contrast, the peak intensities of other cations
decrease substantially in the precipitate. This means that the precipitate is a Sr-O. The
decrease of Sr intensity in sub-surface regions indicates that Sr diffuses from the sub-
surface region to the surface region.
Figure 4-7 shows the pO2 dependence of the formation of precipitates. Samples
were heat treated at 800oC for 50 hrs in pure N2 and 0.1% O2, which was balanced by
Ar. Compared to heat treated samples in air at the same temperature (Figure 4-3d), the
formation of precipitates was reduced considerably in 0.1% O2 (Figure 4-7a). And the
formation of precipitates was not found in pure N2 (Figure 4-7b). Such trends were
consistently observed when samples were heat treated at higher temperatures in same
environments. Figures 4-7c and 4-7d show the heat treated LSCF surface at 890oC in
N2 and 0.1% O2, respectively. It shows also the reduced formation of Sr-O precipitates.
This indicates that in addition to temperatures, the oxygen partial pressure is a critical
factor affecting the formation of Sr-O precipitates on LSCF surfaces.
Sr enrichment on the LSCF surface after heat treatment at 800oC is evident. As a
result, the transition metal concentration decreases. This is in good agreement with
previous works. Bucher et al.59 found Sr enrichment on the surfaces of LSCF after
measuring surface exchange coefficients at 600-700oC. Similarly, Heide60 observed Sr
enrichment on La1-xSrxCoyFe1-yO3 surfaces after heat treatment at 1000oC in 1% O2.
While these previous studies on Sr enrichment mostly postulated the formation of SrO

63
layers on the surface based on the results from chemical analysis, this study clearly
shows the formation of submicron-sized Sr-O precipitates on the surface using SEM
and TEM. The formation of AO precipitates on the surface was previously shown in
other ABO3 perovskite materials,64-66 but the formation of the Sr-O precipitate on LSCF
surfaces was visualized for the first time in the present study.
Generally, elemental enrichment and precipitation is related to defect structures,
especially the presence of point defects.74-77 As La1-xSrxCoyFe1-yO3 exhibits a
substantial oxygen deficiency above 600oC,34, 45 oxygen vacancies may contribute to Sr-
O precipitation. Even though oxygen vacancies improve the oxygen reduction reaction
on the surface and oxygen diffusion in the lattice, their presence reduces the stability of
the structure by increasing repulsive forces between like atoms. The effect of oxygen
vacancies on bonding strength was experimentally demonstrated by Wang et al.67 They
found that the elastic modulus of ceria decreases drastically as the oxygen vacancy
concentration increases. This is because oxygen vacancies weaken the attractive
forces. The formation of oxygen vacancy in the lattice can be written as Eq. 4-3 using
Kroger-Vink notation.
•••× +↔+ o2o V(g)O212hO (4- 3)
Figure 4-8a shows the schematic of the (100) plane of a cubic perovskite structure.
Due to originally broken bonding, atoms on the surface are unstable compared to those
in bulk. If oxygen ions are removed from the lattice according to Eq. 4-3, the shielding
effect between cations will be removed and atoms in the surface region will become
more unstable. Thus, in order to reduce the excess surface energy corresponding to
unstable surfaces, it is probable that some cations near the surface region precipitates

64
on the surface, yielding cation vacancies in the lattice as demonstrated in Figure 4-8b.
As the binding of A-O is generally weaker than the binding energy of B-O in the ABO3
perovskite structure, the precipitation of A site cations will be more energetically
favorable than the precipitation of B site cations.68, 69 Therefore, enriched Sr in LSCF is
likely to precipitate into Sr-O to reduce the excess surface energy caused by oxygen
vacancy formation.
LSCF was heat treated at the same temperatures over various pO2 ranges from
pure N2 to air. At lower pO2, LSCF exhibits a higher oxygen vacancy concentration,
resulting in increased probability for precipitate formation. However, LSCF shows
reduced formation of Sr-O precipitates with decreasing pO2. A similar pO2 dependence
of elemental enrichment was reported by Dufour et al.70 They found that the ratio of Ba
to Ti on the surfaces of BaTiO3 became doubled after heat treatment at 1300oC in air,
but the ratio was decreased to 1.4 when surfaces were heat treated in N2. This indicates
reduced Ba enrichment at lower pO2. Szot et al.68 studied the nature of the surface layer
in ABO3 perovskite structure materials such as SrTiO3 and observed the formation of A-
O layers at elevated temperatures, which is known as the Ruddlesden-Popper (RP)
phase.71 They propose that the RP phase is likely to be more stable at high pO2 and
therefore the formation of A-O layers can be inhibited at reduced pO2. The formation of
Sr-O precipitates on LSCF surfaces can be understood by a two-step mechanism:(i) the
formation of oxygen vacancies, and (ii) subsequent precipitation of enriched Sr. Step (i)
increases with decreasing pO2 but step (ii) occurs at oxidizing conditions, i.e. at high
pO2. As LSCF exhibits a high oxygen vacancy concentration in oxidizing conditions, the
overall reaction is likely to be controlled by step (ii). Konigstein et al.72 reported that

65
thermodynamically stable compounds of Sr-O are SrO and SrO2. The step (ii) for Sr-O
precipitation, then, can be written as
•++→+ 2hVSrO(ppt)(g)O21Sr ///
La2/
La (4-4)
••++→++ o///
La2xO2
/La VV(ppt)SrOO(g)O
21Sr (4-5)
The crystal structure of precipitates was analyzed using low angle XRD but the
presence of either SrO or SrO2 could not be identified due to the limited amount of the
secondary phase. So, it can not be concluded decisively which reaction is more
dominant. However, the reaction increasing hole concentration is likely to be
thermodynamically unfavorable because the formation of holes increases the
concentrations of Co4+ and Fe4+, which are unstable species at high temperatures.8 A
further systematic quantum mechanical study is required to conclude the dominant
reaction mechanism.
Recently, Simner et al.38 measured power density of anode-supported cells utilizing
LSCF cathodes over long term periods at 750oC and observed decrease in the cell
performance. Similarly, Tietz et al.73 also reported substantial degradation of LSCF
cathode based cells during long term testing. Obviously the formation of Sr-O
precipitates on the surfaces of LSCF cathodes can contribute to such degradation of
cell performance during the test. The oxygen reduction reaction at the cathode consists
of a series of elementary steps such as
i. Gas phase diffusion
ii. Adsorption of molecular oxygen (O2(g) + sad→O2 (ad) )
iii. Dissociation into atomic oxygen (O2(ad) → 2O (ad) )

66
iv. Charge transfer (O(ad)+2e/→2O// (ad) )
v. Incorporation of oxygen ions (O// + VO••→ Oo
x)
where sad is the oxygen adsorption sites on the surface. Sr-O is an electronically
insulator.74 The collected data of the surface exchange coefficients and the oxygen
tracer diffusion coefficients of various metal oxides evidence that the electronic species
on the surface are essential for oxygen exchange reaction.42 It is expected that the
formation of Sr-O precipitate on the surface of LSCF forms a passive layer, reducing the
concentration of electronic species and inhibiting oxygen reduction reaction, especially
charge transfer. In addition, for ABO3 perovksite materials, it is generally believed that B
site transition metals play a critical role for catalytic activity.26, 66-68 Takeda et al.44
measured the cathodic polarization of La0.7Sr0.3MO3 (M=Cr, Mn, Fe, Co) and found that
La0.7Sr0.3CoO3 exhibited the lowest polarization at 800 oC in air. Kilner et al.31
investigated the dependence of surface exchange coefficients (Ko) on the composition
of La0.8Sr0.2Mn1-yCoyO3 and found that Ko increased with increasing Co concentration.
Kan et al.54 studied the effect of catalyst impregnation on the catalytic activity for oxygen
exchange for La0.8Sr0.2MnO3(LSM). They found oxygen exchange reaction was
improved with the addition of Co on LSM surfaces via wet impregnation. The results in
literatures indicate that Co is a catalytically active element for oxygen reduction reaction.
Consequently, deficiency of catalytically active transition metals due to Sr enrichment is
likely to further reduce oxygen reduction reaction. Thus, Sr-O precipitation on LSCF
surfaces can cause substantial increases in non-ohmic resistance. It can also lead to
increases in ohmic resistance if Sr is enriched at the interface of LSCF and other cell
components, forming secondary phases such as SrZrO3 or SrCrO4.46, 85

67
4.4 Conclusions
LSCF surfaces exhibit substantial compositional variations in oxidizing condition at
elevated temperatures. This heterogeneous surface structure involves Sr enrichment
and subsequent precipitation into submicron sized Sr-O on the surface. A two-step
mechanism was proposed for Sr-O precipitation: (i) the formation of oxygen vacancies,
and (ii) subsequent precipitation of enriched Sr. As LSCF exhibits high oxygen
nonstoichiometry at elevated temperatures, it is likely that step (ii) controls the overall
reaction. Sr-O is electrically insulating and Sr enrichment results in the depletion of
transition metals. Consequently, the heterogeneous surface structure can lead to
substantial degradation of the surface catalytic activity for LSCF.

68
Figure 4-1. Brief description of sample preparation procedure.
Figure 4-2. Heat treatment set-up.

69
Figure 4-3. SEM micrographs of LSCF of (a) before heat treatment and after heat treatment at (b) 600oC, (c) 700oC, (d) 800oC and (e) 900oC for 50 hours in the absence of Fe-Cr alloy.
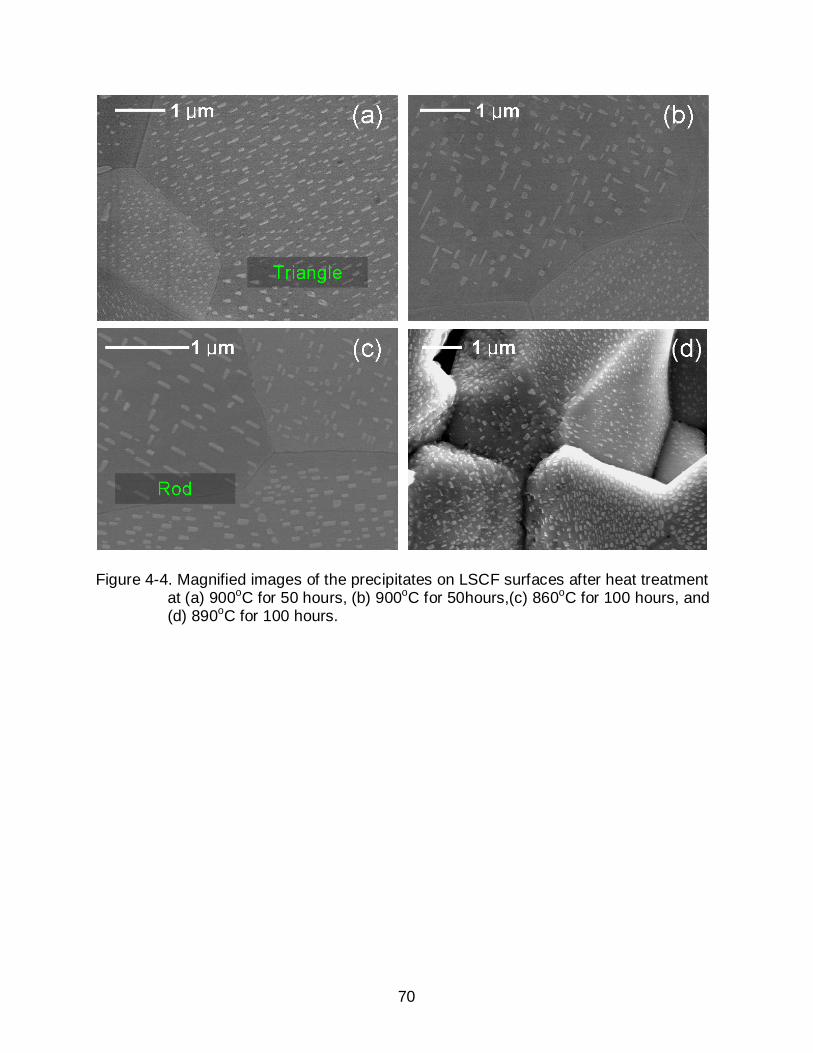
70
Figure 4-4. Magnified images of the precipitates on LSCF surfaces after heat treatment at (a) 900oC for 50 hours, (b) 900oC for 50hours,(c) 860oC for 100 hours, and (d) 890oC for 100 hours.
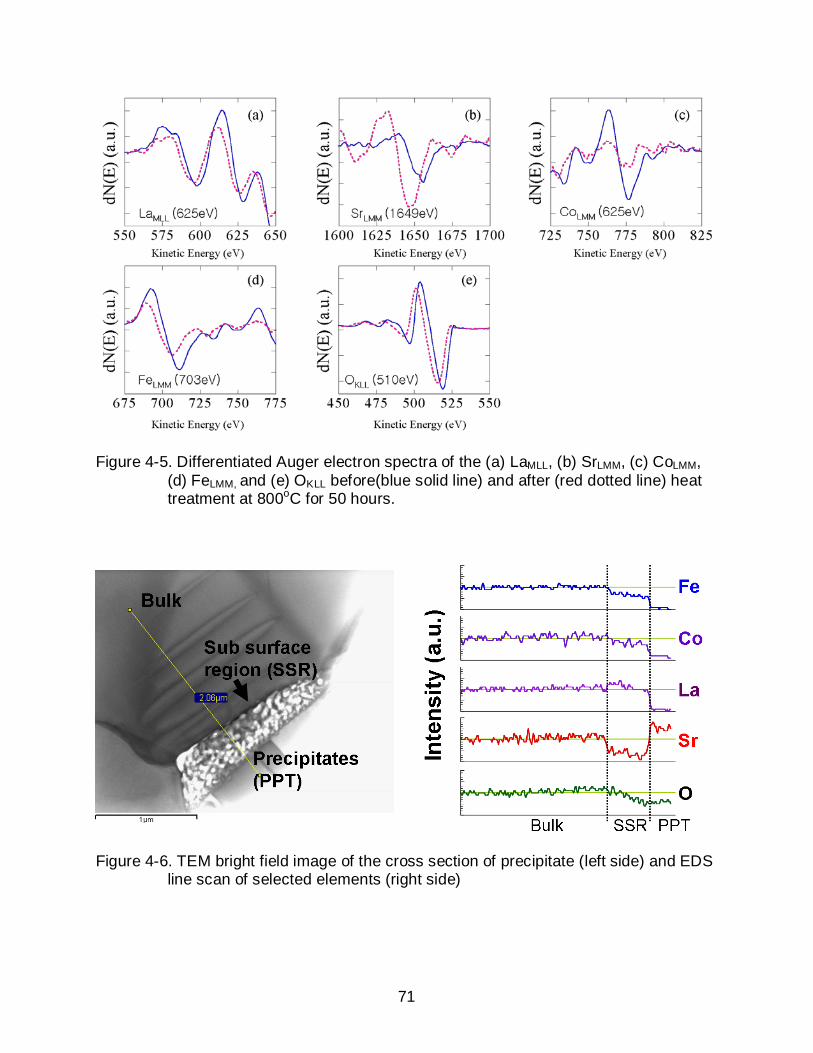
71
Figure 4-5. Differentiated Auger electron spectra of the (a) LaMLL, (b) SrLMM, (c) CoLMM, (d) FeLMM, and (e) OKLL before(blue solid line) and after (red dotted line) heat treatment at 800oC for 50 hours.
Figure 4-6. TEM bright field image of the cross section of precipitate (left side) and EDS
line scan of selected elements (right side)
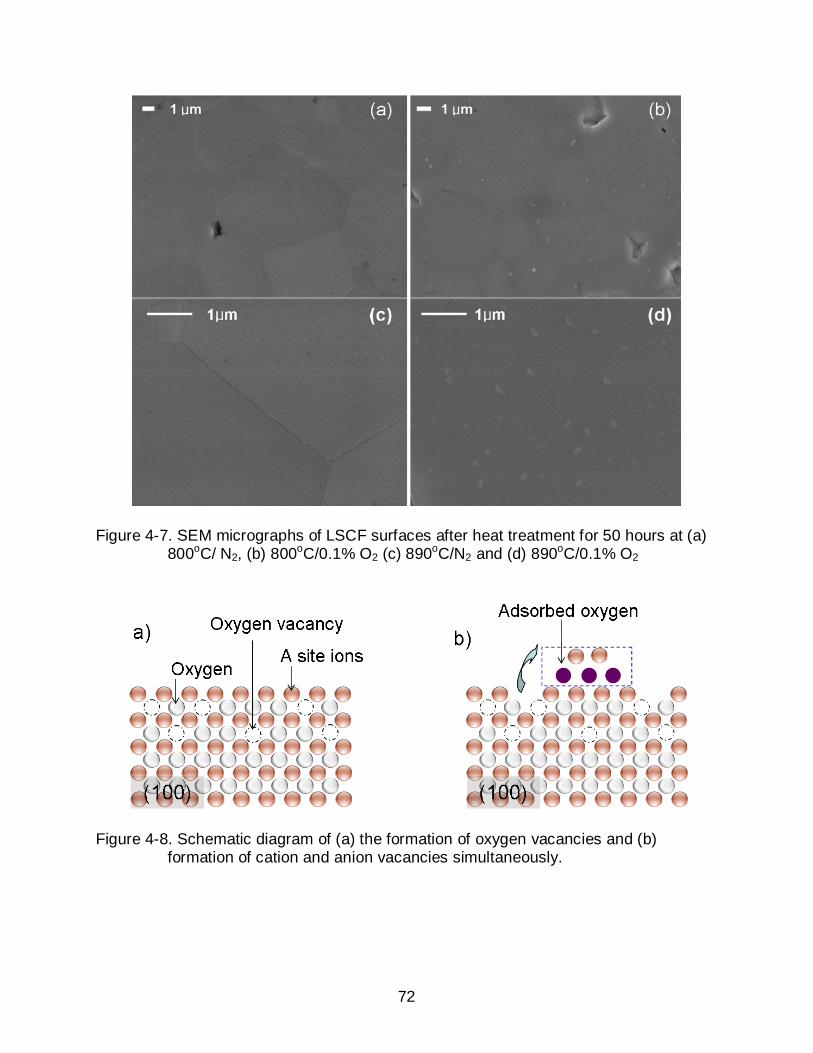
72
Figure 4-7. SEM micrographs of LSCF surfaces after heat treatment for 50 hours at (a) 800oC/ N2, (b) 800oC/0.1% O2 (c) 890oC/N2 and (d) 890oC/0.1% O2
Figure 4-8. Schematic diagram of (a) the formation of oxygen vacancies and (b) formation of cation and anion vacancies simultaneously.

73
Table 4-1. Elemental atomic percents (%) of pre-and post-heat treated LSCF at 800oC obtained from EDS and AES. EDS La Sr Co Fe O
As-fresh 12 9 4 14 61
After heat treatment 13 9 4 15 59
AES La Sr Co Fe O
As-fresh 30 12 5 11 42 After heat treatment 28 22 0 7 43 Enrichment factor 0.9 1.8 0 0.6

74
CHAPTER 5 IMPACT OF CO IMPREGNATION INTO LSCF CATHODE ON SOFC
PERFORMANCE
5.1 Introduction
Recently the mixed ionic electronic conductor (MIEC) has been widely used for a
solid oxide fuel cell cathode due to the high ionic and electronic conducing properties22,
41 They have also exhibited enhanced catalytic activity for oxygen reduction compared
to the pure electronic conductor.42 However, an attempt to reduce operating
temperatures causes the reduced rate of oxygen reduction reaction (ORR), which
results in a substantial increase in activation overpotential. Therefore, tremendous
efforts have been done in order to improve the cathode performance.42, 75-79 Since the
ORR is a heterogeneous reaction, the interaction between the cathode and oxygen is
primarily affected by surface characteristics. Thus, enhancing surface catalytic activity
by dispersing nano-sized particles on the surfaces of the porous electrodes can lead to
an improvement in cathode performance.91, 92
Previously, precious metals were impregnated into the LSCF cathode in order to
enhance the LSCF performance. This method is used to deposit catalytically active fine
particles on the surface of a porous electrode backbone as described in Figure 5-1.
Sahibzada et al.80 investigated the effect of the addition of Pd into the porous
La0.6Sr0.4Co0.2Fe0.8O3-δ (LSCF) cathode and observed 3–4 times lower cathodic
impedance in the temperature range of 400–750oC after Pd impregnation. Similar
enhanced cathode performance by addition of Pd or Pt was also reported by Simner et
al.81 and Uchida et al.82 However, from the economic point of view, it is advantageous to
use abundant elements for the reduction of manufacturing costs. Yamahara et al.83
tested impact of Co impregnation into the La0.85Sr0.15MnO3 cathode and found

75
reasonable increase in maximum power density and decrease in electrode resistance
after impregnation. However, the impact of Co impregnation into the LSCF cathode has
not been tested yet.
It is reported that the chemical composition of the LSCF surface is substantially
different from the stoichiometric values. Viitanen et al.61 studied the chemical
compositional change of LSCF after an oxygen permeation experiment at 900oC using
X-ray Photoelectron Spectroscopy (XPS). They observed the absence of Co and Fe in
the outermost atomic layer from contamination-free LSCF. Bucher et al.59 found Sr
enrichment on the surface using XPS after measuring surface exchange coefficient of
LSCF at 600-700oC. Oh et al.84 showed that Sr in LSCF not only enriched on the
surface but also precipitated into SrO under an oxidizing condition. They observed
reduced concentration of transition metals on the surface in accordance with SrO
precipitation. Vance et al.85 and Lee et al.86 reported that excess Sr increases the
electrode resistance. It is generally believed that B site transition metals play a critical
role for catalytic activity of ABO3 perovskite materials.24, 69, 87, 88 Therefore, Sr
enrichment, can degrade the surface catalytic activity. In this study, cobalt oxide was
additionally dispersed into the porous LSCF cathode instead of precious metals in order
to improve LSCF performance. The impact of Co impregnation was tested by measuring
the electrode resistance and cell performance.
5.2 Experimental
5.2.1 AC Impedance Analysis
A symmetric cell, which consists of LSCF/GDC/LSCF, was prepared for the
impedance measurement. A dense Gd0.1Ce0.9O2-δ (GDC, Anan Kasei, Japan) electrolyte
was made by sintering a pressed pellet at 1450oC for 4 hours. A LSCF ink was

76
prepared by mixing LSCF powder with texanol based polymer vehicle (ESL electro-
science, USA) using Thinky mixer (Thinky, Japan). The ink was symmetrically painted
on both sides of the electrolyte, each having a same electrode area of 0.28 cm2. Pt
wires were connected as a current collector and LSCF ink was applied for better
contact. After that, the cell was sintered at 1100oC for 1 hr with heating and cooling rate
of 5oC/ mins.
Figure 5-2 shows the LSCF/GDC/LSCF symmetric cell and the schematic of AC
impedance measurement set-up. AC impedance of the symmetric cells was measured
in air in the temperature range between 600 and 800oC with 50oC intervals using a
Solartron SI 1260 frequency response analyzer. The amplitude of the excitation voltage
was 50 mV and the AC frequency range was from 0.1 to 105 Hz. The experimental data
was fit using the equivalent circuit shown in Figure 5-3 in order to de-convolute the
impedance response and extract the electrode resistance. It consists of a series of
resistors (R) and constant phase elements (CPE). CPEs were used instead of
capacitors to fit the depressed semi-circle behavior.89 In the figure, RE is the electrolyte
ohmic resistance, and RHF and RLF refer to high and low frequency components
respectively. The overall electrode resistance is the sum of RHF and RLF. The area
specific resistance of the electrode is obtained by
2Area)R(RASR ElectrodeLFHF
Electrode⋅+
= (5-1)
5.2.2 Electrical Conductivity Relaxation
A dense LSCF sample was prepared for analysis. It was prepared by pressing
La0.6Sr0.4Co0.2Fe0.8O3-δ powder (Praxair Specialty Ceramics, USA) uni-axially and
sintering a pellet at 1400oC for 4 hours in air. The density of the sintered body

77
measured by the Archimedes method was ~ 97% of the theoretical value (6.36 g/cm3).
The sintered body was cut and then polished with a series of SiC papers and diamond
abrasives (Leco) down to 1 μm. All samples were cleaned with DI water and acetone
before ECR test. The sample dimension was approximately 0.1x2x20 mm3.
A bar of LSCF was positioned on the alumina tube in the middle of the reactor and
a K-type thermocouple was placed below it. A N2 and O2 gas mixture was fed into the
reactor through a mass flow controller (MKS & Edwards). The total flow rate was fixed
at 300 ccm. The electrical conductivity was measured via the four point probe method.
The conductivity change was monitored by a Lock-in amplifier (Stanford, SR830)
automated with Labview software. The sample was heated to 800oC at a rate of 5oC/min
in air. Before the ECR measurement, the feed stream was switched to 3% O2. Once it
reached steady state the feed stream was switched via four way switching valve. The
oxygen partial pressure (pO2) step was programmed to increase by the following steps:
3→5→8→12→18→28→43→67%.
5.2.3 Button Cell Fabrication and Tests
NiO-GDC anode supports were fabricated by the tape-casting method. A tape
casting slurry was prepared in two steps. First, a mixture of NiO (Alfa Aesar),
Ce0.9Gd0.1O1.95 (Anan), and a dispersant, Solsperse, was ball milled in a toluene and
ethanol solvent system for 24 hours. After that, a plasticizer, di-n butyl phthalate (DBP)
and polyethylene glycol 5000 (PEG5000), and a binder, polyvinyl butyral (PVB), were
added to the slurry. After 24 hours, the slurry was de-gased to remove trapped air
bubbles, which cause cracks or defects during casting. The NiO-GDC anode tape was
tape casted using a Procast tape casting system (DHI) and then the tape was dried for
2 hours at 100oC. Circular shapes of green tape (dia. 32 mm) were cut out and partially

78
sintered at 900oC for 2 hours to remove polymer vehicles as well as provide an
appropriate mechanical strength for the electrolyte deposition.
An anode functional layer was added to increase SOFC performance. An ethanol
based GDC precursor solution was spray coated on the surface of a pre-sintered anode
and heat treated at 900oC for 1 hour. An electrolyte was then deposited on the top
functional layer. A GDC electrolyte slurry, which was prepared by ball-milling GDC
powder, Solsperse, PVB and DBP in ethanol, was spin-coated on the pre-sintered body
and dried at room temperature for 10 hours. Finally, it was sintered at 1450oC for 4
hours using a heating rate of 3oC/ min. A LSCF cathode ink was brush-painted on the
electrolyte. The cathode was fired at 1100 °C for 1 hour. Pt paste, as a current collector,
was brush-painted onto both electrodes along with Pt mesh and gold leads. Current
collectors were heat-treated at 900 °C for 1 hour.
Figure 5-4 shows a diagram of the current density and voltage measurement set
up. The button cell was loaded in a house-built fuel cell testing setup and gas sealed
using a two-part ceramabond sealant (a mixture of 517-powder and 517-liquid from
Aremco). 30 ccm of dry air and 30 ccm of wet hydrogen were supplied to the cathode
and anode sides, respectively. The cell voltage was measured as a function of current
density using a Solartron 1287 potentiostat. Impedance was measured at open circuit
conditions by two-point probe methods using a PARSTAT 2273 frequency response
analyzer (Princeton Applied Research) with a frequency range of 0.1 to 105 Hz. The
electrode area specific resistance (ASR) was calculated from the area below the semi-
circle in the Nyquist impedance plot.

79
5.2.4 Catalyst Impregnation
A Co precursor solution was prepared by dissolving Co(NO3)2•6H2O (Alfa Aesar
99.999%) in ethanol and its pH was measured using a pH meter (Seven multi, Mettler
Toledo). The Co precursor was impregnated into the porous body of the cathode by
dipping the cell into the Co nitrate solution while a vacuum was pulled. NiO-GDC Anode
was dense before reduction in H2 condition, and so Co solution was barely impregnated
into anode side. Co impregnation was continued until no more air bubbles came out
from the surface of the cathode. It was taken from the solution and dried at 70oC. The
electrolyte area around the electrode was cleaned in ethanol and then heat-treated at
850oC for 30 mins.
5.2.5 Characterization
The morphological change was characterized using scanning electron microscopy
(SEM, JSM 6335F) combined with energy dispersive spectroscopy (EDS, Oxford, UK).
ZAF correction is used for semi-quantitative analysis, where Z is the atomic number, A
is the absorption correction factor, and F is the fluorescence correction factors.
5.3 Results and Discussion
5.3.1 Effect of Co Impregnation on Electrode Impedance
ASR-AC impedance spectroscopy measurements were carried out in the
temperature range of 600–800oC. Figure 5-5 shows the AC impedance spectra for
LSCF/GDC/LSCF symmetric cell at three different temperatures. The area below the
semi-circles corresponds to the electrode resistance, and the high frequency intercepts
of the semi-circles were normalized for easier comparison. There are approximately two
semi-circles, and each semi-circle corresponds to a different reaction step.90 The
greatest contribution to the electrode resistance is the high frequency component. As

80
temperature decreases, the size of the high frequency semi-circle increases, while that
of the low frequency semi-circle changes slightly. However, two semi circles were
apparently combined into one below 700oC and so they could not be de-convoluted
each other. Esquirol et al.91 and Sahibzada et al.80 measured the impedance of
LSCF/GDC/LSCF symmetric cell and observed similar behavior. They attributed the
high and low frequency components to the surface reaction and gas phase diffusion,
respectively. It is expected that the resistance for the surface reaction increases
substantially as the temperatures decrease while the mass transport of oxygen gas
depends little on temperature. And so their explanation justifies the observed
dependence of AC impedance spectra on temperature.
Figure 5-6 shows the impedance spectra for the symmetric cells of plain LSCF and
Co impregnated LSCF. It shows that Co impregnation into LSCF reduces RHF while RLF
is unaffected, indicating that it does not retard oxygen gas diffusion but improves the
surface reaction rate. At temperatures below 700oC it is difficult to distinguish the
contribution of the high and low frequency component and so the total electrode ASRs
are compared each other. Figure 5-7 shows the ASRElectrode of plain and Co
impregnated LSCF plotted as a function of temperature in log scale. For the plain LSCF
electrode, the ASR is 0.040 Ω cm2 at 800oC, which is consistent with literature values.91
The ASR decreases to 0.027 Ω cm2 at the same temperature after Co impregnation,
providing a 32% reduced value. The activation energies were obtained from Arrhenius
plots. They were 1.44 eV and 1.55 eV for plain and Co impregnated LSCF electrodes,
respectively. The activation energy is only slightly changed after Cr impregnation. It
seems that the rate limiting step does not change with Co impregnation.
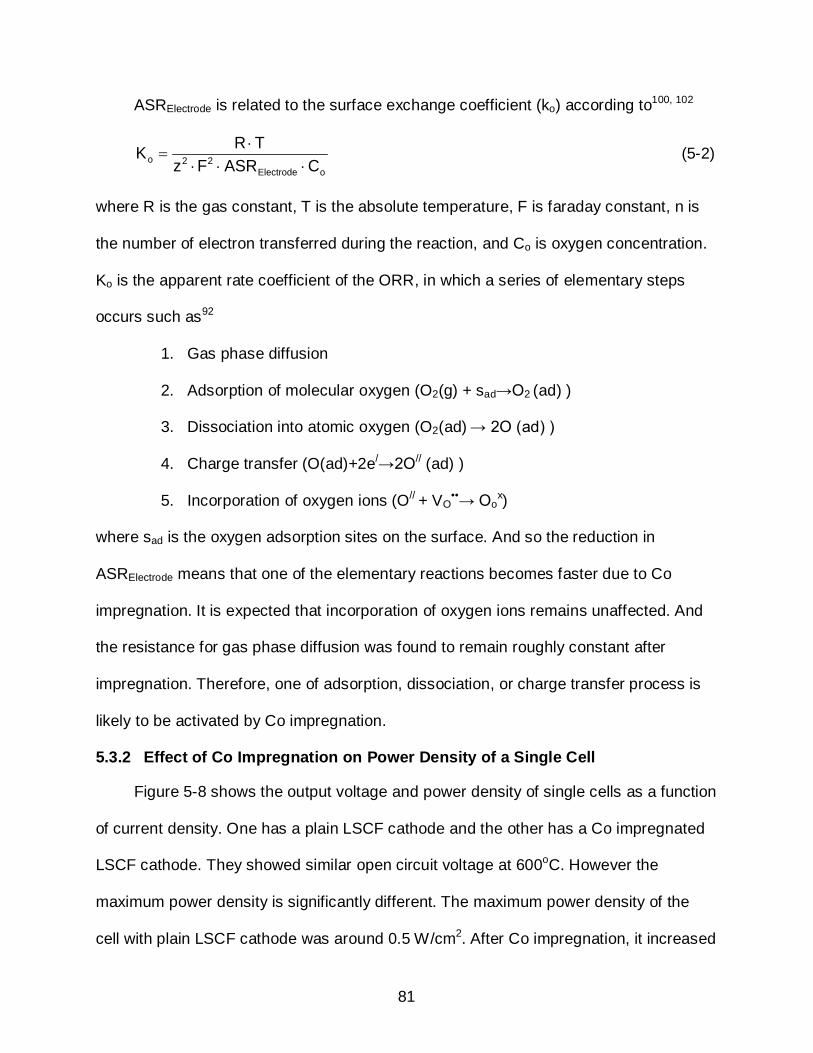
81
ASRElectrode is related to the surface exchange coefficient (ko) according to100, 102
oElectrode22o C ASRFz
TRK⋅⋅⋅
⋅= (5-2)
where R is the gas constant, T is the absolute temperature, F is faraday constant, n is
the number of electron transferred during the reaction, and Co is oxygen concentration.
Ko is the apparent rate coefficient of the ORR, in which a series of elementary steps
occurs such as92
1. Gas phase diffusion
2. Adsorption of molecular oxygen (O2(g) + sad→O2 (ad) )
3. Dissociation into atomic oxygen (O2(ad) → 2O (ad) )
4. Charge transfer (O(ad)+2e/→2O// (ad) )
5. Incorporation of oxygen ions (O// + VO••→ Oo
x)
where sad is the oxygen adsorption sites on the surface. And so the reduction in
ASRElectrode means that one of the elementary reactions becomes faster due to Co
impregnation. It is expected that incorporation of oxygen ions remains unaffected. And
the resistance for gas phase diffusion was found to remain roughly constant after
impregnation. Therefore, one of adsorption, dissociation, or charge transfer process is
likely to be activated by Co impregnation.
5.3.2 Effect of Co Impregnation on Power Density of a Single Cell
Figure 5-8 shows the output voltage and power density of single cells as a function
of current density. One has a plain LSCF cathode and the other has a Co impregnated
LSCF cathode. They showed similar open circuit voltage at 600oC. However the
maximum power density is significantly different. The maximum power density of the
cell with plain LSCF cathode was around 0.5 W/cm2. After Co impregnation, it increased
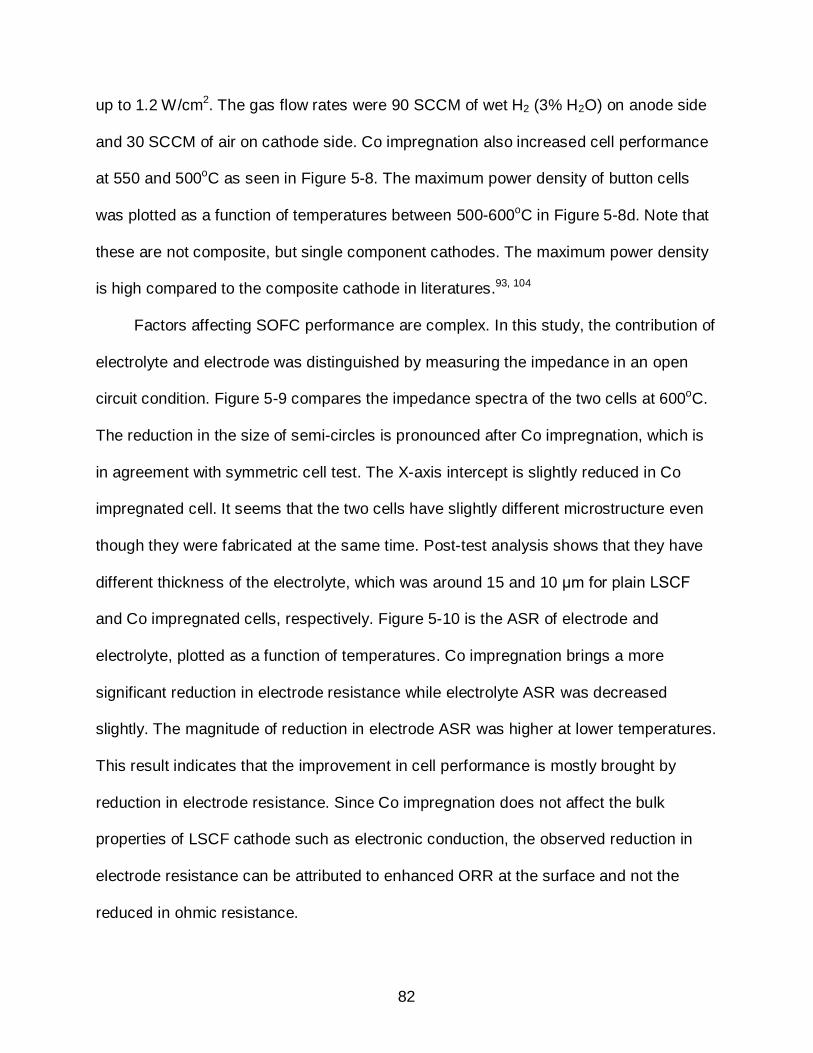
82
up to 1.2 W/cm2. The gas flow rates were 90 SCCM of wet H2 (3% H2O) on anode side
and 30 SCCM of air on cathode side. Co impregnation also increased cell performance
at 550 and 500oC as seen in Figure 5-8. The maximum power density of button cells
was plotted as a function of temperatures between 500-600oC in Figure 5-8d. Note that
these are not composite, but single component cathodes. The maximum power density
is high compared to the composite cathode in literatures.93, 104
Factors affecting SOFC performance are complex. In this study, the contribution of
electrolyte and electrode was distinguished by measuring the impedance in an open
circuit condition. Figure 5-9 compares the impedance spectra of the two cells at 600oC.
The reduction in the size of semi-circles is pronounced after Co impregnation, which is
in agreement with symmetric cell test. The X-axis intercept is slightly reduced in Co
impregnated cell. It seems that the two cells have slightly different microstructure even
though they were fabricated at the same time. Post-test analysis shows that they have
different thickness of the electrolyte, which was around 15 and 10 μm for plain LSCF
and Co impregnated cells, respectively. Figure 5-10 is the ASR of electrode and
electrolyte, plotted as a function of temperatures. Co impregnation brings a more
significant reduction in electrode resistance while electrolyte ASR was decreased
slightly. The magnitude of reduction in electrode ASR was higher at lower temperatures.
This result indicates that the improvement in cell performance is mostly brought by
reduction in electrode resistance. Since Co impregnation does not affect the bulk
properties of LSCF cathode such as electronic conduction, the observed reduction in
electrode resistance can be attributed to enhanced ORR at the surface and not the
reduced in ohmic resistance.

83
Post-test analysis was conducted using SEM. Figure 5-11a is the SEM micrograph
of the cross section of post-tested button cell. And Figure 5-11b is the magnified images
for a cathode side. After Co impregnation, deposition of nano sized particles was found
on the surface of LSCF cathodes. However, atomic percents obtained from EDS do not
provide any noticeable difference between the plain and Co impregnated LSCF
cathode. This is because the penetration depth of electron beam is much deeper than
the size of the nano sized particle. Previously Yamahara et al.83 impregnated Co nitrate
solution into an LSM cathode in similar way to this study, and they observed the
formation of Co3O4 nano particles using Transmission electron microscopy. And sot it is
likely that the newly formed nano particle on LSCF is also Co3O4.
The reduced electrode resistance is mostly attributed to the addition of cobalt
oxide on LSCF surface. However, the removal of Sr enriched surface layers can also
contribute to the improvement in electrode performance. Miura et al.93 tested the oxygen
permeability of La0.6Sr0.4Co0.8Fe0.2O3 membrane and obtained improved permeability
with acid treatment. They performed XPS analysis to identify the reason for activation,
and found a reduced concentration of excess SrO on the surface. In this study, a cell
was dipped into a nitrate solution during impregnation process. The pH of Co nitrate
solution measured was 2.15. This is not a strong acid, but the possibility that a few
surface layers were etched during the Co impregnation process cannot be ruled out and
may contribute to enhanced ORR.
5.3.3 Characteristic Dependence of Kchem on Oxygen Partial Pressure
The chemical exchange coefficient (Kchem) and chemical diffusion coefficient
(Dchem) of LSCF were measured at 800oC using electrical conductivity relaxation. And
they are plotted as a function of pO2 on a log scale in Figure 5-12a. Obtained Kchem and

84
Dchem values can be converted into surface exchange coefficients (Ko) and the self
diffusion coefficients (Dself) using Eqs. 5-3 and 5-4.94
ΓKK chem
o = (5-3)
ΓDD chem
self = (5-4)
where Г is a thermodynamic factor(o
2
C ln pO ln
21
∂∂ ). In addition, the oxygen vacancy
diffusion coefficient (Dv) can be calculated according to53
δδ)(3D
CCDD self
V
oselfV
−⋅=
⋅=
(5-5)
where Co and Cv are the concentration of oxygen and oxygen vacancies,
respectively, and δ is the molar concentration of oxygen vacancies in
La0.6Sr0.4Co0.2Fe0.8O3-δ. The thermodynamic factors and (3-δ)/δ values for LSCF at
800oC are given in Table 5-1.47, 94 Ko, Dself, and Dv were calculated using the values in
Table 5-1 and plotted as a function of pO2 seen in Figures 5-12b and 5-12c,
respectively. The slope in the figure indicates the dependence of K and D values on
pO2. Such dependence must reflect the behavior of oxygen transport mechanisms. For
example, DV is proportional to pO20.073, which is roughly independent of oxygen partial
pressure. This indicates that the mobility of oxygen vacancies is constant in this pO2
range, which is a reasonable result.
Maier assumed a thin layer, charge-transfer, or adsorption process were rate-
limiting steps for the ORR, and set the kinetic models for each case.95 The kinetic model
provided the characteristic dependencies of apparent rate coefficients on oxygen partial

85
pressure as Table 5-2 shows. The characteristic dependencies of Ko and Kchem on pO2,
which were obtained in this study, were 0.1 and 0.56 respectively. A comparison of
them suggests that the rate-limiting step of the ORR is likely to be a charge-transfer
process. Therefore, it is likely that the addition of cobalt oxide on the surface of LSCF
reduces the electrode resistance by expediting charge transfer from the cathode to the
oxygen gas.
5.4 Conclusions
Based on understanding surface characteristic of LSCF, Co was impregnated into
a porous LSCF cathode. After Co impregnation, the electrode ASR was reduced and
the maximum power density of a single component LSCF cathode cell was significantly
improved, giving 1.2 W/cm2 at 600oC. This result suggests that Co impregnation into
LSCF surface effectively improves deteriorated surface catalytic activity caused by Sr
enrichment and transition metal depletion. It seems that the oxygen reduction reaction is
limited primarily by a charge transfer process and addition of cobalt oxide via wet
impregnation improves this process. Such activation is mainly attributed the addition of
cobalt oxide on the surface but the impact of the removal of Sr enriched surface layers
during impregnation can not be ruled out. The long-term stability of the impregnated
electrode structure needs to be tested.

86
Figure 5-1. Sketch of deposition of nano size particles on cathode surface via wet impregnation.
Figure 5-2. Schematic of AC impedance measurements.

87
Figure 5-3. Equivalent circuit to fit the measured impedance data.
Figure 5-4. Current density and voltage measurement setup

88
Figure 5-5. AC Impedance spectra of LSCF/GDC/LSCF symmetric cell.
Figure 5-6. Impedance plots for symmetric cell of plain LSCF electrode and Co
impregnated LSCF electrode at 800oC in air.

89
Figure 5-7. Comparison of total electrode ASRs as a function of temperatures

90
Figure 5-8. Measurement of cell voltage as a function current density at (a) 600oC, (b)
550oC and (c) 500oC. (d) Maximum power densities as a function of temperatures.
Figure 5-9. Impedance of a button cell for plain LSCF and Co impregnated cathode at 600oC

91
Figure 5-10. The area specific resistance of electrode and electrolyte for plain and Co
impregnated LSCF cathode cells.
Figure 5-11. (a) SEM micrograph of LSCF/GDC/Ni-GDC button cell and (b) magnified
images of Co impregnated LSCF after cell test.

92
Figure 5-12. (a) Dchem and Kchem, (b) Dself and Ko, and (c) Dv at 800oC as a function of pO2.
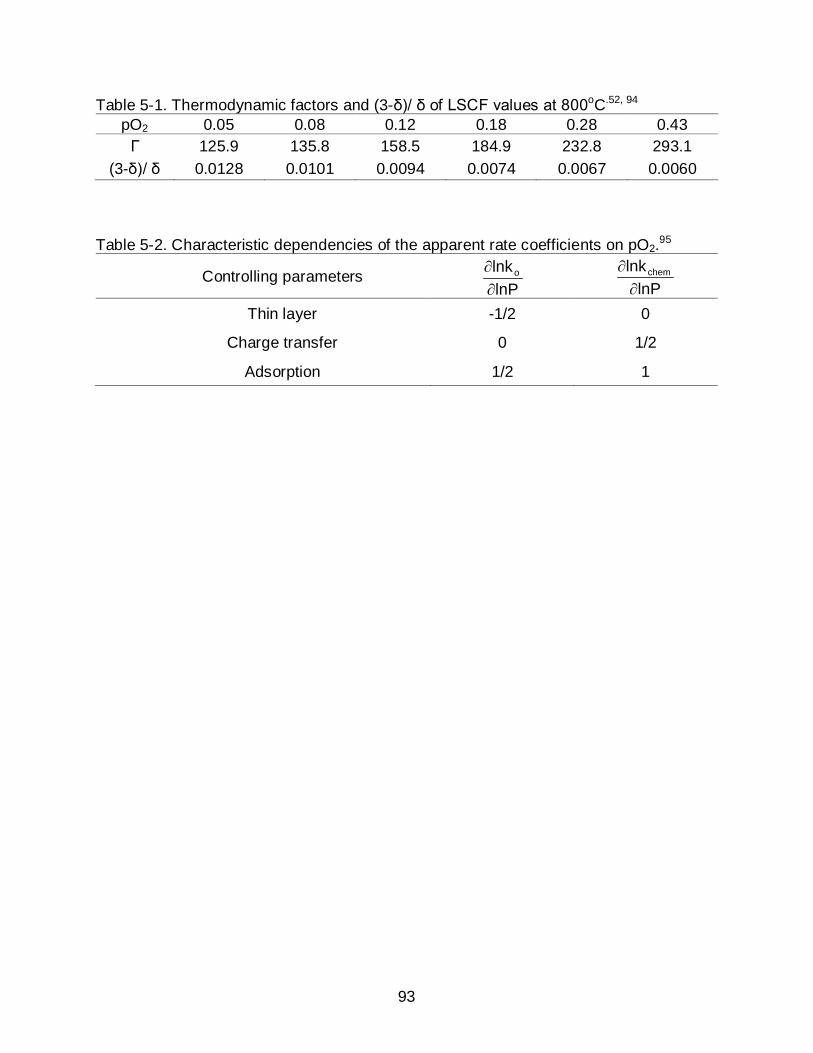
93
Table 5-1. Thermodynamic factors and (3-δ)/ δ of LSCF values at 800oC.52, 94 pO2 0.05 0.08 0.12 0.18 0.28 0.43
Г 125.9 135.8 158.5 184.9 232.8 293.1 (3-δ)/ δ 0.0128 0.0101 0.0094 0.0074 0.0067 0.0060
Table 5-2. Characteristic dependencies of the apparent rate coefficients on pO2.95
Controlling parameters lnPlnko
∂∂
lnPlnkchem
∂∂
Thin layer -1/2 0
Charge transfer 0 1/2
Adsorption 1/2 1

94
CHAPTER 6 MECHANISM OF CR VAPOR DEPOSITION ON SOFC CATHOES
6.1 Introduction
Solid oxide fuel cells (SOFC) need to be operated as a ‘stack’ in order to generate
practical (high) voltages. The stack consists of multiple single cells, which are
electronically connected in series via interconnects. The interconnect also separates
oxygen at the cathode side of one cell from the fuel at the anode side of the adjacent
cell. Thus, high electronic conductivity, gas tightness, good stability both in air and fuel
environment, and low reactivity with other cell components are necessary properties for
interconnects.96 While ceramic interconnects are generally used for high temperature
SOFCs, reduction in the operating temperatures allows utilization of metal alloys. Metal
interconnects are advantageous over ceramic interconnects because of reduced
manufacturing costs, enhanced machinability and thermo-mechanical stability.97, 98
Despite such benefits, metal alloy interconnects contain high concentrations of Cr14,
which leads to out-diffusion of Cr to surface region, formation of Cr scale and Cr
vaporization from the Cr scale at high temperatures in oxidizing conditions (Eq. 6-1 and
6-2).
(g)2CrO(g)O23(s)OCr 3232 →+ (6-1)
(g)(OH)2CrOO(g)2H(g)O23(s)OCr 222232 →++ (6-2)
Mass transport of such Cr vapor species to the cathode and the formation of a solid
chromium oxide can degrade the cathode performance either by blocking
electrochemically active sites or by decomposing cathodes.40, 99 SOFCs utilizing metallic
interconnects undergo significant degradation during long term operation.39, 100

95
The long-term stability is an important requirement for the commercialization of
SOFC. Thus, the development of a practical SOFC cathode requires an understanding
of the degradation mechanism caused by Cr vapor deposition. One group has
hypothesized that the degradation mechanism is based on the electrochemical
reduction of high valent vapor species of chromium oxide (CrO3) and oxyhydroxide
(CrO2(OH2)) to solid phase Cr2O3.40, 101 In contrast, others suggest that the nature of Cr
poisoning is a chemical process in which a nucleation agent on the cathode interacts
with Cr vapor species.114-116 In this study, Cr vapor deposition behaviors on various
ABO3 perovskite materials were systematically investigated in order to better
understand the reaction mechanism between Cr vapor species and solid oxide fuel cell
cathodes. Dense and polished samples were examined to clearly identify surface
morphological changes. A special emphasis was placed on La0.6Sr0.4Co0.2Fe0.8O3
(LSCF).
6.2 Experimental
6.2.1 Sample Preparation
La0.6Sr0.4Co0.2Fe0.8O3-δ powder was obtained from Praxair Specialty Ceramics,
USA and the rest of the compounds, La0.6A0.4Co0.2Fe0.8O3 (A=Ca, Ba), SrCo0.2Fe0.8O3,
and La0.6Sr0.4MnO3, were synthesized by a solid state reaction process. La2O3 (Cerac,
99.999%), SrCO3 (Johnson Matthey, 99%), BaO (Acros, 90%), Co3O4 (Alfa Aesar,
99.7%) and Fe2O3 (Alfa Aesar, 99.945%) powders, were ball milled for 24 hrs in ethanol,
and dried at 70oC. They were calcined at 900oC for 6 hrs. LSCF and LSM were sintered
at 1400oC for 4 hours and 1450oC for 6 hours, respectively. And the others were
sintered at 1200oC for 6 hours. The sintered body was cut and then polished with a
series of SiC papers and diamond abrasives (Leco) down to 1 μm. All samples were

96
cleaned with DI water and acetone before heat treatments. Final sample thicknesses
were around 0.1 cm. The compositions of metal oxides and preparation method are
listed in Table. 6-1.
6.2.2 Heat Treatment
Samples were heat treated under ambient conditions in the presence of
Crofer22APU as described in Figure 6-1. Crofer22APU (ThyssenKrupp VDM, Werdohl,
Germany) is a ferritic stainless steel for solid oxide fuel cell interconnects. The
composition of the steel, given by the supplier, is listed in Table 6-2. Samples were
located on a Crofer22APU sheet, thus the distance between the sheet and sample
surfaces is 0.1 cm, which was equivalent to sample thickness. They were also located
0.5 cm away from the sheet. Heat treatments were carried out for 50 hours at 400, 600
and 800oC with heating and cooling rates of 5oC/min. Because no Cr vapor deposition
was found at 800oC on LSM, it was heat treated additionally at 1050oC for 50 hours.
6.2.3 Characterization.
X-ray diffraction patterns (Philips APD 3720) of the samples were measured with
Cu-Kα1 radiation (λ=1.54 Å). Low angle mode XRD (Philips MRD X'Pert System) was
applied in order to analyze the structural variation of LSCF in surface region after heat
treatment. All data were compared to the literatures and the Joint Committee on Powder
Diffraction Standards Data (JCPDS).
Morphological and compositional changes were characterized using scanning
electron microscopy (SEM, JSM 6335F) combined with energy dispersive spectroscopy
(EDS, Oxford, UK). ZAF correction was used for semi-quantitative analysis. In addition,
surface chemical composition of LSCF before and after heat treatment was measured
using Auger electron spectroscopy (AES, AES Perkin-Elmer PHI 660). The accelerating

97
voltage was 10 kV and it scanned the energy ranges between 50 to 2050 eV, which
covered the characteristic peaks of LaMNN (625 eV), SrLMM (1649 eV), Co (775 eV),
FeLMM (703 eV), and OKLL (510 eV). These characteristic peaks were selected in order to
minimize interference with each other. Obtained AES spectrum was differentiated, and
elemental atomic percents were calculated using AugerScan 3.2.0 software (RBD
Instrument). It calculates the atomic percents (X) according to
∑=
mm
aa
/SI/SIX (6-1)
where I is the peak intensity and S is the relative elemental sensitivity factor for the
Auger line used. The relative sensitivity factors, which are provided by RBD instruments,
are 0.06, 0.045, 0.19, 0.13, and 0.35 for LaMNN, SrLMM, FeLMM, CoLMM and OKLL,
respectively. This study calculated the relative change based on the ratio of atomic
percents before and after heat treatment which were normalized by oxygen
concentration. The enrichment factor was calculated according to
HT preoxygencation
HT postoxygencation
]X/ [X]X/ [X
(E.F.) Factor Enrichment = (6-2)
6.3. Results and Discussion
6.3.1 XRD
Figure 6-2 shows the XRD patterns of the sintered pellets. LSCF, SCF, LBCF,
LSM are identified in the pure perovskite phase102 while small quantities of secondary
phases were detected in solid state synthesized LCCF.
6.3.2 Cr Vapor Deposition on LSCF
In Figure 6-3 are representative SEM micrographs of LSCF surfaces before and
after heat treatment at 800oC for 50 hours in the presence of Crofer22APU. Compared
98
to the flat surface of non-heat treated samples in Figure 6-3a, all the surfaces showed
the formation of a few micron sizes of particles after heat treatment. Heat treatment with
direct contact to Crofer22APU sheet (Figure 6-3b) resulted in uniform formation of
secondary phases on grain boundary and grain surfaces while the particles were
formed along the grain boundary when LSCF surface was not in contact with the sheet
(Figure 6-3c and 6-3d). The distances between Crofer22APU and leading edge of LSCF
were 0.1 cm and 0.5 cm in Figure 6-3c and 6-3d, respectively. As the distance
increased, apparently the formation of secondary phases decreased due to reduced
mass transport of Cr vapor species to LSCF. Elemental atomic percents for a newly
formed particle and a flat region between the particles after heat treatment were
obtained using energy dispersive spectroscopy (EDS). As Table 6-3 shows, the flat
region did not present noticeable difference in atomic percents compared to the non-
heat treated sample. By contrast, the particle exhibited substantially increased
concentration of Sr and Cr, indicating that the particles are Sr-Cr-Ox.
Compositional variation of surface layers as a result of the formation of Sr-Cr-Ox
was investigated using Auger electron spectroscopy (AES). The flat region between Sr-
Cr-Ox particles in Figure 6-3d was selected for the analysis, and the values were
compared to non-heat treated sample. The elemental atomic percent obtained by AES
is given in Table 6-4. It shows that atomic percent of cations varied after heat treatment
while that of oxygen remained essentially constant.
The enrichment factors were calculated using Eq. 6-2. While La concentration was
slightly increased, the concentration of the rest of the cations became halved. In our
previous study, Sr enrichment after heat treatment was evident on the surface of Cr
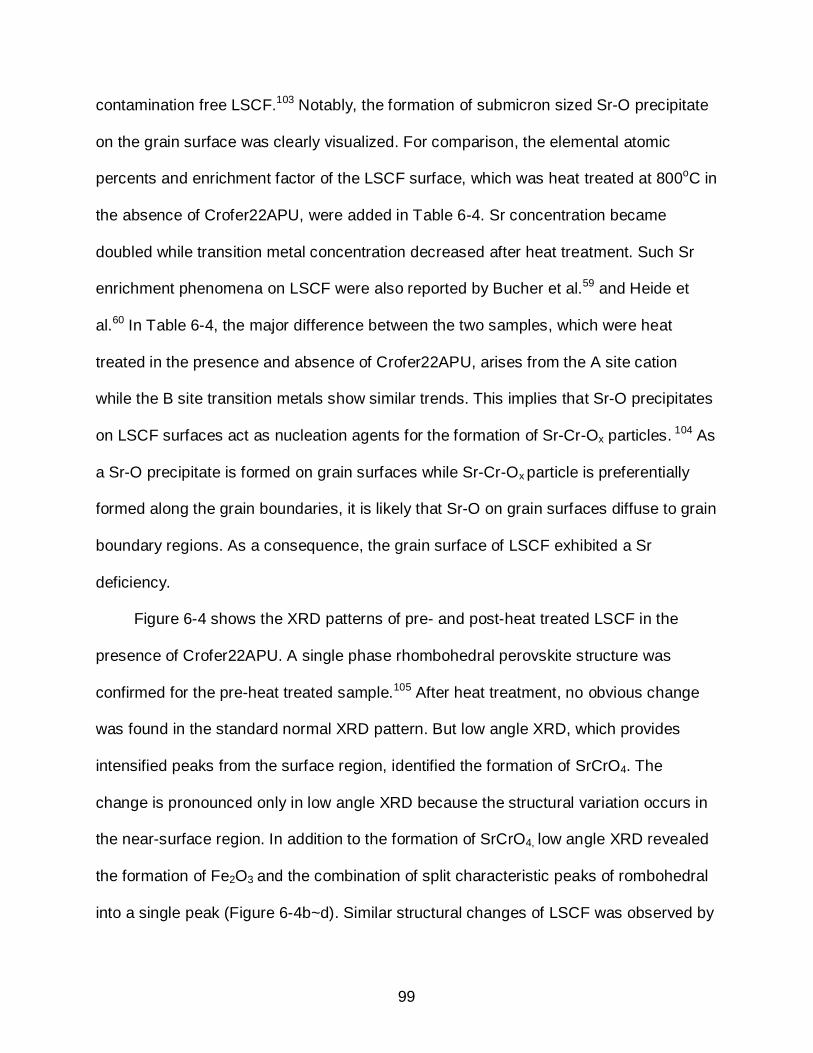
99
contamination free LSCF.103 Notably, the formation of submicron sized Sr-O precipitate
on the grain surface was clearly visualized. For comparison, the elemental atomic
percents and enrichment factor of the LSCF surface, which was heat treated at 800oC in
the absence of Crofer22APU, were added in Table 6-4. Sr concentration became
doubled while transition metal concentration decreased after heat treatment. Such Sr
enrichment phenomena on LSCF were also reported by Bucher et al.59 and Heide et
al.60 In Table 6-4, the major difference between the two samples, which were heat
treated in the presence and absence of Crofer22APU, arises from the A site cation
while the B site transition metals show similar trends. This implies that Sr-O precipitates
on LSCF surfaces act as nucleation agents for the formation of Sr-Cr-Ox particles. 104 As
a Sr-O precipitate is formed on grain surfaces while Sr-Cr-Ox particle is preferentially
formed along the grain boundaries, it is likely that Sr-O on grain surfaces diffuse to grain
boundary regions. As a consequence, the grain surface of LSCF exhibited a Sr
deficiency.
Figure 6-4 shows the XRD patterns of pre- and post-heat treated LSCF in the
presence of Crofer22APU. A single phase rhombohedral perovskite structure was
confirmed for the pre-heat treated sample.105 After heat treatment, no obvious change
was found in the standard normal XRD pattern. But low angle XRD, which provides
intensified peaks from the surface region, identified the formation of SrCrO4. The
change is pronounced only in low angle XRD because the structural variation occurs in
the near-surface region. In addition to the formation of SrCrO4, low angle XRD revealed
the formation of Fe2O3 and the combination of split characteristic peaks of rombohedral
into a single peak (Figure 6-4b~d). Similar structural changes of LSCF was observed by

100
Waller et al.106 They tested the effect of Sr deficiency on the structural change of LSCF
and found the combination of split characteristic peaks of the rhombohedral phase.
They suggested that this is evidence of a phase transition from rhombohedral to cubic
structure. In their study, Fe2O3 appeared as Sr deficiency increased, which was also
observed in this study. Therefore, the structural analysis in this study indicates that the
LSCF surface undergoes a phase transition under Cr contamination conditions as a
result of a Sr deficiency. This is in good agreement with the chemical analysis
performed in this study.
For ABO3 perovksite materials, it is generally believed that B site transition metals
play a critical role for catalytic activity.24, 69, 87, 88 Kilner et al.31 investigated the
dependence of surface exchange coefficients (Ko) on the composition of La0.8Sr0.2Mn1-
yCoyO3 and found that Ko increased with increasing Co concentration. Takeda et al.44
measured the cathodic polarization of La0.7Sr0.3MO3 (M=Cr, Mn, Fe, Co) and found that
La0.7Sr0.3CoO3 exhibited the lowest polarization at 800 oC in air. In addition, Kan et al.54
studied the effect of catalyst impregnation on the catalytic activity for oxygen exchange.
They found oxygen exchange reaction of La0.8Sr0.2MnO3(LSM) was improved with the
addition of Co on the surfaces via wet impregnation. These results in literatures indicate
that Co is a catalytically active element for oxygen reduction reaction. Therefore,
reduction in Co concentration on the surface of LSCF is likely to degrade oxygen
exchange reaction. Furthermore, the collected data of the surface exchange coefficients
and the oxygen tracer diffusion coefficients of various metal oxides evidences that the
electronic species on the surface are essential for oxygen exchange reaction. The
formation of near insulator Fe2O3,107 and less conductive Sr deficient LSCF,108 reduces
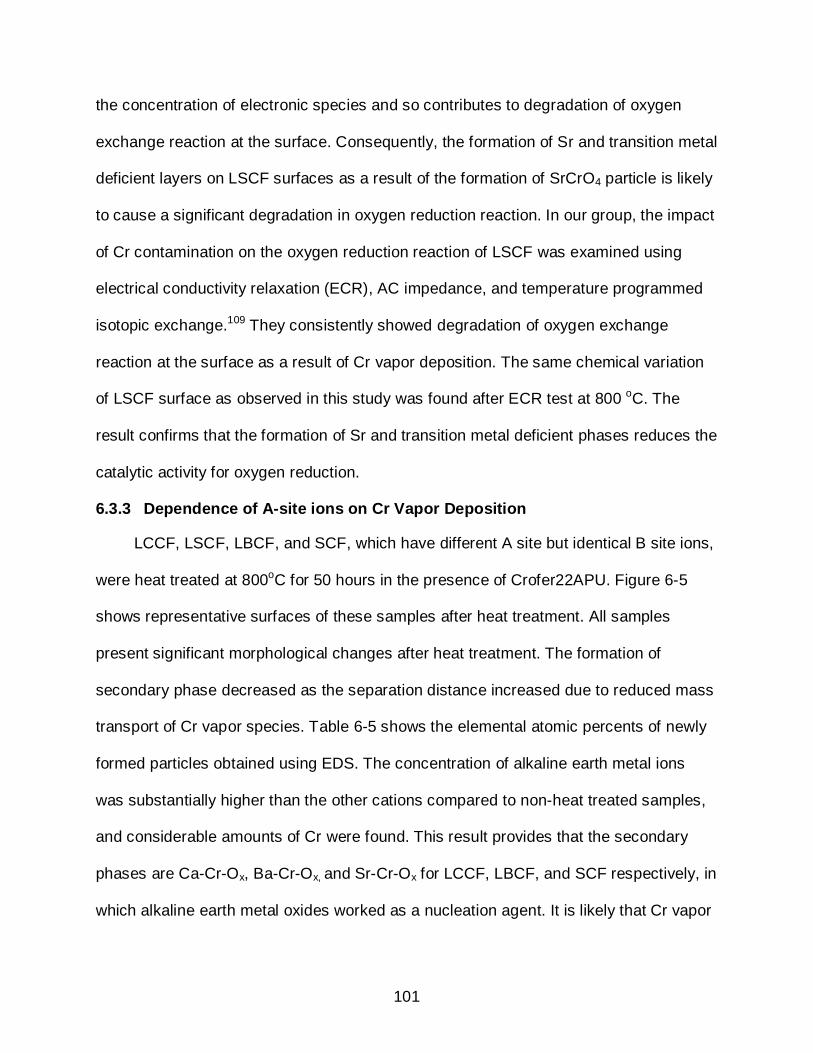
101
the concentration of electronic species and so contributes to degradation of oxygen
exchange reaction at the surface. Consequently, the formation of Sr and transition metal
deficient layers on LSCF surfaces as a result of the formation of SrCrO4 particle is likely
to cause a significant degradation in oxygen reduction reaction. In our group, the impact
of Cr contamination on the oxygen reduction reaction of LSCF was examined using
electrical conductivity relaxation (ECR), AC impedance, and temperature programmed
isotopic exchange.109 They consistently showed degradation of oxygen exchange
reaction at the surface as a result of Cr vapor deposition. The same chemical variation
of LSCF surface as observed in this study was found after ECR test at 800 oC. The
result confirms that the formation of Sr and transition metal deficient phases reduces the
catalytic activity for oxygen reduction.
6.3.3 Dependence of A-site ions on Cr Vapor Deposition
LCCF, LSCF, LBCF, and SCF, which have different A site but identical B site ions,
were heat treated at 800oC for 50 hours in the presence of Crofer22APU. Figure 6-5
shows representative surfaces of these samples after heat treatment. All samples
present significant morphological changes after heat treatment. The formation of
secondary phase decreased as the separation distance increased due to reduced mass
transport of Cr vapor species. Table 6-5 shows the elemental atomic percents of newly
formed particles obtained using EDS. The concentration of alkaline earth metal ions
was substantially higher than the other cations compared to non-heat treated samples,
and considerable amounts of Cr were found. This result provides that the secondary
phases are Ca-Cr-Ox, Ba-Cr-Ox, and Sr-Cr-Ox for LCCF, LBCF, and SCF respectively, in
which alkaline earth metal oxides worked as a nucleation agent. It is likely that Cr vapor
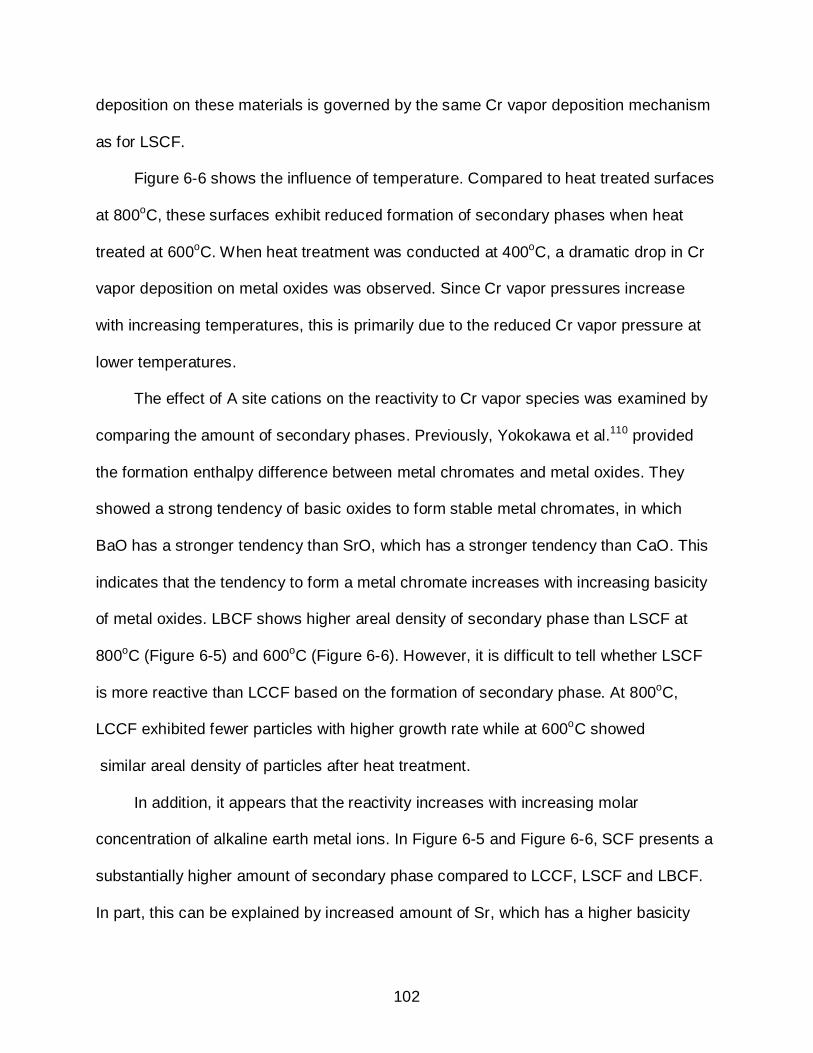
102
deposition on these materials is governed by the same Cr vapor deposition mechanism
as for LSCF.
Figure 6-6 shows the influence of temperature. Compared to heat treated surfaces
at 800oC, these surfaces exhibit reduced formation of secondary phases when heat
treated at 600oC. When heat treatment was conducted at 400oC, a dramatic drop in Cr
vapor deposition on metal oxides was observed. Since Cr vapor pressures increase
with increasing temperatures, this is primarily due to the reduced Cr vapor pressure at
lower temperatures.
The effect of A site cations on the reactivity to Cr vapor species was examined by
comparing the amount of secondary phases. Previously, Yokokawa et al.110 provided
the formation enthalpy difference between metal chromates and metal oxides. They
showed a strong tendency of basic oxides to form stable metal chromates, in which
BaO has a stronger tendency than SrO, which has a stronger tendency than CaO. This
indicates that the tendency to form a metal chromate increases with increasing basicity
of metal oxides. LBCF shows higher areal density of secondary phase than LSCF at
800oC (Figure 6-5) and 600oC (Figure 6-6). However, it is difficult to tell whether LSCF
is more reactive than LCCF based on the formation of secondary phase. At 800oC,
LCCF exhibited fewer particles with higher growth rate while at 600oC showed
similar areal density of particles after heat treatment.
In addition, it appears that the reactivity increases with increasing molar
concentration of alkaline earth metal ions. In Figure 6-5 and Figure 6-6, SCF presents a
substantially higher amount of secondary phase compared to LCCF, LSCF and LBCF.
In part, this can be explained by increased amount of Sr, which has a higher basicity

103
than La. However higher reactivity of SCF is also attributed to higher concentration of
unstable transition metal species. This will be explained in following section.
6.3.4 Dependence of B-site ions on Cr Vapor Deposition
The effect of B site transition metals on the reactivity to Cr vapor was investigated
by comparing Cr vapor deposition behavior on LSCF and LSM. They have the same A
site composition but different B site transition metals. LSM was placed on the
Crofer22APU sheet and heat treated 800oC for 50 hours. Figure 6-7a and 6-7b show
the surfaces of non-heat treated and post-heat treated LSM, respectively. After heat
treatment, any noticeable change, e.g. the formation of particles, was not found on the
LSM surface. This indicates that LSM does not react with Cr vapor species at 800oC.
The formation of secondary phase was observed when LSM was heat treated at
higher temperatures. Figure 6-8a shows the SEM micrograph of LSM after heat
treatment at 1050oC for 50 hours. It shows the formation of facetted particles on the
surface. EDS spectra for non-heat treated LSM and facetted particles are given in
Figure 6-8b and 6-8c, respectively. It reveals that the secondary phase is a Cr-Mn-Ox.
Multiple particles were analyzed but the formation of Sr-Cr-Ox was not found on LSM.
The temperature dependence of Cr vapor deposition on LSM is in good agreement with
the literature. Tucker at al. 111 tested Cr vapor deposition on La0.65Sr0.3MnO3 and found
that Cr vapor deposition did not occur until 1000oC. The observation of Cr vapor
deposition on LSM without application of cathodic or anodic polarization supports the
theory that the nature of Cr vapor deposition on LSM at 1050oC is a chemical process,
in which Mn acts as a nucleation agent.
It was previously reported that the crystal structure of Cr-Mn-Ox, which was formed
as a result of Cr vapor deposition on LSM, was (CrMn)3O4.14, 126 The most prominent
104
form of (CrMn)3O4 is cubic MnCr2O4 spinel in which Mn2+ and Cr3+ occupy the
tetrahedral and octahedral sites, respectively.112, 113 Consequently, it is likely that Mn2+
acts as a nucleation agent for the formation of (CrMn)3O4 as proposed by Jiang et al.114
In order to form Mn2+ species, LSM needs to undergo charge disproportion of Mn3+
according to115
2Mn3+ → Mn2+ +Mn4+ (6-3)
Since the formation of (CrMn)3O4 does not occur until 1050oC, charge disproportion of
Mn3+ is likely to be inhibited below this temperature.
Note that the formation of SrCrO4 on LSCF was found at 600 and 800oC, in which
Sr acted as a nucleation agent. Also, other perovskite materials containing Co and Fe in
B site exhibited similar Cr vapor deposition behavior. By contrast, no formation of
SrCrO4 was detected on LSM at 800oC, and Cr vapor deposition occurred at much
higher temperatures. Since the chemical composition of A site concentration is the
same between LSCF and LSM, the significant difference in Cr vapor deposition
behavior is attributed to B site transition metals. While LSCF exhibits a substantial
oxygen deficiency in air,40, 49 LSM shows oxygen excess. Such high oxygen vacancy
concentration in LSCF is due to the instability of Co4+ and Fe4+, which are generated by
a partial substitution of La for Sr. They are unstable species at high temperatures8 and
thus, LSCF achieves a more stable state by reducing them through oxygen vacancy
formation. In contrast, the valence stability of Mn4+ is relatively higher than that of
Mn3+,116, 117 and therefore, LSM does not exhibit oxygen deficiency. Even though
oxygen vacancies improve the oxygen reduction reaction on the surface and oxygen
diffusion in the lattice,23 their presence weakens the stability of the structure by

105
removing the shielding effect between like atoms. Previously Wang et al.67
demonstrated the effect of oxygen vacancies on bonding strength experimentally. They
found that the elastic modulus of ceria decreases drastically as the oxygen vacancy
concentration increases. This proves that the bonding strength becomes weakened in
accordance with the formation of oxygen vacancies. At elevated temperatures, LSCF
has substantial oxygen vacancies in the lattice45 and thus Sr is likely to be loosely
bound in the lattice. Then enriched Sr in surface region can be precipitated into Sr-O
and react to Cr vapor deposition. In contrast, Sr in LSM, which is not oxygen deficient in
air, is tightly-bound in the lattice and so inert in Cr contaminated environments.
In the previous section, SCF exhibited substantially higher Cr vapor deposition
than LCCF, LSCF, and LBCF. The difference between SCF and other materials is the
concentration of alkaline earth metal ions in A site. As explained, increase in alkaline
earth metal ions increases the basicity of A site. But it also raises the concentration of
unstable Co4+ and Fe4+ species. As a result, SCF has more oxygen vacancies in the
lattice and becomes more reactive to Cr vapor species.
Matsuzaki et al.118 compared Cr vapor deposition behaviors of LSCF and LSM
cathode based cells. They found that Cr vapor deposition occurred on the electrode
surface of LSCF during the cell test at 800 oC. Cr contamination was intense on
electrode surface near the interconnect while it decreased at the three phase boundary
(TPB) of air, electrode and electrolyte. In contrast, in the case of LSM cathode based
cell, Cr vapor deposition was found in TPB region while it was significantly reduced on
the electrode surface. Such different Cr contamination behaviors indicate that the nature
of Cr vapor deposition process on LSCF and LSM during cell operation is not identical.

106
Cr vapor deposition on electrodes can occur either by chemical or electrochemical
reaction. This study shows that Cr vapor species deposited on LSCF at 800 oC in the
absence of polarization currents, which is an evidence of chemical reaction. It was
found that Cr vapor deposition via chemical reaction decreased with increasing
separation distance between metallic interconnect and electrode surface due to the
reduced mass transport of Cr vapor species. This well justifies the observed Cr vapor
deposition on LSCF in literature. Thus, it is likely that Cr vapor deposition on LSCF
electrode during the cell test is chemical reaction. In contrast, this study shows no Cr
vapor deposition on LSM at 800 oC in the absence of polarization currents. This
indicated that Cr vapor deposition on TPB of LSM during the cell test at 800 oC is not
chemical reaction. Previously, Ricoult119 found that cathodic polarization during the
single cell operation caused strong enrichment of Mn2+ at the TPB of LSM and YSZ at
700 oC. As mentioned, Mn2+ is likely to act as a nucleation agent for the formation of
(CrMn)3O4 particles. Consequently, the formation of Mn2+ due to cathodic polarization
leads to preferential deposition of Cr vapor species along the TPB region during the cell
operation. This is in agreement with the observation in literature. Therefore, the
dominant reaction process of Cr vapor deposition on LSM at 800 oC is likely to be the
electrochemical reaction.
At last, it was observed that the grain surface of LSCF exhibited a Sr deficiency in
Cr contaminated environment because enriched Sr on LSCF diffused from grain to grain
boundary regions, forming SrCrO4. Two possible diffusion mechanisms are surface
diffusion and evaporation-condensation. Recently Bishop et al.120 reported mass loss of
La0.6Sr0.4Co0.2Fe0.8O3-δ at 800 oC in air using thermogravimetry. Mass reduction

107
continued over 200 hrs, which is a substantially longer time scale compared with
oxygen diffusion and surface reaction. Such a mass loss phenomenon was difficult to
be justified by Sr enrichment to surface regions or the formation of Ruddlesden-Popper
(RP) phases, which were frequently found from other perovskite materials.68, 71 One can
deduce that Sr-O on LSCF is vaporized at oxidizing conditions at 800 oC. This result
puts more weight on evaporation-condensation for the diffusion mechanism of Sr-O on
LSCF surface.
6.4. Conclusions
This study improves the fundamental understanding of the reaction between
SOFC cathode materials and Cr vapor species. It turns out Cr vapor deposition causes
substantial chemical and structural changes of LSCF surface layers above 600oC,
which involves the formation of SrCrO4 particles, and Sr and transition metal deficient
matrices. This may lead to a significant degradation in surface catalytic activity of LSCF.
LCCF, LBCF, and SCF exhibited similar Cr vapor deposition behavior, in which alkaline
earth metal ions in the A site acted as nucleation agents. In contrast, LSM presented
considerably different behavior in Cr vapor deposition. Mn2+, which is formed as a result
of charge disproportion of Mn3+, seems to act as a nucleation agent on LSM.
Consequently, chemical reaction between LSM and Cr vapor species occurred at higher
temperatures (1050oC). The results imply that transition metals in the B site, rather than
the basicity of A site ions, primarily determines the reactivity to Cr vapor species. It is
proposed oxygen vacancy formation due to instability of Co4+ and Fe4+ increases the
repulsive forces between cations, and allows the formation of nucleation agent at lower
temperatures. Therefore below 1000oC the dominant Cr vapor deposition mechanism

108
on LSCF and LSM during the cell operation is likely to be chemical and electrochemical
reactions, respectively.

109
Figure 6-1. Schematic of experimental design for heat treatment.
Figure 6-2. XRD patterns of tested perovskite materials
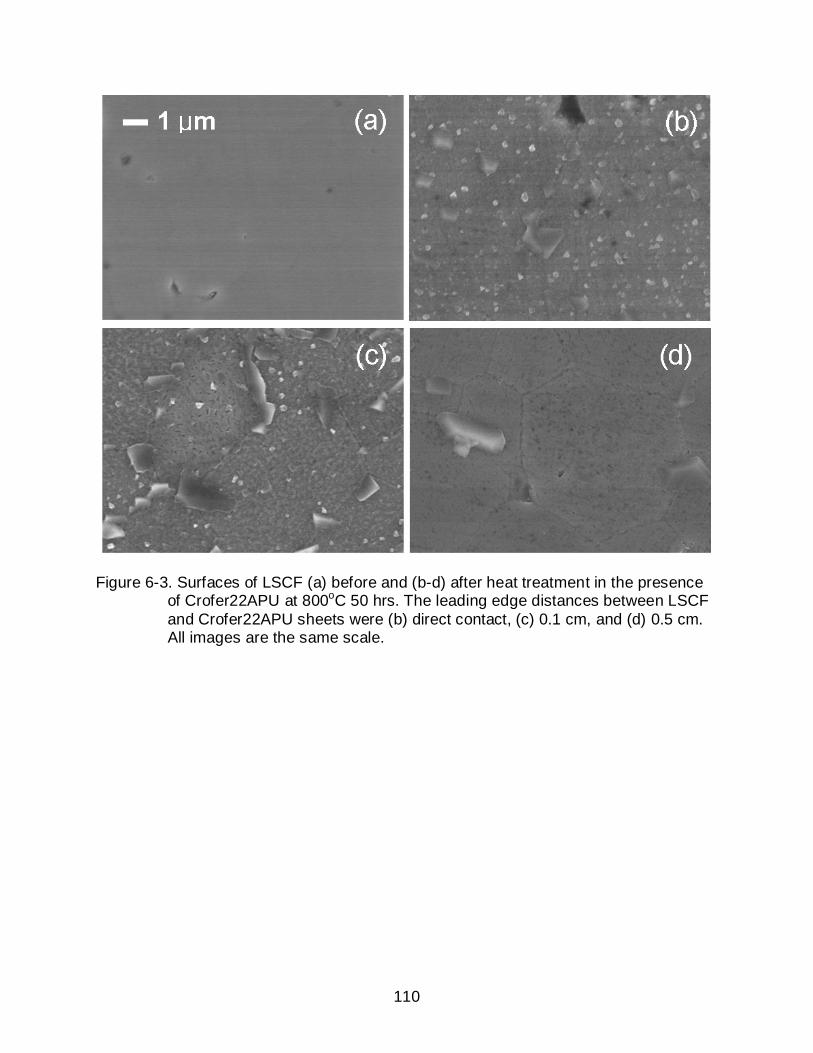
110
Figure 6-3. Surfaces of LSCF (a) before and (b-d) after heat treatment in the presence of Crofer22APU at 800oC 50 hrs. The leading edge distances between LSCF and Crofer22APU sheets were (b) direct contact, (c) 0.1 cm, and (d) 0.5 cm. All images are the same scale.
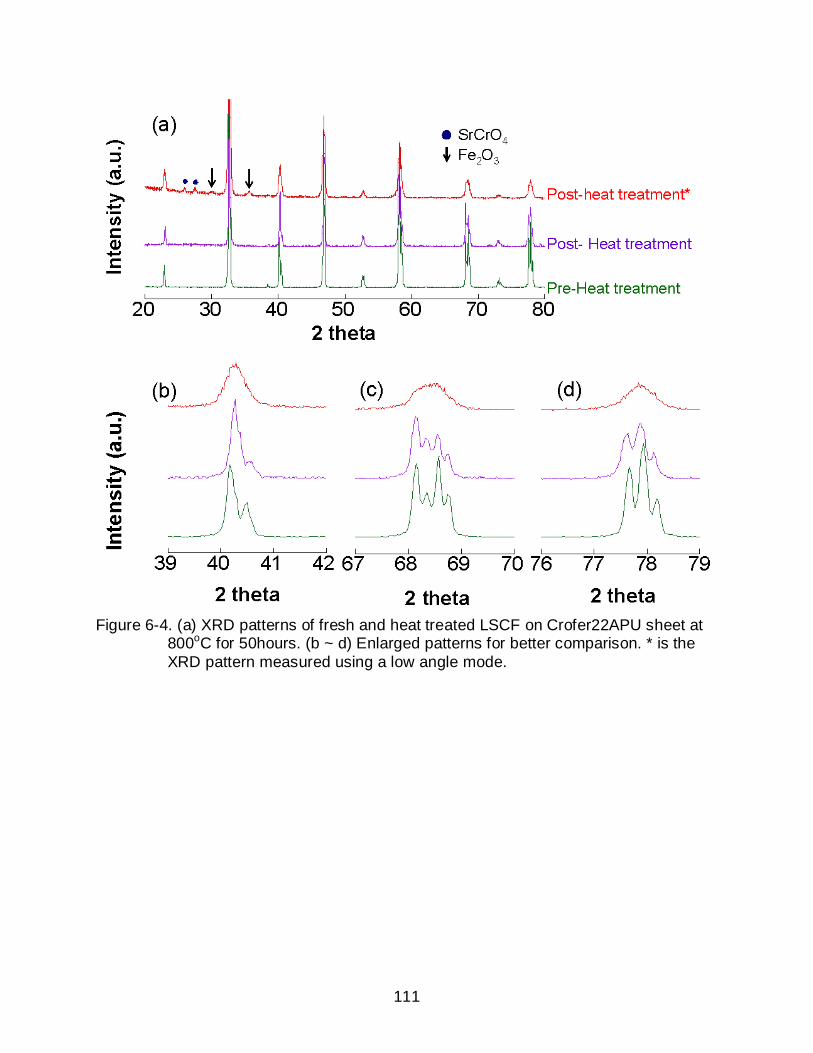
111
Figure 6-4. (a) XRD patterns of fresh and heat treated LSCF on Crofer22APU sheet at
800oC for 50hours. (b ~ d) Enlarged patterns for better comparison. * is the XRD pattern measured using a low angle mode.

112
Figure 6-5. Surfaces of LCCF, LBCF, LSCF and SCF after heat treatment in the presence of Crofer22APU at 800oC for 50 hours. The leading edge distances between samples and Crofer22APU sheet were 0.1 cm and 0.5 cm for the left and right hand sides, respectively.
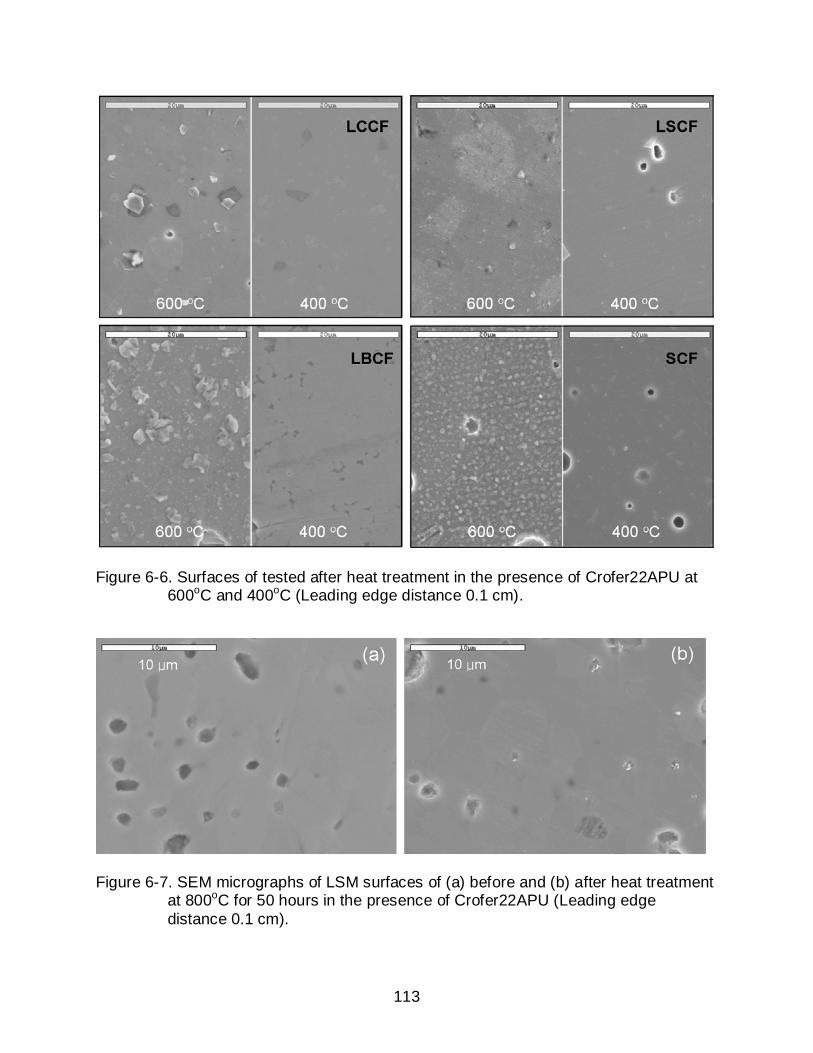
113
Figure 6-6. Surfaces of tested after heat treatment in the presence of Crofer22APU at 600oC and 400oC (Leading edge distance 0.1 cm).
Figure 6-7. SEM micrographs of LSM surfaces of (a) before and (b) after heat treatment
at 800oC for 50 hours in the presence of Crofer22APU (Leading edge distance 0.1 cm).

114
Figure 6-8. (a) SEM micrograph of LSM after heat treatment in the presence of
Crofer22APU at 1050oC for 50 hours, and EDS spectra for (b) the flat region and (c) particle (Leading edge distance 0.1 cm).

115
Table 6-1. Summary of tested ABO3 perovskite materials Composition Abbreviation Preparation method
La0.6Ca0.4Co0.2Fe0.8O3
La0.6Sr0.4Co0.2Fe0.8O3
La0.6Ba0.4Co0.2Fe0.8O3
SrCo0.2Fe0.8O3
La0.6Sr0.4MnO3
LCCF LSCF LBCF SCF LSM
Solid State synthesis Praxair specialty
Solid State synthesis Solid State synthesis Solid State synthesis
Table 6-2. Chemical composition of Crofer22APU Cr Fe Mn Si Cu La
20~24 Bal. 0.3~0.8 0.5 0.5 0.04~0.2
Table 6-3. Elemental atomic percents (%) of LSCF after heat treatment at 800oC for 50 hrs in the presence of Crofer22APU obtained using EDS
Table 6-4. AES atomic percents of LSCF after heat treatment(HT) at 800oC for 50 hours
The enrichment factors are given in parenthesis. * A flat surface region was selected for the analysis.
La Sr Co Fe O Cr Non-heat treated 12 9 4 14 61
Post-heat treatment Flat surface 17 8 4 20 51
Particles 5 16 1 5 58 15
La Sr Co Fe O Non-heat treated 30 12 5 11 42 HT in the presence of Crofer22APU* 38 (1.2) 8 (0.6) 2 (0.4) 8 (0.7) 44
HT in the absence of Crofer22APU 28 (0.9) 22 (1.8) 0 (0) 7 (0.6) 43

116
Table 6-5. Elemental atomic percents of non-heat treated and heat treated samples* LCCF La Ca Co Fe Cr
Non-heat treated 12 8 4 16
Post heat treatment 1 18 1 2 19
LBCF La Ba Co Fe Cr
Non-heat treated 17 11 4 21
Post heat treatment 1 16 1 4 14
SCF Sr Co Fe Cr
Non-heat treated 27 6 25
Post heat treatment 21 3 12 12
*The newly formed particles after heat treatment were selected for the analysis.

117
CHAPTER 7 DEGRADATION MECHANISM AND THEIR IMPACT ON OXYGEN REDUCTION
KINETICS OF LSCF
7.1. Introduction
The advantages of using Fe-Cr metal alloys as interconnects for solid oxide fuel
cell (SOFC) stacks include reduction in manufacturing costs, good machinability and
enhanced thermo-mechanical stability.109, 110 However, Cr vapor species generated
from the Cr scales of these alloys are known to react with the cathode, forming a less
catalytically active phase.40, 104, 121 The long-term stability is an important requirement for
the commercialization of SOFCs. Thus, there is a need to understand cathode
performance in Cr contaminated environments over long time periods. In this study, the
influence of Cr contamination on the oxygen reduction reaction of La0.6Sr0.4Co0.2Fe0.8O3
(LSCF) was examined using electrical conductivity relaxation (ECR),48, 49, 52 AC
impedance spectroscopy23, 80, 91 and temperature programmed isotopic exchange
(TPX).54, 122 The impact of Cr vapor deposition on surface morphology and composition
of LSCF was clearly identified from post ECR characterization.
7.2. Experimental.
7.2.1 AC Impedance
A symmetric cell, which consists of LSCF/GDC/LSCF, was prepared for the
impedance measurement. A dense Gd0.1Ce0.9O2-δ (GDC, Anan Kasei, Japan) electrolyte
was made by sintering a pressed pellet at 1450 oC for 4 hours. A LSCF ink was
prepared by mixing LSCF powder with texanol based polymer vehicle (ESL electro-
science, USA) using Thinky mixer (Thinky, Japan). The ink was symmetrically painted
on both sides of the electrolyte, each having a same electrode area of 0.28 cm2. Pt
wires were connected as a current collector and LSCF ink was applied for better

118
contact. After that, the cell was sintered at 1100 oC for 1 hour with heating and cooling
rate of 5 oC/ mins.
AC impedance of the symmetric cells was measured at 800 oC in the presence
and absence of K-type thermocouple using a Solartron SI 1260 frequency response
analyzer. The amplitude of the excitation voltage was 50 mV and the AC frequency
range was from 0.1 to 105 Hz. Measurement was repeated every 1 hour using ZPlot
software (Scribner). The experimental data was fit using the equivalent circuit shown in
Figure 1 using ZView software (Scribner) in order to de-convolute the impedance
response and extract the electrode resistance. It consists of a series of resistors (R) and
constant phase elements (CPE). In the figure, RE is the electrolyte ohmic resistance,
and RHF and RLF refer to high and low frequency resistance respectively. The electrode
area specific resistance (ASRp) is obtained by
2Area)R(RASR ElectrodeLFHF
p⋅+
= (7-1)
7.2.2 Electrical Conductivity Relaxation
A dense LSCF sample was prepared for analysis. It was prepared by pressing
La0.6Sr0.4Co0.2Fe0.8O3-δ powder (Praxair Specialty Ceramics, USA) uni-axially and
sintering a pellet at 1400oC for 4 hours in air. The density of the sintered body
measured by the Archimedes method was ~ 97% of the theoretical value (6.36g/cm3).
The sintered body was cut and then polished with a series of SiC papers and diamond
abrasives (Leco) down to 1μm. . After polishing, samples were cleaned with DI water
and acetone before ECR measurement. The sample dimension was approximately
0.1x2x20 mm3.
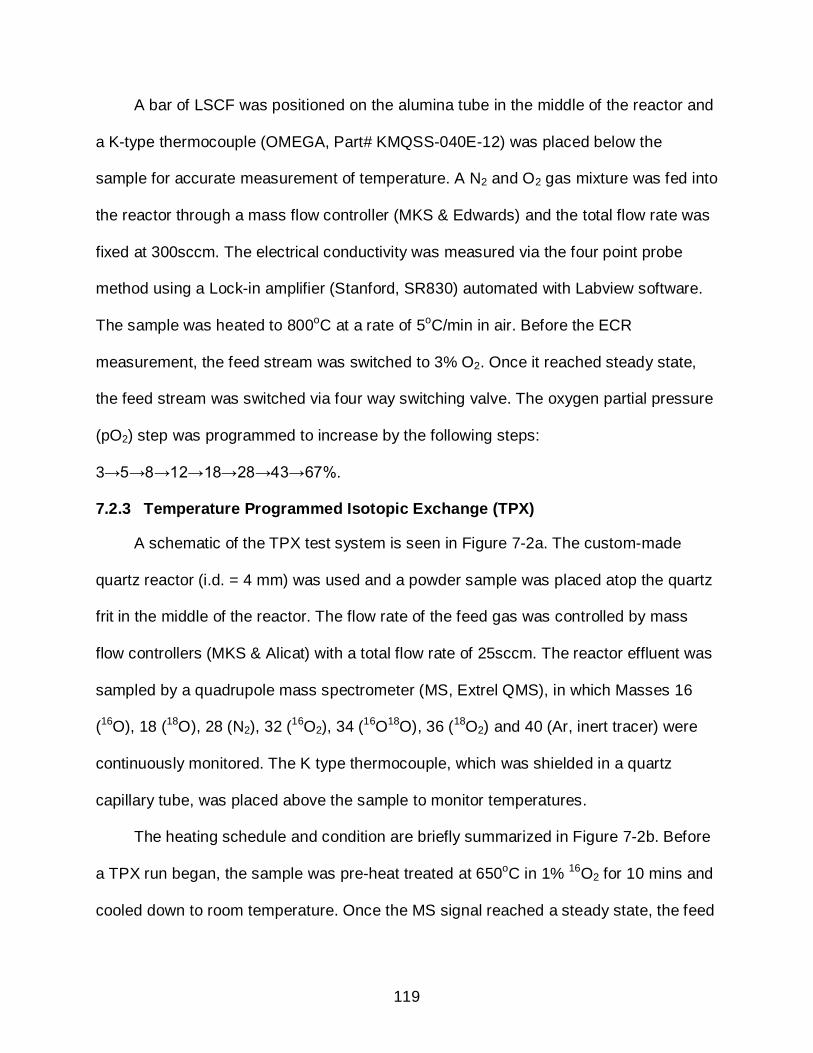
119
A bar of LSCF was positioned on the alumina tube in the middle of the reactor and
a K-type thermocouple (OMEGA, Part# KMQSS-040E-12) was placed below the
sample for accurate measurement of temperature. A N2 and O2 gas mixture was fed into
the reactor through a mass flow controller (MKS & Edwards) and the total flow rate was
fixed at 300sccm. The electrical conductivity was measured via the four point probe
method using a Lock-in amplifier (Stanford, SR830) automated with Labview software.
The sample was heated to 800oC at a rate of 5oC/min in air. Before the ECR
measurement, the feed stream was switched to 3% O2. Once it reached steady state,
the feed stream was switched via four way switching valve. The oxygen partial pressure
(pO2) step was programmed to increase by the following steps:
3→5→8→12→18→28→43→67%.
7.2.3 Temperature Programmed Isotopic Exchange (TPX)
A schematic of the TPX test system is seen in Figure 7-2a. The custom-made
quartz reactor (i.d. = 4 mm) was used and a powder sample was placed atop the quartz
frit in the middle of the reactor. The flow rate of the feed gas was controlled by mass
flow controllers (MKS & Alicat) with a total flow rate of 25sccm. The reactor effluent was
sampled by a quadrupole mass spectrometer (MS, Extrel QMS), in which Masses 16
(16O), 18 (18O), 28 (N2), 32 (16O2), 34 (16O18O), 36 (18O2) and 40 (Ar, inert tracer) were
continuously monitored. The K type thermocouple, which was shielded in a quartz
capillary tube, was placed above the sample to monitor temperatures.
The heating schedule and condition are briefly summarized in Figure 7-2b. Before
a TPX run began, the sample was pre-heat treated at 650oC in 1% 16O2 for 10 mins and
cooled down to room temperature. Once the MS signal reached a steady state, the feed

120
gas was switched to 0.25% 18O2 (Cambridge Isotope, 95% pure), followed by sample
heating at a linear rate of 30oC/mins. All gas mixtures were balanced by helium.
7.2.4 Characterization
The microstructure and element distribution before and after ECR measurement
was characterized by scanning electron microscopy (SEM, JEOL JSM6400), combined
with energy dispersive spectroscopy (EDS, Oxford, UK). ZAF correction was used for
semi-quantitative analysis for EDS. In addition, surface chemical composition of LSCF
before and after ECR test was measured using Auger electron spectroscopy (AES, AES
Perkin-Elmer PHI 660). The accelerating voltage was 10 kV and it scanned the energy
ranges between 50 to 2050 eV, which covered the characteristic peaks of LaMNN (625
eV), SrLMM (1649 eV), Co (775 eV), FeLMM (703 eV), and OKLL (510 eV). These
characteristic peaks were selected in order to minimize interference with each other.
Obtained AES spectra were differentiated, and elemental atomic percents were
calculated using AugerScan 3.2.0 software (RBD Instrument). The specific surface area
of powders was measured by BET analysis (Quantachrome NOVA 1200).
7.3 Results and Discussion
7.3.1 AC Impedance
Figure 7-3 shows the impedance spectra of a LSCF/GDC/LSCF symmetric cell at
800oC. There are approximately two semi-circles, which consists of high frequency (HF)
and low frequency (LF) components as seen in the figure. As the measurement was
conducted at 800oC, the size of semi-circles changed with aging. For easier comparison,
the HF intercepts of the semi-circles were subtracted in Figure 7-3. After 190 hours, the
size of the HF semi-circle was found to increase, while that of the LF semi-circle
remained roughly constant. HF and LF components were de-convoluted by fitting the

121
equivalent circuit (Figure 7-1) to experimental data, and the related area specific
resistance (ASR) was plotted as a function of aging time in Figure 7-4a. This shows that
the electrode ASR, which is the sum of ASRHF and ASRLF, increased relatively faster for
the first 50 hours due to the increase in ASRHF. Then the degradation rate became
slightly reduced, but the electrode ASR increased continuously. The overall electrode
ASR increased approximately 57% after 190 hours. In contrast, if the K-type
thermocouple inside the reactor was removed during impedance measurement, the
symmetric cell exhibited roughly constant ASRHF and ASRLF for 190 hours at 800oC as
shown in Figure 4b. Since the temperatures were maintained by the same furnace
temperature controller, which was located outside of the quartz reactor, the
temperatures were essentially the same in both cases. The temperature differences
between inside and outside of the reactor were less than ± 5 oC.
Each semi-circle corresponds to different reaction mechanisms. Previously
Esquirol et al.91 and Sahibzada et al.80 measured the impedance of LSCF/GDC/LSCF
symmetric cell, and observed the formation of two semi-circles at 800 oC. They
attributed the HF and LF components to the surface reaction and gas phase diffusion,
respectively. In this study, the ASRHF was found to increase while ASRLF remained
roughly constant at 800 oC when the symmetric cell was tested in the presence of K-
type TC in the reactor. This indicates that resistance for surface reaction increased due
to K-type TC.
7.3.2 Electrical Conductivity Relaxation
Figure 7-5a shows an electrical conductivity relaxation curve after switching the
pO2 from 43 to 67% at 800oC, which is normalized by initial and final equilibrium

122
electrical conductivities. It shows that the kinetic model fits well to experimental data.
Figure 7-5b shows the variation of relaxation curves with aging when the pO2 was
switched from 43 to 67%. As the ECR run was repeated over time at isothermal
condition, the relaxation time, which was required to reach a new equilibrium, gradually
increased. This indicates degradation of oxygen transport on the surface or in the bulk..
Chemical diffusion (Dchem) and chemical exchange (Kchem) coefficients in the pO2
range from 5 to 67% at 800oC were obtained by fitting kinetic model to relaxation curves.
They were plotted in log scale as a function of aging time in Figure 7-6. It shows that the
degradation rate of Dchem was not significant over the entire pO2 range, while Kchem
exhibited relatively fast reduction up to 400 hours. Note that Kchem in log scale linearly
dropped. This means that the degradation rate of Kchem was relatively faster at the
beginning and decreased at longer time. Since Kchem represents the apparent rate for
oxygen exchange reaction at the surface, the results indicate degradation of surface
layers during the measurement. Since K-type thermocouple (TC) was located under the
LSCF bar, it is likely the source of the Cr contamination on LSCF surface. Post ECR
characterization clearly showed how it degraded the surface morphology and
composition.
The relationship between electrode ASR (ASRp) and surface exchange coefficient
(Ko) is 100, 102
oP22o CASRFz
TRK ⋅= (7-2)
where R is the gas constant, T is the absolute temperature, F is faraday constant,
n is the number of electron transferred during the reaction, and Co is oxygen
concentration. Furthermore, Ko can be converted into KChem by94
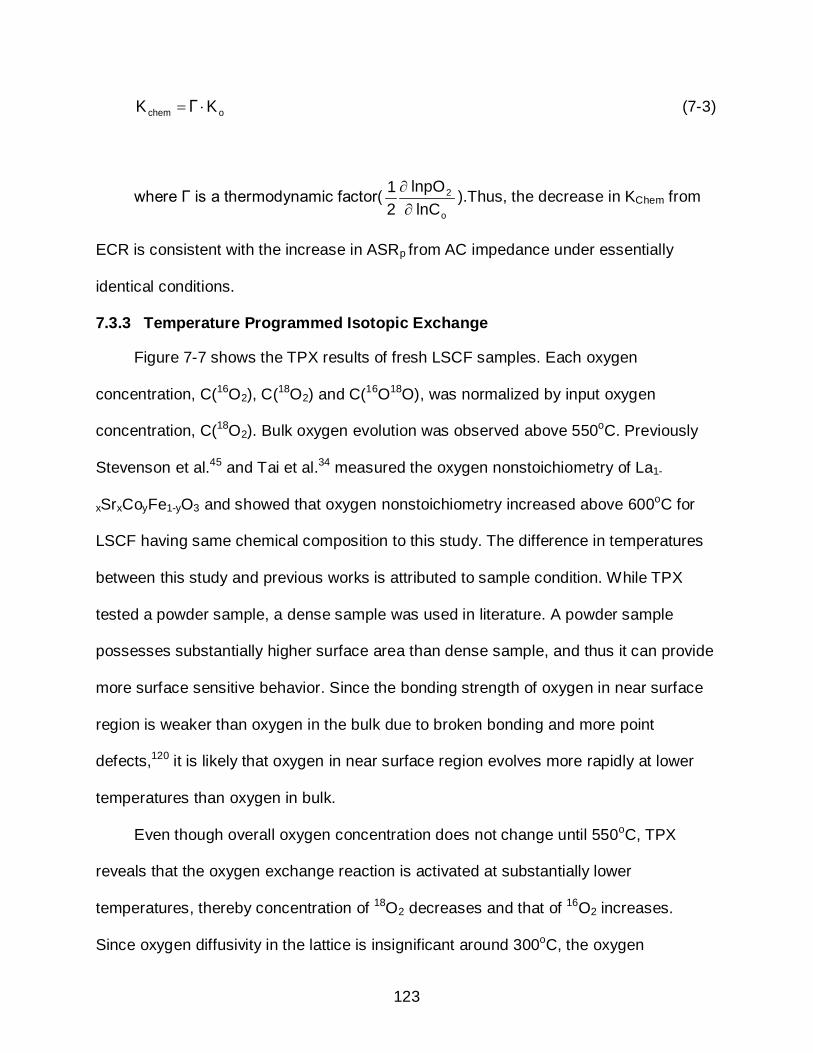
123
ochem KΓK ⋅= (7-3)
where Г is a thermodynamic factor(o
2
lnC lnpO
21
∂∂ ).Thus, the decrease in KChem from
ECR is consistent with the increase in ASRp from AC impedance under essentially
identical conditions.
7.3.3 Temperature Programmed Isotopic Exchange
Figure 7-7 shows the TPX results of fresh LSCF samples. Each oxygen
concentration, C(16O2), C(18O2) and C(16O18O), was normalized by input oxygen
concentration, C(18O2). Bulk oxygen evolution was observed above 550oC. Previously
Stevenson et al.45 and Tai et al.34 measured the oxygen nonstoichiometry of La1-
xSrxCoyFe1-yO3 and showed that oxygen nonstoichiometry increased above 600oC for
LSCF having same chemical composition to this study. The difference in temperatures
between this study and previous works is attributed to sample condition. While TPX
tested a powder sample, a dense sample was used in literature. A powder sample
possesses substantially higher surface area than dense sample, and thus it can provide
more surface sensitive behavior. Since the bonding strength of oxygen in near surface
region is weaker than oxygen in the bulk due to broken bonding and more point
defects,120 it is likely that oxygen in near surface region evolves more rapidly at lower
temperatures than oxygen in bulk.
Even though overall oxygen concentration does not change until 550oC, TPX
reveals that the oxygen exchange reaction is activated at substantially lower
temperatures, thereby concentration of 18O2 decreases and that of 16O2 increases.
Since oxygen diffusivity in the lattice is insignificant around 300oC, the oxygen
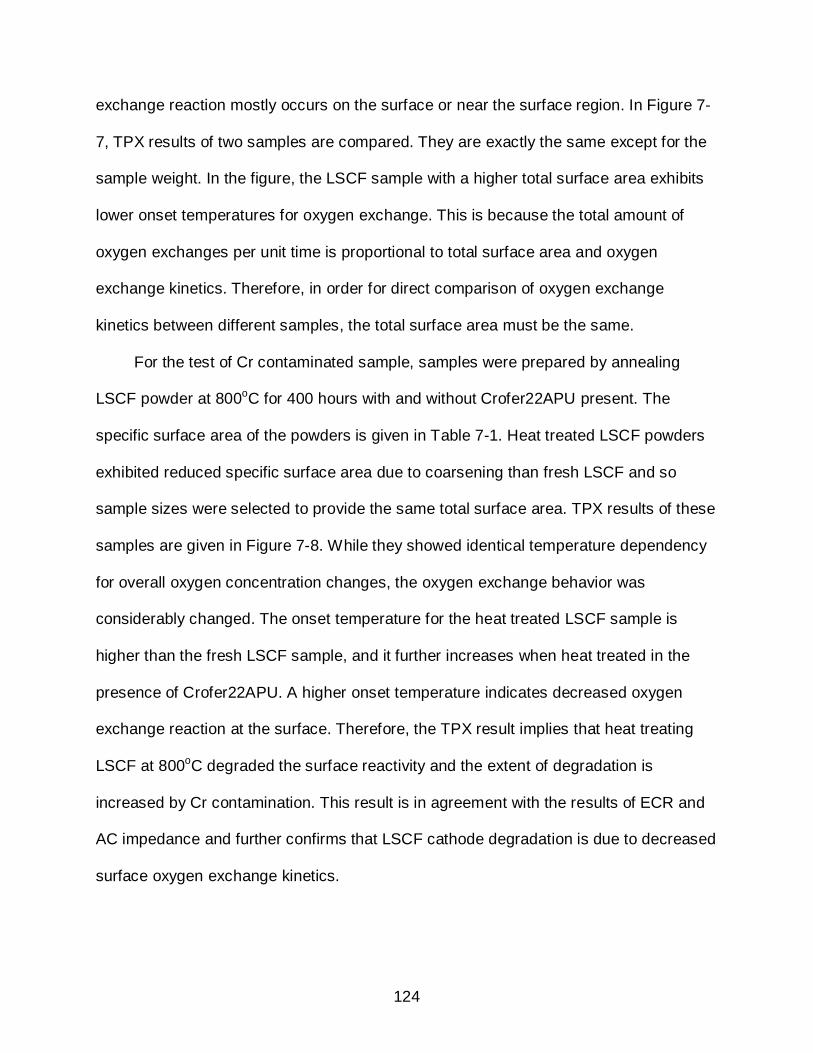
124
exchange reaction mostly occurs on the surface or near the surface region. In Figure 7-
7, TPX results of two samples are compared. They are exactly the same except for the
sample weight. In the figure, the LSCF sample with a higher total surface area exhibits
lower onset temperatures for oxygen exchange. This is because the total amount of
oxygen exchanges per unit time is proportional to total surface area and oxygen
exchange kinetics. Therefore, in order for direct comparison of oxygen exchange
kinetics between different samples, the total surface area must be the same.
For the test of Cr contaminated sample, samples were prepared by annealing
LSCF powder at 800oC for 400 hours with and without Crofer22APU present. The
specific surface area of the powders is given in Table 7-1. Heat treated LSCF powders
exhibited reduced specific surface area due to coarsening than fresh LSCF and so
sample sizes were selected to provide the same total surface area. TPX results of these
samples are given in Figure 7-8. While they showed identical temperature dependency
for overall oxygen concentration changes, the oxygen exchange behavior was
considerably changed. The onset temperature for the heat treated LSCF sample is
higher than the fresh LSCF sample, and it further increases when heat treated in the
presence of Crofer22APU. A higher onset temperature indicates decreased oxygen
exchange reaction at the surface. Therefore, the TPX result implies that heat treating
LSCF at 800oC degraded the surface reactivity and the extent of degradation is
increased by Cr contamination. This result is in agreement with the results of ECR and
AC impedance and further confirms that LSCF cathode degradation is due to decreased
surface oxygen exchange kinetics.
125
It is reported that the chemical composition of the LSCF surface is different from
that of bulk at high temperatures. Viitanen et al.61 observed the absence of Co and Fe in
the outermost atomic layer from contamination-free LSCF after an oxygen permeation
experiment at 900oC. Bucher et al.59 found Sr enrichment on the surface after
measuring chemical exchange coefficient of LSCF at 600-700oC. Furthermore,
Furthermore, Oh et al.84 showed that enriched Sr in LSCF precipitated into submicron
sized Sr-O particles under an oxidizing condition in temperature range of 600-900oC.
They also observed reduced concentration of transition metals on the surface in
accordance with Sr-O precipitation at 800oC. Similarly, enrichment of A site cation is
also found in other perovskite materials such as La1-xSrxMnO3,123 BaTiO3,70 and
SrTiO364-66 at elevated temperatures. As a result concentration of B site transition
metals became reduced in the surface region. Rahmati et al.64 observed the formation
of Sr-O islands on the surface of SrTiO3. They found that the areal density of surface
islands under re-oxidized conditions (1200oC for 30 hours) increased with increasing
surface energies of underlying grains. This indicates that formation of Sr-O islands is
due to the stabilization of surface. Szot. et al68 investigated the chemical variations of
several ABO3 perovskite materials at elevated temperatures (500-1000oC) and
consistently found formation of AO layers on the surface , which is known as
Ruddlesden-Popper Phase (RP).71 They propose that the formation of RP phase is
stable in oxidizing condition. When LSCF powder was heat treated at 800oC for 400
hours in the absence of Crofer22APU sheets, the surface is likely to have Sr enriched
and transition metal deficient phase. Since B site transition metals play a critical role for
catalytic activity of ABO3 perovskite materials26, 66-68 and Sr-O is a electrically insulator74,

126
such Sr enrichment and the formation of Sr-O precipitates on the surface degrades the
surface catalytic activity. Thus, it is likely the cause for the increase in the onset
temperature when LSCF is heat treated without Crofer22APU present. The reason for
higher onset temperature in Cr contaminated LSCF will be explained in following section.
7.3.4 Post ECR Characterization
Figure 7-9a and 7-9b are SEM micrographs of LSCF before and after ECR test,
respectively. While the surface before ECR testing is flat and unblemished, it becomes
rugged and the formation of facetted particles is found along grain boundary surfaces
after ECR testing. Elemental atomic percents for a newly formed particle on grain
boundaries as well as grain surfaces between the particles were obtained using energy
dispersive spectroscopy (EDS). As table 7-2 shows, the grain surface did not present
noticeable difference in atomic percents compared to the fresh sample. By contrast, the
particle exhibited substantially increased concentration of Sr and Cr, indicating that the
particles are Sr-Cr-O. This is in good agreement with literatures.40, 104 Since K type
thermocouple (OMEGA) uses 304 stainless steel, which contains around 8 wt% Cr, as a
sheath,124 it is likely that Cr vapor species is formed and deposits on the LSCF
electrode during ECR measurement.
The kinetic measurements in this study consistently show the degradation of
surface catalytic activities. Therefore, the compositional variation of surface layers was
investigated using Auger electron spectroscopy (AES). The grain surface between Sr-
Cr-O particles was selected for the analysis. The elemental atomic percent, which was
obtained using Eq. 11, is given in Table 7-3.
∑=
mm
aa
/SI/SIX (7-4)
127
where I is the peak intensity and S is the relative elemental sensitivity factor for the
Auger line used. Compared to the fresh sample, atomic percent of cations varied
substantially after heat treatment. It shows Sr deficiency on LSCF surface rather than Sr
enrichment. In addition, the transition metals concentrations became halved.
In literatures, Sr enrichment at elevated temperatures was evident on the surface
of LSCF.59, 60 For the comparison, the elemental atomic percents of the LSCF surface,
which was heat treated at 800oC in the absence of Cr contamination, were added in
Table 7-3.103 Sr concentration became doubled and transition metal concentration
decreased after heat treatment in the absence of Cr contamination. In Table 7-3, the
major difference between the two samples arises from A site cation while B site
transition metals show same trends. This implies that Sr-O precipitate on LSCF
surfaces acts as a nucleation agent for the formation of Sr-Cr-O particles. As Sr-Cr-O
particle is preferentially formed along the grain boundaries, it is likely that Sr-O on grain
surface diffuses to grain boundary region either by surface diffusion or by evaporation-
condensation. As a consequence, grain surface of LSCF exhibits Sr deficiency as
observed in this study.
The heterogeneous catalytic activity is primarily determined by interaction between
surface and surrounding gases, and thus surface composition and structure is an
important factor affecting the activity. Even though the rate determining step of oxygen
reduction reaction is not well understood, it is no doubt that B site transition metals play
a critical role for oxygen reduction reaction.26, 66-68 Previously De Souza et al.42
measured surface exchange coefficient of La1-xSrxMn1-yCoyO3 and found that the
activation energy of Ko decreased with increasing Co concentration. And Teraoka et

128
al.37 found that the rate of the oxygen permeation of La1-xSrxCoyFe1-yO3 increased with
increasing Co. Kremenic et al. reported the oxygen adsorption properties of LaMO3
(M=Cr, Mn, Co, Fe, Ni) depended on the transition metals, in which Co and Ma
exhibited the highest oxygen adsorption. . In addition, Kan et al.54 studied the effect of
catalyst impregnation on the catalytic activity for oxygen exchange. They found oxygen
exchange reaction of La0.8Sr0.2MnO3(LSM) was improved with the addition of Co on the
surfaces via wet impregnation. These results in literatures indicate that Co is a
catalytically active element for oxygen reduction reaction. Therefore, the formation of Sr
and transition metal deficient layers on the grain surface of LSCF can bring a significant
degradation in oxygen reduction reaction and eventually cell performance. In the TPX
result, a heat treated LSCF sample in the presence of Crofer22APU exhibited higher
onset temperatures than heat treated LSCF in the absence of Crofer22APU. This
indicates the formation of Sr and transition metal deficient surface more dramatically
reduces the surface catalytic activity than Sr enriched surface.
It should be stressed that the Cr contamination source for ECR and AC impedance
test was a K type TC, which contains Cr alloys as a sheath. In many studies, the TC is
located near the sample in order for accurate measurement of temperatures. However,
this may lead to unwanted Cr contamination on tested samples during the measurement.
In order to prevent it, the TC must be shielded by other materials such as Zirconia or
quartz.
7.4 Conclusions
This study improved degradation mechanism and their impact on the oxygen
reduction reaction of LSCF. The temperature programmed isotopic exchange (TPX)
result showed that heat treating LSCF at 800oC degraded the surface reactivity due to

129
Sr enrichment and the extent of degradation was further increased by Cr contamination.
Electrical conductivity relaxation and AC impedance study consistently showed that
oxygen reduction reaction at the surface was degraded as a result of Cr vapor
deposition. Post ECR characterization revealed that Cr vapor deposition deteriorated
surface properties by forming a catalytically inactive surface layer, which consists of Sr-
Cr-O particles and Sr deficient surface layers. The surface of LSCF also exhibited
reduced concentration of transition metals. It seems that enriched Sr on LSCF surface
acts as a nucleation agent for the formation of Sr-Cr-O particles, and as a result LSCF
surface exhibits Sr deficiency.

130
Figure 7-1. Equivalent circuit to fit the measured impedance data
Figure 7-2. (a) A schematic of the experimental set up used for temperature
programmed isotopic exchange and (b) the pre-heat treatment and measurement conditions

131
Figure 7-3. AC Impedance spectra of LSCF/GDC/LDCF in air at 800oC
Figure 7-4. Area specific resistance of LSCF at 800oC in air as a function of aging time
(a) in the (a) presence and (b) absence of K type thermocouple in the reactor.

132
Figure 7-5. (a) Normalized electrical conductivity relaxation curve after switching oxygen
partial pressure from 43 to 67% at t =0 and (b) variation of relaxation curves with aging at 800oC.
Figure 7-6. Degradation of Kchem and Dchem in Cr contaminated environment at
800oC
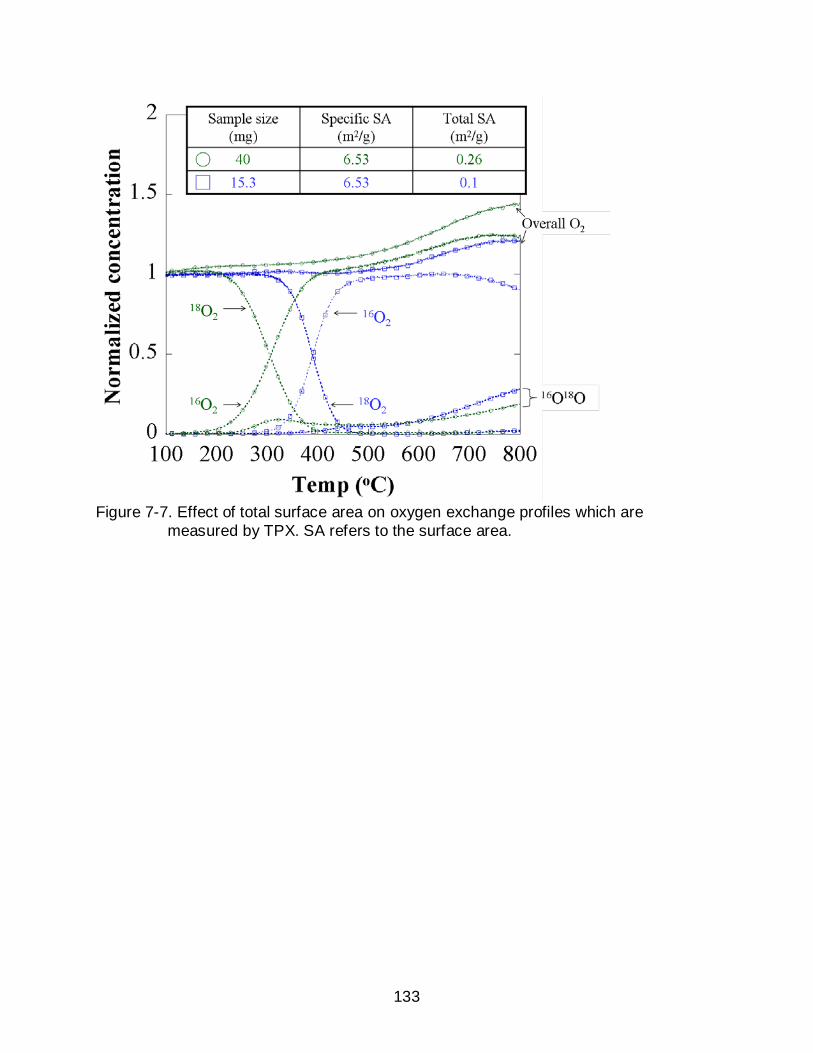
133
Figure 7-7. Effect of total surface area on oxygen exchange profiles which are
measured by TPX. SA refers to the surface area.

134
Figure 7-8. TPX result of heat treated LSCF at 800oC for 400 hours with and without
exposure to Crofer22APU in comparison to fresh LSCF.

135
Figure 7-9. SEM micrographs of polished LSCF surfaces (a) before and (b) after ECR at 800oC for 400 hours.

136
Table 7-1. Samples tested in TPX
Heat treatment conditions Specific SA*
(m2/g) Sample size(mg)
Total SA (m2)
Fresh LSCF LSCF LSCF w/ Crofer22APU
800oC / 400 hours 800oC / 400 hours
6.53 4.38 3.97
15.3 22.8 25.2
0.1 0.1 0.1
* SA is the surface area Table 7-2. Elemental atomic percents (%) of LSCF obtained using EDS
Table 7-3. Elemental atomic percents (%) of LSCF after ECR test at 800oC for 400
hours obtained using AES
The enrichment factors are given in parenthesis. * A grain surface was selected for the analysis.
La Sr Co Fe O Cr Fresh 12 9 4 14 61 Post ECR test at 800oC for 400 hours
Grain surface 17 9 4 19 51 Particles 2 13 1 2 72 10
La Sr Co Fe O Fresh 30 12 5 11 42 Post ECR test at 800oC for 400 hours* 38 (1) 0 (0) 2 (0.3) 8(0.6) 52 Heat treatment at 800oC for 50 hours in the absence of Cr contamination.
28 (0.9)
22 (1.8) 0 (0) 7 (0.6) 43
137
CHAPTER 8 VAPORIZATION OF DOPED ALKALINE EARTH METAL OXIDE
8.1 Introduction
Doped Sr has been found to segregate in the surface region at high
temperatures.59, 60 Bucher el al.59 found Sr enrichment on the surface of LSCF using X-
ray photoelectron spectroscopy (XPS) after electrical conductivity relaxation
measurement at 600-700oC. Similarly Simner et al.38 found Sr enrichment at the
cathode-electrolyte and cathode-current collector interfaces after testing a button cell at
750oC for 500 hours. This study observed that Sr in LSCF not only enriched to the
surface but also precipitated into SrO under oxidizing condition between 600-900oC. As
a heterogeneous catalyst, the surface reaction is primarily affected by surface
composition, and therefore such surface segregation of catalytically inactive element
can lead to degradation of cathode performance.
Recently, Bishop et al.120 reported a slow mass reduction of a dense
La0.6Sr0.4Co0.2Fe0.8O3-δ bar under isothermal conditions in air during thermogravimetric
measurements. The mass reduction was small, but it continued over 200 hours, of
which this time scale is substantially longer than that of oxygen diffusion or oxygen
exchange reaction at the surface. Elemental segregation phenomena in the surface
region may occur during long term heat treatments, but such a mechanism is not
suitable for justifying mass reduction.71, 80 Previously, Mai et al.125 tested the effect of a
Ce0.8Gd0.2O2 (GDC) interlayer between LSCF cathode and a Zr0.92Y0.08O2 (YSZ)
electrolyte in order to prevent chemical reactions between the LSCF and YSZ during
sintering. They found that SrZrO3 was formed at the YSZ interface when the GDC
interlayer was porous while no Sr diffusion occurred when the interlayer was dense.
138
This indicates that Sr was likely to transport from the LSCF cathode to the YSZ
electrolyte via vapor phase diffusion. The objective of this study was to improve the
understanding of the effect of doped alkaline earth metal ions on surface structure at
high temperature. Based on observations in literatures, it was hypothesized that doped
Sr was vaporized in the vicinity of the surface region and a simple heat treatment
experiment was conducted to prove the hypothesis.
8.2 Experimental
LSM was exposed to a stagnant dry atmosphere at 800oC for 50 hours. Samples
were heat treated in the presence of Crofer22APU sheets and BaO (or LSCF powder)
as described in Figure 8-1a. Also, LSM was heat treated with exposure to LSCF powder
and Crofer22APU as described in Figure 8-1b in order to reduce the separation
distance between the LSM surface and the LSCF powder.
8.3 Results and Discussion
Figure 8-2 shows the SEM micrographs of as-polished and heat treated LSM.
Heat treatment was conducted in the same conditions as for the LSCF. In contrast to
the results for LSCF, LSM shows no formation of secondary phase after heat treatment.
This means that LSM must not react with Cr vapor species at 800oC. However, when
LSM was heat treated at higher temperatures, the formation of secondary phases was
found. Figure 8-3a shows the SEM micrographs of LSM after heat treatment at 1050oC
in the presence of Crofer22APU. The formation of facetted particles is clearly observed.
The EDS spectra for the LSM matrix and secondary phase are provided in Figure 8-3b
and 5c, respectively. The characteristic peaks of Mn (Kα1 5.899 keV) and Cr are
pronounced while no Sr and La is found. This means that the secondary phase is a Mn-

139
Cr-Ox. It seems that Sr2+ in LSM is in a stable state, and as a result LSM reacts with Cr
vapor differently than LSCF. Since A-site cations are the same for LSCF and LSM, the
results indicate that the transition metals in B-site play a critical role for the reactivity to
Cr vapor deposition.
Figure 8-4a represents the SEM micrograph of LSM surface after heat treatment
at 800oC for 50 hours in the presence of Crofer22APU and BaO together. They are
located as illustrated in Figure 8-1a. Compared to heat treated LSM in the absence of
BaO, the formation of secondary phases was observed on the LSM surface. Figure 8-4b
is the spot mode EDS spectrum for the particle. Compared to the EDS spectrum of as-
polished LSM (Figure 8-3c), it shows the characteristic peaks of Ba (Lα1 4.466 keV) and
Cr, proving the presence of Ba and Cr for the particle. It seems that the penetration
depth of accelerated electron beam of SEM is deeper than the size of the particles and
so EDS spectrum for the particle contains the characteristic peaks of LSM. During heat
treatment, LSM was located above BaO powder without any direct contact. Therefore,
the only way for BaO to deposit on LSM surface is through vapor phase diffusion, in
which a vapor phase is formed from the BaO powder and mass transported to the LSM
surface. As Ba vapor species are basic,126 they interact with the acidic Cr vapor
species, forming a salt on LSM surface.110 This study, therefore, shows that the
vaporization of BaO cannot be neglected at substantially lower temperatures than
boiling temperatures.
LSM was heat treated with exposure to LSCF powder and Crofer22APU together
as described in Figure 8-1b. Figure 8-5a is the SEM micrographs of LSM after heat
treatment at 800oC for 50 hours. It shows the formation of particles on grain boundary
140
after heat treatment. Figure 8-5b is the EDS spectrum for the particle. The intensity of
the characteristic peak of Sr substantially increased compared to those of La and Mn. In
addition, Cr was also found. It indicates that the particle is a Sr-Cr-Ox and the formation
of Sr-Cr-Ox means the mass transport of Sr vapor from LSCF powder to LSM as same
as BaO. Sr vapor species are also basic, and thus react with Cr vapor species, forming
Sr-Cr-Ox on the surface of the LSM. This result supports that Sr in LSCF is vaporized in
the vicinity of surface region at 800oC. Furthermore this helps explain the slow mass
reduction, which was observed by Bishop et al.120 The formation of Ba-Cr-Ox was found
over the entire surface of LSM when it was heat treated with exposure to BaO and
Crofer22APU. By contrast, the formation of Sr-Cr-Ox was found on the LSM surface
only in the region near the LSCF powder, which is marked by the dotted box in Figure
1b, and the most area remained unchanged. This means vaporization of Sr from LSCF
occurs in the vicinity of surface region.
8.4 Conclusions
Sr vaporization from LSCF was tested by comparing Cr contamination behavior on
LSCF and LSM at high temperature. Heat treatment of LSCF with exposure to
Crofer22APU at 800oC for 50 hours led to the formation of Sr-Cr-Ox particle on LSCF
surface. By contrast, no Cr vapor deposition occurred on LSM at 800oC, and the
formation of Cr-Mn-Ox particle was found at 1050oC. It seems that Sr in LSM is in stable
state and so it does not react with Cr vapor species. When LSM was exposed to BaO
and Crofer22APU at 800oC, the formation of Ba-Cr-Ox particles was found. Since there
was no direct contact between BaO powder and LSM, it indicated that BaO was
vaporized and transported to LSM surface. In a same way, the formation of Sr-Cr-Ox
was found when LSM was heat treated in the presence of LSCF powder and

141
Crofer22APU at 800oC. The result well supports that Sr in LSCF is vaporized in the
vicinity of surface region. As a heterogeneous catalyst, such vaporization of Sr from
LSCF may degrade the catalytic activity and long term performance.
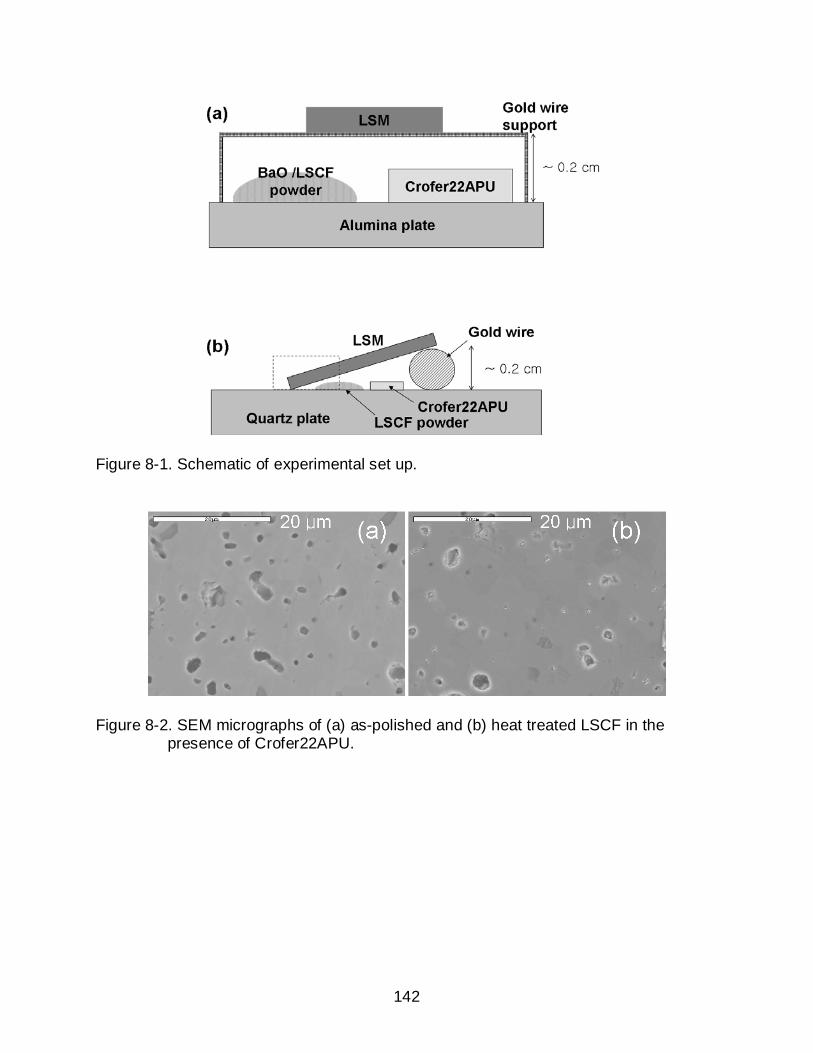
142
Figure 8-1. Schematic of experimental set up.
Figure 8-2. SEM micrographs of (a) as-polished and (b) heat treated LSCF in the presence of Crofer22APU.

143
Figure 8-3. (a) LSM surface after heat treatment at 1050oC for 50 hours in the presence of Crofer22APU sheet. EDS spectra for (b) the newly formed particle after heat treatment and (c) as polished LSM sample.

144
Figure 8-4. (a) Surface of LSM after heat treatment at 800oC for 50 hours in the
presence of BaO powder and Crofer22APU. (b) Spot mode EDS spectra for the particle.
Figure 8-5. (a) SEM micrograph of heat treated LSM surface with exposure to
145
CHAPTER 9 CONCLUSIONS
Surface characteristic of La0.6Sr0.4Co0.2Fe0.8O3 in the absence of and presence of
Cr contamination have been investigated in order to better understand degradation
mechanisms and improve the SOFC cathode performance. In many studies, the oxygen
non-stoichiometry at high temperatures is a major concern for SOFC cathode materials,
and thus A site ions on ABO3 perovskite materials are partially substituted with the ions
having a lower oxidation state to create more oxygen vacancies in the lattice. But this
study showed that some doped Sr tended to segregate in the surface region at high
temperatures and formed catalytically inactive layers. AES and TEM provided that
segregated Sr in La0.6Sr0.4Co0.2Fe0.8O3 (LSCF) precipitated into SrOx and grew on top of
the surface. It seems that excess surface energy due to increase in oxygen vacancies
lead to the precipitation of cations.
Sr segregation led to reduction in the concentration of transition metals on the
surface region, which might bring significant reduction in catalytic activity for oxygen
reduction. In order to improve its performance, cobalt oxide was impregnated into a
porous LSCF cathode via wet impregnation and its effects were tested. The ASR of the
electrode was reduced and the maximum power density of a single LSCF cathode cell
was significantly improved. It seems that increased concentration of cobalt oxide on the
surface enhances surface reaction, especially charge transfer process. But the
possibility of removal of Sr enriched surface layer cannot be ruled out. While a catalyst
impregnation has been widely used previously, mostly expensive materials such as Pt
and Pd were applied. In this study, based on the result of surface characterization,

146
SOFC performance was improved through Co impregnation without incurring significant
increase in material costs.
In the meanwhile, SOFCs need to be operated in a stack, in which Fe-Cr alloys
are used for the interconnect. At high temperatures, Cr was found to vaporize from
these metal alloys and deposit on the cathodes. Electrical conductivity relaxation, AC
impedance spectroscopy and temperature programmed isotopic exchange (TPX)
consistently showed that surface reaction kinetics of LSCF was substantially decreased
in Cr contamination environment. This degradation is attributed to the formation of
SrCrO4 particles and Sr deficient matrix on LSCF surface in Cr contamination condition.
A phase transition from rhombohedral to cubic structure occurred and Fe2O3 was
formed in the near surface region due to Sr deficiency. It was found that the reactivity
between ABO3 perovskite materials and Cr vapor species was not primarily determined
by basicity of A site ions but by B site transition metals. Unstable Co4+ and Fe4+ lead to
the formation of a nucleation agent for the chemical reaction while stable Mn4+ does not
form a nucleation agent. Therefore, Cr contamination is a chemical process for Co-Fe
based materials and an electrochemical process for Mn based materials.
Finally this study identifies that doped Sr in LSCF not only precipitates on the
surface but also vaporizes in the vicinity of the surface region. As LSCF is a
heterogeneous catalyst, this effect can play crucial role in its electrochemical
performance.
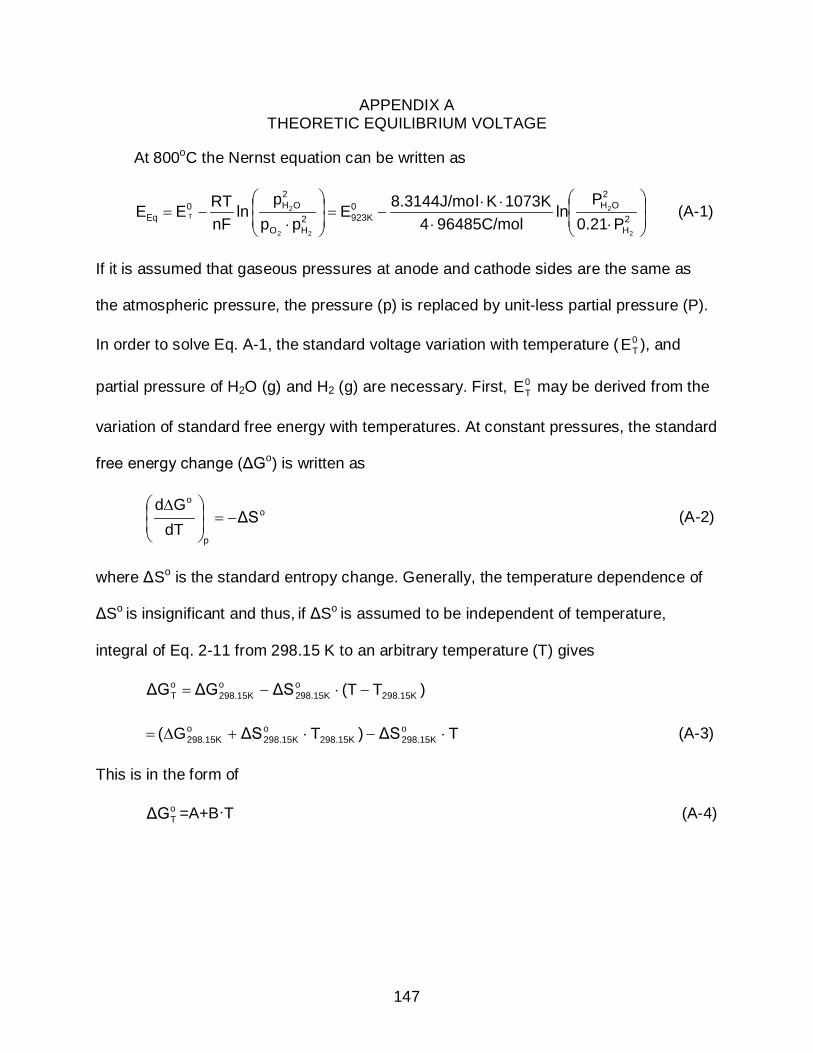
147
APPENDIX A THEORETIC EQUILIBRIUM VOLTAGE
At 800oC the Nernst equation can be written as
⋅⋅⋅⋅
−=
⋅−= 2
H
2OH0
923K2HO
2OH0
Eq2
2
22
2T
P0.21P
ln96485C/mol4
1073KKl8.3144J/moEpp
p ln
nFRTEE (A-1)
If it is assumed that gaseous pressures at anode and cathode sides are the same as
the atmospheric pressure, the pressure (p) is replaced by unit-less partial pressure (P).
In order to solve Eq. A-1, the standard voltage variation with temperature ( 0TE ), and
partial pressure of H2O (g) and H2 (g) are necessary. First, 0TE may be derived from the
variation of standard free energy with temperatures. At constant pressures, the standard
free energy change (ΔGo) is written as
o
p
o
ΔSdTGd
−=
∆ (A-2)
where ΔSo is the standard entropy change. Generally, the temperature dependence of
ΔSo is insignificant and thus, if ΔSo is assumed to be independent of temperature,
integral of Eq. 2-11 from 298.15 K to an arbitrary temperature (T) gives
)T(TΔSΔGΔG 298.15Ko298.15K
o298.15K
oT −⋅−=
TΔS)TΔSG( o298.15K298.15K
o298.15K
o298.15K ⋅−⋅+∆= (A-3)
This is in the form of
oTΔG =A+B·T (A-4)

148
Table A-1 provides the thermodynamic properties of reactants and products. o298.15KΔG
and o298.15KΔS are -228.57 kJ/mol and -88.86 J/mol·K, respectively. Thus, A is -484,000
J/mol and B is 88.86 J/mol·K. Therefore, oTE at 800oC is
1.01V96485C/mol4
K1K88.86J/moll484000J/monF
ΔGEo
ToT =
⋅×⋅+−
−=−=073 (A-5)
Approximate values of OH2P and
2HP can be obtained from the equilibrium vapor
pressure of H2O (g) using Clausius-Clapeyron equation.
19.732T log 4.65T
2900(atm)p log OH2+−−= (A-6)
Since hydrogen gas flows through the anode via a water bath at room temperature
(298.15K), OH2p =0.032 atm and subsequently
2HP =1-0.032=0.968. From Eq. A-5 and A-
6 the equilibrium voltage for an ideal case at 650oC is
1.13V0.9680.21
0.03ln 96485C/mol4
K1Kl8.3144J/mo1.01V E 2
2
Eq =
⋅⋅
⋅⋅−=
073 (A-7)
Table A-1. Thermodynamic properties at 298.15K and 1bar Go (kJ/mol) So (J/mol·K)
O2 (g) 0 205.14 H2 (g) 0 130.68
H2O (g) -228.57 188.82

149
APPENDIX B MEASUREMENT EFFECT OF NON-IDEAL STEP CHANGE IN ECR
A kinetic model of electrical conductivity relaxation (ECR) assumes the ideal step
change of pO2 inside of the reactor. In reality it takes certain amount of time to switch
the gas concentration. Den otter et al. calculated the reactor flush time based on the
continuous stirred tank reactor model (B-1)127
r
STP
totv,f T
TΦVrτ = (B-1)
where τf is the characteristic flush time, Vr it the dead volume, Фv,tot= total flow rate,
TSTP=room temperature, and Tr= reactor temperature. They explained that 99% of gas
inside the reactor would be replaced after the time of 4 x τf has passed. Based on Eq.
B-1, the characteristic flush time of our reactor at 800oC with total flow rate of 500ccm
was calculated according to
0.2sec1073K273K
cc/sec60
5004.4cc
TT
ΦVrτ
r
STP
v,totf ≈×== (B-2)
It takes about 0.8 sec to switch 99% gas inside of the reactor. The actual flush time was
measured by connecting the output of ECR to Mass spectrometer (MS, Extrel QMS). In
order to avoid damage on MS, the gas flow to MS was controlled to 30 sccm using the
ball flow meter between two set-ups as seen in Figure B-1. Figure B-2 shows the
oxygen concentration profile after switching a gas. Eq. B-3 was used to obtain
characteristic flush time128
)τ
t)exp(p(pp(t)pf
0−
−+= ∞∞ (B-3)
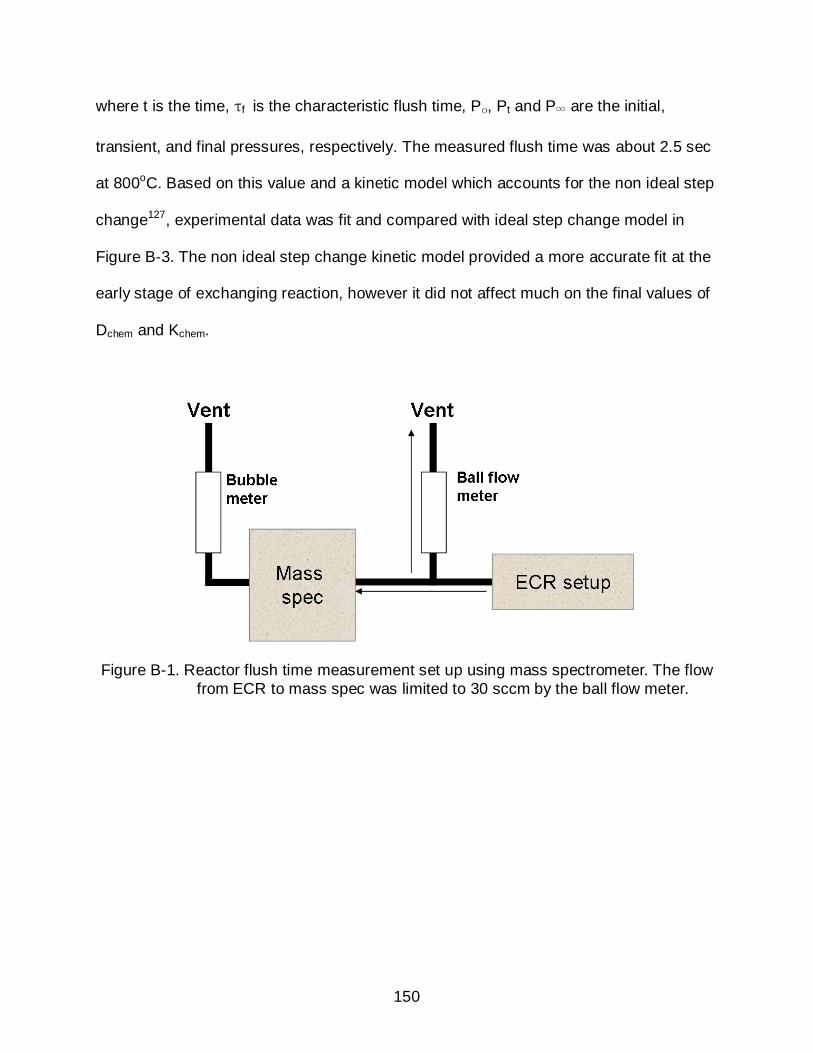
150
where t is the time, τf is the characteristic flush time, Po, Pt and P∞ are the initial,
transient, and final pressures, respectively. The measured flush time was about 2.5 sec
at 800oC. Based on this value and a kinetic model which accounts for the non ideal step
change127, experimental data was fit and compared with ideal step change model in
Figure B-3. The non ideal step change kinetic model provided a more accurate fit at the
early stage of exchanging reaction, however it did not affect much on the final values of
Dchem and Kchem.
Figure B-1. Reactor flush time measurement set up using mass spectrometer. The flow from ECR to mass spec was limited to 30 sccm by the ball flow meter.
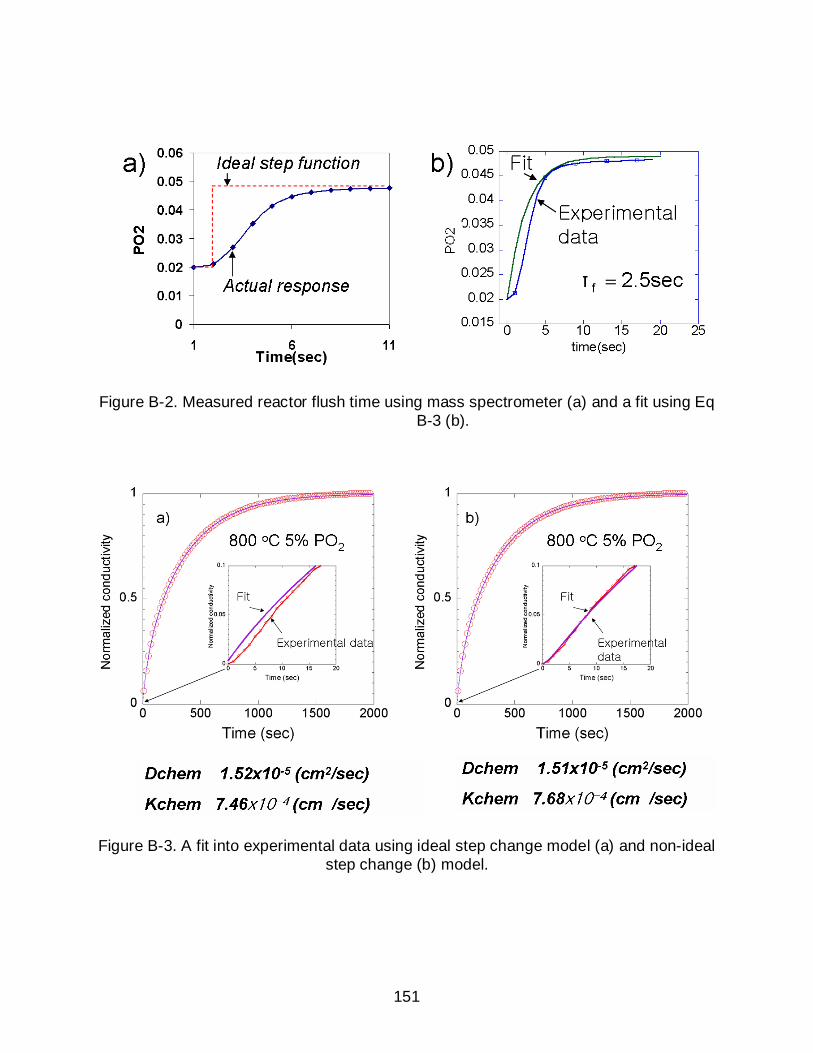
151
Figure B-2. Measured reactor flush time using mass spectrometer (a) and a fit using Eq B-3 (b).
Figure B-3. A fit into experimental data using ideal step change model (a) and non-ideal step change (b) model.

152
CHAPTER C MEASUREMENT OF THE SURFACE SENSITIVE RATE COEFFICIENT USING
ISOTHERMAL ISOTOPIC SWITCHING
C.1 Introduction
There were several attempts to get surface sensitive values by reducing the
sample thickness. Chen et al.143, 144 made an epitaxial thin film of metal oxides with
pulsed laser deposition (PLD) and measured the chemical exchange coefficient (Kchem).
They found that Kchem was much smaller than that of the bulk polycrystalline coefficient.
As Kim et al129 observed, this is because a preferentially oriented thin film has dissimilar
surface properties than a polycrystalline sample. In addition, when a thin film grown on
the single crystal substrate is tested at high temperatures, inter-diffusion across the
interface of film and substrate can occur, changing the oxygen transport property. To
overcome this limitation, Ganeshananthan et al.130 prepared porous bulk polycrystalline
samples with an average grain size of a few microns. They found that the magnitude of
Kchem of La0.6Sr0.4CoO3 was close to other data in the literature, but it increased as
temperature decreased, suggesting an exothermic surface reaction process. The
objective of this study is to introduce the application of a new experimental method to
measure the surface sensitive reaction coefficient: isothermal isotopic switching. One of
the benefits of this technique is easy sample preparation. Either fresh or heat treated
powder can be tested without additional processing (such as pressing and polishing).
Since mass spectrometry monitors the gas composition of the reactor in situ and in real
time, electrode contacts to the samples aren’t necessary. This avoids the potential
contribution to the catalytic activity from triple phase boundaries along the contact131.
Small particle size and high surface area powder samples can provide highly surface
sensitive kinetic values. As an initial test, the surface exchange coefficient of

153
La0.6Sr0.4Co0.2Fe0.8O3-δ (LSCF), an extensively studied material for intermediate
temperature SOFC, was measured and compared to the literature.
C.2 Background
Cathode materials maintain a dynamic equilibrium with the external atmosphere at
sufficiently high temperatures. When an oxygen isotope (18O2) is introduced into the
sample environment, which has been equilibrated with normal oxygen (16O2), under
constant overall oxygen partial pressure, the dynamic equilibrium will not be disturbed,
but normal oxygen in the lattice will be displaced by isotopic oxygen. If isotopic effects
are ignored, this can be expressed as
ו• ⋅→+′′+ o18k
218 O22Ve4(g)O in
O (C-1)
••× +′′+→⋅O
out 2Ve4(g)OO2 216k
o16 (C-2)
Direct measurement of the rate constant (kin and kout) is not possible due to lack of
understanding of the mechanism. Instead, apparent rate coefficients can be measured
assuming a first order reaction such that the flux in and out can be expressed by130
Jin=VSC(t)]C[k
dtdC(t) 18
o18*
in ⋅−= (C- 3)
Jout=VSC(t)]C[k
dtdC(t) 16
o16*
out ⋅−= (C- 4)
where J is the flux, Co is the new equilibrium concentration, C(t) is the
concentration at time t, V is the volume and S is the surface area. kin* and kout* are the
surface exchange coefficients for incorporation and desorption, respectively. Since the
sample is in quasi-equilibrium, it should satisfy Joverall = Jin+Jout = 0. Accordingly, kin* is
equivalent to kout* when ΔC (18O2 ) = -ΔC (16O2 ). If a spherical particle shape is
assumed, integration of Eq. C-3 gives

154
⋅
−=
⋅
−=−−
=
*in
*in
18o
18
18o
18
k3rtexp
kSVtexp
C(0)CC(t)Cg(t) (C-5)
where, C(0) is the initial equilibrium concentration and r is the average particle
radius. Thus, fitting Eq. C-5 to the concentration profile of oxygen isotope obtained by
mass spectrometry will provide surface exchange coefficients (kin*) values.
C.3 Experimental
Commercially available LSCF powder (Praxair) was used without additional
modification. The specific surface area was 6.52 m2/g and the volume averaged particle
radius was 1.4 μm based on manufacturer provided particle size distribution data. The
reactor schematic is the same at temperature programmed isotopic exchange set up.
Due to small sample volume and no electrode connection, reactor size (i.d. = 4.12 mm,
length = 10 cm and volume ~ 1.33 cm3) can be reduced and this ensures fast gas
changing out time in the reactor with a relatively slow gas flow rate. If it follows a
continuously stirred tank reactor model as suggested by den Otter et al127, it takes less
than 1 sec at 800oC with 20CCM. It would take even less time using the plug flow
model. LSCF powder (0.015 g) was placed atop the glass frit in the middle of the
reactor. The flow rate of the feed gas was controlled by mass flow controllers (MKS &
Alicat) adjusted to yield a total flow rate of 20 CCM. Gas composition in feed stream
was switched using an automatic switching valve (Veeco) and the reactor effluent was
constantly sampled by a downstream mass spectrometer (Extrel). First the sample was
pretreated under 16O2 diluted with Helium for 30 mins at 800oC. Once the mass
spectrometry signal reached steady state, the feed gas was switched to 18O2. The total
oxygen concentration was fixed to 10000 PPM. Time dependent relaxation curves were
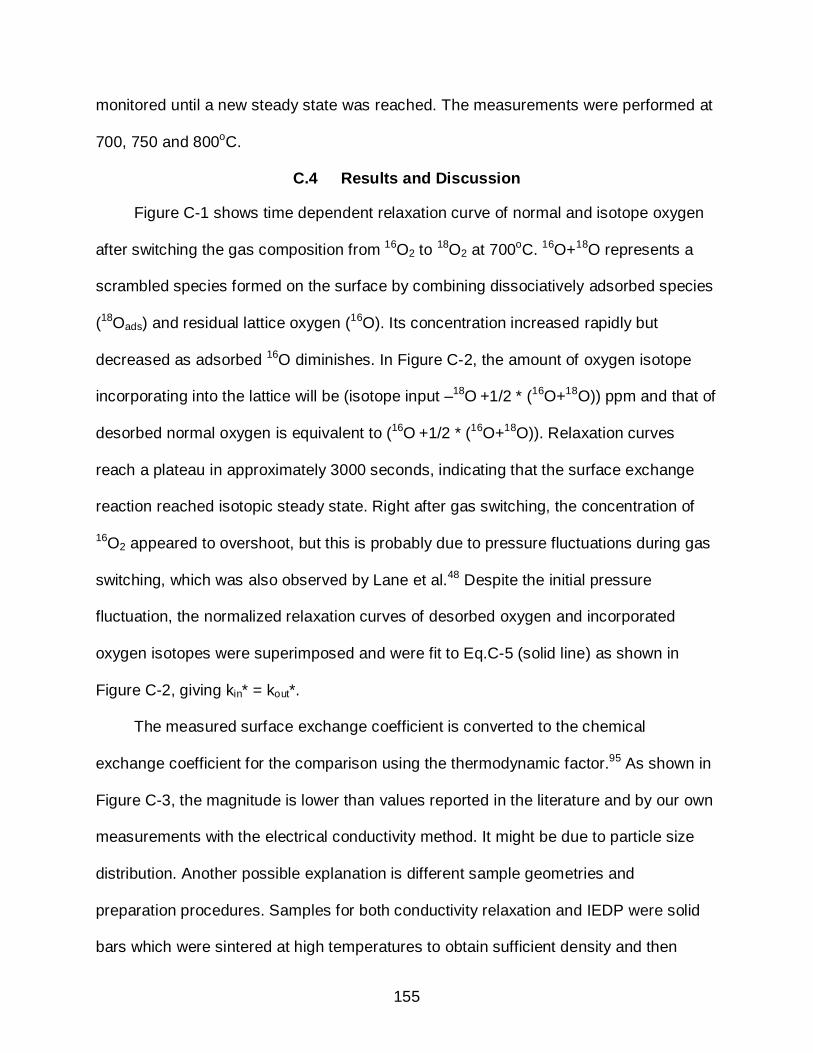
155
monitored until a new steady state was reached. The measurements were performed at
700, 750 and 800oC.
C.4 Results and Discussion
Figure C-1 shows time dependent relaxation curve of normal and isotope oxygen
after switching the gas composition from 16O2 to 18O2 at 700oC. 16O+18O represents a
scrambled species formed on the surface by combining dissociatively adsorbed species
(18Oads) and residual lattice oxygen (16O). Its concentration increased rapidly but
decreased as adsorbed 16O diminishes. In Figure C-2, the amount of oxygen isotope
incorporating into the lattice will be (isotope input –18O +1/2 * (16O+18O)) ppm and that of
desorbed normal oxygen is equivalent to (16O +1/2 * (16O+18O)). Relaxation curves
reach a plateau in approximately 3000 seconds, indicating that the surface exchange
reaction reached isotopic steady state. Right after gas switching, the concentration of
16O2 appeared to overshoot, but this is probably due to pressure fluctuations during gas
switching, which was also observed by Lane et al.48 Despite the initial pressure
fluctuation, the normalized relaxation curves of desorbed oxygen and incorporated
oxygen isotopes were superimposed and were fit to Eq.C-5 (solid line) as shown in
Figure C-2, giving kin* = kout*.
The measured surface exchange coefficient is converted to the chemical
exchange coefficient for the comparison using the thermodynamic factor.95 As shown in
Figure C-3, the magnitude is lower than values reported in the literature and by our own
measurements with the electrical conductivity method. It might be due to particle size
distribution. Another possible explanation is different sample geometries and
preparation procedures. Samples for both conductivity relaxation and IEDP were solid
bars which were sintered at high temperatures to obtain sufficient density and then

156
polished with fine abrasives to produce a flat, well defined surface for more accurate
estimation of surface kinetics.49 This is in contrast this with our sample, which is a fine
powder with a high surface area to volume ratio. As a result, the surface composition or
structure of powder sample can be different from the dense polycrystalline bar, causing
the difference in catalytic activities.
In order to calculate the activation energy of the surface reaction, experiments
were conducted at three different temperatures. Figure C-4 shows the normalized
relaxation curves of 18O2 which shows that the relaxation time decreases as
temperature decreases. Fig.6 shows the Arrhenius plot of kin* which yields an activation
energy of -23 kJ/mol for the surface reaction. This means the surface reaction is
exothermic while in most literature, an endothermic surface reaction for perovskite
materials with similar chemical compositions has been observed.31, 132 Bouwmeester et
al.52 reported an activation energy of 214 kJ/mol for the surface reaction of bulk
polycrystalline LSCF and Chen et al.133 observed the activation energy of approximately
160kJ/mol for La0.5Sr0.5CoO3-δ epitaxial film. However, Ganeshananthan et al.130 found
that the activation energy of porous La0.6Sr0.4CoO3-δ was around -23 kJ/mol, which is
very close to that found from this study. There is one similar aspect between the powder
and porous bulk sample. Both have substantially higher surface area than dense bulk
polycrystalline. As shown in Figure C-4, the surface reaction coefficient increases with
pO2, this means that the rate expression for oxygen reduction should include a surface
coverage term. As surface area becomes larger, surface coverage of adsorbed oxygen
species may play a more important role in determining the apparent activation energy
for surface reaction. Thus, the increase in surface coverage at reduced temperatures

157
might enhance the apparent reaction coefficient, giving negative activation energy.
Whether this is due to high surface area or another factor’s affect on measurement
needs further analysis.
C.5 Conclusions
A new application for the isothermal isotope switching method was applied to
measure surface sensitive reaction coefficients of LSCF. An in situ powder sample was
tested without sintering and electrode contacts. The small sample volume allowed for a
small reactor design, which reduced the gas switch time with relatively lower total gas
flow than other experimental techniques. It shows that time dependent relaxation curves
of normal and isotope oxygen can be fitted to a first order kinetic model. The magnitude
of the surface exchange coefficient of the powder type sample used in this study was
smaller than values reported in literature. That might be due to the different surface
reactivity of fresh powder from dense bulk polycrystalline sample. Relaxation time for
18O2 increased as temperature decreased, giving the activation energy of -23 kJ/mol for
the oxygen reduction process. This is substantially different from previous results for
dense perovskite materials, but it is close to that of porous bulk La0.6Sr0.4CoO3-δ.
Surface coverage of oxygen appears to play a larger role in high surface area samples.

158
Figure C-1. Time dependent relaxation profile of normal oxygen (16O), oxygen isotope (18O) and scrambled oxygen (16O+18O) at 700oC
0
0.2
0.4
0.6
0.8
1
1.2
0 1000 2000 3000 4000 5000 6000
Desorbed oxygenIncorporated isotopeFit
g(t)
Time(sec)
Figure C-2. Normalized concentrations of desorbed oxygen from the sample and incorporated oxygen

159
-6.5
-6
-5.5
-5
-4.5
-4
-3.5
-3
-2.5
-3 -2.5 -2 -1.5 -1 -0.5 0
Our groupLane et alBouwmeester et alThis study
log
k chem
(cm
/sec
)
log pO2
Figure C-3. Kchem measured by ECR in this study and literatures 52, 94, converted using the thermodynamic factor, at 800oC.
0
0.2
0.4
0.6
0.8
1
0 1500 3000 4500 6000
800C750C700C
Nor
mal
ized
con
cent
ratio
n
Time(sec)
Figure C-4. Normalized relaxation curves of incorporated oxygen isotope at different temperatures.
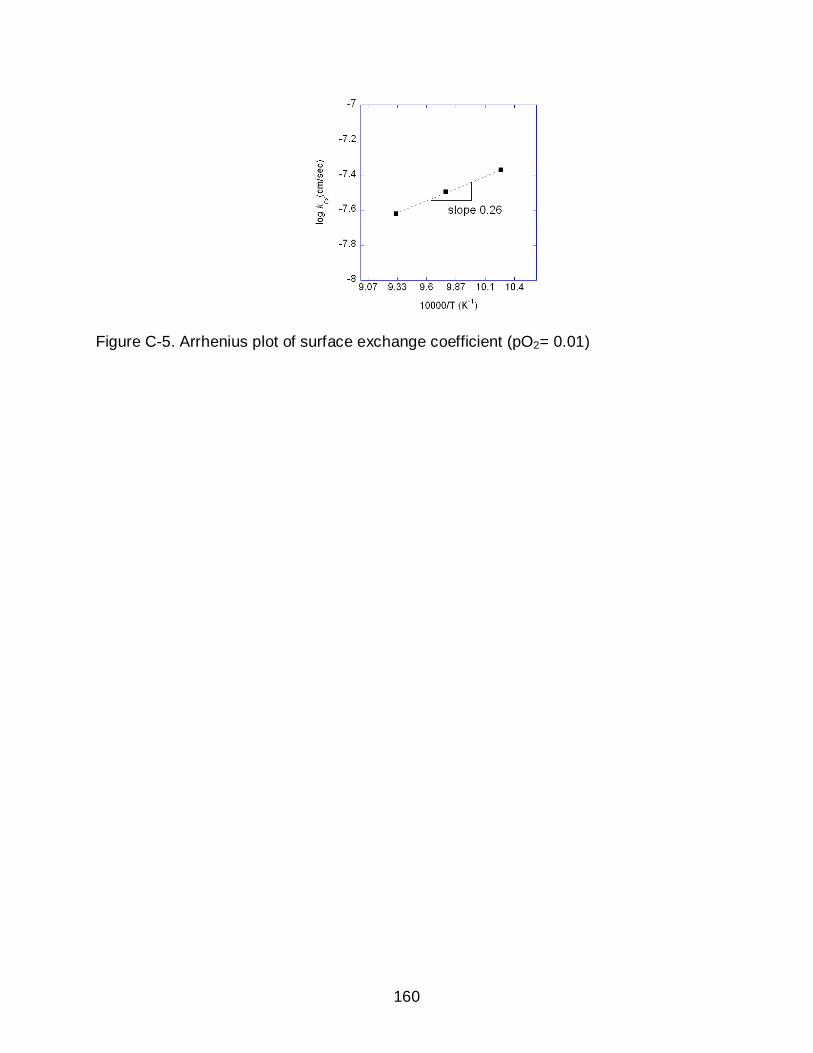
160
Figure C-5. Arrhenius plot of surface exchange coefficient (pO2= 0.01)
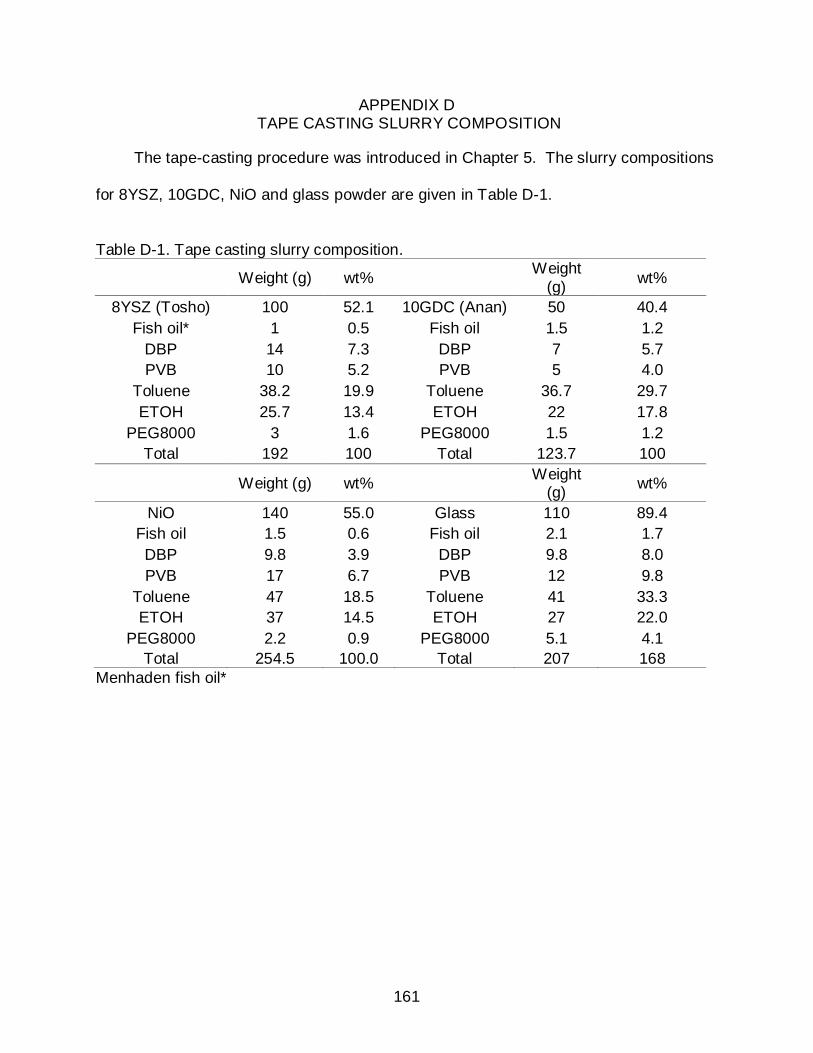
161
APPENDIX D TAPE CASTING SLURRY COMPOSITION
The tape-casting procedure was introduced in Chapter 5. The slurry compositions
for 8YSZ, 10GDC, NiO and glass powder are given in Table D-1.
Table D-1. Tape casting slurry composition.
Weight (g) wt% Weight (g) wt%
8YSZ (Tosho) 100 52.1 10GDC (Anan) 50 40.4 Fish oil* 1 0.5 Fish oil 1.5 1.2
DBP 14 7.3 DBP 7 5.7 PVB 10 5.2 PVB 5 4.0
Toluene 38.2 19.9 Toluene 36.7 29.7 ETOH 25.7 13.4 ETOH 22 17.8
PEG8000 3 1.6 PEG8000 1.5 1.2 Total 192 100 Total 123.7 100
Weight (g) wt% Weight (g) wt%
NiO 140 55.0 Glass 110 89.4 Fish oil 1.5 0.6 Fish oil 2.1 1.7 DBP 9.8 3.9 DBP 9.8 8.0 PVB 17 6.7 PVB 12 9.8
Toluene 47 18.5 Toluene 41 33.3 ETOH 37 14.5 ETOH 27 22.0
PEG8000 2.2 0.9 PEG8000 5.1 4.1 Total 254.5 100.0 Total 207 168
Menhaden fish oil*

162
APPENDIX E CR CONTAMINATION ON LSM82
La0.8Sr0.2MnO3 (LSM82) is the composition, which is more widely used for SOFC
cathodes than La0.6Sr0.4MnO3 (LSM64), which was tested in this study. LSM82 was
tested in a same way that LSM 64 was tested. The powder (Fuel Cell Materials) was
uniaxially pressed and then sintered at 1450oC. Figure E-1a shows the as-polished
surface of LSM82. EDS analysis provided that the darker regions were Mn rich oxide.
Figure E-1b represents the LSM after heat treatment with exposure to Crofer22APU at
800oC for 50 hours. It shows no Cr vapor deposition on the surface. This is in
agreement with LSM64, which indicates that (La1-xSrx)MnO3 does not react with Cr
vapor species at 800oC.
Figure E-1 (a) As-polished LSM82 surface and (b) heat treated LSM82 at 800oC for 50hrs in the presence of Crofer22APU.

163
APPENDIX F KCHEM AND DCHEM AT 750C
The Dchem and Kchem at 750oC were obtained using electrical conductivity relaxation
and plotted as a function of oxygen partial pressure in Figure F-1. The characteristic
dependencies of Kchem and Dchem are close to that at 800oC, meaning that the rate
limiting step of LSCF is a charge transfer between LSCF and oxygen gas. Figure F-2
shows the degradation rate of Kchem at 750oC either. Surface reaction rate decreased at
a relative fast rate during the 70 hours and at a slower rate after 70 hours.
Interestingly, the degradation rate was increased with increasing pO2.
Figure F-1. Dchem and Kchem at 750oC as a function of pO2.

164
Figure F-2. Degradation of Kchem at 750oC.

165
APPENDIX G SURFACE VARIATION OF LCCF AND LBCF
Figure G-1 shows the differentiated AES spectra of La0.6Ca0.4Co0.2Fe0.8O3 (LCCF)
and La0.6Ba0.4Co0.2Fe0.8O3LBCF. In comparison to the AES spectrum of the pre-heat
treated sample, LBCF showed an increase in the characteristic peak of Ba after heat
treatment at 800oC for 50 hrs. By contrast, the AES spectra of LCCF presented weak
change after heat treatment. There is no doubt that the concentration of Ba increased
while that of rest elements decreased but the elemental atomic percents of LBCF may
not be accurate due to peak overlapping. LSCF and LBCF showed similar behavior, but
LCCF showed weak segregation of elements. The tendency of segregation in doped
alkaline earth metal oxides is Ca<Sr≈Ba. Further systematic study is required to explain
difference segregation tendency.
Figure G-1. Differentiated Auger electron spectra for pre (blue) and post (red) heat
treated samples at 800oC for 50 hrs. (a) LCCF and (b) LBCF

166
APPENDIX H COBALT OXIDE DISPERSION ON LSCF SURFACE
Co nitrate solution was prepared by dissolving Co(NO3)2 6H2O and PEG 14g in mixture
of ethanol and water. It was dip-coated and heat treated at 700 and 900oC, respectively.
Figure G-1 shows the formation of nano cobalt oxide on the surface of LSCF.
Figure H-1. LSCF surface after heat treating Co dip-coated LSCF
167
LIST OF REFERENCES
1. R. E. Smalley, Mrs Bulletin, 2005, 30, 412-417.
2. C. J. Campbell and J. H. Laherrere, Scientific American, 1998, 278, 77-83.
3. N. Stern, The economics of climate change : the Stern review, Cambridge University Press, Cambridge, UK, 2007.
4. B. C. H. Steele and A. Heinzel, Nature, 2001, 414, 345-352.
5. S. M. Haile, Acta Materialia, 2003, 51, 5981-6000.
6. O. Yamamoto, Electrochimica Acta, 2000, 45, 2423-2435.
7. R. M. Ormerod, Chem. Soc. Rev., 2003, 32, 17-28.
8. T. Ishihara, Perovskite Oxide for Solid Oxide Fuel Cells Springer, New york, 2009.
9. P. Singh and N. Q. Minh, International Journal of Applied Ceramic Technology, 2004, 1, 5-15.
10. R. O'hayre, S.-W. Cha, W. Colella and F. B. Prinz, Fuel Cell Fundamentals John Wiley & Sons Newyork, 2006.
11. M. C. Williams, J. P. Strakey, W. A. Surdoval and L. C. Wilson, Solid State Ionics, 2006, 177, 2039-2044.
12. E. Fontell, T. Kivisaari, N. Christiansen, J. B. Hansen and J. Palsson, Journal of Power Sources, 2004, 131, 49-56.
13. E. Riensche, U. Stimming and G. Unverzagt, Journal of Power Sources, 1998, 73, 251-256.
14. J. W. Fergus, Materials Science and Engineering A, 2005, 397, 271-283.
15. M. W. Barsoum, Fundamentals of ceramics, McGraw-Hill, London, 2003.
16. H. Ricket, Electrochemistry of Solids: An Introduction Spring-Verlag, New York 1982.
17. S. B. Adler, X. Y. Chen and J. R. Wilson, Journal of Catalysis, 2007, 245, 91-109.
18. S. P. S. Badwal and K. Foger, Ceramics International, 1996, 22, 257-265.
19. W. Z. Zhu and S. C. Deevi, Materials research bulletin 2003, 38, 957-972.
20. H. Y. Zhu and R. J. Kee, Journal of Power Sources, 2006, 161, 957-964.

168
21. R. W. Sidwell and W. G. Coors, Journal of Power Sources, 2005, 143, 166-172.
22. K. C. Wincewicz and J. S. Cooper, Journal of Power Sources, 2005, 140, 280-296.
23. S. B. Adler, Chemical Reviews, 2004, 104, 4791-4843.
24. T. Shimizu, Chemistry Letters, 1980, 1-4.
25. J. Nowotny, T. Bak, M. K. Nowotny and C. C. Sorrell, Advances in Applied Ceramics, 2005, 104, 154-164.
26. R. Hammami, H. Batis and C. Minot, Surface Science, 2009, 603, 3057-3067.
27. Y. J. Leng, S. H. Chan and Q. L. Liu, International Journal of Hydrogen Energy, 2008, 33, 3808-3817.
28. T. Nitadori, T. Ichiki and M. Misono, Bulletin of the Chemical Society of Japan, 1988, 61, 621-626.
29. T. Nakamura, M. Misono and Y. Yoneda, Bulletin of the Chemical Society of Japan, 1982, 55, 394-399.
30. I. Yasuda and T. Hikita, Journal of the Electrochemical Society, 1994, 141, 1268-1273.
31. J. A. Kilner, R. A. DeSouza and I. C. Fullarton, Solid State Ionics, 1996, 86-8, 703-709.
32. J. M. D. Tascon and L. G. Tejuca, Reaction Kinetics and Catalysis Letters, 1980, 15, 185-191.
33. H. Takahashi, F. Munakata and M. Yamanaka, Physical Review B, 1998, 57, 15211-15218.
34. L. W. Tai, M. M. Nasrallah, H. U. Anderson, D. M. Sparlin and S. R. Sehlin, Solid State Ionics, 1995, 76, 273-283.
35. L. W. Tai, M. M. Nasrallah, H. U. Anderson, D. M. Sparlin and S. R. Sehlin, Solid State Ionics, 1995, 76, 259-271.
36. E. Girdauskaite, H. Ullmann, M. Al Daroukh, V. Vashook, M. Bulow and U. Guth, Journal of Solid State Electrochemistry, 2007, 11, 469-477.
37. Y. Teraoka, H. M. Zhang, S. Furukawa and N. Yamazoe, Chemistry Letters, 1985, 1743-1746.
38. S. P. Simner, M. D. Anderson, M. H. Engelhard and J. W. Stevenson, Electrochemical and Solid State Letters, 2006, 9, A478-A481.

169
39. J. Y. Kim, V. L. Sprenkle, N. L. Canfield, K. D. Meinhardt and L. A. Chick, Journal of the Electrochemical Society, 2006, 153, A880-A886.
40. J. W. Fergus, International Journal of Hydrogen Energy, 2007, 32, 3664-3671.
41. C. Sun, R. Hui and J. Roller, Journal of Solid State Electrochemistry, 2009.
42. R. A. De Souza and J. A. Kilner, Solid State Ionics, 1999, 126, 153-161.
43. J. Larminie and A. Dicks, Fuel Cell Systems Explained John Wiley and Sons, 2003.
44. Y. Takeda, R. Kanno, M. Noda, Y. Tomida and O. Yamamoto, Journal of the Electrochemical Society, 1987, 134, 2656-2661.
45. J. W. Stevenson, T. R. Armstrong, R. D. Carneim, L. R. Pederson and W. J. Weber, Journal of the Electrochemical Society, 1996, 143, 2722-2729.
46. M. W. den Otter, L. M. van der Haar and H. J. M. Bouwmeester, Solid State Ionics, 2000, 134, 259-264.
47. S. Wang, P. A. W. van der Heide, C. Chavez, A. J. Jacobson and S. B. Adler, Solid State Ionics, 2003, 156, 201-208.
48. J. A. Lane and J. A. Kilner, Solid State Ionics, 2000, 136, 997-1001.
49. R. Ganeshananthan and A. V. Virkar, Journal of the Electrochemical Society, 2006, 153, A2181-A2187.
50. J. Crank, Mathematics of diffusion, Oxford University Press, London, 1956.
51. R. A. De Souza and J. A. Kilner, Solid State Ionics, 1998, 106, 175-187.
52. H. J. M. Bouwmeester, M. W. Den Otter and B. A. Boukamp, Journal of Solid State Electrochemistry, 2004, 8, 599-605.
53. J. Maier, Pysical Chemistry of Ionic Materials Wiley, West Sussex, 2004.
54. C. C. Kan and E. D. Wachsman, Journal of the Electrochemical Society, 2009, 156, B695-B702.
55. J. Nowotny, T. Bak, M. K. Nowotny and C. C. Sorrell, Advances in Applied Ceramics, 2005, 104, 147-153.
56. M. Thompson, M. D. Baker, A. Christie and J. F. Tyson, Auger Electron Spectroscopy, John Wiley and Sons, Newyork, 1985.
57. G. E. Mcguire, Auger Electron Spectroscopy Reference Manual, Plenum, New York, 1979.
170
58. J. Goldstein, D. Newbury, D. Joy, C. Lyman, P. Echlin, E. Lifshin, L. Sawyer and J. Michael, Scanning Electron Microscopy and X-ray Microanlysis Springer, New York, 2003.
59. E. Bucher and W. Sitte, Solid State Ionics, 2010.
60. P. A. W. v. d. Heide, SURFACE AND INTERFACE ANALYSIS, 2002, 33, 414–425.
61. M. M. Viitanen, R. G. von Welzenis, H. H. Brongersma and F. P. F. van Berkel, Solid State Ionics, 2002, 150, 223-228.
62. V. E. Henrich, Reports on Progress in Physics, 1985, 48, 1481-1541.
63. D. A. Porter and K. E. Eastering, Phase Transformations in Metals and Alloys, CRC press, FL, 1992.
64. B. Rahmati, J. Fleig, W. Sigle, E. Bischoff, J. Maier and M. Ruhle, Surface Science, 2005, 595, 115-126.
65. R. Meyer, R. Waser, J. Helmbold and G. Borchardt, Journal of Electroceramics, 2002, 9, 103-112.
66. K. Gomann, G. Borchardt, A. Gunhold, W. Maus-Friedrichs and H. Baumann, Physical Chemistry Chemical Physics, 2004, 6, 3639-3644.
67. Y. L. Wang, K. Duncan, E. D. Wachsman and F. Ebrahimi, Solid State Ionics, 2007, 178, 53-58.
68. K. Szot, M. Pawelczyk, J. Herion, C. Freiburg, J. Albers, R. Waser, J. Hulliger, J. Kwapulinski and J. Dec, Applied Physics a-Materials Science & Processing, 1996, 62, 335-343.
69. H. Tanaka and M. Misono, Current Opinion in Solid State & Materials Science, 2001, 5, 381-387.
70. L. C. Dufour, G. L. Bertrand, G. Caboche, P. Decorse, A. El Anssari, A. Poirson and M. Vareille, Solid State Ionics, 1997, 101, 661-666.
71. S. N. Ruddlesden and P. Popper, Acta Crystallographica, 1957, 10, 538-540.
72. M. Konigstein and C. R. A. Catlow, Journal of Solid State Chemistry, 1998, 140, 103-115.
73. F. Tietz, A. Mai and D. Stover, Solid State Ionics, 2008, 179, 1509-1515.
74. W. D. Copeland and R. A. Swalin, Journal of Physics and Chemistry of Solids, 1968, 29, 313-&.

171
75. E. P. Murray, M. J. Sever and S. A. Barnett, Solid State Ionics, 2002, 148, 27-34.
76. H. J. Hwang, M. B. Ji-Woong, L. A. Seunghun and E. A. Lee, Journal of Power Sources, 2005, 145, 243-248.
77. F. Qiang, K. N. Sun, N. Q. Zhang, X. D. Zhu, S. R. Le and D. R. Zhou, Journal of Power Sources, 2007, 168, 338-345.
78. H. Y. Jung, K. S. Hong, H. G. Jung, H. Kim, H. R. Kim, J. W. Son, J. Kim, H. W. Lee and J. H. Lee, Journal of the Electrochemical Society, 2007, 154, B480-B485.
79. V. A. C. Haanappel, A. Mai and J. Mertens, Solid State Ionics, 2006, 177, 2033-2037.
80. M. Sahibzada, S. J. Benson, R. A. Rudkin and J. A. Kilner, Solid State Ionics, 1998, 115, 285-290.
81. S. P. Simner, J. R. Bonnett, N. L. Canfield, K. D. Meinhardt, J. P. Shelton, V. L. Sprenkle and J. W. Stevenson, Journal of Power Sources, 2003, 113, 1-10.
82. H. Uchida, S. Arisaka and M. Watanabe, Solid State Ionics, 2000, 135, 347-351.
83. K. Yamahara, C. P. Jacobson, S. J. Visco, X. F. Zhang and L. C. de Jonghe, Solid State Ionics, 2005, 176, 275-279.
84. D. Oh, D. Gostovic and E. D. Wachsman, In preparation, 2010.
85. A. A. Vance and S. McIntosh, Journal of the Electrochemical Society, 2008, 155, B1-B7.
86. Y. K. Lee, J. Y. Kim, Y. K. Lee, I. Kim, H. S. Moon, J. W. Park, C. P. Jacobson and S. J. Visco, Journal of Power Sources, 2003, 115, 219-228.
87. J. M. Serra, V. B. Vert, M. Betz, V. A. C. Haanappel, W. A. Meulenberg and F. Tietz, Journal of the Electrochemical Society, 2008, 155, B207-B214.
88. M. A. Pena and J. L. G. Fierro, Chemical Reviews, 2001, 101, 1981-2017.
89. F. S. Baumann, J. Fleig, H. U. Habermeier and J. Maier, Solid State Ionics, 2006, 177, 1071-1081.
90. M. J. L. Ostergard and M. Mogensen, Electrochimica Acta, 1993, 38, 2015-2020.
91. A. Esquirol, N. P. Brandon, J. A. Kilner and M. Mogensen, Journal of the Electrochemical Society, 2004, 151, A1847-A1855.
92. J. W. N. I. Chorkendorff, Concepts of Modern Catalysis and Kinetics, WILEY-VCH, 2003.

172
93. N. Miura, Y. Okamoto, J. Tamaki, K. Morinaga and N. Yamazoe, Solid State Ionics, 1995, 79, 195-200.
94. J. A. Lane, S. J. Benson, D. Waller and J. A. Kilner, Solid State Ionics, 1999, 121, 201-208.
95. J. Maier, Solid State Ionics, 1998, 112, 197-228.
96. X. Montero, F. Tietz, D. Stover, M. Cassir and I. Villarreal, Corrosion Science, 2009, 51, 110-118.
97. X. Montero, F. Tietz, D. Stover, M. Cassir and I. Villarreal, Journal of Power Sources, 2009, 188, 148-155.
98. W. Z. Zhu and S. C. Deevi, Materials Research Bulletin, 2003, 38, 957-972.
99. E. Konysheva, H. Penkalla, E. Wessel, J. Mertens, U. Seeling, L. Singheiser and K. Hilpert, Journal of the Electrochemical Society, 2006, 153, A765-A773.
100. S. Taniguchi, M. Kadowaki, H. Kawamura, T. Yasuo, Y. Akiyama, Y. Miyake and T. Saitoh, Journal of Power Sources, 1995, 55, 73-79.
101. S. P. Simner, M. D. Anderson, G. G. Xia, Z. Yang, L. R. Pederson and J. W. Stevenson, Journal of the Electrochemical Society, 2005, 152, A740-A745.
102. S. G. Li, N. P. Xu, J. Shi, M. Z. C. Hu and E. A. Payzant, Journal of Materials Science Letters, 2001, 20, 1631-1633.
103. D. Oh, D. Gostovic and E. Wachsman, to be submitted for publication.
104. S. P. Jiang, S. Zhang and Y. D. Zhen, Journal of the Electrochemical Society, 2006, 153, A127-A134.
105. Ohbayash.H, T. Kudo and T. Gejo, Japanese Journal of Applied Physics, 1974, 13, 1-7.
106. D. Waller, J. A. Lane, J. A. Kilner and B. C. H. Steele, Materials Letters, 1996, 27, 225-228.
107. K. H. Kim, S. H. Lee and J. S. Choi, Journal of Physics and Chemistry of Solids, 1985, 46, 331-338.
108. G. C. Kostogloudis and C. Ftikos, Solid State Ionics, 1999, 126, 143-151.
109. D. Oh, E. Armstrong, D. Jung, J. Yoo and E. Wachsman, to be submitted for publication.
110. H. Yokokawa, T. Horita, N. Sakai, K. Yamaji, M. E. Brito, Y. P. Xiong and H. Kishimoto, Solid State Ionics, 2006, 177, 3193-3198.

173
111. M. C. Tucker, H. Kurokawa, C. P. Jacobson, L. C. De Jonghe and S. J. Visco, Journal of Power Sources, 2006, 160, 130-138.
112. I. H. Jung, Solid State Ionics, 2006, 177, 765-777.
113. E. Povoden, A. N. Grundy and L. J. Gauckler, International Journal of Materials Research, 2006, 97, 569-578.
114. S. P. Jiang, J. P. Zhang, L. Apateanu and K. Foger, Journal of the Electrochemical Society, 2000, 147, 4013-4022.
115. S. P. Jiang, Journal of Materials Science, 2008, 43, 6799-6833.
116. J. A. M. Vanroosmalen and E. H. P. Cordfunke, Journal of Solid State Chemistry, 1994, 110, 109-112.
117. S. Piskunov, E. Spohr, T. Jacob, E. A. Kotomin and D. E. Ellis, Physical Review B, 2007, 76, -.
118. Y. Matsuzaki and I. Yasuda, Journal of the Electrochemical Society, 2001, 148, A126-A131.
119. M. Backhaus-Ricoult, Solid State Ionics, 2006, 177, 2195-2200.
120. S. R. Bishop, K. L. Duncan and E. D. Wachsman, Journal of the Electrochemical Society, 2009, 156, B1242-B1248.
121. K. Hilpert, D. Das, M. Miller, D. H. Peck and R. Weiss, Journal of the Electrochemical Society, 1996, 143, 3642-3647.
122. Y. F. Chang, G. A. Somorjai and H. Heinemann, Journal of Catalysis, 1995, 154, 24-32.
123. P. Decorse, G. Caboche and L. C. Dufour, Solid State Ionics, 1999, 117, 161-169.
124. M. Shimada, H. Kokawa, Z. J. Wang, Y. S. Sato and I. Karibe, Acta Materialia, 2002, 50, 2331-2341.
125. A. Mai, V. A. C. Haanappel, S. Uhlenbruck, F. Tietz and D. Stover, Solid State Ionics, 2005, 176, 1341-1350.
126. H. Flood and T. Forland, Acta Chemica Scandinavica, 1947, 1, 592-604.
127. M. W. den Otter, H. J. M. Bouwmeester, B. A. Boukamp and H. Verweij, Journal of the Electrochemical Society, 2001, 148, J1-J6.
128. P. Trambouze, H. V. Landeghem and J.-P. Wauquier, Editions Technip, Paris, 1988.
174
129. G. Kim, S. Wang, A. J. Jacobson and C. L. Chen, Solid State Ionics, 2006, 177, 1461-1467.
130. R. Ganeshananthan and A. V. Virkar, Journal of the Electrochemical Society, 2005, 152, A1620-A1628.
131. J. Nowotny, T. Bak and C. C. Sorrell, Advances in Applied Ceramics, 2005, 104, 174-180.
132. T. Ramos and A. Atkinson, Solid State Ionics, 2004, 170, 275-286.
133. X. Chen, S. Wang, Y. L. Yang, L. Smith, N. J. Wu, B. I. Kim, S. S. Perry, A. J. Jacobson and A. Ignatiev, Solid State Ionics, 2002, 146, 405-413.

175
BIOGRAPHICAL SKETCH
Dongjo Oh, as also known as DJ, was born in Haenam, South Korea and moved
to Incheon at 5 years old. From very young ages, he liked a robot animation and so
wanted to be a scientist. He graduated Bu-pyung elementary school, Bu-pyung seo
middle school, and Bu-kwang high school. After he entered Inha University in Incheon
and majored materials science and engineering. He voluntarily worked as
undergraduate research assistance from sophomore and participated in lots of activity
in the university. And he started military service from Oct. 2000 to Dec. 2002 as a
KATUSA (Korean Augmentation to U.S. Army). In the army he learned leadership and
professionalism. During that period, he wished to study abroad. After finishing the army
service he prepared TOEFL and GRE during the senior and applied materials science
and engineering program in the University of Florida. While at UF his knowledge on
basic material science was improved significantly. In Dec 2008, Chanyoung Yun and DJ
became a family and Michelle was born in Sep. 2009. Life in U.S. brought him not only
scientific knowledge but also confidence. He is not fully fledged but ready to come true
his dream of young ages. He always appreciates Jesus for giving this chance.