
Fundamental Understanding of Microstructural Properties of ...
91
Louisiana Tech University Louisiana Tech Digital Commons Doctoral Dissertations Graduate School Spring 5-25-2019 Fundamental Understanding of Microstructural Properties of Electrolyte System for NOx Exhaust Gas Sensing Khawlah Kharashi Louisiana Tech University Follow this and additional works at: hps://digitalcommons.latech.edu/dissertations is Dissertation is brought to you for free and open access by the Graduate School at Louisiana Tech Digital Commons. It has been accepted for inclusion in Doctoral Dissertations by an authorized administrator of Louisiana Tech Digital Commons. For more information, please contact [email protected]. Recommended Citation Kharashi, Khawlah, "" (2019). Dissertation. 42. hps://digitalcommons.latech.edu/dissertations/42
Transcript of Fundamental Understanding of Microstructural Properties of ...

Louisiana Tech UniversityLouisiana Tech Digital Commons
Doctoral Dissertations Graduate School
Spring 5-25-2019
Fundamental Understanding of MicrostructuralProperties of Electrolyte System for NOx ExhaustGas SensingKhawlah KharashiLouisiana Tech University
Follow this and additional works at: https://digitalcommons.latech.edu/dissertations
This Dissertation is brought to you for free and open access by the Graduate School at Louisiana Tech Digital Commons. It has been accepted forinclusion in Doctoral Dissertations by an authorized administrator of Louisiana Tech Digital Commons. For more information, please [email protected].
Recommended CitationKharashi, Khawlah, "" (2019). Dissertation. 42.https://digitalcommons.latech.edu/dissertations/42

FUNDAMENTAL UNDERSTANDING OF MICROSTRUCTURAL
PROPERTIES OF ELECTROLYTE SYSTEM FOR
NOX EXHAUST GAS SENSING
by
Khawlah Kharashi,
A Thesis Presented in Partial Fulfillment
of the Requirements of the Degree
Doctor of Philosophy
February 2018
COLLEGE OF ENGINEERING AND SCIENCE
LOUISIANA TECH UNIVERSITY
cguin
Highlight
cguin
Sticky Note
This date needs to reflect the month and year of graduation.

GS Form 13
(8/10)
LOUISIANA TECH UNIVERSITY
THE GRADUATE SCHOOL
Date
be accepted in partial fulfillment of the requirements for the Degree of
Supervisor of Thesis Research
Head of Department
Science
Department
Recommendation concurred in:
_____________________________
_____________________________
Advisory Committee
_____________________________
_____________________________
Approved: Approved:
______________________________ ______________________________ Director of Graduate Studies Dean of the Graduate School
__________________________________ Dean of the College
We hereby recommend that the thesis prepared under our supervision by
xxxxxxxxxxxxxxx Khawlah Kharashi, PhD.
entitled Fundamental Understanding Of Microstructural Properties Of
Nox Exhaust Gas Sensing
Master of Science inMolecular Science and Nanotechnology)
cguin
Sticky Note
There is a new form GS 13 on our website.
cguin
Highlight

iii
ABSTRACT
The nitrogen oxides (NOx) sensors available on the market are unable to detect
minute concentrations of NOx (<10 ppm) and, as a result, they are unable to meet the
new US standards, i.e. Tier 3 standards for the period of 2017-2025. As per these
standards sensors should be highly sensitive and capable of determining NOx on the
order of single parts per million. As compared to gasoline engines, diesel engines
have greater efficiency per unit quantity of fuel consumed, but they emit more smog
causing NOx.
The three-way catalyst systems in modern diesel engines are ineffective in
chemically reducing nitrogen oxides in the presence of excess air. Even though a
number of NOx abatement systems have been developed over the years, the after-
treatment systems in vehicles require a highly sensitive NOx sensor capable of
monitoring low concentrations of NOx in the exhaust gases. The solid state
electrochemical sensors, having porous yttria-stabilized zirconia (YSZ), along with
dense electrodes, exhibit enhanced NOx sensitivity. Porous electrolytes support gas
diffusion, while the dense electrodes limit heterogeneous catalysis reactions that
interfere with accurate sensing of NOx.
The primary aim of this study was to investigate porous electrolytes composed
of fully-stabilized YSZ (FSZ) and partially-stabilized YSZ (PSZ) incorporated with α-
alumina (Al2O3) as well as gold (Au) wires as electrodes. The impedancemetric study
of porous PSZ based sensors added with different weight percentages (2, 3.8, 5 and
10) of Al2O3 was conducted at varying operating conditions. The addition of 2 wt%

iv
Al2O3 to PSZ resulted in an increase in the NOx sensor impedance and grain boundary
conductivity. However, above 2 wt% Al2O3 in the PSZ, the resistance of the
electrolyte bulk and grain boundaries was increased. The PSZ based sensor with 2
wt% Al2O3 resulted in greater sensitivity at concentrations as low as 5 ppm NOx.
Composite electrolytes consisting of PSZ, FSZ, and PSZ–FSZ were studied by
using impedance spectroscopy for the electrochemical responses under dry and
humidified gas conditions. The response of 50 PSZ–50 FSZ based sensors indicated
contribution of PSZ to lower water cross-sensitivity, while FSZ promoted NOx
sensitivity. The microstructure of each electrolyte influenced sensor sensitivity, but
there was no impact on water cross-sensitivity.

GS Form 14
(8/10)
APPROVAL FOR SCHOLARLY DISSEMINATION
The author grants to the Prescott Memorial Library of Louisiana Tech
University the right to reproduce, by appropriate methods, upon request, any or all
portions of this Thesis. It is understood that “proper request” consists of the agreement,
on the part of the requesting party, that said reproduction is for his personal use and that
subsequent reproduction will not occur without written approval of the author of this
Thesis. Further, any portions of the Thesis used in books, papers, and other works must
be appropriately referenced to this Thesis.
Finally, the author of this Thesis reserves the right to publish freely, in the
literature, at any time, any or all portions of this Thesis.
Author _____________________________
Date _____________________________

vi
DEDICATION
I would like to dedicate my thesis to my beloved family.

vii
TABLE OF CONTENTS
ABSTRACT ................................................................................................................. iii
APPROVAL FOR SCHOLARLY DISSEMINATION ................................................ v
DEDICATION .............................................................................................................. vi
LIST OF FIGURES ....................................................................................................... x
LIST OF TABLES ..................................................................................................... xiii
ACKNOWLEDGMENTS .......................................................................................... xiv
INTRODUCTION .................................................................................. 1
1.1 Overview ........................................................................................................ 1
1.2 Motivation ...................................................................................................... 1
1.3 Dissertation Organization .............................................................................. 3
BACKGROUND .......................................................................................... 4
2.1 Advancement in Diesel Engine Technology ................................................. 4
2.2 Automotive Emissions Standards .................................................................. 6
2.3 Operating Principles of NOx Exhaust Gas Sensors ....................................... 9
2.4 Potentiometric Sensors ................................................................................ 10
2.5 Impedancemetric Sensors ............................................................................ 11
2.6 NOx Sensor Electrolyte ................................................................................ 13
2.6.1 Chemical Structure of Zirconia ................................................................ 13
2.6.2 Electrochemical Electrolyte/electrode Interfacial Reaction ..................... 14
BASIC CONCEPTS OF ELECTROCHEMICAL IMPEDANCE
SPECTROSCOPY ....................................................................................................... 16
3.1 Impedance, Modulus, Phase Angle .............................................................. 17
3.2 Representation of EIS Data .......................................................................... 20

viii
3.3 Equivalent Circuit Analysis ......................................................................... 21
EFFECT OF AL2O3 IN POROUS ZIRCONIA ELECTROLYTES FOR
NO SENSING ............................................................................................................. 24
4.1 Overview ...................................................................................................... 24
4.2 Experimental ................................................................................................ 25
4.3 Results and Discussion ................................................................................ 27
4.3.1 Microstructure and Morphology .............................................................. 27
4.3.2 Impedance response ................................................................................. 31
4.3.3 NO sensing ............................................................................................... 35
4.3.4 PO2 and Ea dependence ............................................................................ 38
4.3.5 Conclusions .............................................................................................. 40
MANAGING H2O CROSS‐SENSITIVITY USING COMPOSITE
ELECTROLYTE NOX SENSORS ............................................................................ 41
5.1 Overview ...................................................................................................... 41
5.2 Experimental ................................................................................................ 43
5.3 Morphology and Microstructure .................................................................. 44
5.4 Electrochemical Response ........................................................................... 46
5.5 Equivalent Circuit Analysis ......................................................................... 50
5.6 Sensor Sensitivity ........................................................................................ 52
5.7 Rate Limiting Mechanisms and Activation Energies .................................. 55
5.8 Sensor Response Time and Stability ........................................................... 58
5.9 Conclusions .................................................................................................. 60
ENHANCED COMPOSITE ELECTROLYTES ................................. 62
6.1 Introduction .................................................................................................. 62
6.2 Sensor Diagram ............................................................................................ 62
6.3 Microstructure and Morphology .................................................................. 63
6.4 Electrochemical Response of NOx Sensors ................................................. 64
6.5 NO Sensitivity .............................................................................................. 65

ix
6.6 Cross-sensitivity to H2O, O2, CO, CO2, and CH4 ........................................ 66
6.6.1 Water Cross-sensitivity ............................................................................ 66
6.6.2 Cross-sensitivity CO, CO2, and CH4........................................................ 67
6.7 Long-term Functionality .............................................................................. 68
6.8 Conclusions .................................................................................................. 69
CONCLUSIONS AND FUTURE WORK ........................................... 70
BIBLIOGRAPHY ........................................................................................................ 72

x
LIST OF FIGURES
Figure 2-1: The SCR System in 2017 Diesel Trucks [1]. ............................................. 6
Figure 2-2: US and EU have different NOx emission standards for heavy duty
diesel engines. ................................................................................................................ 8
Figure 2-3: Operational Scheme of Amperometric NOx sensor [9] ........................... 10
Figure 2-4: Schematic illustration of Potentiometric NOx sensors [12] .................... 11
Figure 2-5: Schematic diagram of an impedancemetric sensor .................................. 12
Figure 2-6: NOx sensing reaction steps....................................................................... 15
Figure 3-1: Illustration of a general AC circuit .......................................................... 17
Figure 3-2: Illustration of fundamental concepts of EIS [17] ..................................... 19
Figure 3-3: Fundamental concepts of Impedance Spectroscopy. ............................... 20
Figure 3-4: A typical Nyquist plot .............................................................................. 21
Figure 3-5: Voigt elements in series ........................................................................... 23
Figure 4-1: Schematic of NO sensor ........................................................................... 27
Figure 4-2:. SEM images of fractured cross-sections of electrolyte pellets
illustrating typical: a) PSZ particle-to-particle contact b) PSZ microstructure at
higher magnification, c) PSZ- Al2O3 composite with 2% Al2O3 addition, and d)
PSZ-2% Al2O3 composite at higher magnification. ..................................................... 30
Figure 4-3: X-ray diffraction patterns for: a) Al2O3, b) PSZ-2% Al2O3, c) PSZ-
3.8% Al2O3, d) PSZ-5% Al2O3, e) PSZ-10% Al2O3, and f) PSZ ................................. 30
Figure 4-4: Impedance results of PSZ and PSZ-2%Al2O3 based NO sensors, and
the equivalent circuit used for modeling. ..................................................................... 32
Figure 4-5: The fitted values from equivalent circuit modeling for RHFA, RLFA,
and |Z| for impedance data collected at 650 ◦C for PSZ and PSZ-Al2O3 based
sensors. ......................................................................................................................... 32
Figure 4-6: Impedance response of sensors under dry and humidified gas
conditions. .................................................................................................................... 34
Figure 4-7: Sensitivity to 100 ppm NO for the PSZ and PSZ-Al2O3 based sensors ... 36

xi
Figure 4-8: The sensing behavior of PSZ-2% Al2O3 based sensors for various NO
concentrations under humidified conditions. ............................................................... 37
Figure 4-9: Effect of Al2O3 addition on the oxygen partial pressure dependence of
the various sensors. ...................................................................................................... 39
Figure 5-1: NOx sensor diagram: (a) top view, and (b) cross-sectional view with
embedded Au wire electrodes. ..................................................................................... 44
Figure 5-2: SEM images of electrolytes composed of: (a) PSZ, (b) FSZ, (c) 50
PSZ–50 FSZ, and (d) PSZ coarse particles. ................................................................. 46
Figure 5-3: Impedance data collected at 600 ○C where the sensor electrolyte was:
(a) PSZ, (b) 50 PSZ–50 FSZ, (c) FSZ, and (d) PSZ coarse under dry and
humidified conditions. ................................................................................................. 48
Figure 5-4: Equivalent circuit used to model the impedance data for PSZ, FSZ
and composite PSZ–FSZ based sensors. ...................................................................... 50
Figure 5-5: The capacitance of (a) PSZ, (b) FSZ and (c) 50 PSZ–50 FSZ based
sensors with for dry and humidified gas conditions with respect to temperature. ....... 52
Figure 5-6: NO sensitivity for sensors with: (a) PSZ, (b) FSZ, and (c) 50 PSZ–50
FSZ electrolyte under dry and humidified gas conditions at 650○C. ........................... 53
Figure 5-7.Change in angular phase response with respect to temperature for
sensors composed of: (a) PSZ, (b) FSZ, and (c) 50 PSZ–50 FSZ electrolyte. ............ 54
Figure 5-8: Angular phase response with respect to time for sensors composed of
a 50 PSZ–50 FSZ electrolyte. ...................................................................................... 59
Figure 5-9: Stability of a 50 PSZ–50 FSZ sensor over several hours of
operation. ..................................................................................................................... 60
Figure 6-1: Schematic presentation (top & cross-sectional) of a sensor ................ 63
Figure 6-2: Micrograph of the fractured PSZ–FSZ–2% Al2O3 electrolyte............ 64
Figure 6-3: Impedance response of the FSZ–PSZ–2% Al2O3 based sensor. .............. 65
Figure 6-4: NOx sensitivity for FSZ–PSZ–2% Al2O3. ................................................ 66
Figure 6-5: Impedance response for (a) PSZ-FSZ –2% Al2O3 (b) PSZ-FSZ
sensors with and without 3% H2O ............................................................................... 66
Figure 6-6: Selectivity study for PSZ–FSZ–2% Al2O
3 (650 ⁰C, 40Hz) sensors
using air as the base gas. .............................................................................................. 67
Figure 6-7: Phase response of PSZ–FSZ–2% Al2O3-sensor with 100 ppm NO and
CH4 present. ................................................................................................................. 68

xii
Figure 6-8: Phase angle shift response for PSZ–FSZ–2% Al2O
3 sensor over
several days of operation. ............................................................................................ 69

xiii
LIST OF TABLES
Table 2-1: Different oxides of Nitrogen [2] .................................................................. 7
Table 3-1: Elaboration of circuit elements [18] .......................................................... 22
Table 4-1: PSZ electrolyte porosity with respect to Al2O3 addition ........................... 29
Table 5-1: Electrolyte porosity based on Archimedes Method................................... 46
Table 5-2: Power law exponent for sensors composed of the various electrolytes. ... 56
Table 5-3: Activation energy values for the various sensors. ..................................... 58
Table 5-4: The τ90 response of the sensors composed of the various electrolytes. ..... 59

xiv
ACKNOWLEDGMENTS
The work presented in this thesis would not have been possible without many
people who were always there when I needed them the most.
I would like to start with the person who made the biggest difference in my
life, my mentor, Dr. Erica P. Murray, for the continuous support of my PhD study and
research, for her patience, motivation, and her guidance. My sincere thanks also go to
National Science Foundation to fund (DMR-1410670) my research. I extend my
sincere word of thanks to the rest of my thesis committee: Prof. Ramu Ramachandran,
Prof. Yuri Lvov, Dr. Weizhong Dai, and Dr. Sandra Zivanovic for their insightful
comments. I would like to specially acknowledge Mr. Robert Novak and Dr. Jaco
Visser at Ford Motor Company, and Dr. Leta Woo at CoorsTek for the meaningful
discussions.
My acknowledgement will never be complete without the special mention of
my fellow lab mates: Dr. Ling Cui and Dr. Nabamita Pal for the stimulating
discussions, co-operating with me in the laboratory, and being there to bear with me
the good and bad times during my wonderful days of pursuing Ph.D. Also, special
thanks to Dr. Alfred Gunasekaran, Mr. Davis Bailey, Ms. Debbie Wood, and Mr.
Phillip Chapman for other assistances at IfM facility. Deepest appreciation to my
beloved husband Eng. Emad Zeni, and my heroes Qosai and Obai, for their patience,
assistance, continuous support and understanding in everything I have done. I would
like to thank my parents for giving birth to me in the first place and my uncle Mr. Ali
Kharashi for supporting me spiritually throughout my education journey.

1
INTRODUCTION
1.1 Overview
This dissertation encompasses a comprehensive yet concise review of research
findings on the microstructural properties of the Nitrogen oxide (NO) and nitrogen
dioxide (NO2) which together are called (NOx) sensor electrolytes. An effort has been
made to relate the impact of microstructural properties of different electrolytes on the
performance of their respective NOx sensors. At present, the NOx sensors available on
the market are unable to detect minute concentrations of NOx (<10 ppm) and, as a
result, they are unable to meet the future regulations pertaining to automobile exhaust
emissions.
In current vehicles, a NOx sensor is located in the diesel exhaust pipe after the
emissions abatement hardware. The primary purpose is to monitor the performance of
the NOx abatement system by analyzing the exhaust gases passing through the
tailpipe. The new US standards, i.e. Tier 3 standards for the period of 2017-2025,
require that the sensor should be highly sensitive and capable of determining NOx on
the order of single parts per million.
1.2 Motivation
Diesel emissions contain nitrogen oxide gases and other toxic particles, the
smallest of which contribute to lung and heart disease. Increases in airborne fine
particulate matter increases the risk for myocardial infarctions, strokes and heart

2
failure. Therefore, detection and regulation of NOx in diesel engine is of key
importance and is an important area of research in order to limit the amount of the
NOx in the environment. As compared to gasoline engines, the diesel engines have
greater efficiency per unit quantity of fuel consumed, but they emit more NOx causing
smog. In diesel engines, the three-way catalyst systems are ineffective in chemically
reducing nitrogen oxides in the presence of excess air. A number of NOx abatement
systems have been developed ranging from engine modifications e.g., (changes in
injector location, fuel pressure) to NOx control hardware systems i.e., (selective
catalytic reduction, and lean NOx traps) fitted in the diesel exhaust pipe. Overall,
diesel after – treatment systems in vehicles require a highly sensitive NOx sensor
capable of monitoring low concentrations of NOx in the exhaust gases.
Porous electrolyte based NOx sensors enhanced NOx sensitivity which
typically incorporate electrodes with a dense microstructure. The porous electrolyte
supports gas diffusion, while the dense electrodes limit heterogeneous catalysis
reactions that interfere with accurately sensing nitrogen oxide (NO) and nitrogen
dioxide (NO2). The goal of these studies has largely concentrated on porous
electrolytes composed of fully-stabilized yttria-doped zirconia (YSZ) due to the high
ionic conductivity of the material that is known to promote NOx sensitivity from
diesel engines and lower cross-sensitivity to water by using composite electrolyte
NOx sensors with a porous microstructure.
In this thesis study, fully-stabilized yttria-doped zirconia (FSZ, 4.7 mol.%
Y2O3–ZrO2), Partially-stabilized yttria-doped zirconia (PSZ, 4.7 mol.% Y2O3–ZrO2),
and α- Al2O3. as well as twine Au wires electrodes were studied. Compared to the
conventional sensors (such as potentiometric and amperometric), the NOx sensors
utilizing YSZ-based electrolytes have been found to be effective in detecting nitrogen

3
oxides at very low concentrations. However, the Impedancemetric study of gas
sensors is still under development because of a number of challenges such as cross
sensitivity to oxygen and water vapors present in the exhaust gases.
1.3 Dissertation Organization
The organization of this dissertation is given as follows:
• Chapter 2 provides a detailed overview of NOx emissions and the related
regulations set by the major economies of the world. In addition, the
different types of exhaust gas sensors are also discussed.
• Chapter 3 encompasses the basic concepts in electrochemical impedance
spectroscopy.
• Chapter 4 provides the details of Al2O3 effect in porous YSZ-based
electrolytes for NOx sensing applications.
• Chapter 5 describes the research study on the management of H2O cross‐
sensitivity of NOx sensors by using composite electrolytes.
• Chapter 6 details the application of the enhanced composite electrolytes.
• Chapter 7 summarizes the results and gives a discussion regarding future
work and conclusions.

4
BACKGROUND
In this chapter, Section 2.1 discusses the improvement in diesel engine
technology. Section 2.2 discusses the air quality programs in the United States and
Europe that focus on reduced NOx gases followed by Section 2.3 which presents a
compact discussion about different NOx Exhaust gas sensors. The last section of this
chapter discusses the chemical structure of the zirconia electrolytes NOx sensors along
with the microstructural and electrical properties of zirconia.
2.1 Advancement in Diesel Engine Technology
Diesel engines offer greater torque and higher efficiency in comparison to
gasoline engines. However, the nitric oxide (NOx) emissions are significantly greater.
This is a problem because NOx emissions contributor to poor air quality that
negatively impact the environment and human health. Substantial efforts have focused
on lowering NOx emissions as diesel engine technology progresses. Key strategies for
lowering NOx emissions include lean NOx traps (LNT) and selective catalytic
reduction (SCR). Lean NOx traps are the most common exhaust gas after-treatment
system used with diesel engines.
In this system, while the engine runs under lean conditions, the trap converts
nitric oxide into nitrogen and water. The advantages of LNT technology include high
NOx removal activity, which helps to address cold-start problems, while also being
cost-effective. The first few minutes of engine operation is considered cold start, as

5
the engine block and coolant temperatures are low resulting in incomplete
combustion. Cold start is a problem because it results in significantly higher
emissions, in comparison to an engining operate at higher temperatures. LNT
technology enables immediate conversion of NOx that is generated from the engine to
N2 and water in order to control the harmful gases that cause pollutions and improve
air quality. However, the burst of fuel needed to regenerate the trap is a large
disadvantage as engine fuel efficiency is reduced.
Selective catalytic reduction (SCR) is costly in comparison to LNTs; however,
the emissions are significantly lower with this exhaust after-treatment system. A
selective catalytic reduction system uses a metallic or ceramic wash-coated catalyzed
substrate and a chemical reductant to convert nitrogen oxides to molecular nitrogen
and oxygen in the exhaust streams of the diesel engines. Using an aqueous urea
solution, such as AdBlue, is usually the chosen reductant for the SCR system.
However, there is a problem with this system, which is the majority of the NOx
emissions occur during cold-start. SCR systems do not work well at temperatures
below 150°C, which means a good amount of NOx is not treated during cold-start
conditions. Although this is an issue, the SCR systems are still preferred because this
technology is significantly less expensive than LNT systems along with the higher
NOx reduction with lower NOx concentrations. Moreover, it does not require
modification to the combustion unit. Figure 2-1 shows the SCR system in 2017 diesel
trucks.

6
Figure 2-1: The SCR System in 2017 Diesel Trucks [1].
NOx sensors play a crucial role in monitoring and controlling diesel engine
operation and exhaust after-treatment systems. As advancements in diesel engine
technology results in lower emissions, it is important for NOx sensors to be capable of
measuring lower diesel emissions with high sensitivity, selectivity and accuracy.
2.2 Automotive Emissions Standards
Diesel vehicles require NOx sensors that monitor exhaust gases according to
governmental regulations for automotive emissions. Nowadays, limiting the NO and
NO2 exhaust species become the most challenging because these gases are considered
very dangerous pollutants to the air. The Environmental Protection Agency (EPA) in
the US and regulatory agencies in Europe and other countries have issued stringent
standards for heavy duty highway diesel vehicles to limit NOx emissions.
There are many forms of nitrogen oxides ranging from nitric oxide to
dinitrogen pentoxide. There are a total of seven forms which are shown in Table 2-1.
These oxides could occur naturally and can take different forms through other natural
processes such as lightning, forest fires, and emissions [2].

7
Table 2-1: Different oxides of Nitrogen [2].
Formula Name
NO Nitric oxide
NO2 Nitrogen dioxide
N2O Nitrous oxide
NO3 Nitrogen trioxide
N2O4 Nitrogen tetroxide
N2O3 Dinitrogen trioxide
N2O5 Dinitrogen pentoxide
Among the different nitrogen oxides, only NO and NO2 are found naturally
and they virtually constitute all nitrogen oxide emissions. Anthropogenic emissions of
these oxides are predominantly related to combustion processes. These processes
include vehicle emissions, gas turbines, boilers, and industrial burners [3, 4]. The
emissions of NOx are particularly under observation because of their contribution to
atmospheric pollution. Nitrogen oxide combines with ozone to form nitrogen dioxide.
The nitrogen dioxide is a brown gas which is responsible for smog formation and
adverse effects on health such as respiratory problems. Moreover, the atmospheric
NO2 also combines with rainwater and causes acid rain [2].
The general photochemical reaction leading to the formation of nitrogen
dioxide is given in Eq. 2-1 [5]:
NO + O3
hv↔ NO2 + O2 Eq. 2-1

8
All over the world, there are different regulations which determine the NOx
emissions in a particular region. The major economies of the world such as the United
States and Europe have different NOx emission standards. These standards cannot be
compared directly due to difference in the testing parameters. However, these
standards tend to converge to even lower values of emissions over time. These two
standards are shown in Figure 2-2.
Figure 2-2: US and EU have different NOx emission standards for heavy duty diesel
engines.
The US EPA Tier 2 standards were implemented in 2004. They are now
phased out and have been replaced by Tier 3 standards for the period of 2017-2025
[7]. Therefore, to meet strict standards for diesel vehicles based on the data in Figure
2-2, researchers must focus on creating more advanced NOx sensors. Such sensors
need to monitor the exhaust and regulate diesel engine operation within the required
emissions standards. These advanced NOx sensors should have the following
capabilities:
• Stability within ±1 ppm accuracy
• Sensitivity to low gas concentrations (less than 10 ppm NOx)

9
• Better selectivity to NOx in the presence of other gases such as
oxygen and water vapor
• Smooth and stable operation for a long period of time (such as
100,000 hours)
• Repeatable and reproducible output signal
• Simplicity in design and control
• Robustness in design (sensor material resistant to chemical
degradation, changes in morphology, crystallographic changes,
and so on)
• Ability to work effectively in high temperature ranges (500 to
900°C)
• Simple and low-price application process that can be used on
commercial scale for mass production
2.3 Operating Principles of NOx Exhaust Gas Sensors
The most common type of NOx sensor inside the diesel vehicle exhaust system
is the amperometric sensor. This type of sensor typically utilizes a dense zirconia
electrolyte, along with porous platinum electrodes. An operational scheme of
amperometric sensor is shown in Figure 2-3. The sensor utilizes multiple
electrochemical cells in adjacent chambers [6]. The purpose of the first chamber is to
remove any excess quantity of oxygen present in the exhaust gases, whereas the
purpose of the second chamber is to detect NOx in the exhaust gases. The mechanism
of detection, which is based on the diffusion of gases through multi-chambers
provided with small orifices at the entry, results in slower operation of the sensor. On
the other hand, this sensor is able to detect lower concentrations of NOx compared to
the other commercially available sensors [7, 8].

10
Figure 2-3: Operational Scheme of Amperometric NOx sensor [9].
The amperometric sensor is designed to minimize interference from O2 and
provide total NOx detection. Current sensors are capable of detecting NOx at
concentrations around 100 ppm and greater. In terms of the associated electronics and
sensor design, when compared with other sensors, the amperometric sensors possess
complex characteristics that add cost of the device. Advancement of diesel engine
technology is resulting in lower NOx emissions and the new regulatory standards
require monitoring capabilities of sensors for NOx at levels of 10 ppm and lower.
Considering this, there is a concern that current amperometric NOx sensors will not be
effective. Therefore, alternative NOx sensing method are being researched and are
discussed below.
2.4 Potentiometric Sensors
Potentiometric (i.e. mixed potential) NOx sensors have been considered as an
alternative to amperometric NOx sensors. YSZ is a common electrolyte of
potentiometric NOx sensors. Numerous materials have been used for the sensing
electrode, such as precious metals, spinel type oxides, and perovskites. The electrolyte
is embedded between two electrodes (the reference electrode and the sensing
electrode). In this type of sensor, the sensing response is determined by measuring the

11
potential difference between the sensing and counter electrodes of the electrochemical
cell. Both oxidation and reduction reactions occur simultaneously on a single
electrode. This results in a non-Nerstian, potentiometric sensor. Numerous
electrochemical reactions can occur at the same conductive service.
The potentiometric NOx sensors possess inherently simple cell design (Figure
2-4) and can be fabricated at a low cost compared to the amperometric sensors.
Because of these attractive features, they have been extensively studied in the last
decade [10, 11]. However, potentiometric NOx sensors are cross-sensitive to the O2,
CO, and hydrocarbons. Moreover, additional measures are needed to enable total NOx
sensing. Because the sensitivity sign of NO2 is relatively opposite to NO in mixed
potential sensor, it is difficult to monitor the total NOx sensing.
Figure 2-4: Schematic illustration of Potentiometric NOx sensors [12].
2.5 Impedancemetric Sensors
In comparison to the above mentioned potentiometric and amperometric NOx
sensors, the impedancemetric NOx sensors are a relatively new and more promising
approach towards achieving high NOx sensitivity at low NOx concentrations along
with high selectivity and accuracy. This type of sensor is used in this thesis. In such
sensors, the sensing response can be exhibited by impedance parameters such as the

12
modulus |Z| or phase component 𝜃 of the response of impedancemetric against an
applied frequency. However, the angular phase component of the impedance, θ, is
often more responsive to the changes in NOx concentration [8, 13]. For this reason, it
is frequently used to evaluate NOx sensor sensitivity according to the mathematical
expression Eq. 2-2:
𝜃 = 𝑎𝑟𝑐𝑡𝑎𝑛𝑍𝑅
𝑍𝐼 Eq. 2-2
where ZR and ZI represent the real and imaginary components of the impedance,
respectively. The impedance Z is defined accordingly:
𝑍 (𝜔) = 𝑍𝑅 + 𝑍𝐼 Eq. 2-3
The angular frequency 𝜔 = 2𝜋𝑓 depends upon the applied sensor operating
frequency, f. Advantages of the impedancemetric methods are total NOx sensing is
more readily achieved and the sensing response is highly reproducible in comparison
to the potentiometric method. This approach is also a low-cost alternative to the
amperometric method. In addition, NOx sensing in the single digit ppm range is
possible which exceeds the current amperometric NOx sensing capability. A
schematic diagram of an impedancemetric sensor is shown below.
Figure 2-5: Schematic diagram of an impedancemetric sensor.

13
2.6 NOx Sensor Electrolyte
This thesis concentrates on electrochemical NOx sensors supported by a
zirconia (ZrO2) based electrolyte. Zirconia has been used in NOx sensors for decades
because it tolerates the high temperature and stringent conditions of the exhaust
environment. Zirconia is also chemically stable under lean (oxidizing) and rich
(reducing) fuel conditions. Studies have found that the ionic conductivity of yttria -
stabilized zirconia (YSZ) plays a role in electrochemical reactions that promote the
sensitivity of the sensor to NOx gases. The following paragraphs will discuss the
chemical and microstructural properties of YSZ, and sensor reactions at the YSZ
electrolyte and sensing electrode.
2.6.1 Chemical Structure of Zirconia
YSZ was first used by Nernst in 1899, when zirconia (ZrO2) stabilized by
yttria (Y2O3), illustrated the presence of ionic conductivity in solid state via oxide
ionic vacancy (Vo) [14]. YSZ is a high temperature ceramic material commonly
composed of the oxides of zirconium, yttrium, and in some cases silicon. Minor
quantities of SiO2 (~1%) are also added for suppressing the formation of grain
boundaries. The valences of zirconium and yttrium differ by unity and they are found
in the neighboring columns of the periodic table. The addition of yttrium (Y3+) leads
to the substitution of zirconium (Zr4+) in the crystal lattice and, because of the valency
difference, lattice defects (commonly known as vacancies) are developed for
maintaining the electroneutrality. These lattice defects enable the YSZ electrolyte to
transport oxygen ions from one vacancy to another and hence the electrolytic ionic
conductivity is introduced [15].
In applications, such as NOx sensors, the electrolyte may be in the form of a
thick/thin film or pellet. In this case, the electrolytic ionic conductivity depends on the

14
electrolyte microstructure (i.e., porosity, particle size, and composition) as well as the
sensor operating temperature [13, 16]. NOx sensors have traditionally used NOx
sensitivity. In the case of porous electrolytes, the ionic conductivity is greater when
the electrolyte porosity is low and the particles composing the electrolyte are uniform.
This is because there are sufficient pathways for the oxygen ions to travel. However,
it is important to note that low electrolyte porosity also limits the pathways for
diffusion of exhaust gases, which can limit NOx sensing reactions. Thus, it is
necessary to establish a microstructure that balances ionic conductivity with other
properties of the electrolyte.
The composition of the YSZ electrolyte depends upon the dopant
concentration of yttria; also, adding another material to the electrolyte to form a
composite can also modify the composition. Such changes to the electrolyte
composition directly impact the electrolyte’s conductivity. Modifying or tailoring the
electrolyte’s microstructure can be beneficial for enhancing the sensitivity and
controlling the selectivity of the NOx sensor.
The electrolyte’s conductivity is temperature dependent. As the sensor’s
operating temperature increases, oxygen ions are able to travel more rapidly and
reactions involving oxygen proceed more readily. It is important to note that there are
multiple reactions occurring within the NOx sensor that involve O2, NOx and other
exhaust gases. Thus, selection of the preferred operating temperature for NOx sensing
must take into account not only the conductivity of the electrolyte, but also the
temperature that promotes the desired NOx reactions.
2.6.2 Electrochemical Electrolyte/electrode Interfacial Reaction
NOx sensing reactions are understood to occur at the electrolyte/electrode
interface. The porous electrolyte also allows for exhaust gases to participate at this

15
interface resulting in what is called a triple phase boundary (TPB). At the TPB, NOx
sensing reactions involving oxygen ions from the electrolyte, electrons from the
electrode, and exhaust gases that diffused through the electrolyte pores to take place.
As mentioned earlier, studies have found the porosity of the electrolyte affects gas
transport to the (TPB) [2].
Sufficient porosity within the electrolyte allows gases to transport readily
through the electrolyte. However, excess porosity can cause TPB reaction sites to
become limited, which has the negative effect of decreasing NOx sensitivity. Noble
metals in the form of wires can be used as dense sensing electrodes. In this thesis,
embedded Au wires were used as the sensing electrode. Figure 2-6 illustrates the
diffusion of gases through the grain boundary of the porous electrolyte along with the
oxygen ions that travel through the bulk at the triple phase boundary reactions
involving electrons from the Au wire electrode.
Figure 2-6: NOx sensing reaction steps.
The primary equations describe TPB NOx reactions as the following:
½ 𝑂2− + 2𝑒− ↔ 𝑂2− Eq. 2-4
𝑁𝑂 + 𝑂2− ↔ 𝑁𝑂2 + 2𝑒− Eq. 2-5
𝑁𝑂2 ↔ 𝑁𝑂 +
1
2𝑂2
Eq. 2-6

16
BASIC CONCEPTS OF ELECTROCHEMICAL IMPEDANCE
SPECTROSCOPY
This chapter provides a discussion about the history and theory of
electrochemical impedance spectroscopy (EIS), which is an important technique
commonly used for analyzing the dynamics of charges (mobile and bound) within the
bulk or at the interface of solid or liquid materials. The history of EIS can be traced
back to 1880, when Oliver Heaviside introduced impedance spectroscopy to electrical
engineering. Over the years, this technique was developed and improved by several
scientists and three-dimensional analysis became possible in 1981. This technique is
also useful for investigating the electrochemical characteristics of gas sensors,
batteries, fuel cells and other electrochemical devices.
Impedance spectroscopy can effectively provide an understanding about the
interdependency of NOx reactions on the microstructure, composition, and material
configuration of the NOx sensors. EIS has developed rapidly since the 1960s because
of the availability of newer, faster and more accurate measuring equipment.
Impedance based sensors are similar in design to the potentiometric sensors, but at the
place of voltage measurement, application of sinusoidal voltage and then
measurement of resultant current is carried out. The ratio of this voltage and current is
calculated in the frequency domain to give us the impedance response. This response
is then analyzed to extract information about grain boundary resistivity and rates of
chemical reactions. This analysis can also be used for further refinement and

17
quantification of chemical species. The most well-known investigation strategy for
fitting EIS data is the utilization of equivalent circuit models using numerical models
based on complex nonlinear slightest squares fitting.
As with every analysis methods, there are shortcomings to be aware of such as
accuracy, expensive, and complex data analysis for quantification. The key limitation
of EIS is the data can be difficult to interpret accurately due to overlapping time
constants for various reactions. This can make it challenging to distinguish specific
reaction mechanisms. Nonetheless, EIS is widely used because of the following
benefits it provides:
• Non-destructive
• High quality data
• Running EIS is easy.
• EIS modeling analysis is very powerful.
• High information content
• Responses can be measured over large time periods.
3.1 Impedance, Modulus, Phase Angle
A general AC circuit is shown in Figure 3-1 as follows:
Figure 3-1: Illustration of a general AC circuit

18
Magnitude of impedance normally represented by symbol Z and is simply
defined as the ratio of voltage to current. The data of impedance could be obtained in
the following steps:
• In Eq. 3-1, Et is the potential at time t, E0 is the amplitude of the
signal, and ω is the radial frequency. The relationship between radial
frequency ω (expressed in radians/second) and frequency f (expressed
in hertz) is 𝝎 = 𝟐𝝅𝒇:
𝐸𝑡 = 𝐸0 𝑠𝑖𝑛(𝜔𝑡) Eq. 3-1
• The response signal, It, is shifted in phase (𝜃) and has a different
amplitude than I0 as the following equation, Eq. 3-2:
𝐼𝑡 = 𝐼0 sin (𝜔𝑡 + 𝜃) Eq. 3-2
• An expression analogous to Ohm's Law allows us to calculate the
impedance of the system as Eq. 3-3:
𝑍 =
𝐸𝑡
𝐼𝑡
Eq. 3-3
The impedance is therefore expressed in terms of a magnitude, Zo, and a
phase shift, 𝜃. Figure 3-2 illustrates these crucial concepts.

19
Figure 3-2: Illustration of fundamental concepts of EIS [17].
Impedance assumes an AC current of a specific frequency in Hertz. The
impedance possesses components in both real and complex planes as given in Eq.
2-3.
The impedance data used to analyze the NOx sensor response can be based on
the following parameters (Figure 3-3):
• Frequency (Hz): the frequency of the applied sinewave.
• Time (s): the time coordinate corresponding to the measured data point
in the spectrum.
• Z, modulus (Ohm): the modulus of the measured impedance as the
following equation, Eq. 3-4:
|𝑍| = √(Z’)2 + (Z’’)2 Eq. 3-4
• Z’, real part (Ohm): the real part of the measured impedance.
• -Z”, imaginary part (Ohm): the imaginary part of the measurement
impedance.
• -Phase (°): the phase shift.

20
The phase angle quantifies the lag or lead of applied voltage and output
current at a specific frequency. It is commonly used as a sensing signal for NOx
sensors because of its better sensitivity and stability in comparison to the modulus.
It is defined as the ratio of the impedance’s real and imaginary parts as given in
Eq. 2-2.
Figure 3-3: Fundamental concepts of Impedance Spectroscopy.
3.2 Representation of EIS Data
EIS data may be presented as a Complex Plane (Nyquist) Plot or a Bode Plot.
A Nyquist plot is commonly used for representation of impedance data on a complex
impedance plane. This plot provides a quick overview of the impedance data and
qualitative interpretations could be made. The real as well as the imaginary axis are
equal for avoiding distortion of the data curves. This plot is also called the Cole-Cole
plot and its typical form is shown in Figure 3-4.

21
Figure 3-4: A typical Nyquist plot.
In practice, it is not uncommon for multiple and distorted arcs to be present in
the impedance spectra. Each arc describes a relaxation process (frequency-dependent)
in response to an input voltage signal. Furthermore, each arc in the spectra relates to
at least one rate limiting reaction step. Impedance arcs occurring over the high
frequency domain generally indicate that electrochemical reactions (e.g., charge
transfer) are rate limiting. Arcs displayed in the low frequency regime suggest surface
related processes are limiting. Analysis of the activation energy and oxygen partial
pressure dependence can help to interpret rate-limiting processes. Correlating the rate
limiting process with the microstructure of the sensor is expected to enable
optimization of the fabrication process to reduce or eliminate rate-limiting
mechanisms and promote NOx sensor performance.
3.3 Equivalent Circuit Analysis
The basic purpose of an equivalent circuit is to model the impedance response
generated by an electrochemical system. Equivalent circuit analysist can be used to
interpret the underlying physical processes taking place at the electrode-electrolyte
interface of a sensor. In normal practice, two or more parallel circuits are used for

22
properly explaining the output response of a sensor. Commonly used circuit elements
include resistors, capacitors, and inductors, which are the ideal circuit elements. Some
other elements such as Warburg diffusion and constant phase elements are also used,
but they are non-ideal elements that compensate for deviations from ideal resistance
and capacitance behavior. The details of the circuit elements are given in the
following table.
Table 3-1: Elaboration of circuit elements [18].
Element Circuit Symbol Symbol Significance
Resistor
R Resistance to charge
transfer
Capacitor
C Capacitance arising from
double layer charge
Inductor
I Stray inductance
Constant Phase
Element
Q Non-ideal capacitor
Cole
RQ
Charge transfer through
the double layer of the
electrode / electrolyte.
Warburg
W Infinite or semi-infinite
electrode diffusion
Voigt
RC Interfacial charge
exchange
As shown in the above table, the Cole and Voigt are compound elements made
by the combination of two single elements, RQ and RC, respectively. Normally, a
modified form of Voigt element is used, which is also referred to as the Cole circuit in
the series [18], as shown in the following figure:

23
Figure 3-5: Voigt elements the in series.
The following chapters discuss impedancemetric NOx sensor studies that were
carried out using porous zirconia based electrolytes. The objective was to acquire a
fundamental understanding of the role of microstructure and ionic conductivity on the
NOx sensing response. Towards this aim, NOx sensors composed of various
composite electrolytes were operated under different conditions to evaluate the
relationship between electrolyte properties and NOx sensor behavior.

24
EFFECT OF AL2O3 IN POROUS ZIRCONIA ELECTROLYTES
FOR NO SENSING 1
4.1 Overview
Porous electrolyte based NOx sensors are under consideration for
impedancemetric [19-23] and potentiometric [12, 24, 25] exhaust gas sensing
applications. Enhanced NOx sensitivity has been observed at such sensors, which
typically incorporate electrodes with a dense microstructure. The porous electrolyte
supports gas diffusion, while the dense electrodes limit heterogeneous catalysis
reactions that interfere with accurately sensing NO and NO2. These studies have
largely concentrated on porous electrolytes composed of fully-stabilized yttria-doped
zirconia (YSZ) due to the high ionic conductivity of the material that is known to
promote NOx sensitivity.
However, the porous YSZ microstructure and brittle nature of the ceramic
limits sensor durability. Partially-stabilized yttria-doped zirconia (PSZ) has superior
mechanical properties, in comparison to YSZ as the fracture toughness and impact
resistance is greater [26]. PSZ has been considered as an alternative electrolyte in
thin-film solid oxide fuel cells, as well as a composite anode component [27, 28].
1 This material has been published as Kharashi, K. and Murray, E.P., 2016. “Effect of Al2O3 in
Porous Zirconia Electrolytes for NO sensing”. Journal of The Electrochemical Society, 163(13), pp.
B633-B637 and is being reproduced with the kind permission of the publisher (The Electrochemical
Society) and co-author.

25
Although the mechanical properties of PSZ are beneficial, they are also accompanied
by reduced ionic conductivity, with respect to YSZ [29].
Adding small amounts of Al2O3 to yttria-stabilized zirconia can enhance ionic
conductivity along the grain boundaries [30]. The reason is because Al2O3 is able to
prevent impurities such as SiO2 from blocking grain boundary transport pathways.
Al2O3 additions can also contribute to the mechanical strength of the electrolyte [31],
increase crystallographic phase stability [32], and limit hydrothermal aging [30].
Numerous studies reported a decrease in ionic conductivity when the Al2O3 addition
to the electrolyte was greater than 2 wt%, since Al2O3 is an electrical insulator [30,
31, 33].
The mechanical and electrical properties of PSZ-Al2O3 composites are
attractive for porous electrolyte based NOx sensors, yet little is known about the role
of Al2O3 for such applications. Impedancemetric NOx sensing is a promising
technique for achieving high accuracy NOx detection at lower manufacturing costs, in
comparison to the current commercial methods. Impedancemetric NOx studies have
reported similar gas sensing responses for NO and NO2 as thermodynamic conversion
causes NO2 to convert to NO at elevated temperatures [34].
Thus, in the present study, the impedancemetric NO sensing response of
porous PSZ based sensors with Al2O3 additions of 2, 3.8, 5, and 10 wt.% was
analyzed for various operating conditions. The goal of the study was to gain greater
understanding of the impact of Al2O3 on the porous electrolyte structural
characteristics, electrical behavior of the sensors, and NO sensitivity.
4.2 Experimental
In this study, NOx sensors were fabricated with PSZ electrolytes containing
various amounts of alumina, along with embedded electrodes. Standard ceramic

26
processing methods were used to combine the PSZ electrolyte powder that was 8
wt.% (∼4.7 mol.%) Y2O3 – ZrO2 manufactured by UCM Advanced Ceramics with
high purity aluminum oxide (Al2O3) purchased from Sigma Aldrich. The 4 types of
PSZ-Al2O3 electrolytes fabricated contained 2, 3.8, 5, and 10 wt.% Al2O3.
The PSZ-Al2O3 powders were ball milled with 3 wt.% of polyvinyl butyral B-
76 binder and ethanol for 16 hours. A portion of the resulting PSZ- Al2O3 slurry was
dried and uniaxially pressed at 200 MPa into pellets with a diameter of 13 mm and
thickness of 3 mm. Au wire electrodes (0.25 mm diameter) covered with Au mesh to
enhance the current collection were coated with the remaining PSZ-Al2O3 slurry. The
Au mesh dimensions were 3 mm × 3 mm with an open area of 56.3%. PSZ
electrolytes without Al2O3 were fabricated by the same methods.
The sensor diagram given in Figure 4-1 illustrates the placement of the
embedded electrodes. The diagram shows an uncoated view of the Au wires that were
6 mm apart with a 3 mm space between the Au mesh. The uncoated view is only for
illustration purposes as the Au mesh and Au electrodes were coated with a PSZ-Al2O3
slurry. The sensors were fired in air at 1050◦C for 1 hr. Some PSZ and PSZ-Al2O3
electrolyte pellets without the Au wire electrodes were fired under the same
conditions and reserved for microstructural analysis in order to evaluate the impact of
Al2O3 addition within the sensor electrolyte. The porosity, morphology, and structural
characteristics of the PSZ and various PSZ-Al2O3 electrolyte pellets were analyzed
using Archimedes method, Scanning Electron Microscopy (SEM) and X-ray
Diffraction (XRD).
The impedancemetric response of the sensors was studied using a Gamry
Reference 600. Measurements for each sensor were conducted within a quartz tube
that was placed in a furnace where the operating temperature ranged between 550–

27
700◦C. Mass flow controllers were used to manage the testing gas concentrations
where NO ranged from 0-100 ppm with 1–18% O2 present and N2 as the balance gas.
The total gas flow rate was 100 standard cubic centimeters per minute (sccm).
Data were collected for dry gas measurements, as well as humidified gas
conditions where a water bubbler was used to establish a humidity of approximately
3%. The impedance measurements were collected at an applied signal amplitude of 50
mV over a frequency range of 1 Hz–1 M Hz. Measurements were repeated at least
three times to ensure stable, reproducible results were achieved. Equivalent circuit
analysis was used to aid interpretation of the electrochemical behavior of the NO
sensors with respect to the Al2O3 concentration within the electrolyte.
Figure 4-1: Schematic of NO sensor.
4.3 Results and Discussion
4.3.1 Microstructure and Morphology
Typical SEM cross-sectional images of fractured porous electrolyte pellets
composed of PSZ and PSZ-2% Al2O3 are shown in Figure 4-2. These images were
collected at an accelerating voltage of 1.0 kV using secondary electrons. Significant
particle-to-particle contact was observed between PSZ particles that had necked
together (Figures 4-2a–4-2b). Also, there were numerous pores well distributed
throughout the PSZ electrolyte that tended to be 50–200 nm in size. The PSZ-2%

28
Al2O3 electrolyte image was typical of pellets with Al2O3 addition (Figures 4-2c–4-
2d). The PSZ-Al2O3 composite pellets contained irregular shaped Al2O3 particles that
were approximately 0.4–0.6 μm large. Given the low firing temperature (i.e. 1050oC),
the Al2O3 particles did not coalesce with each other. Rather PSZ particles formed a
network of contacts between Al2O3 and other PSZ particles. The pores within the
PSZ-Al2O3 electrolytes appeared to be similar to those within the PSZ electrolytes.
The porosities of the electrolyte pellets were determined by using the
Archimedes measurements. According to the Archimedes principle, a body
submerged in a liquid will experience an upward force equal in magnitude to the
weight of the liquid displaced by that body. This force is opposite to the direction of
the gravitational force and could be given by the relation as follows:
𝐹𝐵 = 𝑚𝑓𝑔 Eq. 4-1
In the above equation, 𝐹𝐵 is the upward or buoyant force and 𝑚𝑓 is the weight
of the liquid space by the body. A body floats in a fluid if the magnitudes of buoyant
and gravitational forces become equal to each other. In this study, the determination
of porosity was based on Archimedes’ principle. This method involved the weighing
of dry electrolyte pellets (Wdry) and then saturation of electrolytic pores by immersing
it in a liquid. The weight of the submerged pellet (Wsub) was also noted, and then its
saturated weight (Wsat) was determined after taking it out of the liquid. The porosity
(𝜑) was then calculated by using the following relation:
𝜑 =
𝑊𝑠𝑎𝑡 − 𝑊𝑑𝑟𝑦
𝑊𝑠𝑎𝑡 − 𝑊𝑠𝑢𝑏
Eq. 4-2
This liquid saturation method offers a simple way of calculating the porosity
of electrolyte pellets. However, its major drawback is its low accuracy due to the
incomplete saturation of the pore network. The porosity is generally defined as the
volume of small spaces or voids that a porous material contains as compared to the

29
total amount of that material [35]. It is usually expressed in parentages and its relation
is given as follows:
Porosity = 𝑉𝑜𝑙𝑢𝑚𝑒 𝑜𝑓 𝑠𝑝𝑎𝑐𝑒𝑠 𝑜𝑟 𝑣𝑜𝑖𝑑𝑠
𝑇𝑜𝑡𝑎𝑙 𝑣𝑜𝑙𝑢𝑚𝑒 𝑜𝑓 𝑡ℎ𝑒 𝑚𝑎𝑡𝑒𝑟𝑖𝑎𝑙 Eq. 4-3
Archimedes measurements of the electrolyte pellets indicated the porosity was
about 44% for the PSZ pellets, and the porosity decreased with increasing Al2O3
addition. Porosity values for the PSZ- Al2O3 pellets are given in Table 4-1. The
decrease in porosity indicated Al2O3 particles blocked existing gas transport pathways
within the PSZ electrolyte. Other studies have found that the NOx sensor electrolyte
porosity has a strong influence on the electrical response of the sensor [34]. Thus, the
Al2O3 electrically insulating particles also modified the ionic transport path- ways
within the sensor electrolyte.
Table 4-1: PSZ electrolyte porosity with respect to Al2O3 addition.
Electrolyte pellet Porosity [%]
PSZ 44 ± 0.5
PSZ - 2% Al2O3 43 ± 0.5
PSZ - 3.8% Al2O3 42 ± 1.0
PSZ - 5%A Al2O3 41 ± 0.35
PSZ - 10% Al2O3 40 ± 0.10
Figure 4-2 shows XRD results for the PSZ and PSZ-Al2O3 composite pellets,
as well as the as-received Al2O3 powder. The primary phases observed in the PSZ-
Al2O3 composites were α-Al2O3 and tetragonal ZrO2. A small peak belonging to cubic
ZrO2 was observed near 2θ = 74.5o. The diffraction patterns showed an increase in the

30
α-Al2O3 peak intensity with increasing alumina addition in the PSZ-Al2O3 composite
electrolytes.
Figure 4-2:. SEM images of fractured cross-sections of electrolyte pellets illustrating
typical: a) PSZ particle-to-particle contact b) PSZ microstructure at higher
magnification, c) PSZ- Al2O3 composite with 2% Al2O3 addition, and d) PSZ-2%
Al2O3 composite at higher magnification.
Figure 4-3: X-ray diffraction patterns for: a) Al2O3, b) PSZ-2% Al2O3, c) PSZ- 3.8%
Al2O3, d) PSZ-5% Al2O3, e) PSZ-10% Al2O3, and f) PSZ.

31
4.3.2 Impedance response
Impedance spectroscopy measurements of the various sensors were collected
to interpret the impact of Al2O3 as follows:
1) Electrical behavior of porous PSZ-Al2O3 electrolyte,
2) Interfacial NO reactions,
3) NO sensing response.
In Figure 4-4, the impedance data for sensors with a PSZ and PSZ-2% Al2O3
electrolyte illustrate the typical electrical response of sensors with and without Al2O3
addition. A partial high frequency arc and a distinct low frequency arc, respectively
referred to as HFA and LFA, were present for both types of sensors. The partial arc
described by HFA was due to electrolyte reactions, and electrode and interfacial
reactions were described by the LFA. A comparison of the data indicated the total
sensor impedance increased with the addition of Al2O3. In studies on the electrical
behavior of Al2O3 added to yttria-stabilized zirconia, the bulk electrolyte ionic
conductivity was found to decrease for additions of Al2O3 greater than 1 wt.% [30].
This decrease in ionic conductivity was correlated with a decrease in bulk electrolyte
capacitance.
Thus, the increase in the HFA impedance that occurred when Al2O3 was added
to PSZ likely resulted from a decrease in bulk electrolyte conductivity. The larger
impedance of the LFA for the PSZ-2% Al2O3 based sensors can be attributed to
insulating Al2O3 particles blocking electrochemical reaction sites along the triple-
phase-boundary (TPB). The TPB is the location where the PSZ electrolyte, Au
electrode, and gas phases were in contact. Al2O3 particles taking the place of PSZ
particles along the TPB reduced the density of TPB reaction sites thereby, impeding
interfacial reactions. Further analysis of the impedance response was carried out using

32
the equivalent circuit shown in Figure 4-4. It was used to model sensor impedance
data. The circuit elements RHFA and RLFA represented the resistance of the HFA and
LFA, respectively. The constant phase elements, CPE1 and CPE2, accounted for the
non-ideal capacitance behavior of the respective HFA and LFA.
Figure 4-4: Impedance results of PSZ and PSZ-2%Al2O3 based NO sensors, and the
equivalent circuit used for modeling.
The fitted values determined by equivalent circuit analysis for RHFA and RLFA,
along with the magnitude of the impedance, |Z|, were used to generate the bar graph
shown in Figure 4-5 for sensors operating at 650◦C.
Figure 4-5: The fitted values from equivalent circuit modeling for RHFA, RLFA, and |Z|
for impedance data collected at 650◦C for PSZ and PSZ-Al2O3 based sensors.

33
The term |Z| is defined by the real, ZR, and imaginary, ZI, impedance
components as shown in Eq. 3-4. Here, the maximum value for |Z| was the overall
magnitude of the impedance, which corresponded to the sum of RHFA and RLFA.
Details concerning the theory of |Z| behavior are described elsewhere [36]. The RHFA
component was significantly larger than RLFA for the PSZ based sensors. Reactions
governed by the porous microstructure of the electrolyte as well as the bulk and grain
boundary conductivity of PSZ contributed to the resistance modeled by RHFA [37, 38].
For sensors containing 2 wt.% Al2O3, the corresponding values for RHFA and
RLFA did not differ greatly. This result was possibly related to an enhancement in the
electrolyte grain boundary conductivity that could have limited the resistance of RHFA.
Although Al2O3 additions can impede electrolyte bulk conductivity, it can have the
opposite effect on the electrolyte grain boundary conductivity for Al2O3 additions ≤ 2
wt.% [30]. As the Al2O3 addition increased to 5 wt% in the PSZ-Al2O3 composite
electrolyte, the |Z| of the sensors gradually increased. This was likely related to an
increase in electrolyte bulk and grain boundary resistivity resulting from greater Al2O3
additions, which in turn contributed to RHFA. As for RLFA, the modeled data indicated
a subtle increase in value for Al2O3 additions of 2–5 wt.%, which suggested electrode
and interfacial reactions were not significantly impeded.
When the amount of Al2O3 increased to 10 wt.%, a substantial increase in both
RHFA and RLFA was observed for the corresponding sensors. Adding 10 wt.% Al2O3 to
the electrolyte most likely hindered electrolyte reactions and interrupted PSZ contact
along the TPB such that interfacial reactions were limited. The slight distortion of the
impedance arcs from ideal semi-circles was accommodated by CPE1 and CPE2 fitting
elements. Since the partial HFA described contributions from multiple electrolyte
reactions, it was difficult to decipher specific phenomena associated with CPE1with

34
respect to Al2O3 addition. On the other hand, fitted valued associated with CPE2 were
found to decrease with Al2O3 addition. The capacitance associated with CPE2
decreased from approximately 6.25 × 10⁻⁷ F for PSZ electrolyte based sensors down
to about 1 × 10⁻⁷ F for sensors with 10 wt.% Al2O3. The following equation Eq. 4-4
was used to determine the capacitance (C):
𝐶 =
[(𝑅𝐿𝐹𝐴)(𝐶𝑃𝐸2)]1/𝑛
𝑅𝐿𝐹𝐴
Eq. 4-4
The constant n describes the deviation from pure capacitance behavior. For an
ideal capacitor n = 1. Here, equivalent circuit modeling results indicated n ∼ 0.8 for
the PSZ and PSZ- Al2O3 sensors. Operating the sensors under humidified gas
conditions resulted in an increase in the impedance, specifically for the LFA, as
shown in Figure 4-6.
Figure 4-6: Impedance response of sensors under dry and humidified gas conditions.
The HFA behaved independent of gas concentration as it is controlled by
temperature dependent reactions [36]. The behavior of NOx sensors in the presence of
water vapor can differ due to variations in material processing and operating
conditions. Here, it is possible that gas species resulting from molecular water
reactions occupied sites along the TPB, thereby reducing the availability of sites for
oxygen and NO. Thus, limited TPB reactions may have contributed to a larger

35
interfacial resistance. Similar observations were observed for the various PSZ-Al2O3
sensors.
4.3.3 NO sensing
The impact of Al2O3 addition within the sensor electrolyte on
impedancemetric NO sensing was evaluated based on the change in the angular phase
response, Δθ, according to Eq. 4-5:
Δθ = θ𝑶𝟐 − θ𝑵𝑶 Eq. 4-5
where θO2 was the sensor baseline angular phase response during operation with 10.5%
O2, and θNO was the response with added NO. The phase angle is useful for sensing NO
[19] and is defined as the ratio of the real ZR, and imaginary ZI parts of the impedance
at a specific frequency, f = 2πω, as given in Eq. 2-2.
Sensitivity to 100 ppm NO for the PSZ-Al2O3 based sensors with respect to
operating temperature is shown in Figure 4-7. Automotive exhaust generally contains
some amount of water, thereby creating humidified gas conditions that can impact NO
sensitivity. Here, the sensitivity measurements with humidified gases were about 2%
lower than dry sensitivity measurements. Data for the sensors with 10 wt.% Al2O3
addition were excluded for temperatures ≤ 600oC as the data was unreliable due to
significant noise in the impedance response, particularly for lower frequencies. The
poor data likely resulted from insufficient contact of PSZ at the TPB due to
interference from Al2O3 particles.

36
Figure 4-7: Sensitivity to 100 ppm NO for the PSZ and PSZ-Al2O3 based sensors.
Sensitivity data for each type of sensor were collected during operation at the
peak frequency where the maximum phase angle response was achieved. The highest
NO sensitivity was observed for the sensors composed of PSZ-2% Al2O3. The 2 wt.%
Al2O3 addition to the PSZ electrolyte most likely contributed to enhanced conductivity
along the PSZ grain boundaries that enabled electrochemical reactions involving
oxygen ions and NO to proceed more readily. Sensitivity to NO decreased with
increasing Al2O3 addition and operating temperature. Increasing the Al2O3 addition
hindered the ionic conductivity, as well as the gas transport pathways within the
sensor electrolyte, and subsequently reduced NO sensitivity. The increase in
temperature may have enabled oxygen reactions to proceed more readily in
comparison to NO reactions. The data presented in Figure 4-7 also indicates the peak
frequency increased with the sensor operating temperature.
Although sensor operation at 10 Hz and 550◦C yielded the greater NO response,
higher frequency operation would enable the sensors to operate more rapidly as the gas
sampling time would be reduced [21]. A key aspect of sensor feasibility involves
balancing the trade-off between the magnitude of the sensing signal and sensor

37
response time. The sensing behavior of PSZ-2% Al2O3 based sensors for various NO
concentrations under humidified conditions is shown in Figure 4-8.
Figure 4-8: The sensing behavior of PSZ-2% Al2O3 based sensors for various NO
concentrations under humidified conditions.
The peak frequency and corresponding operating temperatures were the same
as those given in Figure 4-7. The sensing response for NO concentrations of 5 ppm
was negligible when the operating temperature was 550◦C. As the operating
temperature increased the PSZ-2% Al2O3 based sensors were more sensitive to NO
concentrations ≤10 ppm. However, a decrease in NO sensitivity for all gas
concentrations was observed at 700◦C.
The data presented in Figure 4-8 can be compared to other impedancemetric
studies by considering Δθ/Δ[NO], where Δθ is given by the values along the y-axis
and Δ[NO] is the difference between the concentration of NO at baseline gas
conditions and the concentration of NO present. (In this study, the NO concentration
was 0 ppm for baseline gas conditions such that Δ[NO] was the NO concentration
introduced to the sensor).

38
For data collected at T = 650◦C for the PSZ-2% Al2O3 based sensors
Δθ/Δ[NO] ≈ 0.03 degrees/ppm NO at an operating frequency of 10 Hz.
Impedancemetric NOx sensor studies by Woo et al. reported Δθ/Δ[NO] ≈ 0.07
degrees/ppm NO for porous fully-stabilized Y2O3-ZrO2 based sensors with a Au wire
sensing electrode operating at 650oC [21]. This comparison indicates the fully-
stabilized Y2O3-ZrO2 based NOx sensors are more sensitive to NO than the PSZ-2%
Al2O3 based sensors for similar operating conditions. This was expected as the higher
ionic conductivity of fully-stabilized Y2O3-ZrO2 electrolyte promotes NO sensitivity.
Increasing the ionic conductivity of the PSZ-Al2O3 by optimizing the amount of Al2O3
within the composite electrolyte may be a means to achieve greater NO sensitivity
and sensor feasibility. A comparison of Δθ/Δ[NO] calculations for PSZ and PSZ-2%
Al2O3 based sensors were determined to be approximately 0.010 and 0.016
degrees/ppm, respectively for an operating frequency of 32 Hz. This indicates the 2
wt.% Al2O3 addition enabled about a 38% increase in NO sensitivity. Thus,
determining the optimal concentration for the Al2O3 addition could potentially further
improve NO sensing for PSZ-Al2O3 sensors.
4.3.4 PO2 and Ea dependence
The oxygen partial pressure, PO2, and activation energy, Ea, were determined in
order to provide an understanding of potential rate limiting mechanisms affecting
sensor behavior and the temperature dependence. NOx sensing studies show that NO
sensitivity is related to the rate limiting mechanism for oxygen [20]. Identifying the
rate determining step for the oxygen reaction is important for understanding NO
sensing behavior. The oxygen partial pressure is given by the power law relationship as
given in Eq. 4-6:
(𝐏𝐎𝟐) 𝐦 ∝ 𝐑𝐋𝐅𝐀 Eq. 4-6

39
where m is the slope. As shown in Figure 4-9, the PSZ based sensors had a PO2
dependence where m = −0.47, and the corresponding activation energy was 1.03 ±
0.01 eV. Adding Al2O3 to the PSZ electrolyte caused the slope associated with PO2 to
become more negative. The activation energy remained close to 1eV, although a
slight decrease was observed with increasing Al2O3 addition. For example, Ea
decreased to 1.01 ± 0.02 eV for the PSZ-5% Al2O3 sensors. Data for the PSZ-10%
Al2O3 sensors was not reliable at lower oxygen concentrations due to significant noise
observed in the response for reasons previously discussed.
Figure 4-9: Effect of Al2O3 addition on the oxygen partial pressure dependence of the
various sensors.
Studies on Au/YSZ/Au NOx sensors have calculated similar activation energy
values, and the PO2 dependence followed a slope, m ≈ −0.5.18 A PO2−0.5 dependence
can be an indication that dissociative adsorption of oxygen is rate limiting [39, 40].
The slope value for the PSZ based sensors was slightly lower than m = −0.5, which
may indicate that an additional process was rate limiting. Since the charge transfer
step is associated with a PO2−0.25 dependence, it is possible that charge transfer at the
TPB was also a rate limiting process for the PSZ based sensors.

40
It has been shown in other studies that NOx sensing was hindered significantly
in sensors where charge transfer was the dominant limiting mechanism for the oxygen
reaction, whereas NOx sensing seemed to proceed more readily when dissociative
adsorption was the rate determining step for oxygen [20, 23]. The Al2O3 addition to
PSZ caused to oxygen partial pressure dependence to become more negative, which
suggested gas phase diffusion began to have an impact. Other studies have found a
PO2−1 dependence is associated with gas diffusion [40]. The measured decrease in the
electrolyte porosity of the sensors with addition of Al2O3 correlated with gas diffusion
as an additional rate liming step due to Al2O3 addition.
4.3.5 Conclusions
The addition of Al2O3 to PSZ resulted in an increase in the NO sensor
impedance. Adding 2 wt.% Al2O3 seemed to enhance the PSZ electrolyte grain
boundary conductivity, which supported electrochemical NO reactions at the TPB.
Increasing the Al2O3 addition above 2 wt.% in the PSZ electrolyte increased the
resistance of the electrolyte bulk, grain boundaries and interfacial reactions. In
addition, the decrease in porosity with Al2O3 addition restricted gas transport pathways
within the porous electrolyte.
The dominant rate limiting mechanism for the PSZ-2% Al2O3 based sensors
appeared to be oxygen dissociative adsorption, whereas oxygen dissociative
adsorption combined with charge transfer or gas diffusion seemed to be rate limiting
for PSZ and the other PSZ-Al2O3 composite based sensors. Overall, the addition of 2
wt.% Al2O3 to PSZ based sensors resulted in greater sensitivity to NO, and sensitivity
was achieved at concentrations as low as 5 ppm NO.

41
MANAGING H2O CROSS‐SENSITIVITY USING COMPOSITE
ELECTROLYTE NOX SENSORS 2
5.1 Overview
Advancements in diesel engine technology and emissions regulations in
various countries are driving the need for NOx sensors capable of greater sensitivity,
selectivity, and accuracy. Zirconia-based NOx sensors are favored for their stability
and electrochemical performance under stringent exhaust conditions. Various research
studies have achieved substantial NOx sensitivity at sensors utilizing novel porous
electrolytes, as an alternative to the conventional dense electrolyte microstructure [19,
34, 41]. NOx sensors based on the conventional architecture commonly have porous
precious metal electrodes to support exhaust gas transport to the electrode/electrolyte
interface where NOx sensing reactions take place. Unfortunately, heterogeneous catalysis
can occur within the porous electrodes, thereby reducing the amount of NOx gas
arriving at the interface. This becomes a significant problem when it is necessary to
detect low concentrations (i.e., <10 ppm) of NOx as sensor accuracy is compromised.
Heterogeneous catalysis is negligible at NOx sensors using a porous zirconia-based
electrolyte with dense electrodes. The porous electrolyte does not appear to interfere
with the exhaust gas during transport to the electrode/electrolyte interface. Thus, the
2 This material has been published as Murray, E. P., Kharashi, K., and Adedeji, K., 2017,
"Managing H2O Cross‐Sensitivity Using Composite Electrolyte NOx Sensors," Electrochemical
Sensors Technology, InTech. and is being reproduced with the kind permission of the publisher and co-
author.

42
porous zirconia electrolyte enables greater NOx sensor sensitivity and accuracy.
However, cross-sensitivity to interfering exhaust gases, particularly water vapor,
adversely affects the selectivity of the device. Sensor operation at specific frequencies
appears to be an effective measure for addressing cross-sensitivity to oxygen [19]. Yet,
this approach has not been effective for limiting cross-sensitivity to water. Greater
understanding of the behavior of water during sensor operation is necessary for
managing water cross-sensitivity and improving the feasibility of porous zirconia-based
NOx sensors.
Cross-sensitivity in NOx sensors can result from electrochemical reactions
with exhaust gas species that proceed more readily and/or more rapidly than NOx
reactions. Accumulation of various molecules at the electrode/electrolyte interface can
also enable undesirable reactions to proceed leading to cross-sensitivity. The impact of
water cross-sensitivity has been ambiguous as it can cause the NOx sensing response
to increase or decrease [42-44]. Some studies suggest that the different behavior
observed is related to the sensor materials, fabrication methods, and operating
conditions. Few studies have reported the NOx sensing response for various water
concentrations. Limited data with varying results has made it difficult to
understand and control the impact of water on the sensing behavior of porous
electrolyte NOx sensors.
Recently, the authors found composite electrolyte NOx sensors with a porous
microstructure demonstrated reduced cross-sensitivity to water in comparison to
sensors with a single-phase electrolyte. To further study the potential of composite
electrolytes for NOx sensing, various sensors based on electrolytes containing
specific ratios of partially stabilized zirconia (PSZ) and fully stabilized zirconia
(FSZ) were evaluated using the impedancemetric technique. The work presented in

43
this chapter describes the electrochemical response, gas sensitivity, rate limiting
mechanisms, and sensing response rate due to operation in humidified gas
environments for composite electrolyte NOx sensors.
5.2 Experimental
Standard ceramic processing techniques were used to fabricate NOx sensors
containing partially-stabilized zirconia (PSZ, 4.7 mol.% Y2O3–ZrO2) produced by
advanced ceramics and fully stabilized zirconia (FSZ, 8 mol.% Y2O3–ZrO2)
manufactured by Tosoh as electrolyte materials. There were five electrolyte slurries
prepared using different ratios of PSZ and FSZ along with polyvinyl butyral (Butvar
B-76) binder and ethanol for the solvent. The slurries were ball milled for 16 hours
to form a uniform mixture. A portion of each electrolyte slurry was dried and the
powders were pressed uniaxially at 200 MPa into pellets. The three types of PSZ–FSZ
composite electrolytes studied contained 25, 50, and 75 vol.% PSZ, and are identified
as 25 PSZ–75 FSZ, 50 PSZ–50 FSZ, and 75 PSZ–25 FSZ, respectively.
Electrolytes composed of single-phase FSZ or single-phase PSZ particles were
fabricated for performance comparison purposes. Single-phase PSZ electrolytes
containing coarse particles were also fabricated in order to study the impact of particle
size on water cross-sensitivity. Gold (Au) electrodes were placed over the electrolytes
and coated using the corresponding electrolyte slurry to complete the sensor
configuration. The sensors were air dried and then fired at 1050○C for a period of 1
hour.
A schematic of the top view and cross section of the sensors is shown in
Figure 5-1. The top view shows the position of the sensor electrodes without the
electrolyte coating. The cross-sectional view includes the electrolyte coating over the
electrodes. There was no distinction observed between the electrolyte coating and

44
pellet as the materials were of the same composition. The microstructure and
morphology of the electrolytes were analyzed using scanning electron microscopy
(SEM) and Archimedes method.
The electrochemical behavior of the sensors was characterized using a Gamry
Reference 600 to perform impedance spectroscopy. Impedance measurements were
performed for sensors operating over a temperature range of 600–700○C where the
concentration of NO and NO2 was varied from 0 to 100 ppm in O2 concentrations of
1–18% with N2 as the balance. Data was collected for dry and humidified (3–10%
H2O) environments using a standard gas handling system with mass flow controllers
that maintained a flow rate of 100 standard cubic centimeters per minute (sccm). The
Gamry instrument was configured to apply a signal amplitude of 50 mV over an
operating frequency range of 1 Hz–1 MHz. Measurements were collected in triplicate
to ensure the data was consistent and stable. Equivalent circuit modeling using Gamry
EIS300 software was used to acquire a detailed understanding of the electrochemical
behavior of the sensors.
Figure 5-1: NOx sensor diagram: (a) top view, and (b) cross-sectional view with
embedded Au wire electrodes.
5.3 Morphology and Microstructure
The microstructure of the porous electrolyte can impact gas sensor reactions.
Studies have found the porosity of the electrolyte affects gas transport to the triple

45
phase boundary (TPB) [34, 37]. The TPB is the location where the electrolyte,
electrode, and gas phase are in contact. The TPB is important as NOx sensing
reactions take place along this boundary. Insufficient porosity within the electrolyte
restricts gas transport to the TPB and limits sensor reactions. This usually results in a
slow sensor response rate that is not practical for automotive applications. On the
other hand, excess porosity allows gases to transport readily through the electrolyte,
but also causes TPB reaction sites to become limited, which has the negative effect of
decreasing NOx sensitivity.
Figure 5-2 shows typical SEM surface images for PSZ, FSZ, and PSZ–FSZ
composite electrolytes. The particles composing the PSZ electrolytes in Figure 5-2a
were irregular in shape and varied from 0.1 to 0.3 µm in size, whereas the FSZ
electrolytes consisted of finer particles that seemed to be more uniform in size (largest
diameter ∼0.04 µm) and shape. The FSZ particle-to-particle connectivity, shown in
Figure 5-2b, appeared to be greater than the particle connectivity between PSZ
particles. The PSZ–FSZ composite electrolytes contained a well-distributed mixture
of PSZ and FSZ particles, as shown in Figure 5-2c. In addition, larger pores were
observed throughout the composite microstructure in comparison to the single-phase
electrolytes. Figure 5-2d shows an image of the microstructure of electrolytes
containing PSZ coarse particles where the particle size ranged from about 0.4–1 μm.
Table 5-1 gives the porosity measurements for the various electrolytes that were
determined via the Archimedes method. The irregular shaped PSZ particles allowed
for closer packing of the particles, thereby lowering the porosity of PSZ-based
electrolytes.

46
Figure 5-2: SEM images of electrolytes composed of: (a) PSZ, (b) FSZ, (c) 50 PSZ–
50 FSZ, and (d) PSZ coarse particles.
Table 5-1: Electrolyte porosity based on the Archimedes Method.
Electrolyte Porosity
PSZ 75 PSZ - 25
FSZ
50 PSZ - 50
FSZ
25 PSZ - 75
FSZ FSZ
PSZ
course
43 % 45 % 47 % 50 % 54 % 38%
5.4 Electrochemical Response
Impedance spectroscopy is a powerful and commonly used technique for
interpreting the electrical response of electrochemical devices and systems [36]. The
impedance is an AC measurement that describes the opposition to the current’s flow
due to resistance, inductance, and capacitance effects. The impedance, Z(ω), varies
with frequency, f, and is generally represented by Eq. 2-3.

47
where the angular frequency ω = 2πf. In addition, the real (ZR) and imaginary (ZI)
impedance typically produce a semicircular shaped response or arc that is presented in
the complex plane. In practice, more than one arc is common due to various reactions
occurring at different rates. The impedance measurements for the NOx sensors in this
work consisted of a high and low frequency arc. The high frequency arc (HFA)
described electrochemical reactions occurring at the porous electrolyte, and the low
frequency arc (LFA) reflected electrode and interfacial reactions.
Figure 5-3 shows typical impedance data describing the electrochemical
response of PSZ, FSZ, and 50 PSZ–50 FSZ-based sensors operating at 600○C with
and without 100 ppm NO present under dry and humidified conditions. Data for
sensors composed of PSZ coarse particles is included. For each type of sensor, the
high frequency arc was independent of the gas concentration. In addition, the
magnitude of the high frequency arc differed on account of the difference in ionic
conductivity for PSZ (∼0.08 S/cm) versus FSZ (∼0.14 S/cm) [29]. The higher
conductivity of FSZ contributed to the lower high frequency arc impedance. Thus, the
magnitude of the high frequency arc decreased as the FSZ composition within the
sensor increased. These observations were expected as the high frequency arc is
known to depend upon the ionic conductivity and operating temperature of the
electrolyte material [36]. In all cases here, the high frequency arc was incomplete on
account of the high frequency limitation of the Gamry Reference 600 instrument.
As the high frequency arc does not vary with gas concentration, it is generally
not useful for interpreting the sensor response to NOx gas reactions. Therefore,
acquiring a complete high frequency arc was not necessary for this study. For the low
frequency arc, there was a decrease in magnitude when 100 ppm NO was added to the
gas stream as shown in Figure 5-3 for each sensor type. This change indicated

48
electrode and interfacial reactions proceeded more readily when NO was present. The
impedance data for sensors operating with 100 ppm NO2 gas was very similar to that
for NO. Thermodynamic conversion of NO2 to NO takes place at elevated
temperatures, such that at 600○C approximately 90% of NO2 converts to NO.
Figure 5-3: Impedance data collected at 600○C where the sensor electrolyte was: (a)
PSZ, (b) 50 PSZ–50 FSZ, (c) FSZ, and (d) PSZ coarse under dry and humidified
conditions.
For this reason, data using NO gas is presented in this work. The addition of
water to the gas stream caused the low frequency impedance arc to decrease slightly
for sensors with a PSZ, 75 PSZ–25 FSZ, and 50 PSZ–50 FSZ electrolyte. Quite the
opposite behavior occurred for sensors containing a FSZ and 25 PSZ–75 FSZ
electrolyte. The change in the impedance due to water cross-sensitivity is shown for
sensors composed of PSZ, FSZ, and 50 PSZ–50 FSZ in Figure 5-3a–c. In other
studies, analysis of water adsorption experiments at oxide surfaces have found that
molecular water strongly adsorbs onto the surface of Y2O3 and surface reactions result
in the formation of hydroxyl groups [40, 45].
Furthermore, computational studies indicate dissociation of water molecules is
a mechanism for the formation of hydroxyl species at Y2O3–ZrO2 surfaces, and

49
interfacial reactions between the oxide and hydroxyl groups can enhance oxygen ion
conductivity [46]. However, it is also possible for adsorbed water molecules and
hydroxyl species to block oxygen adsorption sites along the electrolyte/electrode
interface and subsequently hinder interfacial reactions with oxygen [43].
In the present study, the Y2O3 content of the sensor electrolyte was
approximately 4.7 and 8 mol.% for PSZ and FSZ supported sensors, respectively. It is
possible that the higher Y2O3 content of FSZ allowed greater adsorption of molecular
water and hydroxyl groups to take place at sensors containing an FSZ based
electrolyte in comparison to sensors with ≥50 vol.% PSZ. This would decrease the
available sites for NO and O2 adsorption. For such a case, triple-phase-boundary
reactions requiring NO and O2 would be limited, thereby causing the sensor
impedance to increase in the presence of water, as shown in Figure 5-3b. The slight
decrease in impedance for PSZ sensors likely occurred due to enhanced oxygen ion
conductivity. The lower Y2O3 content of PSZ possibly resulted in less molecular
water coverage such that sufficient adsorption of oxygen was able to take place. The
adsorbed oxygen along with resulting hydroxyl species participated in reactions that
produced oxygen ions, which enabled triple-phase-boundary reactions to proceed
more readily at PSZ-based sensors.
As mentioned previously, the microstructure of the sensor electrolyte affects
the number of particles and reaction sites along the triple-phase-boundary where NOx
reactions take place. The SEM images in Figure 5-2 indicate the sensor electrolyte
microstructure differed for each sensor type. To determine the impact of the
electrolyte microstructure on water cross-sensitivity, impedance measurements of
sensors composed of coarse PSZ particles were collected. The impedance data
indicated the electrochemical response for the sensors containing the course PSZ

50
electrolyte particles did not significantly change when humidified gases were present,
as shown if Figure 5-3d. Since similar behavior was observed for sensors composed
of smaller PSZ particles, it is unlikely that the microstructure of the electrolyte
influenced the NOx sensor response during humidified gas conditions.
5.5 Equivalent Circuit Analysis
To interpret the electrochemical response of the sensors further, equivalent
circuit analysis was carried out. The impedance arcs in Figure 5-3 were simulated
using an equivalent circuit model consisting of resistors, R1 and R2, and constant
phase elements, CPE1 and CPE2. Figure 5-4 shows the equivalent circuit model that
was used to analyze the impedance data for each of the sensors in greater depth. The
components R1 and CPE1 described the resistance and non-ideal capacitance behavior
of the electrolyte. Components R2 and CPE2 corresponded to the interfacial resistance
and non-ideal capacitance behavior at the electrodes. The constants n1 and n2 describe
the deviation from ideal capacitance behavior.
Figure 5-4: Equivalent circuit used to model the impedance data for PSZ, FSZ and
composite PSZ–FSZ based sensors.
The behavior of R2 and CPE2 are useful for gaining insight about electrode
reactions that influence sensing behavior. It was found that the interfacial resistance,
R2, decreased as the operating temperature of the sensor increased. This was expected
as interfacial reactions, such as charge transfer, are able to proceed more readily at
higher temperatures. The relationship between the capacitance, C, and constant phase
element CPE2 is described by the following equation:

51
𝐶 =
[(𝑅2)(𝐶𝑃𝐸2)]1/𝑛
𝑅2𝜋𝑟2
Eq. 5-1
where n = 1 describes the behavior of an ideal capacitor. Studies have reported that
oxygen coverage at the electrode/electrolyte interface is described by the low
frequency arc capacitance [20]. Oxygen accumulation at the electrode/electrolyte
interface can hinder NOx transport to the interface and subsequently limit NOx
sensing reactions. Figure 5-5 shows the capacitance associated with sensors
composed of PSZ, FSZ, and 50 PSZ–50 FSZ for dry and humidified gas conditions.
The capacitance for sensors with a PSZ electrolyte tended to be an order of magnitude
greater than the capacitance of FSZ electrolyte sensors. It is possible that the
difference in grain size between the PSZ and FSZ particles contributed to this
difference in capacitance [47]. The capacitance of the 50 PSZ–50 FSZ composite
electrolyte sensors was about half of the capacitance calculated for the PSZ-based
sensors. Adding 3% water to the gas stream caused a slight increase in the capacitance
for the PSZ-based sensors, whereas a decrease in the capacitance occurred for FSZ
electrolyte sensors and especially the 50 PSZ–50 FSZ-based sensors. Adding
additional water did not cause further changes in the capacitance. The addition of NO
did not significantly alter the capacitance, which suggests NO molecules did not
significantly impact oxygen coverage at the interface.
The data in Figure 5-5 also indicated a strong temperature dependence for
capacitance of the FSZ-based sensors, whereas the PSZ and 50 PSZ–50 FSZ-based
sensors displayed a less significant decrease in capacitance as the sensor-operating
temperature increased. Overall, it appears the FSZ content in the composite
electrolytes was beneficial in limiting oxygen coverage at the interface such that water
and NO molecules had greater opportunity to participate in triple-phase-boundary

52
reactions. The PSZ component of the composite electrolyte helped to limit
temperature dependence.
Figure 5-5: The capacitance of (a) PSZ, (b) FSZ and (c) 50 PSZ–50 FSZ based
sensors with for dry and humidified gas conditions with respect to temperature.
5.6 Sensor Sensitivity
The angular phase component of the impedance, θ, is often more responsive
to the changes in NOx concentration in comparison to other impedance parameters
[19, 48]. For this reason, it is frequently used to evaluate NOx sensor sensitivity
according to Eq. 2-2

53
Figure 5-6: NO sensitivity for sensors with: (a) PSZ, (b) FSZ, and (c) 50 PSZ–50
FSZ electrolyte under dry and humidified gas conditions at 650○C.
The change in the angular phase, Δθ, is given by Eq. 4-5. Figure 5-6 shows
Δθ with respect to NO and water concentration for the PSZ, FSZ, and 50 PSZ–50 FSZ
composite-based sensors at an operating frequency of 40 Hz at 650oC. Data was
collected at 40 Hz as the maximum sensitivity was achieved at this operating
frequency. The slope of the data Δθ/Δ[NO] is defined as the sensor sensitivity in
units of degrees/ppm NO. The highest sensitivity was achieved during dry gas
conditions for the various sensors. As the water concentration was increased in the gas
stream, the sensitivity of the sensors decreased. However, the 50 PSZ–50 FSZ
composite based sensors demonstrated the greatest tolerance to changes in the gas
humidity as the sensitivity decreased very slightly.

54
The sensors with an FSZ electrolyte had a higher sensitivity than sensors
composed of PSZ, but the sensitivity of the FSZ based sensors decreased most
significantly with increasing water in the gas stream. Although the FSZ electrolyte
sensors provide higher sensitivity, the 50 PSZ–50 FSZ electrolyte contributes to a
more reliable sensor.
Figure 5-7.Change in angular phase response with respect to temperature for sensors
composed of: (a) PSZ, (b) FSZ, and (c) 50 PSZ–50 FSZ electrolyte.
In application, the temperature of the sensor can fluctuate due to changes in
driving conditions. Thus, a stable NOx sensing response with respect to temperature is
necessary in order to maintain accuracy. In the present study, the temperature
dependence of the various sensors was observed by comparing Δθ with respect to the
sensor-operating temperature as shown in Figure 5-7.
The sensing response of the FSZ-based sensors decreased with increasing
operating temperature as shown in Figure 5-7b. However, the PSZ and especially the

55
50 PSZ–50 FSZ based sensors were less dependent on temperature as shown in
Figure 5-7a and Figure 5-7c. This data corresponded with the capacitance data
presented in Figure 5-5 where the capacitance of the sensors with an FSZ electrolyte
also had a strong temperature dependence in comparison to sensors with a PSZ and
PSZ–FSZ electrolyte. Based on the data shown in Figure 5-6 and Figure 5-7, sensors
with the 50 PSZ–50 FSZ electrolyte were less prone to water cross-sensitivity and
more tolerant to changes in the operating temperature.
5.7 Rate Limiting Mechanisms and Activation Energies
The gases traveling through the porous electrolyte and reacting at the triple-
phase-boundary undergo various reaction steps including adsorption, dissociation,
diffusion, charge transfer, and oxygen ion transport (not necessarily in that order).
The porous microstructure creates specific pathways for gas and ionic transport. The
electrolyte material and microstructure can impact how readily gas transport and
related reactions occur. A common approach to interpreting rate-limiting mechanisms
that impact gas transport and associated reactions is to evaluate the oxygen partial
pressure (PO2) dependence, which is described by the power law relationship as given
in Eq. 4-6.
The power law exponent, m, is used to interpret specific rate-limiting
mechanisms, and RLFA is the low frequency arc previously discussed. The PO2
dependence of the PSZ, FSZ, and 50 PSZ–50 FSZ based sensors was determined by
measuring the impedance response at oxygen concentrations ranging from 1 to 18%
for dry and humidified gas conditions with and without NO. A plot of log (RLFA)
versus log (PO2) was generated for the various gas conditions in order to determine the
exponent m. Table 5-2 provides the m values determined for the sensors with a PSZ,
FSZ, and 50 PSZ–50 FSZ electrolyte. Dissociative adsorption is the rate-limiting

56
mechanism commonly associated with at PO2 dependence where m = 0.5 [40, 49]. The
data in the table indicated under dry gas conditions m ≈ - 0.5 for the PSZ-based
sensors, which suggested dissociative adsorption was rate-limiting. Adding water to
the gas stream without NO present decreased m to - 0.43 suggesting an additional
rate-limiting mechanism, possibly charge transfer, became involved.
Table 5-2: Power law exponent for sensors composed of the various electrolytes.
Power Law Exponent, m
NO
(ppm) PSZ
50 PSZ –
50 FSZ FSZ
Dry
Gas
0 -0.494 -0.620 -0.412
100 -0.465 -0.591 -0.413
Humidified
Gas
0 -0.427 -0.626 -0.471
100 -0.512 -0.553 -0.472
The charge transfer becomes a dominant rate-limiting step when
(PO2)-0.25 ∝ RLFA Eq. 5-2
In the presence of NO and water, the PSZ-based sensors were apparently
limited by dissociative adsorption as a (PO2)-0.51 dependence was observed. A slightly
lower PO2 dependence was determined for the FSZ-based sensors. However, in the
presence of both water and NO, the dissociative adsorption seemed to be the dominant
rate-limiting mechanism for FSZ-based sensors. Sensors with the composite 50 PSZ–
50 FSZ electrolyte had a stronger PO2 dependence in comparison to the other sensors
evaluated. The exponent m tended to be about -0.6, which suggested gas diffusion,
may have participated as an additional rate-limiting mechanism.

57
A (PO2)-1 dependence has been associated with gas diffusion limitations. The
porosity of the 50 PSZ–50 FSZ sensor was about 47%, which is expected to provide
sufficient gas diffusion. However, it is possible that the composite microstructure
resulted in tortuous pathways that interfered with gas diffusion. As a result, the
dissociative adsorption and gas diffusion could serve as rate-limiting mechanisms for
sensors with a composite electrolyte. The activation energy associated with the
various sensors also aids interpretation of how readily sensor reactions are able to
proceed. The activation energy, Ea, of the sensors for operating temperatures ranging
from 600 to 700○C was determined using the Arrhenius equation given below:
ln (
1
𝑅𝐿𝐹𝐴) = (
−𝐸𝑎
𝑅) (
1
𝑇) + ln(𝐴𝑜)
Eq. 5-3
where RLFA is the diameter of the low frequency impedance arc, R represents the
ideal gas constant, T is temperature, and Ao is the y-intercept.
Table 5-3 shows the activation energy calculated for each sensor type for dry
and humidified conditions with and without NO present. The activation energy was
the lowest for the single-phase PSZ-based sensors. The addition of water resulted in
an increase in activation energy for the PSZ-based sensors and a decrease in the
composite and FSZ-based sensors. Adding FSZ to the sensor electrolyte caused the
activation energy to increase. This trend was observed for each of the various gas
compositions measured and likely relates to the electrolyte microstructure. Other
studies have reported that the activation energy in porous electrolyte NOx sensors
tends to increase with increasing electrolyte porosity [34]. Table 5-1 shows the
porosity of the electrolytes increased as the FSZ content in the sensor electrolyte
increased. The increase in porosity causes particle contact along the
electrode/electrolyte interface to decrease resulting in fewer sites for reactions to take
place, thereby resulting in an increase in the activation energy.

58
Table 5-3: Activation energy values for the various sensors.
Activation Energy (eV)
NO
(PPM) PSZ
75 PSZ –
25 FSZ
50 PSZ –
50 FSZ
25 PSZ –
75 FSZ FSZ
Dry Gas
0 1.067 1.119 1.148 1.150 1.230
100 1.017 1.101 1.122 1.125 1.205
Humidified
Gas
0 1.084 1.110 1.122 1.133 1.135
100 1.035 1.043 1.099 1.081 1.082
5.8 Sensor Response Time and Stability
Time-based measurements for the angular phase response, θ, were collected for
sensors with a PSZ, FSZ, and composite PSZ–FSZ electrolyte. Figure 5-8 shows the
typical time-based response for sensors with a 50 PSZ–50 FSZ electrolyte as the NO
composition was varied over 0–100 ppm. The dry and humidified data overlap as the
50 PSZ–50 FSZ electrolyte enables the sensor to be less prone to water cross-
sensitivity. A baseline shift was observed for the time-based data collected for sensors
composed the other electrolytes studied. The response time for each sensor was
evaluated based on the τ90 response, which is the time required for the sensor to achieve
90% of the steady-state response after a step change in gas concentration.
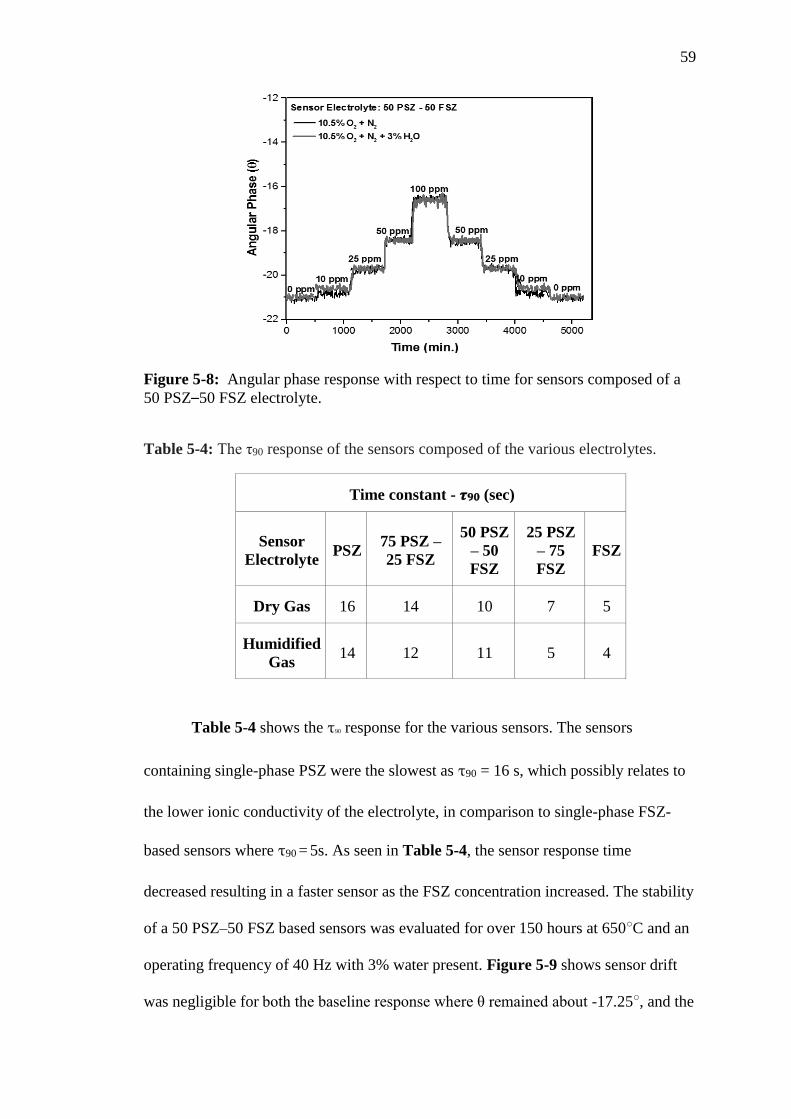
59
Figure 5-8: Angular phase response with respect to time for sensors composed of a
50 PSZ–50 FSZ electrolyte.
Table 5-4: The τ90 response of the sensors composed of the various electrolytes.
Time constant - 𝝉𝟗𝟎 (sec)
Sensor
Electrolyte PSZ
75 PSZ –
25 FSZ
50 PSZ
– 50
FSZ
25 PSZ
– 75
FSZ
FSZ
Dry Gas 16 14 10 7 5
Humidified
Gas 14 12 11 5 4
Table 5-4 shows the τ90 response for the various sensors. The sensors
containing single-phase PSZ were the slowest as τ90 = 16 s, which possibly relates to
the lower ionic conductivity of the electrolyte, in comparison to single-phase FSZ-
based sensors where τ90 = 5s. As seen in Table 5-4, the sensor response time
decreased resulting in a faster sensor as the FSZ concentration increased. The stability
of a 50 PSZ–50 FSZ based sensors was evaluated for over 150 hours at 650○C and an
operating frequency of 40 Hz with 3% water present. Figure 5-9 shows sensor drift
was negligible for both the baseline response where θ remained about -17.25○, and the

60
sensor response with humidified gas where θ remained nearly constant at about
-16.25○. This data suggests that the 50 PSZ–50 FSZ electrolyte is capable of
providing a very stable sensing response. Further evaluation is necessary to determine
the extent of the 50 PSZ–50 FSZ based sensor stability over longer time intervals.
Figure 5-9: Stability of a 50 PSZ–50 FSZ sensor over several hours of operation.
5.9 Conclusions
Impedance spectroscopy was used to interpret the electrochemical response of
NOx sensors composed of PSZ, FSZ, and PSZ–FSZ composite electrolytes during
operation under dry and humidified gas conditions. Analysis of the electrochemical
response of the 50 PSZ–50 FSZ based sensors indicated PSZ contributed to lower
water cross-sensitivity, while FSZ promoted NOx sensitivity. It was also determined
that the electrolyte microstructure influenced sensor sensitivity, but did not impact
water cross-sensitivity. Dissociative adsorption was considered to be the dominant
rate-limiting mechanism for each of the sensors. Adding water to the gas stream did
not appear to significantly alter the rate-limiting mechanism. The response of the
FSZ-based sensors was strongly depended upon the operating temperature, whereas
the response of sensors containing PSZ, and particularly the 50 PSZ–50 FSZ, was less

61
dependent on temperature. The response time of the sensors decreased as the
concentration of FSZ increased within the sensor electrolyte indicating the FSZ
contributed to a rapid sensor response rate. Overall, sensors composed of the 50 PSZ–
50 FSZ composite electrolyte demonstrated significant sensitivity to NO and low
cross-sensitivity to water with negligible temperature dependence.

62
ENHANCED COMPOSITE ELECTROLYTES
6.1 Introduction
Based on the results of the studies discussed in Chapters 4 and 5 on PSZ-2%
Al2O3 and PSZ-FSZ electrolytes, a composite electrolyte composed of PSZ-FSZ-
2%Al2O3 was fabricated in order to capture the beneficial properties of both types of
electrolytes. As demonstrated previously, the PSZ aided the mechanical strength of
the sensor, while the Al2O3 increased NOx sensitivity and further increased
mechanical durability [48]; and the addition of FSZ was expected to minimize water
cross-sensitivity [49]. This work is novel as there are limited studies on the role of
composite porous electrolytes for NOx sensing. The work presented in the following
section evaluates the sensing characteristics of sensors supported by PSZ-FSZ-2%
Al2O3 electrolytes. In addition to the impedance behavior and sinsitivity to NOx, the
cross-sensitivity to H2O,O2, CO,CO2,and CH4 are presented.The experiments in this
study along with the fabrication methods were carried out on the standard testing
stand which is the same as the previous chapters.
6.2 Sensor Diagram
A schematic presentation of the top view and cross section of the sensor is
given in Figure 6-1. Both top and cross-sectional views illustrate the spacing and
placement of gold electrodes along with the dimensions of electrolyte pellet.

63
Figure 6-1: Schematic presentation (top and cross-sectional) of a sensor.
6.3 Microstructure and Morphology
Typical surface images of the sensors were collected using SEM are shown in
Figure 6-2. The micrograph was taken using secondary electrons at an accelerating
voltage of 1.0 kV. The electrolyte consisted of well-dispersed particles with varying
dimensions. The fine FSZ particles were about 0.04 µm in diameter, whereas the PSZ
and Al2O3 particles were coarse with irregular shapes ranging from 0.4 – 1 µm.
Identification of the various particles was based on microstructural analysis of sensors
composed single phase FSZ and PSZ porous electrolytes, and X-ray diffraction analysis
reported by the authors in prior studies [44, 50]. The electrolyte porosity was measured
by using Archimedes method and it indicated a value of 45 ± % 0.5. Cross-sectional
images porous microstructure was very similar to the surface images.
The sensing electrodes studied were dense Au attached with Au mesh to enhance
current collections. The Au sensing electrode was a wire that was 0.2 mm in diameter.
As shown in Figure 6.1, the Au wire sensing electrode was embedded within the
sensor electrolyte. Prior studies found sensors fabricated with Au wire electrodes with
a greater diameter caused micro-cracks to form within the electrolyte, thereby

64
compromising the NOx sensing response. Thus, the 0.2 mm diameter Au wire was
used in order to avoid micro-cracks.
Figure 6-2: Micrograph of the fractured PSZ–FSZ–2% Al2O3 electrolyte.
6.4 Electrochemical Response of NOx Sensors
A typical Nyquist plot showing the electrochemical response of PSZ–FSZ–2%
Al2O3 based NOx sensor is shown in Figure 6-3. Impedance spectroscopy
measurements taken for assessing the sensor’s response to the environment consisting
of dry condition with and without NO gas present during operating temperatures
650°C. In case of low frequency arc, a decrease in its magnitude was observed upon
addition of the two species, i.e. the base line which represents when the 10.5% O2 and
N2 is balanced and 100 ppm NO in the dry environment. This signified a fact that the
reactions at electrode and electrolyte interface occur more readily in the presence of
the above-mentioned species. Apparently, NO causes change in the conductance of
FSZ–PSZ–2% Al2O3/Au sensor [22]. The work represented here is focused on the
behavior of the sensors in the presence of NO gases since the sensors, response
operate with NO2 was equivalent to that for NO because of the thermodynamic
conversion at higher temperatures.

65
Figure 6-3: Impedance response of the FSZ–PSZ–2% Al2O3 based sensor.
6.5 NO Sensitivity
Phase angle, defined as the ratio of capacitive and resistive components, is
considered as more responsive to change in concentration of any gas [51]. As shown
in Figure 6-4, the phase angle measurements were carried out for the three different
electrolytes in the presence of 650oC and NO concentration ranging from 0-100 ppm.
The largest Δθ values occurred at 40 Hz for the electrolyte based sensors. PSZ–FSZ–
2% Al2O3 composite electrolyte sensors demonstrate superior sensitivity to NOx in
comparison to PSZ-2% Al2O3 and PSZ-FSZ based sensors. The enhancement of the
sensitivity of the PSZ–FSZ–2% Al2O3 composite electrolyte is likely due to the higher
ionic conductivity of the FSZ electrolyte, in comparision to PSZ, along with the
contribution of the Al2O3 particles to enhance conductivity along PSZ grain
boundaries that enabled electrochemical reactions involving oxygen ions and NO to
proceed more readily.

66
Figure 6-4: NOx sensitivity for FSZ–PSZ–2% Al2O3.
6.6 Cross-sensitivity to H2O, O2, CO, CO2, and CH4
6.6.1 Water Cross-sensitivity
In Figure 6-5, the Nyquist plots for dry and 3% humidified conditions have
been shown for FSZ-PSZ–2% Al2O3 in the presence of 100 ppm NO at 650oC. The
performance significantly changes with the addition of water. This indicated that the
presence of Al2O3 did not impact water reactions, and that water did not interfere with
NOx sensitivity at the PSZ-FSZ-2%Al2O3 based sensors.
Figure 6-5: Impedance response for (a) PSZ-FSZ –2% Al2O3 (b) PSZ-FSZ sensors
with and without 3% H2O.

67
6.6.2 Cross-sensitivity CO, CO2, and CH4
Figure 6-6 demonstrates the sensing behavior according to the phase angle
for PSZ-FSZ-2%Al2O3 based sensors operating with 100 ppm CO, CO2 and CH4 over
time. Although the response appeared to be rapid and stable, the PSZ–FSZ–2%
Al2O3 based sensors showed substantial cross-sensitivity to all three different gases.
This suggests that the composite electrolyte is not selective to NOx, and therefore, it is
not feasible for NOx sensing. However, analysis of the frequency response for NO and
CH4, shown in Figure 6-7, indicates the peak phase response occurred at different
frequencies. This indicates the NO response could be monitored by operating the
sensor at 100 Hz. This data also suggests there is potential for measuring different
gases at different frequencies. For example, based on the different peak phase
responses for NO and CH4, it could be possible to operate the sensor at 100 Hz for
NO detection and at 400 Hz to detect CH4. If further studies that verify different
frequencies can be distinguished for other gases, then it could be possible to operate a
PSZ-FSZ-2%Al2O3 type sensor as a multi-gas sensor. This idea is highly attractive as
the current methods for multi-gas sensors rely on multiple columns or sensing arrays
that add to the bulk and complexity of the device.
Figure 6-6: Selectivity study for PSZ–FSZ–2% Al2O
3 (650oC, 40 Hz) sensors using
air as the base gas.

68
Figure 6-7: Phase response of PSZ–FSZ–2% Al2O3-sensor with 100 ppm NO and
CH4 present.
6.7 Long-term Functionality
Sensors were further tested for its long-term functionality as shown in Figure
6-88 under low noise phase response conditions, i.e. temperature of 650°C and
frequency of 40 Hz. Any change in phase angle shift (θ) or sensor’s sensitivity was
studied for 30 days under 100 ppm NO balanced with 10.5% O2 and N2. It was found
that only the presence of NO caused a shift in θ output as compared to the baseline
gas. Throughout the testing period, the θ output stayed constant showing a stable
sensor response. Such behavior of the sensor is beneficial for its practical applications
[52].

69
Figure 6-8: Phase angle shift response for PSZ–FSZ–2% Al2O
3 sensor over several
days of operation.
6.8 Conclusions
In this research study, PSZ-FSZ-2%Al2O3 composite electrolytes were
investigated in terms of NO sensitivity, cross-sensitivity to H2O, O2, CO,CO2, and CH4
and long-term stability. The sensitivity of the composite PSZ-FSZ-2%Al2O3 sensors
showed superior NO sensitivity as well as lower water cross-sensitivity compared with
the previous study in Chapters 4 and 5, respectively. Cross-sensitivity to CO, CO2, and
CH4 was observed; however, it is possible that this can be addressed by operating the
sensor at different frequencies in order to distinguish the response to different gases.
Such operation would enable multi-gas sensing. The time-based data collected over 30
days indicated the PSZ-FSZ-2%Al2O3 based sensors were very stable.

70
CONCLUSIONS AND FUTURE WORK
Some of the important conclusions that can be drawn from this research study
are listed as follows:
• The addition of Al2O3 to PSZ in various concentrations (2, 3.8, 5 and 10 wt.%)
resulted in an increase in the NO sensor impedance. The addition of 2 wt% Al2O3
enhanced the PSZ electrolyte grain boundary conductivity. However, increasing
the Al2O3 addition above 2 wt.% in the PSZ electrolyte increased the resistance
of the electrolyte bulk, grain boundaries and interfacial reactions. Overall, the
addition of 2 wt.% Al2O3 to PSZ based sensors resulted in greater sensitivity to
NOx, and sensitivity was achieved at concentrations as low as 5 ppm.
• Composite electrolytes were also studied by using impedance spectroscopy for the
electrochemical response, gas sensitivity, rate limiting mechanisms, and sensing
response rate in humidified gas environments. The tested NOx sensors were
composed of PSZ, FSZ, and PSZ-FSZ composite electrolytes which were operated
under dry and humidified gas conditions. The response of 50 PSZ-50 FSZ based
sensors indicated PSZ contributed to lower water cross-sensitivity, while FSZ
promoted NOx sensitivity. It was also found that the electrolyte microstructure
influenced the sensor’s sensitivity, but did not impact water cross-sensitivity. The
FSZ-based sensors exhibited a rapid sensor response rate which was strongly
dependent upon the operating temperature, whereas the response of sensors

71
containing PSZ, and particularly the 50 PSZ-50 FSZ, was less dependent on
temperature.

72
BIBLIOGRAPHY
[1] R. P. Ltd. (2017). What diesel vehicle owners need to know. Available:
https://www.rix.co.uk/errors/404.aspx?aspxerrorpath=/blog/2016/7/adblue-
what-diesel-vehicle-owners-need-to-know/
[2] J. Meulenbelt, "Nitrogen and Nitrogen Oxides," Medicine, vol. 31, no. 10, p.
64, 2003.
[3] V. Vestreng, L. Ntziachristos, A. Semb, S. Reis, I. S. Isaksen, and L. Tarrasón,
"Evolution of NO x emissions in Europe with focus on road transport control
measures," Atmospheric Chemistry and Physics, vol. 9, no. 4, pp. 1503-1520,
2009.
[4] G. L. Borman and K. W. Ragland, Combustion engineering. McGraw-Hill
Science/Engineering/Math, 1998.
[5] DieselNet. (2017, 12th September). DieselNet Technology Guide. Available:
https://www.dieselnet.com/standards/cn/hd.php
[6] E. M. Logothetis and R. E. Soltis, "Method for determining relative amount of
oxygen containing gas in a gas mixture," ed: Google Patents, 1992.
[7] J. W. Fergus, "Materials for high temperature electrochemical NO x gas
sensors," Sensors and Actuators B: Chemical, vol. 121, no. 2, pp. 652-663,
2007.
[8] N. Kato, H. Kurachi, and Y. Hamada, "Thick film ZrO2 NOx sensor for the
measurement of low NOx concentration," SAE Technical Paper0148-7191,
1998.
[9] "Bringing the world's first high-precision NOx sensor to market," ed: NGK
Insulators, Ltd., 2008.
[10] T. Ono, M. Hasei, A. Kunimoto, T. Yamamoto, and A. Noda, "Performance of
the NO x sensor based on mixed potential for automobiles in exhaust gases,"
JSAE review, vol. 22, no. 1, pp. 49-55, 2001.
[11] N. Miura, G. Lu, and N. Yamazoe, "High-temperature
potentiometric/amperometric NO x sensors combining stabilized zirconia with
mixed-metal oxide electrode," Sensors and Actuators B: Chemical, vol. 52,
no. 1, pp. 169-178, 1998.

73
[12] T. Striker, V. Ramaswamy, E. N. Armstrong, P. D. Willson, E. D. Wachsman,
and J. A. Ruud, "Effect of nanocomposite Au–YSZ electrodes on
potentiometric sensor response to NO x and CO," Sensors and Actuators B:
Chemical, vol. 181, pp. 312-318, 2013.
[13] H. L. Tuller, "Materials for high temperature electrochemical applications:
automotive sensors, catalysts and traps," Sensors and Actuators B: Chemical,
vol. 187, pp. 106-110, 2013.
[14] S. Zhuiykov, Electrochemistry of zirconia gas sensors. CRC Press, 2007.
[15] J. M. Rheaume, Solid State Electrochemical Sensors for Nitrogen Oxide
(NOx) Detection in Lean Exhaust Gases. University of California, Berkeley,
2010.
[16] DieselNet. (2017, 9th May). Cars and Light-Duty Trucks—Tier 3. Available:
https://www.dieselnet.com/standards/us/ld_t3.php#ftp
[17] R. Cottis and S. Turgoose, "Electrochemical impedance and noise," 1999.
[18] R. Barfod, A. Hagen, S. Ramousse, P. Hendriksen, and M. Mogensen, "Break
down of losses in thin electrolyte SOFCs," Fuel Cells, vol. 6, no. 2, pp. 141-
145, 2006.
[19] L. P. Martin, L. Y. Woo, and R. S. Glass, "Impedancemetric NO x Sensing
Using YSZ Electrolyte and YSZ∕ Cr2O3 Composite Electrodes," Journal of
The Electrochemical Society, vol. 154, no. 3, pp. J97-J104, 2007.
[20] L. Y. Woo et al., "Effect of electrode composition and microstructure on
impedancemetric nitric oxide sensors based on YSZ electrolyte," Journal of
the Electrochemical Society, vol. 155, no. 1, pp. J32-J40, 2008.
[21] L. Y. Woo, R. S. Glass, R. F. Novak, and J. H. Visser, "Effect of electrode
material and design on sensitivity and selectivity for high temperature
impedancemetric NO x sensors," Journal of The Electrochemical Society, vol.
157, no. 3, pp. J81-J87, 2010.
[22] J. M. Rheaume and A. P. Pisano, "A review of recent progress in sensing of
gas concentration by impedance change," Ionics, vol. 17, no. 2, pp. 99-108,
2011.
[23] S. Killa, L. Cui, E. P. Murray, and D. S. Mainardi, "Kinetics of nitric oxide
and oxygen gases on porous Y-stabilized ZrO2-based sensors," Molecules,
vol. 18, no. 8, pp. 9901-9918, 2013.
[24] R. Mukundan, K. Teranishi, E. L. Brosha, and F. H. Garzon, "Nitrogen oxide
sensors based on yttria-stabilized zirconia electrolyte and oxide electrodes,"
Electrochemical and solid-state letters, vol. 10, no. 2, pp. J26-J29, 2007.
[25] F. H. Garzon, R. Mukundan, R. Lujan, and E. Brosha, "Solid state ionic
devices for combustion gas sensing," Solid State Ionics, vol. 175, no. 1, pp.
487-490, 2004.

74
[26] M. Borik et al., "Phase composition, structure and mechanical properties of
PSZ (partially stabilized zirconia) crystals as a function of stabilizing impurity
content," Journal of Alloys and Compounds, vol. 586, pp. S231-S235, 2014.
[27] S. Celik, B. Timurkutluk, S. Toros, and C. Timurkutluk, "Mechanical and
electrochemical behavior of novel electrolytes based on partially stabilized
zirconia for solid oxide fuel cells," Ceramics International, vol. 41, no. 7, pp.
8785-8790, 2015.
[28] E. Drożdż, M. Jelonek, J. Wyrwa, and M. Rękas, "The Influence Of The Way
Of Alumina Addition On Properties Improvement Of 3YSZ Material,"
Archives of Metallurgy and Materials, vol. 60, no. 2, pp. 999-1002, 2015.
[29] C. Zhang et al., "Ionic conductivity and its temperature dependence of
atmospheric plasma-sprayed yttria stabilized zirconia electrolyte," Materials
Science and Engineering: B, vol. 137, no. 1, pp. 24-30, 2007.
[30] A. Feighery and J. Irvine, "Effect of alumina additions upon electrical
properties of 8 mol.% yttria-stabilised zirconia," Solid State Ionics, vol. 121,
no. 1, pp. 209-216, 1999.
[31] J. P. Angle, J. J. Steppan, P. M. Thompson, and M. L. Mecartney, "Parameters
influencing thermal shock resistance and ionic conductivity of 8 mol% yttria-
stabilized zirconia (8YSZ) with dispersed second phases of alumina or
mullite," Journal of the European Ceramic Society, vol. 34, no. 16, pp. 4327-
4336, 2014.
[32] M. Abden, M. Islam, and J. Afroze, "Microstructure and Mechanical
Properties of 3YSZ Ceramics Rainforced with Al 2 O 3 Particles,"
International Journal of Materials Engineering, vol. 4, no. 4, pp. 129-135,
2014.
[33] S. J. Glass and D. J. Green, "Mechanical Properties of Infiltrated Alumina‐Y‐
TZP Composites," Journal of the American Ceramic Society, vol. 79, no. 9,
pp. 2227-2236, 1996.
[34] L. Cui, F. Han, W. Dai, and E. P. Murray, "Influence of microstructure on the
sensing behavior of NOx exhaust gas sensors," Journal of The
Electrochemical Society, vol. 161, no. 3, pp. B34-B38, 2014.
[35] M. Bengisu, Engineering ceramics. Springer Science & Business Media,
2013.
[36] J. Macdonald and W. Johnson, "Impedance Spectroscopy: Theory,
Experiments, and Applications, edited by E. Barouskov and JR Macdonald,"
ed: Wiley-VCH, New York, 2005.
[37] M. Steil, F. Thevenot, and M. Kleitz, "Densification of Yttria‐Stabilized
Zirconia Impedance Spectroscopy Analysis," Journal of the Electrochemical
Society, vol. 144, no. 1, pp. 390-398, 1997.
75
[38] S. P. S. Badwal, "Effect of dopant concentration on the grain boundary and
volume resistivity of yttria-zirconia," Journal of materials science letters, vol.
6, no. 12, pp. 1419-1421, 1987.
[39] J. v. Herle, A. McEvoy, and K. R. Thampi, "Conductivity measurements of
various yttria-stabilized zirconia samples," Journal of materials science, vol.
29, no. 14, pp. 3691-3701, 1994.
[40] S. Raz, K. Sasaki, J. Maier, and I. Riess, "Characterization of adsorbed water
layers on Y 2 O 3-doped ZrO 2," Solid State Ionics, vol. 143, no. 2, pp. 181-
204, 2001.
[41] L. Woo, R. Glass, R. Novak, and J. Visser, "Diesel engine dynamometer
testing of impedancemetric NO x sensors," Sensors and Actuators B:
Chemical, vol. 157, no. 1, pp. 115-121, 2011.
[42] R. Soltis, Y. Ding, D. J. Kubinski, and J. H. Visser, "Influence of H2O on
NOx Sensors," ECS Transactions, vol. 3, no. 10, pp. 173-178, 2006.
[43] N. Sakai et al., "Erratum to “Effect of water on electrochemical oxygen
reduction at the interface between fluorite-type oxide-ion conductors and
various types of electrodes”," Solid State Ionics, vol. 176, no. 29, pp. 2327-
2333, 2005.
[44] K. Kharashi and E. P. Murray, "Effect of Al2O3 in Porous Zirconia
Electrolytes for NO Sensing," Journal of The Electrochemical Society, vol.
163, no. 13, pp. B633-B637, 2016.
[45] Y. Kuroda, H. Hamano, T. Mori, Y. Yoshikawa, and M. Nagao, "Specific
adsorption behavior of water on a Y2O3 surface," Langmuir, vol. 16, no. 17,
pp. 6937-6947, 2000.
[46] D. T. Chaopradith, D. O. Scanlon, and C. R. A. Catlow, "Adsorption of water
on yttria-stabilized zirconia," The Journal of Physical Chemistry C, vol. 119,
no. 39, pp. 22526-22533, 2015.
[47] X. Guo and J. Maier, "Grain boundary blocking effect in zirconia: a Schottky
barrier analysis," Journal of the Electrochemical Society, vol. 148, no. 3, pp.
E121-E126, 2001.
[48] K. Indira and T. Nishimura, "In-Situ Electrochemical Monitoring and Ex-Situ
Chemical Analysis of Epoxy Coated Steels in Sodium Chloride Environment
Using Various Spectroscopic Techniques," Transactions of the Indian Institute
of Metals, pp. 1-14, 2017.
[49] A. McEvoy and K. R. Thampi, "Oxygen reduction at porous and dense
cathodes for solid oxide fuel cells," Electrochimica acta, vol. 39, no. 11-12,
pp. 1675-1680, 1994.
[50] E. P. Murray, K. Kharashi, and K. Adedeji, "Managing H2O Cross‐Sensitivity
Using Composite Electrolyte NOx Sensors," in Electrochemical Sensors
Technology: InTech, 2017.

76
[51] L. Y. Woo, R. Glass, R. Novak, and J. Visser, "Impedancemetric NOx Sensing
Based On Porous Yttria-Stabilized Zirconia (YSZ) Electrolyte: Effect of
Electrode Materials on Total-NOx Sensing and Stability," in Meeting
Abstracts, 2009, no. 45, pp. 1503-1503: The Electrochemical Society.
[52] V. Franco, F. P. Sánchez, J. German, and P. Mock, "Real-world exhaust
emissions from modern diesel cars," communications, vol. 49, no. 30, pp.
847129-102, 2014.