FUNDAMENTAL FACTORS OF COMPREHENSION...
13
PSYCHOMETRIKA-- VOL, 9, NO. 3 SEPTgMBER, 1944 FUNDAMENTAL FACTORS OF COMPREHENSION IN READING FREDERICK B. DAVIS O00PERATIYE TEST SHRVICE OF THE tkME~ICAN COUNCIL ON EDUCATION* A survey of the literature was made to determine the skills in- volved in reading comprehension that are deemed most important by authorities. Multiple-c~hoice test items were constructed to measure each of nine skills thus identified as basic. ~'ae intercorrelations of the nine skill scores were factored, each skill being weighted in the initial matrix roughly in proportion to its importav.ce in reading comprehension, as judged by authorities. The principal components were rather readily interpretable in terms of the initialvariables. In- dividual scores in components I and II are sufficiently reliable to war- rant their use for practical purposes, and useful measures of other components could be provided by constructing the required number of additional items. The results also indicate need for workbooks to aid in improving students' use of basic reading skills. The study provides more detailed information regarding the skills measured by the Coopv~fative Reading Comprehension Tests than has heretofore been provided regarding the skills actually measured by any other widely used reading test. Statistical techniques for estimating the reliability coefficients of individual scores in principal-axes compo- nents, for determining whether component variances are greater than would be yielded by chance, and for calculating the significance of the differences between successive component variances are illus- trated. The application of techniques of factorial analysis to the inves- tigation of reading has been attempted several times. Feder (11), Gans (12), and Langsam (23) have published studies that employed Thurstone's centroid method, and unpublished studies have been made by Bedell and Pankaskie. So far as the writer is aware, the study re- ported here is the first to make use of tests especially constructed to measure the mental skills in reading comprehension that are consid- ered of greatest importance by authorities in the field.** The most important step in a study that employs factorial pro- cedures for the investigation of reading comprehension is the selec- tion of the tests the scores of which are to be factored. Unless these tests provide reasonably valid measures of the most important mental skills that have to be performed during the process of reading, the application of the most rigorous statistical procedures can not yield meaningful and significant results. The importance of this point can hardly be overstated. * On leave for military service. ** For a detailed presentation of the basic data of this study, see (8). 185
Transcript of FUNDAMENTAL FACTORS OF COMPREHENSION...

PSYCHOMETRIKA-- VOL, 9, NO. 3 SEPTgMBER, 1944
FUNDAMENTAL FACTORS OF COMPREHENSION IN READING
FREDERICK B. DAVIS O00PERATIYE TEST SHRVICE OF THE tkME~ICAN COUNCIL ON EDUCATION*
A survey of the literature was made to determine the skills in- volved in reading comprehension that are deemed most important by authorities. Multiple-c~hoice test items were constructed to measure each of nine skills thus identified as basic. ~'ae intercorrelations of the nine skill scores were factored, each skill being weighted in the initial matrix roughly in proportion to its importav.ce in reading comprehension, as judged by authorities. The principal components were rather readily interpretable in terms of the initial variables. In- dividual scores in components I and II are sufficiently reliable to war- rant their use for practical purposes, and useful measures of other components could be provided by constructing the required number of additional items. The results also indicate need for workbooks to aid in improving students' use of basic reading skills. The study provides more detailed information regarding the skills measured by the Coopv~fative Reading Comprehension Tests than has heretofore been provided regarding the skills actually measured by any other widely used reading test. Statistical techniques for est imating the reliability coefficients of individual scores in principal-axes compo- nents, for determining whether component variances are greater than would be yielded by chance, and for calculating the significance of the differences between successive component variances are illus- trated.
The application of techniques of factorial analysis to the inves- tigation of reading has been attempted several times. Feder (11), Gans (12), and Langsam (23) have published studies that employed Thurstone's centroid method, and unpublished studies have been made by Bedell and Pankaskie. So fa r as the writer is aware, the study re- ported here is the first to make use of tests especially constructed to measure the mental skills in reading comprehension that are consid- ered of greatest importance by authorities in the field.**
The most important step in a study that employs factorial pro- cedures for the investigation of reading comprehension is the selec- tion of the tests the scores of which are to be factored. Unless these tests provide reasonably valid measures of the most important mental skills that have to be performed during the process of reading, the application of the most rigorous statistical procedures can not yield meaningful and significant results. The importance of this point can hardly be overstated.
* On leave for mili tary service. ** For a detailed presentation of the basic data of this study, see (8).
185

186 PSYCHOMETRIKA
As the first step in the present study, a careful survey was made of the l i terature to identify the comprehension skills tha t are deemed most important by authori t ies ~in the field of reading. A list of several hundred specific skills was compiled, many of them overlapping. This list of skills was studied intensively by the wr i t e r in order to group together those that seemed to require the exercise of the same, or closely related, mental skills. The objective was to obtain several groups of skills, each one of which would consti tute a cluster having relatively high intercorrelat ions and relatively low correlations wi th other clusters of skills.
Nine groups of skills were sorted out and labeled. For the pur- poses of this study, they are regarded as the nine skills basic to com- prehension in reading. Included within them is the mult i tude of spe- cific skills considered impor t an t by the authori t ies consulted. These nine basic skills are as follows:
1 Knowledge of word meanings 2 Abili ty to select the appropr ia te meaning for a word or phrase
in the light of its p~.rticular contextual se t t ing 3 Abili ty to follow the organization of a passage and to ident i fy
antecedents and references in i t 4 Abili ty to select the main thought of a passage 5 Abili ty to answer questions tha t a re specifically answered in
a passage 6 Ability to answer questions tha t are answered in a passage
but not in the words in which the question is asked 7 Abili ty to d raw inferences f rom a passage about its contents 8 Abili ty to recognize the l i terary devices used in a passage and
to determine its tone and mood 9 Ability to determine a wr i te r ' s purpose, intent, and point of
view, i.e., to d raw inferences about a wr i t e r
To provide a measure of each one of these nine basic skills, a large number of five-choice objective tes t i tems were constructed. All possible care was taken to obtain items that measured only one ra the r than several of the nine skills. However , it was recognized tha t skill 1 {knowledge ef word meanings) is basic to the measurement of all the other skills, since to read a t all one has to recognize words and unders tand their meanings, and tha t some overlapping of skills 2-9 is inevitable.
Since the final forms of the reading-comprehension tests used in this study were to be the published forms of Tests C1 and C2 of Form Q of the Cooperativ~ Reading Comprehension Tests, practical consid- erat ions [notably the requirements of the procedure for obtaining

FREDERICK B. DAVIS 187
three equivalent "scales" in the tests (6)] determined in some meas- ure the number of items testing each basic skill that could be used. An effort was made, however, to include the proportion of items testing each one of skills 2-9 that conformed to the judgments of authorities in the field of reading.
To obtain the intercorrelations of scores in the nine basic reading skills selected for measurement, 240 multiple-choice items were admin- istered to a large number of freshmen in several teachers colleges.* The students were told to mark every item and were allowed an un- limited amount of time. By this means, the influence of speed of read- ing was removed and the effects of mechanical difficulties in word perception were minimized. Of the 541 students tested, 421 actually answered every item, and, when proof was obtained that th~s group constituted a representative sample of the entire 541 students tested, the scores of only these 421 pupils were used in the factorial analysis. In addition to the intercorrelations of the scores, the correlations be- tween sex and scores in each of the nine skills were computed. As would have been expected, the correlations with sex were all insig- nificantly different from zero. This being so, there was no need to partial out the influence of sex before making a factorial analysis.
Table 1 shows the intercorrelations of the scores in the nine basic reading skills, and their relationships with sex.
TABLE 1
Intercorrelations, Means, and Standard Deviations of Raw Scores in the Nine Basic Reading Skills, and Their Relationships with Sex
(N = 421)
Skill 1 2 3 4 5 6 7 8 9 Sex* Mean ¢
1 .72 .41 .28 .52 ,71 .68 .51 ,68 .03 23.77 11.61 2 .34 .36 .53 .71 .68 .52 .68 -.07 12.70 3.Z5 3 .16 .34 ,43 .42 .28 .41 -.01 4.20 1,73 4 .30 ,36 ,35 ,29 .36 -.03 2.97 1,10 5 .64 .55 .45 .55 -.04 1~1~ 2.46 6 .76 .57 ,76 -.01 25.67 5.67 7 .59 .68 .06 28.46 5,81 8 .58 -.05 6,75 1.86 9 -.05 15,19 4.07
* A l~ :s i t ive c o e f f i c i e n t i n t h i s co lumn ind ica t e s t h a t t h e m e n o b t a i n e d a h i g h e r m e a n score t h a n t h e w o m e n .
* Every freshman in all of the teachers colleges of the State o f Connecticut and every freshman in two of the Massachusetts State Teachers Colleges com- prised the sample tested. The test ing was done about a month a f te r the begin- ning of the school year.

188 PSYCHOMETRIKA
T h e i n t e r c o r r e l a t i o n s of the n ine basic skil ls r a n g e f r o m .16 to .76, t he va lues re f lec t ing in p a r t t he i r t r u e r e l a t i onsh ips and in p a r t the d i f fe rences in t h e i r re l iabi l i ty . T h e re l i ab i l i ty coefficients of t h e scores in the n ine skills a r e shown in Tab le 2.
TABLE 2 Reliability Coefficients of Raw Scores in Each of the Nine Basic Reading Skills*
Skill r~i N Number of Items
1 .9t) 100 60 2 .56 I00 20 3 .44 1O0 9 4 .18 421 5 5 .55 100 22 6 .77 100 42 7 .63 100 43 8 .64 100 10 9 .71 10(I 27
* T h e d iv i s ion o f e ~ c h t e s t i n t o two ha lves was accompl ished in t h i s case by a r r a n g i n g t h s its~as in o r d e r o f di f f icu l ty a n d a s s i g n i n g a l t e r n a t e i t ems t o each half . I t wi l l be reca l led t h a t speed had n o i n f l u e n c e o n t h e s e seores . T h e re l iabiKty c o e f f ~ i e n t f o r skit[ 4 i s based on 421 cases ; t h e re l iab i l i ty coeff ic ien ts f o r t h e o t h e r sk i l l s are based on a representati~-e sample o f 100 c ~ e s d r a w n f r o m t h e 421 ava i lab le .
As would be expec ted in v i ew of t he wide ly d i f f e r en t l eng ths o f the tes ts used to m e a s u r e the n ine basic r e a d i n g skills, t h e i r re l iab i l - i ty coefficients d i f f e r cons iderab ly . F o r even the leas t re l iable , how- ever , the re l i ab i l i ty coefficient is subs t an t i a l ly and s iga i f i can t ly g r ea t - e r t h a n zero.
Sub jec t ive j u d g m e n t had fo recas t r e l a t ive ly h igh co r r e l a t i o n s be- t w e e n skill 1 and each o f skil ls 2-9. I n spec t ion of Tab l e 1 in t h e l igh t o f the d a t a in Tab le 2 revea ls this to be so. I t is a p p a r e n t t h a t skill 1 cons t i t u t e s the l a rge s t e l emen t c o m m o n to all o f the o t h e r in i t ia l v a r i - ab les ; hence, i t m a y be o f i n t e r e s t to s t u d y t h e i n t e r c o r r e l a t i o n s of skills 2-9 when skill 1 is held cons tan t . T h ese p a r t i a l coefficients a r e shown in Tab le 3.
TABLE 3 Partial Correlation Coefficients Among Skills 2-9, Skill 1 Being Held Constant
(N --- 421)
Skill 3 4 5 6 7 8 9
2 .09 ,23 .26 .40 .38 .26 .37 3 .05 .16 .22 .22 .09 .20 4 .19 .23 .22 .17 .24 5 .45 .32 .26 .32 6 .53 .33 .53 7 .38 .40
.38

r-~REDERICK B. DAVIS 1 8 9
Perhaps the most surpris ing feature of the data in Table 3 is the small size of the coefficients. After making due allowance for the at- tenuation result ing from the comparatively low reliability coefficients of some of the variables, it is apparent that reading comprehension, as measured by the nine basic reading skills, is not a uniLaxy ability. From the correlations it appears probable tha t a mental ability present to the greatest extent in skills 6, 7, and 9 is second most im- por tant in producing the intercorrelations shown in Table 1. To ex- plore this matter , a factorial analysis was undertaken, using the method described by T. L. Kelley (22).*
The initial matr ix of variances and covariances used in the fac- torial analysis is presented in Table 4.
T A B L E 4
In i t i a l M a t r i x of V a r i a n c e s and Covar iances*
V a r i a b l e x~ x~ x~ x 4 x 5 z 6 z7 x~ x 9
x z 134.70 27.01 8.16 3.65 14.77 46.88 45.78 11.04 32.07 x~ 10.56 1.94 1.29 4.22 13.03 12.90 3.17 8.93 x s 3.01 0.31 1.44 4.24 4.24 0.90 2.91 x 4 1.22 0.82 2.25 2.25 0.59 1.63 x~ 6.05 8.93 7.85 2 ~ q 5.53 z~ 32.17 24.89 5.96 17.42 z 7 33.75 6.33 16.00 x s 3.46 4.42 x~ 16.54
* Variances axe shown in the diagonal cells. The Kelley method would be eqxtalty applicable if the scores in variables 1-9 were t ransformed into s ts~dard n~egsures. I n thi~ ca~e, the v a x ~ i n each diagonal cell would be 1 and the ¢ovarianees would he identical with th• intercorrelat:~ne shown In Table I . The resul t ing mat r ix ~ u l d undoubtedly present a more fami l ia r appearance to mav.v students. Each one of the b a ~ e reading skills would then have been weighted equally fo r purlmses of factorial analysis. However, authorities in the field of reading quite remmnably do n o t judge each one of the basic skills to he of equal importance in the Droce~ of reading comprehen- sion. Of the m a n y possible factorial analyses (it~ing different we4ghts), tha t ~ s i s which nP- Dears to have unique mer i t is a princlpal-axes solution based on a ma t r ix of varia~oes and covaz~ a n e e s in which the initial test v a r i a ~ e s are welghte~ to correspond with their re la t ive irn~vor~ance i n the process of reading, as determined by the pooled judgment of authorities. Tha t is the type of factorial analysis tha t it was intended should be performed in the present ~udy , but p r a ~ i c a l considerations resulted in some modifications in the relat ive weights of the nine initial variables.
For purposes of comparison, the Kelley method was used to per form a factorial analysis of the eorrelation ma t r ix shown in Table 1 (excluding se~) with uni t var iances in the diagonals~ .~ eompzzi~on of the factor loadings derived f rom the ~wo prineipal-a~es analy~e~ a~d f rom a cen- troid analysis of the same data is now in preparutlon.
In Table 5 are presented the coefficients of each of the initial variables ( the nine basic reading skills) that yield the nine indepen- den.t components obtained by factorial analysis. The design shown in Table 5 is one of the most interesting that has been obtained by factorial techniques.
* F o r t h i s s t u d y i t w a s des i r ab le to ob ta in the f a c t o r l oad ings of all s ignifi- c a n t c o m p o n e n t s r a t h e r t h a n t he load ings f o r only the two or t h r e e l a r g e s t com- p o n e n t s ; hence a f a i r l y l a r g e n u m b e r of sub jec t s was t e s t ed a n d Kel ley 's me thod w a s selected as be ing mos t su i t ab l e f o r use.

190 PSYCHOMETRIKA
TABLE 5 Coefficients of Each of the Initial Variables That Yield Scores in the
Nine Independent Components (Factor Loadings of Skills 1-9 in Components I-IX)
Components I II III IV V VI VII VIII IX Variance 192.270 22.824 8.657 5.282 3.828 3.306 2.327 1.956 1.096
Skills Variance 1 .813 -.571 -.064 -.033 -.082 .006 -.016 .001 .011 134.699 2 .184 .124 -.005 -.003 .971 -.019 -.017 -.028 -.076 10.563 3 .057 .054 -.001 .000 -.000 .000 .997 .0¢0 -.004 3.009 4 .027 .048 -.000 .00~ .067 .000 .000 .000 .996 1.220 5 .107 .149 .152 -.003 -.022 .970 -.014 -.024 -.012 6.050 6 .341 .469 .567 -.531 -.129 -.204 -.044 - . ~ I -.023 32.169 7 .336 .580 -.719 .008 -.147 -.020 -.051 -.091 -.028 33.752 8 ~78 .105 -.001 .141 -.000 .000 -.010 .981 -.007 3.456 9 .233 .253 .366 .835 -.080-.126 -.027 -.166 -.013 16.540
The sub jec t ive j u d g m e n t exercised in c o n s t r u c t i n g the tes ts o f the n ine r e a d i n g skills is reflected in the s u r p r i s i n g ex ten t to wh ich severa l o f the tes ts a p p e a r to be mode ra t e ly " p u r e " f a c t o r measures . A word of cau t ion must , however , be injected. Because some o f the skills were j udged to be m o r e i m p o r t a n t t h a n o the r s in the r e a d i n g process and because prac t ica l cons ide ra t ions gove rned to some ex ten t the n u m b e r o f i tems used to m e a s u r e each of the n ine react ing skills, the s t a n d a r d dev ia t ions o f the init ial va r i ab les differed cons iderab ly . And , since the init ial m a t r i x of va r i ances and cova r i ances used f o r the ana lys i s reflected those differences, the coefficients in Table 5 m u s t be i n t e rp re t ed wi th due r e g a r d fo r the m a g n i t u d e s of the s t a n d a r d dev ia t ions of the n ine init ial skills. Scores in skill 1, f o r example , have a la rge s t a n d a r d dev ia t ion in c o m p a r i s o n wi th the s t a n d a r d devi- a t ions of scores in the o the r skills. So a small c o m p o n e n t load ing in skill 1 m a y be found to have m o r e we igh t in a r eg res s ion equa t ion f o r ob t a in ing scores in a n y one of the componen t s t h a n would be expec ted f r o m an inspect ion of Table 5 alone.*
* Readers who are most familiar with the centroid method of factorial analy- sis have sometimes questioned this statement. A principal-axes analysis makes it possible to obtain very readily a given individual's score in any one of the com- ponents for which regression coefficients (or factor loadings) have been deter- mined. For example, individual scores in component ][ may be obtained from the following regression equation:
Cz=.813(X ,) -}-.184(Xz) -~ .057(X~) -F .027 (X~) -~ .107(Xn) -~ .341 (X 6) + .336 (X~) -~ .078 (X s) + .233 (X;~).
In this equation, variables 6 and 7 have nearly identical regression coeffici- ents, but we know that the standard deviation of variable 6 is 5.67 while that of variable 7 is 5.81. Therefore, variable 7 will have a slightly greater weight in determining an individual's score in component I than wilt variable 6 despite the
FREDERICK B. DAVIS 191
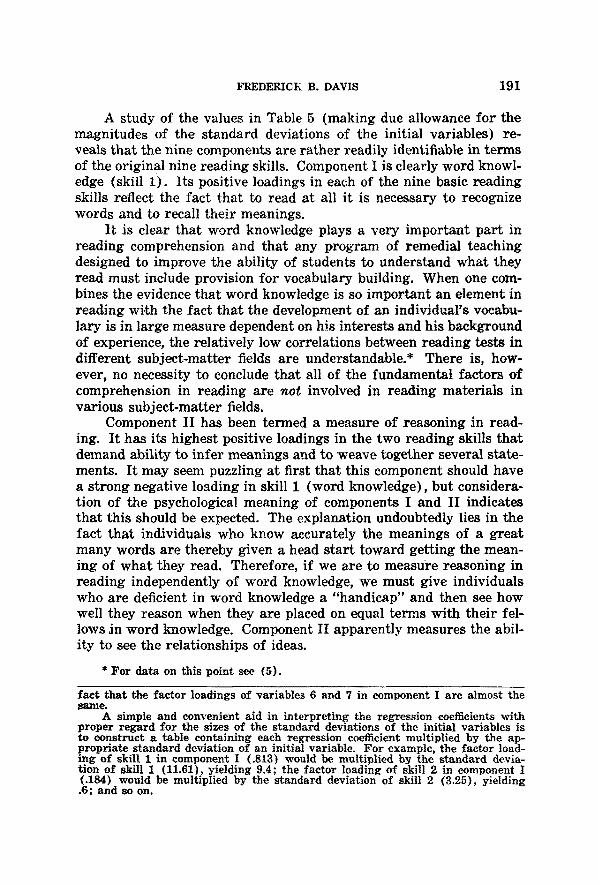
A s tudy of the values in Table 5 (making due allowance for the magni tudes of the s tandard deviations of the initial variables) re- veals tha t the nine components are ra ther readily identifiable in te rms of the original nine reading skills. Component I is clearly word knowl- edge (skill 1). I ts positive loadings in each of the nine basic reading skills reflect the fac t tha t to read at all it is necessary to recognize words and to recall their meanings.
I t is clear tha t word knowledge plays a very impor tan t p a r t in reading comprehension and tha t any program of remedial teaching designed to improve the abili ty of s tudents to unders tand wha t they read mus t include provision for vocabulary building. When one com- bines the evidence tha t word knowledge is so impor tan t an element in reading wi th the fac t t ha t the development of an individual 's vocabu- lary is in large measure dependent on his interests and his background of experience, the relat ively low correlations between reading tests in different sub jec t -mat te r fields are understandable.* There is, how- ever, no necessi ty to conclude tha t all of the fundamenta l fac tors of comprehension in reading are not involved in reacting mater ia ls in various subjec t -mat te r fields.
Component II has been termed a measure of reasoning in read- ing. I t has its highest positive loadings in the two reading skills tha t demand abili ty to infer meanings and to weave together several s tate- ments. I t may seem puzzling a t first tha t this component should have a s t rong negative loading in skill 1 (word knowledge) , bu t considera- tion of the psychological meaning of components I and II indicates tha t this should be expected. The explanation undoubtedly lies in the fac t tha t in~vidua ls who know accurately the meanings of a g rea t many words are thereby given a head s ta r t toward get t ing the mean- ing of wha t they read. Therefore, if we are to measure reasoning in reading independently of word knowledge, we mus t give individuals who are deficient in word knowledge a "handicap" and then see how well they reason when they are placed on equal terms wi th their fel- lows .in word knowledge. Component II apparent ly measures the abil- i ty to see the relat ionships of ideas.
* For data on this point see ( 5 ) .
fact that the factor loadings of variables 6 and 7 in component i are almost the
A simple and convenient aid in interpreting the regression coefficients with proper regard for the sizes of the standard deviations of the initial variables is to construct a table containing each regression coefficient multiplied by the ap- propriate standard deviation of an initial variable. For example, the factor load- nag of skill 1 in component I (.813) would be multiplied by the standard devia- tion of skill 1 (11.61), yielding 9.4; the factor loading of skill 2 in component I (.184) would be multiplied by the standard deviation of skill 2 (3.25), yielding .6; and so on.

192 PSYCHOMETRIKA
Component III is not so readily in terpretable as most of the oth- ers, but it is clear that individuals who obtain high scores in this com- ponent focus their a t tent ion on a wr i ter ' s explicit s ta tements almost to the exclusion of their implications. Component IV measures chiefly the abil i ty to ident i fy a wr i te r ' s intent, purpose, or point of view (skill 9) . Individuals who obtain high scores in this component a re less concerned with what a wr i te r says than with why he says it. Such individuals should presumably be bet ter able to detect bias and propaganda than individuals who obtain low scores in this component. Component V is composed pr~incipally of abil i ty to figure out f rom the context the meaning of an unfamil iar word or to determine which one of severa l known meanings of a word is most appropr ia te in its par- t icular contextual se t t ing (skill 2). It is reasonable tha t it should be essentially unrelated to skill 1, which measures memory for isolated word meanings. The slight negative loadings of skills 6 and 7 in com- ponent V may result f rom the fact tha t the la t ter measures deductive reasoning, while skills 6 and 7 measure inductive processes.
Judg ing by its very high loading in skill 5, component VI seems to be largely a measure of abili ty to grasp the detailed s ta tements in a passage. I t is probably a fa i r ly direct measure of the abil i ty to get wha t I. A. Richards has called " the literal sense meaning" of a pas- sage. Skill 5 was originally intended to measure this abil i ty and the results of the analysis suggest tha t this abil i ty is more than a name; it appears to be a real psychological ent i ty dist inct f rom other men- tal skills involved in reading. Component VII seems to be a measure principally of skill 3 (abil i ty to follow the organization of a passage and to ident ify antecedents and references in i t) . The var iance of this component consists of about 77% of the original variance of skill 3.
Component VII I measures specific knowledge of l i te rary devices and techniques, and probably reflects the influence of t ra in ing in Eng- lish more than the other components do. Component IX is composed largely of abili ty to select the main thought of a passage; it may be considered a measure of abili ty in the synthesis of meaning. The vari- ance of component IX comprises approximately 82% of the original variance of skill 4 (abil i ty to select the main thought of a passage) . Students who make high scores in component IX are presumably those who would be most capable of wr i t ing adequate summaries and precis of wha t they read.
Of the nine components described, all except components II, III, and IV can, for practical purposes, probably be measured sat isfac- torily by means of raw scores in one of the nine basic reading skills

FREDERICK B. DAVIS 193
selected initially. Components V through IX account for only a small fraction of the total variance, but their variances are Significantly different.* A number of the skills considered most important by au- thorit ies in the field of reading include independent elements tha t should be taught separately. I t is not enough to assign learning ex- ercises in reading that consist of passages followed by factual ques- tions to be answered. Such exercises will not necessarily call the stu- dent 's at tention to the separate and essentially unrelated reading skills tha t he ought to master or give him sufficient practice in each one of them.
TABLE 6 Variance Ratios of Successive Components
Component Degrees of Freedom -Variance F
I 406 192.270 l t 8.280
I I 899 22.824 / 2.663
I I I I 403 8.657 | 1.622 IV 399 5.282 /
/ 1.387 V 401 3.828 I
1.158
VI 401 3.306 / | 1.428
VII 403 2.327 / 1 1.181
VII I 400 1.956 ! / 1.944
IX 400 1.006 /'
* The writer is indebted to Professor T. L. Kelley for the development of a precise test of the variance ratios of components obtained by his iteraUve process. This test is described in the article by Professor Kelley that immediately follows.
The differences between the variances of successive components are all sig~ rdficant at the one-per-cent level with the exception of the differences between the variances of components V and VI, and VII and VI I I ; those differences are sig- nificant approximately at the five-per-cent level.
I t should be noted that the variance-ratio test of the significance of the dif- ference between component variances is permitted by the Kelley method but is not permitted by other methods of factorial analysis tha t are frequently employed.
Whether the variance of component IX (the smallest component) is signi- ficantly greater than would be yielded by chance may be determined by noting whethe__r the reliability coefficient of component IX is significantly greater than zero. This is not established by the data. I t is highly likely, however, tha t the variance of the next largest component is significantly greater than would be yielded by chance.

194 PSYCHOMETRIKA
TABLE 7
Re|labili ty Coefficients, Means, and Standard Deviations of the Six Independent Components Having Reliability Coefficients Substantially Greater Than Zero
Component rl~ Mean Standard Deviation
I .94 46.39 13.87 II .48 24.14 4.78
III .28 .81 2.94 IV .17 - .62 2.30
VII .33 .27 1.53 VIII .29 .70 1.40
Because individual scores in each of the independent components defined above can readily be estimated by using appropriate regres- sion equations (Cf. ante, footnote following Table 5), the reliability coefficients of scores in the nine components have been determined empirically, using the same sample of 100 cases for which odd and even scores in each variable were obtained in computing the reliabil- ity coefficients of the nine initial variables.
Inspection of Table 7 reveals that only components 1 and II are measured with sufficient reliability to warrant their use for practical purposes. However, when the significance of the reliability coefficient of each one of the nine components is tested,* it becomes evident that useful measures of at least three additional components could cer- tainly be provided by constructing the required number of additional items of the appropriate types. Since several of the components may be satisfactorily measured, for practical purposes, by raw scores in appropriate types of test items, construction of a large number of the indicated types of items has already been started. It is believed that these may be useful for instructional as well as for measurement pur- poses when they are employed in combination with other workbook materials.
Since useful measures of components I and II are already avail- able, a profile chart for making a graphic record of scores in these two components has been prepared and is described in considerable detail elsewhere (9).
The correlations of components I and II with the Q and L scores derived from the American Council on Education Psychological Ex-
* The standard error of a split-half reliability coefficient, corrected by the Spearman-Brown formula, may be obtained by using Shen's formula,
2(1 -- rlI) a r l l - - " ~/ ~

FREDERICK B. DAVIS 195
~mination and with the total score on the Nelson-Denny Reading Test have also been reported in the literature (9, 370-371). It is hoped that the relationships between components I and II and other well-known reading tests can be obtained, for if components I and II are regarded as fundamental abilities in reading it is of paru- mount importance to determine the extent to which the reacting tests now commonly used in high schools and colleges actually measure each of these abilities.
The study reported here has explored one means of investigating the psychological nature of reading ability. It has suggested a means of determining the validity of tests of comprehension in reading. The results indicate that there is need for reliable tests to measure several of the nine basic skills that have been defined and for workbooks to aid in improving students' abilities in them. The need for correlating scores in existing reading tests with scores in several of the principal components seems obvious. And, not least, the study provides more detailed information regarding the skills measured by the Coopera- tive Reading Comprehension Tests than has heretofore been provided regarding the skills actually measured by any other widely used read- ing test.*
Finally, it is hoped that the data presented will draw attention to the importance of the mental skills involved in reading and act as a stimulus to fur ther research in the fundamental factors of compre- hension.
RI~FE~ENCES
1. Adler, M. J. How to read a book. New York: Simon & Schuster, 1940. 2. Alderman, G. H. Impr6ving comprehension in reading. J. ed~c. Res.,
1926, 13, 11-21. 3. Berry, B, T. Improving freshman reading" habits. E~gl. J., College Edition,
1931, 20, 324-828. 4. Carroll, R, P. An experimental study of comprehension in reading. New
York: Teachers College, Columbia University, 1927. 5. The Cooperative General Achievcment Tests (Revised Series): Information
concerning their construction, interpretation, and use. New York: Coopera- tive Test Service, 1940.
6. The Cooperative Reading Comprehension Tests: Information concerning their construction, interpretation, ~nd use. New York: Cooperative Test Service, 1940.
7. The Cooperative Reading Comprehension Tests, Lower and Higher Levels; Forms Q, R, S, and T. New York: C~operative Test Service.
* Frederick B. Davis, et al., The Cooperative Reading Co~nprehens~on Tests, Lower and Higher Levels, Forms Q, R, S, and T. Eight separate 40-minute read- ing tests are now available and are distributed by the Cooperative Test Service, 15 Amsterdam Avenue, New York, N. Y., a nonprofit agency of the American Council on Education.
196 PSYCHOMETRIKA
8. Davis, Frederick B. Fundamental factors of comprehension in reading. Un- published doctor's thesis on file at Harvard University Library, Cambridge, Massachusetts, 1941.
9. Davis, Frederick B. Two new measures of reading ability. J. ed~w. Psy- choL, 1942, 33, 365-372.
lO. Dewey, J. C. The acquisition of facts as a measure of reading comprehen- sion. Elem. Sch. J., 1935, 35, 346-348.
11. Feder, D. D. Comprehension maturity tes ts - -a new technique in mental measurement. J. educ. Psycho/., 1938, 29, 597-606.
12. Gans, R. A study of critical reading comprehension in the intermediate grades. New York: Teachers College, Columbia University, 1940.
13. Gates, A. I. Methods of constructing and validating the Gates Reading Tests. Teach. Coll. Reo., 1927, 29, 148-159.
14. Gates, A. I. The improvement of reading. New York: Macmillan Company, 1935. Ch. I I I and VII.
15. Gates, A. I. and Van Alstyne, D. General and specific effects of training in reading with observations on the experimental technique. Teach. Coll. Rec., 1924, 25, 98-123.
16. Gray, W. S. Principles of method in teaching reading as derived from sci- entific investigation. National Society for the Study of Education, Yearbook 18, P a ~ H. Bloomington, Illinois: Public School Publishing Company, 1919, 26-51.
17. Gray, W. S. The nature and types of reading. National Society for the Study of Education, Yearbook ~6, Pazt I. Bloomington, Illinois: Public School Publishing Co., 1937, 23-40.
18. Gray, W. S. and Leafy, B. E. What makes a book readable. Chicago: Univ. Chicago Press, 1935.
19. Hildreth, G. H. Learning the three R's. Minneapolis: Educational Publish- ers, Inc., 1936. Ch. III .
20. Hilliard, G. H. Probable types of difficulties underlying low scores in com- prehension tests. Univ. Iowa Studies in Education, II, No. 6. Princeton, N. J.: Psychological Review Co., 1924.
21. Irion, T. W. H. Comprehension difficulties ff£ ninth-grade students in the study of literature. New York: Teachers College, Columbia University, 1925.
22. Kelley, T. L. Essential trai ts of mental life. Cambridge, Massachusetts: Harvard Univ. Press. 1935.
23. Langsam, R. S. A factorial analysis of reading ability. J. e~cp. Educ. , 1941, 10, 57-63.
24. McCalllster, J. M. Determining the types of reading in studying content sub- jects. Sch. Rev., 1932, 40, 115-123.
25. Murphy, P. G. The role of the concept in reading ability. Un{v. Iowa Studies in Psychology, XVII. Princeton, N. J. : Psychological Review Co., 1933, 21-73.
26. Pressey, L. W. and Pressey, S. L. A critical study of the concept of silent reading. J. educ. Psychol., 1921, 12, 25-31.
27. Richards, I. A. Practical criticism. New York: Harcourt Brace, 1929. 28. Richards, I. A. How to read a page. New York: Harcourt Brace, 1942. 29. Richards, I. A. Interpretation in teaching. New York: Harcourt Brace,
1938. 30. Sangren, P .V. The improvement of reading through the use of tests. Lan-
sing, Mich.: De Kleine, 1931.

FREDERICK B. DAVIS 197
31. Shank, S. Student responses in the measurement of reading comprehension. Cincinnati: C. A. Gregory, 1929.
32. Strang, R. Problems in the improvement of reading in high school and col- lege. Lancaster, Pa.: Science Press Publishing Co., 1938. Chapter II.
33. Thorndike, E. L. The psychology of thinking in the ease of reading. Psy- chol. Rev., 1917, 24, 220-234.
34. Thorndike, E. L. Reading as reasoning: A study of mistakes in paragraph reading. J. edue. Psychol., 1917, 8, 323-332.
35. Thorndike, E. L. The understanding of sentences. Elem. Seh. J., 1917, 18, 98-114.
36. Touten, F. C. and Berry, B. T. Reading comprehension at the junior college level. Calif. Qua~'terly sec. Educ., 1931, 6, 245-251.
37. Tyler, R. W. Measuring the ability to infer. Edu~. lies. BruU., 1930, 9, 476- 480.
38. Woody, C. Measurement of a new phase of reading..7, eduo. Res., 1923, 8, 315-316.
39. Wyman, J. B. and Wend]e, M. What is reading ability? J. educ. Psycho/., 1921, 12, 518-531.
40. Yoakum, G. A. Reading and study. New York: Macmillan Co., 1928. C1L II. 41. Zahner, L. C. The testing of comprehension. Educ. Reo. Supplement No.
13, 1940, 21, 71-89. 42. Zahner, L. C. An approach to reading through meanings. Ch. IV in Reading
in General Education. Washington, D. C.: American Council on Education, 1940.