Fundamental characterization of unbound base course ...
104
Louisiana State University LSU Digital Commons LSU Master's eses Graduate School 2009 Fundamental characterization of unbound base course materials under cyclic loading Aaron Mahew Austin Louisiana State University and Agricultural and Mechanical College, [email protected] Follow this and additional works at: hps://digitalcommons.lsu.edu/gradschool_theses Part of the Civil and Environmental Engineering Commons is esis is brought to you for free and open access by the Graduate School at LSU Digital Commons. It has been accepted for inclusion in LSU Master's eses by an authorized graduate school editor of LSU Digital Commons. For more information, please contact [email protected]. Recommended Citation Austin, Aaron Mahew, "Fundamental characterization of unbound base course materials under cyclic loading" (2009). LSU Master's eses. 2263. hps://digitalcommons.lsu.edu/gradschool_theses/2263
Transcript of Fundamental characterization of unbound base course ...

Louisiana State UniversityLSU Digital Commons
LSU Master's Theses Graduate School
2009
Fundamental characterization of unbound basecourse materials under cyclic loadingAaron Matthew AustinLouisiana State University and Agricultural and Mechanical College, [email protected]
Follow this and additional works at: https://digitalcommons.lsu.edu/gradschool_theses
Part of the Civil and Environmental Engineering Commons
This Thesis is brought to you for free and open access by the Graduate School at LSU Digital Commons. It has been accepted for inclusion in LSUMaster's Theses by an authorized graduate school editor of LSU Digital Commons. For more information, please contact [email protected].
Recommended CitationAustin, Aaron Matthew, "Fundamental characterization of unbound base course materials under cyclic loading" (2009). LSU Master'sTheses. 2263.https://digitalcommons.lsu.edu/gradschool_theses/2263
FUNDAMENTAL CHARACTERIZATION OF UNBOUND BASE
COURSE MATERIALS UNDER CYCLIC LOADING
A Thesis
Submitted to the Graduate Faculty of the Louisiana State University and
Agricultural and Mechanical College in partial fulfillment of the
requirements for the degree of Master of Science in Civil Engineering
in
The Department of Civil and Environmental Engineering
By Aaron Austin
B.S., Louisiana Tech University, 2002 May, 2009
ii
ACKNOWLEDGEMENTS
I consider the completion of this research as dedication and support of a group of
people rather than my individual effort. I wish to express gratitude from the deep in my
heart to everyone assisted me to fulfill this work.
First of all, I would like to express my sincere thanks and appreciation to my
advisor Professor Louay N. Mohammad for his support, thoughtful guidance,
encouragement, and help throughout the course of this work. I am also grateful to him
for accepting me as his graduate research assistant and providing me with uninterrupted
financial support for my Master’s studies which gave me an opportunity to expand my
knowledge in Geotechnical Engineering.
I would like to thank Dr. Munir Nazzal, Dr. Mostafa Elseifi, and Dr. Radhey
Sharma for being on my advisory committee. Their cooperation, guidance, and patience
have been invaluable. I wish to acknowledge Louisiana Transportation Research Center
(LTRC) for providing me wonderful research facilities. I would like to give my thanks to
Amar Raghavendra and Keith Beard for training and technical advice.
Last but certainly not least, I would like to express my gratitude to my parents and
supporting family for their encouragement. The goal of obtaining a Masters degree is a
long term commitment, and their patience and moral support have seen me through to the
end. Thank you.
iii
TABLE OF CONTENTS
ACKNOWLEDGEMENTS .............................................................................................ii
LIST OF TABLES .......................................................................................................... v
LIST OF FIGURES ........................................................................................................ vi
ABSTRACT .................................................................................................................viii
CHAPTER 1 INTRODUCTION ..................................................................................... 1
1.1 Background ....................................................................................................... 1
1.2 Problem Statement ............................................................................................ 2
1.3 Objectives .............................................................................................................. 3
1.4 Scope of This Study ............................................................................................... 3
1.5 Outline................................................................................................................... 4
CHAPTER 2 LITERATURE ........................................................................................... 5
2.1 Introduction ........................................................................................................... 5
2.2 Deformation Behavior of Unbound Granular Materials .......................................... 5
2.2.1 Stresses in Unbound Granular Layers .......................................................................... 5
2.2.2 Deformation Characteristics of Unbound Materials ..................................................... 7
2.3 Factors affecting Resilient and Permanent Deformation Properties ........................ 9
2.3.1 Stress State ............................................................................................................... 10
2.3.2 Number of Load Cycles ............................................................................................ 12
2.3.3 Effects of Moisture Content\Suction.......................................................................... 13
2.3.4 Stress History ........................................................................................................... 15
2.3.5 Density ..................................................................................................................... 17
2.3.6 Load Duration and Frequency ................................................................................... 18
2.4 Shakedown Theory .............................................................................................. 18
2.5 Modeling of Permanent Strain Behavior .............................................................. 22
2.5.1 Resilient Modeling Behavior ..................................................................................... 22
2.5.2 Permanent Deformation Modeling Behavior ............................................................. 25
CHAPTER 3 METHODOLGY ..................................................................................... 28

iv
3.1 Experimental Testing Program ............................................................................. 28
3.2 Testing Setup of Triaxial Tests ............................................................................ 28
3.3 Sample Preparation .............................................................................................. 30
3.3.1 Static Triaxial Compression Test ............................................................................... 30
3.3.2 Sample Size .............................................................................................................. 32
3.4 Repeated Load Triaxial (RLT) Tests .................................................................... 32
3.4.1 Resilient Modulus Test ............................................................................................. 33
3.4.2 Single-Stage RLT Test .............................................................................................. 34
3.4.3 Multi-Stage RLT Test ............................................................................................... 37
CHAPTER 4 ANALYSIS OF RESULTS ...................................................................... 41
4.1 Physical Properties Test Results ........................................................................... 41
4.2 Static Triaxial Tests Results ................................................................................. 44
4.3 Repeated Load Tri-axial Testing .......................................................................... 46
4.3.1 Single-Stage RLT Test Results-Resilient Strain ......................................................... 50
4.3.2 Single-Stage RLT Test Result-Permanent Strain ....................................................... 52
4.4 Multi-Stage Test Results ...................................................................................... 53
4.5 Shakedown Limits ............................................................................................... 61
CHAPTER 5 CONCLUSION AND RECOMMENDATIONS ...................................... 71
5.1 Conclusions ......................................................................................................... 71
5.2 Recommendations ............................................................................................... 72
REFERENCES.............................................................................................................. 74
APPENDIX A: RESILIENT MODULUS ..................................................................... 82
APPENDIX B: MOISTURE DENSITY CURVES ........................................................ 85
APPENDIX C: PERMANENT DEFORMATION CURVES......................................... 86
APPENDIX D: CALCULATIONS ............................................................................... 93
VITA............................................................................................................................. 95

v
LIST OF TABLES
Table 2.1 Models proposed to Predict Permanent Strain after Lekarp et. al. 2000 .......... 26
Table 3.1 Load Pulse Used in the Resilient Modulus Procedure ..................................... 36
Table 3.2 Stress Sequence: Limestone ........................................................................... 38
Table 3.3 Stress Sequence: Sandstone ........................................................................... 39
Table 3.4 Molding Moisture Regime for Mult-Stage ..................................................... 40
Table 4.1 Physical Properties Results ............................................................................ 43
Table 4.2 Summary Limits ............................................................................................ 70

vi
LIST OF FIGURES Figure 2.1 Stress components acting on an element (Lekarp 97) ...................................... 5
Figure 2.2 Stress beneath a rolling wheel load (Lekarp, Dawson) .................................... 6
Figure 2. 3 Stress-Strain Behavior of UGMSs (Werkmeister 2003)................................. 7
Figure 2. 4 Hysteresis Loop for One Cycle of Loading (Lekarp 1997) ............................. 8
Figure 2. 5 Typical RLT for Unbound Slate Waste (Dawson and Nunes) ......................... 9
Figure 2. 6 Stress Influence on Permanent Strain in a Granite Gneiss-Material (Bar 72) 11
Figure 2. 7 Influence of Drainage of Permanent deformation (Dawson 90) .................... 14
Figure 2. 8 Effect of Stress History on Permanent Strain (Brown and Hyde 1975) ......... 16
Figure 2. 9 Effect of Density on Permanent Strain ......................................................... 18
Figure 2. 10 Permanent Deformation Behavior at Low Stress Level (Werk 2003) ......... 19
Figure 2. 11 Permanent Deformation Behavior at High Stress Levels (Werk 2003) ....... 20
Figure 2. 12 Shakedown Range Behavior (Arnold 2004) ............................................... 20
Figure 2. 13 Elastic/Permanent Behavior Under RLT Loading (Johnson 1996) .............. 22
Figure 3. 1 MTS Tri-axial Testing Machine ................................................................... 29
Figure 3. 2 Preparation of Testing Limestone Samples .................................................. 31
Figure 3.3 Applied Load and Response of Samples in RLT Test.................................... 35
Figure 4. 1 Particle Size Distribution of Tested Aggregates ........................................... 42
Figure 4. 2 Stress-Strain Curves for Granite Static Compression Test ............................ 44
Figure 4. 3 Stress-Strain Curves for Limestone Static Compression Test ....................... 45
Figure 4. 4 Stress-Strain Curves for Sandstone Static Compression Test ........................ 45
Figure 4. 5 Ultimate Shear Strength in p-q space ........................................................... 46
Figure 4. 6 Residual Shear Strength in p-q space ........................................................... 47

vii
Figure 4. 7 Resilient Modulus vs. Bulk Stress ................................................................ 49
Figure 4. 8 Resilient Modulus Coefficients of Tested Materials: a) k1 b) k2 c) k3 ........... 49
Figure 4. 9 Results of Single-Stage RLT Test a) Resilient Strain Variation of Load Cycles b) Measured and Predicted Resilient Modulus Values ........................................ 51 Figure 4. 10 Vertical Permanent Strain Variations with Number of Cycles .................... 54
Figure 4. 11 Vertical Permanent Strain Rate vs. Vertical Permanent Strain .................... 54
Figure 4. 12 Multi-Stage Cumulative Permanent Strain ................................................. 55
Figure 4.13 Multi-Stage Test Results Permanent Strain Rate for a) Limestone b) Sandstone c) Granite ..................................................................................................... 58 Figure 4.14 Resilient Strain Multi-Stage Test ................................................................ 62
Figure 4. 15 Shakedown Limits for Limestone at Optimum Moisture Content ............... 64
Figure 4. 16 Shakedown Limits for Sandstone at Optimum Moisture Content ............... 64
Figure 4. 17 Shakedown Limits for Sandstone at Dty of Optimum Moisture Content..... 65
Figure 4. 18 Shakedown Limits for Sandstone at Wet of Optimum Moisture Content .... 65
Figure 4. 19 Shakedown Limits for Limestone at Dry of Optimum Moisture Content .... 66
Figure 4. 20 Shakedown Limits for Limestone at Wet of Optimum Moistures Content .. 66
Figure 4. 21 Effect of Saturation on m a) Elastic Limit b) Plastic Limit ......................... 67
Figure 4. 22 Effect of Saturation on d a) Elastic Limit b) Plastic Limit .......................... 68
Figure 4. 23 Intercept vs. Degree of Saturation for Limestone ....................................... 69
Figure 4. 24 Intercept vs. Degree of Saturation for Sandstone ........................................ 69

viii
ABSTRACT
Pavements are a layered system each layer distinguished by different materials as
required by traffic and subgrade conditions. A base course is an intermediate layer
constructed of high quality stone aggregates: quality based on physical properties such as
gradation, hardness, and texture. Although indicative of performance, physical properties
do not directly measure performance. This thesis presents the results of a comprehensive
experimental testing program that was conducted to examine the behavior of unbound
granular base materials under cyclic loading and to evaluate the effect of the stress level
and moisture content on strain behavior. Three base materials, namely granite, limestone
and sandstone, were selected. Different physical properties tests were conducted on the
materials considered. In addition, static and repeated load triaxial (RLT) tests were
performed in this study. Three different types of RLT tests were used including: resilient
modulus, single-stage, and multi-stage RLT test. The single-stage and multi-stage RLT
tests results were analyzed within the framework of the shakedown theory. The results of
this study showed that for resilient modulus the materials preformed the following, with
the materials listed highest to lowest: limestone, granite and sandstone; while for
permanent deformation, the materials were listed highest to lowest: sandstone, limestone
and granite. In addition, the results demonstrated that the change in slope (m) of
shakedown limits with the degree of saturation was more pronounced at lower stress
levels (elastic limit) than that at higher stress levels (plastic limit). Finally, the results
showed a significant effect of degree of saturation on the intercept of the shakedown
limits at both low and high stress levels. The change in intercept was greater for
limestone than sandstone for changes in degree of saturation.

1
CHAPTER 1 INTRODUCTION 1.1 Background
Pavement structures are built to support loads induced by traffic vehicle loading and
to distribute them safely to the subgrade soil. A conventional flexible pavement structure
consists of a surface layer of asphalt (AC) and a base course layer of granular materials
built on top of a subgrade layer. Pavement design procedures are intended to find the
most economical combination of AC and base layers’ thickness and material type, taking
into account the properties of the subgrade and the traffic to be carried during the service
life of the roadway. Pavement materials are required to: (1) spread wheel loads to reduce
the load on the soft underlying subgrade (soil) and/or other weaker pavement materials;
(2) not fail in shear (i.e. shoving or rutting) with the applications of wheel loads;(3) have
a minimal deformation, where most of the deformation occurs in the subgrade.
The two main structural failure mechanisms considered in the design of a flexible
pavement structure are permanent deformation (rutting) and fatigue cracking. Rutting is
the result of an accumulation of irrecoverable strains in the various pavement layers. For
thin to moderately thick pavements, subgrade and granular base layers contribute most to
rutting of a pavement. Fatigue cracking has been defined as the phenomenon of fracture
under repeated or fluctuating stress having a maximum value generally less than the
tensile strength of the material (Ashby and Jones, 1980).
Although base course layer is an intermediary element of the pavement structure, its
correct functioning in the road pavement layers is vitally important. The major structural
function of a base layer is to distribute the stresses generated by wheel loads acting on the
wearing surface so that the stresses transmitted to the subgrade will not be sufficiently

2
great to result in excessive deformation or displacement of that foundation layer. Also,
while transferring these stresses, the base layer must not undergo excessive permanent
deformation and withstand shoving.
Material Characteristics is a principal factor entered into flexible pavement design
methods to determine layer thickness and type. Unbound base course materials (UGMs)
are considered for pavement design primarily on their physical properties with exception
of resilient modulus, which is a performance parameter expressing stiffness that replaced
the structural support value in 1986. Although an improvement, the resilient modulus
alone does not duly characterize the functionality of the unbound granular material layer.
As stated earlier, in addition to transfer of loading to the subgrade, the material must be
capable of safely handling stresses without excessive deformation. Leading to further
improve on the characterization of the UGM, the permanent deformation component
must be accounted for and included with the resilient modulus to fully evaluate the
engineering behavior of the UGM to ensure proper functionality of the base course layer.
1.2 Problem Statement
A principal component included in the design of flexural pavements is the
characterization of those materials that make up the pavement layers. Aiding in the
development of the M-E design guide, areas identified by Strategic Highway Research
Program (SHRP) and other M-E implementation projects such as Federal Highway
Admistration (FHWA) and National Cooperative Highway Research Program (NCHRP)
require further material characterization research include:
Resilient Modulus for granular materials
Permanent Deformation properties for granular materials
3
Overall performance of a pavement structure depends highly on the proper
characterization of material properties.
Currently, Unbound Granular Materials (UGMs) are characterized on the basis of
physical properties such as gradation, plasticity, hardness, durability, and on the basis
static shear strength tests. These properties are determined either empirically
(correlations) or from testing procedures that do not properly consider the relevance to
the cyclic loading behavior of the material. These physical properties or strength
characteristics from static load testing are insufficient to characterize the dynamic
response of materials within a pavement layer. For this reason, to simulate accurate field
conditions, the UGMs must undergo cyclic loading to characterize the dynamic response
behavior. The observed distresses in the field (rutting, flexural cracking) are a direct
result of the dynamic traffic loading, thus characterizing materials behavior with cyclic
loading will aid as a predictor for field performance.
1.3 Objectives
The primary objective of the research study is to characterize the deformational
behavior of unbound granular base materials under cyclic loading and examine the effects
of the state of stress and moisture content on this behavior.
1.4 Scope of This Study
To achieve the aforementioned objectives an experimental testing program was
conducted on three base course materials: Granite, Limestone and Sandstone. The
experimental testing program included conducting physical properties tests, as well as
static and repeated loading triaxial tests. Physical properties tests consisted of gradation,
standard proctor, specific gravity, absorption, coarse aggregate angularity, and Micro-

4
Deval tests. Three types of repeated load tri-axial test were conducted: resilient modulus,
single stage permanent deformation, and multi-stage permanent deformation. The results
multi-stage RLT tests were analyzed within the framework of the shakedown theory. To
examine the effects of moisture content, single samples were tested at wet and dry
moisture regimes to evaluate the effect of moisture on shakedown behavior.
1.5 Outline
Including this introductory chapter this thesis is divided into five chapters. A brief
summary of the contents of the other four chapters are as follows:
Chapter 2 presents an extensive literature review on the behavior of UGMs, outlining
important factors that affect the engineering behavior of UGMs.
Chapter 3 describes the materials used and the methodologies of the experimental testing
program implemented in this study to evaluate the laboratory performance of the UGMs
considered.
Chapter 4 contains full details of test results and analytical discussions.
Finally, Chapter 5 summarizes and concludes this research work and provides
recommendations for future research.
5
CHAPTER 2 LITERATURE
2.1 Introduction A review of the literature providing information on the cyclic loading behavior of
UGMs was surveyed. The literature investigation focused on the various factors that
affect the deformation behavior (permanent and resilient) of UGMs and modeling
techniques. The beginning of the chapter introduces and explains the various factors and
how they relate to deformation behavior. Later in the chapter is an introduction to the
application of shakedown theory. Finally, an overview of models developed to predict
the deformation behavior of UGMs is presented.
2.2 Deformation Behavior of Unbound Granular Materials
2.2.1 Stresses in Unbound Granular Layers
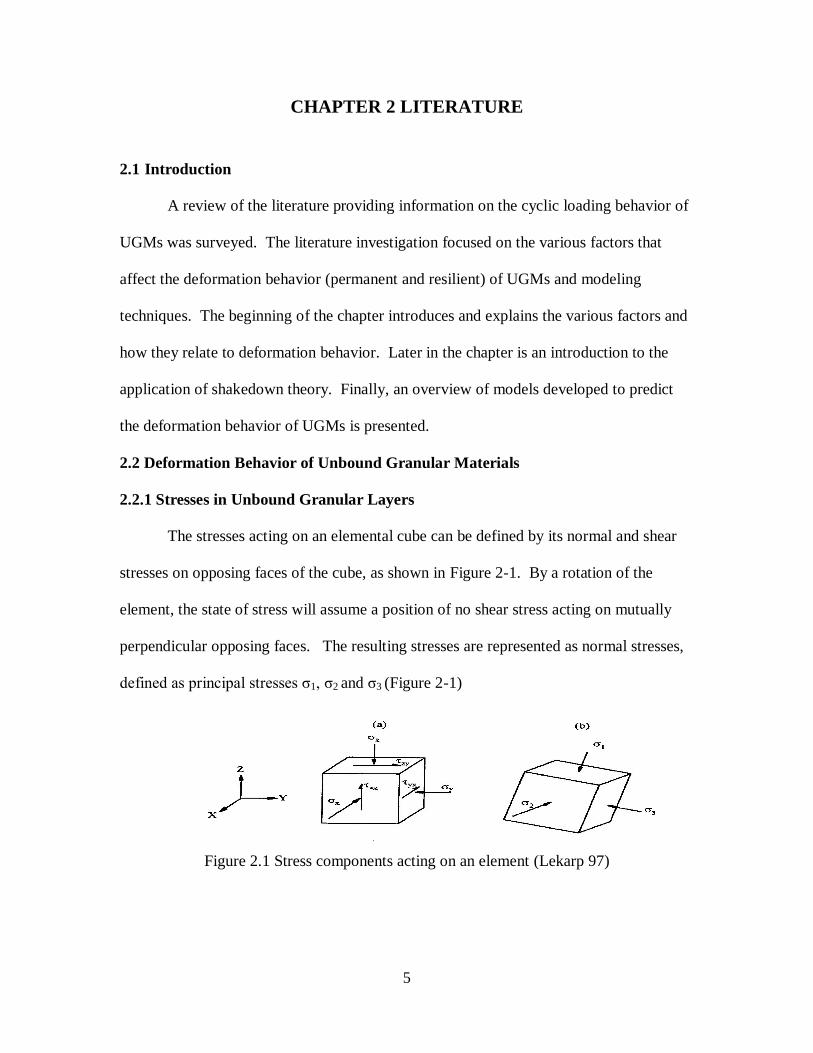
The stresses acting on an elemental cube can be defined by its normal and shear
stresses on opposing faces of the cube, as shown in Figure 2-1. By a rotation of the
element, the state of stress will assume a position of no shear stress acting on mutually
perpendicular opposing faces. The resulting stresses are represented as normal stresses,
defined as principal stresses σ1, σ2 and σ3 (Figure 2-1)
Figure 2.1 Stress components acting on an element (Lekarp 97)

6
The principal stresses are physical invariants that are independent of the coordinate
system chosen (e.g., Cartesian, Polar). In the absence of traffic loading, a confining
pressure from overburden and previous stress history is the applied stress condition.
The pavement structure in the field is subjected to loads induced by wheel loadings
provided by traffic. An element in a pavement is subjected to a stress pulse, each
consisting of vertical, horizontal and shear component. These stresses are mutable and
change as the wheel load passes. From Figure 2.2, the principal stresses (stresses without
a shear stress) are horizontal and vertical when the shear component is zero, that is,
directly beneath the center of the wheel. As the wheel moves away, a reversal of the shear
stress occurs. The stress reversal is commonly referred to as principal stress rotation.
Figure 2.2 Stress beneath a rolling wheel load (Lekarp, Dawson)

7
2.2.2 Deformation Characteristics of Unbound Materials
The strain behavior both resilient and permanent of UGMs under traffic loading
has been one the main research topics in pavement engineering for many years.
Researchers characterized the deformation response by a recoverable (resilient)
deformation and a residual (permanent) deformation (Lekarp 1997). Both permanent and
resilient deformations are a function of the applied stress. Henceforth, the dynamic
deformation response is controlled by the stress-strain behavior of the material. A typical
relationship is shown in Figure 2-3, as the stress increase the material’s resistance to
further deformation decreases.
Figure 2. 3 Stress-Strain Behavior of UGMSs (Werkmeister 2003)
At low levels of stress, the stiffness of the material increases as stress increases
(strain hardening). The strain hardening causes particle rearrangement and the particles
move closer together. Eventually from further increases in stress the UGM strain
behavior softens (strain softening), additional increases in stress will cause collapse.
UGMs are quite different from soils in their response to cyclic loading. UGMs are an
8
assemblage of, often inhomogeneous and non-isotropic, macroscopic particles in contact
with each other. The horizontal and vertical stresses are positive in UGMs since they do
not carry any significant amount of tensile stresses.
The strain behavior of UGMs under compressive stresses is highly complex
because of the existence of resilient and permanent strains even at small levels of stress.
UGMs in a pavement structure are subjected to large number of loadings during the
service life of the pavement. The resilient deformation recovers after each load cycle,
whereas the permanent deformation accumulates (sometime digressively) with each load
cycle. The rate of accumulation depends on material properties, the stress level, and
loading conditions (Arnold 2004). The complex stress-strain behavior for UGMs is given
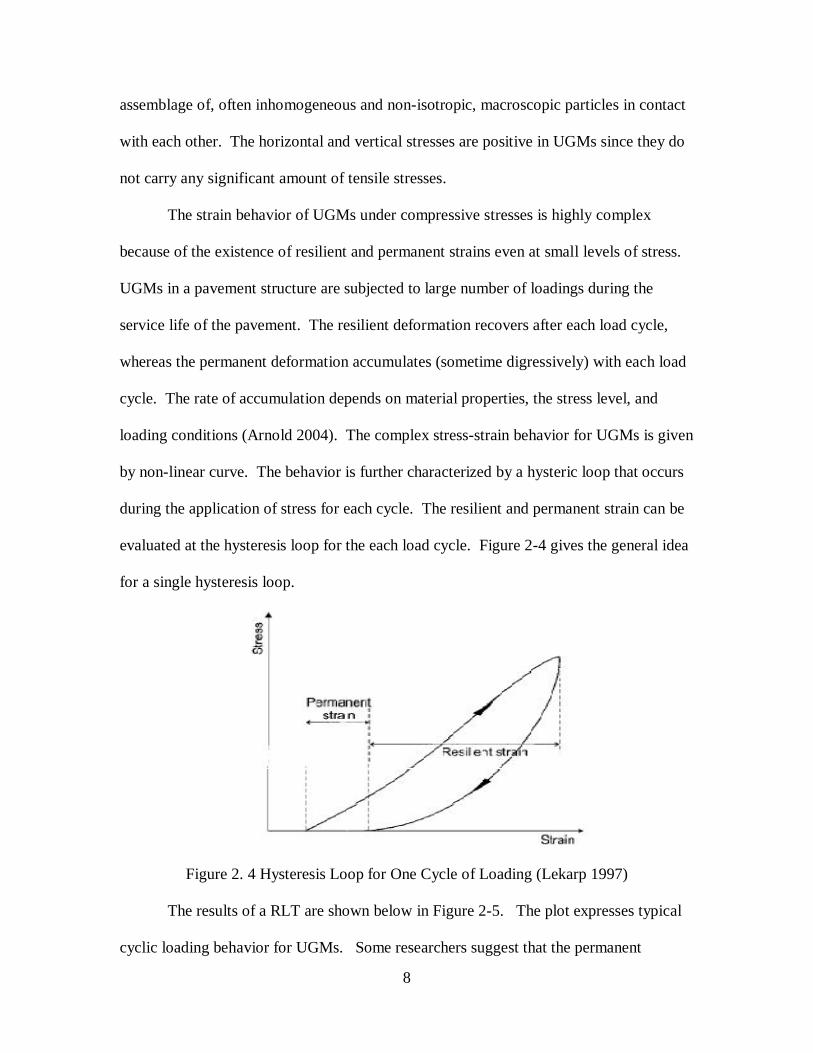
by non-linear curve. The behavior is further characterized by a hysteric loop that occurs
during the application of stress for each cycle. The resilient and permanent strain can be
evaluated at the hysteresis loop for the each load cycle. Figure 2-4 gives the general idea
for a single hysteresis loop.
Figure 2. 4 Hysteresis Loop for One Cycle of Loading (Lekarp 1997)
The results of a RLT are shown below in Figure 2-5. The plot expresses typical
cyclic loading behavior for UGMs. Some researchers suggest that the permanent

9
deformation rate or permanent deformation per cycle diminishes with loading cycles
(Arnold 2004). By a comparison of the hysteresis loops from the graph, the hysteresis
loops become more narrow at increasing cycles, showing a markedly decrease in
permanent deformation. Of course, this is often the case for lower stress levels,
depending upon stress levels, permanent deformation may increase, decrease, remain
constant or increase and quickly fail with increasing load cycles.
Figure 2. 5 Typical RLT for Unbound Slate Waste (Dawson and Nunes)
2.3 Factors affecting Resilient and Permanent Deformation Properties
For the purpose of design, it is important to consider how deformation behavior of
UGMs varies with changes in different influencing factors. From studies found in
literature, the resilient and permanent strains of UGMs are affected by several factors
described below.

10
2.3.1 Stress State
The available literature from studies show that “stress level” is one of the most
important factors affecting the resilient response of UGMs. Many studies have shown a
very high degree of dependence on confining pressure and the bulk stress for the resilient
modulus for UGMs (Mitry ,1964; Monosmith et al.,1967; Hicks, 1970; Smith and Nair,
1973; and Sweere, 1990). Monosmith et al. (1967) reported an increase as great as 500%
in resilient modulus for a change in confining pressure from 2.9 psi (20 kPa) to 29
psi(200 kPa). Smith and Nair (1973) noticed a 50% increase in resilient modulus when
bulk stress increased from 10 psi (70 kPa) to 20.3 psi (140 kPa) .
Suggested from researchers, deviator stress is said to be much less influential on
material stiffness than confining pressure. A study by Morgan (1966) showed the
resilient modulus to decrease slightly with increasing repeated deviator stress under
constant confinement. While a study by Hicks (1970) describes the resilient modulus as
being unaffected by the magnitude of deviatoric stress, as long as there is not excessive
plastic deformation. On the other hand, Hicks and Monismith reported a slight softening
of the material at low deviator stress levels and slight stiffening at higher stress levels.
The accumulation of permanent strain is directly related to deviator stress and
inversely related to confining pressure (Morgan 1966). Conversely, for a constant
deviator stress, the accumulation of permanent strain increased with a reduction in
confining stress. Clearly, confining pressure and deviator stress play a primary role in the
accumulation of permanent strain.
Barksdale (Barksdale 1972) conducted a number of RLT test on UGMs at
confining pressures and up to 100,000 cycles. Barksdale concluded that permanent

11
strains were highly dependent on the applied load and increased when confining pressure
decreased and deviator stress increased (Figure 2-6)
Figure 2. 6 Stress Influence on Permanent Strain in a Granite Gneiss-Material (Bar 72)
Researchers suggest that the magnitude of permanent strain settles down to a
constant value related to the ratio of deviator stress to confining pressure (Barksdale,
1972,; Lashine et al, 1971; Pappin, 1979;Paute et al., 1996; Lekarp and Dawson, 1998).
Lekarp and Dawson (1998) also showed that an increase in stress path length in p-q space
increased the magnitude of permanent strain. Other researchers have used the relationship
of permanent strain in terms of proximity to the static shear failure line (Raymond and
Williams 1978; Pappin 1979; Thom 1988; Paute et al. 1996). This has been refuted by
Lekarp and Dawson who suggest that the mechanism for failure under cyclic loading is
different than of that for static loading.
12
2.3.2 Number of Load Cycles
Researchers investigated the effect of number of load cycles on the resilient
deformation of granular materials, and they concluded the resilient deformation increased
slightly due to loss of moisture during testing ( Moore et al 1970). In contrast, other
researchers suggested the resilient deformation stabilizes after 50-100 load cycles as after
25,000 cycles (Hicks, 1970; Allen and Thompson, 1974).
The growth of permanent deformation in granular materials under repeated a
gradual process during which each load cycle contributes a small increment to the
accumulation of strain. For increasing loads cycles the accumulative strain will always
increase (Arnold 2004). Paute et. al (1996) argued that the rate of increase of permanent
strain is digressive in behavior to such an extent to define a limit value for the
accumulation of permanent strain. While other researchers ( Morgan, 1996; Barksdale,
1972; Sweere, 1990) have reported continuously increasing permanent under repeated
loading. Moreover, Theyse (2002) also reported that for high stress, the permanent strain
increased at a constant rate but between 5,000 and 10,000 load cycles an exponential
increase in permanent strain occurred resulting in collapse shortly after.
According to Lekarp and Dawson (1998), settling down of the permanent stain
rate is achievable only at low applied stresses. In recent work by Kolisoja (1998), tests
were conducted that involved very a large number of cycles. The work revealed that
permanent strain became stable and then suddenly unstable suggesting the behavior may
not be expressed as simple function.
13
2.3.3 Effects of Moisture Content\Suction
Monosmith and Finn (1977) reported that the presence of moisture in a pavement
system is one of the most important environmental considerations. Water is needed as
lubricant to achieve high levels of compaction during construction. The moisture content
will vary from the “as-built” moisture content by the ingress of moisture from changes in
seasonal changes or capillary action. More importantly, the performance of the pavement
structure is dependent upon the permeability of the UGM and drainage conditions of the
structure. If there is a build-up of moisture, the pavement may develop excess pore water
pressure decreasing effective stress leading to reduced strength transpiring in localized
failures and rutting. The effect of high water pressure in UGMs in pavement layers in the
laboratory and in the the field from a combination of a high degree of saturation and low
permeability, due to poor drainage, leads to low effective stress , and consequently, low
stiffness and deformation resistance (Hynes and Yoder, 1963; Barksdale, 1972; Maree et
al., 1982; Thom and Brown, 1987; Dawson et al 1996).
The moisture content of UGMs has been found to affect the resilient modulus
characteristics in the laboratory and field. Several researchers reported a marked
dependency of resilient modulus on the moistures content, with the modulus decreasing
with growing moisture content (Haynes and Yoder, 1963; Hicks and Monosmith, 1971;
Barksdale and Itani, 1989; Dawson et al, 1996; Heydinger et al, 1996). For instance,
Hicks and Monosmith (1971) showed that the resilient modulus deceased as the moisture
increased beyond the optimum moisture content.
Researchers suggest the effect of moisture is also dependant on stress analysis,
total or effective. On one hand, a decrease in resilient modulus is achieved only if the
14
analysis is based on total stress (Mitry, 1964; Seed et al., 1967; Hicks, 1970). On the
other hand, the resilient modulus remains unchanged if the results are analyzed on basis
of effective stress (Pappin, 1979). However, Thom and Brown (1987) argued that the
moisture acts as a lubricant and would cause deformation of the granular assembly and
reduce resilient modulus, without the presence of excess pore pressure. They proved the
hypothesis with a series of test on crushed stone.
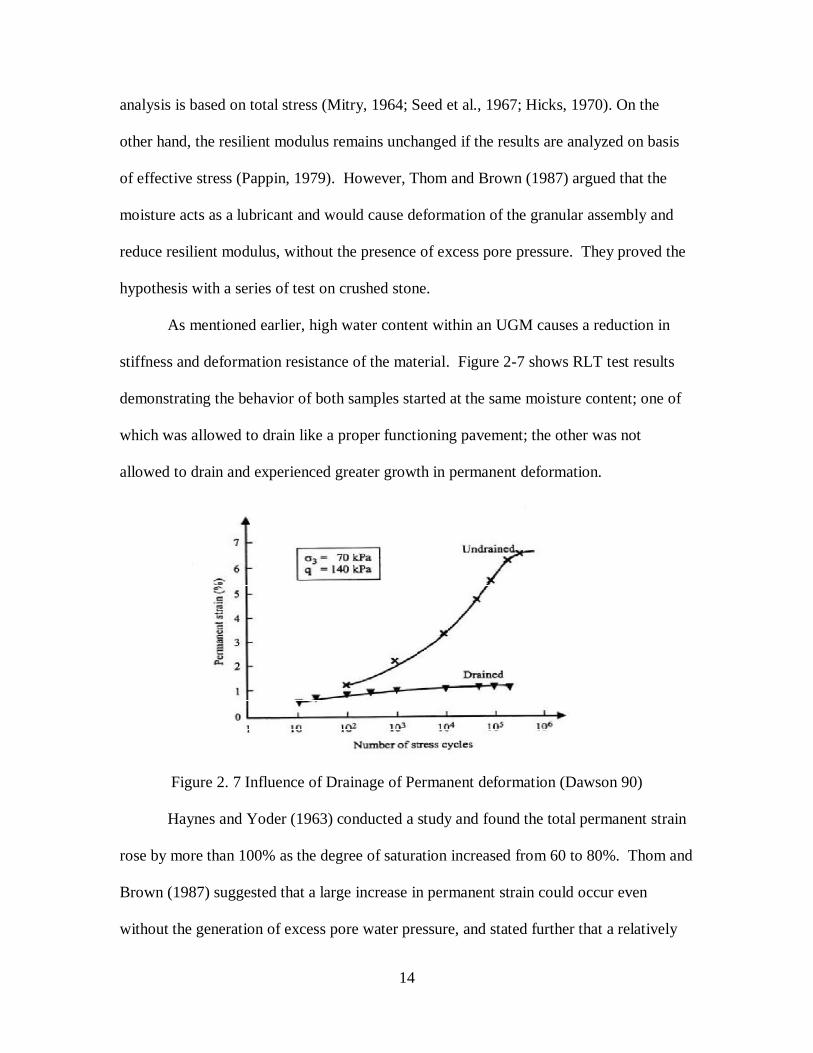
As mentioned earlier, high water content within an UGM causes a reduction in
stiffness and deformation resistance of the material. Figure 2-7 shows RLT test results
demonstrating the behavior of both samples started at the same moisture content; one of
which was allowed to drain like a proper functioning pavement; the other was not
allowed to drain and experienced greater growth in permanent deformation.
Figure 2. 7 Influence of Drainage of Permanent deformation (Dawson 90)
Haynes and Yoder (1963) conducted a study and found the total permanent strain
rose by more than 100% as the degree of saturation increased from 60 to 80%. Thom and
Brown (1987) suggested that a large increase in permanent strain could occur even
without the generation of excess pore water pressure, and stated further that a relatively
15
small increase in water can trigger a dramatic increase in permanent deformation.
Furthermore, the result of wetting as increased rutting has been observed in in-situ
vehicle simulator test trials (Maree et. al, 1982).
In summary, it seems that moisture content has a profound influence on the
permanent and resilient response for UGMs. This is mainly due to the apparent cohesion
caused by soil suction of the unsaturated assembly. If suction is increased, the pore water
pressure reduces and thus the effective stress is increased. Suction (eq. 2.1) is present in
all UGMs and has a significant effect on the effective stress.
푠 = 푢 − 푢 Equation 2.1
where:
푠 = matric suction
푢 =pore air pressure;
푢 = pore water pressure
Effective mean stress (푝 ) is the total mean normal stress minus the pore water
pressure(푢 ). As suction controls effective stress, effective stress governs the effective
level of confining stress, which if increased, has the effect of increasing a material
strength. However, most RLT tests do not control or measure suction so total stresses are
used for testing purposes.
2.3.4 Stress History
Stress history does have an effect on the resilient response of UGMs. The stress
history seems to appear as a consequence of progressive densification and particle
rearrangement under repeated loading (Dehlen, 1969). Therefore, researchers suggest a
prescribed number of cycles ranging from 100 to 1000 load repetitions to eliminate stress
16
history effects (Boyce el. Al, 1976; Hicks, 1970; Allen, 1973). Researchers suggest
stress history effect can be avoided by using low stresses to avoid excessive permanent
deformations, allowing large numbers of resilient modulus test to be carried out
sequentially on the same sample to determine resilient behavior of the material (Brown
and Hyde, 1975; Mayhew, 1983).
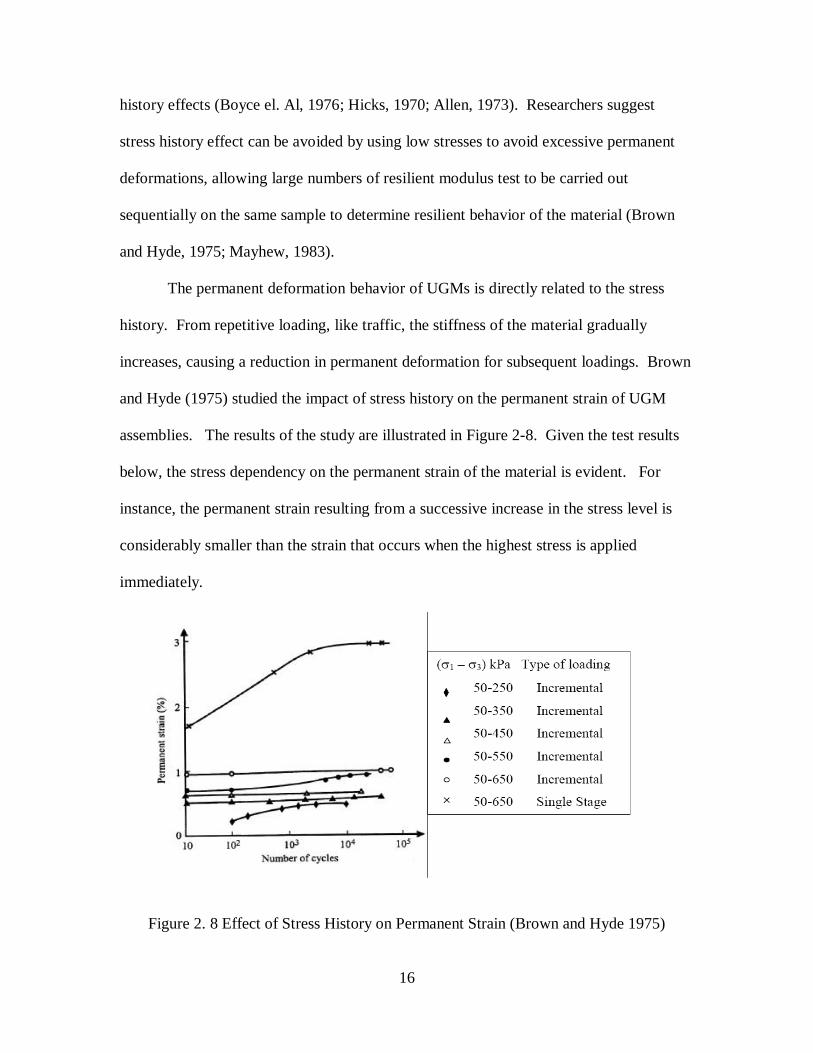
The permanent deformation behavior of UGMs is directly related to the stress
history. From repetitive loading, like traffic, the stiffness of the material gradually
increases, causing a reduction in permanent deformation for subsequent loadings. Brown
and Hyde (1975) studied the impact of stress history on the permanent strain of UGM
assemblies. The results of the study are illustrated in Figure 2-8. Given the test results
below, the stress dependency on the permanent strain of the material is evident. For
instance, the permanent strain resulting from a successive increase in the stress level is
considerably smaller than the strain that occurs when the highest stress is applied
immediately.
Figure 2. 8 Effect of Stress History on Permanent Strain (Brown and Hyde 1975)
17
Even though the effects of stress history are obvious in laboratory testing, further
testing to fully evaluate the observance of stress history’s impact on permanent strain has
been ignored. Still, researchers suggest the effects of stress history can be eliminated by
using a new specimen each time for testing.
2.3.5 Density
The general trend is that resilient modulus increases with increases in dry density.
Researchers who studied the impact of density on uniform sand reported resilient
modulus increased up to 50% for loose to dense specimens (Robinson, 1974; Trollope,
1962). Theoretically, additional compaction results in a greater number of particle
contact improving the resilient response of the material. However, others reported that
an increase in dry density is relatively insignificant on the resilient response (Thom and
Brown, 1989; Selig, 1991).
For the compaction of the granular assembly of UGMs is quite significant for
resistance to permanent deformation and long term stability. From the results presented,
the resistance to permanent deformation in UGMs under repetitive loading apparently
improves with greater dry density. For example, Barksdale (1972) studied the behavior
of several granular materials and reported an average of 185% more permanent strain
when the material was compacted at 95% instead of 100% of maximum dry density
(Standard Proctor Density), refer to Figure 2-9.
Increasing the dry density, as reported by Holubec (1969), promotes a reduction
in permanent strains for crushed aggregates in particular. This behavior is not noticeable
for rounded aggregates, as these aggregates are initially at a higher compacted density
than angular aggregates for the same level of compaction.

18
Figure 2. 9 Effect of Density on Permanent Strain
2.3.6 Load Duration and Frequency
The resilient behavior of UGMs is unaffected by load duration and frequency.
This aforementioned statement has been validated by several studies amongst different
researchers. For example, Seed et al. (1965) reported the resilient modulus increased
only slightly when the frequency was increased from 20 min to 0.3 s. Meanwhile, an
increase in stress duration incrementally of 0.1, 0.15 and 0.25 s had no effect on resilient
modulus or Poisson’s ratio (Hicks, 1970).
2.4 Shakedown Theory
A key objective of pavement design is keep permanent deformations of structural
layers within tolerable limits. As mentioned earlier, the mechanism responsible for
deformations are from cyclic traffic loadings. For many years, cyclic loading models
have been used to explain the plastic limit or “Shakedown” behavior of structures
(Melan, 1936). Researchers argued that this type of analysis could be used as an approach
to model pavement deformations (Sharp 1983; Sharp and Booker, 1984). During the

19
fledgling days of the AASTO road test, researcher noticed that the measured
serviceability index stabilized after a finite number of load applications, providing early
justification for a shakedown approach behavior analysis.
Limit analysis has long been used to determine failure criteria for UGMs under
static loading. To evaluate a traffic loading condition, the shakedown theory has been
extended to pavement analysis to determine the failure behavior for UGMs under cyclic
loadings. The shakedown theory uses the number of cycles and stress ratio , σd\σ3, as the
parameters to explain the permanent deformation behavior. For if the stress ratio is small
enough, then the permanent strain will tend to a limit demonstrating an asymptotic or
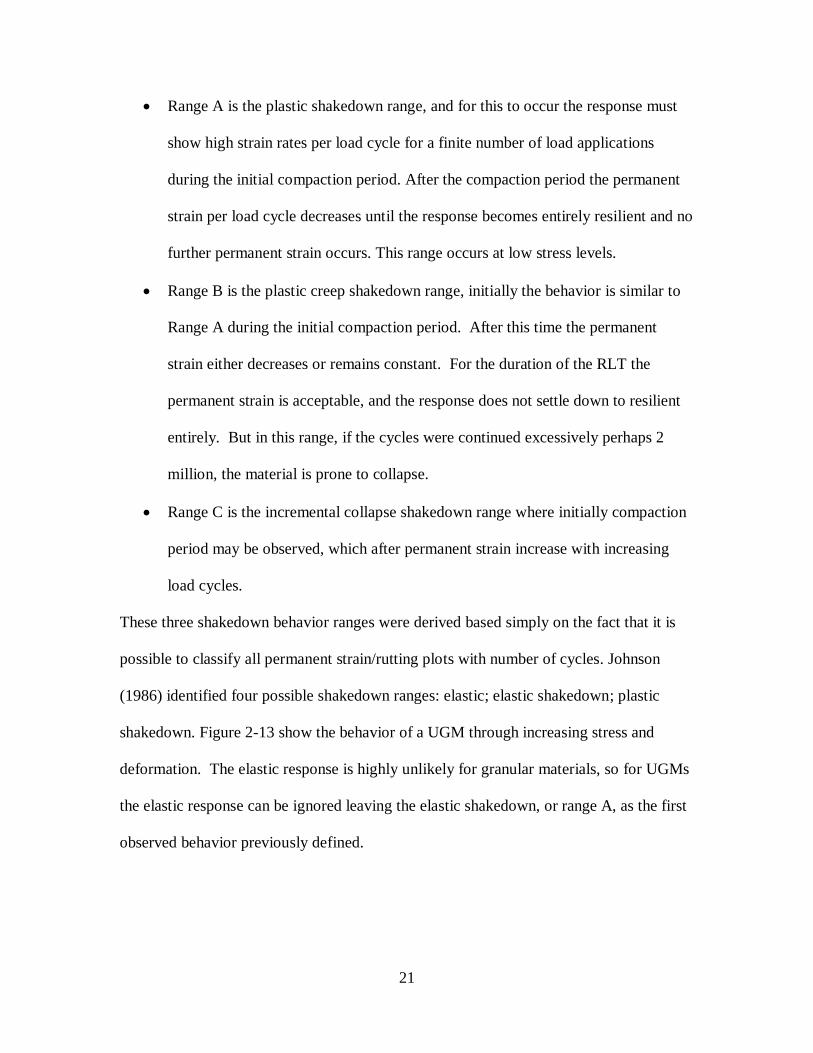
shakedown behavior, refer to Figure 2-10.
Figure 2. 10 Permanent Deformation Behavior at Low Stress Level (Werk 2003)
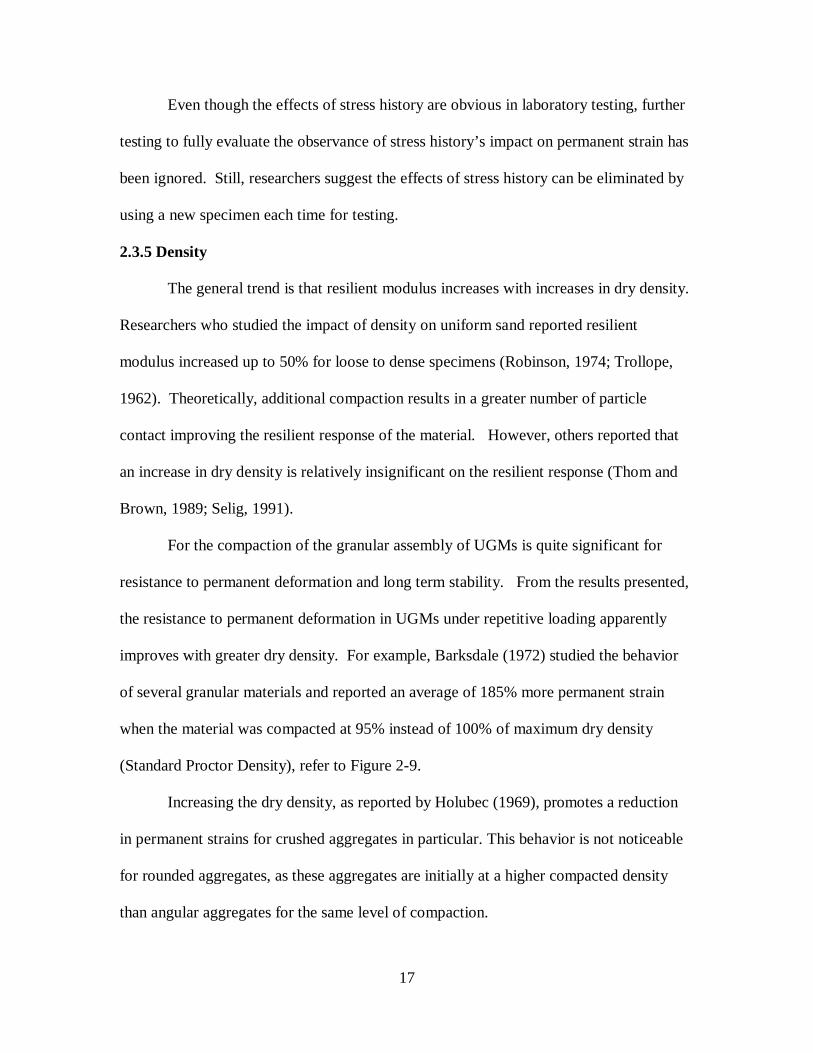
If the stress ratio is increase, permanent strains are likely to increase, to capture
the total behavior a logarithmic model is needed (Figure 2-11). If the ratios are increased
further, strain may upsurge rapidly leading to collapse. These ranges of behaviors can be
determined using the shakedown concept and are displayed below (Figure 2-12).
20
Figure 2. 11 Permanent Deformation Behavior at High Stress Levels (Werk 2003)
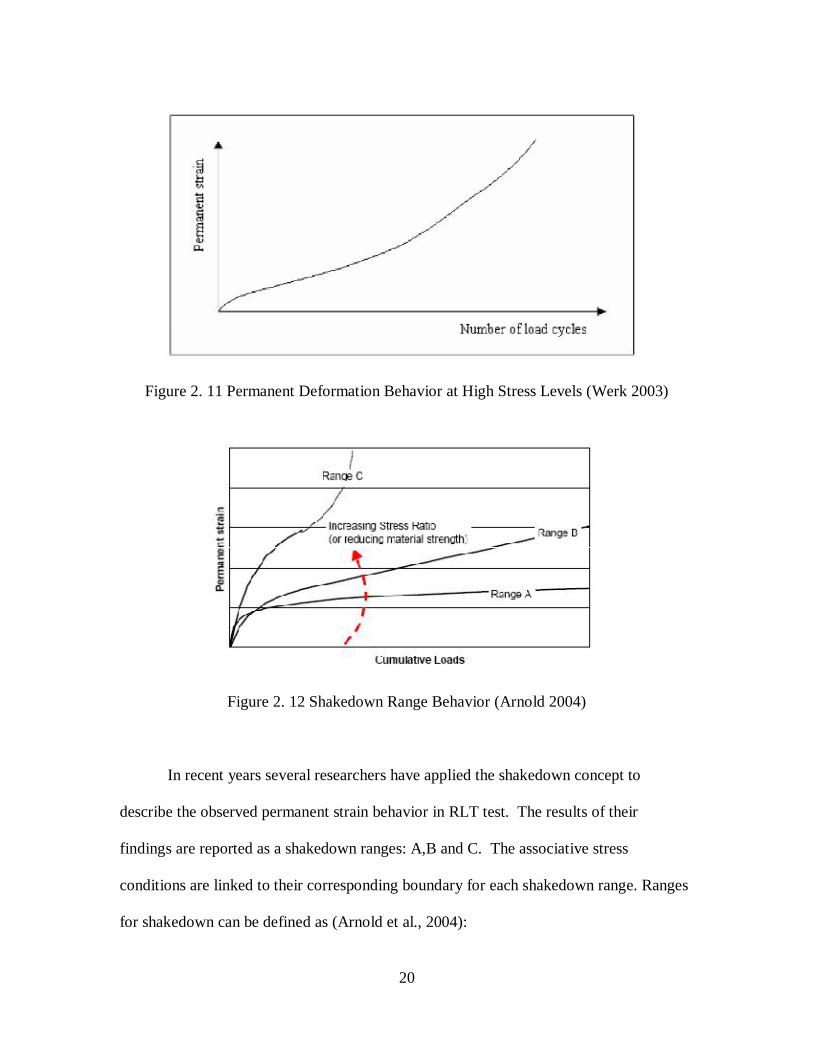
Figure 2. 12 Shakedown Range Behavior (Arnold 2004)
In recent years several researchers have applied the shakedown concept to
describe the observed permanent strain behavior in RLT test. The results of their
findings are reported as a shakedown ranges: A,B and C. The associative stress
conditions are linked to their corresponding boundary for each shakedown range. Ranges
for shakedown can be defined as (Arnold et al., 2004):
21
Range A is the plastic shakedown range, and for this to occur the response must
show high strain rates per load cycle for a finite number of load applications
during the initial compaction period. After the compaction period the permanent
strain per load cycle decreases until the response becomes entirely resilient and no
further permanent strain occurs. This range occurs at low stress levels.
Range B is the plastic creep shakedown range, initially the behavior is similar to
Range A during the initial compaction period. After this time the permanent
strain either decreases or remains constant. For the duration of the RLT the
permanent strain is acceptable, and the response does not settle down to resilient
entirely. But in this range, if the cycles were continued excessively perhaps 2
million, the material is prone to collapse.
Range C is the incremental collapse shakedown range where initially compaction
period may be observed, which after permanent strain increase with increasing
load cycles.
These three shakedown behavior ranges were derived based simply on the fact that it is
possible to classify all permanent strain/rutting plots with number of cycles. Johnson
(1986) identified four possible shakedown ranges: elastic; elastic shakedown; plastic
shakedown. Figure 2-13 show the behavior of a UGM through increasing stress and
deformation. The elastic response is highly unlikely for granular materials, so for UGMs
the elastic response can be ignored leaving the elastic shakedown, or range A, as the first
observed behavior previously defined.

22
Figure 2. 13 Elastic/Permanent Behavior Under RLT Loading (Johnson 1996)
Now that the understanding of the components material behaviors is defined, and
the shakedown concept can adopt upper and lower bound limit theorems. For the key of
pavement design relies on the ability to prevent excessive permanent strain leading to
early failure. Thus, the shakedown concept can be used as a handy performance tool to
assess the permanent strain potential of the material: such as, the material will experience
progressive accumulation of permanent strain leading to collapse; or conversely, the
material undergoes digressive accumulation of permanent strain leading to a settling
down effect or “shakedown state.”
2.5 Modeling of Permanent Strain Behavior
2.5.1 Resilient Modeling Behavior
For the most part, the resilient behavior of UGMs has been modeled by means of
curve fitting, some models will be discussed. Another approach for characterizing the
stress strain relationship is to decompose both stresses and strains into volumetric shear
component; such models will not be discussed for they are beyond the scope of this

23
paper. Researchers use a constitutive relationship to link state of stress to resilient
modulus.
Dunlap (1963) and Monosmith (1967) suggested this relationship between modulus and
confining pressure:
푀 = 푘 휎 or 푀 = 푘 Equation 2.2
Where:
휎 = 푐표푛푓푖푛푖푛푔 푝푟푒푠푠푢푟푒
Hicks in (1970) suggested the following relationship commonly known as the
K-휃 model:
푀 = 푘 휃 Equation 2.3
where:
휃 = 푠푢푚 표푓 푝푟푖푛푐푖푝푎푙 푠푡푟푒푠푠푒푠
푘 푘 = 푟푒푔푟푒푠푠푖표푛 푐표푒푓푓푖푐푖푒푛푡푠
The simplicity of the model has made it very useful, but has mainly two drawbacks. First,
the model assumes a constant poison’s ratio. Second, the effect of stress on the resilient
modulus is accounted for solely by the sum of principal stresses. However, the model is
widely accepted and several versions can be found in literature.
Uzan (1985) included deviator stress into the K-휃 model and expressed the
relationship as:
푀 = 푘 푝 Equation 2.4
or
푀 = 푘 푝 Equation 2.5

24
where:
휃 = 푏푢푙푘 푠푡푟푒푠푠
푝 = 푎푡푚표푠푝ℎ푒푟푖푐 푝푟푒푠푠푢푟푒
푞 = 푑푒푣푖푎푡표푟푖푐 푠푡푟푒푠푠
푘 , 푘 ,푘 , = 푟푒푔푟푒푠푠푖표푛 푐표푒푓푓푖푐푖푒푛푡푠
휏 = 표푐푡푎ℎ푒푑푟푎푙 푠ℎ푒푎푟 푠푡푟푒푠푠 , replaces q for 3-dimensional state
The Uzan model has been shown to be superior to the K-휃 model and will most
likely replace it for routine analysis. For the three dimensional state, the model has been
further modified by adding a +1 term to avoid the modulus from tending to zero as 휏
tends to zero:
푀 = 푘 푝 + 1 Equation 2.6
This model was suggested for use in the determination of the resilient modulus by the
NCHRP project 1-37 “Development of the 2002 Guide for the design of New and
Rehabilitated Pavement Structures.”
Kolisoja(1997) in included the effect of material density in both the K-휃 and the
Uzan models. These are the modified models:
푀 = 퐴(푛 − 푛)푝 .
Equation 2.7
푀 = 퐵(푛 − 푛)푝 . .
Equation 2.8
where:
퐴 푎푛푑 퐵 = 푚푎푡푒푟푖푎푙 푐표푛푠푡푎푛푡푠
푛 = 푝표푟표푠푖푡푦 표푓 푡ℎ푒 푎푔푔푟푒푎푔푡푒
25
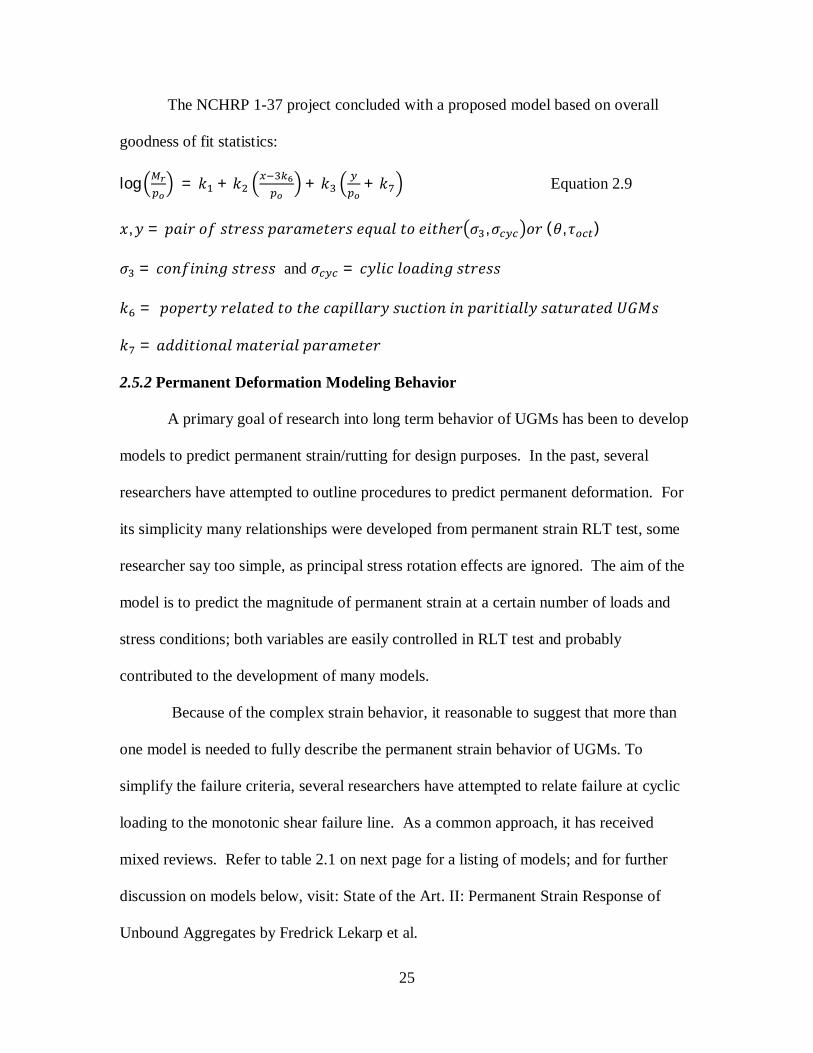
The NCHRP 1-37 project concluded with a proposed model based on overall
goodness of fit statistics:
log = 푘 + 푘 + 푘 + 푘 Equation 2.9
푥, 푦 = 푝푎푖푟 표푓 푠푡푟푒푠푠 푝푎푟푎푚푒푡푒푟푠 푒푞푢푎푙 푡표 푒푖푡ℎ푒푟 휎 ,휎 표푟 (휃, 휏 )
휎 = 푐표푛푓푖푛푖푛푔 푠푡푟푒푠푠 and 휎 = 푐푦푙푖푐 푙표푎푑푖푛푔 푠푡푟푒푠푠
푘 = 푝표푝푒푟푡푦 푟푒푙푎푡푒푑 푡표 푡ℎ푒 푐푎푝푖푙푙푎푟푦 푠푢푐푡푖표푛 푖푛 푝푎푟푖푡푖푎푙푙푦 푠푎푡푢푟푎푡푒푑 푈퐺푀푠
푘 = 푎푑푑푖푡푖표푛푎푙 푚푎푡푒푟푖푎푙 푝푎푟푎푚푒푡푒푟
2.5.2 Permanent Deformation Modeling Behavior
A primary goal of research into long term behavior of UGMs has been to develop
models to predict permanent strain/rutting for design purposes. In the past, several
researchers have attempted to outline procedures to predict permanent deformation. For
its simplicity many relationships were developed from permanent strain RLT test, some
researcher say too simple, as principal stress rotation effects are ignored. The aim of the
model is to predict the magnitude of permanent strain at a certain number of loads and
stress conditions; both variables are easily controlled in RLT test and probably
contributed to the development of many models.
Because of the complex strain behavior, it reasonable to suggest that more than
one model is needed to fully describe the permanent strain behavior of UGMs. To
simplify the failure criteria, several researchers have attempted to relate failure at cyclic
loading to the monotonic shear failure line. As a common approach, it has received
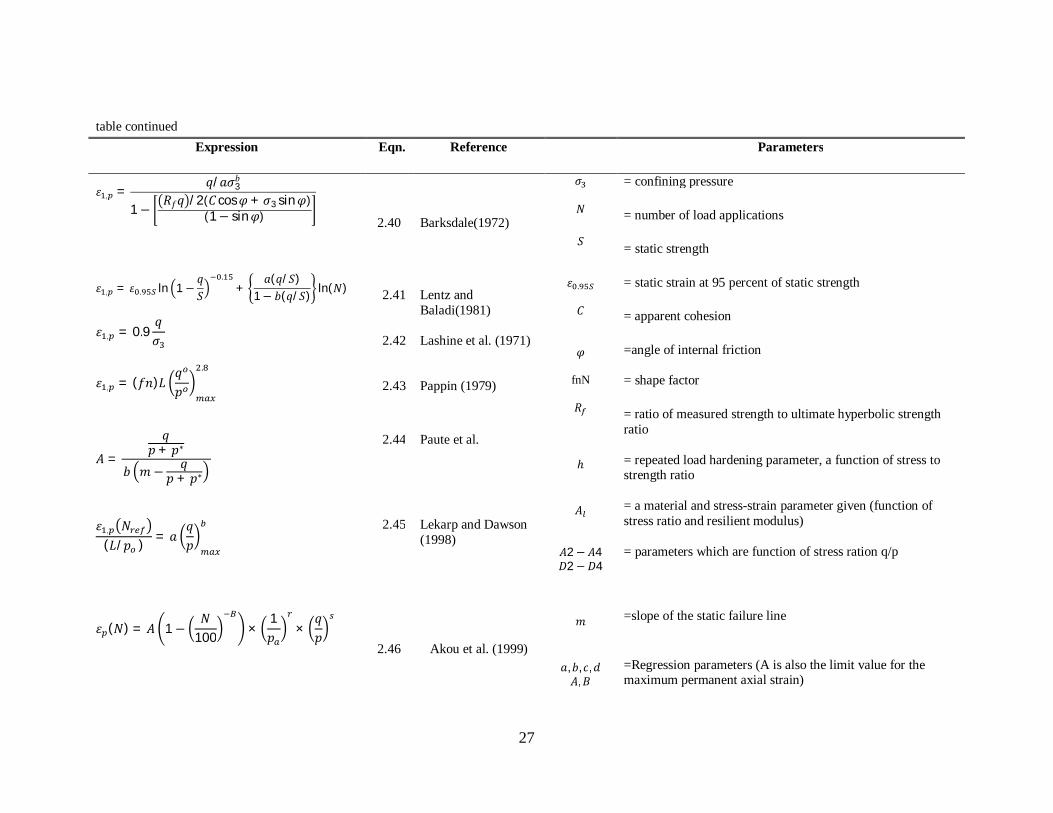
mixed reviews. Refer to table 2.1 on next page for a listing of models; and for further
discussion on models below, visit: State of the Art. II: Permanent Strain Response of
Unbound Aggregates by Fredrick Lekarp et al.

26
Table 2.1 Models proposed to Predict Permanent Strain after Lekarp et. al. 2000
Expression Eqn. Reference Parameters
휀 , = 푎휀 푁
2.30 Ververka (1979) 휀 ,
휀∗ ,
휀∗ , 푁
휀 ,
휀 ,
휀
휀
휀
퐾
퐺
푞
푝
푞
푝
푝∗
푝
퐿
= accumulated permanent strain after 푁 load cycles = additional permanent axial strain after first 100 cycles = accumalated permanent axial strain after a given number of load cycles 푁 ,푁 > 100 = permanent volumetric strain for 푁 > 100 = permanent shear strain for 푁 > 100 = permanent strain for load cycle 푁 = permanent strain for first load = resilient strain = bulk modulus with respect to permanent deformation = shear modulus with respect to permanent deformation = deviator stress = mean normal stress = modified deviator stress = 2/3 q = modified mean normal stress = √3 p = stress parameter defined by intersection of the static failure line = reference stress = stress path Length
퐾 (푁) = 푃
휀 , ( ) ,퐺 (푁) =
푞3휀 , (푁)
2.31
퐺 = 퐴 √푁
√푁 + 퐷 ,퐺퐾 =
퐴 √푁√푁 + 퐷
2.32
Jouve et al. (1987)
휀 ,
푁 = 퐴푁
2.33 Khedr (1985)
휀 , = 푎 + 푏 log푁
2.34 Barksdale (1972)
휀 , = 푎푁
2.35 Sweere (1990)
휀 , = (푐푁 + 푎)(1 − 푒 )
2.36 Wolff&Visser(1984)
휀∗ , = 퐴 √푁
√푁 + 퐷
2.37 Paute et al. (1998)
휀∗ , = 퐴 1−푁
100
2.38 Paute et al. (1996)
휀∗ , = 휀 =1푁 휀 2.39 Bonaquist &Witczak
(1987)
27
table continued Expression Eqn. Reference Parameters
휀 , =푞/푎휎3
푏
1−푅푓푞 /2(퐶cos휑+ 휎3 sin휑)
(1− sin휑)
2.40 Barksdale(1972)
휎
푁
푆
휀 .
퐶
휑
fnN
푅
ℎ 퐴
퐴2−퐴4 퐷2−퐷4
푚
푎, 푏, 푐,푑 퐴,퐵
= confining pressure = number of load applications = static strength = static strain at 95 percent of static strength = apparent cohesion =angle of internal friction = shape factor = ratio of measured strength to ultimate hyperbolic strength ratio = repeated load hardening parameter, a function of stress to strength ratio = a material and stress-strain parameter given (function of stress ratio and resilient modulus) = parameters which are function of stress ration q/p =slope of the static failure line =Regression parameters (A is also the limit value for the maximum permanent axial strain)
휀 , = 휀 . ln 1−푞푆
.+
푎(푞/푆)1− 푏(푞/푆) ln(푁)
2.41
Lentz and Baladi(1981)
휀 , = 0.9푞휎
2.42
Lashine et al. (1971)
휀 , = (푓푛)퐿푞푝
.
2.43
Pappin (1979)
퐴 =
푞푝+ 푝∗
푏 푚− 푞푝 + 푝∗
2.44 Paute et al.
휀 , 푁(퐿/푝 )
= 푎푞푝
2.45 Lekarp and Dawson (1998)
휀 (푁) = 퐴 1−푁
100 ×1푝 ×
푞푝
2.46 Akou et al. (1999)

28
CHAPTER 3 METHODOLGY
This chapter includes a description of the research methodology used in this
study. The chapter outlines detailed information about the physical properties and
experimental testing.
3.1 Experimental Testing Program
An experimental testing program was performed on three types of unbound
granular materials used in construction of base course layers. The tested materials
included: limestone, sandstone, and granite materials. All materials were selected from
1.5 inch sieve crushed run materials provided by the appropriate quarries. Different
laboratory tests were first conducted to screen the physical properties that are typically
used in the selection and evaluation of base course material. The performed test included
sieve analysis (ASTM C136-06), Standard Proctor (ASTM D 792), specific gravity and
absorption, and coarse aggregate angularity (ASTM D 5821). Materials were sampled in
accordance with ASTM C702 .In addition, Micro-Deval (ASTM D 6928) test were
conducted to examine particle degradation of the considered material.
Tri-axial tests were conducted used in this study to characterize the shear strength
properties of base course granular materials in their field construction conditions and
examine their response under cyclic loading. To do this, two types of tri-axial test were
employed: static tri-axial test compression test (SCT) and repeated load tri-axial testing
(RLT). The triaxial tests conducted in this study are described below.
3.2 Testing Setup of Triaxial Tests All triaxial tests were performed using the Material Testing System (MTS) 810 machine
(Figure 3.1) with a closed loop and a servo hydraulic loading system. The

29
applied load was measured using a load cell installed inside the triaxial cell. This type of
set up reduces the equipment compliance errs as well as the alignment errors. The
capacity of the load cell used was ± 22.25 kN. The axial displacement measurements
were made using two Linearly Variable Differential Transducers (LVDT) placed between
the top platen and base of the cell to reduce the amount of extraneous axial deformation
measured compared to external LVDTs. Air was used as the confining fluid to the
specimens. Figure 3.1 illustrates the testing setup.
Figure 3. 1 MTS Tri-axial Testing Machine
30
3.3 Sample Preparation
AASHTO-T307 recommends that a split mold be used for compaction of granular
materials. Therefore, all samples were prepared using a split mold with an inner diameter
of 150 mm and a height of 350 mm. The material was first oven dried at a pre-specified
temperature and then mixed with water at the specified moisture content. The achieved
water contents were within ±0.5 percent of the target value. For single-stage RLT test and
static shear strength test, the material was placed within the split mold and compacted
using a vibratory compaction device to achieve the prescribed dry density determined
from the standard Proctor test. For the multi-stage samples utilized for shakedown the
target moisture content was varied on the wet and dry side of optimum moisture content
and then vibratory compacted to maximum to max dry density as determined from
standard proctor test. To achieve a uniform compaction throughout the thickness, samples
were compacted in six-50 mm layers. Each layer was compacted until the required
density was obtained; this was done by measuring the distance from the top of the mold
to the top of the compacted layer. The smooth surface on top of the layer was lightly
scratched to achieve good bonding with the next layer. The achieved dry densities of the
prepared samples were within ±1 percent of the target value. Samples were enclosed in
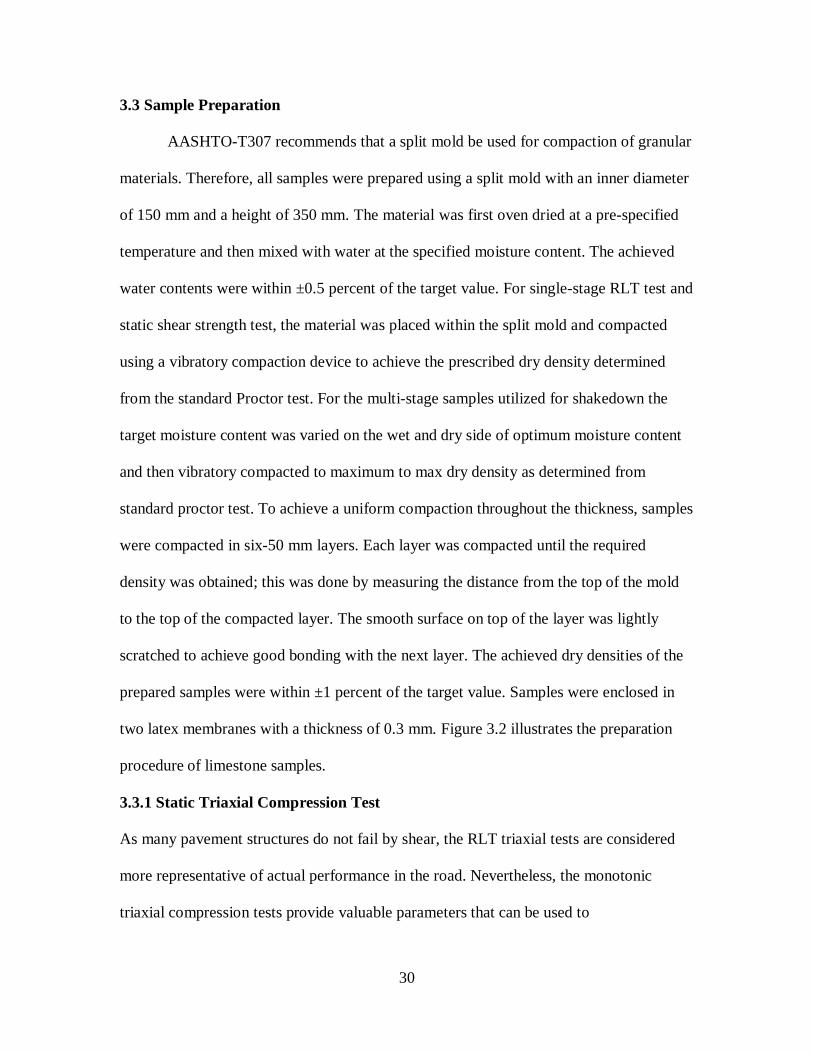
two latex membranes with a thickness of 0.3 mm. Figure 3.2 illustrates the preparation
procedure of limestone samples.
3.3.1 Static Triaxial Compression Test
As many pavement structures do not fail by shear, the RLT triaxial tests are considered
more representative of actual performance in the road. Nevertheless, the monotonic
triaxial compression tests provide valuable parameters that can be used to

31
evaluate strength and stiffness of pavement materials. Furthermore, it is commonly
thought that safe stress states for a pavement material are related to their ultimate shear
strength.
Drained triaxial compression tests were first performed to obtain the shear strength
properties of the different materials considered. The triaxial compression tests were
performed at three different confining pressures: 2, 7 and 10 psi (14, 48, and 69 kPa
Figure 3. 2 Preparation of Testing Limestone Samples

32
respectively). The strain rate used in those tests was less than ten percent strain per hour
to ensure that no excess pore water pressure developed during testing. Two response
parameters were recorded for each static triaxial test: ultimate shear strength (USS) and
residual shear strength (RSS).
3.3.2 Sample Size
Dimensions of the sample tested in the triaxial experiment are based on the
maximum particle size of its material. AASHTO recommends that for untreated granular
base material, the tested sample should have a diameter greater than five times the
maximum particle size of that material. In addition, other studies recommend the use of
samples with 6 in (150 mm) and diameter 12 in (300 mm ) height for a base material with
a maximum particle size greater than .75 in (19 mm) (NCHRP, 2004). Since the base
course material used in this study had a maximum particle size of .75 in, all samples were
prepared with 6 in diameter and 12 in height.
3.4 Repeated Load Triaxial (RLT) Tests
RLT tests were conducted to determine the properties of granular materials under
repeated loading that significantly influence the structural response and performance of
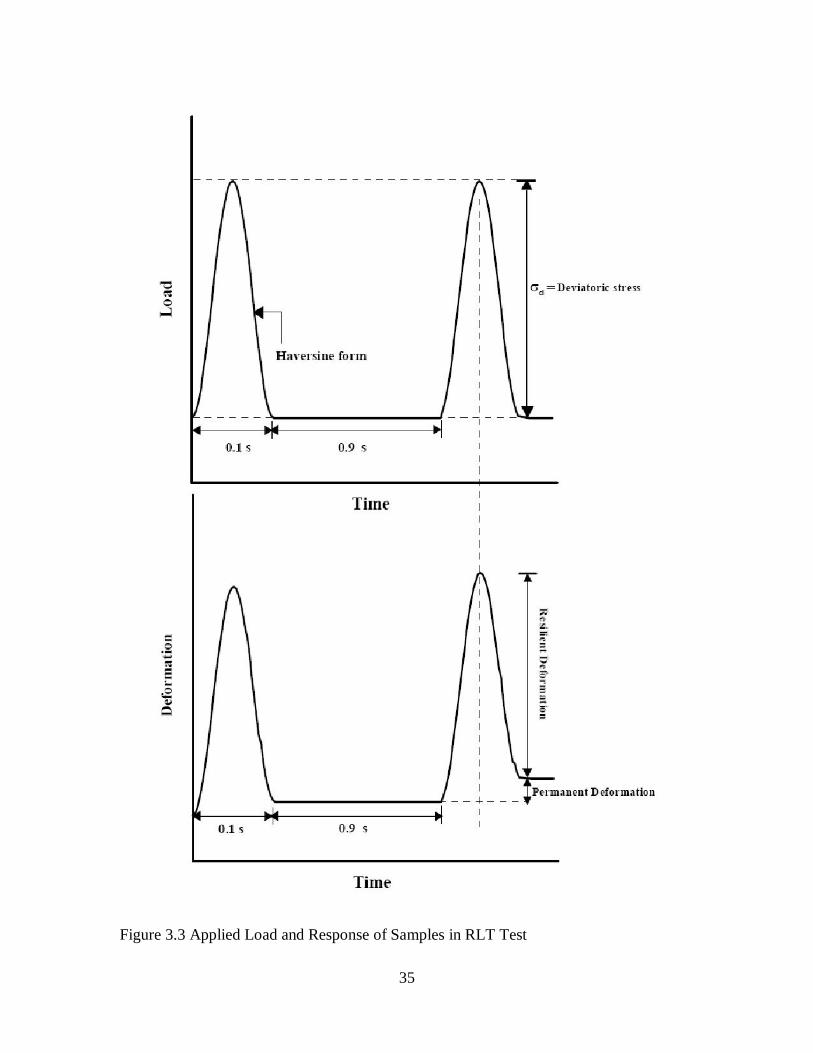
base course layers under traffic loading. In these tests, a repeated axial cyclic stress with
a haversine-shaped load-pulse and fixed magnitude was applied to 6 in diameter
cylindrical samples. The load pulse used in this study has 0.1 sec load duration and 0.9
sec rest period as shown in Figure 3.3. The resilient and permanent deformations (Figure
3.3) of the samples were measured during this test to calculate the resilient and plastic
strains, respectively. During a RLT test, cyclic deviator and confining stresses along with
vertical deformations were recorded. The difference between the maximum and
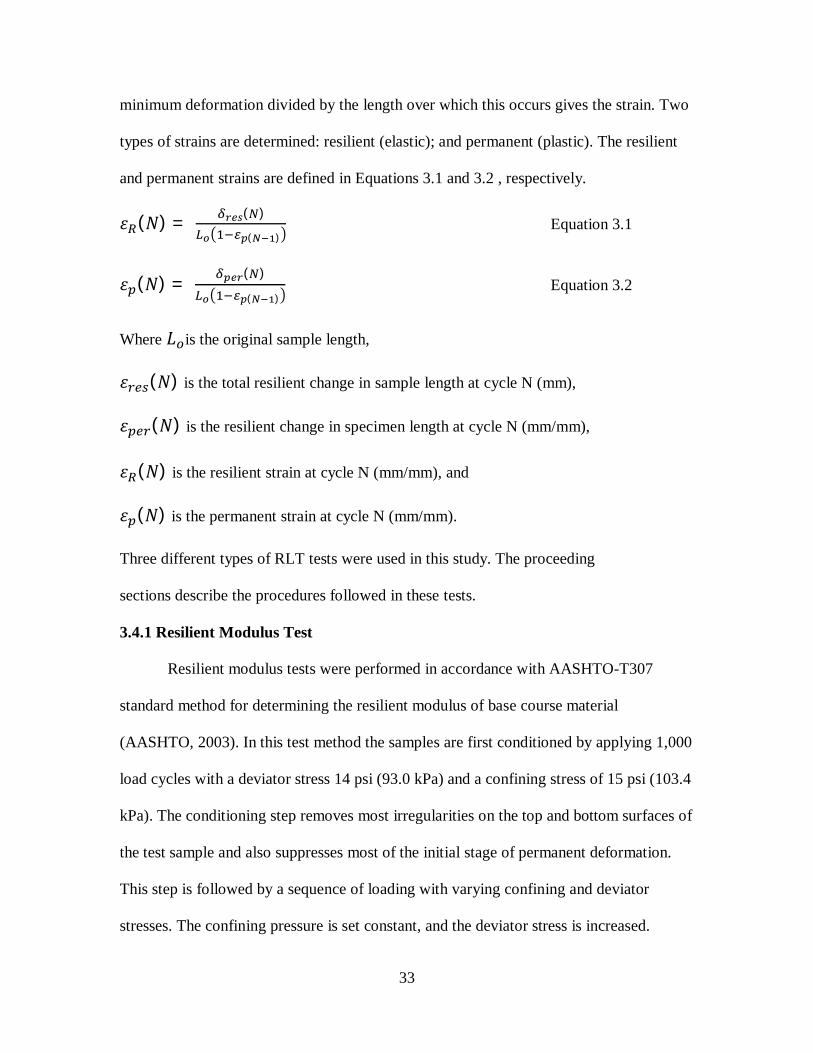
33
minimum deformation divided by the length over which this occurs gives the strain. Two
types of strains are determined: resilient (elastic); and permanent (plastic). The resilient
and permanent strains are defined in Equations 3.1 and 3.2 , respectively.
휀 (푁) = ( )
( ) Equation 3.1
휀 (푁) = ( )
( ) Equation 3.2
Where 퐿 is the original sample length,
휀 (푁) is the total resilient change in sample length at cycle N (mm),
휀 (푁) is the resilient change in specimen length at cycle N (mm/mm),
휀 (푁) is the resilient strain at cycle N (mm/mm), and
휀 (푁) is the permanent strain at cycle N (mm/mm).
Three different types of RLT tests were used in this study. The proceeding
sections describe the procedures followed in these tests.
3.4.1 Resilient Modulus Test
Resilient modulus tests were performed in accordance with AASHTO-T307
standard method for determining the resilient modulus of base course material
(AASHTO, 2003). In this test method the samples are first conditioned by applying 1,000
load cycles with a deviator stress 14 psi (93.0 kPa) and a confining stress of 15 psi (103.4
kPa). The conditioning step removes most irregularities on the top and bottom surfaces of
the test sample and also suppresses most of the initial stage of permanent deformation.
This step is followed by a sequence of loading with varying confining and deviator
stresses. The confining pressure is set constant, and the deviator stress is increased.
34
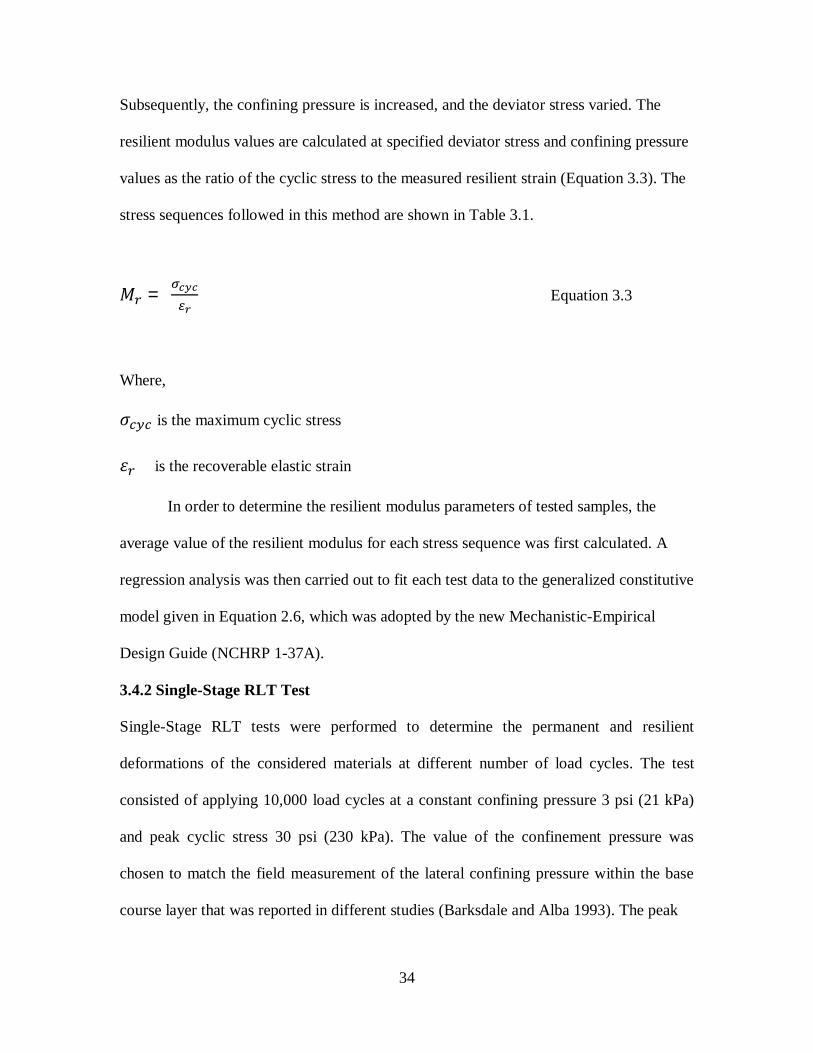
Subsequently, the confining pressure is increased, and the deviator stress varied. The
resilient modulus values are calculated at specified deviator stress and confining pressure
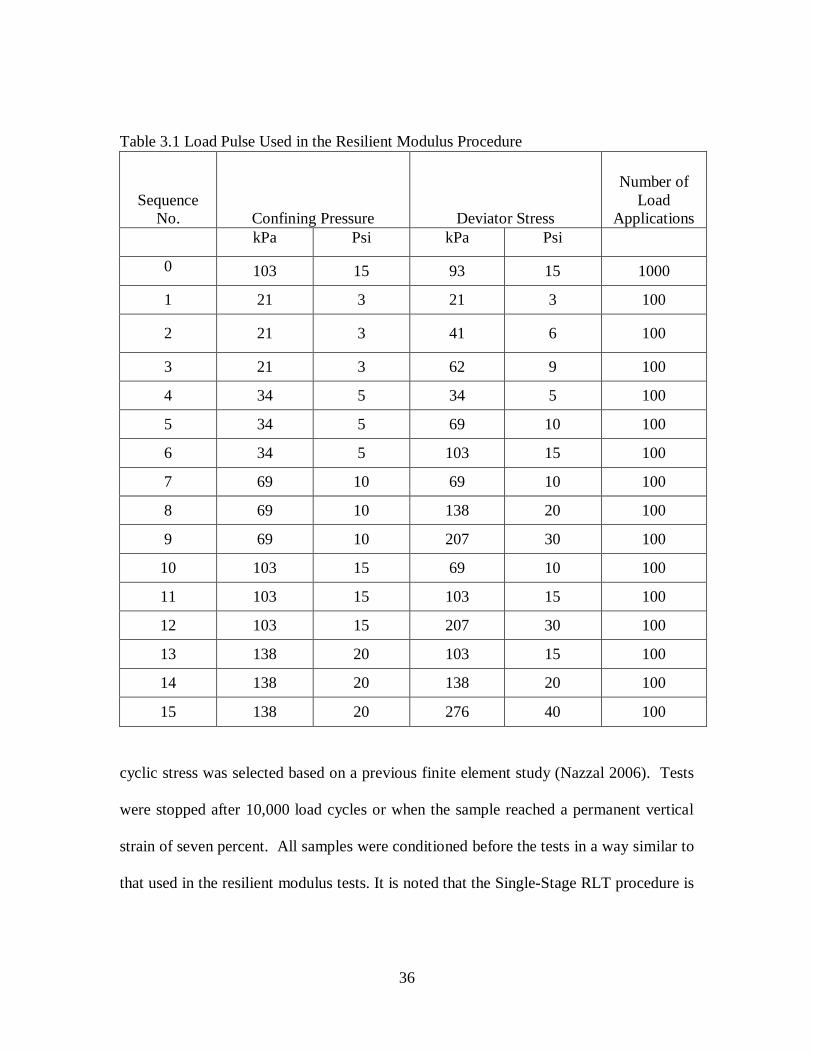
values as the ratio of the cyclic stress to the measured resilient strain (Equation 3.3). The
stress sequences followed in this method are shown in Table 3.1.
푀 = Equation 3.3
Where,
휎 is the maximum cyclic stress
휀 is the recoverable elastic strain
In order to determine the resilient modulus parameters of tested samples, the
average value of the resilient modulus for each stress sequence was first calculated. A
regression analysis was then carried out to fit each test data to the generalized constitutive
model given in Equation 2.6, which was adopted by the new Mechanistic-Empirical
Design Guide (NCHRP 1-37A).
3.4.2 Single-Stage RLT Test Single-Stage RLT tests were performed to determine the permanent and resilient
deformations of the considered materials at different number of load cycles. The test
consisted of applying 10,000 load cycles at a constant confining pressure 3 psi (21 kPa)
and peak cyclic stress 30 psi (230 kPa). The value of the confinement pressure was
chosen to match the field measurement of the lateral confining pressure within the base
course layer that was reported in different studies (Barksdale and Alba 1993). The peak
35
Figure 3.3 Applied Load and Response of Samples in RLT Test
36
Table 3.1 Load Pulse Used in the Resilient Modulus Procedure
cyclic stress was selected based on a previous finite element study (Nazzal 2006). Tests
were stopped after 10,000 load cycles or when the sample reached a permanent vertical
strain of seven percent. All samples were conditioned before the tests in a way similar to
that used in the resilient modulus tests. It is noted that the Single-Stage RLT procedure is
Sequence No. Confining Pressure Deviator Stress
Number of Load
Applications
kPa Psi kPa Psi 0
103 15 93 15 1000
1 21 3 21 3 100
2 21 3 41 6 100
3 21 3 62 9 100
4 34 5 34 5 100
5 34 5 69 10 100
6 34 5 103 15 100
7 69 10 69 10 100
8 69 10 138 20 100
9 69 10 207 30 100
10 103 15 69 10 100
11 103 15 103 15 100
12 103 15 207 30 100
13 138 20 103 15 100
14 138 20 138 20 100
15 138 20 276 40 100

37
similar to those followed in previous studies (Mohammad et. al. 2006; Nazzal et. al
2007).
3.4.3 Multi-Stage RLT Test
Multi-stage RLT tests were used in this study to determine the cyclic behavior of
the considered materials at different stress levels. The multi-stage testing was conducted
by increasing the vertical cyclic stress at each stage, while maintaining the cell pressure
constant. Maintaining cell pressure constant is common in many RLT standards such as
US AASHTO T 307-99 and Australia’s AG: PT/T053. Multi-stage RLT test included six
stages, with a gradually increasing of q/p ratio [q- deviatoric stress equal to 1-3; and p-
mean confining pressure equal to (1+2*3)/3] applied to the sample such that the stress
level moves closer (or above) the static failure line. During each stage 10,000 load cycles
of the same stress level were applied. Each cycle consisted of the same load pulse used in
single-stage RLT tests. Samples were compacted at optimum moisture content, and tested
at the confining stress of 3 psi (21 kPa) which was used in the single-stage RLT test. To
determine shakedown limits, additional multi-stage test were conducted at 6.5 psi (45
kPa) and 10 psi (70 kPa) for limestone and sandstone. Carrying further the application of
shakedown limits to UGMs, multi-stage testing was conducted on limestone and
sandstone at dry and wet of optimum moisture content. Using the void ratio at optimum
moisture content, the saturation ratio was calculated using equation 3.4. Next, the
moisture contents for wet and dry were obtained by shifting the degree of saturation by
an amount that would be encountered in Louisiana to reflect typical seasonal conditions,
allowing calculation of moisture contents at those moisture regime conditions, again by
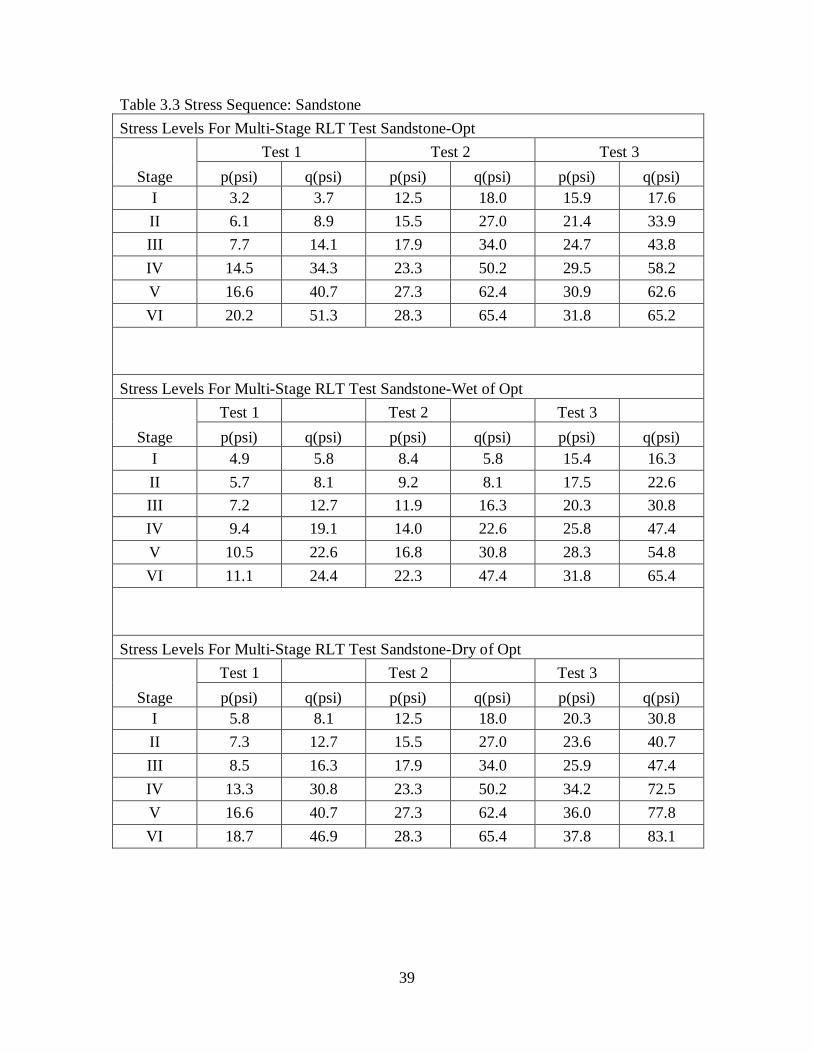
using eq. 3.4. Results are listed in table 3.4. Following this table are the p and q loading
38
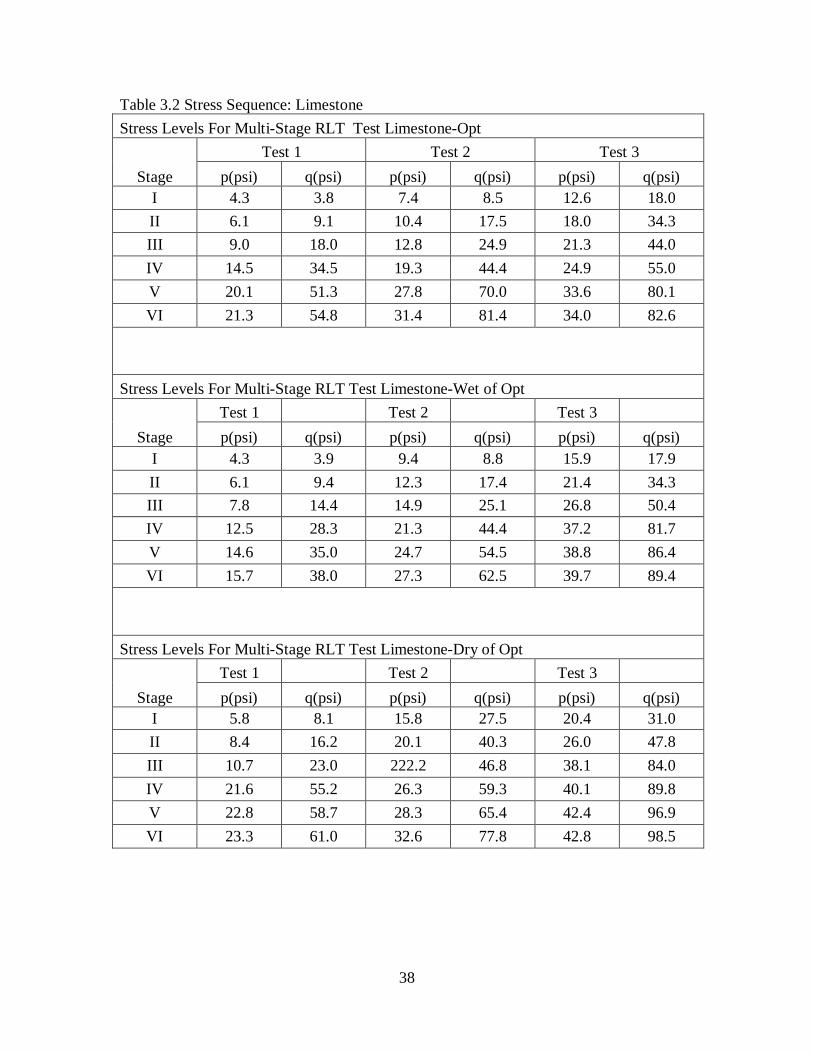
Table 3.2 Stress Sequence: Limestone Stress Levels For Multi-Stage RLT Test Limestone-Opt
Stage Test 1 Test 2 Test 3
p(psi) q(psi) p(psi) q(psi) p(psi) q(psi) I 4.3 3.8 7.4 8.5 12.6 18.0 II 6.1 9.1 10.4 17.5 18.0 34.3 III 9.0 18.0 12.8 24.9 21.3 44.0 IV 14.5 34.5 19.3 44.4 24.9 55.0 V 20.1 51.3 27.8 70.0 33.6 80.1 VI 21.3 54.8 31.4 81.4 34.0 82.6
Stress Levels For Multi-Stage RLT Test Limestone-Wet of Opt
Stage Test 1 Test 2 Test 3 p(psi) q(psi) p(psi) q(psi) p(psi) q(psi)
I 4.3 3.9 9.4 8.8 15.9 17.9 II 6.1 9.4 12.3 17.4 21.4 34.3 III 7.8 14.4 14.9 25.1 26.8 50.4 IV 12.5 28.3 21.3 44.4 37.2 81.7 V 14.6 35.0 24.7 54.5 38.8 86.4 VI 15.7 38.0 27.3 62.5 39.7 89.4
Stress Levels For Multi-Stage RLT Test Limestone-Dry of Opt
Stage Test 1 Test 2 Test 3 p(psi) q(psi) p(psi) q(psi) p(psi) q(psi)
I 5.8 8.1 15.8 27.5 20.4 31.0 II 8.4 16.2 20.1 40.3 26.0 47.8 III 10.7 23.0 222.2 46.8 38.1 84.0 IV 21.6 55.2 26.3 59.3 40.1 89.8 V 22.8 58.7 28.3 65.4 42.4 96.9 VI 23.3 61.0 32.6 77.8 42.8 98.5
39
Table 3.3 Stress Sequence: Sandstone Stress Levels For Multi-Stage RLT Test Sandstone-Opt
Stage Test 1 Test 2 Test 3
p(psi) q(psi) p(psi) q(psi) p(psi) q(psi) I 3.2 3.7 12.5 18.0 15.9 17.6 II 6.1 8.9 15.5 27.0 21.4 33.9 III 7.7 14.1 17.9 34.0 24.7 43.8 IV 14.5 34.3 23.3 50.2 29.5 58.2 V 16.6 40.7 27.3 62.4 30.9 62.6 VI 20.2 51.3 28.3 65.4 31.8 65.2
Stress Levels For Multi-Stage RLT Test Sandstone-Wet of Opt
Stage Test 1 Test 2 Test 3 p(psi) q(psi) p(psi) q(psi) p(psi) q(psi)
I 4.9 5.8 8.4 5.8 15.4 16.3 II 5.7 8.1 9.2 8.1 17.5 22.6 III 7.2 12.7 11.9 16.3 20.3 30.8 IV 9.4 19.1 14.0 22.6 25.8 47.4 V 10.5 22.6 16.8 30.8 28.3 54.8 VI 11.1 24.4 22.3 47.4 31.8 65.4
Stress Levels For Multi-Stage RLT Test Sandstone-Dry of Opt
Stage Test 1 Test 2 Test 3 p(psi) q(psi) p(psi) q(psi) p(psi) q(psi)
I 5.8 8.1 12.5 18.0 20.3 30.8 II 7.3 12.7 15.5 27.0 23.6 40.7 III 8.5 16.3 17.9 34.0 25.9 47.4 IV 13.3 30.8 23.3 50.2 34.2 72.5 V 16.6 40.7 27.3 62.4 36.0 77.8 VI 18.7 46.9 28.3 65.4 37.8 83.1
40
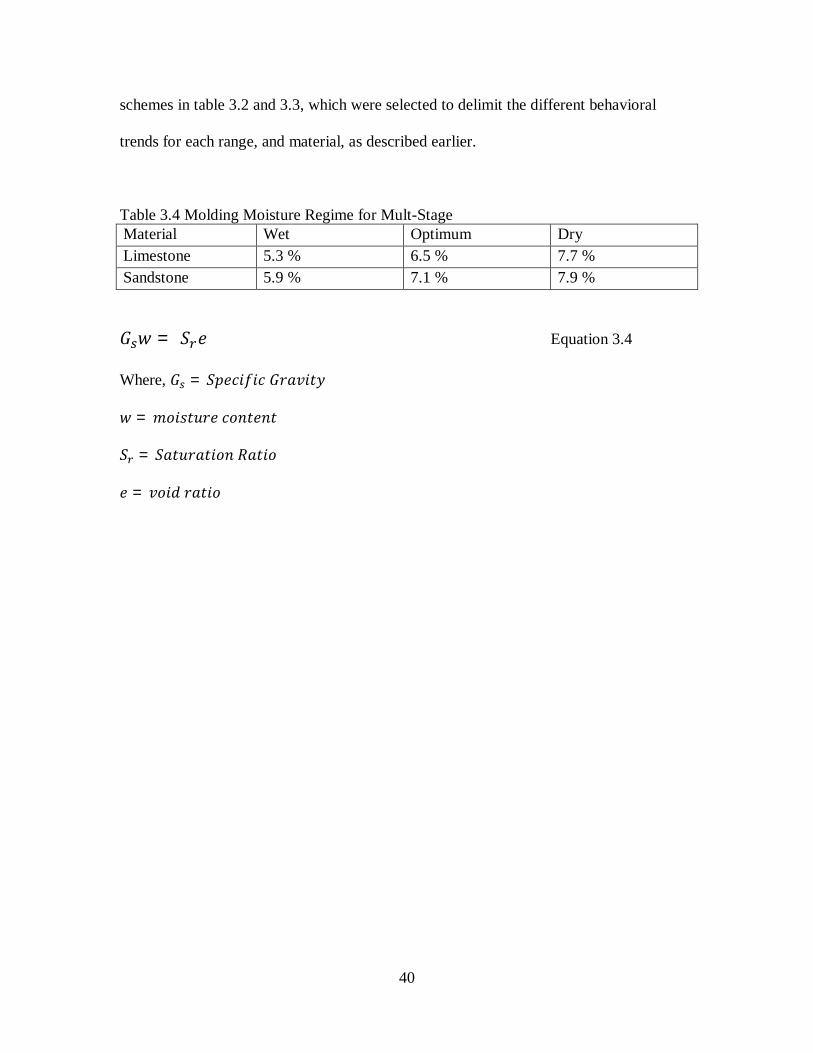
schemes in table 3.2 and 3.3, which were selected to delimit the different behavioral
trends for each range, and material, as described earlier.
Table 3.4 Molding Moisture Regime for Mult-Stage Material Wet Optimum Dry Limestone 5.3 % 6.5 % 7.7 % Sandstone 5.9 % 7.1 % 7.9 %
퐺 푤 = 푆 푒 Equation 3.4
Where, 퐺 = 푆푝푒푐푖푓푖푐 퐺푟푎푣푖푡푦
푤 = 푚표푖푠푡푢푟푒 푐표푛푡푒푛푡
푆 = 푆푎푡푢푟푎푡푖표푛 푅푎푡푖표
푒 = 푣표푖푑 푟푎푡푖표

41
CHAPTER 4 ANALYSIS OF RESULTS
This chapter presents the results of the experimental testing program that was
conducted to evaluate physical properties and to characterize the behavior of the course
materials under static as well as cyclic loading.
4.1 Physical Properties Test Results
Figure 4.1 shows the gradation obtained from the sieve analysis and hydrometer
tests for the considered materials, while Table 4.1 present a summary of the physical
properties test conducted on those materials. It is noted that all materials had the same
maximum nominal aggregate size of 25 mm. Furthermore, they were classified as A-1-b
and GW/sand according to the American Association of State Highway and
Transportation (AASHTO) classification system, and the Unified Soil Classification
System (USCS), respectively. However, there were some differences between the
materials in the percent of fines passing sieve size 0.075 mm, such that the granite had
lowest percentage of about 5, while the crushed lime stone had the highest percentage of
13.5. The gradation of the three materials considered was further evaluated using the
power-law method suggested by Ruth et al. (2002) . The power-law shown in Equation
4.1 characterizes the slope and the intercept constants of the coarse and fine aggregate
portions of the aggregate gradations. The divider sieve between the coarse and fine
aggregate used in the power law analysis was chosen to be 4.75 mm (No.4) sieve. Table
4.1 presents the power law gradation parameters for all the aggregate structures in this
study. It is noted that the granite had the highest nCa coefficient, followed by the
sandstone, then the crushed limestone. This indicates that the granite had the coarsest
gradation followed by the sandstone. However, the nfa value of the all materials was

42
similar. It is noted that a higher nfa value indicates that the fine portion of an aggregate
gradation is finer.
P = a (d) and P = a (d) Equation 4.1
Where,
PCA and PFA = percent by weight passing a given sieve that has an opening of width d
aCA = intercept constant for the coarse aggregate
nCA = slope (exponent) constant for the coarse
d = sieve opening width, mm
aFA = intercept constant for the fine aggregate
nFA = slope (exponent) for the fine aggregates
Figure 4. 1 Particle Size Distribution of Tested Aggregates
Table 4.1 shows that the considered aggregate had absorption values ranging from
0.9 to 2.1 percent. Furthermore, the table shows that the considered aggregates had a low
percentage of loss in the Micro-Deval test; however the granite had the lowest value of
0102030405060708090
100
0.01 0.1 1 10 100
Particle size (mm)
Perc
ent F
iner
LimestoneSandstoneGranite
43
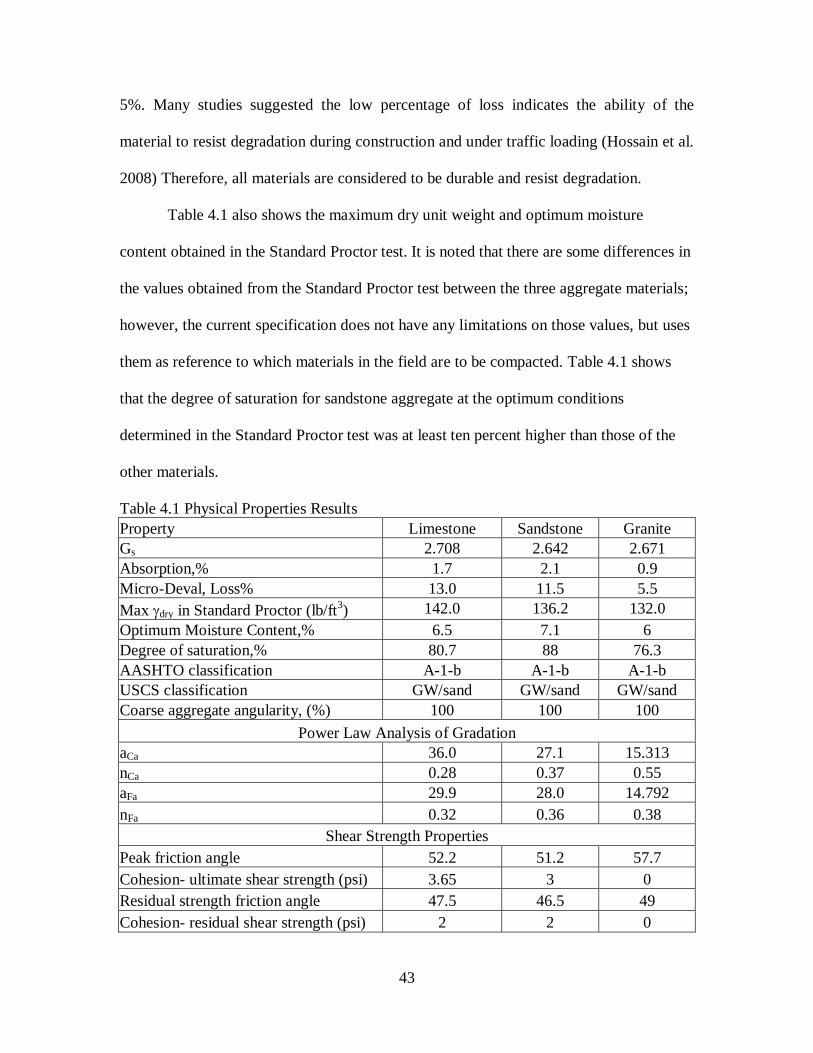
5%. Many studies suggested the low percentage of loss indicates the ability of the
material to resist degradation during construction and under traffic loading (Hossain et al.
2008) Therefore, all materials are considered to be durable and resist degradation.
Table 4.1 also shows the maximum dry unit weight and optimum moisture
content obtained in the Standard Proctor test. It is noted that there are some differences in
the values obtained from the Standard Proctor test between the three aggregate materials;
however, the current specification does not have any limitations on those values, but uses
them as reference to which materials in the field are to be compacted. Table 4.1 shows
that the degree of saturation for sandstone aggregate at the optimum conditions
determined in the Standard Proctor test was at least ten percent higher than those of the
other materials.
Table 4.1 Physical Properties Results Property Limestone Sandstone Granite Gs 2.708 2.642 2.671 Absorption,% 1.7 2.1 0.9 Micro-Deval, Loss% 13.0 11.5 5.5 Max dry in Standard Proctor (lb/ft3) 142.0 136.2 132.0 Optimum Moisture Content,% 6.5 7.1 6 Degree of saturation,% 80.7 88 76.3 AASHTO classification A-1-b A-1-b A-1-b USCS classification GW/sand GW/sand GW/sand Coarse aggregate angularity, (%) 100 100 100
Power Law Analysis of Gradation aCa 36.0 27.1 15.313 nCa 0.28 0.37 0.55 aFa 29.9 28.0 14.792 nFa 0.32 0.36 0.38
Shear Strength Properties Peak friction angle 52.2 51.2 57.7 Cohesion- ultimate shear strength (psi) 3.65 3 0 Residual strength friction angle 47.5 46.5 49 Cohesion- residual shear strength (psi) 2 2 0

44
4.2 Static Triaxial Tests Results
Drained triaxial compression tests were on granite, limestone and sandstone
samples. The achieved dry unit weight and moisture content of the tested samples were
close to those specified in the field for construction of UGM base course layers in
Louisiana, which specifies that the materials should be mixed at the optimum moisture
content and compacted to 95% of the maximum dry unit weight as determined in
standard Proctor test. Figure 4.1 through Figure 4.3 present the average stress-strain
curves obtained from the drained triaxial compression tests conducted on three samples
for each material. The figures show that at the tested confining pressures and dry unit
weight the samples behaves as a loose granular material, such that they exhibit an
increase in shear strength with increasing strain, which is referred to as strain hardening,
and eventually reached peaked strain level ranging from 2- 4%.
Figure 4. 2 Stress-Strain Curves for Granite Static Compression Test
0
10
20
30
40
50
60
70
80
90
100
0 2 4 6 8 10 12
Axial Strain %
Axial Stress psi
10 psi
7 psi
2 psi

45
Figure 4. 3 Stress-Strain Curves for Limestone Static Compression Test
Figure 4. 4 Stress-Strain Curves for Sandstone Static Compression Test
0
10
20
30
40
50
60
70
80
90
100
0 2 4 6 8 10 12
Axial Strain %
Axial Stress psi
10 psi
7 psi
2 psi
0
10
20
30
40
50
60
70
80
0 1 2 3 4 5 6 7 8 9
Axial Strain %
Axial Stress psi
10 psi
7 psi
2 psi

46
The results of the triaxial compression tests conducted on the different considered
materials were used to obtain the ultimate and residual (critical state) shear strength at
each of the three confining stresses used in this study. To determine the friction angle, the
slope of the line (M) that best fits each set of data in q-p space was found for each
material. The ultimate and residual strength in p-q space are represented below in Figures
4.5 and 4.6. Equations 4.1 and 4.2 were then employed to determine the corresponding
friction angle. The computed friction angles are shown Table 1. It is noted that granite
had the highest peak and residual shear strength friction angle followed by the crushed
limestone. Furthermore, the granite material did not have any cohesion, which may be
explained by the low percentage of fines that this material has.
Figure 4. 5 Ultimate Shear Strength in p-q space
4.3 Repeated Load Tri-axial Testing
The average value of the resilient modulus for the last ten cycles of each stress sequence
was first calculated from each of the resilient modulus test results; a regression analysis
Ultimate Shear Strength q-p space
0.0
10.0
20.0
30.0
40.0
50.0
60.0
70.0
80.0
90.0
100.0
0.0 5.0 10.0 15.0 20.0 25.0 30.0 35.0 40.0
p, psi
q, psi
Granite
Limestone
Sandstone
M =q/p
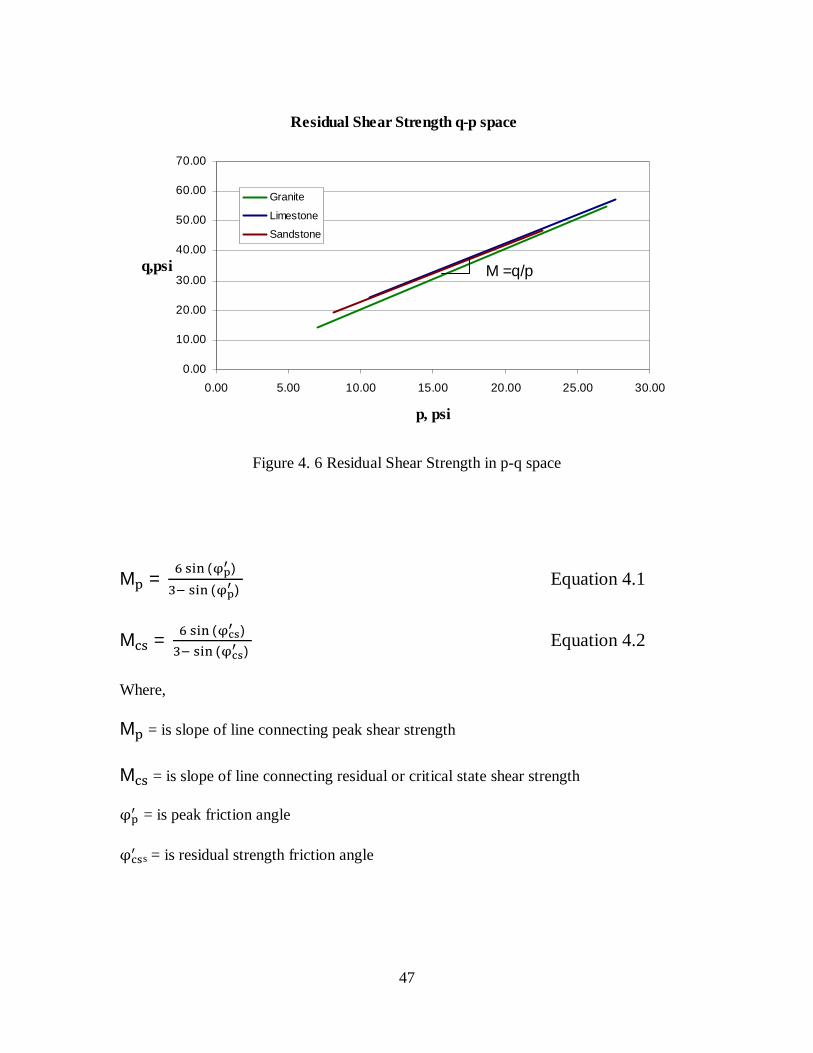
47
Figure 4. 6 Residual Shear Strength in p-q space
M = ( ) ( )
Equation 4.1
M = ( ) ( )
Equation 4.2
Where,
M = is slope of line connecting peak shear strength
M = is slope of line connecting residual or critical state shear strength φ = is peak friction angle φ s = is residual strength friction angle
Residual Shear Strength q-p space
0.00
10.00
20.00
30.00
40.00
50.00
60.00
70.00
0.00 5.00 10.00 15.00 20.00 25.00 30.00
p, psi
q,psi
Granite
Limestone
Sandstone
M =q/p
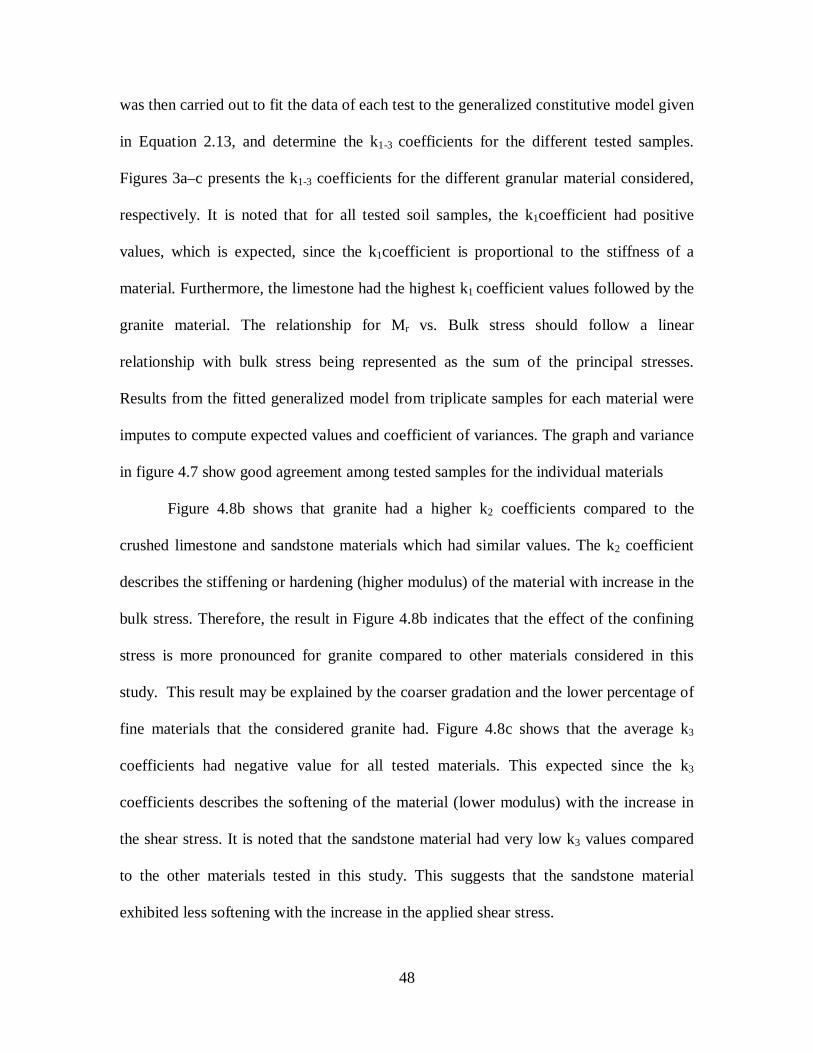
48
was then carried out to fit the data of each test to the generalized constitutive model given
in Equation 2.13, and determine the k1-3 coefficients for the different tested samples.
Figures 3a–c presents the k1-3 coefficients for the different granular material considered,
respectively. It is noted that for all tested soil samples, the k1coefficient had positive
values, which is expected, since the k1coefficient is proportional to the stiffness of a
material. Furthermore, the limestone had the highest k1 coefficient values followed by the
granite material. The relationship for Mr vs. Bulk stress should follow a linear
relationship with bulk stress being represented as the sum of the principal stresses.
Results from the fitted generalized model from triplicate samples for each material were
imputes to compute expected values and coefficient of variances. The graph and variance
in figure 4.7 show good agreement among tested samples for the individual materials
Figure 4.8b shows that granite had a higher k2 coefficients compared to the
crushed limestone and sandstone materials which had similar values. The k2 coefficient
describes the stiffening or hardening (higher modulus) of the material with increase in the
bulk stress. Therefore, the result in Figure 4.8b indicates that the effect of the confining
stress is more pronounced for granite compared to other materials considered in this
study. This result may be explained by the coarser gradation and the lower percentage of
fine materials that the considered granite had. Figure 4.8c shows that the average k3
coefficients had negative value for all tested materials. This expected since the k3
coefficients describes the softening of the material (lower modulus) with the increase in
the shear stress. It is noted that the sandstone material had very low k3 values compared
to the other materials tested in this study. This suggests that the sandstone material
exhibited less softening with the increase in the applied shear stress.

49
Figure 4. 7 Resilient Modulus vs. Bulk Stress
Figure 4. 8 Resilient Modulus Coefficients of Tested Materials: a) k1 b) k2 c) k3
0
10000
20000
30000
40000
50000
60000
70000
80000
0.0 20.0 40.0 60.0 80.0 100.0 120.0Bulk Stess , psi
Mr,
psi
SandStoneKenGranite
%CV k1 k2 k3 Sandstone 15.2 4.6 15.2 Limestone 2.8 2.3 11.5 Granite 9.4 11.7 8.7
a.
0
400
800
1200
1600
2000
Limestone Sandstone Granite
k1 (p
si)

50
Figure continued 4.3.1 Single-Stage RLT Test Results-Resilient Strain
Figure 4.9a presents the average vertical resilient strain curves obtained from the
results of the single stage RLT test that were conducted on the three types of base course
materials investigated in this study. The resilient strain had a similar trend in all
materials, such that it initially increased, then decreased as the number of load cycles
increased until reaching an asymptote at about 6,000 load cycles, and hence reaching a
steady resilient response. The reason for this behavior is that during the primary post
compaction stage, the sample accumulates more deviatoric strain in the horizontal
b.
00.10.20.30.40.50.60.70.80.9
Limestone Sandstone Granite
k2 (p
si)
c.-0.3
-0.25
-0.2
-0.15
-0.1
-0.05
0
k3 (p
si)
Limestone Sandstone Granite
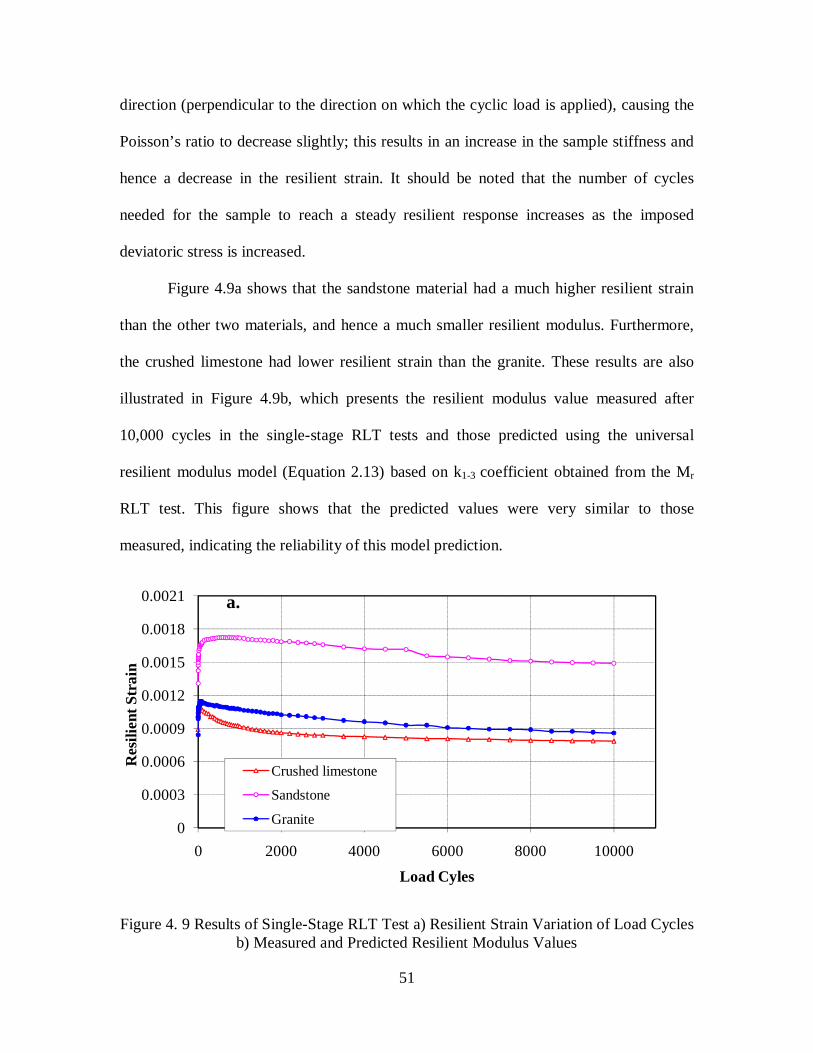
51
direction (perpendicular to the direction on which the cyclic load is applied), causing the
Poisson’s ratio to decrease slightly; this results in an increase in the sample stiffness and
hence a decrease in the resilient strain. It should be noted that the number of cycles
needed for the sample to reach a steady resilient response increases as the imposed
deviatoric stress is increased.
Figure 4.9a shows that the sandstone material had a much higher resilient strain
than the other two materials, and hence a much smaller resilient modulus. Furthermore,
the crushed limestone had lower resilient strain than the granite. These results are also
illustrated in Figure 4.9b, which presents the resilient modulus value measured after
10,000 cycles in the single-stage RLT tests and those predicted using the universal
resilient modulus model (Equation 2.13) based on k1-3 coefficient obtained from the Mr
RLT test. This figure shows that the predicted values were very similar to those
measured, indicating the reliability of this model prediction.
Figure 4. 9 Results of Single-Stage RLT Test a) Resilient Strain Variation of Load Cycles
b) Measured and Predicted Resilient Modulus Values
0
0.0003
0.0006
0.0009
0.0012
0.0015
0.0018
0.0021
0 2000 4000 6000 8000 10000
Res
ilien
t Str
ain
Load Cyles
Crushed limestone
Sandstone
Granite
a.
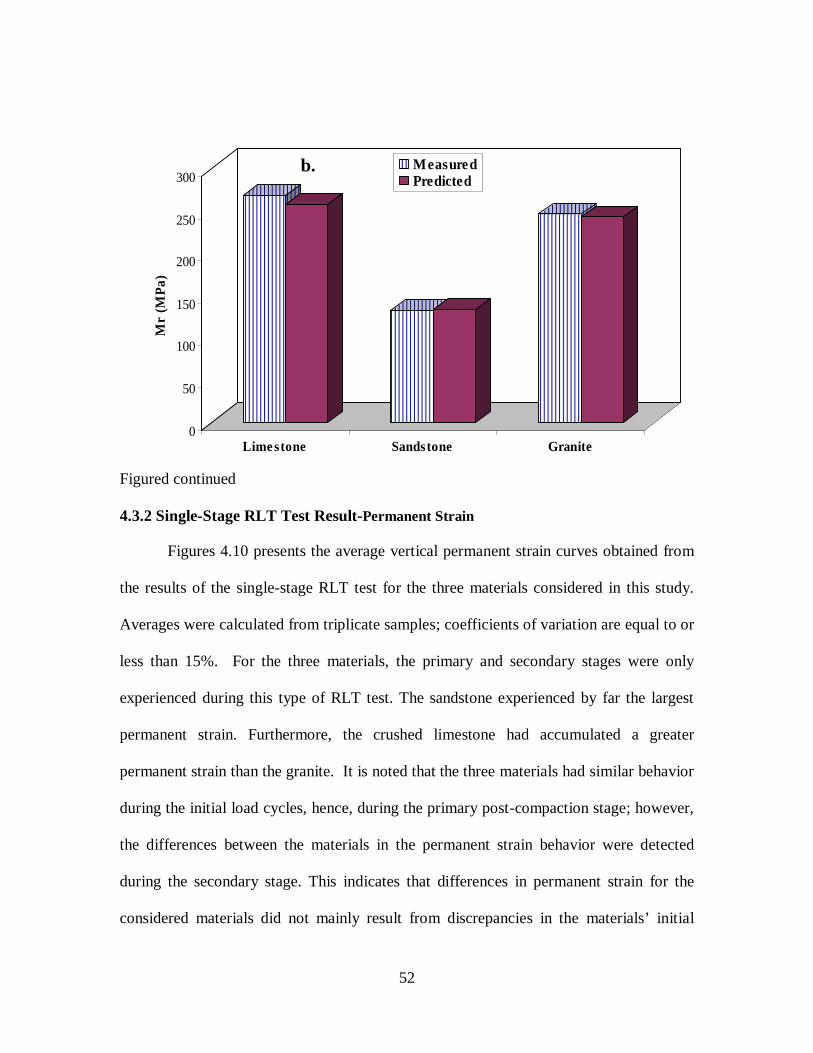
52
Figured continued 4.3.2 Single-Stage RLT Test Result-Permanent Strain
Figures 4.10 presents the average vertical permanent strain curves obtained from
the results of the single-stage RLT test for the three materials considered in this study.
Averages were calculated from triplicate samples; coefficients of variation are equal to or
less than 15%. For the three materials, the primary and secondary stages were only
experienced during this type of RLT test. The sandstone experienced by far the largest
permanent strain. Furthermore, the crushed limestone had accumulated a greater
permanent strain than the granite. It is noted that the three materials had similar behavior
during the initial load cycles, hence, during the primary post-compaction stage; however,
the differences between the materials in the permanent strain behavior were detected
during the secondary stage. This indicates that differences in permanent strain for the
considered materials did not mainly result from discrepancies in the materials’ initial
0
50
100
150
200
250
300M
r (M
Pa)
Limestone Sandstone Granite
Measured Predicted
b.

53
voids and density conditions, but rather from the properties that affect aggregate the
rotation and sliding mechanisms of the aggregate particle which results in the permanent
deformation in the secondary stage. Those properties include particle surface friction and
shape.
Since the single-stage RLT test included applying 10,000 cycles, it is of interest to
examine the permanent strain evolution at a higher number of load cycles. For this
purpose the single relation of the accumulative vertical permanent strain with the vertical
permanent strain rate was examined, Figure 4.11. In general, all materials had a high
permanent strain rate during the first load cycles, yet the permanent strain rate decreased
with each load cycle. However, the permanent strain rate of granite had decreased more
rapidly than the crushed limestone materials and reached smaller values at the end of the
RLT test. The permanent strain rate of sandstone also decreased but at much slower rate
than the other materials. According to the strain rate criterion proposed by Werkmeister
(2005) previously discussed in this paper, the response of granite is within Range A,
while the response of crushed limestone and sandstone is within Range B. However, it is
noted that the sandstone behavior is at the upper end of Range B close to Range C. This
suggests that if such stresses were experienced in the pavement structure, then the granite
material would be the only material to have a stable behavior, thus, it will have the best
performance among the other two materials. Furthermore, the sandstone is expected to
collapse causing the development of excessive rutting of the pavement structure.
4.4 Multi-Stage Test Results
Multi-stage RLT tests were conducted on the three unbound granular materials at
their optimum compaction condition to characterize their permanent and resilient

54
Figure 4. 10 Vertical Permanent Strain Variations with Number of Cycles
Figure 4. 11 Vertical Permanent Strain Rate vs. Vertical Permanent Strain
0
1
2
3
4
5
6
0 1000 2000 3000 4000 5000 6000 7000 8000 9000 10000
Load cycle s
Perm
anen
t Str
ain
(%)
LimestoneSansdstoneGranite
1.E-06
1.E-05
1.E-04
1.E-03
1.E-02
1.E-01
1.E+000 1 2 3 4 5 6
Pe rmane nt Strain
Perm
anen
t Str
ain
Rat
e
LimestoneSandstoneGranite
A
B
C
55
deformation behavior at different stress levels. Figure 4.12 shows the results of the total
permanent strain during each loading stage for all tested materials. It is clear that the
permanent strain is stress dependent, such that it increased as the deviatoric stress
increased. However, this increase differed from one material to another. The sandstone
had accumulated the highest permanent strain at all stages. Furthermore, the highest
difference in the total accumulated permanent strain was observed at the fourth and fifth
stages, where the tertiary stage was reached.
Figure 4. 12 Multi-Stage Cumulative Permanent Strain
Figures 4.13b-d show the permanent vertical strain rate versus the permanent
vertical cumulative strain obtained from the results of the multi-stage RLT tests. It is
noted that the three different responses (Range A, Range B, Range C) were observed at
the different stages of cyclic loading. However, the stages at which those responses were
observed were different for each of the three materials considered in this study. The
Range A response was observed during stages I-III for sandstone and during stages I-II
for other two materials. It is noted that in Range A behavior plots as a convex-downwards
0
1
2
3
4
5
6
7
8
9
0 10000 20000 30000 40000 50000 60000 70000
Load Cycles
Perm
anen
t Str
ain
LimestoneSandstoneGranite
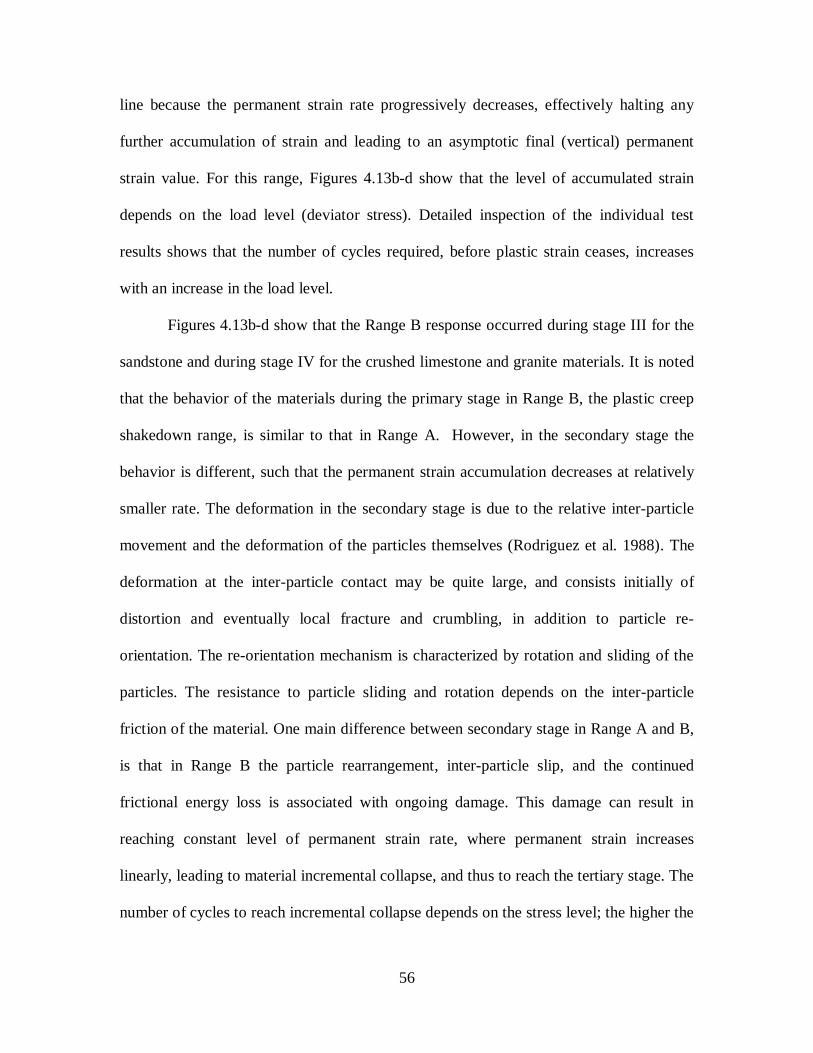
56
line because the permanent strain rate progressively decreases, effectively halting any
further accumulation of strain and leading to an asymptotic final (vertical) permanent
strain value. For this range, Figures 4.13b-d show that the level of accumulated strain
depends on the load level (deviator stress). Detailed inspection of the individual test
results shows that the number of cycles required, before plastic strain ceases, increases
with an increase in the load level.
Figures 4.13b-d show that the Range B response occurred during stage III for the
sandstone and during stage IV for the crushed limestone and granite materials. It is noted
that the behavior of the materials during the primary stage in Range B, the plastic creep
shakedown range, is similar to that in Range A. However, in the secondary stage the
behavior is different, such that the permanent strain accumulation decreases at relatively
smaller rate. The deformation in the secondary stage is due to the relative inter-particle
movement and the deformation of the particles themselves (Rodriguez et al. 1988). The
deformation at the inter-particle contact may be quite large, and consists initially of
distortion and eventually local fracture and crumbling, in addition to particle re-
orientation. The re-orientation mechanism is characterized by rotation and sliding of the
particles. The resistance to particle sliding and rotation depends on the inter-particle
friction of the material. One main difference between secondary stage in Range A and B,
is that in Range B the particle rearrangement, inter-particle slip, and the continued
frictional energy loss is associated with ongoing damage. This damage can result in
reaching constant level of permanent strain rate, where permanent strain increases
linearly, leading to material incremental collapse, and thus to reach the tertiary stage. The
number of cycles to reach incremental collapse depends on the stress level; the higher the

57
applied stress are, the fewer the number of load cycles required to reach to the tertiary
stage. The results in Figures 4.13b-d show that at the third stage, the sandstone material
reached Range B behavior, suggesting that lower stress than the other materials was
needed to overcome particle resistance to sliding and rotation for this material and cause
higher damage.
Figures 4.13b-d show that the Range C response was initially observed during
Stage IV, V and VI for the sandstone, crushed limestone, and granite, respectively
Furthermore, it is noted that in Range C, the incremental collapse shakedown range, the
material exhibits continuing incremental permanent strain with each additional stress
cycle. Thus, the response is always plastic, and each stress application results in a
progressive increment in the magnitude of permanent strain. The initial behavior
observed in other ranges (A, B) is probably the same as that shown in Range C, but
compressed into a fewer number of stress applications as a consequence of the much
higher cyclic stress level applied. In addition the tertiary stage occurs at a much lower
number of load cycles. This suggests that the Range C stresses are high enough to cause
significant energy loss per cycle. Hence, a great degree of damage occurs almost from the
beginning of cyclic load application.
The non-stable material behavior and large permanent strain rates at high stress
levels in Range B and C result from the relatively large-scale particle re-orientation. One
of the causes of the large-scale particle re-orientation is the grain abrasion and particle
crushing. This is governed by the magnitude of applied stresses, and the mineralogy and
strength of the individual particles themselves. Recalling the result of Micro-Deval test,
granite had a much lower percentage loss than the other considered materials, which

58
Figure 4.13 Multi-Stage Test Results Permanent Strain Rate for a) Limestone b) Sandstone c) Granite
1.E-07
1.E-06
1.E-05
1.E-04
1.E-03
1.E-02
1.E-01
1.E+000 1 2 3 4 5 6 7
Permenant Strain
Perm
enan
t St
rain
Rat
eStage IStage IIStage IIIStage IVStage VStage VI
B
C
A
1.E-07
1.E-06
1.E-05
1.E-04
1.E-03
1.E-02
1.E-01
1.E+000 1 2 3 4 5 6 7 8 9
Permenant Strain
Perm
enan
t Str
ain
Rat
e
Stage IStage IIStage IIIStage IVStage V
B
C
A
a.
b.

59
Figure continued
suggests that it has the better ability to resist attrition under severe loading. This may be
one of the reasons for the lower permanent strain accumulation that granite exhibited
during the unstable behavior at higher stress level compared to the other two materials.
The shear strength properties obtained in the SCT test, which showed higher friction
angle for the granite, provides another reason to explain this phenomenon.
Figure 4.14 shows the resilient strain at different stages for each material. As for
the permanent strain, the resilient strain was stress dependent. However, the limestone
and granite materials had the lowest and highest resilient strain at all stages, respectively.
The resilient strain behavior was different than that in the permanent strain. The granite
and limestone had similar trends in the first four stages, such that the resilient strain
increased initially then decreased until reaching a steady constant value. However, the
initial increase in the resilient strain was magnified with the increase in the stress level.
1.E-07
1.E-06
1.E-05
1.E-04
1.E-03
1.E-02
1.E-01
1.E+000 1 2 3 4 5
Permanent Strain
Perm
anen
t St
rain
Rat
eStage IStage IIStage IIIStage IVStage VStage VI
B
C
A
c.
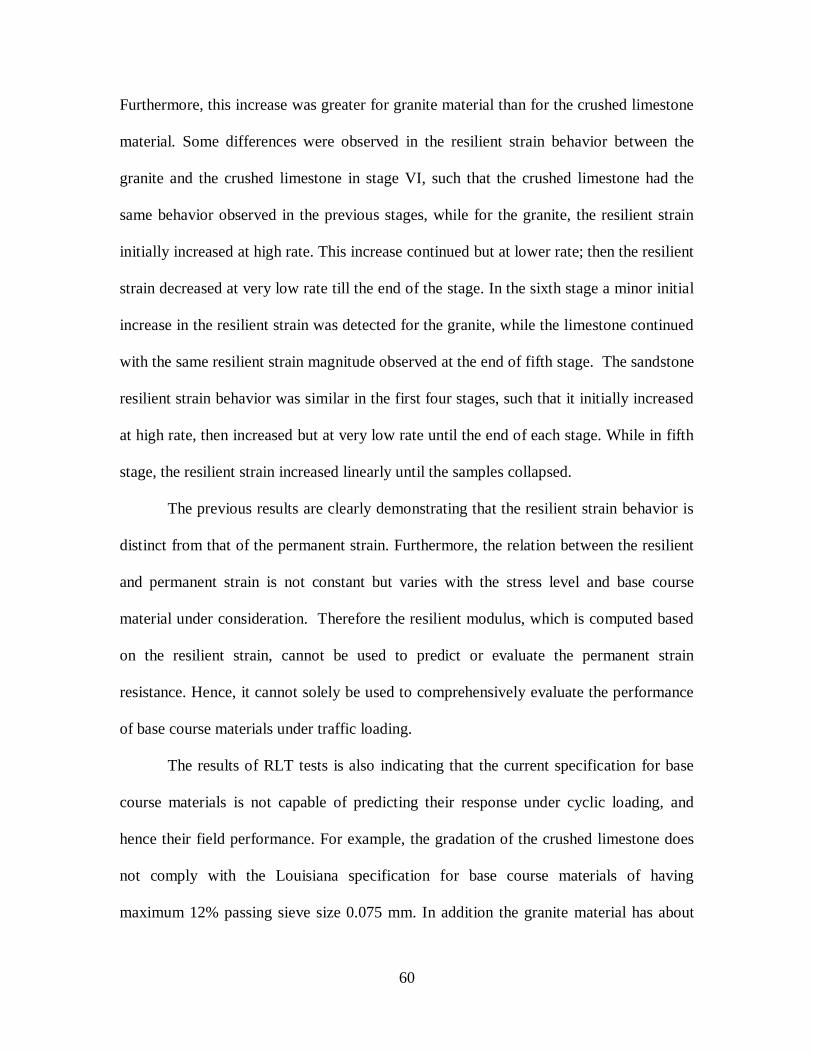
60
Furthermore, this increase was greater for granite material than for the crushed limestone
material. Some differences were observed in the resilient strain behavior between the
granite and the crushed limestone in stage VI, such that the crushed limestone had the
same behavior observed in the previous stages, while for the granite, the resilient strain
initially increased at high rate. This increase continued but at lower rate; then the resilient
strain decreased at very low rate till the end of the stage. In the sixth stage a minor initial
increase in the resilient strain was detected for the granite, while the limestone continued
with the same resilient strain magnitude observed at the end of fifth stage. The sandstone
resilient strain behavior was similar in the first four stages, such that it initially increased
at high rate, then increased but at very low rate until the end of each stage. While in fifth
stage, the resilient strain increased linearly until the samples collapsed.
The previous results are clearly demonstrating that the resilient strain behavior is
distinct from that of the permanent strain. Furthermore, the relation between the resilient
and permanent strain is not constant but varies with the stress level and base course
material under consideration. Therefore the resilient modulus, which is computed based
on the resilient strain, cannot be used to predict or evaluate the permanent strain
resistance. Hence, it cannot solely be used to comprehensively evaluate the performance
of base course materials under traffic loading.
The results of RLT tests is also indicating that the current specification for base
course materials is not capable of predicting their response under cyclic loading, and
hence their field performance. For example, the gradation of the crushed limestone does
not comply with the Louisiana specification for base course materials of having
maximum 12% passing sieve size 0.075 mm. In addition the granite material has about

61
5% of its particles finer than 0.075 mm which is the minimum value required by the same
specification. However, both of those materials showed good performance under low and
high levels of cyclic stress. It is clear that the physical properties currently used to
evaluate and select base course materials do not represent the performance of these
materials. Therefore, there is a need for changing the current specification such that it
includes properties that affect the response of the materials under cyclic loads. The
selected properties may have to be at the micro-scale or even nano-scale. However, with
the lack of knowledge of those properties, the material permanent and resilient strain
behavior under loading and environmental conditions similar to those encountered in the
field is recommended to be examined during the selection and evaluation procedure of
base course materials using Mr, single stage, and multi-stage RLT tests. These tests can
also facilitate the use of non-conventional base course materials such as recycled or
marginal materials.
4.5 Shakedown Limits
Following the initial characterization of the three UGMs, additional multi-stage
RLT testing was conducted on crushed limestone and sandstone samples compacted at
optimum moisture content to determine shakedown limits. To determine how shakedown
limits are affected by moisture content, UGMs samples were tested at wet and dry of
optimum moisture content while maintaining maximum dry density as determined by
standard proctor. Long term performance of UGMs is dependent upon change in
moisture content. During construction materials are compacted at optimum moisture
content and maximum dry density, yet problems arise in performance and are attributed
to fluctuations in moisture content from seasonal variations. The three shakedown ranges
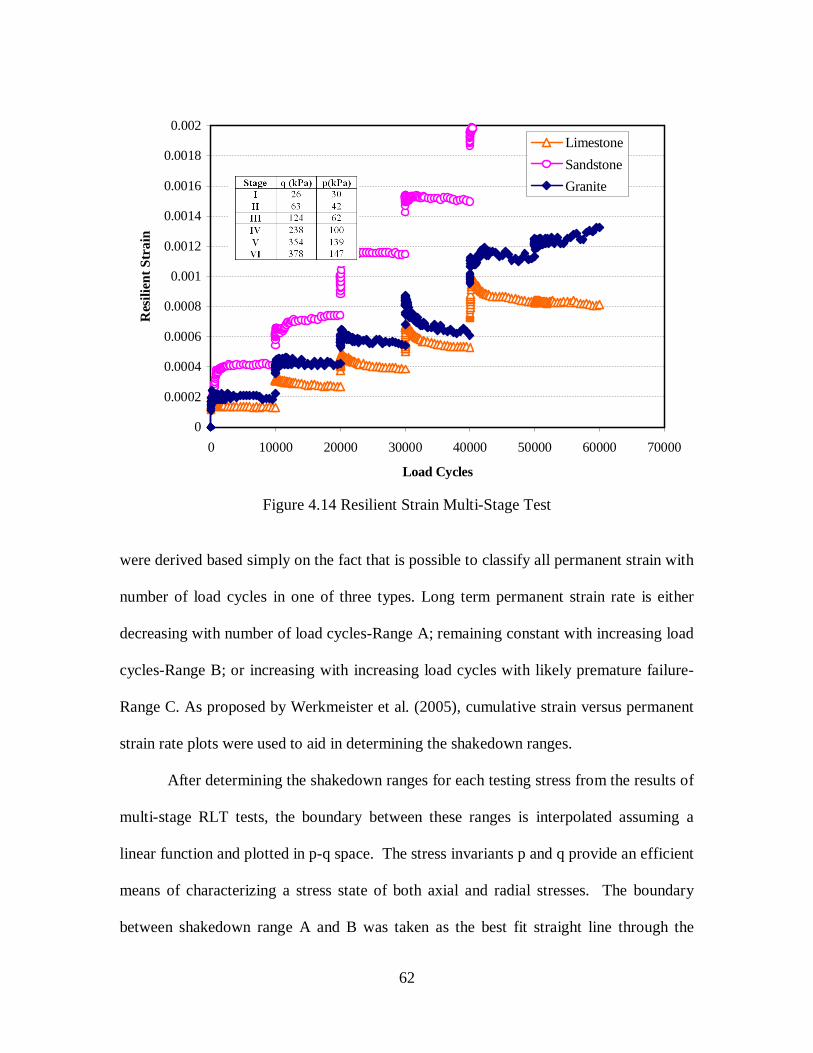
62
Figure 4.14 Resilient Strain Multi-Stage Test
were derived based simply on the fact that is possible to classify all permanent strain with
number of load cycles in one of three types. Long term permanent strain rate is either
decreasing with number of load cycles-Range A; remaining constant with increasing load
cycles-Range B; or increasing with increasing load cycles with likely premature failure-
Range C. As proposed by Werkmeister et al. (2005), cumulative strain versus permanent
strain rate plots were used to aid in determining the shakedown ranges.
After determining the shakedown ranges for each testing stress from the results of
multi-stage RLT tests, the boundary between these ranges is interpolated assuming a
linear function and plotted in p-q space. The stress invariants p and q provide an efficient
means of characterizing a stress state of both axial and radial stresses. The boundary
between shakedown range A and B was taken as the best fit straight line through the
0
0.0002
0.0004
0.0006
0.0008
0.001
0.0012
0.0014
0.0016
0.0018
0.002
0 10000 20000 30000 40000 50000 60000 70000
Load Cycles
Res
ilien
t Str
ain
LimestoneSandstoneGranite

63
highest vertical testing stress possible for shakedown range A for the three tests at
maximum mean stresses. For B/C boundary, a best fit line was fitted to the lowest
vertical stresses where shakedown range C occurred. Figures 4.15 and 4.16 show the
shakedown range boundaries for crushed limestone and sandstone compacted at optimum
moisture content plotted along with the static failure line in p-q space.
Not surprisingly for Limestone, the boundary for B/C region is close in proximity
to the static failure line. The plastic limit for sandstone was below the static shear
strength line. The failure mechanism is different for cyclic loading, suggesting failure of
the material cannot be predicted by static shear strength.
To quantify the effect of moisture on shakedown, sandstone and limestone were
tested at wet and dry of optimum moisture content. The proceeding figures 4-17 through
4-20 show the effect of the change in moisture regime on shakedown limits for Sandstone
and Limestone materials.
The results for the limits are tabulated below at each corresponding degree of saturation
in table 4.2, where m and d are the corresponding slope and intercept in p-q space.
Noticeably, the slope of the elastic and plastic limits are relatively stable with respect to
degree of saturation for both limestone and sandstone UGM’s; m increase. digressively
for both the elastic and plastic limits, but at higher stresses (plastic limits) change in m is
smaller than for smaller stresses (elastic limit) for both materials. Refer to figure 4.21
The results clearly show an increase in intercept for a decrease in degree of
saturation for both materials and limits, Figure 4.22. By lowering the degree of
saturation, the increase in d is most likely to be a direct result of an increase in suction
from decreased moisture in the sample.

64
Figure 4. 15 Shakedown Limits for Limestone at Optimum Moisture Content
Figure 4. 16 Shakedown Limits for Sandstone at Optimum Moisture Content
0
15
30
45
60
75
90
105
0.00 5.00 10.00 15.00 20.00 25.00 30.00 35.00 40.00p (psi)
q (psi)
Ultimate Shear StrengthPlastic Shakedown LimitElastic shakedown Limit
Range A
Range C
Range B
0
15
30
45
60
75
90
0 5 10 15 20 25 30 35p (psi)
Ultimate Shear StrengthElastic Shakedown LimitPlastic Shakedown Limit
Range A
Range BRange C
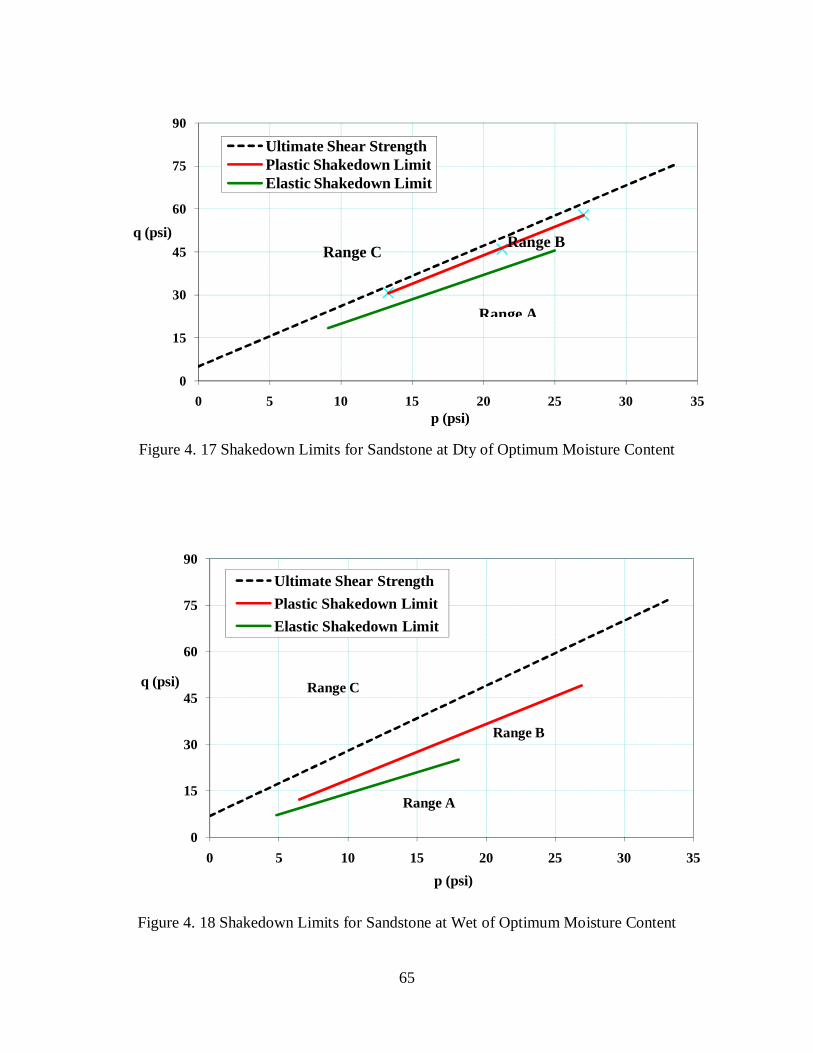
65
Figure 4. 17 Shakedown Limits for Sandstone at Dty of Optimum Moisture Content
Figure 4. 18 Shakedown Limits for Sandstone at Wet of Optimum Moisture Content
0
15
30
45
60
75
90
0 5 10 15 20 25 30 35
q (psi)
p (psi)
Ultimate Shear StrengthPlastic Shakedown LimitElastic Shakedown Limit
Range C Range B
Range A
0
15
30
45
60
75
90
0 5 10 15 20 25 30 35
q (psi)
p (psi)
Ultimate Shear StrengthPlastic Shakedown LimitElastic Shakedown Limit
Range C
Range B
Range A
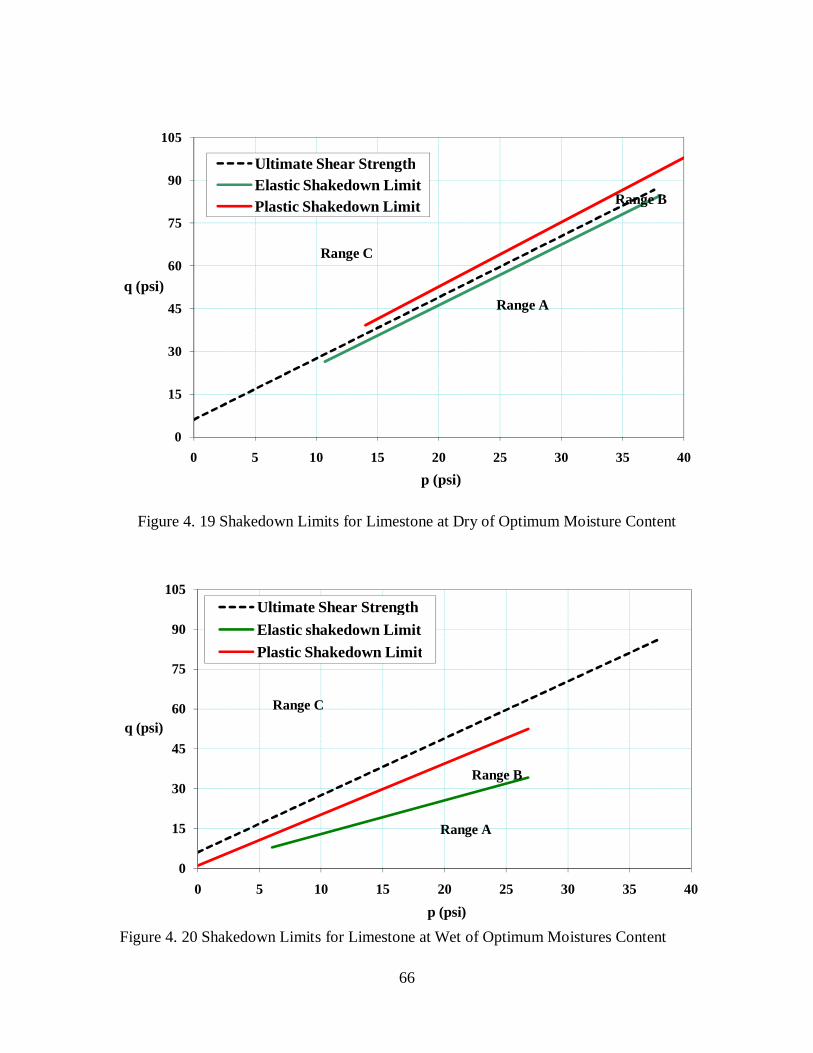
66
Figure 4. 19 Shakedown Limits for Limestone at Dry of Optimum Moisture Content
Figure 4. 20 Shakedown Limits for Limestone at Wet of Optimum Moistures Content
0
15
30
45
60
75
90
105
0 5 10 15 20 25 30 35 40
q (psi)
p (psi)
Ultimate Shear StrengthElastic Shakedown LimitPlastic Shakedown Limit
Range C
Range A
Range B
0
15
30
45
60
75
90
105
0 5 10 15 20 25 30 35 40
q (psi)
p (psi)
Ultimate Shear StrengthElastic shakedown LimitPlastic Shakedown Limit
Range C
Range B
Range A
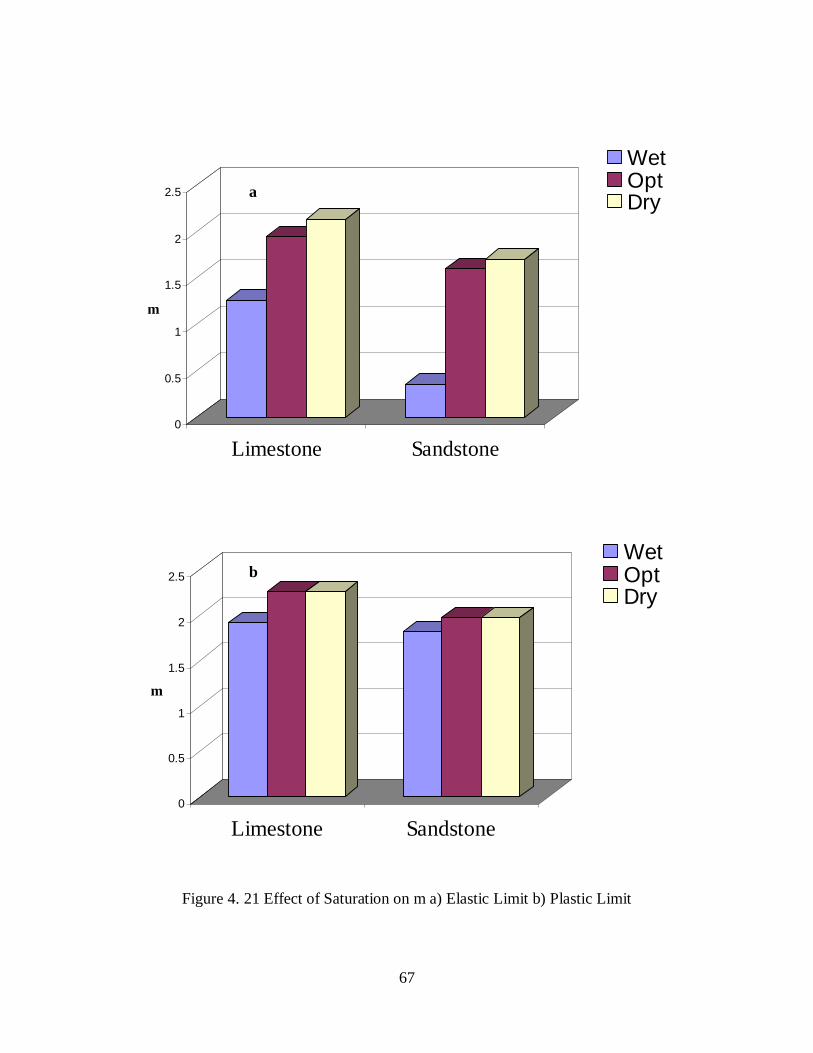
67
Figure 4. 21 Effect of Saturation on m a) Elastic Limit b) Plastic Limit
0
0.5
1
1.5
2
2.5
m
Limestone Sandstone
WetOptDry
0
0.5
1
1.5
2
2.5
m
Limestone Sandstone
WetOptDry
a
b

68
Figure 4. 22 Effect of Saturation on d a) Elastic Limit b) Plastic Limit
0
0.5
1
1.5
2
2.5
3
3.5
4
d, psi
Limestone Sandstone
WetOptDry
0
1
2
3
4
5
6
7
8
d, psi
Limestone Sandstone
WetOptDry
b
a
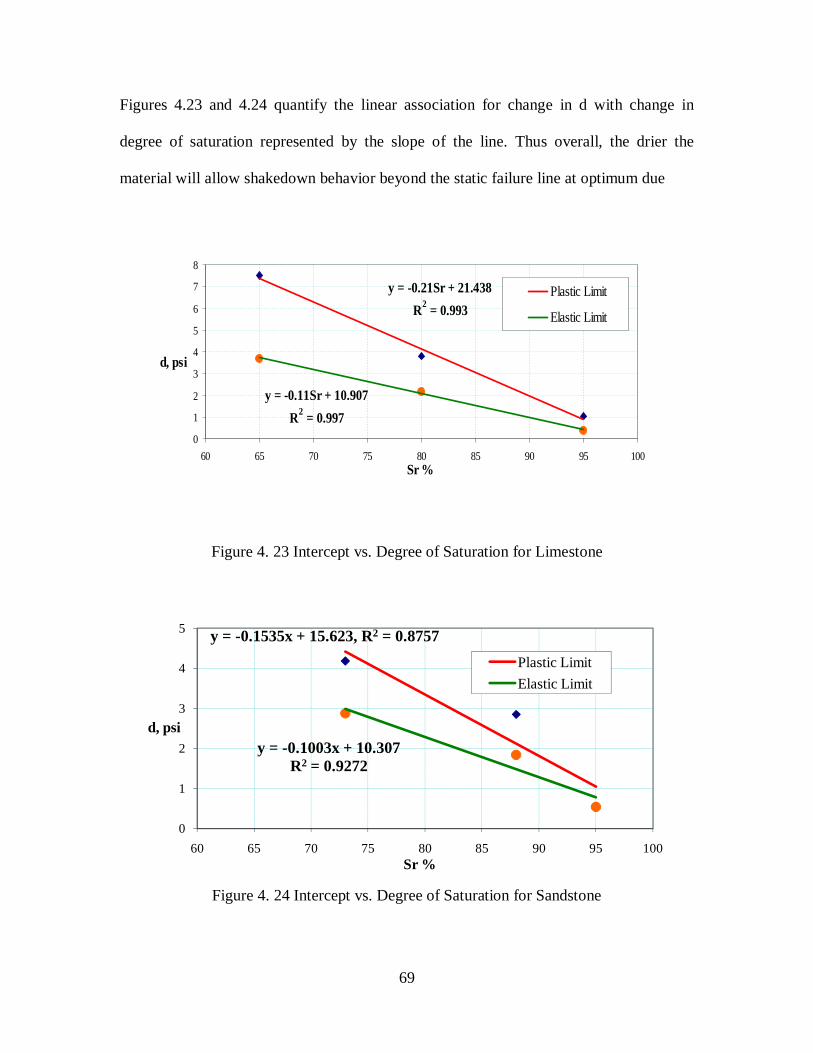
69
Figures 4.23 and 4.24 quantify the linear association for change in d with change in
degree of saturation represented by the slope of the line. Thus overall, the drier the
material will allow shakedown behavior beyond the static failure line at optimum due
Figure 4. 23 Intercept vs. Degree of Saturation for Limestone
Figure 4. 24 Intercept vs. Degree of Saturation for Sandstone
y = -0.21Sr + 21.438R2 = 0.993
y = -0.11Sr + 10.907R2 = 0.997
0
1
2
3
4
5
6
7
8
60 65 70 75 80 85 90 95 100Sr %
d, psi
Plastic Limit
Elastic Limit
y = -0.1535x + 15.623, R2 = 0.8757
y = -0.1003x + 10.307R2 = 0.9272
0
1
2
3
4
5
60 65 70 75 80 85 90 95 100
d, psi
Sr %
Plastic LimitElastic Limit
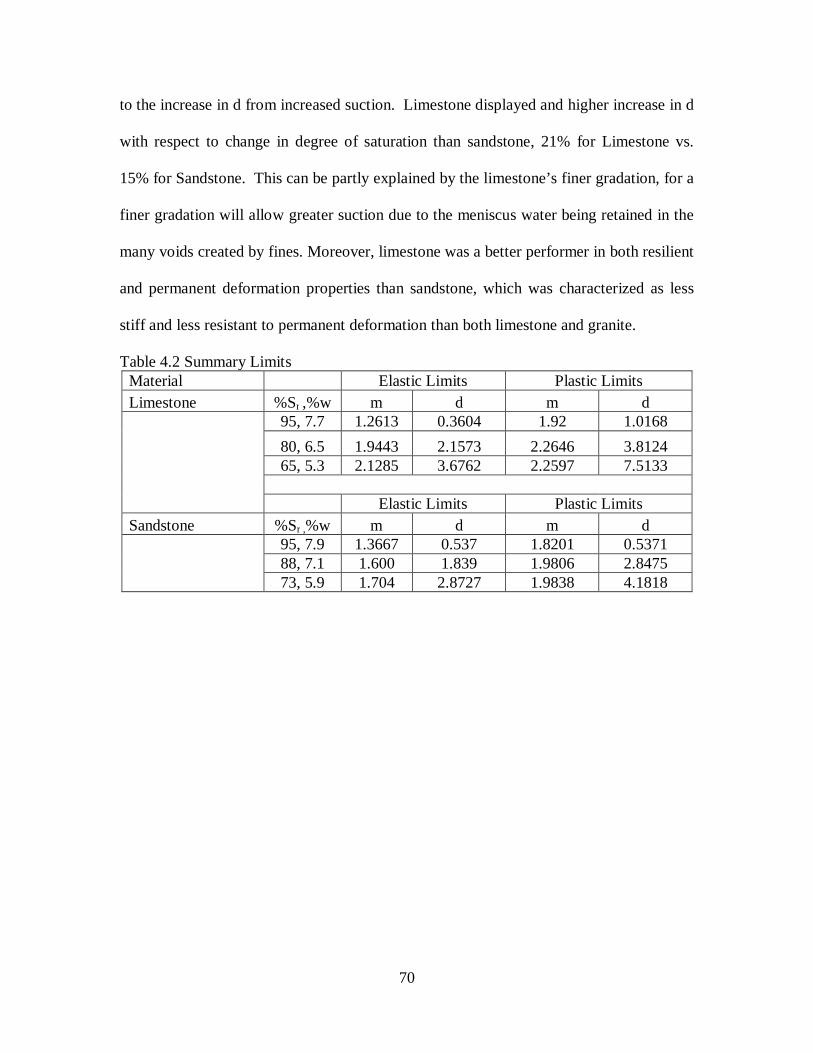
70
to the increase in d from increased suction. Limestone displayed and higher increase in d
with respect to change in degree of saturation than sandstone, 21% for Limestone vs.
15% for Sandstone. This can be partly explained by the limestone’s finer gradation, for a
finer gradation will allow greater suction due to the meniscus water being retained in the
many voids created by fines. Moreover, limestone was a better performer in both resilient
and permanent deformation properties than sandstone, which was characterized as less
stiff and less resistant to permanent deformation than both limestone and granite.
Table 4.2 Summary Limits Material Elastic Limits Plastic Limits Limestone %Sr ,%w m d m d 95, 7.7 1.2613 0.3604 1.92 1.0168 80, 6.5 1.9443 2.1573 2.2646 3.8124 65, 5.3 2.1285 3.6762 2.2597 7.5133 Elastic Limits Plastic Limits Sandstone %Sr ,%w m d m d 95, 7.9 1.3667 0.537 1.8201 0.5371 88, 7.1 1.600 1.839 1.9806 2.8475 73, 5.9 1.704 2.8727 1.9838 4.1818

71
CHAPTER 5 CONCLUSION AND RECOMMENDATIONS
5.1 Conclusions
This paper documented the results of a laboratory testing program that was conducted
to characterize the behavior of unbound granular base materials under different loading
conditions, and examine the effect of different physical properties on this behavior. Three
different types of granular base materials were investigated in this study, namely
limestone, sandstone, and granite. Physical properties and static and repeated load triaxial
tests were performed on the considered materials. Three different types of RLT tests were
used in this study including resilient modulus, single-stage, and multi-stage RLT tests.
The results of the single-stage and multi-stage were analyzed within the framework of the
shakedown theory. Based on the results of this paper, the following conclusions can be
drawn:
The sandstone experienced by far the largest permanent and resilient strain in both
single-stage and multi-stage RLT test. In addition, the granite had the lowest
permanent strain but experienced higher resilient strain than the limestone.
The three materials investigated in this study had similar behavior during the
primary post-compaction stage; however, the differences between the materials in
the permanent strain behavior were detected during the secondary stages.
The limestone and granite had similar permanent strain behavior at low and
intermediate stress levels; however, limestone experienced the unstable Range C

72
shakedown behavior at higher stress levels than granite did. This was attributed to
the granite’s lower percentage loss in the Micro-Deval test and its higher friction
angle.
The resilient and permanent strains are stress dependent. However, the resilient
strain behavior is distinct from that of the permanent strain.
The resilient modulus cannot be used to evaluate the permanent strain resistance
of a base course material. Hence, it cannot solely be used to characterize the
response of base course materials under traffic loading.
There is a need for changing the current specification such that it includes
properties that affect the response of the materials under cyclic loads. The
selected properties may have to be at the micro-scale or even nano-scale.
From the results of shakedown limits, it is evident that degree of saturation affects
the shakedown behavior of UGM’s. The degree of saturation is inversely related
to the intercept of the shakedown limits allowing shakedown beyond the static
failure line.
5.2 Recommendations
The multi-stage RLT test provides a promising tool to characterize the structural response
and stability of different types of base course materials at loading condition similar to
those encountered in a pavement structure. To fully understand the full spectrum of
shakedown behavior, the UGM’s, given the elastic and plastic ranges in table 4.2, should

73
be tested at 1 million cycles to confirm stable and unstable behavior. Once behavior is
confirmed, ranges can be used in finite element packages to calculate strain in a given
base course layer for moisture regime and stress conditions.
74
REFERENCES
Allen, J. (1973). ‘‘The effect of non-constant lateral pressures of the resilient response of granular materials,’’ PhD thesis, University of Illinois at Urbana- Champaign, Urbana, Ill. Allen, J. J., and Thompson, M. R. (1974). ‘‘Resilient response of granular materials subjected to time dependent lateral stresses.’’ Transp. Res. Rec. 510, Transportation Research Board, Washington, D.C., 1–13. Almeida, J. R. de. (1986). Structural Analysis of Rigid Pavements by the Finite Element Method. MSc Thesis, Technical University of Lisbon (in Portuguese). Arnold, G. K. Rutting of granular pavements, Ph.D. dissertation, School of Civil Engineering, The University of Nottingham, The United Kingdom, 2004. Arnold, G. K. Rutting of granular pavements, Ph.D. dissertation, School of Civil Engineering, The University of Nottingham, The United Kingdom, 2004. Arnold G, Dawson A, Hughes D, Robinson D. The application of shakedown approach to granular pavement layers. Journal of Transportation Research Board 2003; 1819(2):194–200. Arnold, G. (2000). Performance based specifications for road construction and materials. UNBAR 5. University of Nottingham, UK. AASHTO T 307-99. Standard method of test for determining the resilient modulus of soils and aggregates. Association of State Highway and Transportation Officials (AASHTO), Washington, D.C., 2003. Barksdale, R. D. (1972). ‘‘Laboratory evaluation of rutting in basecourse materials.’’ Proc., 3rd Int. Conf. on Struct. Des. of Asphalt Pavements, 161–174. Barksdale, R.D. and , J.L. Alba. Laboratory. Determination of Resilient Modulus for Flexible Pavement Design,” Interim Report No. 2 for NCHRP, Transportation Research Board (TRB), NRC, Washington, D.C. , 1993. Barksdale, R. D. (1991). The aggregate handbook. National Stone Association, Washington, D.C. Barksdale, R. D., and Itani, S. Y. (1989). ‘‘Influence of aggregate shape on base behavior.’’ Transp. Res. Rec. 1227, Transportation Research Board, Washington, D.C., 173–182.
Barksdale, R.D., Brown, S. F., and Chan, F. (1989). “Potential benefits of geosynthetics in flexible pavement systems”, National Cooperative Highway
75
research Program Report No. 315, Transportation Research Board, National Research Council, Washington, DC, USA, 56 p.
Boyce, J. R. (1976). The behaviour of granular material under repeated loading. PhD Thesis, University of Nottingham, UK.
Brown, S. F. (1996). 36th Rankine Lecture: Soil Mechanics in Pavement Engineering, Géotechnique, Vol. 46, No. 3, 1996, pp 383-426.
Brown, S. F., and Hyde, A. F. L. (1975). ‘‘Significance of cyclic confining stress in repeated-load triaxial testing of granular material.’’ Transp. Res. Rec. 537, Transportation Research Board, Washington, D.C., 49– 58. Chan, F. W. K. (1990). ‘‘Permanent deformation resistance of granular layers in pavements,’’ PhD thesis, Dept. of Civ. Engrg., University of Nottingham, Nottingham, England
Dawson, A. R. (1990). ‘‘Introduction to soils & granular materials.’’ Lecture Notes from Residential Course, Bituminous Pavements: Materials, Design and Evaluation, University of Nottingham, Nottingham, England
Dehlen, G. L. (1969). ‘‘The effect of non-linear material response on the behavior of pavements subjected to traffic loads,’’ PhD thesis, University of California, Berkeley, Berkeley, Calif. Ekblad, Jonas.,” Influence of Water on Coarse Granular Road Material Properties.” KTH, Stockholm. 2006.
Groeger, J. L., Rada, G. R., and Lopez, A., "AASHTO T307 – Background and Discussion," Resilient Modulus Testing for Pavement Components, ASTM STP 1437, G. N. Durham, W. A. Marr, and W. L. De Groff, Eds., ASTM International, West Conshohocken, PA, 2003. Hallin, John P.,Tenf, Paul T., Scoffield, Larry A., Quintus, Harold Von,.(2007) “Pavement Lesson Learned from the ASSHO road Test and Performance of the Interstate Highway System.”Transportation Research Record. Report No. E-C118. Hicks, R. G. (1970). Factors influencing the resilient properties of granular materials, PhD thesis, University of California, Berkeley, Berkeley, Calif. Hicks, R. G., and Monismith, C. L. (1971). Factors influencing the resilient properties of granular materials. Highway Research Record 345, 15-31. Highway Research Board. Washington, DC
76
Heydinger A G, Xie, Q L, Randolph B W, Gupta J D, Analysis of resilient modulus of dense and open-graded aggregates. Transportation Research Record 1547, Transportation Research Board, Washington, D.C., pp 1–6, 1996.
Holubec, I. (1969). ‘‘Cyclic creep of granular materials.’’ Rep. No. RR147, Department of Highways, Ontario, Canada. Jouve, P., Martinez, J., Paute, J. L., and Ragneau, E. (1987). ‘‘Rational model for the flexible pavement deformations.’’ Proc., 6th Int. Conf. on Struct. Des. of Asphalt Pavements, Vol. 1, 50–64. Hossain, S. M., D. S. Lane, B. Schmidt. “Results of Micro-Deval Test For Coarse Aggregates From Virginia Sources.” The 87th Transportation Research Board Annual Meeting. CD-ROM, National Research Council, Washington, D, 2008. Johnson K L. (1986). Plastic flow, residual stresses and shakedown in rolling contact. Pro-ceedings of the 2nd International Conference on Contact Mechanics and Wear of Rail/Wheel Systems, University of Rhode Island, Waterloo Ontario.
Kolisoja, P. (1998). ‘‘Large scale dynamic triaxial tests.’’ III. Delprosjektrapport 20, Arbeidsfelleskapet KPG, Oslo, Norway. Lashine, A. K., Brown, S. F., and Pell, P. S. (1971). ‘‘Dynamic properties of soils.’’ Rep. No. 2, Submitted to Koninklijke/Shell Laboratorium, Dept. of Civ. Engrg., University of Nottingham, Nottingham, England.
Khogali, W. E., and E. H. H. Mohamed. “Novel Approach for Characterization of Unbound Materials.” Transportation Research Record 1874, 38–46, 2004. Kamal, M. A., Dawson, A. R., Farouki, O. T., Hughes, D. A. B., and Sha’at, A. A. (1993). ‘‘Field and laboratory evaluation of the mechanical behavior of unbound granular materials in pavements.’’ Transp. Res. Rec. 1406, Transportation Research Board, Washington, D.C., 88– 97.
Lashine, A.K., Brown, S.F., and Pell, P.S. (1971). Dynamic properties of soils. Report No. 2 Submitted to Koninklijke/Shell Laboratorium, Department of Civil Engineering, University of Nottingham, UK.
Lekarp, F. (1997). ‘‘Permanent deformation behaviour of unbound granular materials,’’ Licentiate thesis, Royal Institute of Technology, Stockholm. Lekarp, F., and Dawson, A. (1998). ‘‘Modelling permanent deformation behaviour of unbound granular materials.’’ Constr. and Build. Mat., Lekarp, F., Isacsson, U., and Dawson, A. (2000). ‘‘State of the art. I: Resilient response of unbound aggregates.’’ J. Transp. Engrg., ASCE, 126(1), 66–75.
77
Lekarp,F.,Isacsson,U.,and Dawson,A(2000). “State of the art II: Permanent Strain Response of Unbound Aggregates.”J. Transp.Engrg., ASCE,126(1),76-83 Lekarp, F., Richardson, I. R., and Dawson, A. (1996). ‘‘Influences on permanent deformation behavior of unbound granular materials.’’Transp. Res. Rec. 1547, Transportation Research Board, Washington, D.C., 68–75.
Maree, J. H. (1982). ‘‘Aspects of the design and behaviour of road pavements with granular material base layers,’’ PhD thesis, Dept. of Civ. Engrg., University of Pretoria, Pretoria, South Africa (in Afrikaans). Maree, J. H., Freeme, C. R., Van Zyl, N. J., and Savage, P. F. (1982). ‘‘The permanent deformation of pavements with untreated crushed stone bases as measured in heavy vehicle simulator tests.’’ Proc., 11th ARRB Conf., Part 2, 16–25. Mayhew, H. C. (1983). Resilient properties of unbound road base under repeated triaxial loading. Lab. Rep. 1088, TRRL, Crowthorne, U.K. Mitry, F. G. (1964). ‘‘Determination of the modulus of resilient deformation of untreated base course materials,’’ PhD thesis, University of California, Berkeley, Berkeley, Calif. Monismith, C. L., Seed, H. B., Mitry, F. G., and Chan, C. K. (1967). ‘Prediction of pavement deflections from laboratory tests.’’ Proc., 2nd mInt. Conf. Struct. Des. of Asphalt Pavements, 109–140. Morgan, J.R. (1966). The response of granular materials to repeated loading. Proc., 3rd Conf., ARRB, 1178-1192. Moore, W. M., Britton, S. C., and Schrivner, F. H. (1970). ‘‘A laboratory study of the relation of stress to strain for a crushed limestone base material.’’ Res. Rep. 99-5F, Study 2-8-65-99, Texas Transp. Inst., Texas A&M University, College Station, Tex.
Mohammad, L., A. Herath, M. Rasoulian, and Z. Zhang. “Laboratory evaluation of untreated and treated pavement base materials from a repeated load permanent deformation test.” The 85th Transportation Research Board Annual Meeting. CD-ROM, National Research Council, Washington, D.C., 2006. Mohammad, L. N., Puppala, A. J., Alavilli, P. (1994)."Investigation of the Use of Resilient Modulus for Louisiana Soils in Design of Pavements," Louisiana Transportation Research Center, FHWA, LADOTD, Report No. 283. Mohammad, L.N., Herath, A., Rasoulian, M., and Zhongjie, Z. (2006). “Laboratory Evaluation of Untreated and Treated Pavement Base Materials from a Repeated Load Permanent Deformation Test.” Transportation Research Record.
78
Mohammad, L.N., Puppala, A.J., and Alavalli, P. (1994). “Influence of Testing Procedure and LVDT Location on Resilient Modulus of Soils,” Transportation Research Record, No. 1462, pp. 91-101.
Moore, W. M., Britton, S. C., and Schrivner, F. H. (1970). ‘‘A laboratory study of the relation of stress to strain for a crushed limestone base material.’’ Res. Rep. 99-5F, Study 2-8-65-99, Texas Transp. Inst., Texas A&M University, College Station, Tex.
NCHRP 1–37A. Guide for Mechanistic-Empirical Design of New and Rehabilitated Pavement Structures. Final Report, Design Inputs. National Cooperative Highway Research Program (NCHRP), 2004. Nazzal M., M. Y. Abu-Farsakh, and L. Mohammad. “Numerical Analyses of Geogrid Reinforced Flexible Pavements.” Proceeding of GeoCongress conference, Atlanta Geogrgia, 2006. Nazzal M., M. Y. Abu-Farsakh, and L. Mohammad. Laboratory Characterization of Reinforced Crushed Limestone under Monotonic and Cyclic Loading. ASCE Journal of Materials, Vol. 19, No. 9, 2007, pp. 772-783 Nunes, Manual C.M.,Dawson, Dawson, Andrew R. “Behavior of Some Pavement Foundation Materials under Repeated Loadings.” Transportation Research Record 1577, 1–9, 1998
Pappin, J. W. (1979). Characteristics of granular material for pavement analysis. PhD Thesis, University of Nottingham, UK.
Pappin, J. W. (1979). Characteristics of granular material for pavement analysis. PhD Thesis, University of Nottingham, UK. Paute, J. L., Hornych, P., and Benaben, J. P. (1996). ‘‘Repeated load triaxial testing of granular materials in the French network of Laboratoires des Ponts et Chausse´es.’’ Flexible Pavements, Proc., Eur. Symp. Euroflex 1993, A. G. Correia, ed., Balkema, Rotterdam, The Netherlands, 53–64.
Puppala, A. J., S. Chomtid, and V. Bhadriraju. “Evaluation of Plastic Strain Potentials in Subgrade Soils Using Repeated Load Triaxial Tests.” The 84th Transportation Research Board Annual Meeting. CD-ROM, National Research Council, Washington, D.C., 2005. Raad, L., Minassian, G., and Gartin, S. (1992). ‘‘Characterization of saturated granular bases under repeated loads.’’ Transp. Res. Rec. 1369, Transportation Research Board, Washington, D.C., 73–82.
79
Raad, L., Weichert, D. and Haidar, A. (1989a). “Analysis of full-depth asphalt concrete pavements using shakedown theory.” Transportation Research Record, No. 1227, pp. 53-65. Raad, L., Weichert, D. and Haidar, A. (1989b). “Shakedown and fatigue of pavements with granular bases.” Transportation Research Record, No. 1227, pp. 159-172. Raad, L., Weichert, D. and Najm, W. (1988). “Stability of multilayer systems under repeated loads.” Transportation Research Record, No. 1207, pp. 181-186.
Raymond, G.P. & Williams, D.R. (1978). Repeated Load Triaxial tests on a dolomite ballast. Journal of Geotechnical Engineering Division, ASCE, 104(7), 1013-1029.
Robinson, R. G. (1974). ‘‘Measurement of the elastic properties of granular materials using a resonance method.’’ TRRL Supplementary Rep. No. 111UC, TRRL.
Rodriguez, A. R., H.D. Castillo, G. F. Sowers. Soil Mechanics in Highway Engineering, 1988. Ruth, B. E., R. Roque, B. “Nukunya. Aggregate Gradation Characterization Factors and Their Relationships to Fracture Energy and Failure Strain of Asphalt Mixtures”. Journal of the Association of Asphalt Paving Technologists, Vol. 71, 2002. Saeed, A., J. Hall, and W. Barker. “Performance-related tests of aggregates for use in unbound pavement layers.” NCHRP Report 453, National Academy Press, Washington, D.C., 2001. Sharp R and Booker J. (1984). Shakedown of pavements under moving surface loads, pp. 1-14, ASCE Journal of Transportation Engineering, No 1, 1984. Sharp, R. W. (1983). ‘‘Shakedown analysis and the design of pavements,’’ PhD thesis, University of Sydney, Sydney, Australia. Sharp, R. W., and Booker, J. R. Engrg., ASCE, 110(1), 1–14. Seed, H. B., Mitry, F. G., Monismith, C. L., and Chan, C. K. (1965).‘‘Predictions of pavement deflection from laboratory repeated load tests.’’ Rep. No. TE-65-6, Soil Mech. and Bituminous Mat. Res. Lab.,University of California, Berkeley, Berkeley, Calif. Seed, H. B., Mitry, F. G., Monismith, C. L., and Chan, C. K. (1967). ‘‘Prediction of flexible pavement deflections from laboratory repeated load tests.’’ NCHRP Rep. No. 35, National Cooperative Highway Research Program.

80
Selig, E. T. (1987). Tensile zone effects on performance of layers systems. Geotechnique, Vol. XXXVII, No. 3, pp. 247-354. Sharp R and Booker J. (1984). Shakedown of pavements under moving surface loads, pp. 1-14, ASCE Journal of Transportation Engineering, No 1, 1984. Sharp, R. W. (1983). ‘‘Shakedown analysis and the design of pavements,’’ PhD thesis, University of Sydney, Sydney, Australia. Sharp, R. W., and Booker, J. R. (1984). ‘‘Shakedown of pavements under moving surface loads.’’ J. Transp. Engrg., ASCE, 110(1), 1–14.
Smith, W. S., and Nair, K. (1973). “Development of Procedures for Characterization of Untreated Granular Base Coarse and Asphalt Treated Base Course Materials.” Report No. FhWA-RD-74-61, Federal Highway Administration, Washington, D.C., 1973. Sowers, G. F. Robb, A.D. Mullis, C.H. & Glenn, A.J. (1957). The residual lateral pressures produced by compacting soils. Proceedings 4th International Conference 322 on Soil Mechanics and Foundation Engineering, London, UK. Vol. 2, pp. 243-247.
Sweere, G. T. H. (1990). ‘‘Unbound granular bases for roads,’’ PhD thesis, University of Delft, Delft, The Netherlands. Thom, N. H. (1988). ‘‘Design of road foundations,’’ PhD thesis, Dept. of Civ. Engrg., University of Nottingham, Nottingham, England. Theyse, H. L. (2002). Stiffness, Strength, and Performance of Unbound Aggregate Material: Application of South African HVS and Laboratory Results to California Flexible Pavements. University of California Pavement Research Center. Thom, N. H., and Brown, S. F. (1987). ‘‘Effect of moisture on the structural performance of a crushed-limestone road base.’’ Transp. Res. Rec. 1121, Transportation Research Board, Washington, D.C., 50–56. Thom, N. H., and Brown, S. F. (1988). ‘‘The effect of grading and density on the mechanical properties of a crushed dolomitic limestone.’’ Proc., 14th ARRB Conf., Part 7, 94–100. Thom, N., Brown, S. (1987). “Effect of Moisture on the Structural Per-formance of a Crushed-Limestone Road Base”. Transportation Research Record 1121, Transportation Research Board, Washington, D.C., pp 50-56. Thom, N.H. (1988). Design of road foundations. PhD Thesis, University of Nottingham, UK.
81
Trollope, E. H., Lee, I. K., and Morris, J. (1962). ‘‘Stresses and deformation in two-layer pavement structures under slow repeated loading.’’ Proc., ARRB, Vol. 1, Part 2, 693–718.
Uzan, J. (1985). Characterisation of granular material. Transport Research Record No. 1022. Transport Research Board, Washington DC, USA. pp. 52-59.
Vuong, B. (1992). ‘‘Influence of density and moisture content on dynamic stress-strain behaviour of a low plasticity crushed rock.’’ Rd. and Transp. Res., 1(2), 88–100.
Werkmeister, S., A. R. Dawson, and F. Wellner. “Permanent Deformation Behavior of Granular Materials.” Road Materials and Pavement Design, Vol. 6 No. 1, 31–51, 2005. Werkmeister, S., A. Dawson and F. Wellner. “Pavement design model for unbound granular materials.” Journal of Transportation Engineering, ASCE, Vol. 130, No. 5, 665–674, 2004.
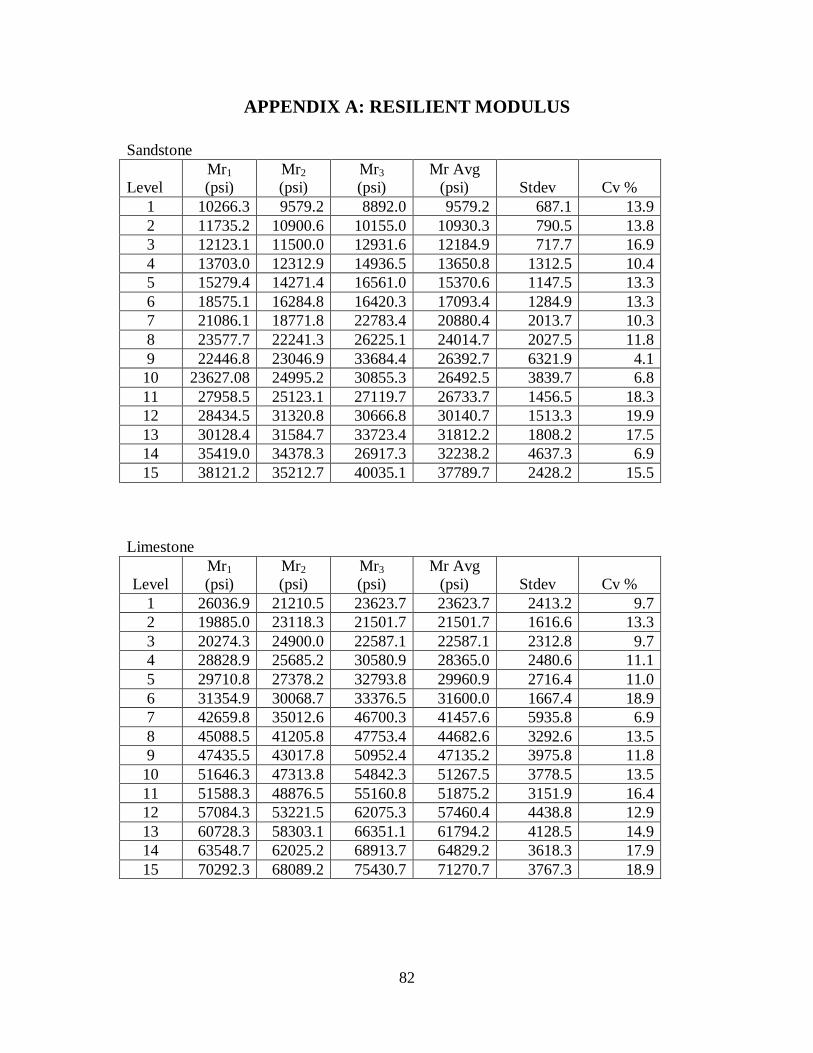
82
APPENDIX A: RESILIENT MODULUS
Sandstone
Level Mr1 (psi)
Mr2 (psi)
Mr3 (psi)
Mr Avg (psi) Stdev Cv %
1 10266.3 9579.2 8892.0 9579.2 687.1 13.9 2 11735.2 10900.6 10155.0 10930.3 790.5 13.8 3 12123.1 11500.0 12931.6 12184.9 717.7 16.9 4 13703.0 12312.9 14936.5 13650.8 1312.5 10.4 5 15279.4 14271.4 16561.0 15370.6 1147.5 13.3 6 18575.1 16284.8 16420.3 17093.4 1284.9 13.3 7 21086.1 18771.8 22783.4 20880.4 2013.7 10.3 8 23577.7 22241.3 26225.1 24014.7 2027.5 11.8 9 22446.8 23046.9 33684.4 26392.7 6321.9 4.1
10 23627.08 24995.2 30855.3 26492.5 3839.7 6.8 11 27958.5 25123.1 27119.7 26733.7 1456.5 18.3 12 28434.5 31320.8 30666.8 30140.7 1513.3 19.9 13 30128.4 31584.7 33723.4 31812.2 1808.2 17.5 14 35419.0 34378.3 26917.3 32238.2 4637.3 6.9 15 38121.2 35212.7 40035.1 37789.7 2428.2 15.5
Limestone
Level
Mr1 (psi)
Mr2 (psi)
Mr3 (psi)
Mr Avg (psi) Stdev Cv %
1 26036.9 21210.5 23623.7 23623.7 2413.2 9.7 2 19885.0 23118.3 21501.7 21501.7 1616.6 13.3 3 20274.3 24900.0 22587.1 22587.1 2312.8 9.7 4 28828.9 25685.2 30580.9 28365.0 2480.6 11.1 5 29710.8 27378.2 32793.8 29960.9 2716.4 11.0 6 31354.9 30068.7 33376.5 31600.0 1667.4 18.9 7 42659.8 35012.6 46700.3 41457.6 5935.8 6.9 8 45088.5 41205.8 47753.4 44682.6 3292.6 13.5 9 47435.5 43017.8 50952.4 47135.2 3975.8 11.8
10 51646.3 47313.8 54842.3 51267.5 3778.5 13.5 11 51588.3 48876.5 55160.8 51875.2 3151.9 16.4 12 57084.3 53221.5 62075.3 57460.4 4438.8 12.9 13 60728.3 58303.1 66351.1 61794.2 4128.5 14.9 14 63548.7 62025.2 68913.7 64829.2 3618.3 17.9 15 70292.3 68089.2 75430.7 71270.7 3767.3 18.9

83
Granite
Level Mr1 (psi)
Mr2 (psi)
Mr3 (psi)
Mr Avg (psi) Stdev Cv %
1 18617.1 17179.2 19453.7 18416.7 1150.4 16.0 2 19674.4 18023.1 20724.4 19474.0 1361.7 14.3 3 23848.2 21023.9 26071.2 23647.7 2529.6 9.3 4 24956.0 22018.7 27292.0 24755.6 2642.3 9.3 5 26828.5 24030.1 29025.5 26628.0 2503.7 10.6 6 37285.4 33132.5 40836.9 37084.9 3856.1 9.6 7 37576.5 34102.8 40448.8 37376.0 3177.7 11.7 8 40106.1 37045.2 42565.6 39905.6 2765.6 14.4 9 45323.3 41156.5 48888.8 45122.9 3870.0 11.6
10 47220.1 43028.5 50810.4 47019.7 3894.8 12.0 11 52850.5 48301.5 56798.2 52650.1 4251.8 12.3 12 59809.9 52089.6 66928.8 59609.4 7421.6 8.0 13 63053.7 58109.8 67396.2 62853.2 4646.4 13.5 14 62780.3 58523.5 66435.8 62579.9 3959.9 15.8 15 63401.6 59444.2 66757.7 63201.2 3660.8 17.2

84
Level Cf(psi) Dev(psi) Mr(psi) CV% Bulk Stress N-Bulk Stress OCT stress Pre Mr SSR SST Error1 3.1 5.7 10266.4 5.8 15.0 1.0 1.2 10037.5 120451656.5 1.15E+08 0.000502 3.1 8.8 11735.3 8.7 18.1 1.2 1.3 11337.7 93602745.1 8.61E+07 0.001153 5.0 4.8 11937.8 4.8 19.8 1.3 1.2 11947.2 82180544.0 8.24E+07 0.000004 5.0 9.9 13703.0 9.7 24.9 1.7 1.3 13863.8 51104204.0 5.34E+07 0.000145 5.0 14.9 15279.4 14.5 29.9 2.0 1.5 15633.7 28931427.4 3.29E+07 0.000546 10.0 9.9 18575.1 9.8 39.8 2.7 1.3 18644.2 5608859.9 5.94E+06 0.000017 10.0 20.1 21086.1 19.8 50.0 3.4 1.6 21667.6 429088.4 5.42E+03 0.000768 10.0 29.9 23577.7 29.9 59.8 4.1 2.0 24395.8 11446801.8 6.58E+06 0.001209 15.0 9.8 22446.9 9.9 54.8 3.7 1.3 22794.4 3175257.8 2.06E+06 0.00024
10 15.0 14.7 23627.1 14.8 59.8 4.1 1.5 24172.9 9988272.4 6.84E+06 0.0005311 15.0 30.1 27958.5 30.1 75.1 5.1 2.0 28155.4 51021152.8 4.82E+07 0.0000512 19.8 14.9 28434.5 14.9 74.4 5.1 1.5 27721.0 45003500.9 5.51E+07 0.0006313 20.0 20.0 30128.5 20.0 80.1 5.4 1.6 29134.1 65959350.3 8.31E+07 0.0010914 20.0 40.2 35419.0 40.2 100.3 6.8 2.3 33944.0 167223265.6 2.08E+08 0.00173
a.
The table is an example of the utilizing solver to solve for regression coefficients.
Constitutive Generalized Model fit using Excel Solver
k1(psi) k2(psi) k3 R2 671.6144 0.628759 0.033566 0.937

85
APPENDIX B: MOISTURE DENSITY CURVES
Standard Proctor a)Limestone b) Sandstone c)Granite
MOISTURE - DENSITY PLOT
125.0
130.0
135.0
140.0
145.0
0.0% 2.0% 4.0% 6.0% 8.0% 10.0%
MOISTURE CONTENT, %
DR
Y D
EN
SIT
Y
pcf
MOISTURE - DENSITY PLOT
130.0
132.0
134.0
136.0
138.0
0.0% 5.0% 10.0%MOISTURE CONTENT, %
DR
Y D
EN
SITY
pcf
MOISTURE - DENSITY PLOT
125.0126.0127.0128.0129.0130.0131.0132.0133.0
0.0% 2.0% 4.0% 6.0% 8.0%
MOISTURE CONTENT, %
DR
Y D
EN
SIT
Ypc
fa
b
c
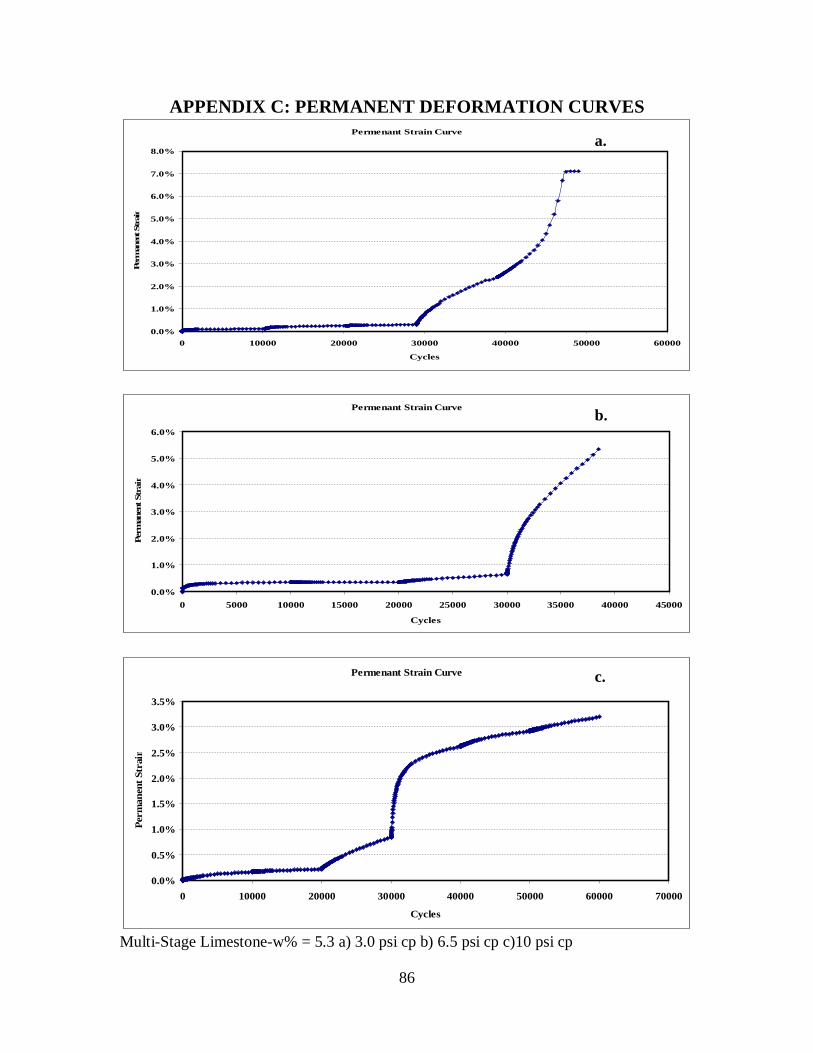
86
APPENDIX C: PERMANENT DEFORMATION CURVES
Multi-Stage Limestone-w% = 5.3 a) 3.0 psi cp b) 6.5 psi cp c)10 psi cp
Permenant Strain Curve
0.0%
1.0%
2.0%
3.0%
4.0%
5.0%
6.0%
7.0%
8.0%
0 10000 20000 30000 40000 50000 60000
Cycles
Perm
anen
t Str
ain
Permenant Strain Curve
0.0%
1.0%
2.0%
3.0%
4.0%
5.0%
6.0%
0 5000 10000 15000 20000 25000 30000 35000 40000 45000
Cycles
Perm
anen
t Str
ain
Permenant Strain Curve
0.0%
0.5%
1.0%
1.5%
2.0%
2.5%
3.0%
3.5%
0 10000 20000 30000 40000 50000 60000 70000
Cycles
Perm
anen
t Str
ain
a.
b.
c.
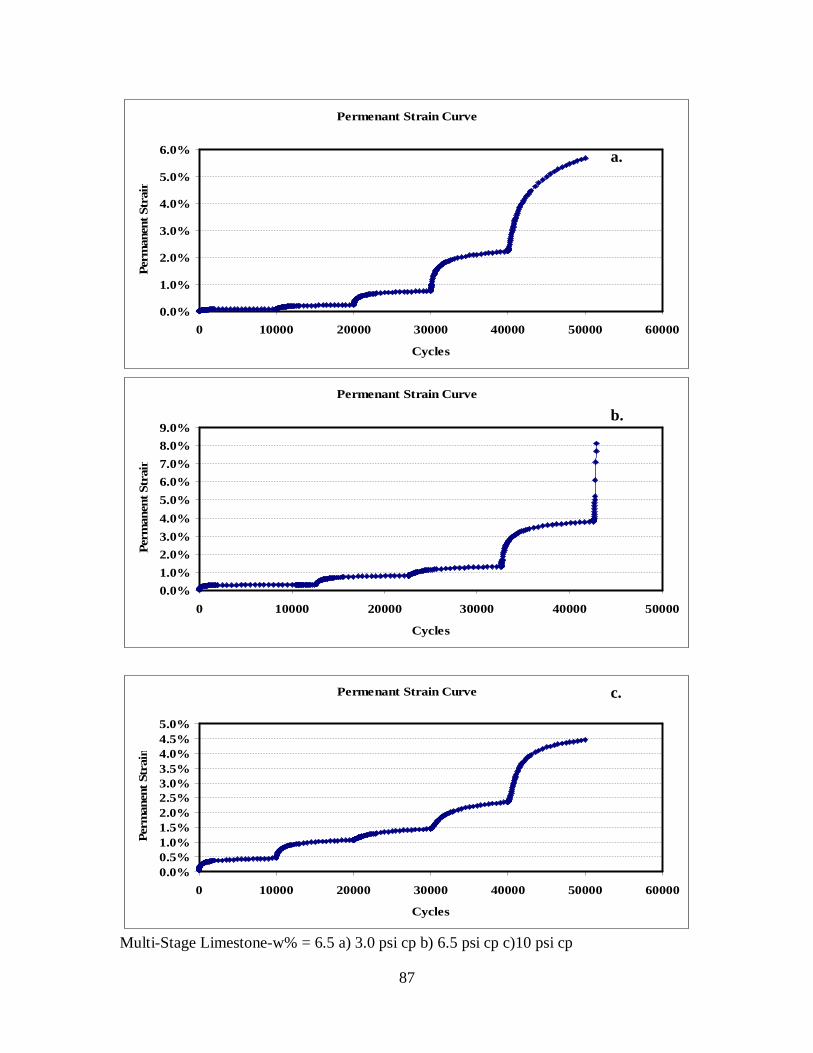
87
Multi-Stage Limestone-w% = 6.5 a) 3.0 psi cp b) 6.5 psi cp c)10 psi cp
Permenant Strain Curve
0.0%
1.0%
2.0%
3.0%
4.0%
5.0%
6.0%
0 10000 20000 30000 40000 50000 60000
Cycles
Perm
anen
t Str
ain
Permenant Strain Curve
0.0%1.0%2.0%3.0%4.0%5.0%6.0%7.0%8.0%9.0%
0 10000 20000 30000 40000 50000
Cycles
Perm
anen
t Str
ain
Permenant Strain Curve
0.0%0.5%1.0%1.5%2.0%2.5%3.0%3.5%4.0%4.5%5.0%
0 10000 20000 30000 40000 50000 60000
Cycles
Perm
anen
t Str
ain
a.
c.
b.
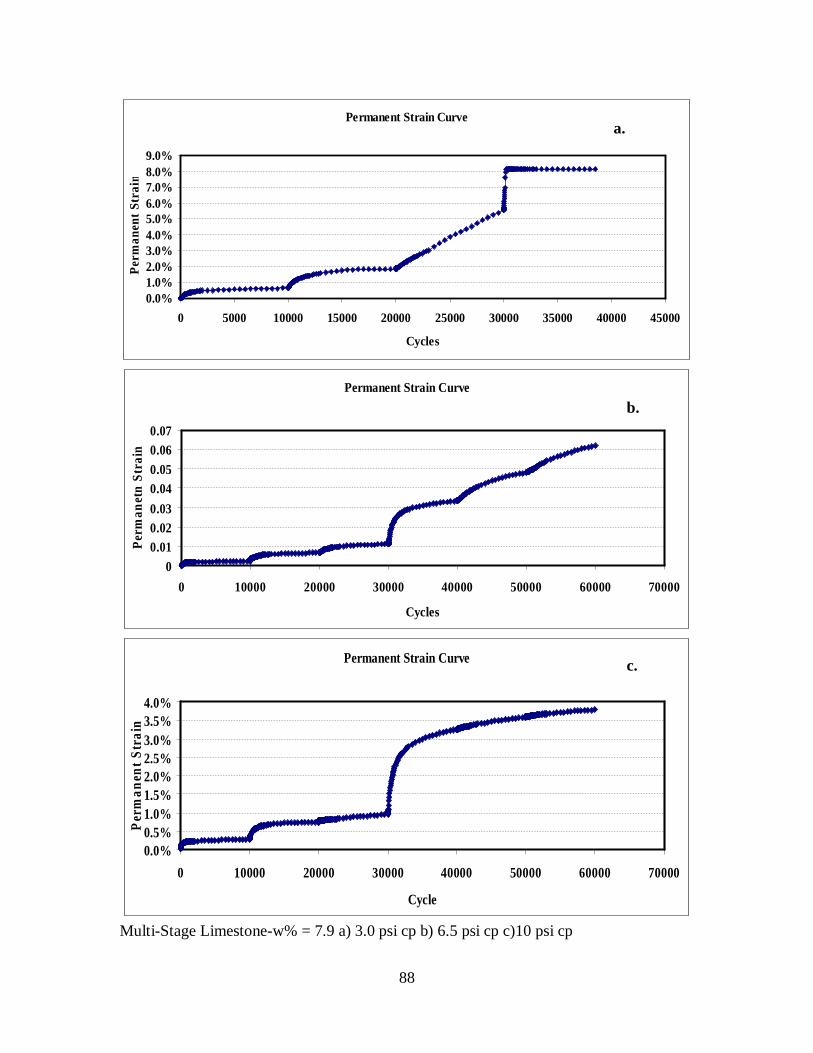
88
Multi-Stage Limestone-w% = 7.9 a) 3.0 psi cp b) 6.5 psi cp c)10 psi cp
Permanent Strain Curve
0.0%1.0%2.0%3.0%4.0%5.0%6.0%7.0%8.0%9.0%
0 5000 10000 15000 20000 25000 30000 35000 40000 45000
Cycles
Perm
anen
t Str
ain
Permanent Strain Curve
00.010.020.030.040.050.060.07
0 10000 20000 30000 40000 50000 60000 70000
Cycles
Perm
anet
n St
rain
Permanent Strain Curve
0.0%0.5%1.0%1.5%2.0%2.5%3.0%3.5%4.0%
0 10000 20000 30000 40000 50000 60000 70000
Cycle
Perm
anen
t Str
ain
a.
b.
c.
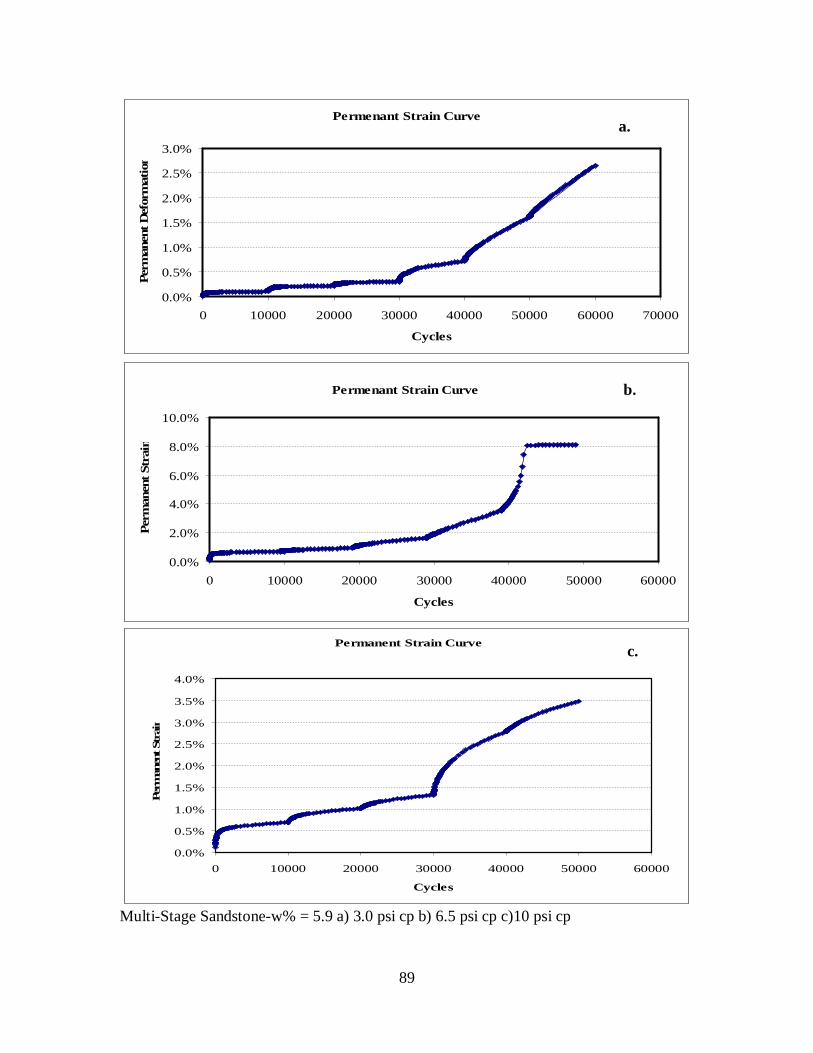
89
Multi-Stage Sandstone-w% = 5.9 a) 3.0 psi cp b) 6.5 psi cp c)10 psi cp
Permenant Strain Curve
0.0%
0.5%
1.0%
1.5%
2.0%
2.5%
3.0%
0 10000 20000 30000 40000 50000 60000 70000
Cycles
Perm
anen
t Def
orm
atio
n
Permenant Strain Curve
0.0%
2.0%
4.0%
6.0%
8.0%
10.0%
0 10000 20000 30000 40000 50000 60000
Cycles
Perm
anen
t Str
ain
Permanent Strain Curve
0.0%
0.5%
1.0%
1.5%
2.0%
2.5%
3.0%
3.5%
4.0%
0 10000 20000 30000 40000 50000 60000
Cycles
Perm
anen
t Str
ain
a.
b.
c.

90
Multi-Stage Sandstone-w% = 7.1 a) 3.0 psi cp b) 6.5 psi cp c)10 psi cp
Permenant Strain Curve
0.0%
0.5%
1.0%
1.5%
2.0%
2.5%
3.0%
0 10000 20000 30000 40000
Cycles
Perm
anen
t Str
ain
Permenant Strain Curve
0.0%1.0%2.0%3.0%4.0%5.0%6.0%7.0%8.0%9.0%
0 10000 20000 30000 40000 50000
Cycles
Perm
anen
t Str
ain
Permenant Strain Curve
0.0%
0.5%
1.0%
1.5%
2.0%
2.5%
0 10000 20000 30000 40000 50000 60000
Cycles
Perm
anen
t Str
ain
a.
b.
c.
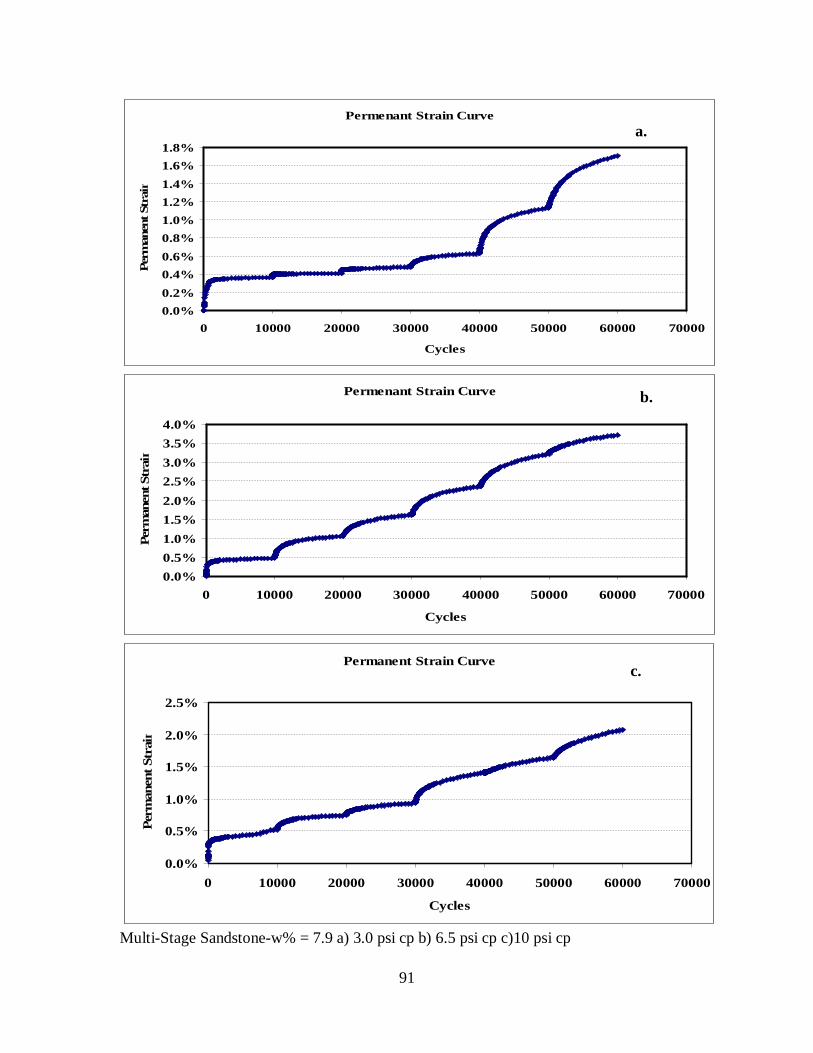
91
Multi-Stage Sandstone-w% = 7.9 a) 3.0 psi cp b) 6.5 psi cp c)10 psi cp
Permenant Strain Curve
0.0%0.2%0.4%0.6%0.8%1.0%1.2%1.4%1.6%1.8%
0 10000 20000 30000 40000 50000 60000 70000
Cycles
Perm
anen
t Str
ain
Permenant Strain Curve
0.0%0.5%1.0%1.5%2.0%2.5%3.0%3.5%4.0%
0 10000 20000 30000 40000 50000 60000 70000
Cycles
Perm
anen
t Str
ain
Permanent Strain Curve
0.0%
0.5%
1.0%
1.5%
2.0%
2.5%
0 10000 20000 30000 40000 50000 60000 70000
Cycles
Perm
anen
t Str
ain
a.
b.
c.

92
Single-Stage-3.0 psi cp a) Limestone b) Sandstone c) Granite
0.0%
0.5%
1.0%
1.5%
2.0%
2.5%
3.0%
0 2000 4000 6000 8000 10000 12000
Load cycles
Perm
anen
t Str
ain
Sample 1
Sample 2
Sample 3
0.0%
1.0%
2.0%
3.0%
4.0%
5.0%
6.0%
0 2000 4000 6000 8000 10000 12000
Load cycles
Perm
anen
t Strai
n
Sample 1
Sample 2
Sample 3
0.0%
0.2%
0.4%0.6%
0.8%
1.0%
1.2%
1.4%1.6%
1.8%
2.0%
0 2000 4000 6000 8000 10000 12000
Load cycles
Perm
anen
t Str
ain
Sample 1
Sample 2
Sample 3
a.
b.
c.
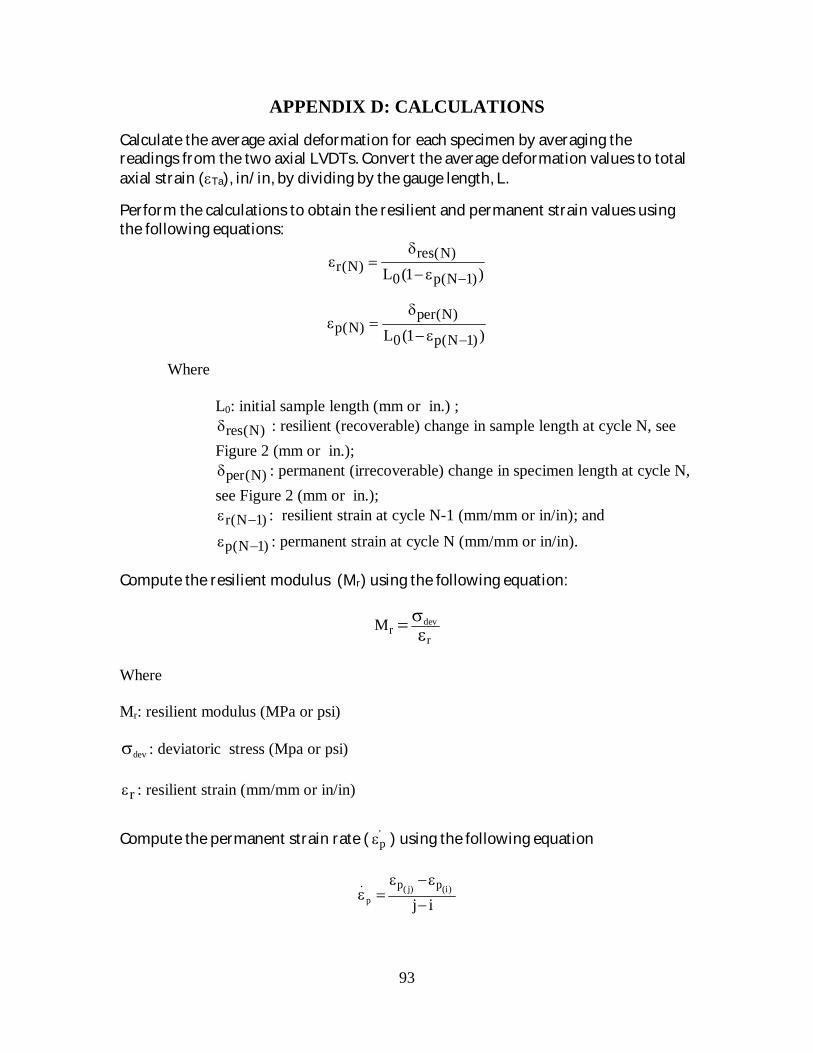
93
APPENDIX D: CALCULATIONS
Calculate the average axial deformation for each specimen by averaging the readings from the two axial LVDTs. Convert the average deformation values to total axial strain (Ta), in/in, by dividing by the gauge length, L.
Perform the calculations to obtain the resilient and permanent strain values using the following equations:
res(N)r(N)
0 p(N 1)L (1 )
per(N)p(N)
0 p(N 1)L (1 )
Where
L0: initial sample length (mm or in.) ; res(N) : resilient (recoverable) change in sample length at cycle N, see
Figure 2 (mm or in.); per(N) : permanent (irrecoverable) change in specimen length at cycle N,
see Figure 2 (mm or in.); r(N 1) : resilient strain at cycle N-1 (mm/mm or in/in); and
p(N 1) : permanent strain at cycle N (mm/mm or in/in).
Compute the resilient modulus (Mr) using the following equation:
devr
rM
Where
Mr: resilient modulus (MPa or psi)
dev : deviatoric stress (Mpa or psi)
r : resilient strain (mm/mm or in/in)
Compute the permanent strain rate (.p ) using the following equation
( j) (i)p
. p p
j i

94
Where .p : permanent strain rate (strain /cycle)
( j)p : permanent strain at cycle j
(i)p : permanent strain at cycle i
i and j: ith and jth cycle numbers
Compute the and mean effective pressure (p) for each stage in each sequence using the following equation
1 2 31 ( )3 3
d
cp
Where d is the devitoric stress c is the confining stress Note: The above calculations are referenced in “Test Method for Multi-Stage Repeated Loading Triaxial Test.”
95
VITA
Aaron Austin was born in November, 1978, to Howard C. Austin and Aurelia W. Austin.
Being the ninth of eleven children, Aaron was the first in his family to graduate high
school and go on to college. Aaron enrolled at Louisiana Tech University in the Fall of
1996 and graduated in Spring 2002. At that time of graduation, America was still healing
from the terrorist attacks on September 11, 2001, and the economy had stalled from the
trauma. Despite the economy, Aaron joined the Louisiana Department of Transportation
and began work as Geotechnical Research Engineer. In the fall of 2006 Aaron resigned
from Louisiana Department of Transportation and entered the civil engineering graduate
program at Louisiana State University. Aaron Austin will graduate on May 12th, 2009 and
will receive a master’s degree in civil engineering with an emphasis in geotechnical
engineering.