![Index [] · elution from ion exchange, 882-3 extraction by ion exchange resins, 878-82 extraction by resin-in-pulp process, 883-5 extraction by solvent extraction process, 885, 889](https://static.fdocuments.in/doc/165x107/5e854e4af2483d734911ad30/index-elution-from-ion-exchange-882-3-extraction-by-ion-exchange-resins-878-82.jpg)
Fundamental and Applied Studies of Metal Ion Extraction by ...
261
University of Wisconsin Milwaukee UWM Digital Commons eses and Dissertations December 2012 Fundamental and Applied Studies of Metal Ion Extraction by Crown Ethers into Imidazolium- Based Room Temperature Ionic Liquids Cory Hawkins University of Wisconsin-Milwaukee Follow this and additional works at: hps://dc.uwm.edu/etd Part of the Analytical Chemistry Commons is Dissertation is brought to you for free and open access by UWM Digital Commons. It has been accepted for inclusion in eses and Dissertations by an authorized administrator of UWM Digital Commons. For more information, please contact [email protected]. Recommended Citation Hawkins, Cory, "Fundamental and Applied Studies of Metal Ion Extraction by Crown Ethers into Imidazolium-Based Room Temperature Ionic Liquids" (2012). eses and Dissertations. 54. hps://dc.uwm.edu/etd/54
Transcript of Fundamental and Applied Studies of Metal Ion Extraction by ...

University of Wisconsin MilwaukeeUWM Digital Commons
Theses and Dissertations
December 2012
Fundamental and Applied Studies of Metal IonExtraction by Crown Ethers into Imidazolium-Based Room Temperature Ionic LiquidsCory HawkinsUniversity of Wisconsin-Milwaukee
Follow this and additional works at: https://dc.uwm.edu/etdPart of the Analytical Chemistry Commons
This Dissertation is brought to you for free and open access by UWM Digital Commons. It has been accepted for inclusion in Theses and Dissertationsby an authorized administrator of UWM Digital Commons. For more information, please contact [email protected].
Recommended CitationHawkins, Cory, "Fundamental and Applied Studies of Metal Ion Extraction by Crown Ethers into Imidazolium-Based RoomTemperature Ionic Liquids" (2012). Theses and Dissertations. 54.https://dc.uwm.edu/etd/54

FUNDAMENTAL AND APPLIED STUDIES OF METAL ION EXTRACTION BY
CROWN ETHERS INTO IMIDAZOLIUM-BASED ROOM TEMPERATURE IONIC
LIQUIDS
by
Cory Hawkins
A Dissertation Submitted in
Partial Fulfillment of the
Requirements for the Degree of
Doctor of Philosophy
in Chemistry
at
The University of Wisconsin-Milwaukee
December 2012

ii
ABSTRACT
FUNDAMENTAL AND APPLIED STUDIES OF METAL ION EXTRACTION BY
CROWN ETHERS INTO IMIDAZOLIUM-BASED ROOM TEMPERATURE IONIC
LIQUIDS
by
Cory Hawkins
The University of Wisconsin-Milwaukee, 2012
Under the Supervision of Professor Mark Dietz, Ph.D.
Growing recognition of the extraordinary physicochemical properties and unique
solvation environment afforded by ionic liquids (ILs) has drawn increasing attention to
these solvents as media for chemical separations. Until recently, little was known about
how ionic liquids behave as solvents in this application, particularly in the extraction of
ionic solutes such as metal ions. In contrast to the single pathway observed using
molecular diluents (i.e., neutral complex extraction), metal ion extraction in these
systems has been shown to proceed through as many as three competing pathways over a
wide range of conditions. Despite this added complexity, the favorable physicochemical
characteristics of the ionic liquids (e.g., non-flammability and unprecedented structural
tunability), along with the higher extraction efficiencies and selectivities sometimes
observed with these solvents, suggest that they offer significant potential in various
separations applications on both the industrial and analytical scale. This potential will not
be fully realized, however, without an improved understanding of the fundamental
aspects of metal ion partitioning between ionic liquids and aqueous solutions. The
objective of this work, therefore, is to clarify the factors controlling the balance among

iii
the various partitioning pathways observed when these solvents are employed in
extraction.
To this end, a series of N,N’-dialkylimidazolium-based ionic liquids have been
evaluated as substitutes for the conventional organic solvents (i.e., n-alcohols) frequently
employed in the extraction of alkali and alkaline earth cations from acidic aqueous phases
by crown ethers. Insight into the fundamental aspects of metal ion extraction in these
systems has been obtained by analysis of the acid and extractant dependencies of metal
ion distribution ratios, measurements of the IL phase water content and of the solubility
of the ionic liquids in the aqueous phase, determination of the partitioning of inorganic
ions, and consideration of the relative hydrophobicities of the ionic liquids employed. To
assess the potential practical utility of these ionic liquids as extraction solvents, these
studies were aimed at obtaining information about the relationship between solvent
structure and performance as solvents in the extraction of alkali and alkaline earth metal
ions. The results obtained represent an important step in the development of guidelines
for the rational design of ionic liquid-based metal ion separation systems.

iv
© Copyright by Cory Hawkins, 2012
All Rights Reserved

v
Table of Contents
LIST OF FIGURES ........................................................................................................... ix
LIST OF TABLES ............................................................................................................ xii
DEDICATION ................................................................................................................. xiv
ACKNOWLEDGEMENTS .............................................................................................. xv
CHEMICAL QUOTATION ........................................................................................... xvii
CHAPTER 1: INTRODUCTION ...................................................................................... 1
1.1 Overview and Scope ........................................................................................... 1
1.2 Ionic Liquids ....................................................................................................... 3
1.3 Solvent Extraction of Metal Ions into Conventional Organic Solvents ......... 6
1.4 Extraction Chromatographic Systems ............................................................. 8
1.5 Extraction of Metal Ions Into Ionic Liquids .................................................. 12
1.6 Overview of the Chapters ................................................................................ 15
1.7 References ......................................................................................................... 18
CHAPTER 2: DEVELOPMENT OF A NOVEL TANDEM METHOD FOR THE
RAPID ISOLATION OF RADIOSTRONTIUM FROM HUMAN URINE ................... 21
2.1 Introduction ...................................................................................................... 21
2.2 Experimental ..................................................................................................... 23
2.2.1 Materials ............................................................................................... 24
2.2.2 Instruments ............................................................................................ 24
2.2.3 Methods ................................................................................................ 25
2.2.4 Overview of the Procedure ................................................................... 25
2.3 Development of a Rapid Sample Pretreatment ............................................. 28
2.3.1 Removal of urine matrix components ................................................... 28
2.3.2 Uptake of strontium by pretreatment adsorbents .................................. 31
2.3.3 Selected preteatment ............................................................................. 32
2.4 Retention of Strontium and Sodium on Diphonix® Resin ............................ 33
2.4.1 Dependence of strontium and sodium uptake on acid concentration ... 33
2.4.2 Diphonix® Column trials ...................................................................... 37
2.5 Suggested Process ............................................................................................. 44
2.6 Conclusions ....................................................................................................... 47
2.7 Acknowledgements ........................................................................................... 49
2.8 References ......................................................................................................... 49
CHAPTER 3: THREE-PATH MODEL OF METAL ION EXTRACTION
INTO IONIC LIQUIDS .................................................................................................... 51
3.1 Introduction ...................................................................................................... 51
3.2 Experimental ..................................................................................................... 54
3.2.1 Materials ............................................................................................... 54
3.2.2 Instruments ............................................................................................ 54

vi
3.2.3 Methods ................................................................................................ 55
3.3 Generality of the Three-Path Model for Groups 1 and 2 Ions ..................... 57
3.3.1 Nitric acid dependency of DM for extraction into aliphatic alcohols by
DCH18C6 ............................................................................................. 57
3.3.2 Metal ion vs. nitrate extraction into CnmimTf2N ILs by DCH18C6 .... 62
3.3.3 Nitric acid dependency of DM for extraction into CnmimTf2N ILs by
DCH18C6 ............................................................................................. 64
3.3.4 Influence of Hard/Soft Lewis Acid Character of Extracted Metal
Ions ....................................................................................................... 71
3.3.5 Crown ether dependency of DM for extraction into CnC1imTf2N ILs
by DCH18C6 .................................................................................................. 72
3.3.6 Implcations for Extraction Efficiencies and Selectivities ..................... 76
3.4 Conclusions ....................................................................................................... 80
3.5 Acknolwedgements ........................................................................................... 80
3.6 References ......................................................................................................... 81
CHAPTER 4: THE ROLE OF IONIC LIQUID PHASE WATER CONTENT ............. 84
4.1 Introduction ...................................................................................................... 84
4.2 Experimental ..................................................................................................... 86
4.2.1 Materials ............................................................................................... 86
4.2.2 Instruments .......................................................................................... 105
4.2.3 Methods .............................................................................................. 106
4.3 Effect of Ionic Liquid Water Content on Strontium Extraction................ 107
4.3.1 Nitric acid dependency of DM for extraction into aliphatic alcohols by
DCH18C6 ........................................................................................... 107
4.3.2 Relationship between ionic liquid-water mutual solubilities and metal
ion extraction into CnC4imTf2N and CnOHC4imTf2N ionic liquids ... 113
4.3.3 Direct correlation of strontium nitrate extraction with ionic liquid phase
water content ...................................................................................... 118
4.5 Conclusions ..................................................................................................... 127
4.6 Acknowledgements ......................................................................................... 128
4.7 References ....................................................................................................... 128
CHAPTER 5: DEVELOPMENT AND EVALUATION OF A HIGH PERFORMANCE
LIQUID CHROMATOGRAPHIC METHOD FOR IONIC LIQUID DETERMINATION
........................................................................................................................................ 130
5.1 Introduction .................................................................................................... 130
5.2 Experimental ................................................................................................... 133
5.2.1 Materials ............................................................................................. 133
5.2.2 Instruments .......................................................................................... 134
5.2.3 Methods .............................................................................................. 134
5.3 Development of an HPLC-UV Method for IL Analysis .............................. 135
5.3.1 Method optimization ........................................................................... 135
5.3.2 Evaluation of method merits ............................................................... 140

vii
5.4 Characterization of the Retention Mechanisms of the HPLC Method ..... 141
5.4.1 Silica column characteristics .............................................................. 141
5.4.2 Effect of solvent strength on retention ................................................ 143
5.4.3 Influence of temperature on the separation process ............................ 148
5.4.4 Effect of changing buffer concentration on retention ......................... 153
5.5 Conclusions ..................................................................................................... 158
5.6 References ....................................................................................................... 160
CHAPTER 6: THE ROLE OF IONIC LIQUID CATION HYDROPHOBICITY ....... 163
6.1 Introduction .................................................................................................... 163
6.1.1 Impetus for studies of ionic liquid hydrophobicity ............................. 163
6.1.2 The hydrophobic effect ....................................................................... 164
6.1.3 Octanol-water partition coefficients for ionic liquids ......................... 168
6.2 Experimental ................................................................................................... 174
6.2.1 Materials ............................................................................................. 174
6.2.2 Instruments .......................................................................................... 175
6.2.3 Methods............................................................................................... 176
6.3 Determination of Ionic Liquid Hydrophobicity ........................................... 180
6.3.1 Methods comparison of the slow-stirring and shake-flask
techniques ........................................................................................... 180
6.3.2 Relationship of Dow to carbon number of the IL cation ...................... 182
6.3.3 Correlation of Dow to strontium extraction behavior of ionic
liquids ................................................................................................. 185
6.3.4 Chromatographic prediction of Dow .................................................... 187
6.4 Conclusions ..................................................................................................... 189
6.5 References ....................................................................................................... 190
CHAPTER 7: PLACING QUALITATIVE TRENDS OF METAL ION
EXTRACTION INTO A QUANTITATIVE CONTEXT .............................................. 193
7.1 Introduction .................................................................................................... 193
7.2 Experimental ................................................................................................... 195
7.2.1 Materials ............................................................................................. 195
7.2.2 Instruments .......................................................................................... 196
7.2.3 Methods............................................................................................... 197
7.3 Measuring the contributions of two prominent pathways .......................... 201
7.3.1 Extraction of strontium from water by DCH18C6 in C5C1imTf2N .... 201
7.3.2 Results for the determination of two contributions by subtraction ..... 203
7.4 Conclusions ..................................................................................................... 207
7.5 References ....................................................................................................... 208
CHAPTER 8: EFFORTS TOWARD IMPROVED METAL ION EXTRACTION
SYSTEMS BASED ON IONIC LIQUIDS..................................................................... 209
8.1 Introduction .................................................................................................... 209

viii
8.2 Experimental ................................................................................................... 210
8.2.1 Materials ............................................................................................. 210
8.2.2 Instruments .......................................................................................... 211
8.2.3 Methods .............................................................................................. 211
8.3 Solvent Extraction .......................................................................................... 216
8.3.1 Conventional ionic liquid solvents ..................................................... 216
8.3.2 Feasibility of magnetic ionic liquids as solvents ................................ 219
8.4 Extraction Chromatographic Materials ....................................................... 222
8.4.1 Ionic Liquid-based Sr-selective resin ................................................. 222
8.4.2 Application to column chromatography ............................................. 225
8.5 Conclusions ..................................................................................................... 227
8.6 References ....................................................................................................... 228
CHAPTER 9: CONCLUSIONS AND RECOMMENDATIONS ................................. 234
9.1 Conclusions ..................................................................................................... 234
9.2 Recommendations .......................................................................................... 238
9.2.1 Expanding the knowledge base to other ionic liquid families ............ 238
9.2.2 Determining theeffect of self-aggregation of ionic liquids on behavior
as solvents ........................................................................................... 238
8.2.3 Developing a useful chromatographic resin from ionic liquids .......... 239
9.3 References ....................................................................................................... 240
CIRRICULUM VITAE .................................................................................................. 241

ix
List of Figures
Figure 1.1: Structures of common ionic liquid cations and anions..................................... 5 Figure 2.1: Overview of procedure for rapid
90Sr sorption, purification, and
concentration from human urine samples ......................................................................... 27
Figure 2.2: UV spectrum of acidified urine before and after treatment with activated
charcoal ............................................................................................................................. 31
Figure 2.3: Methanesulfonic acid dependency of Sr2+
and Na+ retention by Diphonix
®
resin ................................................................................................................................... 35
Figure 2.4: Dependence of kex for 85
Sr and 22
Na on Diphonix® resin on the molar
concentration of Na+/K
+ (1:1) ions ................................................................................... 36
Figure 2.5: Acid dependency of Sr2+
retention by Diphonix® resin ................................ 37
Figure 2.6. Elution profiles for the column where ion concentrations in the eluate are
plotted vs. the number of column volumes ....................................................................... 39
Figure 2.7. Column test using standardized certified normal human urine ...................... 42
Figure 2.8. Column test elution profiles and Sr2+
stripping data using certified normal
human urine on 2 mL Diphonix resin columns ................................................................ 43 Figure 2.9. Tandem Diphonix
®-Sr Resin column treatment steps in the proposed
schemefor rapid sorption, decontamination, and concentration of 90
Sr from human
urine samples .................................................................................................................... 46
Figure 3.1: The three-path model for metal ion partitioning between nitric acid solution
and CnC1imTf2N ionic liquids in the presence of DCH18C6 ........................................... 53
Figure 3.2: Effect of nitric acid concentration on the extraction of Na+ (panel A) and K
+
(panel B) by DCH18C6 (0.10 M) in 1-pentanol (), 1-hexanol (), 1-octanol (■), and
1-decanol () .................................................................................................................... 60
Figure 3.3: Effect of nitric acid concentration on the extraction of Ca2+
(panel A), Sr2+
(panel B), and Ba2+
(panel C) by DCH18C6 (0.10 M) in 1-pentanol (), 1-hexanol (),
1-octanol (■), and 1-decanol () ...................................................................................... 61

x
Figure 3.4: Effect of nitric acid concentration on the extraction of Ca2+
(panel A),
Sr2+
(panel B), and Ba2+
(panel C) by DCH18C6 (0.10 M) in C5C1imTf2N (),
C6C1imTf2N (), C8C1imTf2N (), and C10C1imTf2N () .............................................. 66
Figure 3.5: Effect of nitric acid concentration on the extraction of Na+ (panel A) and
K+(panel B), and Cs
+ (panel C) by DCH18C6 (0.10 M) in C5C1imTf2N (),
C6C1imTf2N (), C8C1imTf2N (), and C10C1imTf2N () .............................................. 67
Figure 3.6: Effect of DCH18C6 concentration on the extraction of Na+ (■), K
+ (),
Cs+() (panel A); Sr
2+ () and Ba
2+ () (panel B) from 3.0 M nitric acid into
C10C1imTf2N ..................................................................................................................... 73
Figure 3.7: Effect of DCH18C6 concentration on the extraction of Sr2+
from 0.050 M
HNO3 () 1.0 M HNO3 () and 3.0 M HNO3 () into C10C1imTf2N ............................ 76
Figure 3.8: Effect of nitric acid concentration on the extraction of Sr2+
(), Na+ (),
and Ca2+
() into 1-octanol (left panel) and C10C1imTf2N (right panel) .......................... 78
Scheme 4.1: Synthesis of Imidazolium-based RTILs ...................................................... 88
Scheme 4.2: Synthesis of Hexylimidazole and Octylimidazole ...................................... 90
Figure 4.1: Effect of nitric acid concentration on the extraction of Ca2+
(panel A),
Sr2+
(panel B), and Ba2+
(panel C) by DCH18C6 (0.10 M) in C5OHC1imTf2N (),
C8OHC1imTf2N (), C10OHC1imTf2N (), and C12OHC1imTf2N () ........................ 110
Figure 4.2: Effect of nitric acid concentration on the extraction of Sr2+
by DCH18C6
(0.10 M) in C8OHC1imTf2N (), C8OHC4imTf2N (), C8C1imTf2N (), and 1-octanol
() ................................................................................................................................... 111
Figure 4.3: Effect of nitric acid concentration on the extraction of Sr2+
by DCH18C6
(0.10 M) in C10OHC1imTf2N (), C10OHC4imTf2N (), C12OHC4imTf2N (),
C10C1imTf2N (), and 1-decanol () ............................................................................ 114
Figure 4.4: Effect of nitric acid concentration on the extraction of Sr2+
by DCH18C6
(0.10 M) in C10OHC1imTf2N (), C10OHC4imTf2N (), C12OHC4imTf2N (),
C10C1imTf2N (), and 1-decanol () ............................................................................ 116
Figure 4.5: Extraction of Strontium from Water into 1-Alkyl-3-methylimidazolium ILs
Containing 0.20 M DCH18C6 ........................................................................................ 120
Figure 4.6: Effect of DCH18C6 concentration in C10C1imTf2N (), C10C2imTf2N (),
C10C4imTf2N (), and C10C6imTf2N () on the extraction of Sr2+
at 1.0 M nitric
acid .................................................................................................................................. 122

xi
Figure 4.7: Correlation of the conditional extraction constant with the water content of
the IL phase for strontium extraction into a series of C10CnimTf2N ILs at 1.0 M HNO3
and 0.050 M DCH18C6 .................................................................................................. 127
Figure 4.8: Correlation of the conditional extraction constant with the water content of
the IL phase for strontium extraction into the homologous series of C10CnimTf2N and
C12OHCnimTf2N ILs at 1.0 M HNO3 and 0.050 M DCH18C6 ...................................... 126
Figure 5.1: Overlay of Chromatograms from Injections of 60 μM C10C1imTf2N (top
trace in red) and C10C1imBr (lower trace in blue) in ACN ............................................. 138
Figure 5.2: Overlay of Chromatograms from the injection of a cocktail composed of nine
homologous 1,3-dialkylimidazolium bis[(trifluoromethyl)sulfonyl]imide ionic liquids
in 90:10 ACN:water ........................................................................................................ 139
Figure 5.3: Variation of logarithmic retention factor with carbon number of homologous
series of 1,3-dialkylimidazolium-based ILs .................................................................... 143
Figure 5.4: The effect of varying the volume fraction of water in the eluent (VB) on the
logarithmic retention factor ............................................................................................. 146
Figure 5.5: Bilogarithmic relationship of retention factor on the varying volume fraction
of water in the eluent (VB) .............................................................................................. 147
Figure 5.6: Temperature dependence of retention factors for ILs and the diluent
impurity ........................................................................................................................... 150
Figure 5.7: The effect of varying the ammonium formate buffer concentration on the
retention factor ................................................................................................................ 154
Figure 5.8: Plot of retention factor versus the reciprocal buffer concentration .............. 158
Figure 6.1: A model for the partitioning of ILs in an mctanol/water biphasic system ... 170
Figure 6.2: Photo of a slow-stirring device for Do,w measurement of C5C1imTf2N ...... 178
Figure 6.3: Correlation of log Dow for ILs obtained using the slow-stirring method with
the carbon number (Cn) of the long alkyl chain of CnC1imTf2N (), short alkyl chain of
C10CnimTf2N () and the sum of chains () ................................................................ 183 Figure 6.4: Correlation of log DSr with log Dow for various CnC1imTf2N ILs ................ 186
Figure 6.5: Correlation of log Dow with the reciprocal log k’ for various CnC1imTf2N
ILs ................................................................................................................................... 188

xii
Figure 7.1: Overlay of chromatograms from the injection of nitrate ion standards in (A)
30% methanol diluent and (B) 50% acetonitrile diluent ................................................. 199
Figure 7.2: Effect of the initial concentration of Sr(NO3)2 (1-10 mM and 30-50 mM) on
the dissolution of C5C1im+ in water in the extraction of strontium by DCH18C6 (0.10 M)
in C5C1imTf2N ................................................................................................................ 202
Figure 7.3: The effect of strontium extraction by DCH18C6 (0.10 M) in C5C1imTf2N on
the dissolution of C5C1im+ in the water .......................................................................... 206
Figure 8.1: Flow chart of the procedure used to determine extraction chromatographic
resin capacity .................................................................................................................. 215
Figure 8.2: Structure of 4z,5’z-cis-syn-cis-di(tert-butyl-cyclohexano)-18-crown-6 ...... 216
Figure 8.3: Effect of nitric acid concentration on the extraction of Sr2+
into () 1-octanol,
() C10C1imTf2N, and () C12OHC4imTf2N and Na+ into () 1-octanol and ()
C10C1imTf2N by 0.10 M 4z,5’z-cis-syn-cis-DtBu18C6 (left panel) and 0.10 M
DCH18C6 (right panel)................................................................................................... 217
Figure 8.4: Photos of the results from contacting [P666,14][FeCl4] with various aqueous
solutions .......................................................................................................................... 220
Figure 8.5: Photo of the results from contacting [C10C1im]2[Co(NCS)4] with (from left to
right) water, 0.1 M HNO3, 1 M HNO3, 4 M HNO3 ........................................................ 221
Figure 8.6: Effect of nitric acid concentration on the batch test uptake of strontium by
resins prepared with 1.0 M DtBuCH18C6 in 1-octanol, C10C1imTf2N or
C12OH4imTf2N ................................................................................................................ 224
Figure 8.7: Effect of DtBuCH18C6 concentration on extraction of strontium from 1 M
HNO3 into 1-octanol and C10C1imTf2N .......................................................................... 227
List of Tables
Table 2.1: Calculated values of Retention Coefficient (kex) for Sr resin .......................... 28
Table 2.2: Color observed during urine pretreatment ....................................................... 29
Table 2.3: Recovery of strontium from acidified urine treated with charcoal and
XAD-7............................................................................................................................... 33
Table 2.4: Trial data for Diphonix® column tests in simulated urine and human urine .. 40

xiii
Table 3.1: Parameters employed for potassium ion determination by ICP-AES ............. 56
Table 3.2: Parameters employed for potassium ion determination by ICP-MS ............... 56
Table 3.3: The effect of IL cation chain length on strontium, barium, and nitrate ion
partitioning between water and 0.20 M DCH18C6 in CnC1imTf2N ................................. 62
Table 3.4: The effect of IL cation chain length on sodium, potassium, cesium, and nitrate
ion partitioning between water and 0.20 M DCH18C6 in CnC1imTf2N ........................... 64
Table 3.5: Effect of nitric acid concentration on αSr/Na and αSr/Ca valuesa in extraction
from aqueous solution by 0.10 M DCH18C6 in 1-octanol and C10C1imTf2N .................. 79
Table 4.1: Structures and Nomenclature of the Ionic Liquid Cations Studied ............... 102
Table 4.2: Various Physicochemical Properties of Some Ionic Liquids Studied ........... 112
Table 4.3: Extraction Selectivity for Strontium over Sodium in 1-Octanol, C10C1imTf2N,
and C12OHC4imTf2N ...................................................................................................... 117
Table 4.4: Experimental and calculated values of the linear least-squares regression of
theconditional extractant constant with the water content of the IL phase for strontium
extraction in Figure 4.6 ................................................................................................... 124
Table 5.1: Best fit parameters, Ai, Bi of Eqn. 5-3, correlation coefficients R2, and the
calculated thermodynamic contributions to retention ..................................................... 152
Table 6.1: T-test comparison of the shake-flask method to the slow-stirring method ... 181
Table 7.1: Relative contributions from ion exchange and ion pair partitioning to the
extraction of strontium ions from water into 0.10 M DCH18C6 in C5C1imTf2N .......... 204
Table 8.1: Effect of DtBuCH18C6 concentration in C10C1imTf2N and 1-octanol on the
solvent extraction of Sr2+
from 1.0 M HNO3 .................................................................. 225
Table 8.2: Results of the column capacity measurements of resins ............................... 230

xiv
DEDICATION
For Jennifer, the love of my life…I am eternally grateful for your unwavering support
throughout our journey. And for my parents, who nurtured my interest in the sciences.

xv
ACKNOWLEDGEMENTS
I have many people to thank for their contributions over the years. First, I would like
to extend my gratitude to my advisor, Professor Mark Dietz. His guidance and wisdom
kept me engaged in this research. He has always been interested in the latest results and
as curious as I about their implications. Without his decisive involvement through the
milestones in this program and support for my professional development, I would not be
at this point in my career. I believe that we have cultivated a working partnership that has
surpassed my expectations for productivity.
My committee members have advised me well throughout this endeavor. I recognize
that Professor Joseph Aldstadt has been an advocate for me since applying for this
program. His interest in history and breadth of knowledge in the analytical sciences are
exemplary. Professor Andrew Pacheco has always listened well and offered helpful
suggestions when a bewildering or peculiar result has been obtained. Professor Mahmun
Hossain has been a valuable resource for understanding organic synthesis as well as in
my professional development. Dr. Michael Kaminski has demonstrated strong leadership
and has been an essential collaborator and benefactor for our research program.
Additionally, I would like to thank the Department of Chemistry & Biochemistry, its
staff, and other faculty members who have assisted in making this effort possible.
My research group has been replete with friends and colleagues having contributed in
various ways. I am pleased with the results of working with Ms. Anna Rud for the two
years she was employed as a researcher in this group. Her diligent efforts in synthesizing
and characterizing ionic liquids have been essential to these studies. Sarah Garvey’s
research has often dovetailed with my own, providing relevant data and perspectives to

xvi
understand the varied aspects of ionic liquids. Among several contributions to my
program, Alan Pawlak helped me get to know the thermogravimetric instrumentation and
assisted with materials synthesis. I have learned from each of my research group
members and I thank you for your support.
xvii
“If the goal of synthetic chemistry is to produce new chemical entities, it is up to
analytical chemists to determine how well the chemical compounds are characterized. In
general, it is easier to synthesize a compound with a definite chemical structure than with
a certain required property.”
- Roman Kaliszan, Analytical Chemistry, 1992, 64, 619A-631A

1
CHAPTER 1:
INTRODUCTION
1.1 Overview and Scope
The separation and preconcentration of strontium is of great importance, both on the
analytical scale on an industrial scale. Although radioactive strontium isotopes, primarily
90Sr, comprise only 5% of the light products of uranium fission [1.1], these radionuclides,
along with an equal part 137
Cs, account for the majority of heat production in spent
nuclear fuel (SNF). This poses a problem for the efficient storage of SNF, as the
protocols involved require the dissipation of the large amounts of heat in order to avoid
damage to the fuel or storage facilities. As of December 2011, more than 67,000 metric
tons of SNF, in more than 174,000 assemblies, is stored at 77 sites (including 4
Department of Energy facilities) located throughout the United States [1.2]. With the
accumulation of SNF set to grow at a rate of roughly 2,000 metric tons per year [1.2], the
amount of medium-to-long lived radionuclides will be on the rise, and the capacities of
storage sites will be strained. To provide for greater capacity in these repositories, the
processing of fuel to remove the heat-generating nuclides is an obvious first step. (Of
course, the full reprocessing of spent fuel in a closed-cycle is generally regarded as the
wisest approach to these resources, but one that has faced substantial political
opposition.) On an industrial scale, solvent extraction is the most commonly used
technique, because it can be run in continuous mode (e.g., countercurrent liquid-liquid
extraction), imparting high selectivity factors without the use of high pressures. Current
methods for the solvent extraction of 90
Sr from SNF (e.g., SREX) [1.3] rely on the
placement of separate extraction stages downstream from the PUREX process [1.4]. One
of the key requirements for the development of any advanced nuclear fuel cycle is

2
improved separations processes for the removal of SNF constituents that most contribute
to the heat load and the overall waste volume. Consequently, the strontium removal
process must be made as efficient as possible (e.g., reduced number of stages and
increased decontamination factors). Our exploration of the possibilities afforded by ionic
liquids (ILs) originates from the notion that higher extraction efficiencies and greater
selectivities for strontium versus alkali metal ions (present in high concentrations in SNL)
could provide the needed improvements.
Interim facilities for the storage of SNF are scattered throughout the United States,
and facilities internationally may be significantly less secure, posing a threat to society of
the possible intentional or accidental release of stored materials. Bioassays that are
currently implemented for the determination of internal exposure to radionuclides, such
as 90
Sr, are often cumbersome and involve time-consuming steps [1.5]. Accordingly, they
would not be especially useful in the event of a radioactive material release involving
significant numbers of potentially contaminated individuals. In analogy to the process-
scale improvements described above, an increase in extraction efficiency and selectivity
involved in the extraction of radiostrontium from aqueous media via liquid-liquid
extraction could facilitate the preparation of extraction chromatographic materials for the
rapid separation and preconcentration of radiostrontium in biological media.
The objective of the present studies is to explore the processes involved in metal ion
extraction from aqueous solutions by crown ethers into imidazolium-based room
temperature ionic liquids, and to eventually establish guidelines for the selection of an
appropriate ionic liquid (IL) solvent for the selective extraction of strontium. In the
interest of presenting a systematic study of the behavior of ILs as solvents for metal ion

3
extraction, the focus of this work is on a single family of hydrophobic 1,3-
dialkylimidazolium room temperature ionic liquids. By affording a unique solvation
environment, ILs such as these have, in some cases, shown promise to improve upon
current metal ion extraction systems based on conventional solvents through greater
extraction efficiencies and larger separation factors. Initial work has suggested that
Groups 1 and 2 metal ion partitioning by crown ethers occurs via several distinct
equilibria that remain, in some ways, inadequately understood. The range of possible
physicochemical properties of ILs are as vast as the number of cation and anion
combinations that may comprise an IL. In view of this diversity and the nature of their
extraction behavior, the selection of an IL solvent for a particular process becomes
challenging. That is to say, in the absence of guiding principles to make a well-informed
choice, the selection method will rely largely on trial-and-error. Therefore, the work
performed in this thesis is defined by the assessment of the major factors involved in
partitioning processes employing ILs in the extraction of alkali and alkaline earth metal
ions and the correlation of these factors with the structures and physicochemical
properties of the ILs employed.
1.2 Ionic Liquids
Reviews of the field of ionic liquids span a range of subjects, but some of the more
thorough examinations across disciplines are those by Welton [1.6], and Seddon [1.7],
and Dietz [1.8] As the number of articles per year with the term “ionic liquid” in the title
has reached into the thousands, it has become impossible to be comprehensive in
describing the field. However, it is worth providing a brief history in this introduction to
give the reader some sense of how the field has developed. Paul Walden, in 1914, was the

4
first to describe the low-melting (13-14°C) salt, ethylammonium nitrate, which was a
product of the neutralization of ethylamine with concentrated nitric acid [1.9]. Although
this observation is heralded as the beginning of the field of ionic liquids, his reports did
not garner much interest at the time. There was some interest in the use of N-
alkylpyridinium halide salts for the dissolution of cellulose for the production of raw
materials in the 1930’s [1.10] and the application of mixtures of these halide salts with
aluminum(III) chloride for aluminum deposition in the years following World War II
[1.11, 1.12]. Yet, it was not until the “rediscovery” of mixtures of aluminum(III) chloride
with N-alkylpyridinium chloride in the mid-1970’s by Osteryoung et al. [1.13], however,
that interest began to develop more widely. The range of compositions that yielded room
temperature liquids (i.e., 60 to 67 mol% AlCl3) was found to be quite narrow and the
cations were prone to reduction. In 1982, however, by evaluating an array of heterocyclic
cations using molecular orbital calculations, Wilkes et al. [1.14] predicted a much wider
electrolytic stability window for 1,3-dialkylimidazolium cations, and the resulting
chloroaluminate salts provided a wider liquidus composition range (from 33 to 67 mol%).
Still, the major drawback of these Lewis acid-based ILs was their moisture sensitivity,
constraining all work with the materials to a dry box. It was not until 1992, when Wilkes
and Zawarotko [1.15] reported air and water stable room temperature ILs with definite
composition that the wide variety of ILs featuring the range of cations and anions known
today became available. Figure 1.1 shows a few examples of the most common cations
and anions that comprise modern ILs.

5
Figure 1.1: Structures of common ionic liquid cations and anions.
The currently accepted definition of an ionic liquid is a salt that melts below 100°C.
From the cation and anion structures shown in Fig. 1.1 it is apparent that the cations tend
to be bulky and often charge-delocalized organic moieties, whereas the anions range from
water-miscible halides to the hydrophobic bis[(trifluoromethyl)sulfonyl]imide (Tf2N)
salts developed by Grätzel et al.[1.16]. The structure and physical properties of ILs are
governed by short-range coulombic forces and long-range inductive forces mediated by
the amphiphilic combination of the cationic polar head groups with hydrophobic tails.
Such interactions lead to low lattice energies and the frustration of crystal formation.
Charge ordering is less defined in systems composed of bulky, asymmetric, and flexible
cations and anions as compared to metal halide salts [1.17]. The resulting properties of
compounds with such ion combinations often include high decomposition temperatures

6
(≥ 200°C), low melting points or glass transitions (≥ -90°C), and negligible vapor
pressures under ambient conditions (leading to nonflammability). Because their structures
remain dominated by coulombic forces, however, ILs tend to exhibit high viscosities
[1.18], which may render more difficult applications where solute transport is important
(e.g., use as solvents).
1.3 Solvent Extraction of Metal Ions into Conventional Organic Solvents
Solvent extraction is used frequently as an analytical technique, primarily in the form
of a batch method with single contacts between two immiscible phases, which normally
consist of aqueous and organic solvents. Solutes distributed between the two phases reach
an equilibrium concentration according to the Nernst partition isotherm, where the
distribution of solute X between the phases is a constant expressed by:
(1-1)
Although the thermodynamic partition coefficient is formally expressed using the
activities and activity coefficients of the species, for many practical applications, the ratio
of the total concentrations of a metal ion solute, M, in both phases is expressed as a
distribution ratio, D (Eqn. 1-2), where all species present that contain the solute are
combined.
(1-2)

7
The distribution ratio, therefore, is the parameter that best expresses the extent of
extraction (i.e., extraction efficiency, %E = D/(D+1) × 100% ), as a readily measureable
quantity.
Because determining the concentration of a species in two immiscible liquids
simultaneously is at times difficult, these measurements are often performed using
radiolabeled solutes. For metal ions, radiotracers of the most common salt forms of the
element are measured by the ratio of the count rates in each phase. Where the availability
of a radionuclide is cost prohibitive or otherwise problematic, the concentration in the
organic phase can be calculated by the depletion of the aqueous phase concentration of a
non-radioactive form upon equilibrium, and measured by many means, including
spectroscopy and chromatography. Generally, an extraction is qualified as being “good”
when D values are larger than 10 (%E > 90.9%), but in some cases, distribution ratios can
reach values larger than 104 (E > 99.99%). An extraction process is deemed “inefficient”
when D values are smaller than 1. D values on the order of up to 104 are meaningful,
owing to the very good detection limits of analytical techniques such as gamma
spectroscopy, liquid scintillation counting, and ICP-MS.
Due to its charge, the metal ion will often have immeasurable distribution ratios in
aqueous/organic biphasic systems. Therefore, a lipophilic ligand with a high formation
constant for the metal ion of interest is often added to the organic phase to assist in its
extraction. In the case where two metal ions that are to be separated, they will have a
separation factor, α, that is expressed by the ratio of their respective distribution ratios
(Eq. 1-3).

8
(1-3)
When the separation factor approaches 1, their separation requires multiple stages. This
technique, therefore, becomes quite cumbersome if it involves the arrangement of many
separatory devices (e.g., funnels) in series. An improved technique involves automating
the process to provide a mode of continuous contact between phases.
1.4 Extraction Chromatographic Systems
Applying the typical organic phase in solvent extraction as the stationary phase in a
column chromatographic platform provides the basis for extraction chromatography. This
technique lends itself well to the analytical separation of metal ions by combining the
selectivity of solvent extraction with the ease of operation provided by column
chromatography. The setup has three components: an inert support, a stationary phase
and a mobile phase. The inert support usually consists of beads of porous silica or a
porous organic polymer on the order of 10 to 200 µm in average diameter. Extractants,
either as pure compounds or as a solution in an appropriate solvent, are used as the
stationary phase, which is impregnated in the macroporous solid support. Diluents are
often used to facilitate dissolution of the extractant and to increase the hydrophobicity of
the stationary phase. The mobile phase typically consists of a solution of a mineral acid
(e.g., HNO3, HCl). The comparison of extraction chromatography to solvent extraction
requires some background in chromatography.

9
Further development of solvent extraction has provided the means for multiple and
continuous modes of extraction, including the countercurrent extraction ensembles used
for industrial and process scale applications. Continuous countercurrent techniques are
based on the theory of gas-liquid countercurrent distillation, where, in this case, the two
phases are liquid, move in opposite directions, and are in constant contact. These methods
are analogous to the technique of partition chromatography introduced by Martin and
Synge [1.19], in which the solute(s) are distributed between two liquid phases of
contrasting polarities, one of which is immobilized on a solid support, and the other that
moves in a given direction. In contrast to the batch method, true equilibrium is never
established in this mode. Using theory that has been applied to distillation columns, the
chromatographic column is divided into equal cross-sectional lengths of the column
termed the height equivalent of a theoretical plate (HETP), where the ratio between the
average concentrations of the solute(s) egressing from the region is equivalent to the ratio
achieved at true equilibrium [1.19]. The efficiency of a column is inversely proportional
to the HETP. The migration of the solute through the column (i.e., elution) is determined
by the average distribution of that solute as it traverses the column length. Thus, a
convenient parameter often used is the length divided by the HETP of the column, or the
number of theoretical plates (N). Through the differentiation of expressions for the
population distribution of the solute and the phase ratio, the effective retention volume
(volume at the height of the Poisson curve generated by a normal distribution of the
solute), VR, can be expressed as a function of the volume of the mobile phase, VM, the
volume of the stationary phase, VS, and the solute distribution coefficient, K.

10
(1-4)
If it is assumed that D = K, from Eqn. 1-4, then the distribution coefficient is
(1-5)
This treatment is ubiquitous in chromatography [1.20]. It follows that with the definition
of the retention factor given by Eqn. 1-6, that the substitution of Eqn. 1-5 relates to the
distribution ratio to the retention of the solute on the extraction chromatographic media
through the phase ratio.
(1-6)
From these equations the retention of solute or selectivity factors may be predicted by D
values obtained through solvent extraction [1.21].
The process to be considered in solvent extraction and in analogy, extraction
chromatography, is that in which hydrated metal ions interact with reagents at the
interface between the phases to form complexes, which are then extracted into the
organic phase. The form of the complex will vary with the coordination numbers, the
charge of the central atom, and the denticity and basicity of the reagent(s) [1.21].
However, when the complex formed is not fully coordinated by the reagent, its extraction
will meet with difficulty because the coordination sites unoccupied by the reagent will be
coordinated with water. The water molecules can either be displaced or can hydrogen
bond with active extractants or ligands from the aqueous phase containing Lewis basic

11
moieties (e.g., NO3-, Cl
-). A distribution ratio must then cover all of the species present in
each phase, and can be generically written as [1.21]:
(1-7)
In this formula, HA represents acidic extractants, X is complexing agents, L is adduct-
forming agents, and S is the organic solvent. Subscripts are assumed to be zero or integer
values. While the extracted species as a whole is required to be electrically neutral.
To illustrate the concept of chelation extraction, one of the simplest systems
describing the equilibrium is that which is simply dependent on the concentration of an
acidic reagent in the aqueous phase, given by the process involving an acidic extractant,
HA.
(1-8)
The distribution ratio derived from Eqn. 1-8 is given by its relationship to the extraction
constant, Kex.
(1-9)
The logarithmic expression provides a practical approach to examining an extraction
system.

12
According to Eqn. 1-10, if the [HA]org or [H+]aq is held constant, that is if the ionic
strength of the aqueous phase is constant, then plots of log D vs. pH or log D vs.
log[HA]org should give lines with slopes equal to the charge of the metal ion. Similarly,
when a neutral ligand is involved in complexing and extracting the metal, the
bilogarithmic plots of the distribution ratio versus the extractant concentration (i.e.,
extractant dependency) should yield lines with slopes corresponding to the stoichiometry
of the complex.
1.5 Extraction of Metal Ions into Ionic Liquids
Ionic liquids are considered a distinct class of fluids with the simple binary cation and
anion combinations fitting the definition estimated to be 106 possibilities [1.7]. This
diversity, paired with the ease by which some of the basic common IL cation structures
can be modified to change the physicochemical character, has led some to regard ILs as
“designer solvents”. As a result, there have been numerous studies demonstrating a
remarkable ability to solubilize a wide range of organic substances [1.22-1.26], and
inorganic species [1.27-1.35] can be readily extracted into them under suitable
conditions. Considering the massive volume of data in the general area of metal ion
extraction into ILs, a synopsis of the findings and a summary of the problems faced in
these systems may be the best approach to the subject. However, before remarks are

13
made regarding the literature on the subject, it is important to note the metrics that
determine if an IL system is considered “better” than its conventional solvent
counterparts. First, a significant increase in DM would be considered an improvement.
Next, an increase in the metal ion selectivity factor would also be of great interest. Lastly,
systems providing efficient and facile recovery of extracted metal ions are of more
practical use than those exhibiting only high extraction efficiencies.
Since the first publication proposing ILs as replacements for conventional solvents
for metal ion extraction [1.27], many publications on various extraction systems have
appeared. In this initial study to explore the possible utility of ionic liquids as solvents in
the extraction of strontium, Dai et al. [1.27] reported extraordinarily efficient extraction
of strontium from water by dicyclohexano-18-crown-6 in a series of 1,3-
dialkylimidazolium-based ILs. As it happens, the extraction from water was radically
enhanced by the participation of the IL in a cation exchange mechanism – a process that
is obviously unsustainable for the recovery of both the IL solvent and the metal ions of
interest [1.36]. This study was a harbinger of the results of many studies to come
describing similarly high distribution ratios for various metals. For example, the
extraction of Ln3+
or Y3+
from nitric acid by a diglycolamide extractant in an
imidazolium-based IL was three-orders of magnitude greater than that observed for
conventional solvents (e.g., chloroform, 1,2-dichloroethane) [1.37]. A set of results for
the separation of Ce3+
, Y3+
, or Eu3+
from nitric acid using a phosphine oxide extractant
(CMPO) in the same IL also resulted in extraordinarily high extraction efficiencies
[1.38]. Their reports conclude that anion exchange [Turanov] and cation exchange
[Nakashima] for the corresponding component of the IL is the primary mode of

14
extraction. As reported by Dietz, et al. [1.36], such systems are particularly deleterious to
the recycling of the solvent. Moreover, in the pursuit of very high DM, these systems
would make it very expensive to recover the solutes of interest, by requiring the addition
of complexing or salting-out agents in the aqueous phase. The solvent extraction adage,
“What goes in must come out”, is apropos in these circumstances.
In an interesting account of the extraction of uranium from nitric acid solutions into
tetraalkylammonium-based ILs containing tri-n-butyl phosphate (as akin to the PUREX
process) Bell and Ikeda [1.39] elucidated the U complexes by UV-VIS spectroscopy to
conclude that for relatively hydrophilic ILs, a mixture of cation and anion exchange were
at play, whereas for the most hydrophobic ILs, ion-pair extraction was to predominant
mode of transport. As an example of a thorough study involving the effort to avoid ion
exchange processes in the extraction of f-elements (uranyl ion and various trivalent
lanthanides and actinides) by traditional dialkylphosphoric and dialkylphosphinic acids,
Cocalia et al. [1.40] utilized traditional radiotracer measurements and UV-VIS
spectroscopy, as well as EXAFS measurements, to demonstrate that the metal
coordination environment in a hydrophobic imidazolium-based IL is the same as for the
conventional n-dodecane diluent.
What is clear from many of the reports is that due to the ionic nature of ILs, their
solvation of ligand-coordinated metal ion species can involve many different mechanisms
resulting in a variety of possible extraction equilibria involving ion-pair extraction, ion
exchange, and composites thereof, depending on the conditions [1.41, 1.42, 1.43, 1.44].
Managing the complex equilibria observed in IL-based metal ion extraction systems
requires the systematic evaluation of the factors involved in the balance of those

15
pathways. The approaches to this may entail the use of a variety of techniques, some of
them (e.g., X-ray, neutron, and Raman spectroscopy) not available to all researchers, and
others with which many laboratories are equipped (e.g., UV-VIS, HPLC, IC, ESI-MS,
ICP-MS, ICP-OES, gamma and scintillation counting equipment). Work in this
laboratory has continued to attempt to clarify the factors responsible for determining the
precise path followed in the extraction of a given metal ion into an IL by various
extractants. In previous studies we have employed extraction by crown ethers as a test
system for these factors. In continuing to explore this relatively well-behaved system, the
current studies pertain to the extraction of strontium by substituted 18-crown-6 ethers, the
details of which will be visited in depth in subsequent chapters.
1.6 Overview of the Chapters
Chapter 2 is a study that was conducted as part of a summer graduate appointment at
Argonne National Laboratory exploring the innovative use of currently available sample
preparation techniques and extraction chromatographic materials in order to improve
upon the throughput of bioassays for radiostrontium. The results provide a context for the
types of improvements to radioanalytical separations that may require novel materials.
Chapter 3 covers the investigations into the various pathways involved in the solvent
extraction of alkali and alkaline earth metal ions via neutral crown ethers in ionic liquids.
The results of these studies have provided the framework for a generalized model of the
equilibria involved in these systems.
Chapter 4 describes the quest to determine the role of organic phase water content in
the extraction of strontium into IL-based systems and to establish relationships between
extraction efficiency and water content analogous to those discovered for similar systems

16
using molecular diluents. In summary, under conditions that provide extraction via a
similarly coordinated crown ether complex, the water content of the IL phase can be used
to control the extent extraction. A new set of 1,3-susbtituted imidazolium ILs
incorporating an alcohol group are demonstrated to increase extraction efficiency, while
maintaining the behavior becoming of the best 1,3-dialkylimidazolium-based ILs.
Chapter 5 provides the development of a high performance liquid chromatographic
method for the rapid determination of IL cations (and thus ILs), and an investigation into
the mechanisms involved in their retention.
Chapter 6 explores the behavior of the 1,3-dialkylimidazolium family of ILs with
regards to their hydrophobicity. Specifically, the octanol-water distribution ratios of
several representatives ILs are measured and correlations to their extraction behavior are
presented in the critical context of the underlying principles of the partitioning processes
involved. Furthermore, as the newly developed HPLC method (Chapter 5) was used for
analysis, the retention factors for those ILs were explored as a means to provide more
rapid estimates of extraction behavior.
In Chapter 7, a set of techniques have been combined to explore the relative
contributions of various extraction pathways, heretofore unresolved. With the
development of new analytical methods to determine the species that indicate the
involvement of various modes of metal ion partitioning, a strategy is proposed to subtract
the contribution of one pathway from another, under given conditions. Thus, a way to
quantitatively determine the contributions from these pathways has been devised.
Chapter 8 considers the practical implications of using ILs as solvents for the
selective extraction of strontium via neutral crown ethers. Explanations of the strategies
17
involved in preparing concentrated solutions of the extractants in ILs are given. The
results of solvent extraction studies using the more hydrophobic di-t-butyl-substituted
crown ethers are discussed in the context of system performance as an extraction
chromatographic material. Additionally, a short section is provided entailing the
unsuccessful attempts to apply magnetic ionic liquids to the same systems.
Chapter 9 offers a summary of the accomplishments in this work and
recommendations for further research in this field.

18
1.8 References
[1.1] J. Rydberg, Solvent Extraction Principles and Practice, Revised and Expanded,
CRC Press, New York, 2004.
[1.2] J.D. Werner, U.S. Spent Nuclear Fuel Storage, Congressional Research Service,
http://www.fas.org/sgp/crs/misc/R42513.pdf, accessed 10 October 2012.
[1.3] E.P. Horwitz, M.L. Dietz, D.E. Fisher, Sol. Extr. Ion Exch. 1991, 9, 1-25.
[1.4] P.A. Baisden, G.R. Choppin, RADIOCHEMISTRY AND NUCLEAR CHEMISTRY –
Nuclear Waste Management and the Nuclear Fuel Cycle, Ed. Sándor Nagy, in
Encyclopedia of Life Support Systems (EOLSS), Developed under the Auspices of
the UNESCO, Eolss Publishers, Oxford ,UK, 2007, [http://www.eolss.net], accessed
10 October 2012.
[1.5] E.P. Horwitz, M.L. Dietz, D.E. Fisher, Anal. Chem. 1991, 63, 522-525.
[1.6] J.P. Hallett, T. Welton, Chem Rev. 2011, 111, 3508-3576.
[1.7] N.V. Plechkova, K.R. Seddon, Chem. Soc. Rev., 2008, 37, 123–150.
[1.8] M.L. Dietz, Sep. Sci. Technol. 2006, 41, 2047–2063.
[1.9] P. Walden, Bull. Acad. Impér. Sci. St. Pétersbourg, 1914, 8, 405–422.
[1.10] C. Graenacher, Cellulose solution, US Pat., 1943176, 1934.
[1.11] F. H. Hurley, Electrodeposition of Aluminum, US Pat., 4,446,331, 1948.
[1.12] F. H. Hurley and T. P. Wier, J. Electrochem. Soc., 1951, 98, 203–206.
[1.13] H. L. Chum, V. R. Koch, L. L. Miller, R. A. Osteryoung. J. Am. Chem. Soc. 1975,
97, 3264–3267.
[1.14] J.S. Wilkes, J.A. Levisky, R.A. Wilson, C.L. Hussey, Inorg. Chem. 1982, 21,
1263-1264.
[1.15] J.S. Wilkes, M.J. Zawarotko, Chem. Commun., 1992, 13, 965-967.
[1.16] P. Bonhote, A.P. Dias, N. Papageorgiou, K. Kalyanasundaram, M. Grätzel, Inorg.
Chem. 1996, 35, 1168-1178.
[1.17] C. Schröder, T. Rudas, G. Neumayr, W. Gansterer, and O. Steinhauser, J. Chem.
Phys. 2007, 197, 044505.

19
[1.18] H. Tokuda, K. Hayamizu, K. Ishii, Md.A. Bin Hasan Susan, M. Watanabe, J. Phys.
Chem. B 2005, 109, 6103-6110.
[1.19] A.J.P. Martin, R.L.M. Synge, J. Biochem. 1941, 35, 1358-1368.
[1.20] R. Consden, A.H. Gordon, A.J.P. Martin, J. Biochem. 1944, 38, 224-232.
[1.21] T.Braun and G. Ghersini, Extraction Chromatography, Journal of
Chromatography Library Vol. 2, Elsevier, New York, 1975.
[1.22] J.G. Huddleston, H.D. Willauer, R.P. Swatloski, A.E. Visser, R.D. Rogers Chem.
Commun., 1998, 1201-1202.
[1.23] S. Carda-Broch, A. Berthod, D.W. Armstrong, Anal. Bioanal. Chem. 2003, 375,
191-199.
[1.24] J. McFarlane, W. B. Ridenour, H. Luo, R. D. Hunt, D. W. DePaoli, R.X. Ren, Sep.
Sci. Technol. 2005, 40, 1245-1265.
[1.25] R.P. Swatloski, S.K. Spear, J.B. Holbrey, R.D. Rogers, J. Am. Chem. Soc., 2002,
124, 4974-4975.
[1.26] W. Li, N. Sun, B. Stoner, X. Jiang, X. Lu, R.D. Rogers, Green Chem. 2001, 13,
2038-2047.
[1.27] S. Dai, Y.H. Ju, C.E. Barnes, J. Chem. Soc., Dalton Trans. 1999, 1201-1202.
[1.28] A.E. Visser, R.P. Swatloski, W.M. Reichert, S.T. Griffin, R.D. Rogers, Ind. Eng.
Chem. Res. 2000, 39, 3596-3604.
[1.29] A.E. Visser, R.P. Swatloski, S.T. Griffin, D.H. Hartman, R.D. Rogers, Sep. Sci.
Technol. 2001, 36, 785-804.
[1.30] S. Chun, S.V. Dzyuba, R.A. Bartsch, Anal. Chem. 2001, 73, 3737-3741.
[1.31] H. Luo, S. Dai, P.V. Bonnesen, Anal.Chem. 2004, 76 2773-2779.
[1.32] J. Huang, A. Riiager, P. Wasserscheid, R. Fuhrmann, Chem. Commun., 2006,
4027-4029.
[1.33] K. Binnemans, Chem. Rev., 2007, 107, 2592-2614.
[1.34] M.L. Dietz, D.C. Stepinski, Talanta, 2007, 75, 598-603.
[1.35] D.C. Stepinski, G.F. Vandegrift, I.A. Shkrob, J.F. Wishart, K. Kerr, M.L. Dietz,
D.T.D. Qadah, S.L. Garvey, Ind. Eng. Chem. Res. 2010, 49 5863-5868.

20
[1.36] M.L. Dietz, J.A. Dzielawa, Chem. Commun. 2001, 20, 2124-2125.
[1.37] A.N. Turanov, V.K. Karandashev, V.E. Baulen, Sol. Extr. Ion Exch. 2008, 28, 367-
387.
[1.38] K. Nakashima, F. Kubota, T. Maruyama, M. Goto, Ind. Eng. Chem. Res., 2005, 44
, 4368-4372.
[1.39] T.J. Bell, Y. Ikeda, Dalton Trans. 2011, 40, 10125.
[1.40] V.A. Cocalia, M.P. Jensen, J.D. Holbrey, S.K. Spear, M.C. Stepinski, R.D. Rogers,
Dalton Trans., 2005, 1957-1965.
[1.41] D.C. Stepinski, M.L. Dietz, Green Chem. 2005, 7, 747-750.
[1.42] V.A. Cocalia, J.D. Holbrey, K.E. Gutowski, N.J. Bridges, R.D. Rogers, Tsinghua
Sci.
Technol. 2006, 11, 188.
[1.43] M.S. Murali, N. Bonville, G.R. Choppin, Sol. Extr. Ion Exch. 2010, 28, 495-509.
[1.44] C.A. Hawkins, S.L. Garvey, M.L. Dietz, Sep. Purif. Technol. 2012, 89, 31-38.888

21
CHAPTER 2:
DEVELOPMENT OF A NOVEL TANDEM METHOD FOR THE RAPID
ISOLATION OF RADIOSTRONTIUM FROM HUMAN URINE
2.1 Introduction
The possibility of an accidental or intentional release of radioactive substances has
increased demand for analytical methods capable of rapidly screening large numbers of
individuals for possible internal exposure. Because of their decay characteristics,
abundance in spent nuclear fuel, and occurrence in industrial and commercial products,
certain radionuclides pose a particular health risk to humans. At approximately 6% of the
total fission yield of uranium-235/238, strontium-90 is considered a medium-lived major
fission product [2.2]. Strontium-90 decays with a half-life of 29 years, undergoing
emission of a 0.55 MeV negatron to form yttrium-90, which in-turn decays with a half-
life of 64 hours to stable zirconium-90 by emission of a 2.3 MeV negatron [2.3]. In its
pure form, strontium-90 has several industrial uses, including as the primary heat source
in radioisotope thermoelectric generators and as a radiation source in metal alloy
thickness gauges [2.4], furnishing relatively low security sources of this material.
Because of its close chemical resemblance to calcium, strontium follows the same
biological pathways when ingested, and 20-30% of it accumulates internally, primarily in
the bones and teeth [2.4], resulting in an effective (i.e., biological) half-life of eighteen
years [2.5]. It therefore poses a major risk to public health in the event of a nuclear or
radiological emergency. The accident at the Chernobyl nuclear power plant in the former

22
Soviet Union, which represents the largest historical worldwide release of strontium-90 to
date, has led to many cases of leukemia of other blood and bone diseases [2.4].
Accordingly, methods have been developed for the quantification of radiostrontium in
a wide variety of sample types, including seawater [2.6], milk [2.7], urine [2.8-2.11], soil
[2.12], and animal tissue [2.13]. Because of the relative ease of sampling and processing,
urine is the most common sample matrix for radionuclide bioassays [2.10]. Urine analysis
for the detection of internal radionuclide contamination is not without complications,
however. Normal human urine contains organic molecules (e.g., urea, uric acid, urobilin,
bilirubin, creatinine, and smaller amounts of carbohydrates, proteins, fatty acids,
hormones, pigments, mucins), and ions (e.g., sodium, potassium, calcium) that can
interfere with the isolation and detection of radionuclides. Widely used experimental
protocols for monitoring radiation workers for potential exposure to actinides and fission
products involve processing large volumes of urine by time-consuming precipitation,
digestion, and ashing steps to preconcentrate the analytes and remove urine matrix
components [2.8]. To improve urine sample throughput, methods have recently been
developed in which the precipitation step is eliminated by applying smaller volumes (≤
50 mL) of minimally-treated urine directly to extraction chromatographic (EXC) media
for separation and preconcentration of the radioactive elements [2.9-2.11]. Although
these methods eliminate the digestion and total precipitation steps; they also omit steps to
remove high molecular mass organic constituents from raw urine that can lead to fouling
of extraction chromatographic columns. Furthermore, the heme breakdown pigments
(i.e., bilirubin) in urine that pass through the column absorb the light emitted by
secondary and ternary fluors during liquid scintillation counting, complicating accurate

23
measurements. As part of an effort to minimize sample pretreatment procedures, reduce
costs, and decrease processing time in the determination of radiostrontium in urine, we
have investigated the pretreatment of urine by organophilic adsorbents and the
purification and preconcentration of strontium by a novel, tandem column arrangement
employing a strong cation exchange resin (Diphonix®) in combination with a strontium-
selective extraction chromatographic material (Sr resin). A simple retention model has
been used to facilitate identification of the optimum chromatographic conditions.
2.2 Experimental
2.2.1 Materials
All reagents were ACS reagent grade or better. Strontium-85 and sodium-22
radiotracers were purchased as nominal solutions from Eckert and Ziegler Isotope
Products, Inc. (Valencia, CA). Radiotracer measurements were performed on a spiked
sample prior to treatment and on the equilibrated aqueous phase after treatment. Stock
solutions used for ICP-OES determination were prepared from a stable strontium chloride
salt purchased from Aldrich (St. Louis, MO). Deionized water of at least 18 MΩ·cm-1
resistivity was used in the preparation of all solutions. Diphonix® resin (50-100 mesh)
and Sr resin (50-100 μm particle size) were obtained from EiChroM Technologies, Inc.
(Darien, IL). Activated charcoal was procured from Mallinckrodt Chemicals, Inc.
(Phillipsburg, NJ). Amberlite XAD-7 (100-200 mesh) polymeric adsorbent and the
sodium chloride and potassium chloride salts used to make the saline solution were
obtained from Sigma-Aldrich (Milwaukee, WI). Frozen certified normal human urine
was obtained from Innovative Research, Inc (Novi, MI, Lot IR100706), stored at < -10

24
°C, and thawed only once for use. In the discussion that follows, “raw urine” refers to
that which has not been previously frozen. The strontium content of blank urine was not
detectable.
2.2.2 Instruments
All UV spectra were measured against a water reference using a Perkin-Elmer
Lambda 4B UV/VIS spectrophotometer with 1-cm pathlength quartz cuvettes. Elemental
analysis of extraction chromatographic eluate was performed using a Perkin-Elmer
Optima Model 3300 DV inductively-coupled plasma optical emission spectrometer (ICP-
OES). Radiotracers were assayed using a Perkin-Elmer A5550 MINIMAXIγ Automatic
Gamma Counter.
2.2.3 Methods
Weight distribution ratios (Dw) for strontium and sodium ions were determined
radiometrically using commercial radiotracers, and assayed via gamma spectroscopy
using standard procedures. Dw is defined by Equation 2-1:
Dw = [(C0 – Cf)/Cf] [V/m] (2-1)
where C0 and Cf are the counts rates for a tracer-spiked aqueous phase of volume V (mL)
prior to and following contact with a mass m (grams) of resin or solid extraction phase,
respectively. Each Dw value is the average of at least three replicates with resulting
uncertainties based on counting statistics that were generally within 10%. Determination
of the dry mass fraction of Diphonix® resin was performed by weighing samples (n = 3,
RSD = 0.28%) of resin before and after drying in a vacuum oven at 70 °C for 12 hours.

25
Column bed densities were determined by measuring the volume occupied by a known
mass of resin packed in the column.
The urine sample pretreatment experiments consisted of acidification of urine with
concentrated nitric acid or methanesulfonic acid, followed by addition of triplicate
aliquots of these stocks to either Amberlite XAD-7 (which is an acrylic ester resin) or
activated charcoal in polypropylene snap-cap tubes at phase ratios of 50, 100, or 200 (mL
g-1
adsorbent). The tubes were vortex mixed for 1 minute and centrifuged for 15 minutes,
after which the suspensions were filtered through 0.15-0.45 μm polypropylene filters to
remove microparticles. Retention of Sr2+
on the adsorbents was determined by spiking
the urine samples with 85
Sr and measuring the weight distribution ratios after
equilibration. The solution pH was measured using universal indicator strips
(ThermoFisher Scientific, Pittsburgh, PA).
2.2.4 Overview of the procedure
The approach to the separation and preconcentration of radiostrontium from urine is
summarized in Figure 2.1. This procedure involves an initial acidification of the urine
sample to pH < 2 using methanesulfonic acid (MSA) and pretreatment with activated
charcoal (1:100 charcoal:sample) to remove organic constituents. Following filtration, the
sample is treated in succession with Diphonix® resin (a strong acid ion exchange resin) to
remove the interfering cations and finally with Sr resin (a porous polymeric
chromatographic support loaded with 1.0 M 4,4',(5')-di(tert-butyl-cyclohexano)-18-
crown-6 in 1-octanol) to complete the purification and preconcentration process. Because
normal urine samples may contain large amounts of sodium (50 to 200 mM) [2.15] and
potassium (20 to 70 mM) [2.15], and because the crown ether on which the Sr resin is

26
based exhibits measureable affinity for both of these ions [2.16] (see Table 1), it is
important that they be removed prior to application of the sample to the Sr resin column.
This can be accomplished with Diphonix® resin, which exhibits relatively strong
retention of alkaline earth cations and poor retention of Na+ and K
+ from dilute (ca. 0.1
M) acid solutions. (According to the manufacturer, Diphonix® resin is composed of a
polystyrene/divinylbenzene matrix containing carboxylic, 4-benzenesulfonic, and
diphosphonic groups.) Once the levels of the alkali ions have been sufficiently reduced
(to < 10 mM), a small-volume Sr resin column (ca. 10% of the volume of commercially
available columns) can be employed to decontaminate and further concentrate the 90
Sr. It
is important to note that iron, aluminum, actinides, and lanthanides are very strongly
retained (Dw ~ 102 to 10
3 for trivalent ions and Dw ~ 10
4 for tetravalent ions, where Dw is
defined in Eqn. 1 in Section 2.2) by Diphonix® resin up to acidities as high as 4 M HNO3
(due largely to the formation of very strong complexes with the phosphoryl groups by
these metal species. [2.17]) Consequently, the presence of 90
Y in secular equilibrium with
90Sr is unproblematic, because Y
3+ will be retained by the Diphonix column under
conditions that permit elution of strontium and thus will be eliminated by this separation
step. It is also noteworthy that, although there is little selectivity between alkaline earth
metal ions on Diphonix resin, calcium ions have the lowest published retention of these
ions on Sr resin, making calcium easily separable from strontium in this process [2.16-
2.17]. Moreover, it is expected on the basis of the size selectivity of the crown ether
ligand, that magnesium ions will exhibit poorer retention on Sr Resin than calcium ions.

27
Figure 2.1: Overview of procedure for rapid 90
Sr sorption, purification, and
concentration from human urine samples.

28
Table 2.1
Calculated values of Retention Coefficient (kex) for Sr resin
Resin & Conditionsa, b
[HNO3],
M
kex
K+
Na+
Sr2+
0.02
0.05
0.10
0.30
0.50
1.00
2.00
4.00
7.00
0.1
0.1
0.9
1.8
2.0
3.5
3.5
3.0
0.8
0.10
0.10
0.10
0.20
0.20
0.30
0.28
0.28
0.10
0.2
0.7
1.1
6.5
11
30
50
70
80
a Calculated by Dr. Ilya Shkrob (Argonne) using Eqn 2-2 and assuming a bed ratio of 0.30 for Sr
resin b The parameters are taken from the data supplied by the manufacturer, EiChroM
2.3 Development of a Rapid Sample Pretreatment
2.3.1 Removal of urine matrix components
As noted in section 2.2.4, the analytical procedure devised here requires pretreatment
of the urine sample to remove organic compounds that can foul the chromatographic
resins and interfere with liquid scintillation counting by acidification of the raw urine and
stirring with an organophilic adsorbent. The efficiency of removal of urine pigments was
evaluated by noting the extent of decolorization of the urine and, for XAD-7, any change
in the appearance (shade/color) of the sorbent following equilibration (see Table 2.2).
While samples treated with charcoal were immediately decolorized upon contact, much
slower uptake of color from acidified urine was observed for XAD-7, with apparent
equilibrium being reached only after more than five 1-2 minute intervals of vigorous
mixing and two 30-minute intervals of standing. Removal or deactivation of high
molecular mass substances (e.g., proteins) from the urine was indicated by the fact that

29
the pretreated samples displayed water-like consistencies and no emulsion or bubble
formation upon agitation. Raw urine, in contrast, was found to produce substantial and
persistent foam upon shaking.
Table 2.2
Color observed during urine pretreatment
Nitric acid-treated samples
[Acid], M
Color of urine
following
acidification
Color of acidified
urine following
equilibration with
XAD-7
Color of XAD-7
following
equilibration with
acidified urine
0.001 light yellow colorless light orange
0.01 light yellow colorless light orange
0.1 light orange colorless orange
1 light orange colorless red-brown
4 brilliant yellow light yellow orange
8 pale yellow pale yellow light yellow
MSA-treated samples
[Acid], M
Color of urine
following
acidification
Color of acidified
urine following
equilibration with
XAD-7
Color of XAD-7
following
equilibration with
acidified urine
0.001 light yellow colorless light orange
0.01 light yellow colorless light orange
0.1 yellow colorless orange
1 orange colorless red-brown
4 red-brown light yellow orange
The extent of urine pigment removal by activated charcoal was assessed (by Ilya
Shkrob at Argonne National Labortory) using UV spectroscopy. A sample of certified
urine was adjusted to pH < 2 with MSA, after which a portion of the sample was diluted
1:10 with water and the UV spectrum (200 nm to 350 nm) measured. Another aliquot of
the acidified urine was treated with activated charcoal (1:50 charcoal:sample), filtered
through a 0.2 µm syringe filter and diluted 10-fold with water before the absorption

30
spectrum of this solution was obtained. An overlay of these spectra is provided in Figure
2.2, where absorbance is plotted versus wavelength. These results indicate that the treated
sample is transparent at wavelengths greater than 240 nm. The significance of this result
is that the secondary fluor will receive all of the energy from the solvent and there will be
no interference with emission of the fluors. For example, a typical primary fluor, 2,5-
diphenyloxazole (PPO) [2.18], has an absorption band with onset at 240 nm and peak at
300 nm. A secondary fluor commonly paired with PPO, p-bis-[2-(4-methyl-5-
phenyloxazolyl)]benzene (POPOP) [2.18], has an onset of the absorption band at 240 nm
and a peak absorption at 275 nm (emission at 290 nm); the onset of the emission band is
270 nm, all of which are in the transparency region. Put succinctly, there will be no
interference with scintillation counting due to urine matrix-associated color quench.

31
Figure 2.2: UV spectrum of acidified urine before and after treatment with
activated charcoal. The solid trace (i) is that of the untreated urine sample (diluted 1:10),
while the dashed trace (ii) is that of the sample treated with charcoal followed by ten-fold
dilution with water. (Data were provided by Dr. Ilya Shkrob, Argonne National Laboratory.)
2.3.2 Uptake of Strontium by Pretreatment Adsorbents
To determine the effect of sample pretreatment on the recovery of strontium, Sr2+
uptake by the various sorbents in contact with certified human urine acidified to various
nitric acid or methanesulfonic acid concentrations was measured. After treatment with
either activated charcoal or XAD-7 (resin:aqueous ratio of 1:100), Sr2+
recoveries of
between 87% and 114% were obtained. (That is, little or no uptake of Sr2+
by either
material was observed.) In most cases minimal difference was noted between charcoal

32
and XAD-7 using either nitric acid or MSA (Table 2.3). Essentially quantitative recovery
of strontium in the presence of charcoal was achieved at acid concentrations of 0.10 M
and greater. These results stand in contrast to those reported previously [2.10], where up
to half of the strontium spiked in HCl-acidified urine was retained on activated charcoal.
All conditions for XAD-7 treatment led to quantitative recovery of strontium.
Table 2.3
Recovery of strontium from acidified urine treated with charcoal and XAD-7a
[Acid], M HNO3/Charcoal
Recovery, %
MSA/Charcoal
Recovery, %
HNO3/XAD-7
Recovery, %
MSA/XAD-7
Recovery, %
0.001 84.7 ± 2.0 91.2 ± 1.8 99.1 ± 1.2 114 ± 1.8
0.01 96.0 ± 2.1 93.3 ± 0.93 98.3 ± 2.3 100 ± 2.4
0.1 98.4 ± 2.1 96.3 ± 1.8 97.3 ± 5.4 97.2 ± 1.5
1 97.0 ± 2.2 99.4 ± 1.6 98.5 ± 1.6 98.8 ± 3.2
4 98.0 ± 2.5 98.8 ± 2.2 99.3 ± 1.1 99.3 ± 2.0
8 98.2 ± 1.8 not measured 99.3 ± 1.6 not measured a Uncertainties are calculated from three measurements at the 95% confidence interval.
2.3.3 Selected Pretreatment
On the basis of the results described in sections 2.3.1 and 2.3.2, pretreatment
involving acidification of the urine sample with MSA (introduced in neat form) to a pH
of less than 2 (e.g., 0.1 M to 0.3 M MSA) followed by stirring of the solution with 1%
(w/v) activated charcoal was chosen as optimum. After this treatment (< 5 min), the
sample is filtered to remove microparticles of activated carbon, rendering it suitable for
the next step in the process. Several aspects of this pretreatment process warrant
comment. First, at pH < 2, Sr2+
is released from the urine components to which it binds.
Next, unlike nitric acid, MSA does not react with bile pigments to form highly UV-
absorbing nitroaromatic compounds that interfere with liquid scintillation counting.

33
Lastly, activated charcoal with MSA treatment removes bile pigments and high-
molecular mass compounds that foul chromatographic columns. At the same time,
activated carbon does not retain Sr2+
during the treatment, provided that pH < 2. (Because
the pH of urine naturally varies from 4.4 to 8 and urine has mildly buffering properties,
addition of 0.1 M MSA may not result in pH <2 for some samples. In this case, the pH is
simply adjusted by addition of neat MSA until the pH < 2.)
2.4 Retention of Strontium and Sodium on Diphonix® Resin
2.4.1 Dependence of strontium and sodium uptake on acid concentration
Because the uptake of alkali and alkaline earth metals by the Diphonix® resin is
accompanied by the displacement of a number of protons corresponding to the charge on
the ion, it is expected that a plot of Dw for Sr2+
uptake by Diphonix® resin vs. [H3O
+] will
exhibit a slope of -2, while an analogous plot for alkali metal ions should yield a slope of
-1. Accordingly, the retention of a given alkaline earth metal ion should far exceed that of
alkali metal ions over a range of conditions. As shown in Figure 2.3, which depicts the
dependence of strontium ion and sodium ion (chosen as a representative alkali metal)
uptake by the Diphonix® resin as a function of the concentration of MSA in the aqueous
phase, this is indeed the case. As predicted for extraction involving only cation exchange,
the slopes of the bilogarithmic data are -1 and -2 for sodium and strontium cations,
respectively, in the region where these curves are linear. By performing linear regression
analysis of the strontium data from 0.10 M MSA to 2.0 M MSA and sodium data from
0.10 M MSA to 1.5 M MSA (r2 > 0.99), the selectivity of Sr
2+/Na
+ is estimated to vary
from 120 at low acidity to 9 at higher acidities. These data indicate that the reduction of

34
urine matrix alkali metals (i.e., Na+ and K
+) can be accomplished by loading the
decolorized urine sample directly on a Diphonix® resin cartridge and washing with a low
acidity eluent. The alkali metal ions will be removed by this wash, while strontium is
retained for the subsequent preconcentration step. As shown in Figure 2.4, elution with
0.1 M MSA results in kex < 10 for Na+ (and by analogy for K
+), whereas for Sr
2+, kex >
100, indicating that the complete separation of the Sr2+
from the alkali ions is feasible on
a Diphonix column. Note that the capacity factor is defined as the number of free column
volumes needed to reach peak maximum for particular solute, and is related to the weight
distribution coefficient (Dw) through
kex = Dw ρ Vs/Vm, (2-2)
where ρ is the density of the resin, Vs is the volume of the stationary phase and Vm is the
volume of the mobile phase. Using ρ = 1.16 g mL-1
and the bed density of 0.30 g mL-1
,
for the Diphonix® resin, kex ≈ Dw/2.01. Using this formula, we calculated the capacity
factors kex for Sr2+
, K+, and Na
+ on the Diphonix
® resin using the data given in Figure
2.3.

35
Figure 2.3: Methanesulfonic acid dependency of Sr2+
and Na+ retention by
Diphonix® resin. The lines are linear least-squares fits to the data points, intended as visual
guides.

36
Figure 2.4: Dependence of kex for 85
Sr and 22
Na on Diphonix® resin on the molar
concentration of Na+/K
+ (1:1) ions. The conditions are indicated by 1:10 phase ratio with 0.1
M MSA (●) and 0.2 M MSA (○), 1:20 phase ratio with 0.1 M MSA (■) and 0.2 M MSA (□), 1:30
phase ratio with 0.1 M MSA (▲) and 0.2 M MSA (△). The lines are fits to Equation 4. (Data
were provided by Dr. Ilya Shkrob, Argonne National Laboratory.)
Figure 2.5 compares results for strontium uptake by Diphonix® resin from aqueous
phases containing a given concentration of MSA in presence of 0.5 M HNO3. No
significant difference is observed in the two sets of results up to approximately 2 M acid,
and the data, not unexpectedly, closely resemble published nitric acid dependencies
[2.19]. In all instances, Dw for Sr2+
uptake falls as the aqueous acidity increases,
consistent with cation exchange. Interestingly then, MSA yields essentially the same
retention of strontium as nitric acid under a given set of conditions. Thus, our choice of

37
MSA for sample acidification, which was prompted by consideration of sample
decolorization (see section 2.3.3), is further supported by the efficient and selective
retention of Sr2+
upon the Diphonix® resin achieved with it.
Figure 2.5: Acid dependency of Sr2+
retention by Diphonix® resin.
2.4.2 Diphonix® column trials
Of course, the performance of a real column is less predictable because the Diphonix®
resin column operates far from equilibrium. In the simplest column test (Figure 2.6 panel
A), 10 column volumes of the saline solution in 0.1 M MSA were loaded on a 0.54 cm2 x

38
3.7 cm (2 mL) column. The alkali ions were then eluted at 1.5 mL min-1
using 0.1 and 0.2
M MSA as eluent. The alkali ions on the column were eluted down to < 1 mM in 20
column volumes (the minimum column volumes for elution of each ion are given in
Table 4. Estimates of the number of column volumes required to elute the alkali ions with
0.1 M MSA after a 10 column volume load on 2 mL Diphonix® resin column (1.5 mL
min-1
flow rate) were 18 and 10 for K+ and Na
+ respectively. Elution with 0.2 M MSA
under the same loading conditions required 12 and 7 column volumes for K+ and Na
+,
respectively. As shown in Figure 2.6 panel B and Table 2.4, stripping the column after
elution of 22 column volumes lead to 100% recovery of strontium and reduced the
concentration of sodium and potassium to the limits of detection. In this experiment, less
than 40% of the alkali ions were retained on the column during loading, while Sr2+
was
quantitatively retained. The same relates to the experiment with acidified urine (0.1 M
MSA) spiked with 6.5 mM strontium (Figure 2.6 panel C and Table 2.4). Less than 30%
of the alkali ions were retained during the 10 column volume loading. The alkali ions
were eluted down to negligible concentrations in 10 column volume elution with 0.1 M
MSA, while 98% of Sr2+
was retained at the column. A 15 column volume wash would
result in 5% loss of Sr2+
, while the 22 column volume wash results in 13% loss of
strontium. (That is, a strontium recovery of 87% is obtained in the nitric acid strip
following a 22 column volume elution.) This experiment suggests that unidentified
components of urine decrease the capacity factors below those in the saline solution.

39
Figure 2.6. Elution profiles for the column where ion concentrations in the eluate
are plotted vs. the number of column volumes. Panel A: 10 column volume load of saline
solution (0.1 M NaCl + 0.1 M KCl) acidified with 0.1 M MSA (2 mL Diphonix resin column,
0.54 cm2 x 3.7 cm) or 0.2 M MSA. Panel B: 10 column volume load of
85Sr-spiked saline solution
acidified with 0.1 M MSA. Load ion concentrations are given. Panel C: 10 column volume load
of 85
Sr-spiked human urine acidified with 0.1 M MSA. (Data were provided by Dr. Ilya Shkrob,
Argonne National Laboratory.)

40
Table 2.4
Trial data for Diphonix® column tests in simulated urine and human urine
aqueous matrixa
(Figure 2.6 panel A)
acidified human urine
treated with charcoala
(Figure 2.6 panel B)
K+
Na+
Sr2+
K+
Na+
Sr2+
Load, mM 96.4 88.7 6.4 64.2 160 6.4
Load, mmol 1.93 1.77 0.127 1.19 2.98 0.061
Load (effluent), mmol 1.30 1.35 0 0.84 2.28 0
% retained 32.6 23.7 100 29.7 23.5 100
Column, M 0.315 0.21 0.064 0.18 0.35 0.063
recovered, mmol
3M HNO3 strip
4.35x10⁻⁵
2.75x10⁻³
0.125 1.45x10⁻⁴
2.57x10⁻³
0.108
Conc. on the column
after 22 volume elution
21.5 μM 1.38 mM 63 mM 73 μM 1.29 mM 54 mM
Eluent, mmol
by integration
0.56 0.36 < LOD 0.32 0.57 0.017
Sr, recovery %
after 22 volume elution
100 86.4
Sr recovery, %
after 10 volume elution
100 98.0
a Both tests use 0.1 M MSA load solutions eluted with 0.1 M MSA. The load was 10 column
volumes (2 mL, 0.54 cm2 x 3.7 cm column) and the elution was to 22-23 column volumes at 1.5
mL min-1
. (Data were provided by Dr. Ilya Shkrob, Argonne National Laboratory.)
Figure 2.7 shows the elaboration of a column for a raw urine sample after a 10
column volume loading and 15 column volume wash using 0.1 M MSA. Approximately
7% of Sr2+
was eluted from the Diphonix® resin column during the wash step, so the
recovery of Sr2+
was 93%. However, 99.95% of the Sr2+
on the Diphonix® resin column
was stripped passing just 3 column volumes of 3M HNO3, resulting in 3.2x concentration
of Sr2+
in the strip eluent. Approximately 82% of Sr2+
on the column was eluted with the
first column volume of the 3 M nitric acid, resulting in a very concentrated strontium
stream. In Figure 2.8, a test on the certified normal human urine is shown. In this test, 5
column volume samples of frozen urine (the form in which it typically arrives from the
field assays for laboratory analysis) were loaded onto separate 2 mL Diphonix columns.
41
In one test, the urine was acidified to pH=1 using 0.22 M MSA (the urine is buffering); in
another, 0.1 M MSA was added to achieve pH=1.6. In these experiments, there was no
loss of Sr2+
during loading and < 0.1% loss of Sr2+
during elution, in both cases. Stripping
the column after 15 column volumes of 0.1 M MSA with 3 column volumes of 3 M
HNO3 resulted in the recovery of 99.7% of Sr on the column. The concentrations of K+
and Na+ in the strip solution were < 0.3 mM (Figure 2.8). Though the 10 column volume
load leads to a 7% loss of Sr2+
in the wash step (Figure 2.7), the overall recovery is nearly
twice that obtained with a 5 column volume load (Figure 2.8), which will result in lower
detection limits. Differences between raw urine and frozen urine may also have an effect
on the recoveries from these two loading experiments. That is, freezing urine, because it
forms ice, denatures many of the proteins that aggregate and remove pigments when they
precipitate. Hence, there tends to be less interference with frozen urine than with raw
urine, which may lead to higher recoveries from the former.

42
Figure 2.7. Column test using standardized certified normal human urine. 10x
sample volumes were loaded on the 2 mL Diphonix resin column, 15x volumes of 0.1 M
MSA were passed, and the column was stripped using 3 M HNO3. (Data were provided
by Dr. Ilya Shkrob, Argonne National Laboratory.)

43
Figure 2.8. Column test elution profiles and Sr2+
stripping data using certified
normal human urine on 2 mL Diphonix resin columns. Panels A: 15 column volumes
of 0.1 M MSA were used to wash, Panels B: 15 column volumes of 0.22 M MSA were
used to wash. (Data were provided by Dr. Ilya Shkrob, Argonne National Laboratory.)

44
The retention behavior of alkali and alkaline earth cations on the Sr resin is well
documented [2.16, 2.20]. The 3 M HNO3 strip (3 column volumes) corresponds to the
conditions under which kex for strontium on the Sr resin is approximately 60 (Table 2).
Assuming that the volume of the Sr resin column is 10% of the volume of Diphonix
column, applying the strip solution directly on a 20-plate Sr resin column would
correspond to 30 column volume load resulting in a loss of < 0.1% Sr2+
during the
loading. After passing five more column volumes of nitric acid to wash away undesirable
ions and 2 column volumes of 10 mM nitric acid to strip, Sr2+
is concentrated 20-fold in
addition to the preconcentration on the Diphonix® resin column. This strontium stream is
decontaminated from any residual potassium, calcium, and trivalent ions including
yttrium.
2.5 The suggested process
The results given in the previous sections provide the basis for the suggested process
(Figure 2.1). At the heart of this process are two columns: a larger column filled with the
Diphonix® resin and a smaller one (10% of the volume of the former) filled with Sr resin
and connected to the other by a three-way valve. To save processing time, while one of
the columns is loaded/eluted, the other column is washed/conditioned for the next run, as
shown in Figure 2.9. In step 1, the two columns are offline and the Diphonix column is
conditioned for loading of Sr2+
with 0.1 M MSA while the Sr column is washed with 10
mM nitric acid. In step 2, 10-30 column volumes of treated urine are loaded on the
Diphonix® resin column, while the Sr resin column is still washed by 10 mM nitric acid.
In step 3, the alkali ions are eluted using 15-20 column volumes of 0.1 M MSA, while the
Sr resin column is conditioned for loading by passing 3 M nitric acid. In step 4, Sr2+
is

45
stripped from the Diphonix® resin column using 3 M nitric acid and the effluent from the
column is loaded directly on the Sr resin column. In step 5, 2 column volumes of 10 mM
nitric acid are used to strip Sr2+
from the Sr resin column, while the Diphonix column is
washed with 3 M nitric acid. Following the stripping of Sr2+
, the two columns return to
the conditions of step 1. The whole process takes approximately one hour. The typical
volumes of the two columns are 2 mL and 200 μL, respectively. For a 20 mL load, the
first column would concentrate Sr2+
by a factor of 2.5-3.5 and the second by a factor of
20, resulting in the overall concentration factor > 50. Higher concentration factors are
possible for Diphonix® resin columns with 30-40 theoretical plates.

Figure 2.9. Tandem Diphonix®-Sr Resin column treatment steps in the proposed scheme for rapid sorption, decontamination,
and concentration of 90
Sr from human urine samples.
46
47
2.6 Conclusion
The procedure described here constitutes a simple method for the separation and
preconcentration of radiostrontium from human urine comprising an acidification and
decolorization step followed by the use of Diphonix® resin (instead of tedious and time-
consuming ashing and precipitation steps[2.8, 2.9, 2.20] or multiple ion exchange resins
in tandem[2.9, 2.10]) and final concentration by Sr resin. Importantly, the rapid
depigmentation method devised here can be used for direct and efficient detection of
other radioisotopes in urine, including tritium, using common scintillation cocktails, as
color quenching is completely eliminated and MSA (unlike nitric acid) does not quench
fluorescence. By employing the recommended conditions, greater than 98% recovery of
Sr2+
, a concentration factor higher than 50-fold, and a processing time of approximately
one hour can be achieved. Notably, the suggested Sr resin column volume is 10-fold
smaller than the typical cartridges supplied by the manufacturer, leading to significant
cost savings. Furthermore, this method could be a simpler and more cost-effective
alternative to the sample processing techniques currently utilized for emergency
purposes.
Although the approach described here does represent a significant improvement in the
available methodology for determination of radiostrontium in human urine, certain
features of it may render it difficult to implement for high-throughput analysis of large
numbers of samples. First, if emergency responders require immediate information about
an individual’s exposure to radiostrontium, then the procedure clearly must be further
simplified. For instance, when the combination of acidity and other urine components
results in high ionic strength, premature Sr2+
breakthrough may occur. This fact, taken

48
together with the differences in the levels of various urine constituents among
individuals, suggests that highly skilled workers may be required to operate the
procedure. Next, although the Diphonix resin in this scheme does provide a means of
eliminating certain interferences before the Sr resin column, the fact remains that the
capacity of Diphonix® is limited (by the availability of active phosphoryl ligands).
Likewise, the amount of crown ether that can be loaded onto the Sr resin (and thus the
retention of Sr2+
) is limited, both by the substrate capacity and the solubility of the crown
in 1-octanol. These limitations restrict the extent to which the size of the columns can be
reduced. Finally, Sr retention is further limited by its modest extractability into a 1-
octanol solution of the crown ether. All of this suggests that truly meeting the
requirements of a high-throughput method may necessitate innovative approaches to
sample processing. For example, high capacity sorbents capable of being loaded with
much higher levels of extractant [2.21] could be devised. Along the same lines, improved
extractants with strong metal ion binding could be developed. Another more exotic
possibility would be to devise an easily retrievable strontium-specific solvent based on a
magnetic ionic liquid [2.22-2.24]. Such a system could, in principle, combine high
capacity and rapid kinetics with the ease of handling and high rates of sample throughput.
All of these approaches, however, require substantial additional fundamental research
before their feasibility can be assessed. In the case of ionic liquids, for example,
significant gaps remain in our understanding of the processes involved in the transfer of
metal ions from an aqueous phase into an ionic liquid in the presence of various
extractants. In the chapters that follow, our efforts to address this deficiency, in
particular, to elucidate the details of the processes involved in the extraction of

49
radiostrontium by a crown ether into various ionic liquids, are described. Only after such
details are understood might ionic liquid-based systems be developed to meet the
demands of high-throughput bioassays.
2.7 Acknowledgements
This study [2.1] was conducted in collaboration with the Chemical Sciences and
Engineering Division at Argonne National Laboratory. Because this work was performed,
in part, by the author, and because it serves as the inspiration for the remaining work
described in this dissertation, details of the study are provided in this chapter. The results
are reproduced with the permission of the authors, and those results obtained by others
are clearly indicated in the text or tables and figures provided.
2.8 References
[2.1] C.A. Hawkins, I.A. Shkrob, C.J. Mertz, M.L. Dietz, M.D. Kaminski, Anal. Chim.
Acta, 534, 2012, 271–279.
[2.2] G. Choppin, J. Rydberg, J.-O. Liljenzin, Radiochemistry and Nuclear Chemistry, 3rd
Ed.; Butterworth-Heinemann, 2001.
[2.3] M. Bé, C.C. Delieu, X. Mougeot, Radioactive Decay Data Tables, Monography,
Bureau International des Poid et Mesures; 1-5, 2010, 201-204.
[2.4] U.S. Environmental Protection Agency, Radiation Protection,
http://www.epa.gov/rpdweb00/radionuclides/strontium.html#environment,
Accessed 27 September 2012.
[2.5] Agency for Toxic Substances and Disease Registry (ATSDR), Toxicological Profile
for Ionizing Radiation. U.S. Dept. of Health and Human Services, Atlanta, GA,
September 1999.
[2.6] Ž. Grahek, M. R. Mačefat, Anal. Chim. Acta, 534, 2005, 271–279.
[2.7] S. L. Maxwell, B. K. Culligan, J. Radioanal. Nucl. Chem., 279, 2009, 757–760.
[2.8] M.L. Dietz, E.P. Horwitz, Health Phys. 61, 1991, 871-877.

50
[2.9] S. L. Maxwell, B. K. Culligan, J. Radioanal. Nucl. Chem. 275, 2008, 497-502.
[2.10] B.B. Sadi, C. Li, S. Jodayree, E.P.C. Lai, V. Kochermin, G.H. Kramer, Rad. Prot.
Dos., 140, 2010, 41-48.
[2.11] D.R. McAlister, E.P. Horwitz, J.T. Harvey, Health Phys., 101, 2011, 176-179.
[2.12] M.H. Lee, H.J.Ahn, J.H.Park, Y.J.Park, K.Song, Appl. Rad. and Isotopes, 69,
2011, 295–298.
[2.13] J. Mellado, M. Llauradó, G. Rauret, Anal. Chim. Acta, 458, 2002, 367-374.
[2.14] G.A. Taylor, The Evolution of Internal Dosimetry Bioassay Methods at the
Savannah River Site, http://www.c-n-t-a.com/srs50_files/253taylor.pdf, (accessed
02 March 2012).
[2.15] D.F. Putnam, Composition and Concentrative Properties of Human Urine, NASA
CR-1802, 1971,
http://ntrs.nasa.gov/archive/nasa/casi.ntrs.nasa.gov/19710023044_1971023044.pdf.
Accessed 02 March 2012.
[2.16] E.P. Horwitz, R. Chiarizia, M.L. Dietz, Solvent Extr. Ion Exch., 10, 1992, 313–
336.
[2.17] R. Chiarizia, E.P. Horwitz, S.J. Alexandratos, M.J. Gula, Sep. Sci. Technol., 32,
1997, 1-35.
[2.18] R. Chang, Physical Chemistry for the Biosciences, 1st Ed., University Science
Books, 2005, 556.
[2.19] R. Chiarizia, J.R. Ferraro, K.A. D’Arcy, E.P. Horwitz, Solv. Extr. Ion Exch., 13,
1995, 1063-1082.
[2.20] E.P. Horwitz, M.L. Dietz, D.E. Fisher, Anal. Chem., 63, 1991, 522-525.
[2.21] C. van den Berg, C.P.M. Roelands, P.Bussman, E.L.P. Goetheer, D. Verdoes,
L.A.M. van der Weilen.
[2.22] S. Hayashi, H. Hamaguchi, Chemistry Letters, 33, 2004, 1590-1591.
[2.23] Y. Yoshida, G. Saito, J. Mat. Chem. 16, 2006, 1254-1262.
[2.24] R.E. Del Sesto, T.M. McCleskey, A.K. Burrell, G.A. Baker, J.D. Thompson, B.L.
Scott, J.S. Wilkes, P.Williams, Chem. Commun. 2008, 447-449.

51
CHAPTER 3:
THREE-PATHWAY MODEL OF METAL ION EXTRACTION INTO
IONIC LIQUIDS
3.1 Introduction
Growing recognition of the extraordinary physicochemical properties and unique
solvation environment afforded by ionic liquids (ILs) has drawn increasing attention to
these solvents as media for chemical separations and analysis [3.1-3.3]. In recent years,
ILs have found use in such diverse areas as gas chromatography [3.4], mass spectrometry
[3.5-3.7], fluorescence spectroscopy [3.8], and capillary electrophoresis [3.9], among
others. Work in this laboratory has primarily concerned the potential utility of ILs,
(particularly those that are liquid at room temperature) as replacements for the molecular
organic solvents (e.g., paraffinic and chlorinated hydrocarbons) typically employed in
liquid-liquid extraction (LLE) [3.10-3.16]. These and other studies have demonstrated
that a variety of organic molecules (e.g., dyestuffs [3.17-3.20], amino acids
[3.21, 3.22])
and inorganic species [3.23-3.27] readily partition into ILs under appropriate conditions.
In the case of metal ion partitioning, these conditions most often involve the presence of a
complexing agent/extractant to render the metal ion more hydrophobic and thus,
extractable. Of the variety of reagents available for this purpose, neutral extractants (e.g.,
organophosphorus reagents, crown ethers, and calixarenes) are generally regarded as
most desirable from a practical perspective, as (at least in conventional molecular solvent
systems) the extent of metal ion partitioning can be varied simply by altering the
concentration of the aqueous phase anion (e.g., nitrate) present. Prior work, however,
indicates that metal ion partitioning in IL-based systems incorporating neutral extractants

52
can be a far more complex process than that observed in analogous conventional systems
[3.10-3.16]. Studies of the extraction of strontium and sodium ion by the macrocyclic
polyether (i.e., crown ether, CE) dicyclohexano-18-crown-6 (DCH18C6), for example,
suggest that in contrast to ordinary organic solvent-based extraction systems, for which
partitioning proceeds by extraction of a neutral complex, partitioning into ILs can involve
as many as three distinct pathways: extraction of a neutral complex, ion-exchange (IX)
involving exchange of a cationic metal-DCH18C6 complex for the cationic constituent of
the IL, and a second type of IX involving exchange of the metal ion for a hydronium ion
(or proton) bound to the extractant (Figure 3.1).
In attempting to evaluate the suitability of ILs as extraction solvents and to develop
guidelines for the design of separation systems employing them, it is essential to establish
the extent to which these observations are “generic”. To this end, a systematic
examination of the extraction of several alkali and alkaline earth cations by DCH18C6
from acidic nitrate media has been performed. As will be shown, in addition to providing
much-needed fundamental information concerning the extraction behavior of these ions
with neutral extractants, the results obtained may have practical significance in efforts to
devise improved systems for metal ion separations employing ILs. Several of the results
discussed in this chapter have been previously published [3.28]. Their reproduction here
has been approved by the authors.

Figure 3.1: The three-path model for metal ion partitioning between nitric acid solution and CnC1imTf2N ionic liquids in the
presence of DCH18C6. 5
3

54
3.2 Experimental
3.2.1 Materials
The ionic liquids were prepared and purified using established methods [3.29, 3.30].
All Tf2N IL products were tested for residual halides by contacting a measured volume
three times with an equal volume of water and analyzing the combined aqueous fractions
by ion chromatography. All were found to contain less than 1 ppm bromide or chloride.
Ion chromatographic eluents were prepared from either saturated sodium hydroxide
solution (puriss., Fluka, Milwaukee, WI) or methanesulfonic acid (puriss., Fluka,
Milwaukee, WI). Primary alcohols and inorganic salts were obtained from Sigma-Aldrich
(Milwaukee, WI). The DCH18C6 (Parish Chemical, Orem, UT) used was a mixture of
the cis-syn-cis and cis-anti-cis isomers and was used as received. Nitric acid solutions
were prepared from trace-metal grade concentrated acid (Optima™, Fisher Scientific,
Pittsburg, PA) and standardized by titration with standard sodium hydroxide solutions
(Ricca, Arlington, TX) using phenolphthalein indicator (Ricca, Arlington, TX).
Radiotracers of 22
Na, 45
Ca, 85
Sr, 135
Ba, and 137
Cs were purchased as nominal solutions
from Eckert and Ziegler Isotope Products, Inc. (Valencia, CA).
3.2.2 Instruments
Gamma spectroscopy was performed using a PerkinElmer model 2480 automatic
gamma counter equipped with WIZARD2 software. Liquid scintillation counting was
performed using a PerkinElmer Tri-Carb 2810 TR Series liquid scintillation counter
equipped with QuantaSmart software. NMR spectra were acquired on a Bruker DPX300
NMR spectrometer operating at 300.13 MHz for proton and 75.47 MHz for carbon-13,

55
and equipped with a z-gradient broadband (BBO) probe. Spectra were obtained using
solutions of dimethylsulfoxide-d6 (Aldrich, 99.96 atom% D), and all chemical shifts were
reported relative to tetramethylsilane. Where appropriate (i.e., for ILs not previously
reported) elemental (CHN) analysis of the ionic liquids was performed by the combustion
method (Galbraith Laboratories, Knoxville, TN). Other elements (e.g., oxygen) were
determined from the theoretical mass balance. Potassium concentrations for acid
dependencies were determined using a spectroscopic standard solution (Ultra Scientific,
North Kingstown, RI) and assayed using a Varian Liberty Series II sequential inductively
coupled plasma atomic emission spectrometer (ICP-AES) using parameters listed in
Table 3.1 or a MicroMass inductively coupled plasma mass spectrometer (ICP-MS) using
settings similar to those listed in Table 3.2. Nitrate and halide concentrations were
determined using a Dionex ICS-1000 ion chromatograph equipped with equipped with a
25 μL fixed-loop manual injection port, an ASRS 300 cation self-regenerating eluent
suppressor,a conductivity detector, Dionex AS18/AG18 analytical and guard columns (4
X 250 and 4 X 50 mm), a Dionex ASRS 300 (4 mm) conductivity suppressor, and 37
mM NaOH eluent. The instrument was operated using Chromeleon software version
6.80. Potassium and cesium concentrations for the determination of anion co-extraction
were measured using the same ion chromatograph equipped with a CSRS 300 cation self-
regenerating eluent suppressor, a Dionex CS12A analytical and CG12A guard columns (4
X 250 and 4 X 50 mm), and 20 mM methanesulfonic acid eluent. IC eluent flow rates
were 1.00 mL/min, and the column temperature was maintained at 30°C.

56
Table 3.1
Parameters employed for potassium ion determination by ICP-AESa
Peak 766.490 nm Viewing Height 10 mm
Window 0.080 nm Sample Uptake Delay 25 seconds
Integration Time 5.00 seconds Pump Rate 15 rpm
Replicates 3 Instrument Stabilization 15 seconds
Power 1.00 kW Rinse Time 30 seconds
a Operated with Varian Plasma96 software version 1.12
Table 3.2
Parameters employed for potassium ion determination by ICP-MSa
Analyzer Gas Torch
Cone Lens 85 Cool 13.59 X-Axis 2.00
Hex Exit Lens 400 Intermediate 0.90 Y-Axis -0.06
Hex Bias 0 Nebulizer 1 0.87 Z-Axis -0.36
LM Resolution 12.5 Nebulizer 2 0.00 Forward Power 1350
High Resolution 12.5 He 8.0
Ion Energy 2.0 H2 4.0
Multiplier 400 Hexapole Aux 0.00
Mass Monitored 39 m/z Laser 2.40
a Operated with MassLynx software version 3.4
3.2.3 Methods
Distribution ratios (DM) were determined as a ratio of the count rate in the organic
phase to that of the aqueous phase using commercial radiotracers, assayed via gamma
spectroscopy or liquid scintillation counting using standard procedures. In each metal

57
distribution experiment, the organic phase consisted of DCH18C6 dissolved in the
designated ionic liquid, and the aqueous phase nitric acid concentration was
systematically adjusted either by conducting separate experiments for each condition, or
adding acid after each condition had been sampled. Unless otherwise noted, acid
dependencies for metal extraction were performed at 0.1 M DCH18C6 in the organic
phase. All organic phases were pre-equilibrated with aqueous phase prior to the
introduction of the metal ions or radiotracer. Each equilibrated phase was sampled for
analysis in at least duplicate with resulting uncertainties based on counting statistics that
were generally within 10%, although the uncertainty interval was considerably wider for
the highest distribution ratios values (DM ≥ 1000). Additionally, for radiometric
measurements, the sum of the count rates in each phase yielded recoveries within 10% of
the radiotracer stock solution used, indicating that equilibrium was established with only
two phases involved. Nitric acid concentrations were determined by titration with a
standard sodium hydroxide solution (Ricca Chemical Company, Arlington, TX). Due to
considerable background signal in the ICP-MS associated with carryover from biological
samples for which this instrument is most often used, a cesium internal standard (ICP
Standard, Ricca, Arlington, TX) was used to improve the quantification of various
samples with low (< 25 ppb) potassium concentrations.
3.3 Generality of the Three-Path Model for Groups 1 and 2 Ions
3.3.1 Nitric acid dependency of DM for extraction into aliphatic alcohols by DCH18C6
In their initial studies to explore the possible utility of ionic liquids as solvents in the
extraction of metal ions, Dai et al. [3.23] reported astonishingly efficient extraction of

58
strontium from water into a series of N,N’-dialkylimidazolium-based ILs containing
DCH18C6. Indeed, for several ILs, the values obtained for the strontium distribution ratio
(DSr) far exceeded (i.e., DSr > 103 vs. DSr ≈ 1) those achieved with conventional molecular
diluents (e.g., chloroform) under the same conditions, a surprising result given the low
aqueous phase anion concentration (1.5 mM NO3-) present and the nature of the expected
partitioning process (i.e., extraction of a neutral complex, as per Eqn. 3-1):
Sr2+
+ 2 NO3- + DCH18C6org ⇋ Sr(NO3)2 DCH18C6org (3-1)
In an effort to discern the source of the unexpectedly high strontium extraction
efficiencies observed, a systematic comparison of the extraction of Sr2+
by DCH18C6
into several N,N’-dialkylimidazolium bis[(trifluoromethyl)sulfonyl]imide ILs to that
observed for a series of aliphatic alcohols (n-pentanol to n-decanol) was carried out
[3.10]. This work, along with a subsequent study of sodium ion extraction under similar
conditions [3.14], suggested that the enhanced extraction efficiency can be attributed to
differences in the predominant mode by which the metal ion partitions between the IL (or
organic) and aqueous phases (i.e., ion-exchange for the IL vs. extraction of a neutral
complex for the conventional diluent). In this work, these studies have been extended to
other alkali and alkaline earth cations to determine both the generality of these earlier
observations and to establish the influence upon extraction selectivity of changing system
conditions.
Figures 3.2 and 3.3 depict the dependence of the distribution ratio (DM) of several
Group 1A and 2A metal ions on aqueous nitric acid concentration for extraction into 0.1

59
M solutions of DCH18C6 in various n-alcohols. For these and other such conventional
solvents, DM initially rises with increasing nitric acid (i.e., nitrate) concentration, as the
extraction of metal ions into these diluents requires anion co-extraction to maintain
electroneutrality (Eqn. 3-1). The leveling-off and eventual sharp decrease in DM for alkali
metal ions at high acidity can be attributed to a decrease in the free DCH18C6
concentration arising from nitric acid extraction by this crown ether [3.31]. Such
competition for the extractant is obviously less pronounced in the case of alkaline earth
cations, a result of their greater electrostatic charge and the accompanying increase in the
metal ion-crown ether complex formation constant [3.32]. As expected, an increase in the
hydrophobicity of the alcohol results in a decline in extraction efficiency for all of the
alkali and alkaline earth cations under any given set of conditions, a consequence of the
decrease in organic phase water content that accompanies this greater hydrophobicity and
the importance of organic phase water in facilitating co-extraction of the nitrate anion
[3.33]. (Further details of this phenomenon will be discussed in Chapter 4.) Regardless of
conditions (e.g., the nature of the metal ion or the alkyl chain length of the solvent),
however, the process responsible for metal ion partitioning into the alcohols remains
unchanged (i.e., extraction of a neutral metal-nitrato crown ether complex).

60
Figure 3.2: Effect of nitric acid concentration on the extraction of Na+ (panel A)
and K+
(panel B) by DCH18C6 (0.10 M) in 1-pentanol (), 1-hexanol (), 1-octanol
(■), and 1-decanol (). The smooth curves are intended only as guides to the eye.

Figure 3.3: Effect of nitric acid concentration on the extraction of Ca2+
(panel A), Sr2+
(panel B), and Ba2+
(panel C) by
DCH18C6 (0.10 M) in 1-pentanol (), 1-hexanol (), 1-octanol (■), and 1-decanol (). Curves are least-squares linear fits.
61

62
3.3.2 Metal ion vs. nitrate extraction into CnC1imTf2N ILs by DCH18C6
That this is not the case for the ionic liquids is readily evident from an examination of
the results presented in Tables 3.3 and 3.4, which summarize measurements of the
partitioning of nitrate anions and five alkali and alkaline earth cations between water and
several CnC1imTf2N ILs in the presence of DCH18C6. If the partitioning of a neutral
complex were the sole mode of cation extraction in these systems as well, then the
percentage extraction of nitrate and of the metal ion would correspond throughout. As
can be seen, however, this is not observed. Rather, in most instances, the fraction of
nitrate extracted is far less than the corresponding fraction of metal ion extracted,
consistent with a significant contribution of ion exchange involving the cationic
constituent of the IL (a process which, as shown in Eqn. 3-2, does not require anion co-
extraction) to the observed metal ion partitioning [3.12]:
M DCH18C6n+
+ x IL+
IL ⇋ M DCH18C6n+
IL + n IL+ (3-2)
As has been shown previously for strontium [3.12], for all of the metal ions examined
here, increasing IL cation hydrophobicity is accompanied by a diminished contribution of
ion exchange to the overall extraction process. For Ba2+
, for example, the amount of
nitrate extracted corresponds to only ca. 9% of that required for extraction of a neutral
complex when C5C1imTf2N is employed, indicating that barium partitioning proceeds
primarily by ion exchange in this solvent. However, for the homologue, C10C1imTf2N,
the percentages of nitrate and barium ion extracted are essentially identical, consistent
with neutral complex partitioning as the sole mode of extraction. It is obvious from the

63
results shown that an increase in IL cation hydrophobicity is more effective at inducing a
shift toward neutral complex extraction for divalent metal ions (such as Ba2+
) than for
monovalent cations. Undoubtedly, it is the greater charge of the Group 2A cations and
the accompanying stronger interaction of these ions with nitrate that account for this
difference. Additionally, the limited water solubility of the ionic liquid cation will render
the extraction of an equivalent of the cationic metal-crown ether complex (Eqn. 3-2) less
favorable for divalent complexes than for monovalent complexes.
Table 3.3
The effect of IL cation chain length on strontium, barium, and nitrate ion
partitioning between water and 0.20 M DCH18C6 in CnC1imTf2N
Metal
Organic
Phase %EMa, b %ENO3
- a, b
Ratio
%EM/%ENO3
-
Partitioning
Mode Indicated
Sr
C5C1imTf2N
C6C1imTf2N
C8C1imTf2N
C10C1imTf2N
96.4
96.5
83.4 ± 5.1
82.6
45.7
39.0
23.4 ± 3.0
20.2
10.7 ± 0.3
9 ± 7
17.6 ± 0.5
16.1 ± 0.8
25.4 ± 0.8
20.9 ± 1.0
23.1 ± 0.2
20.0 ± 1.0
9.01
4.74
1.80
1.01
cation exchange
cation exchange
mixed
neutral complex
Ba
C5C1imTf2N
C6C1imTf2N
C8C1imTf2N
C10C1imTf2N
98.6
93.6 ± 5.0
58.0
31.4 ± 2.3
8.92 ± 0.18
18.4 ± 0.2
28.7 ± 0.1
28.0 ± 0.1
11.1
4.53
2.02
1.12
cation exchange
cation exchange
mixed
neutral complex a The two values shown are from the present study and reference [3.12], respectively.
b Uncertainties were calculated at the 95% confidence interval (n=3).
Values without uncertainties were calculated from duplicate measurements.

64
Table 3.4
The effect of IL cation chain length on sodium, potassium, cesium, and nitrate ion
partitioning between water and 0.20 M DCH18C6 in CnC1imTf2N
Metal
Organic
Phase %EMa %ENO3
- a
Ratio
%EM/%ENO3
-
Partitioning
Mode Indicated
Na
C5C1imTf2N
C6C1imTf2N
C8C1imTf2N
C10C1imTf2N
94.1
85.1 ± 4.7
50.3
28.2 ± 2.5
1.34 ± 0.02
5.08 ± 0.03
12.4 ± 0.1
21.0 ± 0.1
70.2
16.7
4.06
1.34
cation exchange
cation exchange
cation exchange
mixed
K
C5C1imTf2N
C6C1imTf2N
C8C1imTf2N
C10C1imTf2N
99.9 ± 0.1
99.8 ± 0.1
98.4 ± 0.1
92.7 ± 0.1
0.214 ± 0.031
6.67 ± 0.02
50.4 ± 0.1
60.8 ± 0.0
476
15.0
1.95
1.52
cation exchange
cation exchange
cation exchange
mixed
Cs
C5C1imTf2N
C6C1imTf2N
C8C1imTf2N
C10C1imTf2N
99.2 ± 0.4
98.2 ± 0.4
85.1 ± 0.4
56.4 ± 0.4
1.64 ± 0.68
3.55 ± 0.32
17.8 ± 0.1
26.3 ± 0.1
60.4
27.7
4.78
2.14
cation exchange
cation exchange
cation exchange
mixed a Uncertainties were calculated at the 95% confidence interval (n=3).
Values without uncertainties were calculated from duplicate measurements.
3.3.3 Nitric acid dependency of DM for extraction into CnC1imTf2N ILs by DCH18C6
The significant differences between the behavior of mono- and divalent cations in the
ionic liquid systems (as well as the differences in the behavior of ionic liquids and
aliphatic alcohols as extraction solvents) are also readily apparent from an examination of
the nitric acid dependencies of the metal ion distribution ratios (Figures 3.4 and 3.5) for
the various alkali and alkaline earth cations. Prior work with strontium ion [3.12] has
shown that a systematic shift in the predominant mode of its transfer into ILs in the
presence of DCH18C6 accompanies an increase in IL cation hydrophobicity.
Specifically, this shift manifests itself as a change in the acid dependency from one in
which rising nitric acid concentration is accompanied by falling DSr values to one in

65
which these values generally increase as the acidity increases. This conclusion, however,
was based on a somewhat limited range of acid concentrations (i.e., those expected to be
encountered either in the analytical-scale separation and preconcentration of Sr-89/90
from typical environmental samples [3.34, 3.35] or in the process-scale removal of
radiostrontium from nuclear waste samples [3.36, 3.37]). As can be seen from Figure 3.4,
when considered over a wide range of acidities, the variation in DM with nitric acid
concentration for divalent cations can be a rather complex one. In contrast, each of the
monovalent cations is seen to exhibit a nearly monotonic decrease in DM with rising
aqueous acidity (Figure 3.5).

Figure 3.4: Effect of nitric acid concentration on the extraction of Ca2+
(panel A), Sr2+
(panel B), and Ba2+
(panel C) by
DCH18C6 (0.10 M) in C5C1imTf2N (), C6C1imTf2N (), C8C1imTf2N (), and C10C1imTf2N (). The smooth curves are intended
only as guides to the eye.
66

Figure 3.5: Effect of nitric acid concentration on the extraction of Na+ (panel A) and K
+ (panel B), and Cs
+ (panel C) by
DCH18C6 (0.10 M) in C5C1imTf2N (), C6C1imTf2N (), C8C1imTf2N (), and C10C1imTf2N (). The smooth curves are
intended only as guides to the eye.
67

68
To understand these results, it must be recalled that prior work with Sr2+
and Na+
[3.12, 3.14] suggests the presence of three distinct pathways by which a metal ion can be
extracted into an IL in the presence of a crown ether (Figure 3.1): the processes described
by Equations 3-1 and 3-2 above (i.e., partitioning of a neutral metal-nitrato crown ether
complex and exchange of a cationic metal-crown ether complex for the cationic
component of the IL, respectively) and a third process in which the metal ion is
exchanged for a hydronium ion extracted by the crown ether, as depicted for sodium ion:
Na+ + H3O•DCH18C6
+IL ⇋ H3O
+ + Na•DCH18C6
+IL (3-3)
Prior work further suggests that the balance among these pathways will vary with the
experimental conditions (e.g., the hydrophobicity of the IL cation and the aqueous
acidity) [3.12]. Examination of the variation in DM with aqueous nitric acid
concentration for potassium and cesium ion indicates that these dependencies, like those
of Na+, are consistent with a partitioning process involving two types of ion exchange.
That is, for each of these ions, at low aqueous acidities, DM under a given set of
conditions is seen to fall as the chain length of the IL cation (i.e., its hydrophobicity)
rises. Such a result is that expected when the dominant mode of extraction involves
exchange of the metal-crown ether complex for the cationic constituent of the IL (Eqn. 3-
2 above) [3.12]. As the acidity rises, however, the extractant dependencies converge,
indicating that the same process (here, exchange of the metal ion for hydronium ion
complexed with the crown ether as per Eqn. 3-3 [3.14]) is likely the primary factor
determining the extraction efficiency (DM) observed in all three ILs. That a third mode of

69
partitioning (i.e., extraction of a neutral metal-nitrato-crown ether complex) must also be
operative in the extraction of monovalent cations is demonstrated by the results presented
earlier in Table 3.2, where co-extraction of measureable quantities of nitrate from water
into the ILs is frequently observed. It is important to note, however, that this mode is
apparently of significance only in the absence of appreciable quantities of aqueous acid.
Contrary to conventional organic solvents (in which the acid adducts with DCH18C6
typically comprise molecules of undissociated HNO3 [3.30]), spectroscopic analysis
[3.14] has revealed that acid extraction by the crown ether into an IL phase results in the
formation of a DCH18C6 : hydronium complex. Although the process described in Eqn.
3-3 does not lead to the direct loss of the IL cation to the aqueous phase, it is important to
note that the formation and partitioning of the DCH18C6 : hydronium adduct would be
expected to result in the loss of an equivalent of the IL cation upon preconditioning of the
IL phase with acid:
H3O•DCH18C6 +
+ IL+IL
-IL ⇋ H3O•DCH18C6
+IL
-IL + IL
+ (3-4)
That an increase in the initial concentration of the crown ether in the ionic liquid is
accompanied by a corresponding increase in the equilibrium concentration of the IL
cation in the aqueous phase [3.14] confirms that extraction of a metal ion by either ion-
exchange pathway (Eqn. 3-2 or Eqn. 3-3) undoubtedly requires the transfer of the IL
cation to the aqueous phase. From a practical standpoint, these are not conditions for a
sustainable metal ion separation system.

70
In contrast to the trends observed in the acid dependencies of the alkali cations, the
contribution of neutral complex extraction to the overall partitioning process is readily
evident for the divalent metal ions, even at high acidities. Again beginning by
considering the results obtained at low (ca. 0.5 M) acid concentrations (Figure 3.3), it
can be seen that as was the case for the monovalent metal ions, increasing IL cation
hydrophobicity is accompanied by a decrease in the value of DM at a given acidity for
each of the Group 2A metal ions, consistent with the dominant role of ion-exchange
involving the IL cation (Eqn. 3-2) under these conditions. As the nitric acid
concentration is increased, competition between the two other possible modes of metal
ion partitioning determines the direction and shape of the acid dependency, a
consequence of the fact that nitric acid addition introduces both acid (i.e., H3O+) and
nitrate anion to the system. For the ILs comprising a short-chain (i.e., low
hydrophobicity) cation, increasing nitric acid concentration is initially accompanied by
falling values of DM, indicating that ion exchange between crown ether-complexed
hydronium ion and the aqueous metal ion is an important contributor to extraction.
Consideration of the competition among the various possible routes for partitioning
can be used to rationalize the shape of the acid dependencies for the longer chain (i.e.,
more hydrophobic) ILs as well. For calcium ion extraction into the C8 and C10 ILs, for
example, the difference between the dependencies at low acidity is consistent with a
contribution to the observed partitioning of ion exchange involving the cationic
component of the IL (Eqn. 3-2) [3.12]. As the HNO3 concentration (and thus, the nitrate
concentration) rises, DM also increases, indicating that partitioning of the neutral metal-
nitrato-crown ether complex is the primary contributor to the observed extraction [3.12].
71
The eventual convergence and rollover of the dependencies suggests that at least over a
limited range of acidities, the contribution of ion exchange involving the protonated
crown ether is significant [3.14]. Eventually, however, rising nitrate concentration leads
to re-establishment of neutral complex partitioning as the predominant mode of
extraction. This same approach can be used to rationalize the results obtained for the
other divalent metal ions under the same conditions.
It is important to note here that a variation in the preferred mode of extraction with
aqueous acidity is not without precedent. Similar results have, in fact, been reported in
the extraction of uranium with tri-n-butyl phosphate into the same series of ILs
considered here, for which the predominant route for uranium partitioning has been
reported to change from ion exchange to neutral complex extraction as the nitric acid
concentration rises [3.15].
3.3.4 Influence of Hard-Soft Lewis Acid Character of Extracted Metal Ions
In addition to providing data that support the generality of the three-pathway model
as a means to describe the balance of pathways that may contribute to the extraction of
metal ions by crown ethers in ILs, comparing the results for different metal ions reveals
the significant role that the Lewis acidity of the metal ion plays in determining the
predominant mode of partitioning in the crown ether-IL system. That is, as the Lewis
acidity of the divalent cations rises (Ba2+
< Sr2+
< Ca2+
), so too does the prevalence of a
positive slope in the nitric acid dependencies of DM (Figure 3.3) and thus, the
significance of neutral complex extraction. For instance, although the downward trend in
the nitric acid dependency for barium extraction into C8C1imTf2N continues even at

72
relatively high acidities, for both Ca2+
and Sr2+
, DM eventually begins to rise with
increasing nitric acid concentration. As noted previously (and as observed in
conventional molecular solvents), increasing DM with rising nitric acid (i.e., nitrate)
concentration is consistent with partitioning of a neutral metal-nitrato-crown ether
complex [3.12]. These trends may be explained by the hard-soft theory of complexation
[3.38], whereby the nitrate ion (as a hard base) interacts most strongly with a harder acid
(i.e., Ca2+
vs. Ba2+
). Apparently then, for metal cations with an appropriately high charge
density (i.e., Ca2+
and Sr2+
), the interaction between the cation and nitrate anion is
sufficiently strong as to disfavor ion exchange processes.
3.3.5 Crown ether dependency of DM for extraction into CnC1imTf2N ILs by DCH18C6
It is also worth noting that despite obvious differences in the acid dependencies of DM
for the various monovalent and divalent metal ions, in all cases, the extractant
dependencies observed are consistent with the partitioning of a 1:1 metal ion: crown ether
complex. Specifically, as can be seen from Figure 3.6, a log-log plot of DM vs.
DCH18C6 concentration at constant nitric acid concentration yields a line of unit slope
for each of the Group I cations. For the divalent metal ions, some deviation from unit
slope is observed at sufficiently high extractant concentrations, as is observed for 1-
ocatnol [3.31]. To understand the origin of this deviation, it is necessary to first consider
in some detail the extraction of strontium from acidic nitrate media by DCH18C6 into 1-
octanol.

73
Figure 3.6: Effect of DCH18C6 concentration on the extraction of Na+ (■), K
+ (),
Cs+ () (panel A); Sr
2+ () and Ba
2+ () (panel B) from 3.0 M nitric acid into
C10C1imTf2N. Curves are least-squares linear fits.
Dietz et al. [3.31] have derived an expression relating DSr to various experimental
parameters for this system. Specifically, for the cases in which the nitric concentration is
maintained constant, the the distribution ratio of strontium (and by analogy, other alkaline
earth cations) can be expressed as follows

74
(3-5)
where K’ex is the conditional extraction constant and K’c is the conditional formation
constant for the metal ion - crown ether complex, αf is the fraction of free (not complexed
by acid) crown ether in the organic phase, Ccrown is the formal crown ether concentration,
and D (in the denominator) is the distribution ratio of the crown ether itself under the
experimental conditions.
Equation 3-5 may be useful in interpreting the differences observed between
conventional solvent systems and those based upon of ILs. That is, the denominator of
Eqn. 3-5 includes a crown ether concentration term, the magnitude of which (relative to
1) will determine the extent to which DM will rise with increasing extractant
concentration. At low Ccrown, K’c (Ccrown/D+1) << 1, and the value of DM will thus rise
linearly with Ccrown (for a given nitric acid concentration, which fixes [NO3-] and αf). At
higher Ccrown, however, K’c (Ccrown/D+1) eventually approaches 1, or exceeds 1, and the
result is a dimunition in the slope of the DM vs. [DCH18C6] plot, and eventually, a
leveling off of the plot. Indeed, as might be expected, the curves for the extractant
dependencies of alkaline earth cation extraction in Figure 3.6 panel B appear to level off.
However, at still higher concentrations of the crown ether, the plot actually exhibits a
decrease in DM with rising extractant concentration, an observation not explained by Eqn.
3.5. Apparently then, the dependence of the distribution ratios for divalent metal ions on
the extractant concentration is more complicated for ILs than that for molecular diluents.
When the same measurements are made at lower nitric acid concentrations (Figure 3.7),
the lower nitrate concentration is reflected in the overall lower DSr values, consistent with

75
the acid dependency of DSr (Figure 3.3). More importantly, a greater decline in the values
of of DSr at high extraction concentrations is observed at these lower acidities, indicating
that the acid concentration also plays a role in defining the extractant dependencies. All
of these observations can be explained by recognizing that, over the range of acidities
considered, a not insignificant contribution to the overall extraction is made by a crown-
mediated ion exchange reaction analogous that shown for Na+ in Eqn. 3-3. As can be
seen from the equation for this reaction (Eqn. 3-6), the only acid adduct that is formed in
systems comprising these ILs is a 1:1 hydronium: crown ether complex [3.14]. Thus, if
M2+
(e.g, Sr2+
) is substituted for Na+, electroneutrality demands that for every metal ion
extracted, two hydronium: DCH18C6 adducts be involved. Accordingly, the general
equation for the partitioning pathway involving cationic metal ion: DCH18C6 complexes
is
Mn+
+ n H3O•DCH18C6 +
IL ⇋ n H3O+ + M•DCH18C6
n+IL + (n-1) DCH18C6IL (3-6)
From the perspective of chemical equilibria, the production of free DCH18C6 molecules
in the presence of increased concentrations of this species would not be favorable. Thus,
as the initial concentration of the free ligand in the IL phase increases, the propensity to
extract a divalent metal ion by crown-mediated cation exchange is likely to diminish. In
fact, under some conditions (i.e., those that tend to support the extraction of divalent
metal ions by this pathway), the decrease in the rate of change in DM with increasing
crown concentration is apparently sufficient to produce a noticeable decline in the
extractant dependencies.

76
Figure 3.7: Effect of DCH18C6 concentration on the extraction of Sr2+
from 0.050
M HNO3 () 1.0 M HNO3 () and 3.0 M HNO3 () into C10C1imTf2N. The smooth
curves are intended only as guides to the eye.
3.3.6 Implications for Extraction Efficiencies and Selectivities
In considering the possible practical significance of these results, it is important to
point out that certain separations important in radiation dosimetry require (among other
things) high divalent/monovalent cation extraction selectivity. For example, in the
determination of radiostrontium in biological samples, isolation of a pure strontium

77
fraction requires a separation method exhibiting strontium/sodium selectivity ( Sr/Na)
sufficient to take up traces of Sr-89/90 in the presence far larger quantities of sodium ions
and calcium ions [3.34, 3.35]. In conventional solvent extraction systems employing an
aliphatic alcohol diluent (e.g., 1-octanol), as depicted in Figure 3.8 panel A, DCH18C6
can provide adequate Sr/Na only at certain acidities. For C10C1imTf2N (Figure 3.8 panel
B), in contrast, the tendency of the extraction of monovalent cations to fall with
increasing acidity while that of the divalent cations rises results in an improvement in
Sr/Na vs. that seen in 1-octanol over a range of acidities. Especially useful from a
practical perspective is the improvement in the 1-3 M HNO3 region, the range over which
extraction/sorption is commonly carried out. As shown in Table 3.3, at 2 M HNO3 for
example, the Sr/Na selectivity is improved by a factor of five upon changing the organic
diluent from 1-octanol to C10C1imTf2N. (Also noteworthy is that this change also results
in a 10-fold improvement in the Sr/Ca extraction selectivity.) The Sr/Na selectivity in
C10C1imTf2N peaks in the 1-3 M nitric acid region as a consequence of the decline of
strontium extraction above this acidity. It remains to be determined if a modification of
the structure of the crown ether to render it more hydrophobic might preserve these
improvements in selectivity, while affording higher extraction efficiencies.

Figure 3.8: Effect of nitric acid concentration on the extraction of Sr
2+ (), Na
+ (), and Ca
2+ () into 1-octanol (left panel)
and C10C1imTf2N (right panel). Data for calcium distribution ratios in the left panel were estimated as an average of those for 1-
pentanol and 1-decanol. The smooth curves are intended only as guides to the eye.
78

Table 3.3
Effect of nitric acid concentration on Sr/Na and Sr/Ca valuesa in extraction from aqueous solution by
0.10 M DCH18C6 in 1-octanol and C10C1imTf2N
[HNO3], M σSr/Na in 1-octanol σSr/Na in C10C1imTf2N σSr/Ca in 1-octanolb σSr/Ca in C10C1imTf2N
0.1
0.2
0.4
1
2
3
4
5.8
0.85
1.6
5.61
7.35
8.22
14.2
27.8
182
1.3
2
7.5
25.8
42.6
68.4
60.2
32
12.6
13.6
25.3
25.4
23.6
38.0
50.6
70.4
206
150
267
291
237
234
157
169 a Distribution ratios used in these calculations are derived from least-squares regression of the empirical data.
b Data for calcium distribution ratios estimated as an average of those for pentanol and decanol.
79

80
3.4 Conclusions
Taken together, the results presented in this chapter indicate that the three-path
description of metal ion partitioning into imidazolium-based ILs in the presence of a
neutral crown ether suggested by prior studies of strontium and sodium ion constitutes a
“generic” representation of alkali and alkaline earth cation extraction in these systems.
This model, therefore, can be utilized to gain a qualitative understanding of the balance of
the partitioning pathways by interpretation of the trends in the acid dependencies, and
perhaps the extractant dependencies, over a wide range of conditions for metal ions that
do not form anionic complexes. Such interpretation has been useful in explaining, for
instance, how the hard-soft acid nature of the metal ion may affect which of the pathways
predominates under given conditions, and in turn, provides significant selectivity between
metal ions differing in this aspect. Although it remains to be demonstrated, it is expected
that analogous processes describe the partitioning of any of a number of other metal ions
into a variety of ILs in the presence of other neutral extractants as well. Because the
interplay between the various pathways has shown to be considerably dependent on the
structure (e.g., hydrophobicity) of the IL, the effect of systematic variations in the
structure of the cationic component of the IL will be explored in subsequent chapters.
3.4 Acknowledgements
This work was supported by the Single Investigator Small Group Research (SISGR)
Program of the Office of Basic Energy Sciences of the United States Department of
Energy under sub-contract from Brookhaven National Laboratory. The measurements of
the nitric acid dependence of the strontium distribution ratios and those of sodium in n-

81
alcohols were performed by Sarah Garvey. Dan McAlister of EiChroM Technologies,
Inc. (Darien, IL) and Sue Krezoski of the UWM Department of Chemistry and
Biochemistry are gratefully acknowledged for assistance with ICP-AES and ICP-MS
measurements, respectively.
3.6 References
[3.1] X. Han, D.W. Armstrong, Acc. Chem. Res. 2007, 40, 1079–1086.
[3.2] P. Sun, D.W. Armstrong, Anal. Chim. Acta, 2010, 661, 1-16.
[3.3] M. Koel, Crit. Rev. Anal. Chem. 2005, 35, 177-192.
[3.4] J.L. Anderson, D.W. Armstrong, Anal. Chem. 2005, 77, 6453-6462.
[3.5] D.W. Armstrong, L-K. Zhang, L. He, M.L. Gross, Anal. Chem. 2003, 73, 3679-
3686.
[3.6] S. Carda-Broch, A. Berthod, D.W. Armstrong, Rapid Comm. Mass Spec. 2003, 17,
553-560.
[3.7] I. Romero-Sanz, J. Fernandez de la Mora, J. Appl. Phys. 2004, 95, 2123-2129.
[3.8] P.K. Chowdhury, M. Halder, L. Sanders, T. Calhoun, J.L. Anderson, D.W.
Armstrong, X. Song, J. W. Petrich, J. Phys. Chem. B, 2004, 108, 10245-10255.
[3.9] E.G. Yanes, S.R. Gratz, M.J. Baldwin, S.E. Robinson, A.M. Stalcup, Anal. Chem.
2001, 73, 3838-3844.
[3.10] M.L. Dietz, J.A. Dzielawa, Chem. Commun. 2001, 20, 2124-2125.
[3.11] M.P. Jensen, J.A. Dzielawa, P. Rickert, M.L. Dietz, J. Am. Chem. Soc. 2002, 124,
10664-10665.
[3.12] M.L. Dietz, J.A. Dzielawa, I. Laszak, B.A. Young, M.P. Jensen, Green Chem.
2003, 5, 682-685.
[3.13] D.C. Stepinski, M.P. Jensen, J.A. Dzielawa, M.L. Dietz, Green Chem. 2005, 7,
151-158.
[3.14] D.C. Stepinski, M.L. Dietz, Green Chem. 2005, 7, 747-750.

82
[3.15] M.L. Dietz, D.C. Stepinski, Talanta, 2008, 75, 598-603.
[3.16] D.C. Stepinski, G.F. Vandegrift, I.A. Shkrob, J.F. Wishart, K. Kerr, M.L. Dietz,
D.T.D. Qadah, S.L. Garvey, Ind. Eng. Chem. Res. 2010, 49, 5863-5868.
[3.17] A.E. Visser, R.P. Swatloski, R.D. Rogers, Green Chem. 1999, 2, 1-4.
[3.18] R. Vijayaraghavan, N. Vedaraman, M. Surianarayanan, D.R. MacFarlane, Talanta,
2006, 69, 1059-1062.
[3.19] Y.C. Pei, J.J. Wang, X.P. Xuan, J. Fan, M. Fan, Environ. Sci. Technol. 2007, 41,
5090-5095.
[3.20] A. Safavi, H. Abdollahi, N. Maleki, S. Zienali, J. Colloid Interface Sci. 2008, 332,
274-280.
[3.21] Wang, J. Pei, Y. Zhao, Y. Hu, Z., Green Chem. 2005, 7, 196-202.
[3.22] L.I.N. Tomé, M. Domínguez-Pérez, A.F.M. Cláudio, M.G. Freire, I.M. Marrucho,
O. Cabeza, J.A.P. Coutinho, J. Phys. Chem. B, 2009, 113, 13971-13979.
[3.23] S. Dai, Y.H. Ju, C.E. Barnes, J. Chem. Soc., Dalton Trans. 1999, 1201-1202.
[3.24] A.E. Visser, R.P. Swatloski, W.M. Reichert, S.T. Griffin, R.D. Rogers, Ind. Eng.
Chem. Res. 2000, 39, 3596-3604.
[3.25] J. Huang, A. Riisager, P. Wasserscheid, R. Fehrmann, Chem. Commun. 2006, 38,
4027-4029.
[3.26] H. Luo, S. Dai, P. Bonnesen, Anal. Chem. 2004, 76, 2773-2779.
[3.27] K. Binnemans, Chem. Rev. 2007, 107, 2592-2614.
[3.28] C.A. Hawkins, S.L. Garvey, M.L. Dietz, Sep. Purif. Technol. 2012, 89, 31-38.
[3.29] P. Bonhote, A.P. Dias, N. Papageorgiou, K. Kalyanasundaram, M. Grätzel, Inorg.
Chem. 1996, 35, 1168-1178.
[3.30] M. Deetlefs, K.R. Seddon, Green Chem. 2003, 5, 181-186.
[3.31] Dietz, M.L. Bond, A.H. Clapper, M. Clapper, J.W. Finch, Radiochim. Acta, 1999,
85, 119-129.
[3.32] R.M. Izatt, J.S. Bradshaw, S.A. Nielsen, J.D. Lamb, J.J. Christensen, D. Sen,
Chem. Rev. 1985, 85, 271-339.

83
[3.33] E.P. Horwitz, M.L. Dietz, and D.E. Fisher, Solvent Extr. Ion Exch. 1990, 8, 199-
208.
[3.34] E.P. Horwitz, M.L. Dietz, and D.E. Fisher, Anal. Chem. 1991, 63, 522-525.
[3.35] E.P. Horwitz, R. Chiarizia, M.L. Dietz, Solvent Extr. Ion Exch. 1992, 10, 313–336.
[3.36] E.P. Horwitz, M.L. Dietz, D.E. Fisher, Solvent Extr. Ion Exch. 1991, 9, 1-25.
[3.37] M.L. Dietz, E.P. Horwitz, R.D. Rogers, Solvent Extr. Ion Exch. 1995, 13, 1-17.
[3.38] R.G. Pearson, J. Am. Chem. Soc. 1963, 85, 3533-3539.

84
CHAPTER 4:
THE ROLE OF IONIC LIQUID PHASE WATER CONTENT
4.1 Introduction
In the interest of providing a clear description of the current understanding of metal
ion extraction into ILs it is worth summarizing the main points found in Chapter 3, where
our fundamental knowledge of the extraction of metal ions into conventional solvents has
been applied to interpret their extraction behavior into ILs. Put simply, the similarities
between these types of solvents quickly disappear when a wide range of conditions are
evaluated. Metal ion extraction into the conventional (i.e., molecular) solvents (e.g.,
paraffinic and chlorinated hydrocarbons) traditionally employed in liquid-liquid
extraction (LLE) generally involves the complexation of the metal ion by a ligand (i.e.,
extractant) to produce a hydrophobic (and thus, extractable) species [4.1]. Of the many
extractants available, neutral extractants are the most widely employed, in large part
because the extent of metal ion partitioning can be adjusted simply by changing the
aqueous phase anion (e.g., nitrate) concentration. In such systems, electroneutrality
requires that the cationic metal-extractant complex initially formed be accompanied by an
aqueous phase anion (or anions) upon extraction, thus producing a neutral (and therefore
extractable) species. Such a process is depicted in Eqn. 4-1 for the extraction of an alkali
or alkaline earth cation from a nitrate-containing aqueous phase by a crown ether (here,
dicyclohexano-18-crown-6, henceforth abbreviated as DCH18C6):
Mn+
+ n NO3- + DCH18C6org ⇋ M(NO3)n DCH18C6org (4-1)

85
Prior work with these systems has shown that when oxygenated, aliphatic solvents (e.g.,
n-alcohols) are employed, the magnitude of the metal ion distribution ratio (a measure of
the extent to which a given metal ion is extracted, defined as [M]org/[M]aq at equilibrium)
under a given set of conditions is related to the organic phase water content, with metal
extraction efficiency increasing as the hydrophilicity (and thus, the water content) of the
organic diluent rises [4.2, 4.3].
In contrast to the straightforward nature of extraction into conventional solvents (e.g.,
n-alcohols), alkali and alkaline earth cation extraction by DCH18C6 into ionic liquids has
been found to be far more complex [4.4-4.9], with as many as three distinct pathways for
partitioning possible: extraction of a ion paired (neutral) complex (Eqn. 4-1); exchange of
the cationic metal complex for the IL cation (Eqn. 4-2); and a third process in which the
metal ion is exchanged for the proton (i.e., hydronium ion) extracted by the crown ether
during preconditioning of the system, as depicted in Eqn. 4-3 [4.4-4.8].
M DCH18C6n+
+ x IL+
IL ⇋ M DCH18C6n+
IL + n IL+ (4-2)
Mn+
+ n H3O•DCH18C6 +
IL ⇋ n H3O+ + M•DCH18C6
n+IL + (n-1) DCH18C6IL (4-3)
Work in this and other laboratories concerning the factors governing the balance
among these various pathways suggests that numerous factors can play a role in
determining the predominant mode of extraction, among them the hydrophobicity of the
IL cation [4.6] and anion [4.10], the nature of the metal ion (in particular, its charge
density [4.9, 4.11]), and the aqueous phase anion [4.9]. Most often, the interaction of

86
these factors is such as to favor one or both of the ion exchange processes, rather than
neutral complex extraction [4.4, 4.6, 4.7, 4.9, 4.11]. Given that ion exchange inevitably
results in loss of the IL to the aqueous phase [4.4, 4.7], this is a problematic observation
from the perspective of the development of practical IL-based extraction processes.
Clearly, an ideal extraction system would combine the highly efficient metal ion
partitioning often observed for some ILs [4.12] with the uncomplicated behavior (i.e.,
neutral complex partitioning as the sole mode of extraction) of a conventional organic
solvent. Yet, the vast diversity of available IL structures complicates the selection of IL
solvents without an understanding of their correlated physicochemical properties. To this
end, we have examined the effect of incorporating a primary alcohol group into the long
chain of the imidazolium ion for a series of 1-alkyl-3-methylimidazolium and 1-alkyl-3-
butylimidazolium bis[(trifluoromethyl)sulfonyl]imides on the extraction of alkali and
alkaline earth cations by DCH18C6. It was anticipated that such structural modification,
by raising the water content of the solvent (versus that of the corresponding IL lacking a
hydroxyl group), would favor extraction of a neutral complex, in analogy to aliphatic
alcohols. Although ILs incorporating hydroxyl groups have been described previously
[4.13-4.15], this work, which explores the mutual solubility of the ILs and water [4.16],
and the follow-up studies described here represent the first systematic effort to evaluate
them as solvents for metal ion extraction.
4.2 Experimental
4.2.1 Materials
All chemicals were reagent grade and used without additional purification, unless
noted otherwise. All aqueous solutions were prepared using deionized water with a

87
specific resistance of at least 18 MΩ·cm-1
. Dicyclohexano-18-crown-6 ether (DCH18C6)
was purchased from Parish Chemical (Orem, UT) as a mixture of the cis-syn-cis and cis-
anti-cis isomers. Strontium-85 and sodium-22 radiotracers were purchased as nominal
solutions from Eckert and Ziegler Isotope Products, Inc. (Valencia, CA).
Imidazolium-based ionic liquids including the 3-methyl, 3-ethyl, and 3-butyl
substituents were synthesized by the two-step process shown in Scheme 4.1. The 1-alkyl-
3-methylimidazolium based ILs have been prepared previously by similar methods
[4.17]. In the first step, a halogenated alkane or alcohol (in 3% molar excess) and an N-
alkylimidazole were combined neat, and the mixture subjected to microwave irradiation
(using a CEM Discover BenchMate Model 908005), yielding an 1,3-dialkylimidazolium
halide. The product was washed with ethyl acetate (unless noted otherwise) four times to
remove unreacted starting materials. Halide salts that were solid were either heated
slightly until melted or dissolved in a small amount of deionized water to facilitate
contact with the ethyl acetate. Excess solvent was removed under reduced pressure by
rotary evaporation in a water bath held at 60°C. In the second step, the water-miscible
salts were dissolved in deionized water and combined with an aqueous solution
containing a 3 mol% excess of lithium bis[(trifluoromethyl)sulfonyl]imide (LiTf2N).
Although in each case, the IL phase formed readily following the addition of the aqueous
LiTf2N solution, samples were allowed to stir overnight to ensure completion of the
reaction. The IL (lower) layer was then allowed to settle, separated from the aqueous
phase, and washed with deionized water until a test of the water washes for the presence
of halide ion (by precipitation with silver nitrate) was negative. The final products, which
were nearly colorless to yellow free-flowing liquids, were dried under vacuum at 80°C

88
for at least 24 hours. It is worth noting that the impurities imparting visible color to the
ILs are compounds with high molar extinction coefficients, and these compounds are
estimated to be present in concentrations less than 1 μM [4.18, 4.19]. They are thus
unlikely to affect partitioning experiments. The ionic liquids used in these experiments
(all Tf2N salts) were tested for residual halides by contacting them three times with equal
volumes of water and analyzing the combined aqueous fractions by ion chromatography.
In all cases, analysis indicated that the IL contained less than 10 ppm bromide or
chloride. Where appropriate (i.e., for ILs not previously reported) elemental (CHN)
analysis of the ionic liquids was performed by the combustion method (Galbraith
Laboratories, Knoxville, TN). Other elements (e.g., oxygen) were determined from the
theoretical mass balance.
Figure 4.1: Synthesis of Imidazolium-based RTILs.

89
Because of the absence of commercially available 1-hexylimidazole or 1-
octylimidazole precursors, ionic liquids incorporating the 3-hexyl or 3-octyl substituents
were synthesized in a five step process starting with the three steps shown in in Scheme
4.2 and finishing with the two steps in Scheme 4.1. The procedure to synthesize the 1-
alkylimidazoles were adapted from reference [4.20]. In the first step, protection of one
imidazole amine was performed in a methanol solution by adding excess acrylonitrile and
heating to 60°C while stirring under an atmosphere of nitrogen gas for at least 12 hours.
The 1-(2-cyanoethyl)imidazole product was obtained by vacuum-assisted rotary
evaporation in a water bath held at 80°C. Significant amounts (ca. 3-5%) of a 3-
methoxypropanenitrile side-product were also recovered due to Michael addition of the
solvent to acrylonitrile. This molecular impurity was removed from the ionic liquid by
solvent washes. Proton NMR spectra also revealed that 3-5% unprotected imidazole was
also recovered, because the side-reaction eliminated the active excess of acrylonitrile.
Thus, the reaction was started again with the addition of a smaller amount of
acrylonitrile. After recovery of this product by rotary evaporative, the 1H-NMR spectrum
was free of imidazole signals, suggesting that the reaction was complete. In the second
step, either 1-bromohexane or 1-bromooctane was combined with the crude product from
the first step and the mixture dissolved in acetonitrile because the two reactants are
immiscible. The solution was subjected to microwave irradiation (using a CEM Discover
BenchMate Model 908005), yielding an 3-alkyl-1-(2-cyanoethyl)limidazolium bromide.
After rotary evaporation of the solvent at 80°C, the product was washed with ethyl
acetate four times to remove unreacted starting materials. Excess solvent was removed by
vacuum-assisted rotary evaporation in a water bath held at 60°C. The third step

90
comprised the deprotection of the amine in a biphasic reaction between 15% (w/w)
aqueous sodium hydroxide and the second product dissolved in dichloromethane by
vigorously stirring overnight. The resulting organic phase was removed and washed with
water to remove excess salt and sodium hydroxide. The solvent was then removed by
rotary evaporation in a water bath held at 40°C, Finally, other volatiles were removed in
the same manner with the water bath held at 80°C.
Figure 4.2: Synthesis of Hexylimidazole and Octylimidazole.
N-Alkylimidazole Synthesis
1-(2-cyanoethyl)imidazole (1)
Dissolve 1H-imidazole (35.6 g, 0.52 mol) in 80 mL methanol. Add (36.2 mL, 29.3 g,
0.55 mol) acrylonitrile and dissolv while bubbling nitrogen gas into the solution. Stir at
60°C under flowing nitrogen for at least 12 hours. Evaporate solvent and excess volatiles.
Add 50 mL of methanol and an additional 2 mL of acrylonitrile and continued the
reaction for at least 8 hours. Evaporate solvent and volatiles to obtain a crude product free
of imidazole, but replete with 3-methoxypropanenitrile, a by-product of methanol and

91
acrylonitrile. 1
H-NMR in CDCl3: δ, 7.58 (s, 1H), 7.11 (s, 1H), 7.03 (s, 1H), 4.27 (t, 2H),
3.60 (t, 2H, by-product), 3.40 (s, 3H, by-product), 2.82 (t, 2H), 2.60 (t, 2H, by-product).
1-(2-cyanoethyl)-3-hexyl-imidazole (2)
From compound 1 (1.89 g, 0.015 mol nominally), and 1-bromohexane (2.70 g, 0.016
mol) (in 2.5 mL acetonitrile, microwave: power = 200 W, 120°C, t = 20 min), 4.31 g
(0.019 mol) of 3-hexyl-1-(2-cyanoethyl)imidazole (97% recovery). 1H-NMR in CDCl3: δ,
10.23 (s, 1H), 8.16 (s, 1H), 7.45 (s, 1 H), 4.90 (t, 2H), 4.26 (t, 2H), 3.37 (t, 2H), 1.88 (m,
2H), 1.29 (m, 6H), 0.90 (t, 3H).
(2-cyanoethyl)-3-octyl-1-imidazole (3)
From compound 1 (1.58 g, 0.013 mol nominally), and 1-bromooctane (2.64 g, 0.014 mol)
(in 2.5 mL acetonitrile, microwave: power = 200 W, 120°C, t = 20 min), 3.90 g (0.012
mol) of 3-octyl-1-(2-cyanoethyl)imidazole (91% recovery). 1H-NMR in CDCl3: δ, 10.17
(s, 1H), 8.11 (s, 1H), 7.44 (s, 1 H), 4.91 (t, 2H), 4.32 (t, 2H), 3.39 (t, 2H), 1.91 (m, 2H),
1.24 (m, 10H), 0.86 (t, 3H).
1-hexylimidazole (4)
Dissolve compound 2 (62.1 g, 0.22 mol) in 130 mL dichloromethane. Add 125 mL 15%
(w/w) sodium hydroxide and stir vigorously overnight. Separate the organic phase and
wash it repeatedly with water until a silver nitrate test reveals no residual bromide.
Remove the solvent by vacuum-assisted rotary evaporation at 40°C, then any residual
volatiles at 80°C. A light yellow more less viscous liquid of 1-hexylimidazole was

92
recovered (31.1 g, 0.20 mol, 94% recovery). 1H-NMR in CDCl3: δ, 7.47 (s1, H), 7.28 (s,
1H), 6.89 (s, 1 H), 3.91 (t, 2H), 1.75 (qt, 2H), 1.26 (m, 6H), 0.86 (t, 3H).
1-octylimidazole (5)
Dissolve compound 3 (73.8 g, 0.26 mol) in 130 mL dichloromethane. Add 135 mL 15%
(w/w) sodium hydroxide and stir vigorously overnight. Separate the organic phase and
wash it repeatedly with water until a silver nitrate test reveals no residual bromide.
Remove the solvent by vacuum-assisted rotary evaporation at 40°C, then any residual
volatiles at 80°C. A yellow, less viscous liquid of 1-hexylimidazole was recovered (38.3
g, 0.35 mol, 95% recovery). 1H-NMR in CDCl3: δ, 7.60 (s1, H), 7.14 (s, 1H), 6.87 (s, 1
H), 3.93 (t, 2H), 1.67 (qt, 2H), 1.23 (m, 10H), 0.85 (t, 3H).
1,3-Dialkylimidazolium IL Synthesis (compounds not described in Chapter 3)
1-octyl-3-butylimidazolium bromide (6)
From N-butylimidazole (2.37 g, 0.019 mol), and 1-bromooctane (3.87 g, 0.020 mol)
(neat, microwave: power = 240 W, 110°C, t = 8 min), 6.00 g (0.019 mol) of C8C4imBr
was obtained as a yellow liquid (yield of 99%). 1H-NMR (DMSO): δ, 9.32 (s, 1H), 7.84
(d, 2H), 4.19 (dt, 4H), 1.80 (m, 4H), 1.24 (m, 12H), 0.90 (m, 6H).
1-decyl-3-ethylimidazolium bromide (7)
From N-ethylimidazole (1.83 g, 0.019 mol), and 1-bromodecane (4.49 g, 0.020 mol)
(neat, microwave: power = 240 W, 90°C, t = 10 min), 5.76 g (0.018 mol) of C10C2imBr

93
was obtained as a yellow liquid (yield of 94%). 1H-NMR (DMSO): δ, 9.34 (s, 1H), 7.85
(d, 2H), 4.19 (t and q, 4H), 1.80 (m, 4H), 1.42 (t, 3H), 1.24 (m, 14H), 0.86 (m, 3H).
1-decyl-3-butylimidazolium bromide (8)
From N-butylimidazole (2.37 g, 0.019 mol), and 1-bromodecane (4.49 g, 0.020 mol)
(neat, microwave: power = 240 W, 90°C, t = 10 min), 6.60 g (0.019 mol) of C10C4imBr
was obtained as a yellow liquid (yield of 99%). 1H-NMR (DMSO): δ, 9.34 (s, 1H), 7.85
(d, 2H), 4.18 (dt, 4H), 1.80 (m, 4H), 1.24 (m, 16H), 0.90 (m, 6H).
1-decyl-3-hexylimidazolium bromide (9)
From compound 3 (2.33 g, 0.015 mol), and 1-bromodecane (3.55 g, 0.016 mol) (neat,
microwave: power = 240 W, 100°C, t = 15 min), 5.33 g (0.014 mol) of C10C6imBr was
obtained as a pale yellow liquid (yield of 94%). 1H-NMR (CDCl3): δ, 10.63 (s, 1H), 7.38
(d, 2H), 4.37 (t, 4H), 1.91 (m, 4H), 1.29 (m, 20H), 0.88 (t, 6H).
1-decyl-3-octylimidazolium bromide (10)
From compound 4 (2.50 g, 0.014 mol), and 1-bromodecane (3.25 g, 0.015 mol) (neat,
microwave: power = 240 W, 100°C, t = 15 min), washes were performed using n-hexane
5.06 g (0.013 mol) of C10C8imBr was obtained as a yellow liquid (yield of 91%). in
(CDCl3): δ, 10.46 (s, 1H), 7.41 (d, 2H), 4.36 (t, 4H), 1.89 (m, 4H), 1.28 (m, 24H), 0.86 (t,
6H).

94
1-octyl-3-butylimidazolium bis[(trifluoromethyl)sulfonyl]imide (11)
From compound 6 (5.99 g, 0.019 mol), and 6.04 g (0.021 mol) LiTf2N (both predissolved
in D.I. water), 9.44 g (0.018 mol) of C8C4imTf2N was obtained as a colorless liquid (yield
of 95%).1H-NMR (DMSO): δ, 9.19 (s, 1H), 7.80 (s, 2H), 4.16 (q, 4H), 1.80 (m, 4H), 1.25
(m, 12H), 0.90 (m, 6H).
1-decyl-3-ethylimidazolium bis[(trifluoromethyl)sulfonyl]imide (12)
From compound 7 (6.41 g, 0.020 mol), and 6.38 g (0.022 mol) LiTf2N (both predissolved
in D.I. water), 10.25 g (0.020 mol) of C10C2imTf2N was obtained as a colorless liquid
(yield of 98%).1H-NMR (DMSO): δ, 9.93 (s, 1H), 7.84 (d, 2H), 4.20 (t and d, 4H), 1.79
(m, 2H), 1.42 (t, 3H), 1.24 (m, 14H), 0.89 (m, 3H).
1-decyl-3-butylimidazolium bis[(trifluoromethyl)sulfonyl]imide (13)
From compound 8 (7.01 g, 0.020 mol), and 6.11 g (0.021 mol) LiTf2N (both predissolved
in D.I. water), 10.85 g (0.020 mol) of C10C4imTf2N was obtained as a colorless liquid
(yield of 98%).1H-NMR (DMSO): δ, 9.19 (s, 1H), 7.80 (s, 2H), 4.16 (dt, 4H), 1.78 (m,
4H), 1.30 (m, 16H), 0.89 (m, 6H).
1-decyl-3-hexylimidazolium bis[(trifluoromethyl)sulfonyl]imide (14)
From compound 9 (7.21 g, 0.019 mol), and 6.09 g (0.021 mol) LiTf2N (both predissolved
in D.I. water), 9.98 g (0.017 mol) of C10C6imTf2N was obtained as a yellow liquid (yield
of 90%).1H-NMR (CDCl3): δ, 8.83 (s, 1H), 7.34 (s, 2H), 4.20 (q, 4H), 1.88 (m, 4H), 1.30
(m, 20H), 0.89 (m, 6H).

95
1-decyl-3-octylimidazolium bis[(trifluoromethyl)sulfonyl]imide (15)
From compound 10 (7.63 g, 0.019 mol), and 6.09 g (0.021 mol) LiTf2N (both
predissolved in D.I. water), 10.4 g (0.017 mol) of C10C8imTf2N was obtained as a yellow
liquid (yield of 91%).1H-NMR (CDCl3): δ, 8.81 (s, 1H), 7.36 (s, 2H), 4.19 (t, 4H), 1.87
(m, 4H), 1.26 (m, 24H), 0.88 (m, 6H).
1-(Hydroxyalkyl)-3-alkylimidazolium IL Synthesis
1-(5-hydroxypentyl)-3-methylimidazolium bromide (16)
From N-methylimidazole (2.37 g, 0.029 mol), and 5-bromo-1-pentanol (4.69 g, 0.028
mol) (neat, microwave: power = 250 W, 70°C, t = 20 min), 6.58 g (0.026 mol) of
C5OHC1imBr was obtained as a pale yellow solid (yield of 94%). 1H-NMR: δ, 9.20 (s,
1H), 7.80 (d, 1H), 7.73 (s, 1H), 4.41 (broad peak, 1H), 4.16 (t, 2H), 3.85 (s, 3H), 3.31 (t,
2H), 1.79 (m, 2H), 1.44 (m, 2H), 1.25 (m, 2H).
1-(8-hydroxyoctyl)-3-methylimidazolium bromide (17)
From N-methylimidazole (1.86 g, 0.023 mol), and 8-bromo-1-octanol (4.61 g, 0.022 mol)
(neat, microwave: power = 250 W, 60°C, t = 30 min), 5.86 g (0.020 mol) of
C8OHC1imBr was obtained as a slightly yellow solid (yield of 91%). 1H-NMR: δ, 9.15 (s,
1H), 7.90 (s, 1H), 7.72 (s, 1H), 4.34 (broad peak, 1H), 4.16 (t, 2H), 3.85 (s, 3H), 3.35 (m,
2H, obscured by water peak), 1.78 (m, 2H), 1.40 (m, 2H), 1.26 (m, 8H).

96
1-(10-hydroxydecyl)-3-methylimidazolium bromide (18)
From N-methylimidazole (2.03 g, 0.025 mol), and 10-bromo-1-decanol heated to melt
(5.75 g, 0.024 mol) (neat, microwave: power = 250 W, 60°C, t = 30 min), 7.36 g (0.023
mol) of C10OHC1imBr was obtained as a colorless solid (yield of 96%). 1H-NMR
(DMSO): δ, 9.18 (s, 1H), 7.79 (s, 1H), 7.73 (s, 1H), 4.34 (broad peak, 1H), 4.16 (t, 2H),
3.85 (s, 3H), 3.37 (m, 2H, obscured by water peak ), 1.78 (m, 2H), 1.40 (m, 2H), 1.26 (m,
12H).
1-(8-hydroxyoctyl)-3-butylimidazolium bromide (19)
From N-butylimidazole (2.43 g, 0.020 mol), and 8-bromo-1-octanol (3.89 g, 0.019 mol)
(neat, microwave: power = 250 W, 70°C, t = 30 min) 6.03 g (0.018mol) of C8OHC4imBr
was obtained as a slightly yellow liquid (yield of 97%). 1H-NMR (DMSO): δ, 9.17 (s,
1H), 7.82 (s, 2H), 4.34 (broad peak, 1H), 4.17 (dt, 4H), 3.85 (s, 3H), 3.33 (m, 2H,
obscured by water peak ), 1.80 (m, 4H), 1.42 (m, 2H), 1.30 (m, 10H), 0.90 (t, 3H).
1-(10-hydroxydecyl)-3-butylimidazolium bromide (20)
From N-butylimidazole (1.75 g, 0.014 mol), and 10-bromo-1-decanol heated to melt
(3.25 g, 0.014 mol) (neat, microwave: power = 250 W, 70°C, t = 30 min), 4.65 g (0.013
mol) of C10OHC4imBr was obtained as slightly yellow liquid (yield of 94%). 1H-NMR
(DMSO): δ, 9.31 (s, 1H), 7.84 (s, 2H), 4.33 (broad peak, 1H), 4.19 (dt, 4H), 3.85 (s, 3H),
3.33 (m, 2H, obscured by water peak ), 1.80 (m, 4H), 1.42 (m, 2H), 1.30 (m, 10H), 0.90
(t, 3H).

97
1-(12-hydroxydodecyl)-3-methylimidazolium bromide (21)
From N-methylimidazole (1.94 g, 0.024 mol), and 12-bromo-1-dodecanol heated to melt
(5.98 g, 0.023 mol) (neat at 60°C to melt the bromoalcohol and mix), microwave: power
= 250 W, 60°C, t = 30 min), 7.58 g (0.022 mol) of C12OHC1imBr was obtained as a
slightly colored solid (yield of 97%). 1H-NMR (DMSO): δ, 9.16 (s, 1H), 7.79 (s, 1H),
7.72 (s, 1H), 4.33 (broad peak, 1H), 4.16 (t, 2H), 3.85 (s, 3H), 3.36 (m, 2H, obscured by
water peak ), 1.78 (m, 2H), 1.40 (m, 2H), 1.26 (m, 16H).
1-(12-hydroxydodecyl)-3-ethylimidazolium bromide (22)
From N-ethylimidazole (1.04 g, 0.011 mol), and 12-bromo-1-dodecanol heated to melt
(2.95 g, 0.011 mol) (neat, microwave: power = 250 W, 70°C, t = 30 min), 3.70 g (0.010
mol) of C12OHC2imBr was obtained as slightly yellow liquid (yield of 94%). 1H-NMR
(CDCl3): δ, 10.63 (s, 1H), 7.36 (s, 1H), 7.30 (s, 1H), (4.48 (q, 2H), 4.33 (t, 2H), 3.365 (t,
2H), 1.94 (m, 2H), 1.63 (t, 3H), 1.58 (m, 2H), 1.30 (m, 17H).
1-(12-hydroxydodecyl)-3-butylimidazolium bromide (23)
From N-butylimidazole (1.38 g, 0.011 mol), and 12-bromo-1-dodecanol heated to melt
(3.04 g, 0.011 mol) (neat, microwave: power = 250 W, 70°C, t = 30 min), 4.36 g (0.011
mol) of C12OHC4imBr was obtained as slightly yellow liquid (yield of 98%). 1H-NMR
(DMSO): δ, 9.25 (s, 1H), 7.82 (d, 2H), 4.33 (t, 1H), 4.18 (dt, 4H), 3.38 (m, 2H, obscured
by water signal), 1.78 (m, 4H), 1.40 (m, 2H), 1.21 (m, 18H), 0.90 (t, 3H).

98
1-(12-hydroxydodecyl)-3-octylimidazolium bromide (24)
From compound 5 (1.93 g, 0.011 mol), and 12-bromo-1-dodecanol heated to melt (2.93
g, 0.011 mol) (neat, microwave: power = 240 W, 120°C, t = 30 min), 4.20 g (0.0094 mol)
of C12OHC8imBr was obtained as yellow liquid (yield of 85%). 1H-NMR (CDCl3): δ,
10.72 (s, 1H), 7.25 (d, 2H), 4.38 (t, 4H), 3.66 (t, 2H), 1.89 (m, 2H), 1.58 (m, 2H), 1.36
(m, 14H), 1.28 (m, 14H), 0.91 (t, 3H).
1-(5-hydroxypentyl)-3-methylimidazolium bis[(trifluoromethyl)sulfonyl]imide (25)
From compound 16 (6.51 g, 0.026 mol), and 7.42 g (0.026 mol) LiTf2N (both
predissolved in D.I. water), 11.0 g (0.024 mol) of C5OHmimTf2N was obtained as a
colorless liquid (yield of 95%). 1H-NMR (DMSO): δ, 9.10 (s, 1H), 7.75 (s, 1H), 7.70 (s,
1H), 4.37 (broad peak, 1H), 4.16 (t, 2H), 3.85 (s, 3H), 3.39 (m, 2H, obscured by water
peak), 1.79 (m, 2H), 1.45 (m, 2H), 1.29 (m, 2H).
1-(8-hydroxyoctyl)-3-methylimidazolium bis[(trifluoromethyl)sulfonyl]imide (26)
From compound 17 (5.81 g, 0.020 mol), and 5.74 g (0.020 mol) LiTf2N (both
predissolved in D.I. water), 9.28 g (.019 mol) of C8OHmimTf2N was obtained as a
colorless liquid (yield of 95%). 1H-NMR (DMSO): δ, 9.10 (s, 1H), 7.77 (s, 1H), 7.70 (s,
1H), 4.334 (t, 1H), 4.16 (t, 2H), 3.85 (s, 3H), 3.38 (m, 2H, obscured by water peak ), 1.78
(m, 2H), 1.40 (m, 2H), 1.27 (m, 8H). Elemental analysis data: Theoretical: %C = 34.21,
%H = 4.72, %N = 8.55; Empirical: %C = 34.07, %H = 4.61, %N = 8.58.

99
1-(10-hydroxydecyl)-3-methylimidazolium bis[(trifluoromethyl)sulfonyl]imide (27)
From compound 18 (7.72 g, 0.024 mol), and 6.96 g (0.025 mol) LiTf2N (both
predissolved in D.I. water), 12.02 g (0.023 mol) of C10OHmimTf2N was obtained as a
colorless liquid (yield of 96%). 1H-NMR (DMSO): δ, 9.11 (s, 1H), 7.79 (s, 1H), 7.73 (s,
1H), 4.34 (t, 1H), 4.16 (t, 2H), 3.85 (s, 3H), 3.40 (m, 2H, obscured by water peak ), 1.80
(m, 2H), 1.40 (m, 2H), 1.24 (m, 12H). Elemental analysis data: Theoretical: %C = 36.99,
%H = 5.24, %N = 8.09; Empirical: %C = 36.94, %H = 5.05, %N = 8.00.
1-(8-hydroxyoctyl)-3-butylimidazolium bis[(trifluoromethyl)sulfonyl]imide (28)
From compound 19 (7.67 g, 0.023 mol), and 6.64 g (0.024 mol) LiTf2N (both
predissolved in D.I. water), 11.65 g (0.023 mol) of C8OHbimTf2N was obtained as a
colorless liquid (yield of 95%). 1H-NMR (DMSO): δ, 9.10 (s, 1H), 7.80 (s, 2H), 4.33 (t,
1H), 4.16 (dt, 4H), 3.35 (m, 2H, obscured by water peak ), 1.78 (m, 4H), 1.40 (m, 2H),
1.26 (m, 10H), 0.91 (t, 3H). Theoretical: %C = 38.27%, %H = 5.48, %N = 7.88;
Empirical: %C = 37.47, %H = 5.46, %N = 7.61.
1-(10-hydroxydecyl)-3-octyllimidazolium bis[(trifluoromethyl)sulfonyl]imide (29)
From compound 20 (9.62 g, 0.025 mol), and 7.31 g (0.026 mol) LiTf2N (both
predissolved in D.I. water), 13.38 g (0.024 mol) of C10OHbimTf2N was obtained as a
colorless liquid (yield of 94%). 1H-NMR (DMSO): δ, 9.19 (s, 1H), 7.79 (s, 2H), 4.31 (t,
1H), 4.16 (dt, 4H), 3.39 (m, 2H, obscured by water peak ), 1.79 (m, 4H), 1.40 (m, 2H),
1.25 (m, 13H) 0.93 (t, 3H). Theoretical: %C = 40.63, %H = 5.92, %N = 7.48; Empirical:
%C = 39.32, %H = 5.86, %N = 6.98.

100
1-(12-hydroxydodecyl)-3-methylimidazolium bis[(trifluoromethyl)sulfonyl]imide
(30)
From compound 21 (7.50 g, 0.022 mol), and 6.21 g (0.022 mol) LiTf2N (both
predissolved in D.I. water), 11.44 g (.021 mol) of C12OHC1imTf2N was obtained as a
slightly colored liquid (yield of 97%). 1H-NMR (DMSO): δ, 9.10 (s, 1H), 7.80 (s, 1H),
7.69 (s, 1H), 4.32 (t, 1H), 4.15 (t, 2H, J = ), 3.85 (s, 3H), 3.41 (m, 2H, obscured by water
peak ), 1.80 (m, 2H), 1.40 (m, 2H), 1.25 (m, 21H). Theoretical: %C = 39.48, %H = 5.71,
%N = 7.68; Empirical: %C = 38.19, %H = 5.64, %N = 7.29.
1-(12-hydroxydodecyl)-3-ethylimidazolium bis[(trifluoromethyl)sulfonyl]imide (31)
From compound 22 (3.70 g, 0.010 mol, suspended in water), and 3.28 g (0.011 mol)
LiTf2N (dissolved in D.I. water), 5.62 g (0.010 mol) of C12OHC2imTf2N was obtained as
a colorless liquid (yield of 98%). 1H-NMR (CDCl3): δ, 8.86 (s, 1H), 7.35 (d, 2H), 4.30 (q,
2H), 4.17 (t, 4H), 3.65 (t, 2H), 1.89 (m, 2H), 1.58 (t, 3H), 1.30 (m, 19H).
1-(12-hydroxydodecyl)-3-butylimidazolium bis[(trifluoromethyl)sulfonyl]imide (32)
From compound 23 (13.17 g, 0.034 mol), and 10.65 g (0.037 mol) LiTf2N (both
predissolved in D.I. water), 18.93 g (0.032 mol) of C12OHC4imTf2N was obtained as a
colorless liquid (yield of 95%). 1H-NMR (DMSO): δ, 9.18 (s, 1H), 7.80 (d, 2H), 4.31 (t,
1H), 4.17 (dt, 4H), 3.38 (q, 2H, unresolved from water signal), 1.78 (m, 4H), 1.40 (m,
2H), 1.21 (m, 18H), 0.91 (t, 3H).

101
1-(12-hydroxydodecyl)-3-ethylimidazolium bis[(trifluoromethyl)sulfonyl]imide (33)
From compound 24 (4.17 g, 0.0094 mol, suspended in water), and 2.96 g (0.010 mol)
LiTf2N (predissolved in water), 4.96 g (0.077 mol) of C12OHC4imTf2N was obtained as a
colorless liquid (yield of 81%). 1H-NMR: δ, 9.18 (s, 1H), 7.80 (d, 2H), 4.31 (t, 1H), 4.17
(dt, 4H), 3.38 (q, 2H, unresolved from water signal), 1.78 (m, 4H), 1.40 (m, 2H), 1.21 (m,
18H), 0.91 (t, 3H).
The names and structures of all of the ionic liquid cations prepared, along with the
shorthand notation employed to represent them, are summarized in Table 4.1.
Table 4.1
Structures and Nomenclature of the Ionic Liquid Cations Studied
IL Cation Name IL Cation Shorthand IL Cation Structure
1-pentyl-3-methylimidazolium C5C1im
1-hexyl-3-methylimidazolium C6C1im
1-octyl-3-methylimidazolium C8C1im
1-decyl-3-methylimidazolium C10C1im
1-decyl-3-ethylimidazolium C10C2im
1-decyl-3-butylimidazolium C10C4im
1-decyl-3-hexylimidazolium C10C6im
102
Table 4.1 Continued
1-decyl-3-octylimidazolium C10C8im
1-(5-hydroxypentyl)-3-methylimidazolium C5OHC1im
1-(8-hydroxyoctyl)-3-methylimidazolium C8OHC1im
1-(8-hydroxyoctyl)-3-butyl-imidazolium C8OHC4im
1-(10-hydroxydecyl)-3-methylimidazolium C10OHC1im
1-(10-hydroxydecyl)-3-butyl-imidazolium C10OHC4im
103

Table 4.1 Continued
1-(12-hydroxydodecyl)-3-methylimidazolium C12OHC1im
1-(12-hydroxydodecyl)-3-ethyl-imidazolium C12OHC2im
1-(12-hydroxydodecyl)-3-butyl-imidazolium C12OHC4im
1-(12-hydroxydodecyl)-3-octyl-imidazolium C12OHC8im
104

105
4.2.2 Instruments
Gamma spectroscopy was performed using a PerkinElmer model 2480 automatic
gamma counter equipped with WIZARD2 software. NMR spectra were acquired on a
Bruker DPX300 NMR spectrometer operating at 300.13 MHz for proton and 75.47 MHz
for carbon-13, and equipped with a z-gradient broadband (BBO) probe. Unless otherwise
noted, spectra were obtained using solutions of dimethylsulfoxide-d6 or chloroform-d3
(Aldrich, 99.96 atom% D), and all chemical shifts were reported relative to
tetramethylsilane. Thermogravimetric analysis (TGA) was performed using a TA
Instruments Q50 TGA in a nitrogen atmosphere at a scan rate of 10°C/min with sample
sizes of approximately 5 mg. Differential scanning calorimetry data were obtained with a
TA Instruments Q20 DSC. The DSC scanning sequence involved freezing the sample to
-90°C, then ramping to 200°C, followed by cooling to -90°C, and finally ramping to
40°C, all at a rate of 5°C min-1
. The water content of the ILs was measured using a
Metrohm 670 KF coulometer. The water solubility of ILs was measured using a
Shimadzu UV-2450 UV-Visible Spectrophotometer with matching 10 mm path length
quartz cuvettes. Halide impurities were determined using a Dionex ICS-1000 ion
chromatograph equipped with equipped with a 25 μL fixed-loop manual injection port,
an, a conductivity detector, Dionex AS18/AG18 analytical and guard columns (4 X 250
and 4 X 50 mm), a Dionex ASRS 300 anion self-regenerating eluent suppressor (4 mm),
and 37 mM NaOH eluent. The instrument was operated using Chromeleon software
version 6.80.

106
4.2.3 Methods
Distribution ratios (DM ) were determined as the ratio of the count rate in the organic
phase to that of the aqueous phase using commercial radiotracers. Assays were carried
out via gamma spectroscopy using standard procedures. In each metal ion distribution
experiment, the organic phase consisted of DCH18C6 dissolved in the designated ionic
liquid, and the aqueous phase nitric acid concentration was systematically adjusted either
by conducting separate experiments for each condition, or adding the appropriate amount
of acid after each sampling. All organic phases were pre-equilibrated with aqueous phase
prior to the introduction of the metal radiotracer. Additionally, the sum of the count rates
in each phase yielded recoveries within 10% (most often < 10%) that of the radiotracer
stock solution used, indicating that equilibrium was established with only two phases
involved. Room temperature was maintained at 23 ± 2°C. Each equilibrated phase was
sampled for analysis in at least duplicate, with resulting uncertainties based on counting
statistics that were generally within 10%, although the uncertainty interval was
considerably wider for the highest DM values (DM ≥ 1000). The determination of the
conditional extraction constant for strontium extraction was performed as an average of
three experiments, each with four replicate analyses. Nitric acid concentrations were
determined by titration with a standard sodium hydroxide solution (Ricca Chemical
Company, Arlington, TX). The density of the ionic liquids (ILs) was determined by
weighing volumes accurately measured by calibrated micropipettes. All measurements
for “dry” ionic liquids were performed using materials that were dried in vacuo at 80°C
for at least 24 hours in small quantities (≤ 3 mL) to facilitate the loss of water vapor.
Samples used in the measurement of the mutual solubility of ionic liquids with water

107
were prepared by contacting a 1:1 ratio of the neat IL with deionized water in glass
culture tubes and vortex mixing. Following 12 hours or more of standing at 25 ± 2°C,
samples were centrifuged at 3000 rcf to ensure complete disengagement. The water
solubility of ILs was measured by UV spectrophotometry at the wavelength characteristic
of the imidazolium ring (210 nm) using standards prepared from a known weight of the
dry IL. The water content of solutions of DCH18C6 in ILs was measured after vortex
equilibration with 1.0 M nitric acid. The tubes were allowed to stand overnight in a 25°C
water bath and centrifuged for 30 minutes to completely disengage the phases.
4.3 Effect of Ionic Liquid Water Content on Strontium Extraction
4.3.1 Relationship between ionic liquid-water mutual solubilities and metal ion
extraction into CnC1imTf2N and CnOHC1imTf2N ionic liquids
Prior work in this laboratory has demonstrated that insight into the partitioning of
metal ions into ionic liquids in the presence of a neutral extractant can be obtained by a
comparison to the behavior of the ions in various conventional (i.e., molecular) solvents
[Chapter 3]. In the interest of providing a comprehensive illustration of how these earlier
results relate to the studies performed in this chapter, it is worth reviewing our
understanding, as developed on the basis of the results described in Chapter 3. With this
in mind, we first consider the extraction of monovalent and divalent cations from acidic
nitrate media into several n-alcohols in the presence of DCH18C6. The general rise in
the distribution ratios with increasing nitric acid concentration for the extraction of alkali
and alkaline earth ions into n-alcohols shows that extraction proceeds via the partitioning
of a neutral complex (Eqn. 4-1). At sufficiently high acidity, however, the extraction of
the monovalent cation declines, the apparent result of competition for the crown ether

108
between the cation and extracted nitric acid [4.21]. From a practical perspective,
reactions of the type described by Eqn. 4-1 are highly desirable as the basis for metal ion
separations, as they permit the extraction of the ion of interest from an acidic aqueous
phase (such as are encountered in waste processing applications [4.22] or result from the
leaching or dissolution of a sample for subsequent analysis [4.23]) and its facile recovery
(i.e., back-extraction) into dilute acid or water.
In contrast, results obtained in the extraction of alkali and alkaline earth ions into
CnC1imTf2N ILs, containing DCH18C6 from nitric acid solutions of increasing
concentration show quite different trends. In the case of the sodium ion, a monotonic
decrease in DM with acidity is observed, while for strontium ion, the dependency obtained
is a complex relationship in which DM may either fall or rise with acidity, depending on
the hydrophobicity of the IL cation and the precise acid concentration. In both instances,
the substantial difference between the behavior of the conventional solvents and the ionic
liquids is readily apparent. Prior work [4.4, 4.6, 4.7, 4.9] has demonstrated that the
unusual acid dependencies observed in these ILs have their origins in the multi-path
extraction process operative, in which three distinct reactions contribute to the observed
metal ion distribution. That is, in addition to the extraction of a neutral complex (as per
Eqn. 4-1), two other processes are observed, both (as noted above) involving ion
exchange (Eqn. 4-2 and 4-3).
Figure 4.1 and 4.2 depict the results obtained in analogous extraction studies
employing a series of 1-hydroxyalkyl-3-methylimidazolium ionic liquids (hereafter
designated as CnOHC1imTf2N ILs), while Table 4.2 summarizes several physicochemical
properties of these ILs, as well as those for three CnC1imTf2N ILs, relevant to their

109
behavior as extraction solvents. As can be seen from the table, for a given alkyl chain
length, incorporation of a hydroxyl group, while not appreciably affecting the IL density
and only modestly reducing the liquidus range, significantly increases the water content
of the solvent, typically by a factor of nearly four. For all of the CnOHC1im-based ILs
examined, in fact, the solvent water content is comparable to or exceeds that measured
for 1-octanol (36,000 ppm), the solvent upon which are based processes for the recovery
of Sr-90 from nuclear wastes [4.22] and commercial sorbents for its recovery from
various samples for subsequent determination [4.23]. This functionalization also
increases the water solubility of the IL rather substantially, however. In all instances, in
fact, the water solubility of the CnOHC1im IL is an order of magnitude or larger than that
of the corresponding CnC1im-based IL. Thus, while hydroxyl-functionalization does
have the desired effect on the solvent water content, it also significantly raises the
hydrophilicity of the IL, likely rendering it more prone to function as a liquid ion-
exchanger (Eqn. 4-2) [4.4, 4.6]. Of these two effects, the increase in solvent
hydrophilicity is apparently the more important, as is suggested by Figures 4.1 and 4.2.
That is, for alkali cations, a monotonic decrease in extraction is observed as the nitric
acid concentration is raised. For alkaline earth cations, nearly the same type of
dependency is observed, especially for barium. Although a slight upturn in DSr is seen at
the highest acidities, and DCa increases from 4 M to 8 M HNO3 (a trend that has been
attributed to the metal ion charge density and thus, nitrato stability constants), for all of
the metal ions considered, ion exchange, not neutral complex extraction, predominates
under the experimental conditions. Thus the increased water content associated with
hydroxyl-functionalization of the IL is apparently insufficient to outweigh the increased

110
tendency toward ion exchange resulting from the presence of a relatively hydrophilic IL
cation.
Figure 4.1: Effect of nitric acid concentration on the extraction of Na+(panel A) and
Cs+ (panel B) by DCH18C6 (0.10 M) in C5OHC1imTf2N (), C8OHC1imTf2N (),
C10OHC1imTf2N (), and C12OHC1imTf2N ().
Figure 4.2: Effect of nitric acid concentration on the extraction of Ca2+
(panel A), Sr2+
(panel B), and Ba2+
(panel C) by
DCH18C6 (0.10 M) in C5OHC1imTf2N (), C8OHC1imTf2N (), C10OHC1imTf2N (), and C12OHC1imTf2N ().
111

Table 4.2
Various Physicochemical Properties of Some Ionic Liquids Studied
IL
Density (dry),
g/mL
Density (wet),
g/mL
Water Content
(wet), ppm
Water
Solubility, ppm Tg / Tm, °C Td, °C
C5OHC1imTf2N 1.51 ± 0.02 1.41 ± 0.01 66700 ± 144 33900 ± 400 -72 383
C8OHC1imTf2N 1.27 ± 0.08 1.28 ± 0.02 48000 ± 39 12400 ± 160 -72 385
C10OHC1imTf2N 1.31 ± 0.02 1.24 ± 0.03 39800 ± 42 3700 ± 380 -71 403
C12OHC1imTf2N 1.23 ± 0.06 1.18 ± 0.05 34200 ± 110 568 ± 20 -63 / -40 413
C8OHC4imTf2N 1.28 ± 0.04 1.27 ± 0.02 34100 ± 1901 4700 ± 380 -72 ND
C10OHC4imTf2N 1.23 ± 0.02 1.21 ± 0.01 25600 ± 80 6800 ± 150 -71 ND
C12OHC4imTf2N 1.23 ± 0.03 1.18 ± 0.02 23800 ± 727 2600 ± 140 ND ND
C5mimTf2N 1.35 ± 0.04 1.36 ± 0.01 17100 ± 56 2150 ± 76 -85 / -9a 444
C8mimTf2N 1.28 ± 0.06 1.24 ± 0.03 11500 ± 65 990 ± 28 -85a 425
b
C10mimTf2N 1.29 ± 0.02 1.22 ± 0.04 10400 ± 45 310 ± 33 -83 / -29a 395
Uncertainties are based on the 95% confidence interval, where n = 5 measurements of density and n = 4 measurements of water mutual solubility
ND = not determined a Reference [4.24]
b Reference [4.25]
112

113
4.3.2 Relationship between ionic liquid-water mutual solubilities and metal ion
extraction into CnC4imTf2N and CnOHC4imTf2N ionic liquids
Although the overall trends indicate that ion-exchange pathways will dominate the
extraction of Sr2+
into CnOHC1imTf2N ILs, the relatively flat acid dependency of DSr in
C12OHC1imTf2N suggests that an improvement (i.e., a greater propensity toward neutral
complex extraction) might be realized by a combination of hydroxyl-functionalization of
one of the alkyl groups of the dialkylimidazolium cation (to boost the water content of
the ionic liquid) and a lengthening of the other (to reduce the IL cation hydrophilicity).
Accordingly, the n-butyl analogs of C8OHC1imTf2N and C10OHC1imTf2N (designated as
C8OHC4imTf2N and C10OHC4imTf2N, respectively) were prepared and evaluated as
extraction solvents. Figure 4.3 shows the acid dependency of the extraction of strontium
ion by DCH18C6 into C8OHC4imTf2N, along with (for purposes of comparison) the
corresponding results for C8OHC1imTf2N, C8C1imTf2N, and 1-octanol. As might be
anticipated for the slightly more hydrophobic IL (for which a lesser tendency toward ion
exchange would be expected), the decline in DSr with acidity is less pronounced for
C8OHC4imTf2N than for C8OHC1imTf2N. Unfortunately, however, the fact that DSr still
declines with increasing nitric acid concentration is a clear indication that the
contribution of neutral complex partitioning (Eqn. 4-1) to the overall extraction remains
insignificant.

114
Figure 4.3: Effect of nitric acid concentration on the extraction of Sr
2+ by DCH18C6
(0.10 M) in C8OHC1imTf2N (), C8OHC4imTf2N (), C8C1imTf2N (), and 1-octanol
().
Figure 4.4 shows the acid dependency of DSr for extraction by DCH18C6 into
C12OHC4imTf2N. Also shown (to facilitate comparison) are the corresponding results for
C10OHC1imTf2N, C10OHC4imTf2N, C10C1imTf2N, and 1-decanol. As is immediately
apparent, the slightly greater alkyl chain length of C10OHC4imTf2N vs. C10OHC1imTf2N
results in a change from an acid dependency in which DSr falls with rising acidity to one
in which DSr generally increases as the nitric acid concentration is raised. The addition of
two more methylene groups to the long alkyl chain, producing the more hydrophobic
C12OHC4imTf2N, further reduces DSr at low acidities. In this respect then, the behavior of

115
C12OHC4imTf2N mimics that of C10C1imTf2N, an IL previously shown to be sufficiently
hydrophobic as to favor neutral complex extraction [4.6]. Interestingly, however, the
values of DSr under a given set of conditions are up to a factor of two higher for
C12OHC4imTf2N than for C10C1imTf2N. The much greater water content of the OH-
functionalized IL (25,600 ppm vs. 10,400 ppm) and the accompanying greater ease of
transfer of the co-extracted nitrate anion likely accounts for the improvement in Sr2+
extraction. As shown in Table 4.3, this increased extraction efficiency is not accompanied
by a significant decrease in the extraction selectivity for strontium over sodium ion, an
important issue in any potential practical application of these extraction systems [4.14,
4.15]. Curiously, the water solubility of C10OHC4imTf2N (6830 ppm) is higher than that
of both C10C1imTf2N (300 ppm) and C10OHC1imTf2N (3700 ppm), and on this basis, a
greater propensity toward ion exchange would be anticipated. That this is not observed
suggests that the water solubility of the ionic liquid, considered alone, is not adequate as
a predictor of the predominant mode of metal ion partitioning to be expected in these
extraction systems.

116
Figure 4.4: Effect of nitric acid concentration on the extraction of Sr
2+ by DCH18C6
(0.10 M) in C10OHC1imTf2N (), C10OHC4imTf2N (), C12OHC4imTf2N (),
C10C1imTf2N (), and 1-decanol ().

117
Table 4.3
Extraction Selectivity for Strontium over Sodium in 1-Octanol, C10C1imTf2N, and
C12OHC4imTf2N
[HNO3], M DSr/DNa in 1-octanol
DSr/DNa in
C10C1imTf2N
DSr/DNa in
C12OHC4imTf2N
0.01 ND 0.3 0.5
0.1 0.9 1.3 2.3
0.25 1.7 1.9 4.8
0.5 5.8 13 10
1 7.4 26 19
2 8.2 43 32
3 14 68 53
4 28 60 80
5 75 50 130
6 190 30 180
ND = not determined

118
4.3.3 Direct correlation of strontium nitrate extraction with ionic liquid phase water
content
The importance of organic phase water content in determining the extent of
strontium nitrate extraction into oxygenated, aliphatic solvents (e.g., n-alcohols) was
established by Horwitz et al. in 1990 [4.2]. In this work, a correlation was observed
between the conditional extraction constant for the neutral strontium nitrato-crown ether
complex and the water content of the organic phase. This observation served as the basis
for understanding the higher extraction efficiencies observed for these diluents than for
other classes of conventional solvents (e.g., alkanes). In particular, high solvent water
contents were shown to support the extraction of the strontium nitrate because the
energies involved in the formation and extraction of its complex with DCH18C6 are not
sufficient to dehydrate the co-extracted nitrate anion. High organic phase water contents,
by eliminating the need for anion dehydration, thus favor extraction of the strontium-
nitrato-crown ether complex. While for molecular diluents, the correlation between K’ex
and [H2O]org is expected to persist over a wide range of acidities and within the range of
DCH18C6 concentrations where the extractant dependencies are linear, for ILs, the
situation is less clear. Prior studies of the extraction of strontium into ILs have, in fact,
yielded contradictory results [4.12, 4.26] concerning the role played by IL phase water
content in determining the efficiency with which Sr is extracted by a crown ether [4.12,
4.26, 4.27]. In certain instances, no correlation with water content was observed, while in
others, a relationship opposite that seen in conventional solvents was seen [4.27]. In these
studies, however, the lack of understanding of the underlying processes involved in the
extraction meant that the observed extraction represented a composite of the
contributions of three partitioning pathways. In each of these studies, in fact,

119
investigations were carried out under conditions in which ion-exchange processes
contribute significantly to the observed partitioning. Systematic exploration of the role of
water content in metal ion extraction into ILs, however, requires the conditions be
carefully chosen so as to favor extraction of a metal-nitrato-crown ether complex
(product of Eqn. 4-1), in analogy to the process observed in conventional molecular
solvents. If conditions are chosen that promote a significant and varying contribution to
the extraction from ion exchange processes (Eqn. 4-2 and Eqn. 4-3), it is unreasonable to
anticipate a correlation between the observed extraction efficiency and the IL water
content. One must also exercise caution in attributing a particular mechanism to a
correlation with solvent water content. For instance, in Figure 4.5, although a strong
correlation is found between the extraction of strontium from water into a series of 1-
alkyl-3-methylimidazolium ILs and the solubility of water in those ILs, it is merely a
correlation, not an indicator that water is playing a direct role in the extraction of the
complex. Rather, the extraction efficiency, in these instances, is directly related to the
hydrophobicity of the IL cation, which similarly dictates the solubility of water in the IL.
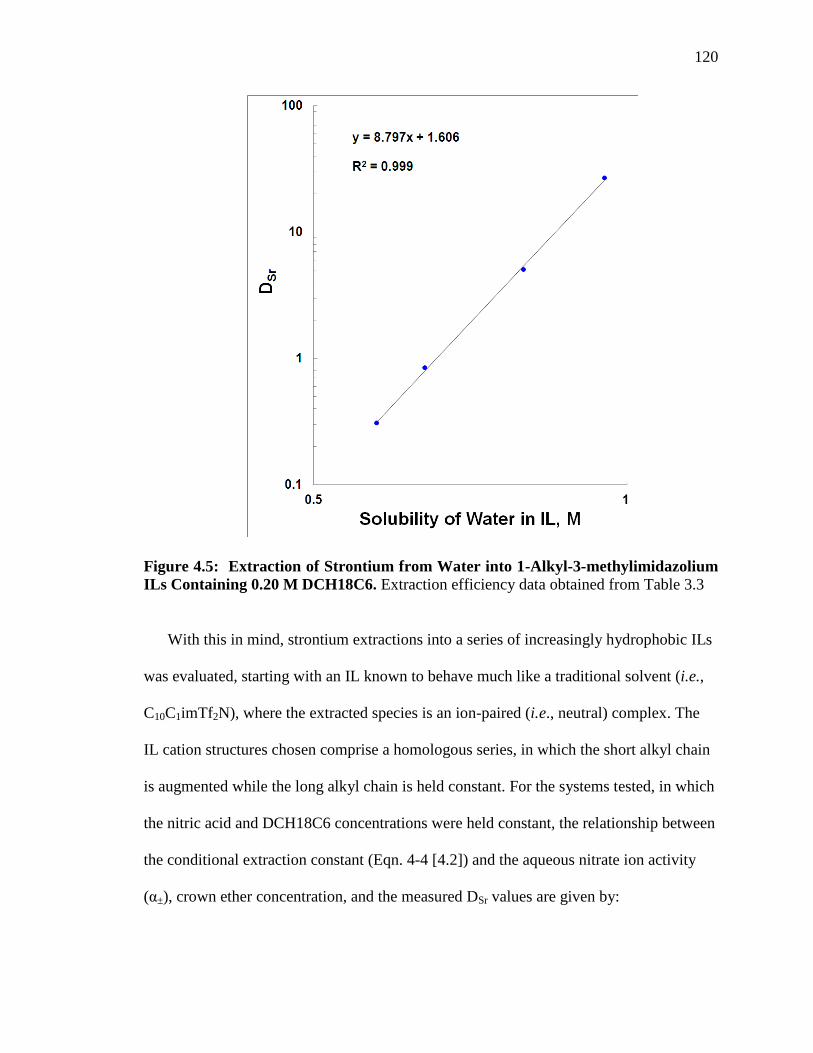
120
Figure 4.5: Extraction of Strontium from Water into 1-Alkyl-3-methylimidazolium
ILs Containing 0.20 M DCH18C6. Extraction efficiency data obtained from Table 3.3
With this in mind, strontium extractions into a series of increasingly hydrophobic ILs
was evaluated, starting with an IL known to behave much like a traditional solvent (i.e.,
C10C1imTf2N), where the extracted species is an ion-paired (i.e., neutral) complex. The
IL cation structures chosen comprise a homologous series, in which the short alkyl chain
is augmented while the long alkyl chain is held constant. For the systems tested, in which
the nitric acid and DCH18C6 concentrations were held constant, the relationship between
the conditional extraction constant (Eqn. 4-4 [4.2]) and the aqueous nitrate ion activity
(α±), crown ether concentration, and the measured DSr values are given by:

121
K'ex,Sr = DSr [DCH18C6]
-1 α±
-2 (4-4)
Several issues regarding this calculation must be noted. First, no measureable extraction
of 85
Sr was found in the absence of DCH18C6. Next, the DCH18C6 concentration chosen
must lie in the region of first-order extractant dependency. In addition, the nitric acid
concentration chosen must be such that not only is DSr readily measureable, but also the
activity of the nitrate ion in that solution is known (here, 0.75 for a 1.0 M HNO3 solution
[4.28]). Lastly, to facilitate measurements, the crown ether concentration was the highest
possible in the range for which the extractant dependence of DSr is linear.
As can be seen from in Figure 4.6, at any given DCH18C6 concentration, DSr
declines as the hydrophobicity of the ILs increases. For all of the ILs, a significant
deviation from linearity is evident above 0.1 M DCH18C6. Therefore, a concentration of
0.05 M DCH18C6 was chosen for the experiments to determine if a correlation exists
between strontium extraction and the water content of the acid-equilibrated IL phases. As
it happens, these are the same conditions employed by Horwitz et al. in their studies of
conventional solvents.

122
Figure 4.6: Effect of DCH18C6 concentration in C10C1imTf2N (), C10C2imTf2N
(), C10C4imTf2N (), and C10C6imTf2N () on the extraction of Sr2+
at 1.0 M
nitric acid. The solid lines are intended only as guides to the eye.
The results of the linear least-squares regression of the conditional strontium
extractant constant with the water content of the equilibrated ILs are presented in Figure
4.7 and Table 4.4. Considering the complexities involved in these system, with ion-
pair/neutral complex extraction (Eqn. 4-1) and a contribution from crown ether-mediated
ion exchange (Eqn. 4-3, section 3.3.5), the merits of this regression (R2 = 0.95) and the
fact that the overall uncertainties based on counting statistics and replicates (7% to 13%
RSD) are comparable to those expected for these types of measurements, support the

123
hypothesis that water content plays a important role in the extraction, provided that care
is taken to select conditions strongly disfavoring ion-exchange processes.
Figure 4.7: Correlation of the conditional extraction constant with the water
content of the IL phase for strontium extraction into a series of C10CnimTf2N ILs at
1.0 M HNO3 and 0.050 M DCH18C6. Error bars are based on the standard deviations
(n=4) and counting error (for K’ex) at the at the 95% confidence interval. Regression is of
the bilogarithmic relationship.
y = 0.995x + 2.08
R² = 0.944

124
Table 4.4
Experimental and calculated values of the linear least-squares regression of the
conditional extractant constant with the water content of the IL phase for strontium
extraction in Figure 4.6
IL [H2O], M
a K’ex,Sr
a K’
ex,Sr Calc.
b %Deviation
C10
C1imTf
2N 0.62 72 73 -1.8%
C10
C2imTf
2N 0.55 66 66 -0.1%
C10
C4imTf
2N 0.43 57 51 8.3%
C10
C6imTf
2N 0.35 40 43 -7.0%
a Experimental results were for 4 replicates of water content and 4 replicates with 3 replicate
determinations of Sr-85 distribution ratios b Calculated values are those predicted and %deviations are calculated from the residuals
In considering these results, it is important to note that data from the C10C8imTf2N
system were excluded as outliers because of higher-than-expected water content (0.39 ±
0.01 M H2O, higher than that for C10C6imTf2N), while the K’ex,Sr (29) continued to
diminish as expected. A clue as to the source of these aberrant results is found in
observations made during sample preparation. That is, upon disengagement of the IL
from the equilibrated acid, the IL phase became cloudy. When these samples were
centrifuged or warmed by hand the cloudiness vanished. In addition, upon standing, the
IL phase became cloudy. Both observations strongly indicate that the formation of a
microemulsion is responsible for the higher water content observed for this ILs. This
same conclusion may apply, albeit to a lesser extent, to C10C6imTf2N, for which a slightly
higher than anticipated water content was observed. Although surface tension data are
required to confirm this, it appears that, as the shorter alkyl chain of the imidazolium ion
exceeds half the length of the longer chain the surface activity of the IL may increase to

125
the point that formation of surfactant aggregates contribute to the overall water content.
The extraction of the strontium complex, however, is apparently not enhanced
proportionately. If this is the case, then the role that water plays in the solubilization of
the complex is dependent on how water itself is solubilized. Lower extraction with
increased IL hydrophilicity indicates that the IL may have formed either reversed-
micelles in which the complex is not soluble, or normal micelles too small to
accommodate the strontium-nitrato-crown ether complex. These results may corroborate
the hypothesis of Horwitz et al. that, “the water dissolved in the system is, in all
probability, hydrogen-bonded to the solvent molecules” [4.2], and suggest that the
formation of micelles or entrainment of microdroplets of acid or water in the organic
phase may not significantly contribute to the solubilization of the complex.
Although the water contents of these ILs were approximately an order of magnitude
lower than those of n-alcohols, improvements upon extraction by way of higher IL water
content were expected with the hydroxy-functionalized ILs. Care was taken to avoid ILs
that display a significant amount of ion exchange behavior under the same conditions as
the C10CnimTf2N series. Figure 4.8 is a combined plot of the effect of water content in the
equilibrated IL phase on the calculated conditional extraction constant for both the
C10CnimTf2N (n = 1, 2, 4, 6) series and the C12OHCnimTf2N (n = 1, 2, 4, 8) series. A
striking feature of these plots is the obvious continuity between the separate series of ILs.
Taking into consideration the uncertainties involved in the measurements of the
distribution ratios, water contents, and the densities of the contacted IL phases, the
correlation is remarkable. In fact, the combined linear bilogarithmic regression yields a

126
straight line with slope of nearly 1, suggesting that the co-extraction of nitrate in the ion-
paired complex requires the same number of water molecules.
Figure 4.8: Correlation of the conditional extraction constant with the water
content of the IL phase for strontium extraction into the homologous series of
C10CnimTf2N and C12OHCnimTf2N ILs at 1.0 M HNO3 and 0.050 M DCH18C6. Error bars are based on the standard deviations (n=4) and counting error (for K’ex) at the
95% confidence interval. Regression is of the bilogarithmic relationship for the combined
data points.
C12
OHCnimTf
2N: y = 1.09x + 1.07, R
2
= 0.996
C10
CnimTf
2N: y = 0.995x + 2.08, R
2
= 0.944

127
4.4 Conclusions
The results presented here represent an important step toward clarifying the factors
responsible for determining the “balance of pathways” among the various possible modes
of alkali and alkaline earth cation extraction by crown ethers into RTILs. As had been
anticipated, hydroxyl-functionalization does increase the water content of an N,N’-
dialkylimidazolium bis[(trifluoromethyl)sulfonyl]imide IL. At the same time, however, it
increases the water solubility of the IL cation. The net effect of these changes can be a
greater tendency toward either ion exchange (as is observed for C10OHC1imTf2N) or
towards neutral complex extraction (as is observed for C12OHC4imTf2N) as a mode of
metal ion partitioning. It appears then that neither IL water content nor IL cation
solubility in water by itself is sufficient to permit the prediction of the favored mode of
metal ion extraction. Additional studies to better define the complicated interplay among
various IL characteristics, the nature of the metal ion, and the aqueous phase conditions
are clearly needed to realize such predictive capabilities. In following the work of
Horwitz et al. to determine the relationship between the conditional strontium extraction
constant and the equilibrium water content of a variety of oxygenated aliphatic diluents,
homologous series of hydrophobic 1,3-dialkylimidazolium (e.g., C10CnimTf2N) and 1-(ω-
hydroxyalkyl-3-alkylimidazolium ILs (e.g., C12OHCnimTf2N) ILs were evaluated. Both
families exhibited a meaningful correlation, suggesting that under certain conditions (i.e.,
those that suppress ion exchange as a mode of partitioning), IL phase water does play a
central role in the partitioning of the complex(es). If the log-log relationship with water
actually correlates with the metal complex coordination environment, then the number of
water molecules associated with the extracted complex in these systems is one. This is

128
the first time that a set of ionic liquid solvents has been evaluated in this manner.
Furthermore, the water content has been shown to be a directly related to the structure
(i.e., hydrophobicity) of the ILs, a topic that will be examined in more detail in Chapter 5.
4.5 Acknowledgements
This work was supported by the Single Investigator Small Group Research (SISGR)
Program of the Office of Basic Energy Sciences of the United States Department of
Energy under sub-contract from Brookhaven National Laboratory.
4.6 References
[4.1] J. Rydberg, Solvent Extraction Principles and Practice, Revised and Expanded,
CRC Press, New York, 2004.
[4.2] E.P. Horwitz, M.L. Dietz, D.E. Fisher, Solv.Ext. Ion Exch. 1990, 8, 199-208.
[4.3] M.L. Dietz, E.P. Horwitz, S. Rhoads, R.A. Bartsch, J. Krzykawski, Solv.Extr. Ion
Exch. 1996, 14,1-12.
[4.4] M.L. Dietz, J.A. Dzielawa, Chem. Commun., 2001, 2124-2125.
[4.5] M.P. Jensen, J.A. Dzielawa, P. Rickert, M.L. Dietz, J. Am. Chem. Soc., 2002, 124,
10664-10665.
[4.6] M.L. Dietz, J.A. Dzielawa, I. Laszak, B.A. Young, M.P. Jensen, Green Chem. 2003,
5, 682-685.
[4.7] D.C. Stepinski, M.L. Dietz, Green Chem. 2005, 7, 747-750.
[4.8] D.C. Stepinski, M.P. Jensen, J.A. Dzielawa, M.L. Dietz, Green Chem., 2005, 7,
151-158.
[4.9] M.L. Dietz, S.L. Garvey, C.A. Hawkins, Proceedings of the 19th
International
Solvent extraction Conference (ISEC), Santiago, Chile, 2011, Chapter X, 208-213.
[4.10] H. Luo, S. Dai, P. V. Bonnesen, T. J. Haverlock, B. A. Moyer, A. C. Buchanan III
Solv. Extr. Ion Exch. 2006, 24, 19-31.

129
[4.11] C.A. Hawkins, S.L. Garvey, M.L. Dietz, Sep. Purif. Technol., 2012, 89, 31-38.
[4.12] S. Dai, Y.H. Ju, C.E. Barnes, J. Chem. Soc., Dalton Trans. 1999, 1201-1202.
[4.13] S.V. Dzyuba, R.A. Bartch, Tet. Lett., 2002, 43, 4657-4659.
[4.14] J.D. Holbrey, M.B. Turner, W.M. Reichert, R.D. Rogers, Green Chem., 2003, 5,
731-736.
[4.15] K. Shimojo, K. Nakashima, N. Kamiya, M. Goto, Biomacromolecules, 2006, 7, 2-
5.
[4.16] C.A. Hawkins, A. Rud, S.L. Garvey, M.L. Dietz, Sep. Sci. and Technol.
10.1080/01496395.2012.697527, 27 June 2012.
[4.17] M. Detleefs, K.R. Seddon, Green Chem., 2003, 5, 181-186.
[4.18] M.J. Earle, C.L. Gordon, N.V. Plechkova, K.R. Seddon, T.Welton, Anal. Chem.
2007, 79, 758-764
[4.19] F. Tang, K. Wu, L. Ding, J.Yuan, Q. Liu, L. Nie, S. Yao, Sep. Purif. Technol.
2008, 60, 45-50.
[4.20] Y.S. Ding, M. Zha, J. Zhang, S.S. Wang, Chin. Chem. Let. 2007, 18, 48-50
[4.21] M.L. Dietz, A.H. Bond, M. Clapper, J.W. Finch, Radiochim. Acta, 1999, 85, 119-
129.
[4.22] E.P. Horwitz, M.L. Dietz, D.E. Fisher, Solvent Extr. Ion Exch. 1991, 9, 1-25.
[4.23] E.P. Horwitz, M.L. Dietz, D.E. Fisher, Anal. Chem. 1991, 63, 522-525.
[4.24] S.V. Dzyuba, R.A. Bartsch, ChemPhysChem, 2002, 3, 161–166.
[4.25] H. Tokuda, K. Hayamizo, K. Ishii, Md. A.B.H. Susan, M. Watanabe, J. Phys.
Chem. B, 2005, 109, 6103-6110.
[4.26] A.E. Visser, R.P. Swatloski, W.M. Reichert, S.T. Griffin, R.D. Rogers, Ind. Eng.
Chem. Res. 2000, 39, 3596–3604.
[4.27] M.L. Dietz, J.A. Dzielawa, M.P. Jensen, M.A. Firestone, ACS Symposium Series
(Ionic Liquids as Green Solvents), 2003, 856, 526-543
[4.28] W. Davis Jr., H.J. De Bruin et al., J. Inorg. Nucl. Chem., 1964, 25, 1065-1083.

130
CHAPTER 5:
DEVELOPMENT AND EVALUATION OF A HIGH PERFORMANCE LIQUID
CHROMATOGRAPHIC METHOD FOR IONIC LIQUID DETERMINATION
5.1 Introduction
The determination of IL concentrations in aqueous solution has generally been carried
out spectrophotometrically, exploiting the presence of a chromophore in the cation, or
less frequently, in the anion. Imidazolium ions, for example, strongly absorb UV
radiation, undergoing ππ* transitions with a maximum absorbance at approximately
210 nm, thus providing a facile means for their quantification. Yet UV spectrophotometry
can be fraught with interferences at such low wavelengths, particularly from organic
solvents, which can lead to poor sensitivity. Additionally, because our objective was to
measure the octanol-water partition coefficients of selected ILs, for UV
spectrophotometry, it would be necessary to use references of octanol-saturated water and
water-saturated octanol, as well as standard calibrators in these solvents, to measure the
extinction coefficients for each compound in each phase. This can be laborious and
generate significant amounts of waste octanol. To address these issues, a new method for
IL determination using HPLC-UV has been developed and evaluated.
A number of previous studies have examined the separation of ILs by various liquid
chromatographic methods. These methods can be classified as either normal- or reversed-
phase depending on the relative polarity of the mobile and stationary phases. In normal-
phase liquid chromatography, the stationary phase is more polar than the mobile phase.
Retention therefore increases as the polarity of the mobile phase decreases, and polar
analytes are more strongly retained than nonpolar ones [5.1]. (The opposite situation

131
occurs in reversed-phase liquid chromatography, which employs a hydrophobic
stationary phase and water-rich mobile phase [5.1].) Normal-phase liquid
chromatography has been used to separate a variety of substances, ranging from nonpolar
to highly polar compounds [5.1]. Although historically less frequently used than
reversed-phase systems, normal-phase methods are currently undergoing a resurgence,
particularly for small polar or charged analytes.
To date, the efficient separation of ILs in a rapid and efficient manner has using
reversed-phase HPLC proven difficult. To achieve a separation of polar or charged
analytes in reversed-phase systems, either ion-pairing agents or high salt concentrations
can be employed [5.2-5.4]. For the analysis of imidazolium-based ILs, for example
Stepnowski et al. [5.2, 5.3] used an octylsiloxane-bonded stationary phase, and studied
the effects of organic modifiers (acetonitrile or methanol) and phosphate buffer
concentration on the separation of various 1,3-dialkylimidazolium and N-alkylpyridinium
ILs by gradient elution. They noted that while acetonitrile provided the best peak shape
and detection limits, some of the most polar solutes (i.e., C2C1im and C4C1im) were
difficult to retain and separate. In addition, ionic interactions led to less-than-desirable
retention time precision, necessitating the addition of trifluoroacetic acid as an ion-
pairing agent to increase the retention times. More recently, the effect of various added
salts and a variety of reversed-phase stationary phases has been investigated by Ruiz-
Angel and Berthod [5.4]. It was shown that retention of ILs could be increased by the
addition of salts, but that several adsorption isotherms overlap, resulting in poor peak
shapes. In particular, excessive peak tailing or even peak splitting was observed as a
consequence of significant ionic interactions with exposed silanols and ion-exchange
132
with adsorbed ions from added salts. The loss in efficiency and distorted peak shapes
were overcome by the use of fast or stepwise gradients.
Taking advantage of the dominance of ionic interactions observed with IL solutes,
several researchers have explored ion chromatography (IC) with direct conductivity
detection as an approach to the determination of IL cations and anions [5.5-5.7].
Satisfactory results have been obtained by employing low conductivity buffers (e.g.,
phthalate) and an acetonitrile modifier in the eluent. The advantage of IC methods is that
by using tandem cation/anion exchange columns, both the IL cations and anions can be
determined simultaneously, often with excellent sensitivity and linearity (1-300 μM). IC
systems utilizing tandem orthogonal separations and gradient elution programs are quite
expensive and can be difficult to maintain, however.
Encouraging results have also been obtained using HPLC employing either polar or
mixed-mode stationary phases for the separation of ILs [5.8- 5.11]. Some of the most
intriguing approaches have employed a technique known as hydrophilic interaction liquid
chromatography (HILIC). The term HILIC was coined by Alpert in 1990 [5.12] to
differentiate the partitioning mechanism involved in the separation of relatively polar or
charged analytes (e.g., carbohydrates, amino acids, oligonucleotides) on a polar
stationary phase (e.g., silica, amino, amide, cyano, diol, sulfobetaine, zwitterionic) to
which is adsorbed a stagnant layer of water under conditions of high organic solvent
strength (usually 70-95% acetonitrile). Solute retention in the HILIC mode is directly
proportional to the polarity of the solute and inversely proportional to the polarity of the
mobile phase, resulting in a normal-phase retention order. Although the HILIC separation
mechanism has yet to be satisfactorily explained, it appears to be based on the differential

133
distribution of the solute molecules between the organic-rich mobile phase and a water-
enriched layer retained on the hydrophilic stationary phase [5.13, 5.14]. Retention in
separations involving the HILIC mode therefore has a significant partitioning component,
thus differing from typical normal-phase separations, which are based on the adsorption
of solutes on a polar stationary phase using purely organic solvents. Of course, hydrogen
bonding and dipole-dipole interactions will be present to some extent, due to the polar
column packing and the presence of the water-rich layer. In all cases, this technique
utilizes buffers, salts and/or acids in the eluent that tend to mask ionic interactions with
surface silanols. Still, because the residual silanols cannot be completely suppressed,
particularly with non-bonded silica phases, a HILIC separation can exhibit ionic
interactions as another significant component [5.13]. Note that the buffers employed
often comprise volatile salts (e.g., ammonium acetate or trifluoroacetate), primarily
because of their solubility in highly polar aprotic organic mobile phases. An added
benefit of such salts is that their use often renders the method compatible with mass
spectrometry [5.15], a particular advantage over reverse-phase techniques, which tend to
have much lower sensitivity due to the higher mobile phase water content.
5.2 Experimental
5.2.1 Materials
All chemicals were reagent grade and used without additional purification, unless
noted otherwise. All aqueous solutions were prepared using deionized water with a
specific resistance of at least 18 MΩ·cm-1. The HPLC mobile phase buffer was prepared
by combining equal parts of 500 mM formic acid (puriss. Grade, Sigma-Aldrich, St.
Louis, MO) and 500 mM ammonium formate (J.T. Baker, supplied by VWR Chicago,

134
IL), which resulted in a pH of 3.7. The HPLC mobile phase was prepared by combining
10.0 mL of this formate buffer with 40.0 mL of water and 450 mL of acetonitrile
(Honeywell Burdick and Jackson, HPLC grade, supplied by VWR Chicago, IL) to
produce a 10 mM buffer concentration in 90:10 acetonitrile:water for analysis.
Imidazolium-based ionic liquids including the 3-methyl, 3-ethyl, and 3-butyl substituents
were synthesized by the two-step process described in Chapter 4.
5.2.2 Instruments
The HPLC system comprised a set of Agilent 1200 series analytical binary pumps
equipped with an online degasser, a fixed loop manual injection port, and a variable
wavelength UV-VIS flow cell, and operated using ChemStation software. The column
was a 75 mm x 3.0 mm Agilent Zorbax HILIC Plus silica column with 3.5 μm average
particle size. The final conditions for HPLC analysis were an isocratic flow rate of 0.800
mL min-1
with 10 mM ammonium formate buffer (pH 3.7) in 90:10 acetonitrile:water.
The column temperature was maintained at 30°C, and an injection volume of 20 μL was
employed. The detection of eluting species was carried out at 210 nm, near the
absorbance maximum for the imidazolium cation.
5.2.3 Methods
All retention factors (k’), were calculated as per Eqn. 5-1, where tR is the retention
time of the solute of interest and t0 is the peak retention time for an unretained solute.
Toluene is known to have no significant interactions with silica under these conditions;
thus it was chosen as the unretained solute in the determination of k’.

135
5-1
Initial experiments investigating the retention of different ILs were performed using 60
μM solutions of C10C1imBr and C10C1imTf2N in acetonitrile at a 0.400 mL/min flow rate.
The mobile phase composition was modified for the determination of the effect of water
content by online mixing of the 10 mM ammonium formate buffer (pH 3.7) in 90:10
acetonitrile:water mobile phase with the appropriate amount of 10 mM ammonium
formate buffer (pH 3.7) in water, and by preparing a solution in a 95:5 acetonitrile:water
mobile phase. The temperature range and step for the van’t Hoff correlation with
retention was 25-60°C in 5°C increments. Investigating the effect of buffer concentration
was accomplished with individual solutions of 2, 5, 8, 9, 10, 20, 30, and 50 mM buffer in
90:10 acetonitrile:water. Before each new set of chromatographic conditions were
examined, the column was equilibrated with at least 20 column volumes (i.e., for at least
11 minutes) of mobile phase. A steady baseline UV signal and stable column temperature
were taken as indicators that the system was, in fact, equilibrated.
5.3 Development of an HPLC-UV Method for IL Analysis
5.3.1 Method optimization
Because samples and standards must be analyzed in identical chemical environments
for UV spectrophotometry, samples derived from octanol-water partition experiments
must either be analyzed in octanol-saturated water or water-saturated octanol, or in a
diluent that is compatible with both water and 1-octanol. For ease of sample preparation,
the latter strategy was typically employed. (See, for example, the determination of IL

136
water solubility in Chapter 4 using a 50% aqueous methanol diluent.) This technique does
not, however, exhibit the sensitivity and selectivity necessary to determine Do,w values
that are much greater than 10 or lower than 0.1, given the micromolar concentrations
expected. A more sensitive technique is necessary to achieve the detection limits sought.
In considering the array of possible chromatographic approaches, HILIC appears to
offer the most promise, in that it has been found to be much less prone to severe peak
tailing than are reversed-phase separations [5.9]. Unfortunately, the best retention factor
(k’) windows to date [5.11] are very wide (Δk’ ≥ 30 separating C2C1imTf2N and
C8C1imTf2N), too wide for the rate of throughput sought. Better results (i.e., good peak
shape and narrower retention factor windows; Δk’ ~ 5 in the separation of 8 neutral
ionizable solutes) were obtained, however, using underivatized silica columns and
ammonium formate buffer [5.10]. Method development therefore began with conditions
similar to these (i.e., a mobile phase consisting of 10 mM ammonium formate buffer at
pH 3.7 in 90:10 acetonitrile:water and an Agilent Zorbax HILIC Plus silica column that
had been previously shown to be a very robust stationary phase, capable of tolerating
high ionic strength and strong acids.)
Figure 5.1 shows the chromatogram obtained upon injection of C10C1imBr and its
Tf2N analog. In considering these results, it is important to note that in order to maintain
electroneutrality during the separation, the imidazolium ion must be paired with an anion
and the ions cannot migrate independently. As can be seen, although the bromide and
Tf2N salt have vastly different properties (e.g., water miscibility), they exhibit the same
retention factor This suggests that formate, the most common anion in the system, is the
anion with which the C10C1im+ ion is paired during migration under these conditions.

137
Reports of such IL anion-independent retention behavior have appeared previously [5.3,
5.4, 5.9]. The very symmetrical peak (asymmetry factor of less than 1.2, as calculated by
the ratio of the widths of the trailing edge to the leading edge of the peak at 10% peak
height) is a benefit when separating members of a homologous series, and minimal
baseline noise suggests that detection limits should be in the low μM range. As a
fortunate consequence of having chosen appropriate conditions to start method
development, with the direction provided by prior efforts [5.9-5.11], only a change in
flow rate from to 0.800 mL min-1
was necessary to obtain the elution profile for the nine
1,3-dialkylimidazolium-based ILs shown in Fig. 5.2. As can be seen, excellent results
were obtained. With the exception of C8C1im and C7C1im, there is baseline resolution
among the homologous ILs. In addition, the retention window for these compounds is
suitably narrow, with retention factors falling between 3 and 11. Lastly, the diluent
impurity is well resolved from the analytes of interest.

Figure 5.1: Overlay of Chromatograms from Injections of 60 μM C10C1imTf2N (top trace in red) and C10C1imBr (lower trace
in blue) in ACN; 20 μL injection volume, mobile phase: 10 mM ammonium formate buffer pH 3.7 in 90:10 ACN:water, flow rate:
0.400 mL min-1
, Zorbax HILIC Plus 3.0 mm I.D. x 75 mm 3.5 μm dp, column temp. 30°C, UV detection 210 nm. Analysis of an
acetonitrile blank indicates that the peak at ca. 11.5 minutes is a polar, UV-active contaminant common to all lots the HPLC grade
acetonitrile (ACN) used.
138

Figure 5.2: Overlay of Chromatograms from the injection of a cocktail composed of nine homologous 1,3-dialkylimidazolium
bis[(trifluoromethyl)sulfonyl]imide ionic liquids in 90:10 ACN:water; 20 μL injection volume, mobile phase: 10 mM ammonium
formate buffer pH 3.7 in 90:10 ACN:water, flow rate: 0.800 mL min-1
, Zorbax HILIC Plus 3.0 mm I.D. x 75 mm 3.5 μm dp, column
temp. 30°C, UV detection 210 nm
139

140
5.3.2 Evaluation of the method merits
Using C8C1im as a representative analyte with intermediate retention, the lower limit of
detection can be calculated as 5.6 x 10⁻⁷
mol L-1
, and the lower limit of quantification as
1.87 x 10⁻⁶
mol L-1
. This sensitivity corresponds to a 30-fold improvement over
previously described HPLC-based analytcal methods [5.9-5.11] and compares favorably
to that of IC methods with conductivity detection [5.6]. The reproducibility of peak
retention times ranged from 0.16% to 0.90% RSD, and the precision of peak areas ranged
from 1.26% RSD to 5.80% RSD for 10 nmol and 0.2 nmol on column per IL in the
cocktail, respectively. Good linearity (R2 > 0.999) was observed for 0.01 nmol to 20
nmol on column per IL in the cocktail. However, at 40 nmol on column, significant
fronting of the peaks was observed due to overloading of the column. (The column
capacity could be increased substantially by increasing the column size to more standard
analytical dimensions (150 mm x 4.6 mm), at the cost of sample throughput.) Carryover
was found to be 0.1% by injecting a blank diluent sample after the injection of a high
standard, which is suitable for a manual injection system. Over one-thousand injections
have been performed on the same column without a significant deterioration in efficiency
or resolution.

141
5.4 Characterization of the Retention Mechanisms of the HPLC Method
5.4.1 Silica column characteristics
The use of an underivatized silica stationary phase remains the major difference
between this method and that of Lamouroux et al. [5.11], in which a diol-derivatized
silica stationary phase was described as exhibiting HILIC retention behavior. Because
silica and diol phases afford approximately the same polarity, they tend to provide similar
retention characteristics for polar and ionic solutes. There are, however, major differences
between the diol and silica phases. First, diol phases are bonded to the silica, resulting in
fewer free silanol sites to provide a means of adsorptive ion-exchange. In addition, they
have a greater tendency to form hydrogen bonds, and therefore, they acquire thicker
layers of water on the stationary phase, enhancing the partitioning mechanism. In general,
satisfactory retention and selectivity on a diol stationary phase come at the cost of long
elution times and poor peak shapes for the many retained species (i.e., C2C1im). As
Lamouroux et al. noted [5.9], the considerable tailing observed in the separation of Ils on
a diol phase is due, in large part, to secondary ionic interactions with free silanols. Such
drastic differences in elution profiles, coupled with the expectation that a HILIC mode
may be involved in the retention observed in Fig. 5.2, prompted an investigation of the
retention mechanism under these conditions.
The chemistry of the surface of silica is not straightforward [5.18]. While only two
types of functional groups (i.e., silanols and siloxane bridges) exist on the surface, the
interrelationships between them are many and complex. For example, the silanol groups
can exist either independently or hydrogen bonded to near neighbors. Although they are
primarily weakly acidic, some of these silanols are strongly acidic and thus, ionized at

142
even low pH [5.1]. The siloxane bridges, while often assumed to be inactive, can
contribute to retention through hydrophobic interactions [5.1]. Not unexpectedly then,
chromatography performed on silica-based stationary phases is not always reproducible
or understandable.
Normal-phase elution order with a significant partitioning component is a hallmark of
HILIC mode separations [5.12]. For ionized solutes, ion exchange often constitutes a
secondary component [5.10, 5.13]. In an effort to assess the relative contributions of
these two components, the first of our studies involved determining the relationship
between the retention of the IL cations and their hydrophobicity. Figure 5.3 illustrates the
relationship between the logarithm of the retention factor and the carbon number of the
same two homologous series of ILs (C10Cnim and CnC1im) in Fig. 5.2. Consistent with
typical normal-phase separations, the retention is observed to decrease with increasing
hydrophobic character of the IL. Additionally, the correlations are more or less linear,
suggesting that retention (and therefore selectivity) is largely driven by the
hydrophobicity of the ILs. The slightly parabolic shape of the plots, however, suggests
that more than one retention mode influences the retention of these solutes, despite their
vastly different polarities.

143
Figure 5.3: Variation of logarithmic retention factor with carbon number of
homologous series of 1,3-dialkylimidazolium-based ILs. Fitted lines are of linear least-
squares regressions. Error bars are standard deviations (n=3) at the 95% confidence
interval. Conditions are the same as in Fig. 5.2.
5.4.2 Effect of solvent strength on retention
These results raise the question of whether the most important factor governing IL
retention is partitioning or adsorption. Obviously, electrostatic interactions often play an

144
important role in the behavior of ILs [5.19], and these interactions are thus likely to be a
significant factor in their chromatographic retention. The basic relationship governing
solute retention derives from reversed-phase chromatography, for which retention is
determined (ideally) by partitioning. Equation 5-2 describes the relationship between the
retention factor and solvent strength for a separation system [5.16].
(5-2)
where k’A is the theoretical value of retention factor with only the weak solvent as the
mobile phase, VB is the volume fraction of the strong solvent in the mobile phase, and S is
a constant for a given solute (all other conditions constant). In conventional normal-phase
systems, where retention is based on surface adsorption and subsequent displacement of
the analyte by the eluent, the relationship between retention and the volume fraction of
the strong solvent (i.e., water), will conform to the following expression [5.17]
(5-3)
where As and nb are the cross-sectional areas occupied by the solute and the eluent
molecules, respectively, on the surface. Plots of logarithmic retention factor vs. the linear
and logarithmic functions of the water contents in the eluents should thus produce one
straight line and one curve, depending on whether the dominant retention mechanism is
partitioning or adsorption. While there are many examples of such plots in the literature,
it remains unclear if these mechanisms can be resolved in such a simple manner.
145
Figure 5.4 shows the effect of varying the volume fraction of water in the mobile
phase on log k’. That the plot is not linear is clear evidence that partitioning cannot be the
only mechanism contributing to the retention of the ILs (if indeed it is present at all), in
agreement with previous studies [5.20, 5.9] which proposed that for ionic solutes,
retention is likely to be controlled by adsorption. A closer look at Fig. 5.4 shows that the
plot can be divided into three distinct regions. In the first, which corresponds to the
volume fraction of water from 0.05 to 0.6, IL retention decreases with increasing water
content, thus defining a region of normal-phase behavior that might be considered HILIC
mode. In the next region, which encompasses water volume fractions from 0.6 to 0.8, the
retention factor remains essentially constant and all nine IL peaks co-elute. Lastly, in the
third region (water fraction of 0.8 and above), a subtle shift to reversed-phase behavior
(increasing k’ with increased water in the mobile phase) is observed. These shifts in
retention mode lead to the default “U” shape of the curves [5.21].
When the logarithmic retention factors of several representatives ILs are plotted
versus the logarithmic volume fraction of water for region 1 (Fig. 5.5), an excellent linear
fit is obtained (as per Eqn. 5-3), which is consistent with an adsorptive process [5.8].
Thus, adsorption (most likely ion-exchange) plays a dominant role in the retention and
selectivity under the operating conditions of this method. Note, that to attain these fits,
the range of the water contents was truncated from 60% for C2C1im to 50% for C4C1im,
and 40% for C7C1im and C10C2im, because of a shift toward more reversed-phase
behavior with increasing solute hydrophobicity. Regardless of the apparent role of
adsorption, no single approach can definitively elucidate the retention mechanism(s).

Figure 5.4: The effect of varying the volume fraction of water in the eluent (VB) on the logarithmic retention factor.
146

147
Figure 5.5: Bilogarithmic relationship of retention factor on the varying volume
fraction of water in the eluent (VB).
Previous studies of the retention of hydrophobic solutes on silica have estimated that,
from 70% to 95% ACN, the water-rich layer occupies 4% to 13% of the pore volume,
leading to significantly exclusion of those solutes from the pores and reduced retention
[5.22]. That an estimated 7% of the pore volume may be occupied by the water-rich layer
at the 90% ACN operating mobile phase composition suggests that the exclusion of the
ILs from the pores may be a factor leading to the trend of decreasing k’ with increasing

148
IL hydrophobic surface area. This process may also play a significant role in the
selectivity observed with this method.
5.4.3 Influence of temperature on the separation process
Temperature has a significant effect on retention, especially for charged or ionizable
solutes [5.1]. Several previous studies have explored the effect of temperature on
retention for a variety of solutes and stationary phases [5.20, 5.25-5.27], and the results
have provided the means for fundamental thermodynamic interpretations of the retention
mechanisms involved. The relationship between the retention factor and thermodynamic
temperature (T in Kelvin) is described by the van’t Hoff equation [5.23, 5.24] (Eqn. 5-4):
(5-4)
where the parameter Bi is proportional to the partial standard molar enthalpy of transfer
of a solute i from the mobile phase to the stationary phase (ΔH°), Ai involves the standard
partial molar entropy of transfer of the solute from the mobile phase to the stationary
phase (ΔS°), and the last term is the phase ratio (ratio of the volume of the stationary
phase, Vs, to that of the mobile phase, VM). Accordingly, the dependence of ln k’ on
inverse temperature is expected to be linear. Thus, by plotting ln k’ versus 1/T over a
sufficiently wide temperature range, the enthalpic and entropic contributions to the
retention and selectivity can be calculated - ΔH° from the slope and ΔS° from the
intercept. A van’t Hoff plot exhibiting nonlinearity indicates that a change in retention
mechanism has occurred over the range of temperatures studied [5.23].

149
Before one can calculate the entropic contribution to retention from the intercept (Ai),
the phase ratio of the column must be known. Because it is impossible to know exactly
the boundary between the space occupied by the stationary phase and the mobile phase in
the column, however, the ratio must be calculated (Eqn. 5-5) using the total column
porosity (εT) provided by Eqn. 5-6 [5.28].
(5-5)
(5-6)
where V0 is the hold-up time determined as the elution volume of a small unretained
solute (toluene), and VC is the volume of the empty column. The retention time for
toluene was 0.539 ± 0.001 min, resulting in a V0 of 0.431 mL and a phase ratio (VS/VM)
of 0.230.
Figure 5.6 is a plot of ln k’ versus 1/T for the various 1,3-dialkyimidazolium ILs as
well as the diluent impurity. At first glance, the curves appear to be quite linear. Although
the retention of the C4C1im through C10C4im ILs increases with increasing temperature,
the retention of the diluent impurity and C2C1im exhibit decrease with increasing
temperature (with that of the impurity being more dependent on temperature). Evidently,
there is a difference, from a thermodynamic perspective, between the overall retention
process for C2C1im and the impurity versus that of the remaining ILs. To gain more
insight into the processes involved, it is helpful to examine the trends in the
thermodynamic contributions for the various solutes. Table 5.1 shows the results of linear
least-squares regression of the experimental ln k’ versus 1/T data and the calculated
thermodynamic contributions for each IL, as well as those for the diluent impurity.

Figure 5.6: Temperature dependence of retention factors for ILs and the diluent impurity. Temperature range was 25°C to 60°C
150

151
Given that the shift in enthalpy from negative to positive (i.e., exothermic to
endothermic) coincides with significant changes in the hydrophilicity of the ILs, it can be
surmised that the retention mechanism of C2C1im and the impurity includes a larger
contribution from specific adsorptive interactions with the silica stationary phase than is
the case for the remaining ILs. These observations are in accord with prior work [5.26]
suggesting that retention by direct electrostatic interactions results in significantly more
negative enthalpies than does retention dominated by ion-exchange with adsorbed eluent
ions. Moreover, all of the processes are dominated by the partial molar change in entropy
from the mobile phase to the stationary phase. That the entropic contribution is observed
to rise with increasing IL alkyl chain length indicates that the driving force behind the
retention process ion exchange that, to some extent, it is governed by hydrophobicity.
Theory of ion-exchange involving non-adsorptive interactions has been developed in
terms of Gouy-Chapman theory [5.29], where the analyte ions interact with the electric
field formed by the buffer cation concentration gradient established in the eluent layers
closest to the stationary phase. Under the conditions of the current method, an
entropically-driven process might be one where the IL cations entering those layers from
the bulk eluent exchange for ammonium ions without specific adsorptive interactions
with the stationary phase. The correlation coefficients suggest that the dependence of ln
k’ on 1/T is linear (R2 > 0.95), except for C4C1im (for which R
2 = 0.712). Assessment of
the seemingly low correlation coefficient for the latter must take into account that
temperature has little effect on the retention of C4C1im, whose small positive enthalpy
lies in the region of transition from an endothermic process to an exothermic process.
Therefore, even though the residuals from this regression are comparable to those of the

152
other curves, they result in a much larger sum of deviations. Upon closer inspection of
the residuals for each regression, it can be seen that there is a slightly parabolic nature.
But, whether this is a result of slight variations in the relative contributions of the
different retention mechanisms or merely an artifact of bias in the column temperature at
25°C and 60°C (not determined by an online thermocouple) cannot be determined,
however.
Table 5.1
Best fit parameters, Ai, Bi of Eqn. 5-3, correlation coefficients R2, and the calculated
thermodynamic contributionsa to retention.
Solute Ai Bi R2
–ΔH°
(kJ mol-1
)
ΔS°
(J K-1
mol-1
)
C2C1im 1.61 ± 0.06 342 ± 18 0.984 -2.84 25.6
Diluent Impurity 0.18 ± 0.16 753 ± 51 0.973 -6.26 13.7
C4C1im 2.39 ± 0.07 -85.5 ± 22 0.712 0.71 32.0
C5C1im 2.69 ± 0.06 -246 ± 19 0.964 2.05 34.6
C6C1im 2.94 ± 0.06 -371 ± 18 0.987 3.08 36.6
C7C1im 3.10 ± 0.05 -457 ± 17 0.992 3.80 38.0
C8C1im 3.20 ± 0.05 -517 ± 17 0.994 4.30 38.8
C10C1im 3.31 ± 0.05 -594 ± 17 0.995 4.94 39.7
C10C2im 3.23 ± 0.07 -636 ± 21 0.994 5.29 39.1
C10C4im 3.34 ± 0.08 -774 ± 24 0.994 6.43 40.0
a Uncertainties are based on the standard error of the coefficients at the 95% confidence interval

153
5.4.4 Effect of changing buffer concentration on retention
The extent to which ionic interactions play a role in the retention of solutes can be
assessed by observing the effect of changing buffer concentration on retention. In
traditional ion-exchange chromatography, the relationship between the retention factor
(k’) of a solute and the buffer or salt concentration [C] is described by Eqn. 5-7 [5.30],
where s is a constant dependent on the charge of the solute and counter-ion.
(5-7)
If we define the retention of a solute (A+) by silanol-mediated ion-exchange as the
equilibrium constant of the process in Eqn. 5-8
(5-8)
where SiO- and C
+ represent the ionized silanol group and its counter ion (i.e., NH4
+),
respectively, and the subscripts s and m denote the stationary phase and mobile phase,
respectively. Expressed for a singly charged solute and a monovalent counter-ion, the
slope of the relationship in Eqn. 5-7 would be -1. Although the relationship for our
compounds is linear, as shown in Fig. 5.7, the deviation from unit slope observed for all
of the curves (-0.37 to -0.10) may be indicative of the existence of retention mechanisms
other than ion exchange [5.31, 5.32]. However, the activity of the ammonium ion may be
significantly less due to diminished dissociation of the buffer salt in a largely aprotic
solvent [5.31], which would also account for the deviation of the slope from unity.

154
Figure 5.7: The effect of varying the ammonium formate buffer concentration on
the retention factor.
To better define the contribution of ion-exchange to the overall retention, a “two-site
model” described by Yang et al. [5.32] for the determination of the contribution from
ion-exchange behavior of hydrophobic bases on reversed-phase columns was employed.
Rearrangement of Eqn. 5-8 results in an ion-exchange distribution ratio for the solute, A+,
according to Eqn.5-9.

155
(5-9)
Using the appropriate phase ratio (ϕIX
) and distribution ratio (KIX), the retention factor
for A+ can be obtained, as in Eqn. 5-10.
(5-10)
For a given column, all of the terms in Eqn. 5-10 except for [C+]m can be combined into a
single constant, BIX, which is proportional to is the total number of free silanol sites per
unit area, [SiO-: C
+], and the equilibrium constant for the process, KA. This leads to the
simplified Eqn. 5-11:
(5-11)
It is noteworthy that for a 1:1 displacement reaction, Eqn. 5-11 leads to the conclusion
that there will be no retention upon extrapolation to 1/[C+] = 0. The key assumption of
the two-site model is that the solute molecules interact with two types of sites
independently. Therefore, applying this approach the present system is indicative of a
combination of a normal-phase and ion-exchange contribution to retention, as per Eqn. 5-
12.
(5-12)

156
where ϕNP
and KNP are the phase ratio and distribution ratio for a pure normal-phase
partitioning process, and k’NP and k’IX are the respective retention factors for these two
mechanisms, the sum of which is the observed retention factor, k’. No assumption is
made as to the details of the normal-phase interaction, but it is taken to be a partitioning
process like that described by HILIC theory. As long as these two components are
independent of one another, and the normal-phase mechanism is only weakly dependent
on the buffer concentration, then Eqn. 5-11 and Eqn. 5-12 can be rewritten as:
(5-13)
This expression provides the means to interpret a plot of k’ versus 1/[C+], where the slope
of the curve is BIX and the y-intercept is the contribution to retention by mechanisms
other than ion-exchange. It is not unprecedented to apply this approach to a normal-phase
separation [5.33, 5.34]. In fact, the first such use of a plot of k’ versus the inverse
counter-ion concentration was performed in pursuit of a second non-ion-exchange
process in a system utilizing bare silica phases [5.34].
Figure 5-8 is a plot of the retention factor versus the reciprocal ammonium
concentration from the mobile phase buffer. (Conspicuously absent is the impurity peak,
which was not observed for the highest buffer concentration (20 mM).) In accordance
with Eqn. 5-13, the plots are rather linear (R2 ≥ 0.98). All of the intercepts observed are
positive, consistent with the existence of an additional retention mechanism at “infinite”
buffer concentration [5.34]. The decreasing intercepts with respect to increasing

157
hydrophobicity (i.e., alkyl chain length) of the ILs reveal that there are vast differences in
the contribution from the normal-phase mode, with a very small contribution from that to
the retention of C10C4im. With the exception of C2C1im, the slopes of the curves decrease
in that same order, reinforcing the idea that the silica particle pores are less accessible to
the more hydrophobic solutes.

158
Figure 5.8: Plot of retention factor versus the reciprocal buffer concentration.
That the slopes of these curves are much greater than the intercepts reinforces view that
the ion-exchange process is dominant for all of the ILs tested. Values of the regression
parameters, however, should not be taken as a direct measure of the relative contributions

159
from normal-phase retention modes, because the activity of the ammonium ion under
these conditions is not known. Yet again, the diminishing slopes (BIX) along with
increasing alkyl chain carbon number suggest that the interactions become somewhat less
significant with increasing hydrophobicity of the solute. Considering the normal-phase
behavior of the solute bands, and the likelihood that the high organic content of the
mobile phase has led to a water-rich boundary on the silica phase, it is noted that the
more hydrophobic ILs may be significantly excluded from pores that are enriched in
water, and will, therefore, exhibit lower retention.
5.5 Conclusions
The method outlined here represents a significant improvement over previously
developed HPLC and IC methods for the separation of ILs [5.9, 5.6], as nine imidazolium
cations can be separated in the span of 7 minutes with exceptionally good peak shape. In
addition, the method provides a means for rapid determination of a number of ILs with
excellent sensitivity and precision. Because the 90% ACN mobile phase employed is
miscible with both organic solvents and water, as long as the water (i.e., strong solvent)
content of an injected sample is 10% or less (i.e., a 10-fold dilution of a purely aqueous
sample) , the method provides a facile approach for the determination of ILs in a wide
variety of samples.
The retention of 1,3-dialkylimidazolium IL homologues was found to vary with
carbon number with some deviation from linearity. A thorough evaluation of the
retention mechanism showed that ion-exchange is the predominant mode of retention for
the ionic liquid cations on underivatized silica, which is consistent with several prior

160
studies [5.11, 5.20, 5.35, 5.36] and reviews [5.13, 5.21] on the subject of the interaction
modes on various polar stationary phases. The van’t Hoff correlation indicates that the
retention mechanisms do not change with temperature and phase transfer of the analytes
is driven primarily by entropy. Taken together with a predominantly ion-exchange mode
of retention under conditions that favor the sorption of water on the silica surface, these
thermodynamic data suggests that analyte adsorption may not be the dominant retention
mechanism, but that ion-exchange may occur in the boundary layer formed near the
stationary phase surface. Additionally, retention of the IL cations is controlled by their
hydrophobicity, suggesting that increased exclusion from the pores and resulting decrease
in retention with increasing alkyl chain length is, in part, responsible for the selectivity
observed.
5.6 References
[5.1] L.R. Snyder, J.J. Kirkland, J.L. Glajch, Practical HPLC Method Development,
Wiley and Sons, Inc., New York, 1997.
[5.2] P. Stepnowski, A. Müller, P. Behrend, J. Ranke, J. Hoffmann, B. Jastorff, J.
Chromatogr. A, 2003, 993, 173-178.
[5.3] P. Stepnowski, W. Mrozik, J. Sep. Sci. 2005, 28, 144-148.
[5.4] M.J. Ruiz-Angel, A. Berthod, J. Chromatogr. A, 2008, 1189, 476-482.
[5.5] A. Markowska, P. Stepnowski, Jap. Anal. Sci. 2008, 24, 1359-1361.
[5.6] S. Stolte, S. Steudte, A. Markowska, J. Arning, J. Neumann, P. Stepnowski, Anal.
Methods, 2011, 3, 919-926.
[5.7] W. Gao, H. Yu, Analytical Letters, 2011, 44, 922–931.
[5.8] S. Kowalska, B. Buszewski, J. Sep. Sci. 2006, 29, 2625-2634.

161
[5.9] G. Le Rouzo, C. Lamouroux, C. Bresson, A. Guichard, P. Moisy, G. Moutiers, J.
Chromatogr. A, 2007, 1164, 139-144.
[5.10] D.V. McCalley, J. Chromatogr. A, 2007, 1171, 46-55.
[5.11] C. Lamouroux, G. Foglia, G. Le Rouzo, J. Chromatogr. A, 2011, 1218, 3022-3028.
[5.12] A.J. Alpert, J. Chromatogr. A, 1990, 499, 177-196.
[5.13] P. Hemström, K. Irgum, J. Sep. Sci. 2006, 29, 1784-1821.
[5.14] E. Wikberga, T. Sparrmana, C. Viklundb, T. Jonssonb, K. Irgum, J. Chromatogr.
A, 2011, 1218, 6630-6638.
[5.15] H.P. Nguyen, K.A. Shug, J. Sep. Sci. 2008, 31, 1465-1480.
[5.16] C.F. Poole, The Essence of Chromatography, Elsevier, Amsterdam, 2003, 302.
[5.17] L.R. Snyder, H. Poppe, J. Chromatogr. A, 1980, 184, 363-413.
[5.18] R.K. Iler, The Chemistry of Silica, and Sons, Inc., New York, 1979.
[5.19] H. Tokuda, K. Hayamizu, K. Ishii, Md.A.B.H. Susan, M. Watanabe, J. Phys.
Chem. B, 2005, 109, 6103-6110.
[5.20] Y. Guo, S. Gaiki J. Chromatogr. A, 2005, 1074, 71-80.
[5.21] B. Buszewski, S. Noga, Anal. Bioanal. Chem. 2012, 402, 231-247.
[5.22] D.V. McCalley, U.D. Neue, J. Chrom. A, 2008, 1192, 225-229.
[5.23] L.A. Cole, J.G. Dorsey, Anal. Chem. 1992, 64, 1317-1323.
[5.24] D. Haidacher, A. Vailaya, C. Horváth, Proc. Natl. Acad. Sci. 1996, 93, 2290-2295.
[5.25] Z. Hao, B. Xiao, N. Weng, J. Sep. Sci. 2008, 31, 1449-1464.
[5.26] J. Wu, W. Bicker, W. Linder, J. Sep. Sci. 2008, 31, 1492-1503.
[5.27] J. J. Soukup, P. Jandera, Biologija, 2011, 57, 85-91.
[5.28] J. Urban, P. Jandera, Z. Kučerová, M.A. van Straten, H.A. Claessens, , J.
Chromatogr. A, 2007, 1167, 67-75.
[5.29] J. Stråhlberg, Anal. Chem. 1994, 66, 440-449.

162
[5.30] H.F. Walton, R.D. Rochlin, Ion Exchange in Analytical Chemistry, CRC Press,
Boca Raton, FL, 1990.
[5.31] G.W. Tindall, J.W. Dolan, LC-GC North America, November 2002, 1028-1032.
[5.32] X. Yang, J. Dai, P.W. Carr, J. Chromatogr. A, 2003, 996, 13-31.
[5.33] M. Liu, J. Ostovic, E.X. Chen, N. Cauchon, J. Chromatogr. A, 2009, 1216, 2362-
2370.
[5.34] G.B. Cox, R.W. Stout, J. Chromatogr. A, 1987, 384, 315-336.
[5.35] N.P. Dihn, T. Jonsson, K. Irgum, J. Chromatogr. A, 2011, 1218, 5880-5891.
[5.36] Y. Guo, S. Gaiki J. Chromatogr. A, 2011, 1218, 5920-5938.

163
CHAPTER 6:
THE ROLE OF IONIC LIQUID CATION HYDROPHOBICITY
6.1 Introduction
6.1.1 Impetus for studies of ionic liquid hydrophobicity
The ease with which an imidazolium ion can be derivatized has led to a vast array of
imidazolium-based ILs that are potential candidates for a wide range of applications. In
fact, there are over 30,000 1,3-dialkyl imidazolium entries recorded in the ACS Chemical
Abstracts Service database [6.1]. The array of possible structures, however, presents a
challenge in determining what structural features will likely afford the physicochemical
properties sought for a given application. The selection of an appropriate IL is further
complicated by the sensitivity of properties to the IL structure. For example, studies of
the effect of systematically varying the alkyl chain length of 1,3-dialkylimidazolium-
based ILs have demonstrated that the certain properties (e.g., water solubility) of these
compounds can be substantially altered by addition or deletion of a single methylene
group.
The goal of a substantial portion of this work has been to provide information to
establish guiding principles for the rational selection of the ILs most appropriate for use
in metal ion extraction. Clearly, the most effective guidelines would be those based on
the fundamental physicochemical properties of ILs and their relationship to the behavior
of ILs as solvents. As the three-path model for metal ion extraction has informed our
understanding, it has become clear that the desired solvent characteristics (e.g.,
mimicking the behavior of conventional solvents but with extraction efficiencies and
extraction selectivities that are superior to conventional solvents) can be achieved under
certain conditions simply by making the IL cation sufficiently hydrophobic as to render

164
exchange of this species for the cationic metal complex much less favorable. As
described in Chapter 4, the switch in the predominant mode of partitioning from ion
exchange to ion-pair extraction comes at the cost of lower extraction efficiency. Often
among the results of this change in pathway are values of DSr (at acidities where
extraction is normally performed) no better than those observed with 1-octanol as the
solvent. Despite the lack of overall improvement in extraction efficiencies when using a
relatively hydrophobic IL (e.g., C10C1imTf2N), these solvents have been shown to offer
greater selectivities, a result of the switch in partitioning mode which occurs for Sr2+
, but
not for Na+ (see Chapter 3). Although these studies have proven to be important in
understanding the factors that contribute to the trends seen in the acid dependencies, they
have not provided a means of quantitatively relating IL structure to the propensity for
ion-pair extraction. From a practical standpoint, such a goal would likely be best served
by developing a scale of hydrophobicity that relates the structure of the IL to its
extraction properties, a scale that could provide a means of solvent selection. With this in
mind, in this chapter we describe our efforts to devise a system for determining IL
hydrophobicity (lipophilicity) and its correlation to metal ion extraction behavior in
biphasic systems employing ILs as the organic phase.
6.1.2 The hydrophobic effect
Although hydrophobicity has been invoked in previous chapters as a fundamental
property involved in determining both the balance of pathways in the extraction of metal
ions (Chapters 3 and 4) and the chromatographic retention mechanism(s) of retention of
an IL on a chromatographic column (Chapter 5), it has not been strictly defined. Initially,

165
a conceptual description of hydrophobicity will be the most useful. The phenomenon
underlying the property is the hydrophobic effect, which arises from the fact that
hydrocarbon molecules have a greater solubility in hydrocarbon (i.e, organic) solvents
than in water [6.2]. More exactly, the hydrophobic effect is defined by the free energy
transfer of a hydrocarbon from water into a hydrocarbon solvent [6.3]. Let us start by
noting that due to the presence of a hydrogen bond network, water is a highly ordered
substance. The introduction of a solute into an aqueous environment will therefore
disrupt this hydrogen bond network. To some extent, the hydrogen bonding requirements
can be satisfied by forming new interactions with a polar solute. For a nonpolar solute,
however, or one with extensive nonpolar functionalities, those bonds are unable to
reform. Instead, the water molecules at the surface of the cavity formed by the inclusion
of the nonpolar solute must rearrange tangentially to that surface to reform the broken
hydrogen bonds. In the process of rearranging, a higher degree of local order (a negative
change in entropy) is established, with more rigid hydrogen bonds between water
molecules. The extent to which this reorganization is necessary to maintain the hydrogen
bonds in the presence of a solute is related to the overall hydrophobicity of the solute.
The thermodynamic interpretation of this situation is that hydrocarbon (i.e., non-polar)
moieties have a tendency to be expelled from an aqueous environment because of the
unfavorable free energy of the process. This so-called “hydrophobic effect” is the source
of many spontaneous molecular phenomena in aqueous solution including protein folding
[6.4, 6.5], the formation of membranes [6.2, 6.7], and gas solubility in water [6.8].
In order to draw the relationship between the hydrophobic effect and the solution
chemistry we seek to explain, it is best to take a more quantitative approach to the

166
phenomenon. Partitioning of a solute between an aqueous phase and an immiscible
hydrocarbon solvent is a process that is described well by fundamental chemical
thermodynamics, beginning with a general expression for the chemical potential of a
solute, i, in Eqn. 6-3
(6-3)
where μ° is the standard chemical potential, R is the gas constant, T is absolute
temperature, and γ is the activity coefficient in a solution of Xi concentration of the
solute. The chemical potential of a hydrocarbon dissolved in water is given by Eqn. 6-4.
(6-4)
where Χw is the mole fraction of the solute, γw is the activity coefficient at that
concentration, and is the standard chemical potential. The reference standard state for
the standard chemical potential is the state of “infinite dilution” in water. The third term
on the right-hand side of the equation represents only the partial excess chemical
potential that stems from interactions of solute molecules with each other, and because of
the very low solubility of hydrocarbons in water, may be assumed to be zero. The second
term on the right-hand side is the contribution made by the entropy of mixing.
Accordingly, is a measure of the internal free energy of the solute molecule and its
interaction with the solvent. A corresponding term, , is obtained from the counterpart
expression of chemical potential for a solute dissolved in a hydrocarbon solvent, shown
in Eqn. 6-5.

167
(6-5)
Because the internal free energy is the same in both solvents, μhc - μw, therefore
represents the difference in free energy between the solute in a hydrocarbon solvent and
the solute in water. This difference is deemed the free energy of transfer from water to
hydrocarbon, and its assessment provides a basis for understanding the hydrophobic
effect.
The values of for different hydrocarbon solvents differ only slightly in
comparison to the difference in and , and therefore, Eqn 6-5 can be applied to a
solution of a hydrocarbon in itself (i.e., pure liquid hydrocarbon). In this case, the second
and third terms on the right-hand side of Eqn. 5-5 would be zero and µhc would equal to
within the limits of approximations made. When a hydrocarbon dissolves in water to
form a saturated solution, the chemical potentials of that solute in the two phases will be
the same because of the established equilibrium. Therefore, for a solute partitioned
between a hydrocarbon liquid and water, µw = µhc. Substitution of the expression for µw
from Eq. 6-4 in Eq. 6-5, results in an expression for the free energy of transfer that is only
dependent on the solubility in water:
(6-6)
In the case of the distribution of solutes between octanol and water, where the solute
concentration can be determined in both phases, the overall expression for the difference
in free energy between the phases can be applied, as in Eqn. 6-7.

168
(6-7)
6.1.3 Octanol-water partition coefficients for ionic liquids
Of the parameters describing the hydrophobicity of small molecular substances, the
octanol-water partition coefficient (Kow) is perhaps the most well-established, a result of
its ease of measurement, the extensive set of values available for a wide range of solutes
[6.8], and the demonstrated relationship between the parameter and a variety of other
important solute properties. For example, because the dielectric properties of 1-octanol
are similar to those of a generalized lipid phase [6.8], Kow can be used to model the
partitioning of solutes across biological membranes [6.9-6.11]. Along these same lines,
this parameter is useful in correlating the hydrophobicity of a wide variety of substances
to processes that depend on their lipophilicity, including the prediction of the transport of
chemical species in ecosystem risk analysis and the distribution and pharmacodynamics
of drug substances in the human body [6.12, 6.13]. Briefly, the Kow represents a
thermodynamic property of a pure substance under specified conditions that is defined
precisely (by Eqn. 6-8) as the ratio of the equilibrium concentration of an identical pure
chemical species (X) distributed between an octanol-rich phase (saturated with water,
org) to that in a water-rich phase (saturated with 1-octanol, aq) at a given temperature.
(6-8)
Applying the rule for the difference in logarithms to Eqn. 6-7 will provide the
proportionality between the free energy of transfer and the distribution ratio at

169
equilibrium (Eqn. 6-8). Therefore, the logarithm of the distribution ratio is directly
proportional to the free energy change in the transfer of the solute, as shown for the
octanol-water distribution ratio in Eqn. 6-9.
(6-9)
The resulting proportionality provided in Eqn. 6-10 demonstrates that the octanol-water
partition coefficient is a direct measurement of the hydrophobic effect. It follows from
this that a logarithmic plot of the partition coefficient may be a linear function of some
condition (e.g., carbon number of the solute, aqueous modifier concentration) on which
the partitioning of the solute is dependent.
(6-10)
Kow is defined for the undissociated species of the solute in both phases. As a result, it
can be difficult to determine for acids, bases, and salts, for which the degree of ionization
in the aqueous phase is greater than that in the octanol phase. Like these more
conventional compounds, ILs are expected to undergo greater dissociation in the water-
rich phase (Fig. 6.1), thus complicating Kow determination. (The dissociation constants of
C4C1imTf2N in water and 1-octanol have been determined to be 115 and 0.07,
respectively [6.16], indicating the significant degree of dissociation in the aqueous phase
versus the octanol phase for this particular IL.)

170
Figure 6.1: A model for the partitioning of ILs in an mctanol/water biphasic system.
The symbols represent the ion pair, Xν+Yν-, the respective dissociated ions Xz+
Yz-
, and
their stoichiometric coefficents ν+ and ν-.
For ionizable substances, the octanol-water partition coefficient is often reported as
the ratio of the sum of the concentration of both undissociated and dissociated salt in the
octanol-rich phase to that in the water-rich phase [6.15-6.17]. Although by definition this
value cannot be considered the Kow, it can be deemed an octanol-water distribution ratio
(Dow), as described by Eqn. 6-11, where the dissociated and undissociated IL cation may
be measured in both phases.
(6-11)

171
Large databases of log Kow values estimated by structural-property models (e.g, linear
solvation free energy relationships [6.18], quantitative structure-property relationships
[6.19], and atom/fragment contribution models [6.20]) have been compiled in an effort to
predict the biological behavior of potential drugs or pollutants. In cases where a wide
variety of structures are possible, and therefore an multiplicity of properties that can
affect the transport of solutes, these correlation models have provided a means to identify
structures with important properties prior to their synthesis [6.21]. To facilitate estimation
of the physicochemical properties of ionic liquids, these and other models and empirical
correlations have been successful, but in ways that are often not mutually comparable
[6.22]. However, the variables encountered in solvent extraction are far fewer than those
in biological systems transport and distribution, and hence, these models may be too
complicated for the hydrophobicity scale pursued in this work.
Techniques for the experimental determination of octanol-water partition coefficients
(or distribution ratios) include the shake-flask method, the generator column method,
high-performance liquid chromatography (HPLC), and the slow-stirring method. The
shake-flask method establishes the equilibrium by shaking or rotating suitable vessels
containing the mutually saturated phases in the presence of the solute of interest. The
phases are disengaged by centrifugation. Although its simplicity makes this is the most
common technique used, the method can yield erroneous results for solutes with very
high (> 4) or very low (< -4) log Dow, due to the formation of emulsions and/or
entrainment of microdroplets of one phase in the other [6.23]. As an alternative to the
shake-flask method, the generator column technique [6.24] utilizes a column is packed
with an inert material (Chemosorb W or glass beads) that has been coated with water-

172
saturated octanol containing the test solute. Water is then pumped through the column,
resulting in the equilibrium of the phases. The solute that elutes with the water and that
passes through the column is then processed by solvent extraction and or concentrated by
solid phase extraction to be analyzed. A tremendously high phase ratio allows the
measurement of extremely high Kow values (> 108) [6.23]. Although this method prevents
the formation of emulsions by slowly passing the phases through one another, it is a
tedious and time-consuming procedure, and thus, is probably well-suited only for the
most hydrophobic of solutes.
Liquid chromatography, particularly in reversed-phase mode, lends itself well to the
estimation of partition coefficients because the principle retention mechanism is based on
the partitioning of the test solute between an aqueous mobile phase and lipophilic
stationary phase. Additionally, automated instrument for simultaneous analysis of
substances with a wide range of polarities can rapidly generate a large number of results
without the need for quantifying solute concentrations [6.25-6.28]. Partition coefficients
are estimated from linear equations relating retention indices on RP-C18 columns to Kow,
as derived for a set of reference chemicals. Among the disadvantages of this are the
difficulty in extrapolating the results (i.e., the linearity of the equations) beyond the range
of the test solutes, and the variability in the density of the bonded phase between columns
and manufacturers. (Specifications such as the carbon-load and end-capping of silanols
must remain the same between columns to compare retention factor indices. Over the last
decade, column manufacturers and chromatographers have made significant efforts to
classify the selectivity of alkyl-silica columns on the market, resulting in selection guides
for column equivalency [6.29].) Despite these limitations, recent attempts to catalog the

173
chemical toxicity of various 1,3-dialkylimidazolium-, 1-alkylquinolinium-, and 1-
alkylpyridinium-based ILs by Ranke et al. [6.30] employing linear regression of
reversed-phase gradient elution retention and IL lipophilicity or cytotoxicity data resulted
in significant correlations. The results confirmed that hydrophobicity dominates the
biological transport properties of IL cations over a wide range of structures. Ranke et al.
[6.31] subsequently derived equations from first principles that relate the retention of ILs
in the same chromatographic systems to their aqueous solubility and partitioning
behavior.
The slow-stirring method was introduced [6.32] as a direct alternative to the shake-
flask method for the measurement of the partition coefficient of very hydrophobic solutes
(e.g., polychlorinated biphenyls) [6.23]. By equilibrating the phases through non-
turbulent mixing this technique prevents the formation of emulsions as well as the mutual
entrainment of the phases, to which the shake-flask method is prone. Recently, the slow-
stirring method was applied to the determination of the Dow values of various ILs by
Brenneke et al. [6.15], and confirmed by Ventura et al. [6.17]. Because the slow-stirring
method was used with satisfactory accuracy for the difficult determination of the Dow of
ILs, this technique was explored as a means for measuring the Dow of the ILs in the
current study.
A complication noted by prior investigations in the determination of Dow values for
ILs is the considerable concentration dependence of the values obtained. For instance, the
log Dow values of C4C1imTf2N between the octanol and water have been shown to
decrease with decreasing initial concentrations [6.15- 6.17]. Rigorous evaluation of the
equilibria for this compound in each phase by Lee et al. [6.16] and later by Ventura et al.

174
[6.17] demonstrated that the Dow is a composite of the equilibria shown in Fig. 6.1, and
that, the Dow is a linear function of IL concentration at sufficiently low initial
concentrations. In light of these complications, the model proposed by Ventura et al.
[6.17] is based on an ion-pair extraction into the octanol phase. It is worthy to note,
however, that at the lowest values of initial IL concentration, Ventura et al. reported
equilibrium concentrations for C2C1imTf2N and C4C1imTf2N in the octanol phase that
were at or below the detection limit of the UV-VIS spectrophotometer (0.01 in
absorbance). Therefore, these studies have called into question the use of a direct method
for the determination of IL octanol-water distribution ratios.
For the purpose of these studies, Dow (as a basic representation of solute
hydrophobicity) has been sought as a means to correlate the extraction of metal ions (i.e.,
Sr2+
) by DCH18C6 from acidic nitrate solutions into ILs, to the hydrophobicity of 1,3-
dialkylimidazolium bis[(trifluoromethyl)sulfonyl]imide ILs. Establishing a scale with a
simple relationship would provide a relatively facile means of evaluating ILs for a variety
of processes where solvent hydrophobicity is a primary factor. As in previous studies, in
this work, the hydrophobic anion bis[(trifluoromethyl)sulfonyl]imide is common to all of
the ILs, thus simplifying the assessment of the differences in the hydrophobicity of the IL
cation.
6.2 Experimental
6.2.1 Materials
All chemicals were reagent grade and used without additional purification unless
noted otherwise. All aqueous solutions were prepared using deionized water with a

175
specific resistance of at least 18 MΩ·cm-1
. The DCH18C6 (Parish Chemical, Orem, UT)
used was a mixture of the cis-syn-cis and cis-anti-cis isomers and was used as received.
The 1-octanol employed for partitioning experiments was spectroscopic grade purchased
from Alfa Aesar (distributed by VWR Chicago, IL) The HPLC mobile phase buffer was
prepared by combining equal parts 500 mM formic acid (puriss. Grade, Sigma-Aldrich,
St. Louis, MO) and 500 mM ammonium formate (J.T. Baker, supplied by VWR Chicago,
IL) which resulted in a pH of 3.7. The HPLC mobile phase was prepared by combining
10.0 mL of the formate buffer with 40.0 mL of water and 450 mL of acetonitrile
(Honeywell Burdick and Jackson, HPLC grade, supplied by VWR Chicago, IL) to
produce a 10 mM buffer concentration in 90:10 acetonitrile:water. Imidazolium-based
ionic liquids including the 3-methyl, 3-ethyl, and 3-butyl substituents were synthesized
by the two-step process described in Chapter 4.
6.2.2 Instruments
NMR spectra were acquired on a Bruker DPX300 NMR spectrometer operating at
300.13 MHz for proton and 75.47 MHz for carbon-13, and equipped with a z-gradient
broadband (BBO) probe. Unless otherwise noted, spectra were obtained using solutions
of dimethylsulfoxide-d6 or chloroform-d3 (Aldrich, 99.96 atom% D), and all chemical
shifts were reported relative to tetramethylsilane. Initial attempts to determine IL
concentrations from octanol-water partition devices were made using a Shimadzu UV-
2450 UV-Visible Spectrophotometer (sensitivity of ±0.01 absorbance units) with
matching 10 mm path length quartz cuvettes. Measurements of IL concentrations from
octanol-water partition devices were made using a set of Agilent 1200 series analytical

176
binary pumps equipped with an online degasser, a fixed loop manual injection port, and a
variable wavelength UV-VIS flow cell, and operated using ChemStation software. The
column used was a 75 mm x 3.0 mm I.D. Agilent Zorbax HILIC Plus silica column with
3.5 μm average particle size. The conditions for HPLC analysis were an isocratic flow
rate of 0.800 mL min-1
with 10 mM ammonium formate buffer (pH 3.7) in 90:10
acetonitrile:water. The column temperature was maintained at 30°C. An injection volume
of 20 μL was employed, along with detection at 210 nm.
6.2.3 Methods
Slow-stirring devices were prepared according to the work of Brenneke et al. [6.15].
The apparatus shown in Fig. 6.2 consisted of a 40 mL (24 mm diameter 93 mm height)
clear, glass vial (National Scientific Company, Claremont, CA, supplied by Thermo-
Fisher Scientific), fitted with an open-top screw cap incorporating a Teflon-coated
silicone septum, and containing a 1 cm Teflon-coated magnetic stir bar. Prior to adding
the octanol phase, a 12 gauge Teflon tube (Hamilton Company, Reno, NV) topped with a
polypropylene Luer Lug style female hub with a 1/16” barb (Value Plastics, Fort Collins,
CO) was immersed in the water phase, drawn through a similar sized hole in the vial
septum, and sealed with parafilm.
It has been noted previously that IL concentrations in the aqueous phase must be less
than the critical micelle concentration (CMC) [6.33]. For even the most hydrophilic ILs
studied here (i.e. C5C1imTf2N), the CMC is expected to be greater than the aqueous
solubility [6.34]. Additionally, a dependence of Dow on concentration (deviation from
Henry’s Law) was investigated by Lee et al. [6.17], suggesting that the concentrations
used in previous experiments [6.15] were too high. Consideration of these and other data

177
[6.17] determined that indeed Dow does diminish with decreasing initial concentration of
the IL, and that the initial concentration of the solute must be exceedingly low to avoid a
significant bias. Our approach to achieving this goal while maintaining measureable
concentrations was to employ initial concentrations of ILs in the octanol-rich phase that
were less than the water solubility of the ILs, and at least 10-fold less than those used in
the original studies [6.15]. Accordingly, all devices were prepared with an initial IL
concentration of less than or equal to 1 x 10⁻³
M in water-saturated 1-octanol. The
octanol-rich phase was gently added on top of the water-rich phase in equal volumes and
stirred for at least 40 days at 23 ± 2°C, until the Dow did not change by more than ± 0.3.
Sampling of the octanol-phase was accomplished by penetrating the vial septum with a
syringe. Samples were withdrawn from the aqueous phase by inserting a stainless steel
syringe needle into the Teflon tube to avoid contamination with the octanol phase.

178
Figure 6.2: Photo of a slow-stirring device for Do,w measurement of C5C1imTf2N.
Shake-flask devices were prepared in quadruplicate by simply adding equal volumes
of 1.0 mM IL in water-saturated octanol and octanol-saturated water to 50 mL
polypropylene centrifuge tubes (Becton Dickinson, Franklin Lakes, NJ, supplied by
Thermo-Fisher Scientific). The tubes were mixed for 12 hours on a horizontal rotary
shaker at 250 rpm, allowed to settle for 24 hours, and centrifuged at 3000 rcf for 5
minutes to disengage the phases. Aliquots of each phase were separated from the other
and stored in 15 mL polypropylene tubes (Becton Dickinson, Franklin Lakes, NJ,
supplied by Thermo-Fisher Scientific).

179
Aqueous phase samples were diluted 10-fold in acetonitrile prior to analysis by HPLC,
as required to maintain efficiency in the separation. In cases where the aqueous IL cation
concentrations were less than the lower limit of quantification of the HPLC-UV method
(ca. 2 μM), an aliquot of the water-rich phase was evaporated and reconstituted with
acetonitrile to a concentration factor of at least five. Octanol phase samples that contained
higher concentrations than the highest standard calibrator were diluted at least 10-fold
with acetonitrile, resulting in a peak area response within the range of the calibration
curve. Note that 1-octanol is a weaker solvent than acetonitrile in a normal phase
chromatographic system, and because it is miscible in the eluent, samples from that phase
do not require solvent strength modification as do aqueous phase samples.
Distribution ratios of metal ions (DM) were determined as the ratio of the count rate in
the organic phase to that of the aqueous phase using commercial radiotracers. Assays
were carried out via gamma spectroscopy using standard procedures. In each metal ion
distribution experiment, the organic phase consisted of DCH18C6 dissolved in the
designated ionic liquid, and the aqueous phase nitric acid concentration was
systematically adjusted either by conducting separate experiments for each condition, or
by adding the appropriate amount of acid after each sampling. All organic phases were
pre-equilibrated with aqueous phase prior to the introduction of the metal radiotracer.
Additionally, the sum of the count rates in each phase yielded recoveries within 10%
(most often < 10%) that of the radiotracer stock solution used, indicating that equilibrium
was established with only two phases involved. Room temperature was maintained at 23
± 2°C. Each equilibrated phase was sampled for analysis in at least duplicate, with
resulting uncertainties based on counting statistics that were generally within 10%,

180
although the uncertainty interval was considerably wider for the highest DM values (DM ≥
1000).
6.3 Determination of Ionic Liquid Hydrophobicity
6.3.1 Methods comparison of the slow-stirring and shake-flask techniques
Before studies relating Dow to IL solvent properties can commence, a workable
method of equilibration for the octanol and water phases must be chosen. The most facile
of these is the shake-flask technique, but owing to its various drawbacks [6.15, 6.16,
6.23], the slow-stirring technique is considered the more reliable approach. For ease of
measuring the octanol-water distribution ratios of ILs, however, it would be preferable to
use the shake-flask method. Avoiding a time-intensive equilibration would allow for a
higher throughput analysis of the distribution ratios for a broader range of ILs. Although
there is ample data to support the assertion that a bias is common with this technique, it is
incumbent upon the analyst to determine whether such a bias is prevalent for a particular
set of solutes and whether that bias is acceptable or not.
In the present work, a single slow-stirring device was prepared for the partitioning
determination for each solute.. This device (Fig. 6.2) may require several months to
equilibrate the phases due to the small contact area between them. To evaluate the
necessity of using the slow-stirring technique for 1,3-dialkylimidazolium-based ILs,
quadruplicate shake-flask experiments were also performed for several of the ILs to
permit a direct method comparison. A simple “student t-test” (taking the slow-stirring
results as the accepted value) as per Eqn. 6-12 was applied for this comparison.

181
x (6-12)
where μ is the slow-stirring Dow value, x is the mean of the shake-flask Dow values, N is
the degrees of freedom, s is the standard deviation, and tcalc is to be compared to the
tabulated t statistic at the 95% confidence interval. If the average Dow values for the shake
flask results show no sign of determinant error, then we can reasonably assume that the
shake-flask and slow-stirring techniques are equivalent.
The results of the methods comparison are provided in Table 6.1 In every case, the t-
test resulted in tcalc > tcritical (tcritical = 3.18 for four separate measurements), suggesting that
significant systematic error has been introduced to the Dow values obtained using the
shake-flask technique. The shake-flask Dow for C5C1imTf2N is approximately 70% higher
than that for the slow-stirring method. Likewise, Dow for C8C1imTf2N generated by the
shake-flask technique is significantly lower than that of the slow-stirring method.
Table 6.1
T-test comparison of the shake-flask method to the slow-stirring method
IL Shake-flask Do,w Slow-stirring Do,w tcalc (N=3)
C5C1imTf2N 0.17 ± 0.02 0.064 8.3
C6C1imTf2N 0.50 ± 0.01 0.38 20
C8C1imTf2N 5.90 ± 0.4 7.65 8.6
At these moderate distribution ratios, the differences are too large to be attributed to the
entrainment of one phase in the other. If one places these differences in the context of the

182
Dow values determined, however, they are relatively small. Yet, combined with the
difficulties encountered in previous studies [6.15-6.17], the differences between the
method results suggest that the concentration dependence of Dow may be responsible.
Additionally, although it may be possible to prevent or remove emulsions incurred during
the shaking process, literature data for Kow values measured by the shake-flask technique
indicate that formation of emulsions influences the observed Kow values [6.23]. Overall,
the t-test results are consistent with misgivings of previous investigators [6.15, 6.17,
6.23], who questioned the validity of the shake-flask technique as a means of making Dow
measurements of ILs. Stated another way, the shake-flask method is not valid for our
purposes for the present studies, therefore, the octanol-water distribution ratios will be
measured for our ILs using only with the slow-stirring technique.
6.3.2 Relationship of Dow to carbon number of the IL cation
One of the most straightforward structural descriptors is the number of carbon atoms
in a molecule or within a particular functional group. Linear relationships between phase
transfer parameters like log Kow and carbon number generally hold true for in particular
classes of compounds containing the same kind and number of functional groups such as
n-alkanes, alkenes, n-alcohols, and esters (i.e., series of homologues) [6.2]. From a
practical perspective, correlating the carbon number of ILs to the Dow values determined
can provides a simple means of verifying the consistency of data obtained by a particular
method. The plot in Fig. 6.3 depicts the relationship between the slow-stirring log Dow
values for a series of 1,3-dialkylimidazolium ILs and either the carbon number of
individual alkyl chains or the total number of carbons in both alkyl chains.

183
Figure 6.3: Correlation of log Do,w for ILs obtained using the slow-stirring method
with the carbon number (Cn) of the long alkyl chain of CnC1imTf2N (), short alkyl
chain of C10CnimTf2N () and the sum of chains (). The values are for C5C1imTf2N,
C6C1imTf2N, C8C1imTf2N, C10C1imTf2N, C10C2imTf2N, and C10C4imTf2N. Error bars
are the relative standard deviations of triplicate analysis at the 95% confidence interval.
If variations in the partitioning of the various ILs arise from differences in the free
energy of transfer from one phase to the other (Eqn. 6-10), then previously reported
values of ΔG associated with the transfer of a methylene group from water to the water-
hydrocarbon interface (-3.0 to -3.5 kJ mol-1
) [6.35] or from water to the bulk hydrocarbon

184
solvent (-3.7 kJ mol-1
) [6.3], imply that a plot of log Dow versus carbon number should
yield a curve with a slope that lies in the range of -0.53 to -0.66. That this is consistent
with the correlation for the long chain increments and the sum of the alkyl chains, is not
just interesting, but suggests that the methodology is performing well for our purposes of
IL solvent behavior predictions. There appears, however, to be some significant deviation
from that trend with in correlation to the short alkyl chain of the C10CnimTf2N
homologous series. In attempting to understand these results, it must be recalled that
solvent-solute interactions occur over a rather short range, and therefore, for amphiphiles
like 1,3-dialkylimidazolium salts, the contributions from the hydrophobic tails and the
hydrophilic head group may be, to some extent, considered independent [6.2]. The
ordering of polar solvent groups by strong attractive forces in the polar imidazolium head
group environment, especially by water molecules, is likely to predominate. Also, it is
not probable that the head group will influence interactions distal to the point of
attachment to the amine groups. Therefore, because the ILs studied here share a common
head group, it is reasonable to assume that, for the same side-chain, the contribution to
partitioning from the addition of methylene groups will in interval values, leading to a
slope of the same proportion. Nevertheless, because the slope for the variation in the
short chain of the C10CnimTf2N series is significantly less than that for the variation in the
long chain length of CnC1imTf2N, there must be a physical explanation. These results are
consistent with prior studies [6.36, 6.37] demonstrating that the addition of a second,
shorter alkyl tail to a charged head group (i.e., sulfate and quaternary ammonium) already
possessing a longer chain, will make a smaller contribution to a phase change (i.e., free
energy of critical micelle formation) than will the longer tail. Conversely, the effect of the

185
incremental augmentation of the longer chain will not be influenced by the presence of a
shorter chain [6.36]. Although the aggregation of the solutes investigated is a different
process than partitioning, both are governed by the hydrophobic effect, and will therefore
be determined, at least in part, by the free energy change associated with the solute-
solvent interactions. Taken together, these concepts suggest that of the data point for
C10C1imTf2N in the short chain increment were replaced by that for another homologue
with more methylene groups (e.g., where n = 3, 5, or 6), then the slope would be closer to
that for the long chain homologues. Unfortunately, not only are the N-propylimidazole
and N-pentylimidazole precursors not commercially available, but they are difficult to
synthesize. Along the same lines, the measurement of Dow for C10C6imTf2N has been
stymied by its very low water solubility, making its detection difficult.
6.3.3 Correlation of Dow to the strontium extraction behavior of ionic liquids
For the distribution of ILs in the octanol-water partitioning system to be used as a
parameter to design a scale of hydrophobicity related to their metal ion extraction
behavior, a meaningful correlation must be obtained. That is, the equilibrium for metal
ion extraction must be established by a process similar to that for the octanol-water
biphase. Thus, the conditions chosen for metal ion extraction must be those for which
ion-exchange of the IL cation for the metal-crown ether complex (Eqn. 3-2)
predominates. Because this pathway dominates at very low nitric acid concentration for
the most hydrophilic ILs, the correlation of log DSr versus log Dow in Fig. 6.4 is based on
data for extraction from 0.01 M HNO3 into the CnC1imTf2N homologous series.

186
Figure 6.4: Correlation of log DSr with log Dow for various CnC1imTf2N ILs . The DSr
experiments were performed using 0.10 M DCH18C6 in the IL.
The fact that the slope of the plot obtained at 0.01 M HNO3 versus log Dow is nearly
negative 1 is not surprising, given that it has been previously demonstrated that plot of
log Kex,Sr versus carbon number [6.38] provides a line with a slope similar to the
CnC1imTf2N series evaluated in section 6.3.2, which were both in accord with the free
energy of the transfer of a CH2 group between the phases. That both the relatively

187
hydrophobic C10C1imTf2N and hydrophilic C5C1imTf2N fit well on this curve, indicates
again that, at low nitrate concentrations, the predominant pathway by which extraction
occurs is ion exchange. Given that C10C1imTf2N has been recognized for Sr2+
extraction
behavior like that of a conventional solvent (Chapter 3), the log Dow of 2 for this
compound may be considered as a benchmark for ILs which are to mimic the behavior of
a conventional (molecular) solvent.
6.3.4 Chromatographic prediction of Dow
Clearly, there is a direct relationship between the partitioning that occurs in the
octanol-water system and the partitioning model of reversed-phase retention. However,
normal-phase retention is also driven by solute polarity, and whether or not a partitioning
mechanism is involved, a correlation may be possible. As a result of the evaluation of this
HPLC method (see Chapter 5 section 5.4.2), the selectivity has been shown to be related
to the hydrophobicity of the ILs. Therefore the retention of the ILs under these conditions
should be comparable with other processes that are governed by their hydrophobicity.
The plot in Figure 6.5 shows the relationship between log Dow and the retention factors of
several CnC1im ionic liquids, using the HPLC method developed and evaluated for their
measurement (see Chapter 5). Reciprocal retention factors were used to display the
relationship in terms of increasing IL hydrophobicity.

188
Figure 6.5: Correlation of log Dow with the reciprocal log k’ for various CnC1imTf2N
ILs.
These results contrast with previous reports [6.23] stating that retention mechanisms
differing from strict partitioning by solvophobic interactions will not provide reliable
correlations with octanol-water partition coefficients, suggesting that, at least for this
system, the relationship between a normal phase ion-exchange mode of retention and Dow
is correlatable, but not necessarily causal. It is understood that caution should be applied

189
when attempting to provide general guidelines for families of compounds on the basis of
variables with such fundamental differences. Nevertheless, predictions can be made, at
least within this homologous series. Furthermore, using the same systems, it may be
possible to predict the log Dow, and therefore estimate metal ion extraction behavior, for
various other ILs that have chromophores (e.g., N-alkylpyridinium- and N-
alkylquinolinium-based ILs) given a few homologues from either family.
6.4 Conclusions
The results reported here, while preliminary, provide important insight into the trends
of IL hydrophobicity that can potentially form the basis of a practical hydrophobicity
scale. Most importantly, by combining the correlation with Dow of the extraction of Sr2+
from very dilute nitric acid into CnC1imTf2N and the shape of the nitric acid dependency
of extraction into C10C1Tf2N, a benchmark has been set for the observation of ion-pair
extraction behavior into this family of ILs at a log Dow value of ca. 2. The relationship of
partitioning of ILs with carbon number has afforded appropriate linear best fits to the Dow
values determined by slow-stirring and are validated by the relationship of the slope to
the free energy of transfer of a CH2 group from water to 1-octanol. Interestingly,
differences in results for log Dow versus carbon number of either alkyl tail indicate that
evaluating the partitioning of 1,3-dialkylimidazolium ILs as solutes, and perhaps the
partitioning of solutes in biphasic systems comprising these ILs may be approached from
the standpoint of two-tailed amphiphiles. Differences observed between the shake-flask
and slow-stirring method results are statistically significant, but they are quite small
compared to the range of values measured. To determine truly accurate Dow values,

190
however, a systematic evaluation of the concentration dependence of the Dow for these
ILs would yield values that are comparable to others [6.16, 6.17], who obtained data by a
rigorous treatment (i.e., extrapolation to infinite dilution). Although the accuracy of the
octanol-water distribution ratios reported here remains in question due to their possible
concentration dependence, the compelling correlations provided therefrom speak to the
validity of the intervals generated. Provided that the experimental results are
reproducible, then their absolute accuracy is not essential to predict IL hydrophobicity for
the means of this laboratory. Furthermore, to put these issues of accuracy into
perspective, the concentrations employed for the Dow measurements are comparable to
those that might be found in our extraction studies, thus providing data valuable to the
prediction of the metal ion extraction behavior of ILs.
6.6 References
[6.1] SciFinder Scholar, web version September 2012; Chemical Abstracts Service:
Columbus, OH, 2007; RN 58-08-2 (accessed 30 November 2012).
[6.2] C. Tanford, The Hydrophobic Effect: Formation of Micelles and Biological
Membranes, Wiley, New York, 1973.
[6.3] F. MacRitchie, Chemistry at Interfaces, Academic Press, Inc. San Diego, CA, 1990.
[6.4] W. Kauzmann, Adv. Protein Chem. 1959, 14, 1.
[6.5] K.A. Dill, Biochemistry, 1990, 29, 7133-7155.
[6.6] E. Wilhelm, R. Battino, R.J. Wilcock, Chem. Rev. 1977, 77, 219-262.
[6.7] C. Tanford, Science, 1978, 200, 1012-1018.
[6.8] J. Sangster, J. Phys. Chem. Ref. Data, 1989, 18, 1111-1229.
[6.9] R. Collander, Ann. Rev. Plant Physiol.1957, 8, 335-348.

191
[6.10] C. Hansch, J.E. Quinlan, G.L. Lawrence,. J. Org. Chem. 1968, 33, 347-350.
[6.11] A. Leo, C. Hansch, D. Elkins, Chem. Rev. 1971, 71, 525-616.
[6.12] C.J. van Leeuwen, T.G. Vermeire, Risk Assessment of Chemicals: An Introduction,
Springer, 2007.
[6.13] N.P. Franks, W.R. Lieb, Nature, 1994, 367, 607-614.
[6.14] N.V. Plechkova, K.R. Seddon, Chem. Soc. Rev. 2008, 37, 123–150.
[6.15] L. Ropel, L.S. Belvéze, S.N.V.K. Aki, M.A. Stadtherr and J.F. Brennecke, Green
Chem. 2005, 7, 83-90.
[6.16] S.H. Lee, S.B. Lee, J. Chem. Technol. Biotechnol. 2009, 84, 202-207.
[6.17] S.P.M. Ventura, R.L. Gardas, F. Gonçalves, J.A.P. Coutinho, J. Chem. Technol.
Biotechnol., 2011, 86, 957-963.
[6.18] M.J. Kamlet, R.M. Doherty, M.H. Abraham, Y. Marcus, and R. W. Taft, J. Phys.
Chem. 1988, 92, 5244-5255.
[6.19] L. P. Burkhard, A. W. Andrew, D. E. Armstrong, Chemosphere, 1983, 12, 935.
943.
[6.20] A.J. Leo, Chem. Rev. 1993, 93, 1281-1306.
[6.21] E.H. Kerns, J. Pharm. Sci. 2001, 90, 1838-1858.
[6.22] C-W. Cho, U. Preiss, C. Jungnickel, S. Stolte, J. Arning, J. Ranke, A. Klamt, I.
Krossing, J. Thöming, J. Phys. Chem. B, 2011, 115, 6040–6050.
[6.23] J. De Bruijn, F. Busser, W. Seinen, J. Hermens, Environ. Toxicol.Chem. 1989, 8,
499-512.
[6.24] H. DeVoe, M.M. Miller, S.P. Wasik, J. Res. Natl. Bur.Stand. (U.S.) 1981, 86, 361-
366.
[6.25] G.D. Veith, N.M. Austin, R.T. Morris, Wat. Res. 1979, 13, 43-47.
[6.26] M-M. Hsieh, J.G. Dorsey, Anal. Chem. 1995, 67, 48-57.
[6.27] K. Valcó, C. Bevan, D. Reynolds, Anal. Chem. 1997, 69, 2022-2029.
[6.28] J.G. Krass, B. Jastorff, H-G. Genesier, Anal. Chem. 1997, 69, 2575-2581.

192
[6.29] J.W. Dolan, A. Mauleb, D. Bingley, L. Wrisley, C.C. Chan, M. Angod, C. Luntee,
R. Krisko, J.M. Winston, B.A. Homeier, D.V. McCalley, L.R. Snyder, J. Chrom. A,
2004, 1057, 59-74.
[6.30] J. Ranke, A. Müller, U. Bottin-Weber, F. Stock, S Stolte, J. Arning, R. Störmann,
N Jastorff, Ecotoxicol. Environ. Safety, 2007, 67, 430-438.
[6.31] J. Ranke, A. Othman, P Fan, A. Müller, Int. J. Mol. Sci. 2009, 10, 1271-1289.
[6.32] D.N. Brooke, A.J. Dobbs, N. Williams, Ecotoxicol. Environ. Safety, 1986, 11 251-
260.
[6.33] S. Gocan, G. Cimpan, J. Comer, Advances in Chromatography v. 44: Lipophilicity
Measurements by Liquid Chromatography, , CRC Press, Boca Raton, FL, 2006, 79-
176.
[6.34] M. Blesic, M.H. Marques, N. V. Plechkova, K.R. Seddon, L.P. N. Rebelo, A.
Lopes, Green Chem. 2007, 9, 481–490.
[6.35] M.J. Rosen, Surfactants and Interfacial Phenomena, Wiley, New York, 1989.
[6.36] H.C. Evans, J. Chem. Soc., 1956, 579-586.
[6.37] K.T. Shinoda, T. Nakagawa, B. Tamamushi, T. Isemura, Colloid Surfactant,
Academic Press, New York, 1963.
[6.38] M.L. Dietz, J.A. Dzielawa, Chem. Commun. 2001, 2124-2125.

193
CHAPTER 7:
PLACING QUALITATIVE TRENDS OF METAL ION EXTRACTION INTO
A QUANTITATIVE CONTEXT
7.1 Introduction
The analysis in Chapters 3 and 4 described our current understanding of the
extraction of metal ions into room-temperature ionic liquids, highlighting the similarities
and differences versus extraction systems utilizing molecular diluents (i.e., 1-octanol) and
providing insight into the key factors (e.g., metal cation charge density, IL
hydrophobicity, the nature of the aqueous phase anion) that determine the balance among
the possible modes of extraction. Trends observed in the nitric acid dependencies of
alkali and alkaline earth cation extraction, for instance, were explained by a three-path
model including ion-pair (neutral complex) extraction, ion exchange of the cationic
complex for the IL cation, and crown ether-mediated ion exchange. To date, the
information provided by evaluating these acid dependencies has been largely qualitative
in nature. Understanding the origins of the observed trends, however, requires a more
quantitative approach, in which the interplay among the three equilibria is considered.
Therefore, to provide a less ambiguous description of the processes involved in
extraction, methods to measure their separate contributions must be developed. It is
anticipated that by elucidating the individual contributions of the pathways over the range
of conditions employed in the acid dependencies, an improved understanding of the
conditions that may provide the best extraction behavior may result. For instance, an
understanding of the magnitude of the contribution from ion-exchange modes under
various conditions could guide the development of processes for which these pathways

194
are either required or undesirable. As noted previously, an ideal process for the extraction
of strontium is one in which the contribution from ion exchange is minimized, high
extraction efficiencies and selectivities at modest acidities are maintained, and the
stripping of the IL phase with dilute acid is feasible. The present study is aimed at
developing techniques to facilitate in the investigation of the effects of individual
pathways on the overall metal ion distribution ratios.
The approach by which the contributions to extraction from individual pathways can
be elucidated is not as straightforward as it might seem. In the case of the determination
of the co-extraction of nitrate (i.e., ion-pair extraction), for instance, the typical technique
employed involves the measurement of the aqueous phase depletion by analysis of the
solution before and after extraction using ion chromatography (IC) [7.2, 7.3]. The
cadmium reduction colorimetric method could be employed as an alternative to IC [7.4],
but wet chemical methods are laborious and time-consuming. Neither of these methods,
however, are viable for samples taken under the conditions of a typical extraction, which
ivolves molar concentrations of acid, while the depletion of the aqueous phase anion is
likely to be orders of magnitude lower. To accurately measure a small change
superimposed on such a large background presents a significant challenge. In a few cases,
another method that can be used to avoid such difficulties is 15
N-NMR [7.2]. Yet
performing this measurement on a regular basis using a 15
N-labelled nitrate source would
be prohibitively expensive. Perhaps the best choice of methodology for high acid
conditions would be one that measures the anion concentration directly in the IL phase.
Anion determination in organic solvents has been performed primarily using modern IC
techniques [7.5, 7.6]. These usually involve the simultaneous analysis of various anions

195
(e.g., carboxylates, chloride, nitrate, sulfate) in water-miscible solvents such as alcohols,
ketones, dimethyl sulfoxide, and acetonitrile. The organic phase to be tested in the current
studies, however, is a water-immiscible solution of DCH18C6 in a hydrophobic IL.
Therefore, a water-miscible diluent will be evaluated for use as a sample diluent. The
details of this method development will be provided in the Methods section (7.2.3).
7.2 Experimental
7.2.1 Materials
All chemicals were reagent grade and used without additional purification, unless
noted otherwise. All aqueous solutions were prepared using deionized water with a
specific resistance of at least 18 MΩ·cm-1
. Strontium nitrate solutions were prepared from
the dried (110°C for at least 4 hours) salt (Aldrich, Milwaukee, WI) and diluted with
water to the appropriate concentrations. The DCH18C6 (Parish Chemical, Orem, UT)
employed was a mixture of the cis-syn-cis and cis-anti-cis isomers and was used as
received. The HPLC mobile phase buffer was prepared by combining equal parts 500
mM formic acid (puriss., Sigma-Aldrich, St. Louis, MO) and 500 mM ammonium
formate (J.T. Baker, supplied by VWR Chicago, IL) which resulted in a pH of 3.7. The
HPLC mobile phase was prepared by combining 10.0 mL of the formate buffer with 40.0
mL of water and 450 mL of acetonitrile (Honeywell Burdick and Jackson, HPLC grade,
supplied by VWR Chicago, IL) to produce a 10 mM buffer concentration in 90:10
acetonitrile:water for analysis. Ion chromatographic eluents were prepared from either
saturated sodium hydroxide solution (puriss., Fluka, Milwaukee, WI) or methanesulfonic
acid (puriss., Fluka, Milwaukee, WI). Methanol used as a diluent was HPLC grade,

196
manufactured by Honeywell Burdick and Jackson, and purchased from VWR Chicago,
IL. A strontium standard solution (J.T. Baker, INSTRA-ANALYZED®) was used to
determine (by IC) the concentration of strontium nitrate solutions. A 85
Sr radiotracer of
was purchased as a nominal solution from Eckert and Ziegler Isotope Products, Inc.
(Valencia, CA).
7.2.2 Instruments
Gamma spectroscopy was performed using a PerkinElmer model 2480 automatic
gamma counter equipped with WIZARD2 software. The HPLC system comprised a set
of Agilent 1200 series analytical binary pumps equipped with an online degasser, a fixed
loop manual injection port, and a variable wavelength UV-VIS flow cell, and
ChemStation software. The column was a 75 mm x 3.0 I.D. Agilent Zorbax HILIC Plus
silica column with 3.5 μm average particle size. The final conditions for HPLC analysis
were an isocratic flow rate of 0.800 mL min-1
with 10 mM ammonium formate buffer
(pH 3.7) in 90:10 acetonitrile:water. The column temperature was maintained at 30°C,
and the injection volume of 20 μL, and detection at 210 nm. Nitrate concentrations in the
IL phase were determined using a Dionex ICS-1000 ion chromatograph equipped with a
25 μL fixed-loop manual injection port, a conductivity detector, Dionex AS18/AG18
analytical and guard columns (4 X 250 and 4 X 50 mm), a Dionex ASRS 300 (4 mm)
conductivity suppressor, and 37 mM NaOH eluent. The instrument was operated using
Chromeleon software version 6.80. Strontium concentrations in water (before and after
extraction) were measured using the same ion chromatograph equipped with Dionex
CS12A analytical and CG12A guard columns (4 x 250 and 4 x 50 mm), and 30 mM

197
methanesulfonic acid eluent. IC eluent flow rates were 1.00 mL/min, and the column
temperature was maintained at 30°C.
7.2.3 Methods
Distribution ratios (DM) were determined as a ratio of the count rate in the organic
phase to that of the aqueous phase using commercial radiotracers, assayed via gamma
spectroscopy or liquid scintillation counting using standard procedures. In each metal
distribution experiment, the organic phase consisted of DCH18C6 dissolved in the
designated ionic liquid, and the aqueous phase nitric acid concentration was
systematically adjusted either by conducting separate experiments for each condition, or
adding acid after each condition had been sampled. Unless otherwise noted, acid
dependencies for metal extraction were performed at 0.1 M DCH18C6 in the organic
phase. All organic phases were pre-equilibrated with aqueous phase prior to the
introduction of the metal ions or radiotracer. Each equilibrated phase was sampled for
analysis in at least duplicate with resulting uncertainties based on counting statistics that
were generally within 10%, although the uncertainty interval was considerably wider for
the highest distribution ratios values (DM ≥ 1000). Additionally, for radiometric
measurements, the sum of the count rates in each phase yielded recoveries within 10% of
the radiotracer stock solution used, indicating that equilibrium was established with only
two phases involved. Nitric acid concentrations were determined by titration with a
standard sodium hydroxide solution (Ricca Chemical Company, Arlington, TX).
The concentration of anions in organic solvents was determined by the standard
addition method to avoid variability in elution and response due to matrix effects [7.6].

198
However, if the samples are sufficiently diluted in the same solvent as the standards, then
matrix effects will be minimal and direct external standardization may be employed.
Thus, the development of a method for the determination of the nitrate ion concentration
in the IL phase began by evaluating two different diluents for the IL phase: 30%
methanol or 50% acetonitrile in water. A 30% methanol diluent resulted in poor
chromatography and a lower response than desired. The lower limit of quantification
(LLOQ, calculated from the standard error of the estimate) using this composition was 2
ppm. By injecting blank 30% methanol it was determined that the large baseline
disturbance in Fig. 7.1 panel A was due to the interference band from elution of the
sample plug as it passed through the eluent suppressor. That is, the alcohol was being
electrolytically reduced in the suppressor. Acetonitrile was therefore explored as an
aprotic, less reactive alternative. Though an interference band was associated with
acetonitrile as well (Fig. 7.1 panel B), the baseline was significantly improved, leading to
a LLOQ of 0.2 ppm nitrate, ten-fold less than obtained with 30% methanol. In addition to
the favorable LLOQ, an RSD (n=4) of 3%, 101% recovery at 1.0 ppm for a sample of IL
diluted with 50% acetonitrile, and a calibration curve (0.1 ppm to 10 ppm) providing
good linearity (R2 > 0.999), all demonstrate that the method using 50% acetonitrile
diluent was sufficient to determine nitrate in the IL phase post-extraction.

Figure 7.1: Overlay of chromatograms from the injection of nitrate ion standards in (A) 30% methanol diluent and (B) 50%
acetonitrile diluent.
19
9

200
Samples were prepared by the following procedure. A solutions of 0.10 M DCH18C6
in C5C1imTf2N or neat C5C1imTf2N was preconditioned by vortex mixing with twice the
volume of water, disengaging the phases by centrifugation at 3000 rcf, and discarding the
aqueous phase to obtain the conditioned IL phase. Extraction was performed by vortex
mixing the conditioned IL phase with an equal volume of the appropriate aqueous
strontium nitrate solution, disengaging the phases by centrifugation at 3000 rcf, and
separating the phases for further sample processing. Nitrate determination in the IL phase
was performed by weighing 136.7 mg of the IL in a 10.00 mL volumetric flask (grade A)
and dissolving in acetonitrile. The IL sample was further diluted by 20-fold with 50%
acetonitrile in water before injection on the IC. The density of the IL phase post-
extraction was determined by averaging the weight of of four 0.100 mL aliquots taken
from the IL phase. The IC standard calibrators (0.1 ppm to 10 ppm nitrate) were prepared
by dilution of an standard nitrate solution (Fluka Analytical, TraceCERT®) in the 50%
acetonitrile diluent used for the sample. The aqueous phase was analyzed for C5C1im+ by
the HPLC-UV method provided in section 7.2.2, using a standard prepared from the dried
(80°C in vacuo ≥ 12 hours) IL synthesized in-house. Aqueous samples from the
extraction were diluted 10-fold in acetonitrile prior to injection on the HPLC. Extractions
without crown ether present were used to determine the innate solubility of the IL in the
aqueous phase, which was subtracted from the amount with crown ether present to
determine the increase in dissolution.

201
7.3 Measuring the contributions of two prominent pathways
7.3.1 Extraction of strontium from water by DCH18C6 in C5C1imTf2N
Using the HPLC-UV method (Chapter 5) and the ion chromatographic approach
described in section 7.2.3, the pathways contributing to the extraction of strontium nitrate
from water into C5C1imTf2N have been evaluated. Prior studies [7.7] on this system have
demonstrated that the aqueous solubility of the C5C1im+ ion increases with the extraction
of Sr2+
at a ratio consistent with the 2:1 stoichiometry in Eqn 7-1.
Sr DCH18C62+
+ 2 IL+
IL ⇋ Sr DCH18C62+
IL + 2 IL+ (7-1)
However, studies [7.2] of the co-extraction of nitrate under similar conditions have
shown that an amount of nitrate corresponding to approximately 10% of the amount of
strontium extracted is also transferred into the IL phase. Because the aqueous phase in
this case is a neutral solution of Sr(NO3)2, the electroneutrality requirement in this system
means that those nitrate ions must be accompanied by an equivalent of cations or that an
equivalent of anions from the IL phase must be transferred to the aqueous phase. In light
of the hydrophobicity of Tf2N and a lack of precedence for anion exchange or ion-pair
extraction via Tf2N in these systems [7.7], the explanation for the co-extraction of nitrate
from water into the IL phase must be that it is accompanied by an equivalent of Sr2+
via
the ion-pair partitioning pathway depicted in Eqn. 7-2.
Sr2+
+ 2 NO3- + DCH18C6IL ⇋ Sr(NO3)2 DCH18C6IL (7-2)

202
The plots in Fig. 7.2 depict the relationship between the aqueous phase concentration of
the IL cation following extraction of Sr2+
by DCH18C6 in C5C1imTf2N and the initial
aqueous phase concentration of Sr(NO3)2.
Figure 7.2: Effect of the initial concentration of Sr(NO3)2 (1-10 mM and 30-50 mM)
on the dissolution of C5C1im+ in water in the extraction of strontium by DCH18C6
(0.10 M) in C5C1imTf2N. Curves are linear least-squares fits. Error bars are the standard
error of the estimate for previous data [7.7] and based-on standard deviations (n=3) at the
95% confidence interval for the current data.
y = 1.3438x - 1E-05 R² = 0.9989
y = 1.350x - 0.004 R² = 0.989
0.000
0.010
0.020
0.030
0.040
0.050
0.060
0.070
0.080
0.000 0.010 0.020 0.030 0.040 0.050 0.060
[C5C
1im
] aq, M
[Sr2+]initial, M
Data from Dietz and Dzielawa [7.7]
Current data

203
Upon examination, it is immediately apparent that although the plots agree well with one
another, the observed slopes deviate from the value of 2 expected if the only partitioning
mode were that defined by Eqn. 7-1. In fact, they are approximately 33% lower than
anticipated – a difference that can only be attributed to the contribution from the neutral
complex/ion-pair partitioning mode (Eqn.7-2). The occurrence of both partitioning modes
in this system would not be unexpected given that the solubility of C5C1imTf2N in water
is 0.03 M [7.7] and the solubility of water in C5C1imTf2N is nearly 1 M (Chapter 4 Table
4.2), providing favorable conditions for ion exchange and ion pair extraction,
respectively.
7.3.2 Results for the determination of two contributions by subtraction
Emerging from these insightful results is a question: How much of each pathway is
involved? To resolve this question, one must examine, if possible, the equilibrium
concentrations of the species associated with each process, or determine the amount of
one process that is measureable and subtract that contribution from the total metal ion
extraction to attain the other. Therefore, the values to be measured in the system at hand
are the overall Sr2+
extraction (total by gamma spectroscopy), the IL cation solubilization
in the aqueous phase (ion exchange, by HPLC-UV), and nitrate co-extraction (ion-pair,
by IC). Note that they must be considered over a range of Sr(NO3)2 concentrations that do
not approach the capacity of the available DCH18C6 ligands in the IL phase. By
comparing the amount of ion exchange of the IL cation or the amount of nitrate extracted
into the IL to the total Sr2+
extracted, their relative contributions can be determined. In
the present experiment, the contribution from ion-pair extraction based on the equilibrium

204
nitrate concentration in the IL phase was subtracted from the total Sr2+
extracted to
estimate the contribution from ion exchange. The system of Sr2+
extraction from water
was chosen for this study because one should be able to arrive at a similar result by the
subtraction of the ion exchange component from the total extraction, yielding an estimate
of the contribution from ion-pair extraction.
Table 7.1 provides the results for the determination of the total Sr2+
extraction from
7.90 mM Sr(NO3)2 into 0.10 M DCH18C6 in C5C1imTf2N, the theoretical metal-nitrato
complex extraction contribution, and the contribution of ion exchange predicted from
difference of ion pair from the total. Included for comparison, is the contribution from ion
exchange determined by the excess dissolution of the IL cation in the aqueous phase upon
extraction.
Table 7.1
Relative contributions from ion exchange and ion pair partitioning to the
extraction of strontium ions from water into 0.10 M DCH18C6 in C5C1imTf2N
Total Sr2+
Extraction a
DSr-85 with 7.9 mM
Sr(NO3)2 %ESr Total Sr2+
(IL), mM
125 ± 6 99.2% 7.86 ± 0.4
Contribution from Ion Pair Extraction a
[NO3-]IL, mM Theoretical Sr
2+ Extracted %ESr by ion pair
6.18 ± 0.2 3.1 ± 0.09 40 ± 4%
Percent Contribution from Ion Exchange a
%ESr by difference from ion-pair Based on [C5C1im+]aq (HPLC-UV)
60 ± 5% 67 ± 5% a Uncertainties reported are for the sum of error from instrumental analysis and standard
deviations of four replicates for each measurement at the 95% confidence interval
205
The estimation of the influence of ion exchange based on the determination of the
nitrate co-extracted into the IL is in reasonable agreement with the value determined
directly by the measurement of the excess dissolution of C5C1im+ in the aqueous phase.
That the measurements of the percent contributions to Sr2+
extraction resulted in
uncertainties on the order of that expected (± 10%) for these techniques, is encouraging.
Still, how the 40% of extraction from the ion pair pathway is the missing fraction which
led to the lower slopes of the plots in Fig. 7.2 is not initially evident. To make this
assessment, the plots in Fig. 7.3 are the best fit curves for the dissolution of C5C1im+ and
that which has been adjusted by 40% extraction, both with respect to all amounts of
strontium extracted into the IL phase. The adjusted values of [C5C1im+]aq result in a slope
(1.93) that is within 3% of that expected for the second order reaction in Eqn. 7-1. This
result verifies the accuracy of the method for the determination of the contributions by
subtraction of one partitioning mode from the other.

206
Figure 7.3: The effect of strontium extraction by DCH18C6 (0.10 M) in C5C1imTf2N
on the dissolution of C5C1im+ in the water. Plot symbols represent () for the
[C5C1im+]aq from ion exchange only and () for the [C5C1im
+]aq + the contribution from
ion pair extraction. Curves are linear least-squares fits. Error bars based-on standard
deviations (n=3) at the 95% confidence interval for the current data.
y = 1.9337x - 0.0001 R² = 0.9961
y = 1.3817x - 0.0001 R² = 0.9961
0.000
0.005
0.010
0.015
0.020
0.025
0.000 0.002 0.004 0.006 0.008 0.010 0.012
[C5C
1im
+] a
q,
M
[Sr2+]IL, M

207
7.4 Conclusions
The methodologies introduced in this study represent the first efforts to establish the
relative contributions of the various metal ion extraction pathways involving IL solvents.
A new method for the direct determination of nitrate co-extraction into the IL phase has
been developed and shows promise to provide a means to measure the contribution from
ion pair extraction. The conditions chosen for this experiment were such that either ion
exchange or ion pair extraction could be determined independently. However, that the
results are comparable from each approach by difference from the total %ESr, indicates
that similar techniques may be used for analysis of highly acidic conditions, for which the
amount of nitrate extraction from conditioning must be accounted. The HPLC-UV
method for IL cation quantification has again proven to be quite useful, and is expected to
perform very well with samples from highly acidic media, because nitrate is not
appreciably retained on the column. By subtracting the contributions to total Sr2+
extraction from the ion pair and ion exchange pathways shown here, it is anticipated that
the influence from the pathway of crown ether-mediated ion exchange may be elucidated.
Studies to determine if this approach will work in actual practice are currently underway.

208
7.5 References
[7.1] E.P. Horwitz, M.L. Dietz, D.E. Fisher, Solv.Ext. Ion Exch. 1990, 8, 199-208.
[7.2] M.L. Dietz, J.A. Dzielawa, I. Laszak, B.A. Young, M.P. Jensen, Green Chem. 2003,
5, 682-685.
[7.3] C.A. Hawkins, S.L. Garvey, M.L. Dietz, Sep. Purif. Technol., 2012, 89, 31-38.
[7.4] E.M. Burke, F. X. Suarez, D.C. Hillman, E. M. Heithmar, Water Res. 1989, 23,519-
521.
[7.5] G.M Sergeev, M.S Blinova, J. Chrom. A. 1999, 847, 345-349.
[7.6] Determination of Trace Anions in Organic Solvents, DIONEX Application Note 85,
http://www.dionex.com/en-us/webdocs/4173-AN85_LPN0482-03.pdf, accessed on
07 November 2012.
[7.7] M.L. Dietz, J.A. Dzielawa, Chem. Commun., 2001, 2124-2125.

209
CHAPTER 8:
EFFORTS TOWARD IMPROVED METAL ION EXTRACTION SYSTEMS
BASED ON IONIC LIQUIDS
8.1 Introduction
This research program has its origins in the belief that new metal ion separation
systems based on RTILs could succeed in providing significantly greater extraction
efficiency and selectivity for elements of interest (i.e., strontium) than conventional
solvents. This is, in fact, what has generally been found to hold true under various
conditions in the extraction of Sr2+
from aqueous acidic nitrate media by crown ethers in
sufficiently hydrophobic ILs [8.1]. For example, employing 0.10 M DCH18C6 in
C10C1imTf2N at 2 M to 3 M nitric acid, the Sr2+
extraction efficiencies and the
selectivities for Sr2+
versus Na+ are approximately 5-fold greater than those in 1-octanol
(8.1, Chapter 3]. Similar, but more gainful conditions are provided by C12OHC4imTf2N,
in which the extraction efficiencies are 5- to 15-fold those of 1-octanol and selectivities
of Sr2+
versus Na+ are close to 5-fold those in 1-octanol, all other conditions being the
same [8.2, Chapter 4]. Such improvements in solvent extraction behavior using ILs have
the potential to substantially increase the capacity and throughput of practical Sr-selective
extraction systems. Moreover, the advantages of using ILs over paraffinic alcohols
include their non-volatility, non-flammability, and the structural flexibility allowing
facile modification of certain of their physicochemical properties. On the basis of what
we now know about the behavior of ILs as extraction solvents for metal ions, the current
studies attempts have been made to assess the feasibility of employing ILs as the basis for
practical extraction media.

210
8.2 Experimental
8.2.1 Materials
All chemicals were reagent grade and used without additional purification, unless
noted otherwise. All aqueous solutions were prepared using deionized water with a
specific resistance of at least 18 MΩ·cm-1. Dicyclohexano-18-crown-6 ether (DCH18C6)
was purchased from Parish Chemical (Orem, UT) as a mixture of the cis-syn-cis and cis-
anti-cis isomers. 4,4',(5')-di(tert-butyl-cyclohexano)-18-crown-6 (DtBuCH18C6) was
obtained from EiChroM Technologies, Inc. (Lisle, IL). The 4z,5’z-cis-syn-cis-DtBu18C6
isomer has been isolated by A. Pawlak via precipitation with perchloric acid. Strontium
nitrate solutions were prepared from the dried (110°C for at least 4 hours) salt (Aldrich,
Milwaukee, WI). The strontium-85 and sodium-22 radiotracers wre purchased as nominal
solutions from Eckert and Ziegler Isotope Products, Inc. (Valencia, CA). Ion
chromatographic eluent was prepared from methanesulfonic acid (puriss., Fluka,
Milwaukee, WI). A strontium standard solution (J.T. Baker, Instra-Analyzed®) was used
to determine (by IC) the concentration of strontium nitrate solutions. Solutions of
DtBuCH18C6 in ILs were prepared by weighing the material into a 2 mL volumetric
flask, adding a portion of the IL, and heating in an oven to 110 °C to dissolve the crown
ether. The heated solution was then centrifuged in the flask to bring the liquid level below
the mark and cooled to room temperature. The solution was then brought to the mark,
heated if necessary, and mixed thoroughly. Ionic liquids were synthesized as Tf2N salts
according to the procedures reported in Chapter 4. Magnetic ILs were prepared from the
chloride salts according to procedures previously reported [8.4, 8.5].

211
8.2.2 Instruments
Gamma spectroscopy was performed using a PerkinElmer model 2480 automatic
gamma counter equipped with WIZARD2 software. Strontium concentrations for the
determination of strontium nitrate stocks and extraction chromatographic column
capacity were measured using a Dionex ICS-1000 ion chromatograph equipped with a 25
μL fixed-loop manual injection port, a CSRS 300 cation self-regenerating eluent
suppressor, a conductivity detector, Dionex CS12A analytical and CG12A guard columns
(4 X 250 and 4 X 50 mm), using a 30 mM methanesulfonic acid eluent. IC eluent flow
rates were 1.50 mL/min, and the column temperature was maintained at 30°C. The
instrument was operated using Chromeleon software version 6.80.
8.2.3 Methods
Distribution ratios (DM ) were determined as the ratio of the count rate in the organic
phase to that of the aqueous phase using commercial radiotracers. Assays were carried
out via gamma spectroscopy using standard procedures. In each metal ion distribution
experiment, the organic phase consisted of crown ether dissolved in the designated ionic
liquid, and the aqueous phase nitric acid concentration was systematically adjusted either
by conducting separate experiments for each condition, or adding the appropriate amount
of acid after each sampling. All organic phases were pre-equilibrated with aqueous phase
prior to the introduction of the metal radiotracer. Additionally, the sum of the count rates
in each phase yielded recoveries within 10% (most often < 10%) that of the radiotracer
stock solution used, indicating that equilibrium was established with only two phases
involved. Room temperature was maintained at 23 ± 2°C. Each equilibrated phase was

212
sampled for analysis in at least duplicate, with resulting uncertainties based on counting
statistics that were generally within 10%, although the uncertainty interval was
considerably wider for the highest DM values (DM ≥ 1000). Nitric acid concentrations
were determined by titration with a standard sodium hydroxide solution (Ricca Chemical
Company, Arlington, TX).
Preparation of crown ether loaded Amberchrom CG-7lm (hereafter referred to as
resin), began with the treatment of the crude resin (Rohm & Haas, Philadelphia, PA) to
remove all traces of preservatives and unreacted monomer. From the ethanol slurry
received, a portion was decanted and the polymeric beads were soaked for 12 hours in
distilled water. The material was then washed several times with water through a vacuum
filter assembly, followed by methanol washes until the filtrate was no longer turbid. The
washed material was transferred to a round-bottom flask using methanol and the solvent
removed by rotary evaporation. Once purified, the resin (1.20 g) was slurried in
methanol, and 0.800 g of a 1 M solution of DtBuCH18C6 in 1-octanol, C10C1imTf2N, or
C12OHC1imTf2N was added. The resulting mixture was gently stirred for several minutes.
The methanol was then removed under vacuum at 40 °C to yield ca. 2 g of the crown
ether loaded resin. If the material showed signs of bead aggregation (i.e., clumping), then
methanol was added to create a slurry and the process was repeated until a free-flowing
dry powder was obtained. All resins were prepared using the same lot (EIChroM, EXP
336) of DtBuCH18C6.
Weight distribution ratios (Dw) were determined radiometrically using commercial
radiotracers. Dw is defined by Equation 2-1. Each Dw value is the average of at least three
replicates with resulting uncertainties based on counting statistics that were generally

213
within 10%. Weight distribution experiments of resins were performed as batch tests by
contacting known weights of the dry resin (20-25 mg accurately weighed to ± 0.1 mg)
with 1.00 mL of a radiotracer spiked acid solution in glass culture tubes. The resin beads
were suspended in the solution by gently plucking the tubes periodically and allowing
them to soak for at least 30 minutes. Resin beads that remained suspended after standing
were settled by centrifugation. A portion of the supernatant was filtered through 0.45 μm
polypropylene filters to remove microparticles. Aliquots of the 100 μL were transferred
to gamma counting tubes and assayed via gamma spectroscopy using standard
procedures.
Measurements of resin capacities were made using resins prepared from 1.0 M DtBuCH18C6
in 1-octanol and 0.60 M DtBuCH18C6 in C10C1imTf2N. The former was loaded, as the
commercial resin, at 40% (w/w) in the beads, and the latter was loaded at 47.3% (w/w) so
as to compensate for the difference in solution densities (i.e., 0.882 g/mL and 1.187
g/mL, respectively), and apply the same volume into the resin pores. The resin beds were
prepared in Invitrogen Quick Gel Extraction Columns (Grand Island, NY, lot 0348). The
empty columns were weighed and resin filled to a mark at 0.40 mL. Then they were
weighed to determine the amount of dry resin in the bed, which was used to calculate the
theoretical capacities. The resulting dry column bed densities were 0.30 g/mL and 0.37
g/mL for the 1-octanol resin and the C10C1imTf2N resin, respectively. These values
compare well with the value of 0.35 g/mL noted by the manufacturer of the commercial
resin. A stock of 0.5 M strontium nitrate in 3.0 M HNO3 was prepared for metal loading
the columns. The columns were conditioned with 3 column volumes of 3.0 M HNO3.
Loading of the strontium nitrate solution was set to ½ of the bed volume (0.20 mL).

214
Washes with 3 column volumes of 3.0 M HNO3 were collected for analysis to ensure that
the removal of unbound Sr2+
was complete. Elution was performed with 3 column
volumes of water. These eluate samples were evaporated and reconstituted in water to
prepare for analysis by ion chromatography. The stock solution, rinsate, and eluate
samples were sufficiently diluted with water prior to analysis in triplicate. Figure 8.1 is a
detailed flow chart of this procedure.

Figure 8.1: Flow chart of the procedure used to determine extraction chromatographic resin capacity.
Pack 0.40 mL column beds (dry wt. basis)
Condition with 3 column volumes (C.V.) 3
M HNO3. Stop liquid at bed height.
Load 0.200 mL 0.5 M Sr(NO3)
2 in 3 M HNO
3,
let stand for 2 hours
Wash interstices with 3 C.V. 3 M HNO3,
and collect all liquid
Elute with 3 C.V. DI water and collect
Evaporate samples
Reconstitute in 5.00 mL DI water
Dilute by 40x with water for analysis
Sr2+
determination by IC
215

216
8.2 Solvent Extraction
8.2.1 Conventional ionic liquid solvents
To explore the possibility of combining conventional extractants with the enhanced
extraction found utilizing IL solvents, a set of experiments was performed comparing
solvent extraction results using DCH18C6 with those obtained for DtBuCH18C6
(4,4',(5')-di(tert-butyl-cyclohexano)-18-crown-6), whose increased hydrophobicity
reduces loss of the ligand to the aqueous phase [8.6]. Of particular interest is the question
of whether the enhanced extraction efficiency and selectivity (versus 1-octanol) of
divalent Sr2+
over monovalent metal ions (e.g., Na+) would be preserved in the
DtBuCH18C6 system. Figure 8.2 compares the nitric acid dependency of DSr and DNa in
a solvent extraction system comprising the 4z,5’z-cis-syn-cis-isomer of DtBuCH18C6
(structure shown in Fig. 8.2) in 1-octanol or C10C1imTf2N to that obtained using
DCH18C6. As shown in Fig. 8.3, the general trend of increasing DSr with nitrate
concentration for Sr2+
extraction is observed in both solvents, consistent (as expected)
with neutralcomplex/ion-pair extraction. Also apparent is that the DSr values are 10-fold
greater in the extraction by 4z,5’z-cis-syn-cis-DtBuCH18C6.
Figure 8.2: Structure of 4z,5’z-cis-syn-cis-di(tert-butyl-cyclohexano)-18-crown-6.

217
Figure 8.3: Effect of nitric acid concentration on the extraction of Sr2+
into () 1-
octanol, () C10C1imTf2N, and () C12OHC4imTf2N and Na+ into () 1-octanol and
() C10C1imTf2N by 0.10 M 4z,5’z-cis-syn-cis-DtBu18C6 (left panel) and 0.10 M
DCH18C6 (right panel). The smooth curves are intended only as a guide to the eye.
Though the DSr for this isomer in 1-octanol has been predicted to be comparable to that of
cis-syn-cis-DCH18C6, based on calculations from binding reorganization energies [8.7],
the greater hydrophobicity of this ligand compared to that of DCH18C6 apparently leads
to higher distribution ratios. The DSr at 2 M to 3 M acid for C12OH4imTf2N is 1.5 to 2-
fold higher than that for C10C1imTf2N, which is 2.5 to 4-fold higher than that for 1-
octanol, while the Sr/Na separation factors are only 1.5 to 2 times those in 1-octanol.
Both of these parameters are somewhat less than the gains observed using the DCH18C6

218
extractant. Extraction of Sr2+
into C12OHC4imTf2N by DtBuCH18C6 appears to respond
more to changes in acidity than it does when extracted by DCH18C6, which may provide
more efficient extraction (at high acid) and stripping (with dilute acid). Although the
shapes of the acid dependencies for Sr2+
extraction into C10C1imTf2N are the same with
both extractants, the same cannot be said for Na+ extraction. For the extraction of sodium
in the DCH18C6/IL system, a dependency exhibiting a significant downward slope is
observed, which has been attributed to the effect of the crown ether-mediated ion
exchange pathway with increasing acid [8.8]. In contrast, the acid dependency of Na+
extraction by 4z,5’z-cis-syn-cis-DtBu18C6 in C10C1imTf2N is relatively flat until ca. 2 M
HNO3, suggesting that this pathway is less prominent in the DtBuCH18C6/IL system.
Because the curve does not show dependence on nitrate concentrations, is likely that the
dominant partitioning pathway associated with the extraction of Na+ by DtBuCH18C6 in
C10C1imTf2N involves the exchange of the IL cation for the cationic complex. Also noted
is that the sodium acid dependency in DCH18C6/1-octanol rolls over at high acidity to a
greater extent than in the DtBuCH18C6 system, suggesting that competition from the
acid for ligand binding is much more marked in the DCH18C6 system. In fact, all of
these general differences in trends are consistent with a lesser propensity to extract acid
by DtBuCH18C6 than by DCH18C6. In any event, solvent extraction employing
DtBuCH18C6 in the C10C1imTf2N solvent under these conditions displays significant
improvements over 1-octanol.

219
8.3.2 Feasibility of magnetic ionic liquids as solvents
Another class of ionic liquids that has sparked interest in various applications is that
based on tetrahedral transition metal anionic complexes (e.g., tetrahaloferrate(III)) [8.4,
8.5, 8.9-8.12]. Owing to the presence of high-spin d5 metal ions in these compounds, they
tend to display observable ferromagnetism [8.9, 8.11], and therefore, can be manipulated
using strong magnets. Combining the demonstrable gains in metal ion extraction
efficiency and selectivity using IL solvents with the ability to control them by applying a
magnetic field is an attractive prospect. Although it has been reported that
tetrahaloferrate(III) anions, for instance, are stable in aprotic solvents, in amphiprotic
solvents they undergo dissociation due to the formation of stronger hydrogen bonds with
the solvent [8.10, 8.13]. To explore whether or not this would preclude their use in metal
ion extraction systems, a series of magnetic ILs were synthesized and tested for their
ability to withstand contact with aqueous solutions.
The first such compound to be examined was [P666,14][FeCl4], because of the
availability of large quantities of the [P666,14][Cl] precursor. The neat [P666,14][FeCl4] IL
was contacted with aqueous solutions of nitric acid, hydrochloric acid, and aluminum
nitrate over a range of ionic strength, the results of which are shown in Fig. 8.3. It was
anticipated that nitric acid would probably lead to decomposition of the IL anion, but that
by using hydrochloric acid, the dissociation would be mitigated by the common-ion
effect. This turned-out not to be the case, however, as the IL showed signs of
decomposition at an acid or salt concentration on the order of 0.1 M.

220
Figure 8.4: Photos of the results from contacting [P666,14][FeCl4] with various
aqueous solutions. The conditions are from left to right: water, 0.01 M, 1 M, and 6 M
nitric acid (top panel), water 0.08 M, 0.8 M, 3 M, and 6 M HCl (middle panel), and
water, 0.25 M, and 1 M Al(NO3)3 (bottom panel).

221
As an alternative, 1,3-dialkylimidazolium salts were examined, because hydrogen-
bond interactions with organic cations have been reported to stabilize the anion [8.13,
8.14]. Similar results were obtained by contacting [C10C1im][FeCl4] (not shown) and
[C10C1im]2[Co(NCS)4] (Fig. 8.5). The latter, tetraisothiocyanatocobaltate(II) salt, is an
ink-like liquid [8.5] that could provide enhanced extraction kinetics, were it to prove
stable under the conditions of the extractions. Nevertheless, these compounds turned-out
to be similarly labile, indicating that the tetrahedral high-spin transition metal complex
class of magnetic ILs will not support the conditions necessary to perform metal ion
extraction. It may be possible that more stable cage-like complexes with larger ligands
could protect the labile ion. However, there were ample opportunities to perform
interesting, fundamental studies on non-magnetic ILs. Therefore, this line of research was
abandoned.
Figure 8.5: Photo of the results from contacting [C10C1im]2[Co(NCS)4] with (from
left to right) water, 0.1 M HNO3, 1 M HNO3, 4 M HNO3.

222
8.4 Extraction Chromatographic Materials
8.4.1 Ionic Liquid-based Sr-selective resin
The results of studies utilizing DtBuCH18C6 in C10C1imTf2N for the solvent
extraction of Sr2+
and Na+ (representative alkaline earth and alkali metal ions,
respectively) demonstrated that significant improvements to the commercial resin (Sr
resin) might possibly be achieved simply by replacing the solvent (1-octanol) with an IL.
To investigate this prospect, resins incorporating 40% (w/w) of a 1.0 M solution of
DtBuCH18C6 in 1-octanol, C10C1imTf2N, or C12OHC4imTf2N were prepared and
evaluated for metal ion uptake. Figure 8.6 is a plot of the nitric acid dependencies of the
weight distribution of Sr2+
on these resins. Immediately apparent in these plots is the
reduced extraction provided at high acidity by the resins comprising IL versus the
conventional material. It is also important to note how the acid dependencies of
extraction into the IL, is less steep than that for 1-octanol, which is also observed in
liquid-liquid extraction and is consistent with variations in the composition of the
extracted complexes [8.15]. Additionally, there is essentially no difference between the
Dw values of the dialkyl IL and the hydroxylated IL, whereas in the solvent extraction
systems, the extraction of Sr2+
was at least 1.5-times greater with the hydroxylated
analog.
Theoretically, as long as the extraction mechanisms of the two systems are the same,
then the translation of solvent extraction media to the solid support of a resin should be
straightforward [8.15]. However, several possible issues could give rise to the difference
in results from those obtained from solvent extraction, barring any noticeable change in
partitioning pathway. First, solvent extraction does not always correlate with extraction

223
chromatographic materials due to differences observed in the availability of the ligand in
the solid support. For perspective on this matter, the Stokes-Einstein equation [8.16]
relates diffusion coefficients of solutes to the viscosity of the medium by an inverse
proportionality. Consequently, the diffusion of solutes into the pores of the beads can be
diminished by higher viscosity of the solution impregnated therein. The viscosities of the
neat solvents can provide reasonable estimates of the differences in viscosity observed by
the metal ions or complexes, once they have transferred to the IL side of the interface. At
standard temperature and pressure, the viscosity of 1-octanol is 7.2 cP [8.17], whereas
that of a typical IL can be on the order of 300-1000 cP [8.18]. This relation of solute
diffusion and viscosity may also provide insight into how the ligand can be sequestered
by the less mobile IL. Indeed, the provision of a transport path for solutes to interact with
the ligand may be quite difficult, requiring that the large IL ions translate or rotate when
in fact they are in a highly ordered state dictated largely by coulombic attractions.

224
Figure 8.6: Effect of nitric acid concentration on the batch test uptake of strontium
by resins prepared with 1.0 M DtBuCH18C6 in 1-octanol, C10C1imTf2N or
C12OH4imTf2N.

Table 8.1
Effect of DtBuCH18C6 concentration in C10C1imTf2N and 1-octanol on the solvent extraction of Sr2+
from 1.0 M HNO3
[DtBuCH18C6], M
Mole Ratio
(IL:crown ether) IL Phase Observations DSr
0.25 8.0 cloudy, but phase disengaged 25.1
0.40 cloudy, but phase disengaged 34.5
0.50 3.5 cloudy, but phase disengaged 43.2
0.60 cloudy, but phase disengaged 47.9
0.75 cloudy, but phase disengaged 33.1
1.0 1.2 crown ppt'd resulting in phase ambiguity not measured
[DtBuCH18C6], M
Mole Ratio
(octanol:crown ether) Organic Phase Observations DSr
0.25 22 clear after 1st contacts 8.7
0.50 9.4 clear after 1st contacts 15.1
0.75 5.4 clear after 1st contacts 19.4
1.0 3.1 clear post-equilibrium 26.5
225

226
Of course, the solvent extraction experiments were performed using solutions of 0.1
M DtBuCH18C6, which is ten-fold less than was applied to the resin. It is possible that
the solubility of the crown ether in ILs diminishes or the nature of the complex extracted
changes when exposed as a thin layer within the pores of the beads. Solubility represents
another possible source of the low Dw values obtained with ILs. In a follow-up
investigation, it was determined that the mole ratios of the 1-octanol:crown ether and
IL:crown ether differ significantly, due to the different molar volumes of the respective
solvents. Table 8.1 provides an assortment of data from extractant dependency
experiments performed from 0.25 M to 1.0 M DtBuCH18C6. When the crown ether
concentration reaches 1 M, the mole ratio of IL to crown ether approaches 1:1, while for
1-octanol it is 3:1. A combination of the extractant and the ionic liquid is therefore more
likely to behave like the crown ether itself than a 1-octanol solution at the same
concentration. When combined with a significant drop in DSr with increasing
[DtBuCH18C6], and the observation that the crown ether precipitates from the 1.0 M
solution in C10C1imTf2N upon mixing with acid, these results point to a distinctive
composition issue for high molar mass solvents like ionic liquids. A graphical
representation (Fig. 8.7) of the extractant dependencies in Table 8.1 clearly shows how
the IL significantly outperforms 1-octanol in solvent extraction near the point (0.6 M
DtBuCH18C6) that the acid contacted IL phase becomes unstable, as indicated by the
observations of the crown ether precipitation (Table 8.1).

227
Figure 8.7: Effect of DtBuCH18C6 concentration on extraction of strontium from 1
M HNO3 into 1-octanol and C10C1imTf2N.
This crown ether concentration (0.60 M) is interpolated to yield a mole ratio with the IL
of ca. 3:1 (IL:ligand), which coincides with that for the 1-octanol solution at 1.0 M crown
ether.

228
Further investigation has revealed that, while 1 M HNO3 will precipitate the 1.0 M
crown ether from C10C1imTf2N, water will lead to a precipitate only after contact has
been sustained overnight. Taken together, these observations suggest that, upon contact
with acid, it is the crown ether-acid adduct (most likely with hydronium ion) that is most
insoluble in the IL in the presence of acid. This is not entirely unexpected; in fact, this
same process is used to isolate individual isomers from commercial preparations of
DtBuCH18C6, by selectively precipitating the acid adducts from with various
concentrations of strong acid in contact with n-hexane [8.19]. As a possibly related
matter, ionic liquids comprising long alkyl groups have been studied spectroscopically,
revealing that the hydrophobic side chains and the polar head groups tend to pack in
nanostructural domains, providing pockets with vastly different degrees of polarity [8.20-
8.22]. Therefore, the hydrophobic domains would likely resemble a long aliphatic alkane,
not unlike hexane. Interestingly, precipitation from contacting the 1.0 M DtBuCH18C6 in
C12OHC4imTf2N mixture with 1 M HNO3 is much more subtle at first, and then proceeds
to the extent observed for C10C1imTf2N after standing overnight. This might suggest that
slower shifts in reorganization of the ions in the hydroxyl functionalized ILs provides,
temporarily, a better solvation environment for the acid adduct. Considering that dyes
dissolved in C2OHC1imTf2N have been explored by time-resolved fluorescence
demonstrating slower rotation and solvation dynamics associated with hydrogen bond
interactions with the IL cation [8.23], it is plausible that this slower change in
C12OHC4imTf2N can be viewed from this same perspective. Although ILs composed of
dicyanamide [8.24] and tetraisothiocyanatometalate [8.5] anions have proven to be much
more mobile than their Tf2N- and PF6
- counterparts, as of yet, there are no chemically

229
stable ILs possessing both the substantial hydrophobicities and low viscosities that may
be required. Likewise, there have been no reports of the use of co-solvents or modifiers
that could reduce the viscosity substantially without adversely impacting the solvation
effects of the IL.
8.4.2 Application to column chromatography
As an essential parameter of effective extraction chromatographic media, capacity is
directly related to the availability of the active ligand and the formation of the extracted
complex. Based on the batch tests of the resins prepared from ILs, they evidently have a
significantly lower capacity than those prepared with the same formal concentration of
crown ether in 1-octanol. But, by how much do the two resins differ in this respect?
While the evidence is circumstantial, the crown ether solution stability would be expected
to have an impact on the behavior of an IL-based Sr-selective resin. One likely scenario is
that the aqueous solution contacts the stationary phase at the entrance of pores, and upon
precipitation the solid ligand prevents the diffusion of solutes past that threshold,
effectively reducing capacity. Then, there is the matter of the crown/IL solution viscosity.
Upon dissolution the material that once was a pure ionic liquid, mobile enough to
dispense by pouring, becomes a rigid liquid, requiring elevated temperatures to facilitate
mixing and transfer. Both of these behaviors will significantly limit the accessibility of
the larger pore volume. In all likelihood, both of these behaviors are at the heart of the
matter with lower-than-expected Dw values. Measurements of capacity can be made by
applying the resins to a column configuration and performing the extraction on a bed of
known density and composition. The procedure employed for the determination of resin
capacity is provided with a flow chart (Fig. 8.1) in the Methods (section 8.2.3). With the

230
knowledge that the resins prepared using 1 M DtBuCH18C6 in IL will more likely result
in crown ether precipitation, the latest version of the resin contained a 0.6 M solution in
C10C1imTf2N (see Table 8.1), so as to isolate the effect that solution viscosity may have.
Table 8.2 presents the results of the capacity measurements. The recoveries were
quantitative, based on the sum of the rinsates and eluates compared to the stock solution.
The capacity of the octanol resin was in agreement with the literature value (75%) [8.25]
for Sr resin. Given that the IL-based resin capacity was 17% less than that of the
commercial resin, and that crown ether precipitation was not expected at this
concentration, lower accessibility of the pore volume due to the viscosity of the IL
solution is proposed as a likely source of the disparity between the resins. However, this
figure may not account for all of the differences observed in the batch tests.
Table 8.2
Results of the column capacity measurements of resins
Sample Sr2+
Amount Theoretical
Capacity
%Capacity /
%Recovery
Uncertainty
Octanol Eluate 3.51 mg 4.74 mg 74.2% capacity 1.6%
Octanol Rinsate 5.05 mg 98.8% recovery 3.5%
IL Eluate 1.78 mg 3.74 mg 57.3% capacity 1.4%
IL Rinsate 6.88 mg 99.9% recovery 3.1%
0.5 M Sr(NO3)2
Stock 0.4948 M 0.008 M

231
8.5 Conclusions
The studies reported here have provided an improved understanding of the
advantages and limitations of metal ion extraction systems based on ILs. Increases
observed in the divalent metal ion (i.e., Sr2+
) extraction efficiency and selectivity over
monovalent metal ions (i.e., Na+), versus that of conventional solvents may offer distinct
advantages in current processes. As the basis of liquid-liquid extraction media, ILs may
find a niche, particularly in processes that involves elevated temperatures, which decrease
the viscosity of the IL solutions without the risk of volatilization of the solvent. One such
process where the volatility or flammability of a solvent may pose an extreme hazard
would be in the reprocessing of spent nuclear fuel (e.g., SREX) [8.26]. Moreover, if the
enhanced extraction behavior can be exploited at half the typical ligand concentrations,
then there may be some cost benefit to employing ILs (provided, of course, that these
solvents can eventually be prepared cheaply and on a large scale. Despite the
improvements observed in liquid-liquid extraction, the outlook for analytical-scale
radiochemical separations is not as promising. When impregnated on a porous solid
support, IL-extractant mixtures behave quite differently. The physicochemical basis for
disparity between the results for solvent extraction and extraction chromatographic resins
based on ILs appears to be the result of several factors (i.e., viscosity, solution stability).
Results of studies investigating the possible causes suggest that both crown ether/IL
solution stability and viscosity play a critical role in limiting the diffusion of solutes into
the pore volume essential for retention and column capacity. Ultimately, the outcome of
the resin studies suggest that it is unlikely that strontium-selective extraction

232
chromatographic materials comprising crown ethers dissolved ILs will be a viable
alternative to those already on the market.
8.6 References
[8.1] C.A. Hawkins, S.L. Garvey, M.L. Dietz, Sep. Purif. Technol., 2012, 89, 31-38.
[8.2] C.A. Hawkins, A. Rud, S.L. Garvey, M.L. Dietz, Sep. Sci. and Technol.
10.1080/01496395.2012.697527, 27 June 2012.
[8.3] E.P. Horwitz, M.L. Dietz, D.E. Fisher, Solv.Ext. Ion Exch. 1990, 8, 199-208.
[8.4] R.E. Del Sesto, T.M. McCleskey, A.K. Burrell, G.A. Baker, J.D. Thompson, B.L.
Scott, J.S. Wilkes, P. Williams, Chem. Commun., 2008, 447–449.
[8.5] T. Peppel, M. Köckerling, M. Geppert-Rybczyńska, R.V. Ralys, J.K. Lehmann, S.P.
Verevkin, A. Heintz, Angew. Chem. Int. Ed. 2010, 49, 7116 –7119.
[8.6] E.P. Horwitz, M.L. Dietz, D.E. Fisher, Anal. Chem. 1991, 63, 522-525.
[8.7] Communication from Benjamin P. Hay, Oak Ridge National Laboratory, 2006.
[8.8] M.L. Dietz, D.C. Stepinski, Green Chem. 2005, 7, 747–750.
[8.9] S. Hayashi, H. Hamaguchi, Chem. Soc. Jap. Chem. Let., 2004, 33, 1590-1591.
[8.10] D. Wyrzykowski, A. Pattek-Janczyk, T. Maniecki, K. Zaremba, Z. Warnke,
Thermochimica Acta, 2006, 443, 72–77.
[8.11] S.H. Lee, S.H. Ha, S-S. Ha, H-B. Jin, C-Y You, Y-M. Koo, J. Appl. Phys., 2007,
101, 09J102.
[8.12] J. Wang, H. Yao, Y. Nie, L. Bai, X. Zhang, J. Li, Ind. Eng. Chem. Res. 2012, 51,
3776−3782.
[8.13] U. Bentrupa, M. Feistb, E. Kemnitz, Prog. Solid State Chem. 1999, 27, 75-129.
[8.14] P.B. Hitchcock, K.R. Seddon, T. Welton, J. Chem. Soc. Dalton Trans. 1993, 2639-
2643.
[8.15] T.Braun and G. Ghersini, Extraction Chromatography, Journal of
Chromatography Library Vol. 2, Elsevier, New York, 1975.

233
[8.16] C. C. Miller, Proceedings of the Royal Society of London. Series A, Containing
Papers of a Mathematical and Physical Character, 1924, 106, pp. 724-749.
[8.17] S. Matsuo and T. Makita, Int. J. Thermophys. 1989, 10, 833-843.
[8.18] J.G. Huddleston, A.E. Visser, W.M. Reichert, H.D. Willauer, G.A. Broker, R.D.
Rogers, Green Chem. 2001, 3, 156-164.
[8.19] M.L. Dietz, C. Felinto, S. Rhoads, M. Clapper, J.W. Finch, B.P. Hay, Sep. Sci.
Technol. 1999, 34, 2943-2956.
[8.20] A. Triolo, O. Russina, H-J. Bleif, E. Di Cola, J. Phys. Chem. B, 2007, 111, 4641-
4644.
[8.21] D. Xiao, J.R. Rajian, A. Cady, S. Li, R.A. Bartsch, E.L. Quitevis, J. Phys. Chem.
B, 2007, 111, 4669-4677.
[8.22] O. Russina, A. Triolo, L. Gontrani, R. Caminiti, D. Xiao, L.G Hines Jr, R.A
Bartsch, E.L. Quitevis, N. Plechkova, K.R Seddon, J. Phys.: Condens. Matter,
2009, 21, 424121.
[8.23] A. Paul, A. Samanta, J. Phys. Chem. B, 2007, 111, 4724-4731.
[8.24] D.R. MacFarlane, J. Golding, S. Forsyth, M. Forsyth, G.B. Deacon, Chem.
Commun. 2001, 1430–1431.
[8.25] E.P. Horwitz, R. Chiarizia, M.L. Dietz, Sol. Extr. Ion Exch. 1992, 10, 313-342.
[8.26] E.P. Horwitz, M.L. Dietz, D.E. Fisher, Sol. Extr. Ion Exch. 1990, 8, 557-572.

234
CHAPTER 9:
CONCLUSIONS AND RECOMMENDATIONS
9.1 Conclusions
Because of their remarkable ability to extract a variety of substances while providing
non-volatile, nonflammable, thermally-stable liquid phases with flexible chemistry, ionic
liquids (ILs) have been widely investigated as replacements for conventional (molecular)
solvents for an enormous range of purposes. Comparisons with their conventional
counterparts (i.e., n-alcohols) have provided a foundation for understanding extraction
into ILs and a benchmark by which to measure improvements, based on several criteria.
These include increases in extraction efficiency and separation factors versus those
observed in conventional solvent systems, and behavior that allows not just facile
extraction, but also recovery of the solvent and the solute(s) and reuse of the solvent.
Extraction systems based on ILs comprising 1,3-dialkylimidazolium (CnCmim) cations
and the hydrophobic bis[(trifluoromethyl)sulfonyl]imide (Tf2N) anion have, under certain
conditions, displayed all these characteristics.
The extraction of metal ions into ILs has proven, in many instances, to be far more
complex than in conventional solvents. However, understanding the IL systems and
choosing appropriate conditions to design efficient and selective extractions is possible,
given a more fundamental appreciation of IL systems in general. Therefore, the objective
of these studies was to provide an improved basis for understanding metal ion extraction
from aqueous solutions into room-temperature ionic liquids by investigating the variety
of possible extraction pathways and some of the major factors (i.e., IL hydrophobicity,
nature of the extracted metal ion, aqueous acidity, and the water content of the organic
phase) determining their balance. As a test system, the extraction of alkali and alkaline

235
earth metal ions from acidic nitrate media via neutral crown ethers into hydrophobic
CnCmimTf2N ILs was examined. Considering that the unfavorable metal ion complex
extraction by way of ion exchange pathways has a tendency to predominate in many of
these systems, the design of the components for practical extraction media has been
centered on their prevention. A three-path model was demonstrated to be a generic
representation of the pathways observed in the extraction of metal ions by neutral crown
ethers in ILs by studying the effect of systematic variation in the alkyl substituents of the
imidazolium cation on the observed trends in extraction data for various metal ions. The
effect of water content of ILs was explored by synthesizing a homologous series of
CnCmimTf2N ILs and their 1-(ω-hydroxyalkyl) analogs. For the first time, a meaningful
correlation has been demonstrated between the extraction of strontium and the water
content of ILs, as has been observed previously for oxygenated aliphatic solvents. That a
single correlation described both systems suggests that a specific quantity of water is
necessary for the co-extraction of the aqueous anion in the predominantly neutral
complex/ion-pair extraction involved.
In the pursuit of the key factors relating IL structure to solvation behavior, IL
hydrophobicity has been a recurrent theme. Octanol-water distribution ratios (Dow) were
measured as an indicator of IL hydrophobicity and demonstrated to provide the basis of a
quantitative scale relating extraction behavior to IL structural features. Specifically, it has
been shown that the behavior of CnCmim-based ILs as extraction solvents is related to the
Dow, thus providing a means to predict the performance of other families of ILs. As a
result of this study, a benchmark log Dow value of ca. 2 (based on C10C1imTf2N) has been
established as the minimum value required for ILs exhibiting the ability to efficiently and

236
selectively extract strontium and acid dependence similar to conventional solvents. These
techniques are expected to provide a foundation for guidelines to select an appropriate IL
solvent for the extraction of metal ions.
To more rapidly determine the concentration of ILs in various sample types, a new
HPLC-UV method was developed for their quantification. The method represents a
significant improvement over previously developed chromatographic methods for the
separation of ILs in that it provides greater efficiencies, lower detection limits, and higher
throughput. Additionally the method offers the ability to analyze a variety of sample
types, which has proven beneficial in this research, and is expected to support many other
efforts. Rigorous evaluation of the normal-phase separation to determine the underlying
solute retention mechanisms resulted in the conclusion that that non-adsorptive ion
exchange is the predominant mode of retention. The method also provided the means to
measure the contribution of ion exchange of the IL cation in the extraction of metal ions.
Paired with a newly engineered IC technique to determine the nitrate content of the IL
phase post-extraction, the possibility of determining the relative contributions of
competing extraction pathways was explored. Through these techniques the
quantification of the relative contributions from two competing extraction modes (i.e., ion
exchange via the IL cation, and neutral complex/ion-pair extraction) has been
demonstrated in the well-characterized extraction of strontium from water, indicating that
similar methods may be used across a range of conditions.
Finally, in a set of experiments examining various means for the practical application
of ILs in metal ion extraction, the solvent extraction behavior of a substantially
hydrophobic IL was compared with that of the traditional 1-octanol system. Five-fold

237
improvements to extraction efficiency and modest gains in separation factor for strontium
over sodium were observed for the IL systems. Particularly good behavior was observed
for the 0.1 M DtBuCH18C6 in C12OHC4imTf2N system, suggesting that applications
employing solvent extraction of strontium may benefit from similar solvents. However,
when these same materials were studied in an extraction chromatographic (EXC)
medium, the improvements in solvent extraction were shown not to directly translate to
EXC. An investigation into the causes of such non-ideal behavior indicated that at three
factors may limit the extraction efficiency on the solid support: the IL viscosity (which
leads to poor transport of the solute), crown ether insolubility in the IL phase, and a
constraint is placed on the mole fraction-based composition of that solution by the high
molecular weight ILs employed.
While the studies reported in this work have provided a better understanding of how
IL-based metal ion extraction systems behave, it is important to note that this field
remains far from settled. The structure-property relationships available in the design of
ILs are limited by imagination. Considering the selection of appropriate solvents and
complexants, it is hoped that the knowledge and techniques provided in this work will
facilitate the continued development of this understanding and assist in the generation of
improved technologies for a variety of extraction media.

238
9.2 Recommendations
In light of the efforts to expand the knowledge base of IL-based extraction systems,
several recommendations are made in the following sections. Alhough these do not
represent a comprehensive list of interests, they include both the forthcoming studies in
this laboratory and as possible endeavors that may revolutionize the field.
9.2.1 Expanding the knowledge base to other ionic liquid families
Although the objective of this work was to study 1,3-dialkylimidazolium ionic
liquids (particularly the hydrophobic Tf2N salts), other common IL cations (e.g., N-
alkylpyridimium, N-alkylquinolinium, N-dialkylpyrrolidinium) are amenable to the same
approaches employed here. Any ILs incorporating an appropriate chromophore (e.g., an
aromatic anion) will, in fact, be suitable for the analytical methods applied. Perhaps, a
somewhat less common IL ion such as amino acids, which due to their dual
functionalities can provide either cations or anions, may yield “greener” alternatives to
the heterocyclic moieties used here.
9.2.2 Determining the effect of self-aggregation of ionic liquids on behavior as solvents
On many occasions, the surface activity of the most hydrophobic ILs was reflected in
their behavior as solvents and solutes. For instance, in the differences observed among
the C10CnTf2N series for both water content (Chapter 4) and the correlation of their Dow to
the carbon number (Chapter 6), the two-tail amphiphilic characteristics of the ILs led to
deviations from trends that were established with near homologues. The measurement of

239
surface tension should therefore become a regular part of the assessment of ILs of this
type. In some cases, interfacial surface tension measurements, along with light scattering
techniques, may provide a means to understand their aggregation behavior.
9.2.3 Developing a useful chromatographic resin from ionic liquids
While these and other studies have demonstrated how difficult it may be to produce
practical radioanalytical separations media by simply replacing a conventional solvent
with an IL that behaves well in solvent extraction, there are some directions that might be
worth pursuing. Along the lines of rendering the physical properties of the ILs more
amenable, there are some indications that viscosities may be lowered by the use of
particular anions that disrupt short-range coulombic interactions with the cation (e.g.,
dicyanamide and amino acids) [9.1, 9.2]. Although these anions tend to be too
hydrophilic for the biphasic extraction of metal ions, the same principles may be explored
for a more hydrophobic anion. Studies [9.3] have also suggested that mixtures of ionic
liquids may provide the flexibility to modify the physicochemical properties of IL
systems. It is possible that a combination and an appropriate composition of a mixture of
ILs may provide the lowered viscosities desired. Furthermore, it is common in
conventional solvent systems to add modifiers that impart properties allowing easier
handling of those materials. For instance, 5% lauryl nitrile is added to the diluent in the
SREX process to lower its viscosity and make it easier to handle in the strontium
extraction from spent nuclear fuel (SREX process) [9.4, 9.5].
Another aspect of the extraction of strontium, in particular, that could use some
innovation is in the ligands employed. Some of the issues observed with the crown ethers

240
in previous and present studies were that they also extract acid and have considerable
affinity for other cations like potassium and lead(II). A more selective, possibly pre-
organized, extractant might mitigate the competition observed and increase the capacity
of extraction media significantly. Of course, these endeavors would require advanced
synthetic and molecular modeling techniques, as well as the facilities and spectroscopic
equipment to elucidate metal coordination environments.
9.3 References
[9.1] D.R. MacFarlane, J. Golding, S. Forsythe, G.B. Deacon, Chem. Commun., 2001,
1430-1431.
[9.2] H. Yu, Y. Ting Wu, Y. Jiang, Z. Zhou, Z. Zhang, New J. Chem., 2009, 33, 2385-
2390.
[9.3] H. Niedermeyer, J.P. Hallett I.J. Villar-Garcia, P. A. Hunt, T. Welton , Chem.
Soc. Rev., 2012, 41, 7780-7802.
[9.4] [1.3] E.P. Horwitz, M.L. Dietz, D.E. Fisher, Sol. Extr. Ion Exch. 1991, 9, 1-25.
[9.5] E.P. Horwitz, M.L. Dietz, M.P. Jensen, International solvent extraction conference,
Melbourne (Australia), 1996.

241
CURRICULUM VITAE
Cory A. Hawkins
Education
Ph.D. in Chemistry, University of Wisconsin-Milwaukee Dec 2012
Dissertation: “Fundamental and Applied Studies of Metal Ion Extraction by Crown Ethers into
Imidazolium-based Room Temperature Ionic Liquids”, Advisor: Mark. L. Dietz, Ph.D.
B.S. in Chemistry, Southern Oregon University 2000
Experience
Research Assistant, University of Wisconsin - Milwaukee, Milwaukee, WI 2008-2011
Led a research program aimed at elucidating the principles of Group 1 and 2 metal ion
transfer from aqueous acidic solutions into room temperature ionic liquids. Developed
techniques to quantify pathways of ion transport under a wide range of conditions.
Synthesized new ionic liquids.
Supervised undergraduate researchers and training junior graduate research assistants.
Teaching Assistant, University of Wisconsin - Milwaukee, Milwaukee, WI 2007-2011
Taught laboratories and discussions for Analytical and General Chemistry.
Graduate Research Assistant, Argonne National Laboratory - Argonne, IL 2010
Performed radiochemical and chromatographic analysis for a project to develop an
improved radiostrontium bioassay, sponsored by the Centers for Disease Control. Patent
application submitted for device designed from these studies.
Analyst II, Bioanalytical Systems Inc., McMinnville, OR 2006-2007
Served as lead analyst on tissue methods development and analysis projects. Managed
team members in the development and validation of HPLC-UV and HPLC-MS/MS
methods for small molecule pharmaceuticals. Performed sample analysis in a GLP
environment.
Analyst I, Bioanalytical Systems Inc., McMinnville, OR 2002-2006
Developed and validated HPLC-UV and HPLC-MS/MS methods for small molecule drug
products, substances, and biological matrices. Performed sample analysis in a GLP
environment.
Analyst I, LC Resources, Inc., McMinnville, OR 2000-2002
Developed and validated HPLC-UV and HPLC-MS/MS methods for small molecule drug
products, substances, and biological matrices. performed sample analysis in a GLP
environment; operated and maintained instruments and equipment.

242
Publications
C.A. Hawkins, A. Rud, S.L. Garvey, M.L. Dietz, Evaluation of hydroxyalkyl-functionalized
imidazolium-based ionic liquids as solvents for the extraction of metal ions, Sep. Sci. and
Technol., 10.1080/01496395.2012.697527, 27 June 2012.
C.A. Hawkins, I.A. Shkrob, C.J. Mertz, M.L. Dietz, M.D. Kaminski, Novel Tandem Column
Method for the Rapid Isolation of Radiostrontium from Human Urine, Anal. Chim. Acta, 2012,
746, 114-122.
S.L. Garvey, C.A. Hawkins, M.L. Dietz, Effect of Aqueous Phase Anion on the Mode of
Facilitated Ion Transfer into Room-Temperature Ionic Liquids, Talanta, 2012, 95, 25-30.
C.A. Hawkins, S.L. Garvey, M.L. Dietz, Structural Variations in Room-Temperature Ionic
Liquids: Influence on Metal Ion Partitioning Modes and Extraction Selectivity, Separation and
Purification Technology, 2012, 89 31-38.
M.L. Dietz, S.L. Garvey, C.A. Hawkins, Mechanisms of metal ion transfer into RTILs -
implications for their use as extraction solvents,19th International Solvent Extraction Conference,
Salesianos Impresores, Santiago, Chile, Chapter 8, 2011.
C.A. Hawkins and J.W. Dolan, Understanding Split Peaks, LC/GC, 2003, 21, pages 1134-1138.
Patents and Patent Applications
ANL-IN-10-037, Non-Provisional Application for: Method for Rapid Separation and Counting
of Radioactive Strontium From Urine, Inventors: M.D. Kaminski, C.J. Mertz, I.A. Shkrob, M.L.
Dietz, C.A. Hawkins, filed July 2011.
Honors and Awards
3rd
Prize Paper ACS I&EC Division Graduate Student Symposium Aug. 2012
3rd
Prize Poster Milwaukee ACS YCC Poster Symposium Nov. 2011
1st Prize, Graduate Research, UW-Milwaukee Chemistry May 2011
3rd
Prize, Graduate Research, UW-Milwaukee Chemistry May 2010
Outstanding Service to the SOU Chemistry Department 2000

243
Presentations
C.A. Hawkins, A. Rud, S.L. Garvey, M.L. Dietz, Room-temperature ionic liquid-based solvent
extraction systems for improved fission product separations, 244th ACS Meeting and Exposition,
I&EC Division Graduate Student Awards Symposium, Philadelphia, PA, 21 August 2012.
C.A. Hawkins, A. Rud, S.L. Garvey, M.L. Dietz, Poster: Three Pathway Model for Metal Ion
Partitioning into Room Temperature Ionic Liquids: Interrogating the Factors Contributing to
Extraction, UW-Milwaukee Chemistry & Biochemistry Department, 27 April 2012.
C.A. Hawkins, A. Rud, M.L. Dietz, Poster: Evaluation of hydroxyalkyl-functionalized
imidazolium-based ionic liquids as solvents for the extraction of metal ions, Milwaukee Section
ACS Younger Chemists Committee Poster Symposium, Milwaukee, WI, 4 November 2011.
C.A. Hawkins, A. Rud, S.L. Garvey, M.L. Dietz, Evaluation of hydroxyalkyl-functionalized
imidazolium-based ionic liquids as solvents for the extraction of metal ions, 17th Symposium on
Separation Science and Technology for Energy Applications, Gatlinburg, TN, 23-27 October
2011.
Dietz, M.L. Garvey, S.L. C.A. Hawkins, Mechanisms of metal ion transfer into RTILs -
implications for their use as extraction solvents, 19th International Solvent Extraction Conference,
Santiago, Chile, 3-7 October 2011.
C.A. Hawkins, M.L. Dietz, Poster: “Fundamental aspects of group 1 and 2 metal ion transfer into
imidazolium-based room temperature ionic liquids”, UW-Milwaukee Chemistry & Biochemistry
Department, 6 May 2011.
C.A. Hawkins, S.L. Garvey, A.J. Pawlak, M.L. Dietz, Poster: “Fundamental aspects of metal ion
transfer into room temperature ionic liquids”, 241st ACS Meeting and Exposition, Anaheim, CA,
28 March 2011.
C.A. Hawkins, M.L. Dietz, Poster: “Fundamental Aspects of Metal Ion Transfer into Room-
Temperature Ionic Liquids: Toward Improved Methods for Rapid Determination of Strontium-90
in Bioassay Samples”, UW-Milwaukee Chemistry & Biochemistry Department, 7 May 2010
C.A. Hawkins, M. Kiser, T. Fleischmann, Poster: “Does Column Switching Reduce Phospholipid
Ion Suppression in the Analysis of Rapamycin Using LC-ESI-MS/MS?”, 54th ASMS Conference
on Mass Spectrometry, Seattle, WA, 2006.
Professional Affiliations
American Chemical Society 1999-present
Chairperson, Milwaukee ACS Younger Chemists Committee 2009-2010
Organizer of 1st Annual Chemistry in Southeastern Wisconsin Symposium
American Society for Mass Spectrometry 2006-2007
President of SOU Chemistry Student Affiliates of the ACS 1999-2000