Fundamental Analysis Of Large Retail Format In Indiaijifr.com/pdfsave/29-01-2016682V3-E5-030.pdf ·...
16
1630 Available online through - http://ijifr.com/searchjournal.aspx ©IJIFR 2015.All Rights Reserved www.ijifr.com International Journal of Informative & Futuristic Research ISSN: 2347-1697 Volume 3 Issue 5 January 2016 Original Paper Abstract The Indian retail industry is one of the fastest growing in the world. Retail industry in India is expected to grow to US$ 1.3 trillion by 2020, registering a Compound Annual Growth Rate (CAGR) of 16.7 per cent over 2015-20. Retailers can be categorized in India into Large Retail Format (Hyper), Medium and Kirana Shops. Large Format Retailers are spread across India. During the Initial phase of retail growth from 2000. These companies developed with greater size with Market capitalization and Return on Investment. Since then, the growth of Large Retail Format in India has been a continuous Process. 1. Introduction The Indian retail industry is one of the fastest growing in the world. Retail industry in India is expected to grow to US$ 1.3 trillion by 2020, registering a Compound Annual Growth Rate (CAGR) of 16.7 per cent over 2015-20. India is the fifth largest preferred retail destination globally. The country is among the highest in the world in terms of per capita retail store availability. India’s retail sector is experiencing exponential growth, with retail development taking place not just in major cities and metros, but also in Tier- II and Tier-III cities. Healthy economic growth, changing demographic profile, increasing disposable incomes, urbanization, changing consumer tastes and preferences are the other factors driving growth in the organized retail market in India. Fundamental Analysis Of Large Retail Format In India Paper ID IJIFR/ V3/ E5/ 030 Page No. 1630-1645 Research Area Finance Keywords Market capitalization, Indian Retail Industry, Earning Per Share (EPS), Operating Profit Margin (OPM), Net Profit Margin (NPM), Debt Equity Ratio (DER) , Return on Assets (ROA) , Return on Net worth (ROA), Current Ratio (CR), Fixed Assets Turnover Ratio (FATR) 1 st K. Sivagnana Sankari M.Phil. Scholar PG and Research Department of Commerce V.O.Chidambaram College, Tuticorin - Tamilnadu 2 nd V.Sornaganesh M.Phil. Scholar PG and Research Department of Commerce V.O.Chidambaram College, Tuticorin - Tamilnadu
Transcript of Fundamental Analysis Of Large Retail Format In Indiaijifr.com/pdfsave/29-01-2016682V3-E5-030.pdf ·...

1630
Available online through - http://ijifr.com/searchjournal.aspx
©IJIFR 2015.All Rights Reserved
www.ijifr.com
International Journal of Informative & Futuristic Research ISSN: 2347-1697
Volume 3 Issue 5 January 2016 Original Paper
Abstract
The Indian retail industry is one of the fastest growing in the world. Retail industry in India is expected to grow to US$ 1.3 trillion by 2020, registering a Compound Annual Growth Rate (CAGR) of 16.7 per cent over 2015-20. Retailers can be categorized in India into Large Retail Format (Hyper), Medium and Kirana Shops. Large Format Retailers are spread across India. During the Initial phase of retail growth from 2000. These companies developed with greater size with Market capitalization and Return on Investment. Since then, the growth of Large Retail Format in India has been a continuous Process.
1. Introduction
The Indian retail industry is one of the fastest growing in the world. Retail industry in
India is expected to grow to US$ 1.3 trillion by 2020, registering a Compound Annual
Growth Rate (CAGR) of 16.7 per cent over 2015-20. India is the fifth largest preferred
retail destination globally. The country is among the highest in the world in terms of per
capita retail store availability. India’s retail sector is experiencing exponential growth,
with retail development taking place not just in major cities and metros, but also in Tier-
II and Tier-III cities. Healthy economic growth, changing demographic profile,
increasing disposable incomes, urbanization, changing consumer tastes and preferences
are the other factors driving growth in the organized retail market in India.
Fundamental Analysis Of Large
Retail Format In India Paper ID IJIFR/ V3/ E5/ 030 Page No. 1630-1645 Research Area Finance
Keywords
Market capitalization, Indian Retail Industry, Earning Per Share (EPS),
Operating Profit Margin (OPM), Net Profit Margin (NPM), Debt Equity Ratio
(DER) , Return on Assets (ROA) , Return on Net worth (ROA), Current Ratio
(CR), Fixed Assets Turnover Ratio (FATR)
1st K. Sivagnana Sankari
M.Phil. Scholar
PG and Research Department of Commerce
V.O.Chidambaram College, Tuticorin - Tamilnadu
2nd
V.Sornaganesh
M.Phil. Scholar
PG and Research Department of Commerce
V.O.Chidambaram College, Tuticorin - Tamilnadu

1631
ISSN: 2347-1697
International Journal of Informative & Futuristic Research (IJIFR)
Volume - 3, Issue -5, January 2016
Continuous 29th Edition, Page No.:1630-1645
K. Sivagnana Sankari, V.Sornaganesh :: Fundamental Analysis Of Large Retail Format In India
India’s population is taking to online retail in a big way. The online retail market is expected to grow from US$ 6 billion to US$ 70 billion during FY15-FY20.
Increasing participation from foreign and private players has given a boost to Indian
retail industry. India’s price competitiveness attracts large retail players to use it as a sourcing base. Global retailers such as Wal-Mart, GAP, Tesco and JC Penney are
increasing their sourcing from India and are moving from third-party buying offices to
establishing their own wholly-owned/wholly-managed sourcing and buying offices.
The Government of India has introduced reforms to attract Foreign Direct Investment
(FDI) in retail industry. The government has approved 51 per cent FDI in multi-brand
retail and increased FDI limit to 100 per cent (from 51 per cent) in single brand retail.
2. Review Of Literature
Literature review is a study involving a collection of literatures in the selected area of
research in which the researcher has limited experience, and critical examination and
comparison of them to have a better understanding. It also helps the researchers to
update the past data, data sources and results and identify the gaps, if any in the
researches. Thus, the reviews in the present study consist of the ones discussed below
and they reveal that there are very scant studies in India emphasizing on the fundamental
analysis of the industry sector.
Jim Berg (1999) conducted a study – “Fundamental Analysis Using Internet”. This
study examined that fundamental analysis looks at the fundamental issues that drive
the value of the particular company. These issues include its financial position, its
industry sector, and the current economic environment. The objective was to identify
companies that may be considered undervalued in the market with a view to
investing when the time is right. In this study, Jim Berg outlined more about what
fundamental analysis is and how it could be used.
In this study, John Colnan (1994), senior Research Analyst from SHAN
Stockbroking’s Research Department provides some briefs pointers on what information to look for and how to make sense of what is available.
Mark P. Bauman (1996) conducted a study named, “A Review of Fundamental
Analysis Research in Accounting”. This paper has outlined the development of
fundamental valuation model and reviewed related empirical work.
First, an accounting-based expression for a firm’s equity value has been developed into a rich theoretical framework. They verified its descriptive validity regarding the
mapping of accounting numbers into stock prices. This paper identified three major
issues associated with practical implementation of the model; the prediction of future
profitability, the length of appropriate forecast horizon, and the determination of the
appropriate discount rate.
Jon Lynch conducted a study, “Share Market Analysis-Fundamental Vs Technical
Analysis”, which reveals that in recent times, there has been a bigger push towards
stock market research, which is being conducted by private individuals. This has
been possible through the vast amount of information on the Australian stock market

1632
ISSN: 2347-1697
International Journal of Informative & Futuristic Research (IJIFR)
Volume - 3, Issue -5, January 2016
Continuous 29th Edition, Page No.:1630-1645
K. Sivagnana Sankari, V.Sornaganesh :: Fundamental Analysis Of Large Retail Format In India
, now available online to any subscriber. This article explains the difference between
the fundamental and technical analysis; the most common methods adopted to
conduct research on the performance of stock markets.
Vanstone B. Finnie G. and Tan C. (2004) conducted a study entitled- “Enhancing
Security Selection in the Australian Stock Market Using Fundamental Analysis and
Neural Networks”. This paper examines financial trading from the aspect of security
selection. In practice, it is unrealistic for a financial trader to participate in the fill
market of tradable securities competing for investment capital. Essentially, there are
two main methodologies used namely, fundamental analysis and technical analysis.
This paper examines the practice of fundamental analysis and demonstrates how
neural networks can be practically employed to enhance the fundamentalist selection
process.
Dr. Maria Nevis Soris and V.Sornaganesh (2012) conducted a study entitled-
“Fundamental Analysis of NBFC in India” This study conducted to examine the
economic sustainability of the five major NBFC in Indian NBFC sector and its
financial performance.
V.Sornaganesh and D.Maheswari (2014) TCS as a welcome game changer that
offers significantly lower pricing, better service levels, more sophisticated offerings,
a customer-centric mindset and a global footprint.
Ushasri Tirumala (2015) nearly 74% of Indian consumers shop across all channels –
local retailers, modern retail outlets and online. Modern trade is growing fast, with
about 40% of urban shoppers using it regularly, almost twice what it was in 2012.
3. Need And Objectives Of The Study An investor who would like to be rational and scientific in his investment activity has to
evaluate a lot of information about past performance of the companies, industries and
the economy as a whole before taking the investment decision and hence, the present
study attempts to analyze the profitability position of the sample companies.
Some of the objectives of conducting the study are as follows:
To test the financial efficiency of the Retail Industries.
To acquire practical exposure of financial analysis of an enterprise.
To get familiarity of scheming efficiency of different firms.
To analyses the profitability position of the Retail Industries.
To gain knowledge of evaluating intrinsic value of a firm.
To take decisions cautiously after studying risks involved in the same.
To offer suggestions on the basis of findings of the study.
4. Hypotheses Formulated The study tests whether the selected variables of sample companies vary significantly
during the study period. This specific hypothesis is tested at appropriate time while

1633
ISSN: 2347-1697
International Journal of Informative & Futuristic Research (IJIFR)
Volume - 3, Issue -5, January 2016
Continuous 29th Edition, Page No.:1630-1645
K. Sivagnana Sankari, V.Sornaganesh :: Fundamental Analysis Of Large Retail Format In India
analyzing and interpreting the results. The following Hypothesis has been taken to put
on test:
H1: The Earning Per Share (EPS) position of Shoppers Stop, Future Retail, Trent,
Kewal Kiran, Pantaloom Fashion, does not differ significantly.
H2: The Operating Profit Margin (OPM) position of Shoppers Stop, Future Retail,
Trent Kewal Kiran, Pantaloom Fashion, differ significantly.
H3: The Net Profit Margin (NPM) position of Shoppers Stop, Future Retail, Trent
Kewal Kiran, Pantaloom Fashion, differ significantly.
H4: The Debt Equity Ratio (DER) position of Shoppers Stop Future Retail Trent Kewal
Kiran andPantaloom Fashion does not differ significantly.
H5: The Return on Assets (ROA) position of Shoppers Stop Future Retail Trent Kewal
Kiran and Pantaloom Fashion differ significantly.
H6: The Return on Net worth (RONW) position of Shoppers Stop Future Retail Trent
Kewal Kiran and Pantaloom Fashion does not differ significantly.
H7: The Current Ratio (CR) position of Shoppers Stop Future Retail Trent Kewal Kiran
and Pantaloom Fashion differ significantly.
H8: The Fixed Assets Turnover Ratio (FATR) position of Shoppers Stop Future Retail
Trent Kewal Kiran and Pantaloom Fashion differ significantly.
5. Research Methodology The present study adopts an analytical and descriptive research design. The data of the
sample Retail industries (for a period of five years from 2011 to 2015) has been
collected from the annual reports published by the Retail industries. A finite sample size
of five big retailers has been selected for the purpose of the study. They are Shoppers
Stop, Future Retail, Trent, Kewal Kiran, Pantaloom Fashion. The variables used in the
analysis of the data are Earning Per Share(EPS), Operating Profit Margin(OPM), Net
Profit Margin(NPM), Debt Equity Ratio(DER), Return On Assets(ROA), Return On Net
worth(RNW), Current Ratio(CR), Fixed Assets Turnover Ratio(FTR).While interpreting
the results, the statistical tool of one-way Analysis of Variance (ANOVA) has been
used. In view of the objectives of the study listed above, exploratory research design has
been adopted. Exploratory research is one, which largely interprets the already available
information, and it lays particular emphasis on analysis and interpretation of the existing
and available information, and it makes use of secondary data.
5.1 Time Period of the Study
The study is conducted based on the audited financial statements of Retail Industries for
a period of 5 years (Mar 2011 to Mar 2015).
5.2 Limitations of the Study
Only limited tools were used.
Due to constraint of time, the researcher is not able to cover all the Indian Retail
industries.

1634
ISSN: 2347-1697
International Journal of Informative & Futuristic Research (IJIFR)
Volume - 3, Issue -5, January 2016
Continuous 29th Edition, Page No.:1630-1645
K. Sivagnana Sankari, V.Sornaganesh :: Fundamental Analysis Of Large Retail Format In India
5.3 Tools Used For Analysis
FINANCIAL TOOLS : The Financial tool that is used for the purpose of
analysis are Earning Per Share(EPS), Operating Profit Margin(OPM), Net Profit
Margin(NPM), Debt Equity Ratio(DER), Return On Assets(ROA), Return On
Net worth(RNW), Current Ratio(CR), Fixed Assets Turnover Ratio(FTR).
STATISTICAL TOOLS: The statistical tool that is used for testing hypothesis
is One-Way Analysis Of Variance (ANOVA).
5.4 Sources of Data
This study is based on secondary data, discussions with personnel concerned. The
secondary data consists of the annual reports of four Retail Industries ranging for the last
five years. Various other reports like Journals and Websites were also referred to for the
present study.
5.5 Sample Size
A sample of five Retail Industries in India viz., Shoppers Stop, Future Retail, Trent,
Kewal Kiran, Pantaloom Fashion were considered for the purpose of analysis.
6. Analyses and Interpretation
6.1 Financial Analysis
Financial analysis (also referred to as financial statement analysis or accounting analysis
or Analysis of finance) refers to an assessment of the viability, stability and profitability
of a business, sub-business or project Use and transformation of financial data into a
form that can be used to monitor and evaluate the firm's financial position, to plan future
financing, and to designate the size of the firm and its rate of growth. Financial analysis
includes the use of financial statement analysis and funds flow analysis.
It is performed by professionals who prepare reports using ratios that make use of
information taken from financial statements and other reports. These reports are usually
presented to top management as one of their bases in making business decisions.
Continue or discontinue its main operation or part of its business;
Make or purchase certain materials in the manufacture of its product;
Acquire or rent/lease certain machineries and equipment in the production of its
goods;
Issue stocks or negotiate for a bank loan to increase its working capital;
Make decisions regarding investing or lending capital;
Other decisions that allow management to make an informed selection on
various alternatives in the conduct of its business.
6.2 Ratios Used For Analysis
The ratios being calculated for the purpose of analysis of financial performance are:
1635
ISSN: 2347-1697
International Journal of Informative & Futuristic Research (IJIFR)
Volume - 3, Issue -5, January 2016
Continuous 29th Edition, Page No.:1630-1645
K. Sivagnana Sankari, V.Sornaganesh :: Fundamental Analysis Of Large Retail Format In India
Earnings per Share (EPS)
Operating Profit Margin (OPM)
Net Profit Margin (NPM)
Debt Equity Ratio (DER)
Return on Assets (ROA)
Return on Net worth (ROA)
Current Ratio (CR)
Fixed Assets Turnover Ratio (FTR)
7. Results and Discussions
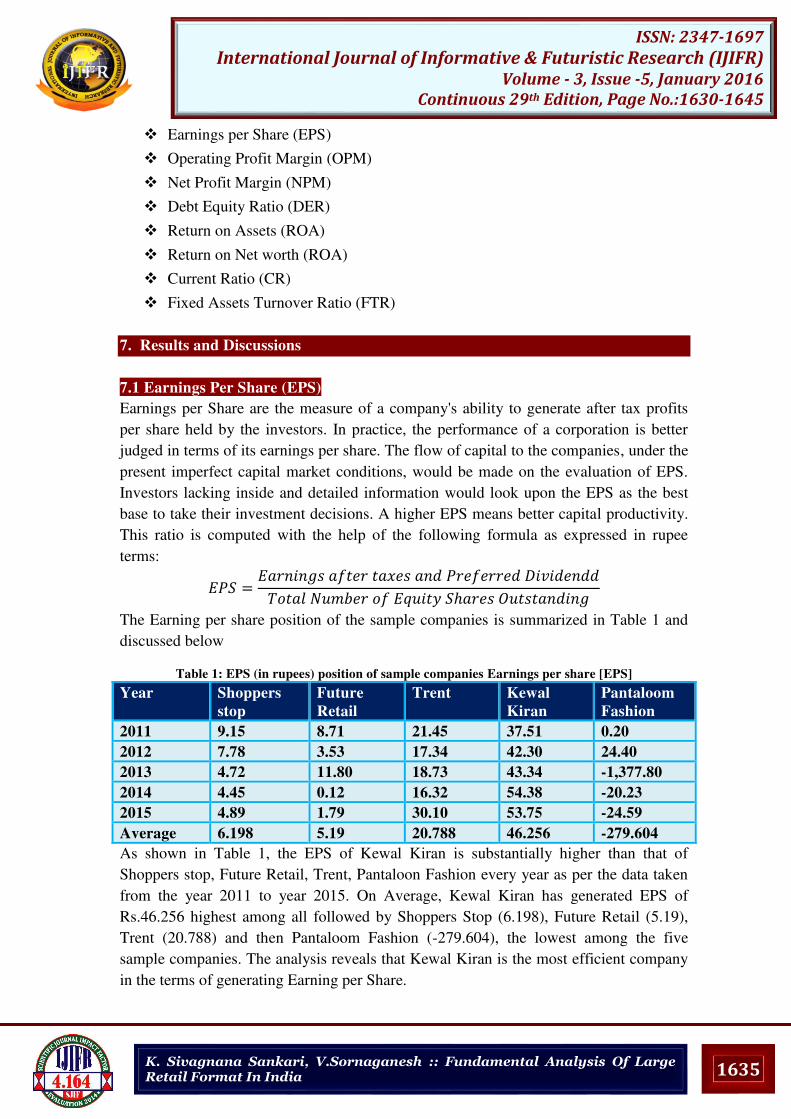
7.1 Earnings Per Share (EPS)
Earnings per Share are the measure of a company's ability to generate after tax profits
per share held by the investors. In practice, the performance of a corporation is better
judged in terms of its earnings per share. The flow of capital to the companies, under the
present imperfect capital market conditions, would be made on the evaluation of EPS.
Investors lacking inside and detailed information would look upon the EPS as the best
base to take their investment decisions. A higher EPS means better capital productivity.
This ratio is computed with the help of the following formula as expressed in rupee
terms: = � � � � ℎ �
The Earning per share position of the sample companies is summarized in Table 1 and
discussed below
Table 1: EPS (in rupees) position of sample companies Earnings per share [EPS]
Year Shoppers
stop
Future
Retail
Trent Kewal
Kiran
Pantaloom
Fashion
2011 9.15 8.71 21.45 37.51 0.20
2012 7.78 3.53 17.34 42.30 24.40
2013 4.72 11.80 18.73 43.34 -1,377.80
2014 4.45 0.12 16.32 54.38 -20.23
2015 4.89 1.79 30.10 53.75 -24.59
Average 6.198 5.19 20.788 46.256 -279.604
As shown in Table 1, the EPS of Kewal Kiran is substantially higher than that of
Shoppers stop, Future Retail, Trent, Pantaloon Fashion every year as per the data taken
from the year 2011 to year 2015. On Average, Kewal Kiran has generated EPS of
Rs.46.256 highest among all followed by Shoppers Stop (6.198), Future Retail (5.19),
Trent (20.788) and then Pantaloom Fashion (-279.604), the lowest among the five
sample companies. The analysis reveals that Kewal Kiran is the most efficient company
in the terms of generating Earning per Share.

1636
ISSN: 2347-1697
International Journal of Informative & Futuristic Research (IJIFR)
Volume - 3, Issue -5, January 2016
Continuous 29th Edition, Page No.:1630-1645
K. Sivagnana Sankari, V.Sornaganesh :: Fundamental Analysis Of Large Retail Format In India
The EPS position of sample companies is compared and tested using the following
hypothesis.
7.1 (a) Hypothesis Testing
H0: EPS of Shoppers Stop, Future Retail, Trent, Kewal Kiran, Pantaloom Fashion, does
not differ significantly.
H1: EPS of Shoppers Stop, Future Retail, Trent, Kewal Kiran, Pantaloom Fashion, differ
significantly.
ANOVA
Source of Variation SS df MS F-ratio 5% F- Limit
Between Groups 363607 4 90901.84 1.204388 F(20,4)= 2.87
Within Groups 1509510 20 75475.52
Total 1873118
7.1(b) Interpretation Since the calculated value of F is 1.204388 which is lesser than the table value of 2.87
(CV>TV at 5% significance level), the null hypothesis is accepted and the alternative
hypothesis is rejected. Hence, it is concluded that the EPS position of Shoppers Stop,
Future Retail, Trent, Kewal Kiran, Pantaloom Fashion, does not differ significantly.
7.2 Operating Profit Margin (OPM) Operating Profit Margin indicates how effective a company is at controlling the costs
and expenses associated with their normal business operations. A rise in the operating
profit margin indicates a decline in efficiency. This ratio is used to test the efficiency of
the business. This ratio is found out using the following formulae and expressed in
percentage terms.
OPM = � � ∗
The Operating Profit Margin position of the sample companies is depicted in Table 3
and discussed below
Table 3: Operating Profit Margin [OPM] (in %) position of sample companies
Year Shoppers
stop
Future
Retail
Trent Kewal
Kiran
Pantaloom
Fashion
2011 9.04 9.5 1.05 29.18 -
2012 7.35 10.21 -1.56 24.29 2.52
2013 5.6 11.1 5.03 24.3 5.14
2014 5.66 8.98 2.13 25.48 2
2015 6.21 10.79 4.04 23.63 3.92
Average 6.772 10.116 2.138 25.376 2.716
As shown in table 3, among all the sample companies, Kewal Kiran has sustained the
highest Operating profit margin followed by Future Retail which has registered a
Table 2: One-way ANOVA for EPS

1637
ISSN: 2347-1697
International Journal of Informative & Futuristic Research (IJIFR)
Volume - 3, Issue -5, January 2016
Continuous 29th Edition, Page No.:1630-1645
K. Sivagnana Sankari, V.Sornaganesh :: Fundamental Analysis Of Large Retail Format In India
reasonably higher margin. On an aggregate basis, Kewal Kiran is highly successful in
controlling the expenses by registering the Five years OPM of 25.376.
Thus it is found that Kewal Kiran is the most efficient company in controlling costs and
expenses when compared to other sample companies. The OPM position of sample
companies are compared and tested using the following hypothesis.
7.2(a) Hypothesis Testing H0: OPM of Shoppers Stop Future Retail Trent Kewal Kiran and Pantaloom Fashion
does not differ significantly
Ha: OPM of Shoppers Stop Future Retail Trent Kewal Kiran and Pantaloom Fashion
differ significantly
Table 4: One-way ANOVA for OPM
Source of Variation SS df MS F-ratio 5% F-Limit
Between Groups 1800.31 4 450.077 122.527 F (15,4)= 3.06
Within Groups 73.4655 20 3.67328
Total 1873.77 24
7.2 (b) Interpretation Since the calculated value of F is 122.5273 which is greater than the table value of 3.06
(CV>TV at 5% significance level), the null hypothesis is rejected and the alternative
hypothesis is accepted. Hence, it is concluded that the OPM position of Shoppers Stop,
Future Retail, Trent Kewal Kiran, Pantaloom Fashion, differ significantly.
7.3 Net Profit Margin (NPM) Net Profit Margin indicates how much a company is able to earn after accounting for all the direct and indirect expenses to every rupee of revenue. The ratio is designed to focus attention on the net profit margin arising from business operations before interest and tax is deducted. The convention is to express profit after tax and interest as a percentage of sales. This ratio is calculated by using the following formula and is expressed in percentage terms.
Net Profit Margin = � � ∗
The Net Profit Margin position of the sample companies is depicted in Table 5 and is discussed below
Table 5: Net Profit Margin [NPM] of the sample companies
Year Shoppers
Stop
Future
Retail
Trent Kewal
Kiran
Pantaloom
Fashion
2011 4.53 306.42 6.27 19.73 0.07
2012 3.33 188.95 5.75 17.27 6.48
2013 1.73 301.74 6.65 17.62 -5.36
2014 1.36 499.93 4.32 18.28 -11.30
2015 1.33 249.68 7.36 16.22 -12.32
Average 2.456 309.344 6.07 17.824 -4.486

1638
ISSN: 2347-1697
International Journal of Informative & Futuristic Research (IJIFR)
Volume - 3, Issue -5, January 2016
Continuous 29th Edition, Page No.:1630-1645
K. Sivagnana Sankari, V.Sornaganesh :: Fundamental Analysis Of Large Retail Format In India
As shown in table 5, among all the sample companies, Future Retail has sustained the
highest Net profit margin followed by Kewal Kiran which has registered a reasonably
higher margin.
7.3(a) Hypothesis Testing H0: NPM of Shoppers Stop Future Retail Trent Kewal Kiran and Pantaloom Fashion does not differ significantly Ha: NPM of Shoppers Stop Future Retail Trent Kewal Kiran and Pantaloom Fashion differ significantly
Table 6: One-way ANOVA for NPM Source of Variation SS df MS F-ratio 5% F-Limit
Between Groups 370673.3 4 92668.32 33.87402 F (20,4)= 2.87
Within Groups 54713.51 20 2735.675
Total 425386.8 24
7.3(b) Interpretation Since the calculated value of F is 33.87402 which is greater than the table value of 2.87 (CV>TV at 5% significance level), the null hypothesis is rejected and the alternative hypothesis is accepted. Hence, it is concluded that the NPM position of Shoppers Stop, Future Retail, Trent Kewal Kiran, Pantaloom Fashion, differ significantly.
7.4 Debt Equity Ratio (DER) Debt Equity Ratio compares the creditors' funds with owners' funds. It indicates how much money is being placed by the creditors as that of equity holders. It represents the proportion of borrowed funds in the total capital of the company. It represents the proportion of borrowed funds in the total capital of the company. A debt equity ratio of 2:1 is the norm accepted by financial institutions for financing of projects. If the proportion of debt to equity is low, a company is said to be low geared. Higher debt equity ratio may be permitted for highly intensive industries like petrochemicals, fertilizers, power, etc. This ratio is calculated by using the following formula and expressed in terms of times.
Total Debt Net worth The Debt to Equity position of the sample companies is depicted in Table 7 and is
discussed below.
Table 7: Debt Equity Ratio [DER] (in %) position of sample companies
Year Shoppers
Stop
Future
Retail
Trent Kewal
Kiran
Pantaloom
Fashion
2011 0.21 0.54 0.27 0.03 -
2012 0.33 0.73 0.19 0.07 0.73
2013 0.44 0.96 0.15 0.06 -
2014 0.51 1.69 0.17 0.04 1.75
2015 0.60 0.81 0.05 0.04 3.58
Average 0.418 0.946 0.166 0.048 1.212

1639
ISSN: 2347-1697
International Journal of Informative & Futuristic Research (IJIFR)
Volume - 3, Issue -5, January 2016
Continuous 29th Edition, Page No.:1630-1645
K. Sivagnana Sankari, V.Sornaganesh :: Fundamental Analysis Of Large Retail Format In India
The five years data reveals that Pantaloom Fashion has achieved the highest Debt Equity Ratio and is followed by Future Retail. Kewal Kiran alone has registered the lowest ratio. Even the five years Debt Equity Ratio of Pantaloom Fashion is significantly higher (1.212times) than that of Future Retail (0.946Times), Shoppers Stop (0.418 times) Trent (0.166) and Kewal Kiran (0.048 times). Thus it is inferred that Kewal Kiran has the least proportion of debt fund in its total capital and hence it is the most efficient company among all other sample companies. Kewal Kiran has the highest portion of its self-owned funds in the capital structure followed by Trent, Shoppers Stop. The DER position of sample companies are compared and tested using the following hypothesis.
7.4 (a) Hypothesis Testing H0: DER of Shoppers Stop Future Retail Trent Kewal Kiran and Pantaloom Fashion does not differ significantly Ha: DER of Shoppers Stop Future Retail Trent Kewal Kiran and Pantaloom Fashion differ significantly.
Table 8 : One-way ANOVA for DER
Source of Variation SS df MS F-ratio 5% F-Limit
Between Groups 5.05812 4 1.26453 2.53665 F(14,4)= 3.11
Within Groups 9.97008 20 0.4985
Total 15.0282 24
7.4(b) Interpretation Since the calculated value of F is 2.53665 which is lesser than the table value of 3.11 (CV>TV at 5% significance level), the null hypothesis is accepted and the alternative hypothesis is rejected. Hence, it is concluded that the FATR position of Shoppers Stop Future Retail Trent Kewal Kiran and Pantaloom Fashion does not differ significantly.
7.5 Return On Assets (ROA) Return on assets measures the overall efficiency of capital invested in business. The profitability of the firm is measured by establishing relation of net profit with the total assets of the organization. It indicates what the yield is for every rupee invested in assets. This is computed using the following formula and is expressed in percentage terms. Earnings after Taxes and Preferred Dividends * 100
Total Assets The Return on Assets position of the sample companies is depicted in Table 9 and is
discussed below.
Table 9: Return on Asset [ROA] (in %) position of sample companies
Year Shoppers
Stop
Future
Retail
Trent Kewal Kiran Pantaloom
Fashion
2011 72.79 124.61 531.51 160.45 -7.60
2012 79.76 125.06 492.75 183.00 14.00
2013 83.61 143.47 461.02 205.97 -1,546.00
2014 87.56 140.41 396.14 235.78 62.39
2015 91.80 124.93 412.84 259.48 37.19
Average 83.104 131.696 458.852 208.936 -288.004

1640
ISSN: 2347-1697
International Journal of Informative & Futuristic Research (IJIFR)
Volume - 3, Issue -5, January 2016
Continuous 29th Edition, Page No.:1630-1645
K. Sivagnana Sankari, V.Sornaganesh :: Fundamental Analysis Of Large Retail Format In India
As per the data taken from year 2011 to year 2015, Trent has achieved the highest yield
of 458.852%. The data reveals that Pantaloom Fashion registered the lowest ROA of -
288.004%. On the five years average, Trent has sustained the higher ROA followed by
Kewal Kiran which has registered a reasonably higher yield. Thus, Trent is the most
efficient company in generating yield over assets and hence their overall efficiency is
better than other four sample companies. The ROA position of sample companies are
compared and tested by using the following Hypothesis.
7.5 (a) Hypothesis Testing H0: ROA of Shoppers Stop Future Retail Trent Kewal Kiran and Pantaloom Fashion
does not differ significantly
Ha: ROA of Shoppers Stop Future Retail Trent Kewal Kiran and Pantaloom Fashion
differ significantly. Table 10: One-way ANOVA for ROA
Source of Variation SS df MS F-ratio 5% F-Limit
Between Groups 1453449 4 363362 3.63313 F (20,4)= 2.87
Within Groups 2000272 20 100014
Total 3453721 24
7.5(b) Interpretation Since the calculated value of F is 3.633128 which is greater than the table value of 2.87
(CV>TV at 5% significance level), the null hypothesis is rejected and the alternative
hypothesis is accepted. Hence, it is concluded that the ROA position of Shoppers Stop
Future Retail Trent Kewal Kiran and Pantaloom Fashion differ significantly.
7.6 Return On Networth (RONW) Return on net worth expresses the net profit in terms of the equity shareholders’ funds. This ratio is an important yardstick of the performance of equity shareholders since it
indicates the return on the funds employed by them. The factor which motivates
shareholders to invest in a company is the expectation of an adequate rate of return on
their funds and periodically, they will want to assess the rate of return earned in order to
decide whether to continue with their investment. This ratio is useful in measuring the
rate of return as a percentage of the book value of shareholders equity. It is computed
with the help of the following formula and expressed in percentage: � � ∗
Where, Net worth = Equity capital + Reserves and surplus The Return on Net worth position of the sample companies is depicted in Table 11and is discussed below:
Table 11: Return on Net worth [RON] (in %) position of sample companies
Year Shoppers
Stop
Future
Retail
Trent Kewal
Kiran
Pantaloom
Fashion
2011 12.56 4.82 4.03 23.37 -
2012 9.75 2.82 3.51 23.11 174.28

1641
ISSN: 2347-1697
International Journal of Informative & Futuristic Research (IJIFR)
Volume - 3, Issue -5, January 2016
Continuous 29th Edition, Page No.:1630-1645
K. Sivagnana Sankari, V.Sornaganesh :: Fundamental Analysis Of Large Retail Format In India
2013 5.75 0.5 4.06 21.04 89.12
2014 5.17 -0.85 4.12 23.06 -32.42
2015 5.32 -0.51 7.29 20.71 -66.11
Average 7.71 1.356 4.602 22.258 32.974
Among all the five companies, Pantaloom Fashion has made the highest RONW of
32.974% followed by Kewal Kiran (22.258%), Shoppers Stop (7.71%) Trent (4.602) and
Future Retail (1.356) which has registered a reasonably higher yield.
The RONW position of sample companies are compared and tested using the following
hypothesis:
7.6 (a) Hypothesis Testing H0: RONW of Shoppers Stop Future Retail Trent Kewal Kiran and Pantaloom Fashion
does not differ significantly
Ha: RONW of Shoppers Stop Future Retail Trent Kewal Kiran and Pantaloom Fashion
differ significantly
Table 12: One-way ANOVA for RONW
Source of Variation SS df MS F-ratio 5% F-Limit
Between Groups 3578.61 4 894.653 0.46616 F (15,4)= 3.06
Within Groups 38383.7 20 1919.19
Total 41962.3 24
7.6 (b) Interpretation Since the calculated value of F is 0.466163 which is greater than the table value of 3.06
(CV>TV at 5% significance level), the null hypothesis is accepted and the alternative
hypothesis is rejected. Hence, it is concluded that the RONW position of Shoppers Stop
Future Retail Trent Kewal Kiran and Pantaloom Fashion does not differ significantly.
7.7 Current Ratio (CR) This ratio measures the solvency of the company in the short-term. Current Assets are
those assets which can be converted into cash within a year. Current Liabilities and
provisions are those liabilities that are payable within a year. A current ratio 2:1
indicates a highly solvent position. A current ratio 1.33:1 is considered by banks as the
minimum acceptable level for providing working capital finance. The constituents of the
current assets are as important as the current assets themselves for evaluation of a
company’s solvency position. A very high current ratio will have adverse impact on the profitability of the organization. A high current ratio may be due to the piling up of
inventory, inefficiency in collection of debtors, high balances in cash and bank accounts
without proper investment. This ratio is calculated by the following formula � �� � �
The Current ratio position of the sample companies is depicted in Table 13 and is discussed below.

1642
ISSN: 2347-1697
International Journal of Informative & Futuristic Research (IJIFR)
Volume - 3, Issue -5, January 2016
Continuous 29th Edition, Page No.:1630-1645
K. Sivagnana Sankari, V.Sornaganesh :: Fundamental Analysis Of Large Retail Format In India
Table 13: Current Ratio [CR] (in proportion) position of sample companies
Year Shoppers
Stop
Future
Retail
Trent Kewal
Kiran
Pantaloom
Fashion
2011 0.84 1.13 3.19 3.05 0.89
2012 0.75 1.03 2.85 2.81 1.34
2013 0.78 1.22 2.33 1.87 0.26
2014 0.77 1.02 1.83 1.76 0.87
2015 0.83 1.14 0.95 1.71 0.65
Average 0.794 1.108 2.23 2.24 0.802
As per the data taken from year 2011 to year 2015, the current ratio of Kewal Kiran
(2.24); it indicates Kewal Kiran is highly solvent position. Trent has achieved 2.23. Thus
it is concluded that Shoppers Stop has achieved the greater short term solvency and over
capitalization when compared to other sample companies. The CR position of sample
companies are compared and tested by using the following hypothesis:
7.7 (a) Hypothesis Testing
H0: CR of Shoppers Stop Future Retail Trent Kewal Kiran and Pantaloom Fashion does
not differ significantly
Ha: CR of Shoppers Stop Future Retail Trent Kewal Kiran and Pantaloom Fashion
differ significantly.
Table 14: One-way ANOVA for CR
Source of Variation SS df MS F-ratio 5% F-Limit
Between Groups 10.9927 4 2.74819 10.1855 F (20,4)= 2.87
Within Groups 5.39628 20 0.26981
Total 16.389 24
7.7 (b) Interpretation Since the calculated value of F is 10.18548 which is greater than the table value of 2.87
(CV>TV at 5% significance level), the null hypothesis is rejected and the alternative
hypothesis is accepted. Hence, it is concluded that the CR position Shoppers Stop Future
Retail Trent Kewal Kiran and Pantaloom Fashion differ significantly.
7.8 Fixed Assets Turnover Ratio (FTR) This measures the company’s ability to generate sales revenue in relation to the size of the asset investment. A low asset turnover may be remedied by increasing sales or by
disposing of certain assets or both. An increase in the fixed asset figure may result from
the replacement of an asset at an increased price or the purchase of an additional asset
intended to increase production capacity. It is the proportion of sales to the fixed assets,
represented. This ratio is calculated by the following formula and expressed in rupee
terms. � � � �� � �

1643
ISSN: 2347-1697
International Journal of Informative & Futuristic Research (IJIFR)
Volume - 3, Issue -5, January 2016
Continuous 29th Edition, Page No.:1630-1645
K. Sivagnana Sankari, V.Sornaganesh :: Fundamental Analysis Of Large Retail Format In India
The Fixed Assets turnover position of the sample companies is depicted in Table 15 and is discussed below:
Table 15: Fixed Asset Turnover Ratio[FATR] (in %) position of sample companies Year Shoppers Stop Future
Retail
Trent Kewal
Kiran
Pantaloom
Fashion
2011 3.46 4.46 2.08 3.5 -
2012 3.14 2.5 2.32 4.08 -
2013 3.3 2.59 2.56 3.88 1.82
2014 3.41 2.51 2.71 4.56 2.11
2015 3.35 1.91 2.53 4.3 2.09
Average 3.332 2.794 2.44 4.064 1.204
As per the data reveals that Kewal Kiran has the highest Fixed Assets Turnover Ratio of
4.064 times.Pantaloom Fashion has achieved the lowest Fixed Assets Turnover Ratio of
1.204 times. Hence it is concluded that Kewal Kiran is over trading on its assets and it
is the most efficient company among all the other four sample companies.
The FTR position of sample companies are compared and tested using the following
hypothesis:
7.8 (a) Hypothesis Testing H0: FATR of Shoppers Stop Future Retail Trent Kewal Kiran and Pantaloom Fashion
does not differ significantly
Ha: FATR of Shoppers Stop Future Retail Trent Kewal Kiran and Pantaloom Fashion
differ significantly
Table 16: One-way ANOVA for FATR
Source of Variation SS df MS F-ratio 5% F-Limit
Between Groups 22.7603 4 5.69008 11.8491 F (15,4)= 3.06
Within Groups 9.60424 20 0.48021
Total 32.3645 24
7.8(b) Interpretation Since the calculated value of F is 11.84909 which is greater than the table value of 3.06
(CV>TV at 5% significance level), the null hypothesis is rejected and the alternative
hypothesis is accepted. Hence, it is concluded that the FATR position of Shoppers Stop
Future Retail Trent Kewal Kiran and Pantaloom Fashion differ significantly.
The Earning per Share of Kewal Kiran is substantially higher than that of other
retail shops for the data taken from the year 2011 to 2015, Kewal Kiran has
generated EPS of Rs.46.256, making Kewal Kiran is one of the most efficient
company’s in terms of generating earnings.
Kewal Kiran has sustained the highest operating profit margin of 25.376%. Thus
it is found that Kewal Kiran is the most efficient company in controlling costs
and expenses as compare to other sample companies.

1644
ISSN: 2347-1697
International Journal of Informative & Futuristic Research (IJIFR)
Volume - 3, Issue -5, January 2016
Continuous 29th Edition, Page No.:1630-1645
K. Sivagnana Sankari, V.Sornaganesh :: Fundamental Analysis Of Large Retail Format In India
Future Retail has sustained the highest Net profit margin of 300%. Kewal Kiran
is the most efficient company in controlling indirect expenses in comparison to
other sample companies.
Kewal Kiran has the highest portion of its self-owned funds in the capital
structure followed by Trent. Kewal Kiran has the least proportion of debt fund
in its average capital of 0.048 times and hence it is the most efficient company
among all other sample companies.
Trent has achieved the highest ROA of 458.85% and it is the most efficient
company in generating yield over assets and hence their overall efficiency is
better than that of other sample companies.
Pantaloom Fashion is the most efficient company in generating additional
earnings other than four sample companies.
Kewal Kiran has the greater short term solvency and over capitalization of assets
and hence their overall efficiency is better than that of other sample companies.
Kewal Kiran is highly overtrading on its assets and their overall efficiency is
better than that of other sample companies.
7.9 Suggestions
The capital structures of most of the retail companies are expected to remain
stressed due to slower inventory, higher rentals, higher manpower costs and
pressure on operating margins. “The working capital requirements of the retailers
may increase due to slow moving inventory. Traditionally, retailers have relied
on debt to fund their expansion plans, which has led to high interest out go and
reduced free cash flow and moderate capital structures.” Therefore, they have to
raise cheaper funds from other modes of liabilities in order to see the better
margin and Earning per share.
Companies are responding to the pressure on margins by improving employee
productivity, lower capital expenditure (by slowing down new store addition or
by closing down unprofitable stores), changing store formats, better inventory
management and increasing supply chain efficiencies.
8. Conclusion
There are still challenges in the current economic environment like inflation, interest
burden and pressure on margins etc., To counter the falling income growth, the retailers
have been re-locating the existing stores in view of the consumer mix relevant to the
particular store format or closure of unviable stores unable to attract footfalls or generate
desired revenues on per square feet basis.
9. References [1] Jim Berg (1999), Fundamental Analysis using internet, past edition ASX investors update e-mail
newsletter, (www.asx.com.au). [2] John colnan (1994), Fundamental Analysis, SHAW Stock Broking Ltd., by ASX investors update
e-mail newsletter, (www.qsx.com.au)

1645
ISSN: 2347-1697
International Journal of Informative & Futuristic Research (IJIFR)
Volume - 3, Issue -5, January 2016
Continuous 29th Edition, Page No.:1630-1645
K. Sivagnana Sankari, V.Sornaganesh :: Fundamental Analysis Of Large Retail Format In India
[3] John Lynch, “Share Market Analysis-Fundamental analysis Vs. Technical Analysis”, (www.eninarticle.com)
[4] Dr. Maria Nevis Soris and V.Sornaganesh (2012), Fundamental Analysis of NBFC in India, OUTREACH – A Multi-Disciplinary Refereed Journal in 2012.
[5] Punithavathy Pandian (2005) “Security Analysis and Portfolio Management” Vikas Publication Pvt Ltd, New Delhi.
[6] V.Sornaganesh and D.Maheswari (2014), Fundamental Analysis of Indian IT Industry, IJIFR- A multi-disciplinary Referred Journal in 2014.(www.ijifr.com)
[7] Ushasri Tirumala, Senior VP & GM, Mahatton Associates, India, Catalyst Business line 20.11.2015. (www.thehindubusinessline.com)