Fundamental analysis
34
Fundamental Analysis Prepared by Prof. Rahul Mailcontractor Assistant Professor, KLS’s Institute of Management Education and Research, Belgaum, Karnataka
-
Upload
rahul-mailcontractor -
Category
Economy & Finance
-
view
221 -
download
0
Transcript of Fundamental analysis

Fundamental Analysis
Prepared byProf. Rahul Mailcontractor
Assistant Professor,KLS’s Institute of Management Education and Research,
Belgaum, Karnataka

Fundamental Analysis• Fundamental analysis involves determining the
intrinsic value of an equity share. To determine the intrinsic value, the analyst must forecast the earnings and expected dividends from the stock and choose a discount rate which reflects the risk of the stock.
• It is the examination of various factors such as earnings of the company, growth rate and risk exposure that affects the value of shares of a company.
• Fundamental analysis consists of:
Economic analysis: Impact 30-35 % Industry analysis : Impact 15- 20 %
Company analysis: Impact 30-35 %

Economic Analysis
• Economic analysis is the analysis of various macro economic factors that have a significant bearing on the value of various securities. When the level of economic activity is low security prices are low and when the economic activity is high security prices are high. An analysis of the macro economic environment is essential to understand the behavior of stock prices.

The various Macro economic factors are as follows.
Global Economic Factors Tax structure
Fiscal Policy Balance of payments, Forex reserves and exchange rates
Monetary Policy Foreign Direct Investment (FDI)
Gross Domestic Product (GDP)
Investment by FII's
Savings and Investment Business cycles
Inflation Monsoon and Agriculture
Interest rates Infrastructure Facilities
Budget Demographic Factors

Economic Forecasting• To estimate stock price changes, an analyst must look at the macro economic environment
and the factors peculiar to the industry. Economic activities affect corporate profits, investment attitudes and share price. For economic analysis an analyst should be familiar with forecasting techniques. Economic indicators, diffusion index, surveys and econometric model building are some forecasting methods are used for analyzing the state of the economy: Economic indicators: Any economic variable that predicts the future of financial or
economic trends is called an economic indicator. The purpose of using indicators is to make an early diagnosis of the cyclical movements in the economy. It Indicates the present status, progress or slow down of the economy. Indicators are classified as leading, coincidental and lagging.
a. Leading indicators: Indicate what is going to happen in the economy. Popular leading indicators are fiscal policy, monetary policy, productivity, rainfall, capital investment and stock indices.
b. Coincidental indicators: Indicate what the economy is i.e., state of economy. The coincidental indicators are GDP, industrial production, interest rates and reserve funds.
c. Lagging indicators: Changes occurring in leading and coincidental indicators are reflected in lagging indicators. Unemployment rate, consumer price index and flow of foreign funds are examples of such indicators.
The leading. Coincidental and lagging indicators provide an insight into the economy’s current and future position.

Diffusion and Composite index: The diffusion index indicates the current business cycle phase. It measures the breadth of a business cycle movement (Contraction or Expansion).It provides an overview of the economic activity of the country. It is a consensus index consisting of leading, coincidental and lagging indicators and has been constructed by the National Bureau of Economic Research in USA. It is complex and difficult to calculate.
The best of leading, coincidental and lagging indicators are selected and combined into the composite index. It highlights the cyclical patterns in the data and reduces the volatility of individual indicators. A composite index reveals common turning point patterns in a set of economic data more clearly than any individual component.
Econometric Models: An analysis of economic factors provides direction for investment in the stock market. Economist have developed many economic models to forecast endogenous variables. To make forecast the model depends on certain other variables called exogenous variables. The model can be deterministic or stochastic. When an exact relationship is assumed in the model it is deterministic. In stochastic model, one or more variables are random.
Creating macro economic models involves the following steps
a. Selection of the variables
b. Categorization of variables
c. Specification of the model.
d. Collection of data
e. Estimation of the parameters.

Industry Analysis• Industry Analysis: An analysis of the performance, prospects and problems
of an industry is known as industry analysis. Industry analysis is required because the return and risk of various industries are different. The performance of the industry reflects the performance of the companies it consists. Industry analysis is used to analyze the performance of the industries over the years.
• An industry is a group of firms that have a similar technological structure of production and produce similar goods and services.
• Industries can be classified into: Growth industry: Has high rate of earnings and growth is independent
of business cycle. The expansion depends on technological change. Ex. IT, Pharma.
Cyclical industry: Growth and profitability of the industry move along with the business cycle. During boom, industry enjoys growth and during depression they suffer a setback. Ex. Real Estate, Capital Goods.
Defensive industry: It is an industry which defies the business cycle. The stocks of defensive industries can be held as they pay dividends on a regular basis. The expand and earn income in depression also. They are counter cyclical in nature. Ex. FMCG
Cyclical growth industry: It is an industry that is cyclical and at the same time growing. Changes in technology and introduction of new models can help the industry resume its growth path. Ex. Automobile.

The Industry Life Cycle
Intr
odu
ctio
n
Gro
wth
Mat
uri
ty
Dec
lin
eTime
Tot
al I
nd
ust
ry R
even
ue
Industries evolve over time, both structurally and in terms of overall size. The industry life cycle is measured in total industry sales and the growth in total industry sales. The industry structure and competitive forces that shape the environment in which businesses operate change throughout the life cycle. Therefore a business's strategy must adapt accordingly. It is useful to consider the evolution of the industry life cycle in the context of Porter’s 5 Forces.

Industry Life cycle• The life cycle of an industry is separated into four well defined
stages
a. Pioneering stage: In this stage the prospective demand for the product is promising and the technology used to manufacture the product is low. The demand for the product encourages many entrants and there is severe competition among rivals. The entrants try to develop a brand name, differentiate the product and create product image. The severe competition leads to change in market share and position of the firm and variation in profits. It is very difficult to invest in companies at the pioneering stage.
Ex. E-commerce
b. Rapid Growth stage: After the pioneering stage the companies that have withstood the competition improve their market share and financial performance. The technology improves resulting in lower cost of production and good quality products. The companies have stable growth. It is advisable to invest in these companies. Ex. Pharma. IT

c. Maturity and stabilization stage: In the stabilization stage the growth rate of the industry tends to moderate and the rate of growth stabilizes. Symptoms of obsolescence may appear in the technology. Technological innovations in the production process and product have to be introduced. The industry will start to consolidate, possibly through mergers and acquisitions. Mature industries are settled , risks are low and cash is generated. However, rivalry among competitors is fierce and falling prices pose a serious threat to profitability.
d. Declining stage: In this stage, demand for the product and the earnings of the company decline. Innovation and change in consumer preference lead to this stage. The specific features of the declining stage is that even in boom, the growth of the industry is low and declines at a higher rate during a recession. It is better avoiding investment in such industries.

Study of structure and characteristics of an industryAn investor must analyze the following factors:• Growth of the industry: The historical performance of the
industry in terms of growth and profitability must be analyzed. The past variability in returns and growth in reaction to macroeconomic factors must be analyzed and future estimates of growth must be forecasted.
• Cost structure and profitability: The cost structure affects the cost of production and profitability of the firm. Cost structure of the industry in terms of fixed and variable cots must be analyzed. Factors like inventory turnover and asset turnover must be analyzed which is an indication of capacity utilization of an industry. Analyzing Profitability ratios helps us understand the profitability of the industry.
• Nature of the product and demand: The products produced by industries are demanded by consumers and other industries. An investor must analyze the condition of the feeder industry as well as the end user industry to assess the demand for industrial goods. In case of consumer goods industry, a change in consumer preference, technological innovations and substitute products affect the demand.

• Nature of the competition: The number of firms in the industry and the market share of top firms must be analyzed. Factors like Entry Barriers and Exit Barriers, Degree of homogeneity and differentiation of products practiced by various players, Pricing policies, Competition from foreign players etc must be analyzed.
• Government policy: Government polices affect the industries directly. Factors like tax subsidies and tax holidays, regulations and pricing policy , Entry and exit barriers set by government and liberalization of licensing must be analyzed. Government policies on environment and pollution control standards affect various industries.
• Labor: Labor scenario in a particular industry is very important. The number of trade unions and their operating mode have an impact on labor productivity. Frequent strikes and lockouts result in loss of production and high fixed capital loss. Availability of Skilled and unskilled labor must be analyzed.
• Research and Development: For any industry to survive competition in national and international market, the product and production process must be competitive. This depends on R&D. The expenditure on R&D should be studied before making any investment in industry.

PORTER’S FIVE FORCES MODEL
Threat of new entrants
Bargaining power Bargaining power of buyers
of suppliers
Threat of substitutes
Five forces shaping competition & determining profitability in industry
Potential entrants
Industry competitorsRivalry among existing
playersSuppliers Buyers
Substitutes

PORTER’S FIVE FORCES MODEL
1. Threat of new entrants: The entry of new companies in the market increases the competition and reduces profitability. The entry and exit barriers for a particular industry decide the number of new entrants. Government rules and regulation for starting a company is a major factor for new entrants. The capital required to start new companies, economies of scale, customer switching costs, resistance of existing players are main barriers for entrants.
2. Bargaining power of Buyers: Buyers are a competitive force. They can bargain for price cut, superior and better service and induce rivalry among competitors. If they are powerful. They can depress the profitability of suppliers. Bargaining power of buyers is high when. •Its purchasing power is relatively large to the seller•Its switching costs are low•It poses strong threat to backward integration

3. Bargaining Power of Suppliers: Suppliers can exert competitive force in an industry as they can raise prices, lower quality and curtail the range of free services they provide. Powerful suppliers can affect the profitability of the buyer industry. Suppliers have strong bargaining power when
• A few suppliers dominate the industry and there are many buyers
• There are no substitutes for the product supplied.
• The switching cost of buyers is high
•If suppliers pose a threat of forward integration.
4. Rivalry Among Existing Players: Firms in an industry compete on the basis of price, quality, promotions, services etc. A firms attempt to improve its competitive position provokes retaliatory action from others. This can affect the profitability of industry. Rivalry tends to be high when
•The number of competitors is large
•Few firms are capable of engaging in competitive battle
•Industry growth is sluggish forcing the firms to acquire a larger market share
•The level of fixed cost are high forcing the firms to achieve higher capacity utilization
•The industry has high exit barriers

5. Threat from the Substitutes: All firms in an industry face competition from industries producing substitutes products. Substitute product may limit the profit potential of the industry. The threat of substitute products is high when
• The price performance tradeoff offered by substitutes is attractive
• The switching costs for buyer is low
• The substitute products are produced by industry earnin superior Profits.

Company Analysis• Evaluating the financial performance of the company on the
basis of qualitative factors and quantitative factors is company analysis.
• Qualitative Factors: The qualitative factors that affect the value of a company are
1. Business Model: The way in which a company makes money. It describes company’s operations, mode of revenue generation, nature of expenses, organization structure and its sales and marketing effort.
2. Management :Good and capable management teams generate profits. Management should attain the stated objectives of the company and create value for all the stake holders. The criterion used for management analysis is management discussion and analysis, management ownership of equity stake.

3. Corporate governance : It refers to the set of systems and practices put in place by the company to ensure accountability, transparency and fairness in order to safeguard the interest of the stake holders. Areas of corporate governance are
a) Structure of board of directors
b) Financial and information transparency
c) Stake holders rights
4. Corporate culture : It refers to the collective beliefs, values, systems and processes of the company. Every company has set of values and goals that helps to define what the business is about. The basis of corporate culture is expressed in terms of the policies and procedures adopted in the company’s functioning.

• Quantitative Factors1. Earnings of the company: Earnings decide its stock value in the
market. Growing earnings result in high valuation of the stock. Earnings are operating profits. Earnings are generated from operating sources and non operating sources. The following factors have an effect on the earnings of a company.
a. Change in sales b. Change in cost c. Depreciation method d. Depletion of resources e. Inventory accounting method. f. Replacement cost of inventory g. Wages, salaries h. Income tax and other taxes.
Measurement of earnings: Gross Profit= Sales – Cost of Goods Sold (COGS) EBITDA = Gross profit- Operating Expenses EBIT = EBITDA – (Depreciation and Amortization) EBT= EBIT – Interest EAT= EBT – Tax

• EPS(Earnings per share): EPS gives the overall picture of the performance of the company.
• EPS = Net Income – Dividends on Preference Shares
Average Outstanding Shares
• P/E multiple (Price Earnings multiple) The price earnings ratio reflects the price investors are willing to pay for every rupee of earning per share. It is calculated in retrospective or prospective manner. A high P/E ratio indicates high Expectations of the market regarding the growth of the company’s future earnings. Investors compare the P/E ratio of company to that of the industry and market.
• P/E ratio = Market price per share
Earnings per share

2. Financial Leverage: The degree of utilization of Borrowed money in a business is known as the financial leverage. It involves the selection of appropriate financing mix , proportion of long term debt and equity capital (Net worth) i.e., capital structure of a company . A high degree of financial leverage results in high interest payments. This will affect the net profits to equity holders.
• Financial Leverage = Total Debt
Share holder’s equity
Degree of Financial Leverage (DFL) = % change in EPS
% change in EBIT
Degree of Financial Leverage (DFL) = EBIT
EBIT – Interest(EBT)
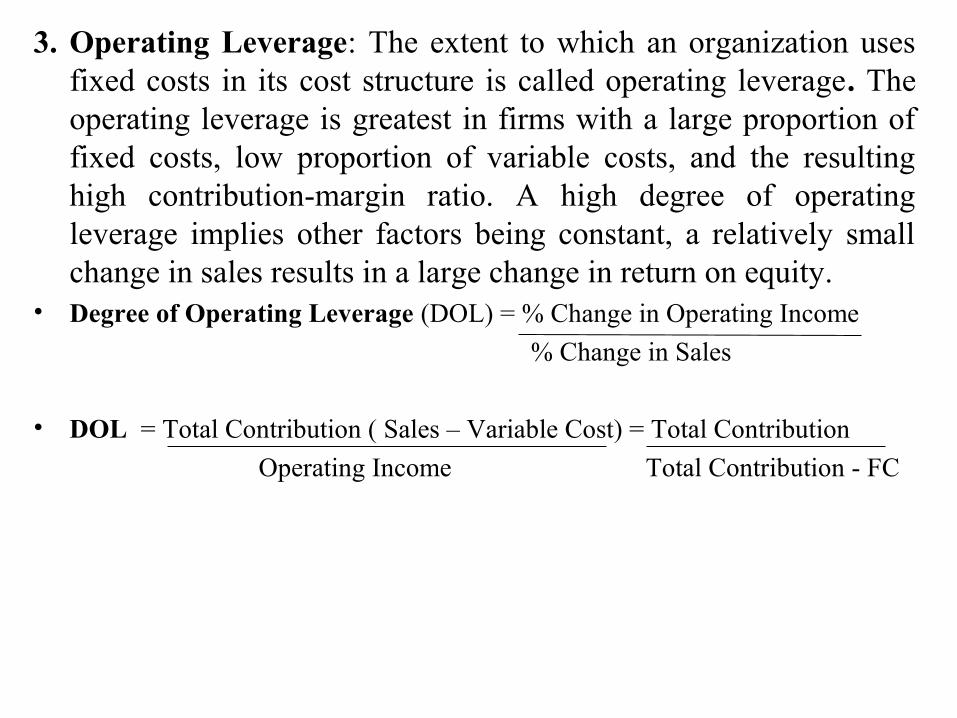
3. Operating Leverage: The extent to which an organization uses fixed costs in its cost structure is called operating leverage. The operating leverage is greatest in firms with a large proportion of fixed costs, low proportion of variable costs, and the resulting high contribution-margin ratio. A high degree of operating leverage implies other factors being constant, a relatively small change in sales results in a large change in return on equity.
• Degree of Operating Leverage (DOL) = % Change in Operating Income
% Change in Sales
• DOL = Total Contribution ( Sales – Variable Cost) = Total Contribution
Operating Income Total Contribution - FC

4. Competitive Edge: The competitiveness of a company can be assed by looking at the following aspects
• Market share: The market share of annual sales helps determine a company’s relative position within the industry. If market share is high the company will be able to meet the competition successfully. While assessing the market share the size of the company should also be considered.
• Growth of sales: A company with rapid growth in sales is better for share holders than one with stagnant growth rate. Investors prefer a large company because it is able to withstand the business cycle. Growth in sales results in growth in profits.
• Stability of Sales: A company with stable sales revenue will have more stable earnings. Wide variation in sales lead to variation in capacity utilization. The fall in market share indicates a declining trend for the company even if the sales are stable. Stability of shares should be compared to market share.

• Production Efficiency: Production efficiency means producing the maximum output at minimum cost per unit of output. This measures how well the production process is performing. Increasing efficiency boosts the capacity of the business without any change in number of inputs employed. Production efficiency enables the firm to produce goods at a lower cost than competitors and generate more profits. Production efficiency results in Increase in profitability, Low operational costs, Optimum use of company resources, Enhanced competitiveness and market share and superior return to the investor.

Financial Analysis• It involves analyzing the financial statements of the company
from various view points. The financial statements give the historical and current information of the company’s operations. Historical financial statements helps to predict the future.
• The financial statements of the company include:Balance sheet: It shows the status of a company’s financial
position at the end of the year. It is snapshot of company’s Assets, Liabilities and Equity
Profit and loss account: It shows the profit and loss made by the company during a period. It shows the Sales, expenses, and taxes incurred to operate
Fund flow and Cash Flow Statement: It shows the sources and application of funds

Analysis of Financial Statements• It helps the investor in determining the financial position and progress of
the company.• The various simple analyses that are performed to ascertain the financial
position of the company are: Comparative financial statement: Here data from the current year’s
financial statements is compared with similar data from the previous year’s financial statements.
Trend analysis: It shows the growth and decline of sale or profit over the years.
Common size statement: Common size balance sheet shows each item in balance sheet as a percentage of total assets for assets and each item as a percentage of total liabilities. Common size income statement shows each item of expense as a percentage of net sales. With common size statements comparisons can be made between firms of different sizes.
Fund flow analysis: It is a statement of the sources and application of funds.
Cash flow analysis: It shows cash inflow and outflow of a company during the year.
Ratio analysis: Ratios summarize the data for easy understanding, comparisons and interpretations.

Financial Ratio Analysis• Liquidity Ratios (ability to meet financial obligations)
• Leverage Ratios (use of debt)
• Turn over Ratios (asset management or efficiency ratios)
• Profitability Ratios (Reflect profitability)

Liquidity Ratios• Measure ability to pay maturing obligations
• Current ratio = Current assets
current liabilities
• Quick ratio or
• Acid test ratio = Current assets - Inventories current liabilities

Leverage or Debt Ratios• Measure extent to which firm uses debt to finance asset
investment (risk attribute)
• Debt-equity ratio = Total debt
Equity( Net worth)
• Total debt to total assets ratio
• Debt to asset ratio = (Current liabilities + long-term debt)
Total assets
• Interest coverage ratio = EBIT
Interest

Turn over Ratios Efficiency Ratios• Measure effectiveness of asset management• Inventory turnover (times per year)= Net sales
Average inventory
• Total asset turnover = Sales Average Total assets
• Fixed asset turnover = Sales Average net fixed assets
• Debtor turn over = Net credit Sales
Average Debtors

Profitability Ratios• Measures profits relative to sales (profit margin ratios)
• Gross profit margin = Gross profit (Sales – COGS)
Sales
• Operating Profit Margin =Operating profits(Gross Profit – OE)
Sales
• Net profit margin = Net profit (PAT)
Sales
• Rate of return ratios
• Return on Assets (ROA) = Net Profit(PAT)
Total Assets
• Return on Equity (ROE) = Net Profit
Stockholder Equity
Excludes preferred stock balances

Valuation Ratios• Earnings per share (EPS):
• EPS = Net Income – Dividends on Preference Shares
Average Outstanding Shares
• P/E ratio = Market price per share
Earnings per share
• Dividend yield = Annual dividend
price per share
• Dividend payout = Dividends per share (DPS)
Earnings per share (EPS)
• Book value per share = Net worth
Number of shares
• Market price to Book Value( P/B ratio) = Market price per share
Book value per share

DuPont Analysis
3 Ratio
Equity
Assets Total
2 Ratio
Assets Total
Sales
1 Ratio
Sales
ProfitsNet
Equity
ProfitsNet ROE ××==
Ratio 1 = NPM Ratio 2 = TATO Ratio 3 = Equity Multiplier
The DuPont System suggests that ROE (which drives stock price) is a functionof cost control, asset management, and debt management.

Growth in Earnings
• Growth Rate= Retention ratio X ROE
• Retention Ratio= Retained earnings /Net Income;