Functions Copyright 2014 Scott Storla. The Basic Graphs.
28
Functions Copyright 2014 Scott Storla
-
Upload
laura-james -
Category
Documents
-
view
214 -
download
0
Transcript of Functions Copyright 2014 Scott Storla. The Basic Graphs.

Functions
Copyright 2014 Scott Storla
What will be the cost of one year of community college in 2016?
Copyright 2014 Scott Storla
Idea
1. Gather data on past costs.
2. Make a picture of the data to look for a pattern.
3. If a pattern exists, describe the pattern using numbers, operations, grouping and variables.
4. Predict the past or future using the result of step 3.

Step 1. Gather data
Copyright 2014 Scott Storla
Copyright 2014 Scott Storla
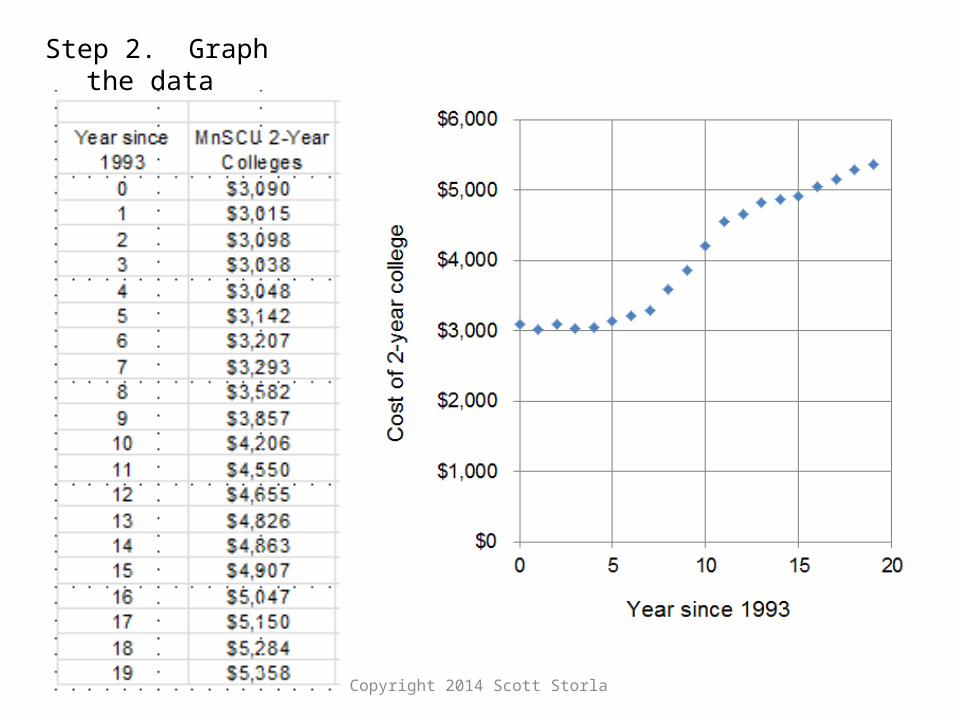
Step 2. Graph the data

Copyright 2014 Scott Storla
Step 2. Look for patterns

Copyright 2014 Scott Storla
Step 2. Graph the data

Copyright 2014 Scott Storla
Step 2. Graph the data

Copyright 2014 Scott Storla
Step 2. Look for patterns

Copyright 2014 Scott Storla
Step 3. Model using algebra

Copyright 2014 Scott Storla
Step 4. Predict the futureWhat’s the cost in 2016?
Around $5,800
What’s the cost in 2016?
99 4563y x
99 12 4563y
$5,751y

Copyright 2014 Scott Storla
Written
Graph
Equation Data Table99 4563y x
I’d like to use the year to predict the cost of college.

Domain and Range
Copyright 2014 Scott Storla
Copyright 2011 Scott Storla
0
3
4
8
40
48
50
54
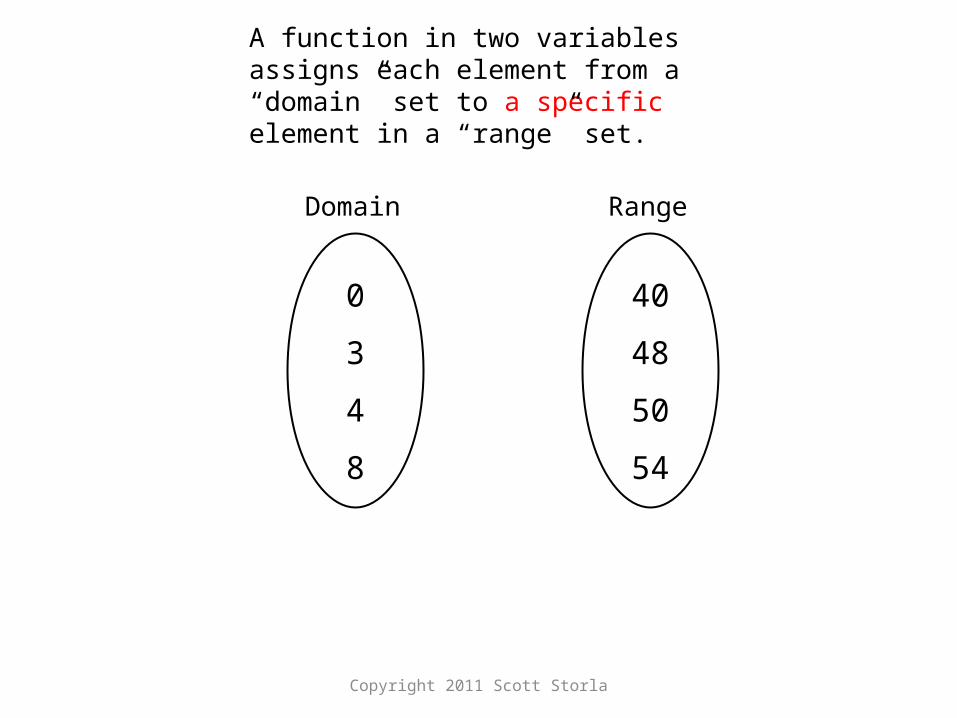
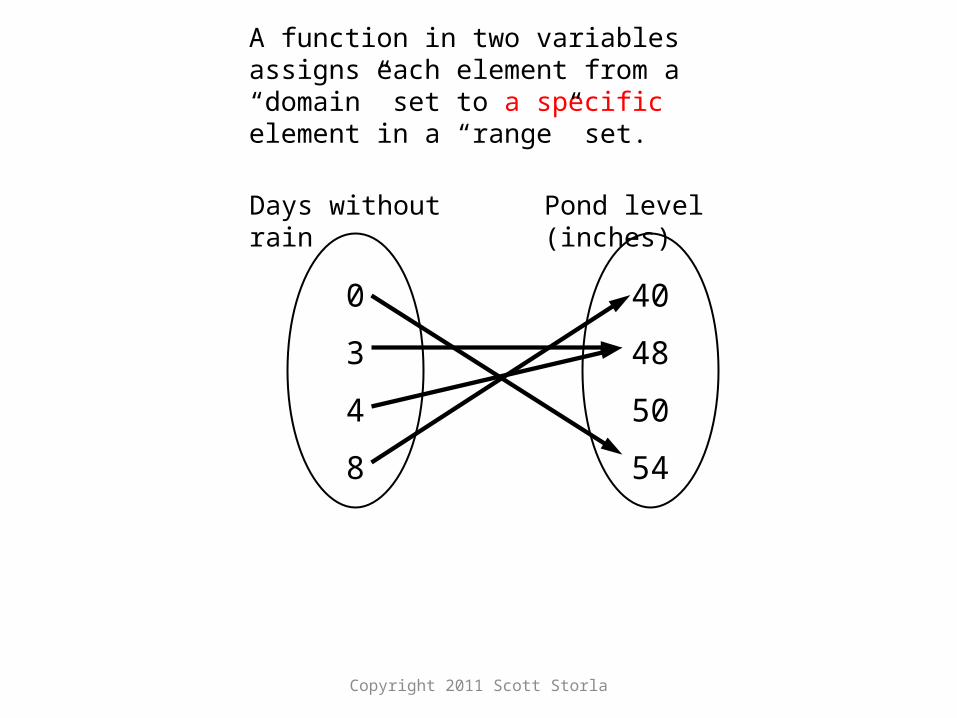
A function in two variables assigns each element from a “domain” set to a specific element in a “range” set.
Domain Range

Copyright 2011 Scott Storla
A function in two variables assigns each element from a “domain” set to a specific element in a “range” set.
Domain
Independent variable
Input
Explanatory variable
Manipulated variable
Controlled variable
Range
Dependent variable
Output
Response variable
Response variable
Measured variable

Copyright 2011 Scott Storla
0
3
4
8
40
48
50
54
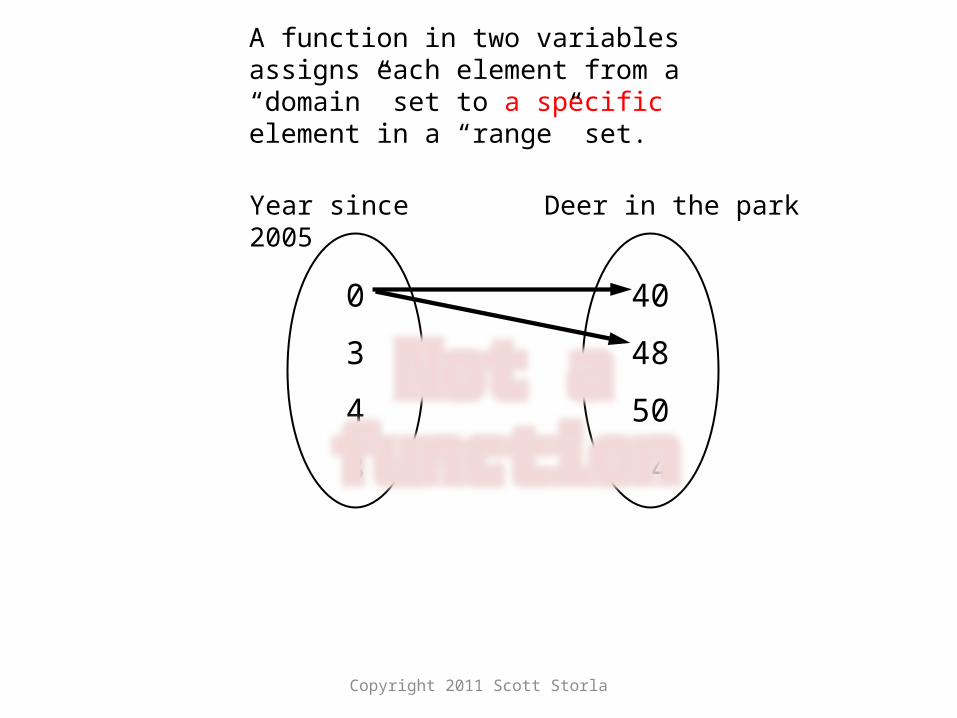
Year since 2005 Deer in the park
A function in two variables assigns each element from a “domain” set to a specific element in a “range” set.
Domain Range
Copyright 2011 Scott Storla
0
3
4
8
40
48
50
54
Year since 2005 Deer in the park
Not a function
A function in two variables assigns each element from a “domain” set to a specific element in a “range” set.
Copyright 2011 Scott Storla
0
3
4
8
40
48
50
54
Days without rain Pond level (inches)
A function in two variables assigns each element from a “domain” set to a specific element in a “range” set.

Copyright 2014 Scott Storla
99 4563y x
Graph
I’d like to predict the cost of college given the year.
Domain and Range
Domain Range
Domain
Range
DomainRange

Copyright 2014 Scott Storla
99 4563y x
I’d like to predict the cost of college given the year.
Domain and Range
Domain Range
Domain
Range
DomainRange

Domain and Range
Copyright 2014 Scott Storla
Describing a Data Table Algebraically
Copyright 2014 Scott Storla

Copyright 2014 Scott Storla
99 4563y x
Graph
I’d like to predict the cost of college given the year.
Describing a data table algebraically

Copyright 2014 Scott Storla
The Basic Graphs
The linear function y x
The quadratic function 2y x
The square root function y x
The exponential function xy e
The logarithmic function lny x
Copyright 2014 Scott Storla
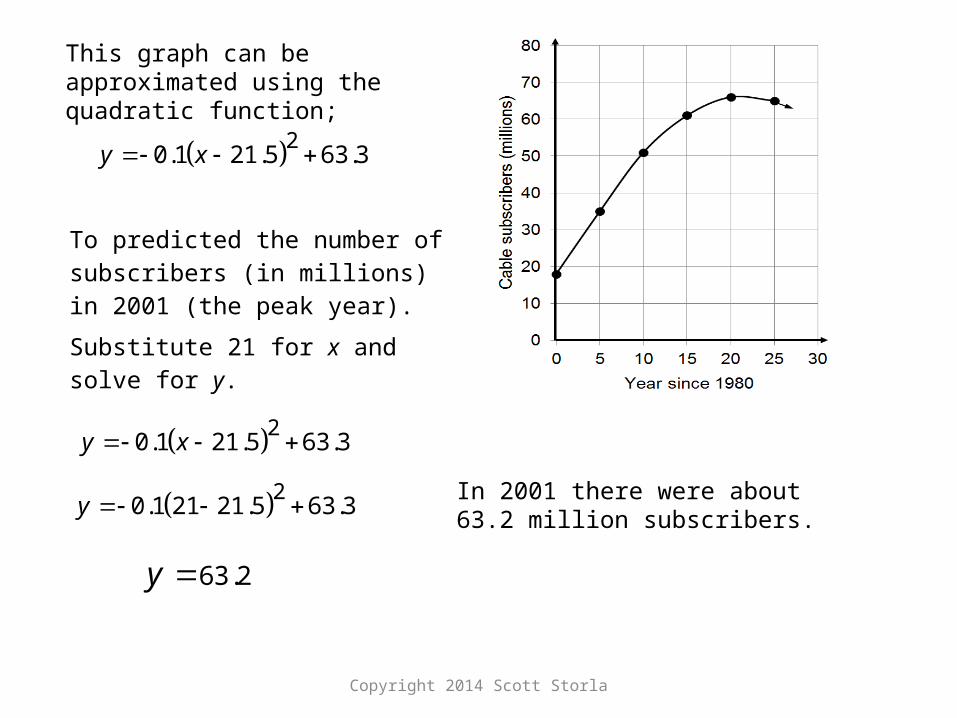
This graph can be approximated using the quadratic function;
20.1 21.5 63.3y x
To predicted the number of subscribers (in millions) in 2001 (the peak year).
Substitute 21 for x and solve for y.
20.1 21.5 63.3y x
20.1 21 21.5 63.3y
63.2y
In 2001 there were about 63.2 million subscribers.

Copyright 2014 Scott Storla
Use the graph to predict the first year there were 50 million subscribers.
This graph can be approximated using the quadratic function;
20.1 21.5 63.3y x
To predict the year the number of subscribers will return to 50 million. Substitute 50 for y and solve for x
Continue the curve and predict when the number of subscribers will return to 50 million.
20.1 21.5 63.3y x
250 0.1 21.5 63.3x
Oper Inv
21.5 21.5
^2
0.1 0.1
63.3 63.3
133 21.5x
21.5 133 x
10 or 33x x
There will be 50 million subscribers in 1990 and again in 2013

Copyright 2014 Scott Storla
b. Replace y with 40 to find the approximate age of a boy (in months) that is 40 cm tall.
This graph can be approximated using the square root function;
2.9 20.1y x
a. Predict the height of a boy that is 35 months old by replacing x with 35.

Copyright 2014 Scott Storla
a. Replace x with 12 to predict the pieces of malware in 2015.
This graph can be approximated using the exponential function;
0.590.82 xy e
b. Replace y with 100 to predict the first year that the number of pieces of malware will reach one hundred million.

Describing a Data Table Algebraically
Copyright 2014 Scott Storla