Functionally Independent Components of the Late Positive ... · Functionally Independent Components...
16
Functionally Independent Components of the Late Positive Event-Related Potential during Visual Spatial Attention Scott Makeig, 1 Marissa Westerfield, 2,5 Tzyy-Ping Jung, 3 James Covington, 2 Jeanne Townsend, 2,5 Terrence J. Sejnowski, 3,4 and Eric Courchesne 2,5 1 Naval Health Research Center, San Diego, California 92186-5122, 2 Children’s Hospital Research Center, San Diego, California 92123, 3 Howard Hughes Medical Institute, Computational Neurobiology Laboratory, The Salk Institute for Biological Studies, La Jolla, California 92037, and Departments of 4 Biology, and 5 Neurosciences, University of California San Diego, La Jolla, California 92093 Human event-related potentials (ERPs) were recorded from 10 subjects presented with visual target and nontarget stimuli at five screen locations and responding to targets presented at one of the locations. The late positive response complexes of 25–75 ERP average waveforms from the two task conditions were simultaneously analyzed with Independent Component Analysis, a new computational method for blindly separating linearly mixed signals. Three spatially fixed, temporally inde- pendent, behaviorally relevant, and physiologically plausible components were identified without reference to peaks in single-channel waveforms. A novel frontoparietal component (P3f) began at ;140 msec and peaked, in faster responders, at the onset of the motor command. The scalp distribution of P3f appeared consistent with brain regions activated during spatial orienting in functional imaging experiments. A longer-latency large component (P3b), positive over parietal cortex, was fol- lowed by a postmotor potential (Pmp) component that peaked 200 msec after the button press and reversed polarity near the central sulcus. A fourth component associated with a left fron- tocentral nontarget positivity (Pnt) was evoked primarily by target-like distractors presented in the attended location. When no distractors were presented, responses of five faster- responding subjects contained largest P3f and smallest Pmp components; when distractors were included, a Pmp compo- nent appeared only in responses of the five slower-responding subjects. Direct relationships between component amplitudes, latencies, and behavioral responses, plus similarities between component scalp distributions and regional activations re- ported in functional brain imaging experiments suggest that P3f, Pmp, and Pnt measure the time course and strength of functionally distinct brain processes. Key words: electroencephalogram; event-related potential; evoked response; independent component analysis; reaction time; P300; motor; inhibition; frontoparietal; orienting Late positive event-related potentials (ERPs) (300 –1000 msec) dominated by a vertex-positive response, called P300, occur in response to stimuli perceived as belonging to an infrequently presented category (Sutton et al., 1965). Although similar late positive responses are reliably evoked by visual, auditory, or somatosensory stimuli in a variety of tasks, they may not be unitary (Squires et al., 1975; Ruchkin et al., 1990). Their ampli- tudes and peak latencies are affected by several task variables, including attention and novelty, and their scalp distributions vary both within and across responses. Results of lesion studies (Hal- gren et al., 1980; Knight et al., 1989) and functional imaging experiments (Ford et al., 1994; Ebmeier et al., 1995) also suggest that late positive responses are complexes of components gener- ated in more than one brain region. Scalp-recorded late positive complexes (L PC s) cannot be easily decomposed into components, because their time courses and scalp projections generally overlap. L PC components are com- monly identified with single response peaks in single-channel waveforms. By this procedure, Squires et al. (1975) reported that auditory target responses in some subjects contained three com- ponents. Others have attempted to identif y components with peaks in difference waves between LPCs evoked in simple and choice response tasks (Hohnsbein et al., 1991; Falkenstein et al., 1995). However, none of these studies adequately assessed the spatial stationarity of the response near the identified peaks. Thus, they could not be sure that each peak was composed of only one spatially fixed component. Peak-based methods also cannot be used when response components do not produce separate peaks. Nor can they determine other details of the component time courses. Independent Component Analysis (ICA), a new approach to linear decomposition (Bell and Sejnowski, 1995; Makeig et al., 1996a, 1997), can overcome some of these limita- tions. ICA is compatible with the assumption that an ERP is the sum of brief, coherent activations occurring in a small number of brain regions whose spatial projections on the scalp are fixed across time and task conditions. Nearly all visual LPC studies have used simple tasks involving the presentation of two or three stimulus types in pseudorandom order at a single spatial location. Most ERP studies of spatial selective attention, in contrast, have focused on early visual re- sponse features whose amplitudes are augmented or suppressed Received Sept. 16, 1998; revised Jan. 14, 1999; accepted Jan. 21, 1999. This report was supported by the Office of Naval Research, Department of the Nav y (ON R.reimb.6429 to S.M.), the Howard Hughes Medical Institute (T.S.), and the National Institutes of Health (National Institute of Neurological Diseases and Stroke NS34155 to J.T. and National Institute of Mental Health M H36840 to E.C.). The views expressed in this article are those of the authors and do not reflect the official policy or position of the Department of the Nav y, Department of Defense, or the United States Government. Approved for public release, distribution unlimited. We are grateful for thoughtful suggestions on this manuscript by Drs. E. Donchin and J. Polich. Correspondence should be addressed to Dr. Scott Makeig, Naval Health Research C enter, P.O. Box 85122, San Diego, CA 92186-5122. Copyright © 1999 Society for Neuroscience 0270-6474/99/192665-16$05.00/0 The Journal of Neuroscience, April 1, 1999, 19(7):2665–2680
Transcript of Functionally Independent Components of the Late Positive ... · Functionally Independent Components...
Functionally Independent Components of the Late PositiveEvent-Related Potential during Visual Spatial Attention
Scott Makeig,1 Marissa Westerfield,2,5 Tzyy-Ping Jung,3 James Covington,2 Jeanne Townsend,2,5
Terrence J. Sejnowski,3,4 and Eric Courchesne2,5
1Naval Health Research Center, San Diego, California 92186-5122, 2Children’s Hospital Research Center, San Diego,California 92123, 3Howard Hughes Medical Institute, Computational Neurobiology Laboratory, The Salk Institute forBiological Studies, La Jolla, California 92037, and Departments of 4Biology, and 5Neurosciences, University of CaliforniaSan Diego, La Jolla, California 92093
Human event-related potentials (ERPs) were recorded from 10subjects presented with visual target and nontarget stimuli atfive screen locations and responding to targets presented atone of the locations. The late positive response complexes of25–75 ERP average waveforms from the two task conditionswere simultaneously analyzed with Independent ComponentAnalysis, a new computational method for blindly separatinglinearly mixed signals. Three spatially fixed, temporally inde-pendent, behaviorally relevant, and physiologically plausiblecomponents were identified without reference to peaks insingle-channel waveforms. A novel frontoparietal component(P3f) began at ;140 msec and peaked, in faster responders, atthe onset of the motor command. The scalp distribution of P3fappeared consistent with brain regions activated during spatialorienting in functional imaging experiments. A longer-latencylarge component (P3b), positive over parietal cortex, was fol-lowed by a postmotor potential (Pmp) component that peaked
200 msec after the button press and reversed polarity near thecentral sulcus. A fourth component associated with a left fron-tocentral nontarget positivity (Pnt) was evoked primarily bytarget-like distractors presented in the attended location. Whenno distractors were presented, responses of five faster-responding subjects contained largest P3f and smallest Pmpcomponents; when distractors were included, a Pmp compo-nent appeared only in responses of the five slower-respondingsubjects. Direct relationships between component amplitudes,latencies, and behavioral responses, plus similarities betweencomponent scalp distributions and regional activations re-ported in functional brain imaging experiments suggest thatP3f, Pmp, and Pnt measure the time course and strength offunctionally distinct brain processes.
Key words: electroencephalogram; event-related potential;evoked response; independent component analysis; reactiontime; P300; motor; inhibition; frontoparietal; orienting
Late positive event-related potentials (ERPs) (300–1000 msec)dominated by a vertex-positive response, called P300, occur inresponse to stimuli perceived as belonging to an infrequentlypresented category (Sutton et al., 1965). Although similar latepositive responses are reliably evoked by visual, auditory, orsomatosensory stimuli in a variety of tasks, they may not beunitary (Squires et al., 1975; Ruchkin et al., 1990). Their ampli-tudes and peak latencies are affected by several task variables,including attention and novelty, and their scalp distributions varyboth within and across responses. Results of lesion studies (Hal-gren et al., 1980; Knight et al., 1989) and functional imagingexperiments (Ford et al., 1994; Ebmeier et al., 1995) also suggestthat late positive responses are complexes of components gener-ated in more than one brain region.
Scalp-recorded late positive complexes (LPCs) cannot be easily
decomposed into components, because their time courses andscalp projections generally overlap. LPC components are com-monly identified with single response peaks in single-channelwaveforms. By this procedure, Squires et al. (1975) reported thatauditory target responses in some subjects contained three com-ponents. Others have attempted to identify components withpeaks in difference waves between LPCs evoked in simple andchoice response tasks (Hohnsbein et al., 1991; Falkenstein et al.,1995). However, none of these studies adequately assessed thespatial stationarity of the response near the identified peaks.Thus, they could not be sure that each peak was composed of onlyone spatially fixed component. Peak-based methods also cannotbe used when response components do not produce separatepeaks. Nor can they determine other details of the componenttime courses. Independent Component Analysis (ICA), a newapproach to linear decomposition (Bell and Sejnowski, 1995;Makeig et al., 1996a, 1997), can overcome some of these limita-tions. ICA is compatible with the assumption that an ERP is thesum of brief, coherent activations occurring in a small number ofbrain regions whose spatial projections on the scalp are fixedacross time and task conditions.
Nearly all visual LPC studies have used simple tasks involvingthe presentation of two or three stimulus types in pseudorandomorder at a single spatial location. Most ERP studies of spatialselective attention, in contrast, have focused on early visual re-sponse features whose amplitudes are augmented or suppressed
Received Sept. 16, 1998; revised Jan. 14, 1999; accepted Jan. 21, 1999.This report was supported by the Office of Naval Research, Department of the
Navy (ONR.reimb.6429 to S.M.), the Howard Hughes Medical Institute (T.S.), andthe National Institutes of Health (National Institute of Neurological Diseases andStroke NS34155 to J.T. and National Institute of Mental Health MH36840 to E.C.).The views expressed in this article are those of the authors and do not reflect theofficial policy or position of the Department of the Navy, Department of Defense, orthe United States Government. Approved for public release, distribution unlimited.We are grateful for thoughtful suggestions on this manuscript by Drs. E. Donchinand J. Polich.
Correspondence should be addressed to Dr. Scott Makeig, Naval Health ResearchCenter, P.O. Box 85122, San Diego, CA 92186-5122.Copyright © 1999 Society for Neuroscience 0270-6474/99/192665-16$05.00/0
The Journal of Neuroscience, April 1, 1999, 19(7):2665–2680
in response to stimuli presented at attended or nonattendedlocations (Hillyard et al., 1995). Here, we present results ofapplying ICA to 31-channel ERP recordings of ERPs evoked intwo visual selective attention tasks. We demonstrate that LPCsevoked in these tasks can be robustly decomposed into fourcomponents with distinct time courses and relationships to be-havior. Two of these components varied in amplitude and peaklatency between faster- and slower-responding subjects, suggest-ing that intersubject differences in visual response speed may beaccounted for by differences in the degree to which independentcomponents of the scalp-recorded LPC are activated. In particu-lar, a new frontoparietal component (P3f) appears to reflect brainactivity involved in rapidly responding to stimuli presented at anattended location.
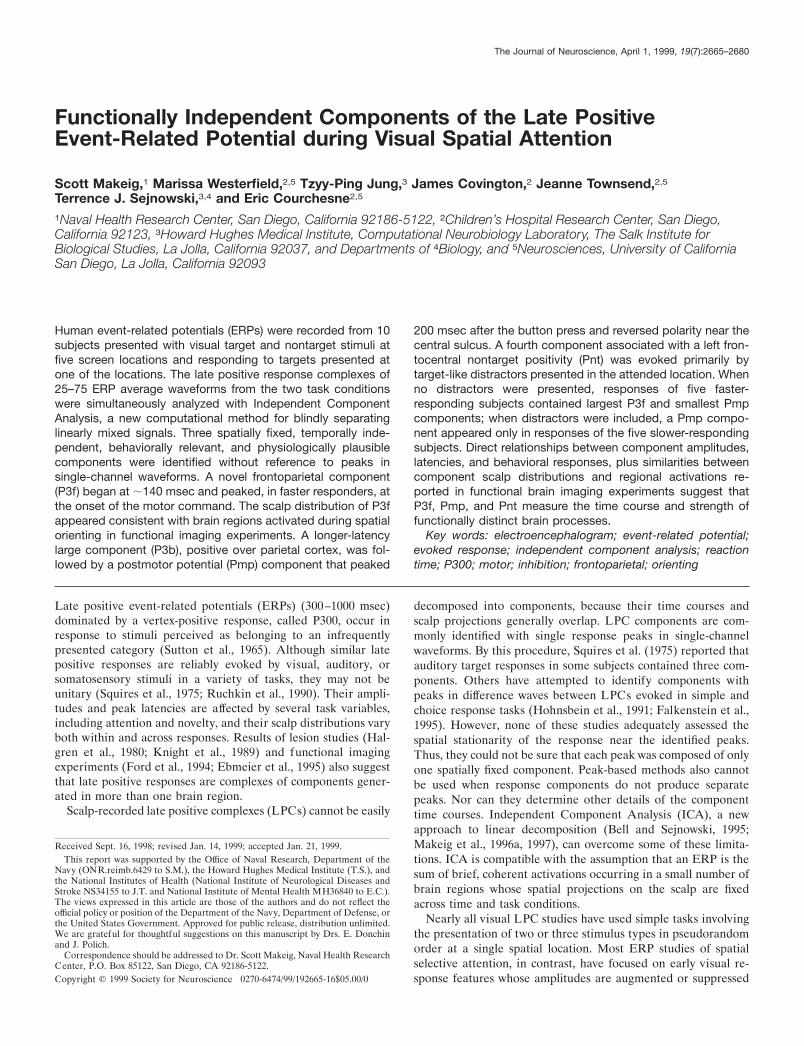
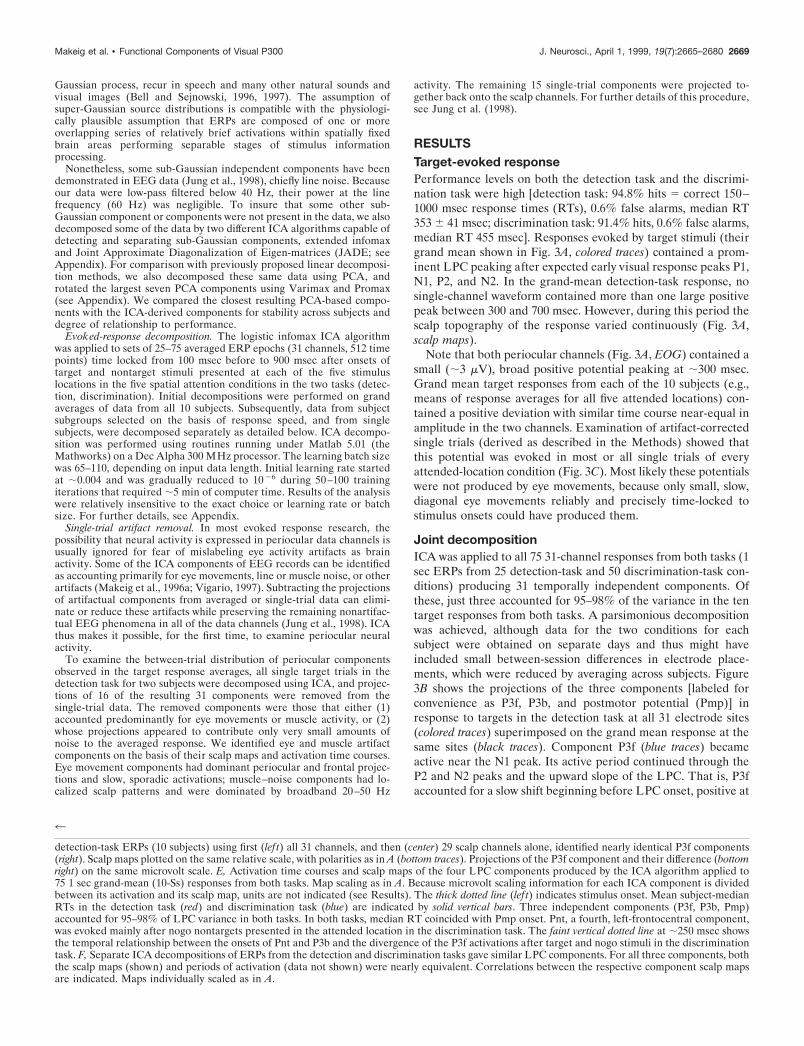
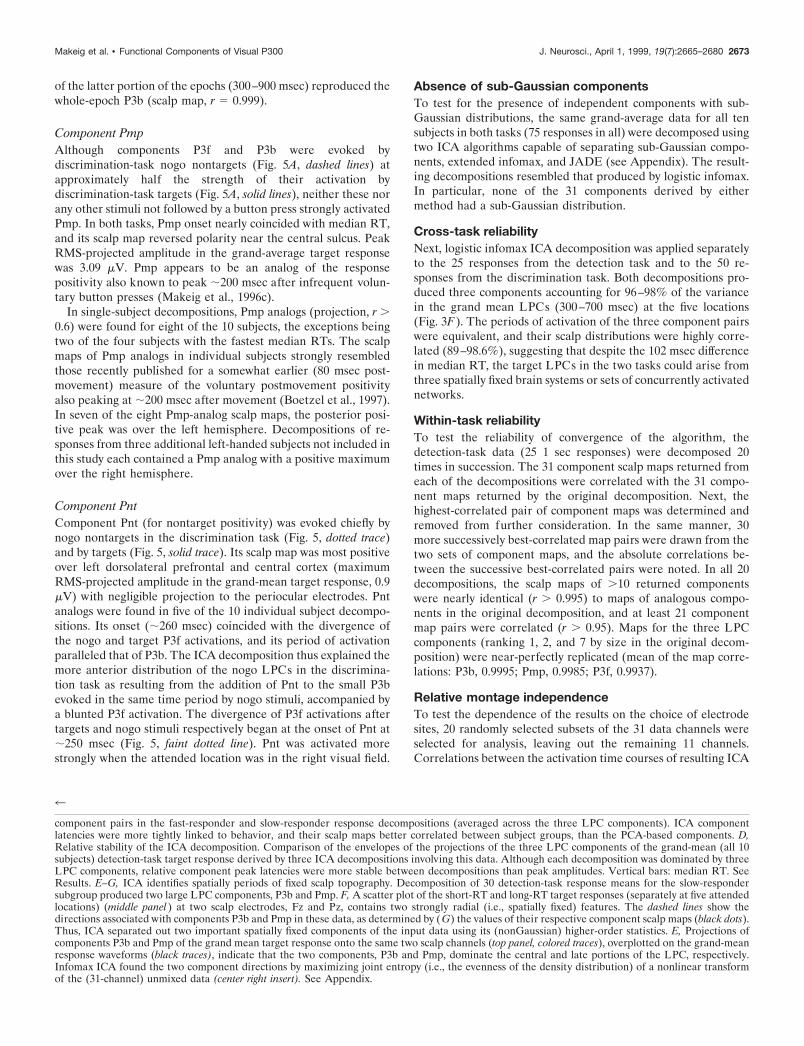
MATERIALS AND METHODSTask design. ERPs were recorded from subjects who attended to random-ized sequences of filled round or square disks appearing briefly insideone of five empty squares that were constantly displayed 0.8 cm above acentral fixation cross (Fig. 1 A). The 1.6 cm square outlines were dis-played on a black background at horizontal visual angles of 0, 62.7, and65.5° from fixation. During each 76 sec block of trials, one of the fiveoutlines was colored green, and the other four were blue. The greensquare marked the location to be attended. This location was counter-balanced across blocks. One hundred single stimuli ( filled white circles inone condition, filled circles and squares in a second) were displayed for117 msec within one of the five empty squares in a pseudorandom
sequence with interstimulus intervals of 250–1000 msec (in fourequiprobable 250 msec steps).
Ten right-handed volunteers (two women, eight men; ages 22–40years) with normal or corrected to normal vision participated in theexperiment. Subjects were instructed to maintain fixation on the centralcross while responding only to stimuli presented in the green-colored(attended) square. In the “detection” task condition, all stimuli werefilled circles, and subjects were required to press a right-hand held thumbbutton as soon as possible after stimuli presented in the attended location(Fig. 1 B). Thirty blocks of trials were collected from each subject,yielding 120 target and 480 nontarget trials at each location. Subjectswere given 1 min breaks between blocks.
In the “discrimination” task condition, 75% of the presented stimuliwere filled circles, the other 25% filled squares. Subjects were required topress the response button only in response to filled squares appearing inthe attended location (Fig. 1C) and to ignore filled circles. In thiscondition, thirty-five blocks of trials were collected from each subject,seven blocks at each of the five possible attended locations. Each blockincluded 35 target squares and 105 distractor (or “nogo”) circles pre-sented at the attended location, plus 560 circles and squares presented atthe four unattended locations.
These experiments were designed and run to study the attentionalenhancement of early visual components P1 and N1 (positive and neg-ative peaks occurring between 100 and 200 msec) evoked by stimulipresented in different parts of the visual field (Townsend et al., 1996).Analyses of those data will be reported elsewhere. Here we report ananalysis of brain responses to the target stimuli presented at attendedlocations in the same experiments.
Evoked responses. EEG data were collected from 29 scalp electrodesmounted in a standard electrode cap (Electrocap) at locations based ona modified International 10–20 system and from two periocular elec-trodes placed below the right eye and at the left outer canthus. Allchannels were referenced to the right mastoid with input impedance ,5kV. Data were sampled at 512 Hz within an analog pass band of 0.01–50Hz. To further minimize line noise artifacts, responses were digitallylow-pass filtered below 40 Hz before analysis. After rejecting trialscontaining electrooculographic (EOG) potentials .70 mV, brain re-sponses to circle and square stimuli presented at each location in eachattention condition were averaged separately using the ERPSS (Event-Related Potential Software System, J. S. Hansen, Event-Related Poten-tial Laboratory, University of California San Diego, La Jolla, CA, 1993)software package, producing a total of 75 512-point ERPs for eachsubject in the two tasks. Responses to target stimuli were consideredcorrect and averaged only when subjects responded between 150 and1000 msec. Most studies of the LPC or P300 have used a simple “oddball”paradigm, presenting stimuli in only two classes (standard, rare), al-though similar-appearing late positive components are evoked by infre-quently presented stimuli in a wide range of evoked-response experi-ments. We hypothesized that data from these five-location selective-attention tasks might be better suited than simple oddball paradigms fordecomposing LPCs by ICA because it included a relatively large number(75) of target and nontarget classes.
Independent component analysis. The “infomax” ICA algorithm weused (Bell and Sejnowski, 1995, 1996) is one of a family of algorithms thatexploits temporal independence to perform blind separation. Recently,Lee et al. (1999a) have shown that all these algorithms have a commoninformation theoretic basis, differing chiefly in the form of distributionassumed for the sources, which may not be critical (Amari, 1998).Infomax ICA finds a square “unmixing” matrix by gradient ascent thatmaximizes the joint entropy (Cover and Thomas, 1991; Linsker, 1992;Nadal and Parga, 1994) of a nonlinearly transformed ensemble of zero-mean input vectors (see Appendix for further details). Logistic infomaxcan accurately decompose mixtures of component processes having sym-metric or skewed distributions, even without using nonlinearities specif-ically tailored to them.
The algorithm can be used practically on data from a 100 or morechannels. The number of time points required for training may be as fewas several times the number of variables (the square of the number ofchannels). In turn, the number of channels must be at least equal to thenumber of components to be separated. As confirmed by simulations(Makeig et al., 1996b), when training data consists of a mixture of fewerlarge source components than channels, plus many more small sourcecomponents, as might be expected in actual EEG data, large sourcecomponents are accurately separated into separate output components,with the remaining output components consisting of mixtures of smaller
Figure 1. Schematic view of the task. The top trace shows the time line ofa typical trial. BP, Button press. A, Screen before stimulation. The cross isthe fixation point, and the lightly shaded box is the attended locationduring the ensuing 76 sec block. B, Appearance of a filled circle stimulusat an unattended location; no response required. C, Appearance of a filledsquare at the attended location in the discrimination task; button pressrequired. See Materials and Methods.
2666 J. Neurosci., April 1, 1999, 19(7):2665–2680 Makeig et al. • Functional Components of Visual P300
source components. In this sense, performance of the infomax ICAalgorithm degrades gracefully as the amount of “noise” in the dataincreases.
ICA outputs. At the end of training, multiplying the input data matrixby the unmixing matrix gives a new matrix whose rows, called thecomponent activations, are the time courses of relative strengths oractivity levels of the respective independent components across condi-tions. ICA component activations are similar to the factor weights pro-duced by spatial principal component analysis (PCA). The columns ofthe inverse of the unmixing matrix give the relative projection strengthsof the respective components onto each of the scalp sensors. These maybe interpolated to show the scalp map associated with each component.ICA scalp maps are similar to spatial PCA eigenvectors or factor load-ings. Unlike components produced by PCA and Varimax, however,component scalp maps found by ICA are not constrained to be orthog-onal and thus are free to accurately reflect the actual projections offunctionally separate sources, if they are successfully separated.
The projection of the ith independent component onto the originaldata channels is given by the outer product of the ith row of thecomponent activation matrix with the ith column of the inverse unmixingmatrix, and is in the original units (e.g., microvolts). Neither the scalpmaps nor the activation time series found by the infomax ICA algorithmare normalized. In this case, scaling information is distributed betweenthem, and the true size of a component is given only by the size of itsprojection. Because ICA decomposition is a novel technique, we nowpresent a brief overview of the assumptions underlying the application ofICA to electrophysiological data (more information and a collection ofMATLAB routines for performing and visualizing the analysis areavailable at http://www.cnl.salk.edu/;scott /ica.html).
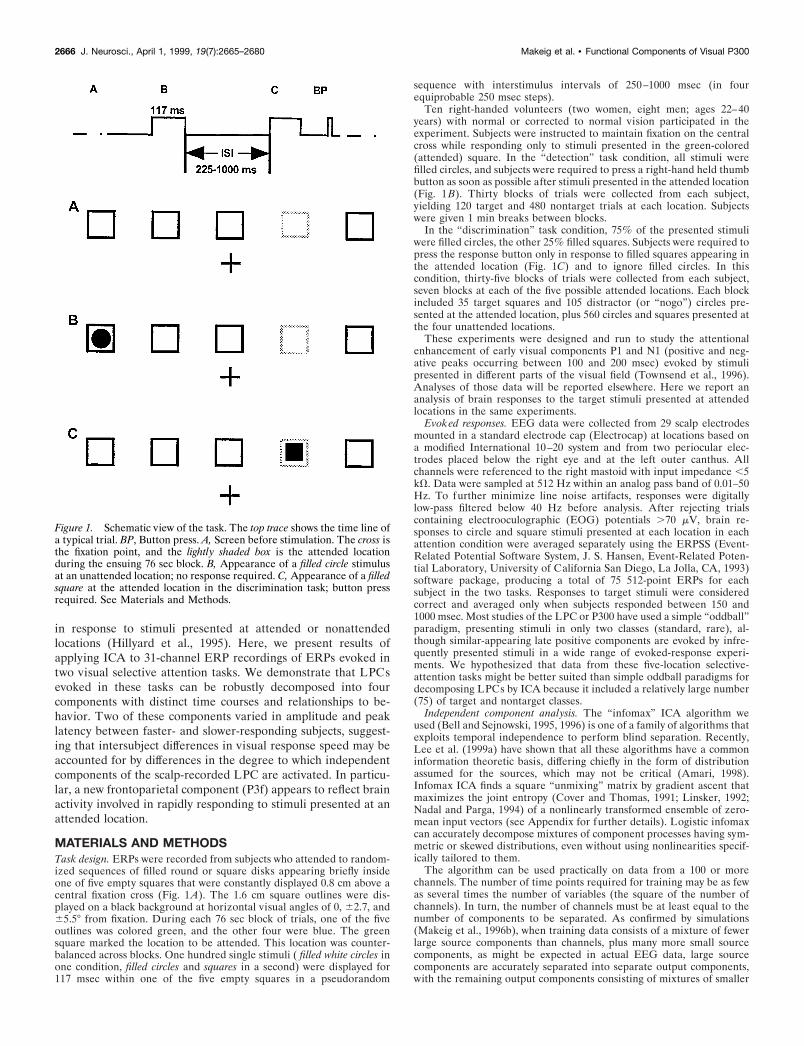
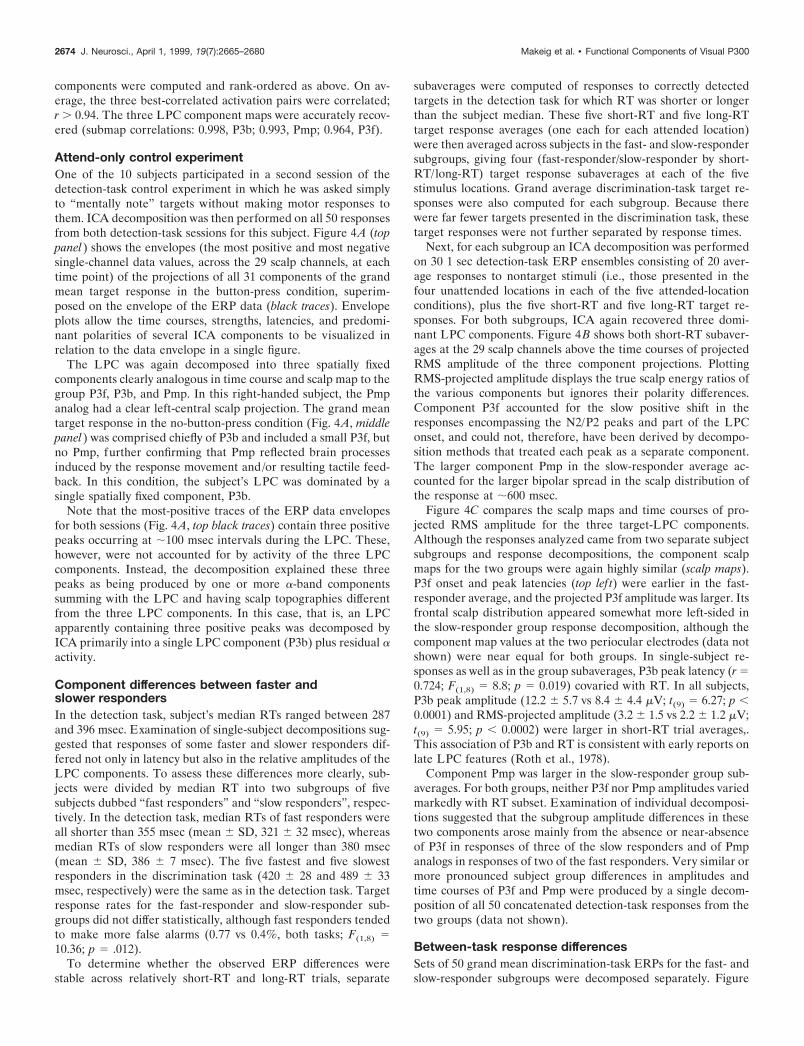
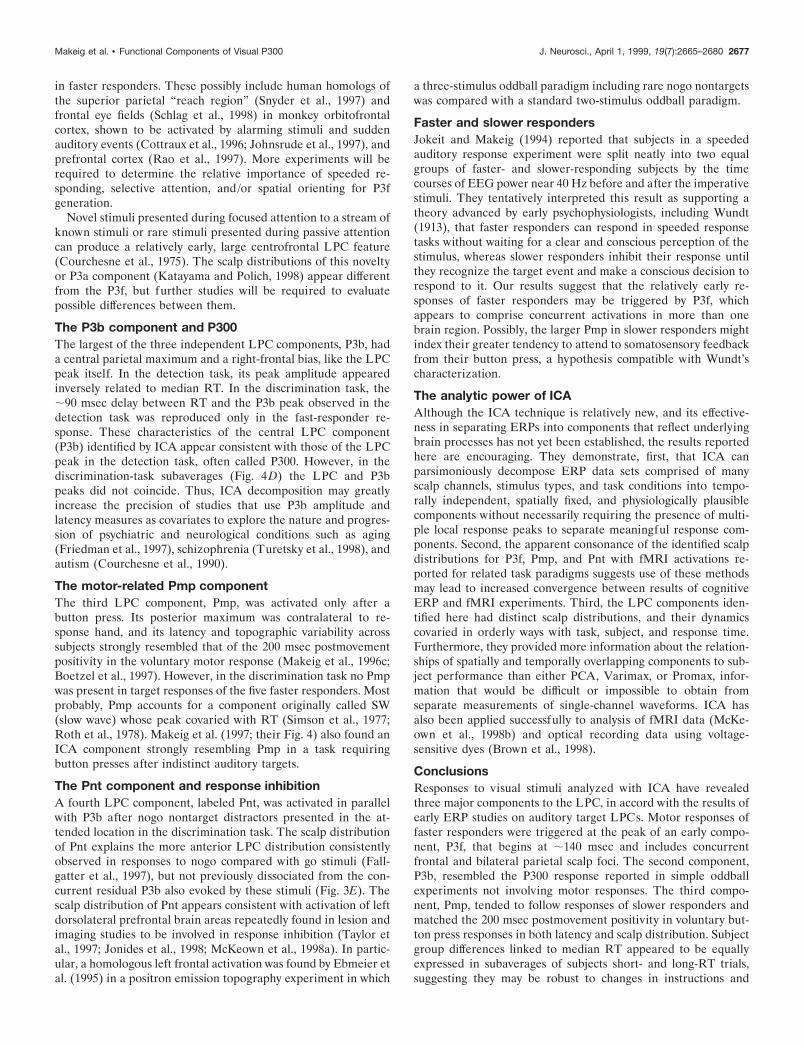
ICA limitations. Figure 2 gives a highly schematic overview of possiblelimitations of ICA as applied to event-related brain responses. Of all theprocesses contributing to a set of recorded ERP data phenomena (outercircle), ICA can only successfully separate “ICA-relevant”’ processes( gray circle) whose activities satisfy several assumptions used in ICA (seebelow). Although ICA algorithms typically give quite comparable resultswhen applied to simulated model data precisely fitting these assumptions,results obtained using different ICA algorithms applied to actual brainresponse data (dashed circles labeled ICA1, ICA2), although agreeing inlarge part (region labeled ICA-accounted), may also differ in their details.ICA analysis of ERP data must therefore be viewed as exploratory, andcare must be taken to test the functional distinctness of the resulting ICAcomponents. Simply demonstrating their replicability across subjects andexperimental conditions is not sufficient to ensure their physiologicalunity. In particular, ICA may account for a single brain component bymore than one ICA component. In addition, one must attempt to estab-lish relationships between component activations and independent ex-
perimental variables such as subject performance and behavior, as well asconsidering their physiological plausibility.
ICA assumptions. Four main assumptions underlie ICA decompositionof ERP data: (1) signal conduction times are equal, and summation ofcurrents at the scalp electrodes is linear, both reasonable assumptions forcurrents carried to the scalp electrodes by volume conduction at EEGfrequencies (Nunez, 1981); (2) spatial projections of components arefixed across time and conditions; (3) source activations are temporallyindependent of one another across the input data; and (4) statisticaldistributions of the component activation values are not Gaussian (incontrast, PCA assumes that the sources have a Gaussian distribution).
Spatial stationarity. Spatial stationarity of the component scalp maps,assumed in ICA, is compatible with the observation made in largenumbers of functional imaging reports that performance of particulartasks increases blood flow within small (several cubic centimeters),discrete brain regions (Friston, 1998). ERP sources reflecting task-related information processing are generally assumed to sum activityfrom spatially stationary generators, although stationarity may not applyto some spontaneously generated EEG phenomena such as spreadingdepression or sleep spindles (Werth et al., 1997).
Temporal independence. To fulfill the temporal independence assump-tion used by ICA, response components must be activated with tempo-rally independent time courses. In the case of event-related brain com-ponents with temporally overlapping active periods, this may beaccomplished or approximated by, first, sufficiently and systematicallyvarying the experimental stimulus and task conditions, and, next, trainingthe algorithm on the concatenated collection of resulting event-relatedresponse averages. However, simply varying stimuli and tasks does notguarantee that all the spatiotemporally overlapping response compo-nents appearing in the averaged responses are independently activated inthe ensemble of input data.
Fortunately, the first goal of experimental design, to attain indepen-dent control of the relevant output variables, is compatible with the ICArequirement that the activations of the relevant data components beindependent. Unfortunately, however, independent control of temporallyoverlapping components may be difficult or impossible to achieve. Ex-amples of processes unlikely to be separated by ICA are parallel activa-tions of both auditory cortices by auditory stimuli. In this case, ICA mustfuse both activations into a single component, unless appropriate exper-imental interventions are developed to block or delay each activationindependently in one or more of the input conditions.
Decomposing subaverages. For ICA decomposition of ERP data, theremay be a performance trade-off between (1) first averaging together largenumbers of trials and/or conditions and then decomposing the fewresulting averages, or (2) decomposing a larger number of subaverages ofthe same data. Response averages or subaverages summing fewer trialsnormally contain larger remnants of spontaneous EEG processes andnonbrain artifacts that are, moreover, superimposed by the averagingprocess, decreasing their chance of being temporally independent. De-composing a few averages obtained by summing large numbers of trialsand conditions, on the other hand, may minimize the contributions ofneural and artifactual processes not reliably time- and phase-locked toexperimental events, but may also remove evidence of the temporalindependence of overlapping components that might be exhibited in thedifferent subaverages. The group-mean data, whose analysis we reporthere, consisted of between 25 and 75 1-sec averages from different taskand/or stimulus conditions, each summing a relatively large number ofsingle trials (250–7000). Elsewhere, we explore use of an alternativeapproach, decomposing the unaveraged single trials (T.-P. Jung, S.Makeig, M. A. Westerfield, J. Townsend, E. Courchesne, and T. J.Sejnowski, unpublished observations).
Dependence on source distribution. Because of the central limit theo-rem, even when mixtures of many processes appear to be normallydistributed, this does not mean that the processes themselves are Gauss-ian. In theory, multiple Gaussian processes cannot be separated by ICA,although in practice even small deviations from normality can suffice togive good results. Also, not all ICA algorithms are capable of unmixingindependent components with sub-Gaussian (negative-kurtosis) distribu-tions. Intuitively, sub-Gaussian processes are relatively “active” more ofthe time than the best-fitting Gaussian process. Examples include sinu-soids and uniformly distributed noise.
In particular, the infomax ICA algorithm using the logistic nonlinear-ity is biased toward finding super-Gaussian (sparsely activated) indepen-dent components (i.e., sources with positive kurtosis). Super-Gaussiansources, which are relatively “inactive” more often than the best-fitting
Figure 2. Schematic overview of ICA applied to ERP data. ICA methods(dotted circles) may account for somewhat different portions of ERPphenomena (outer circle) that match the assumptions of ICA (shadedarea). See Materials and Methods.
Makeig et al. • Functional Components of Visual P300 J. Neurosci., April 1, 1999, 19(7):2665–2680 2667
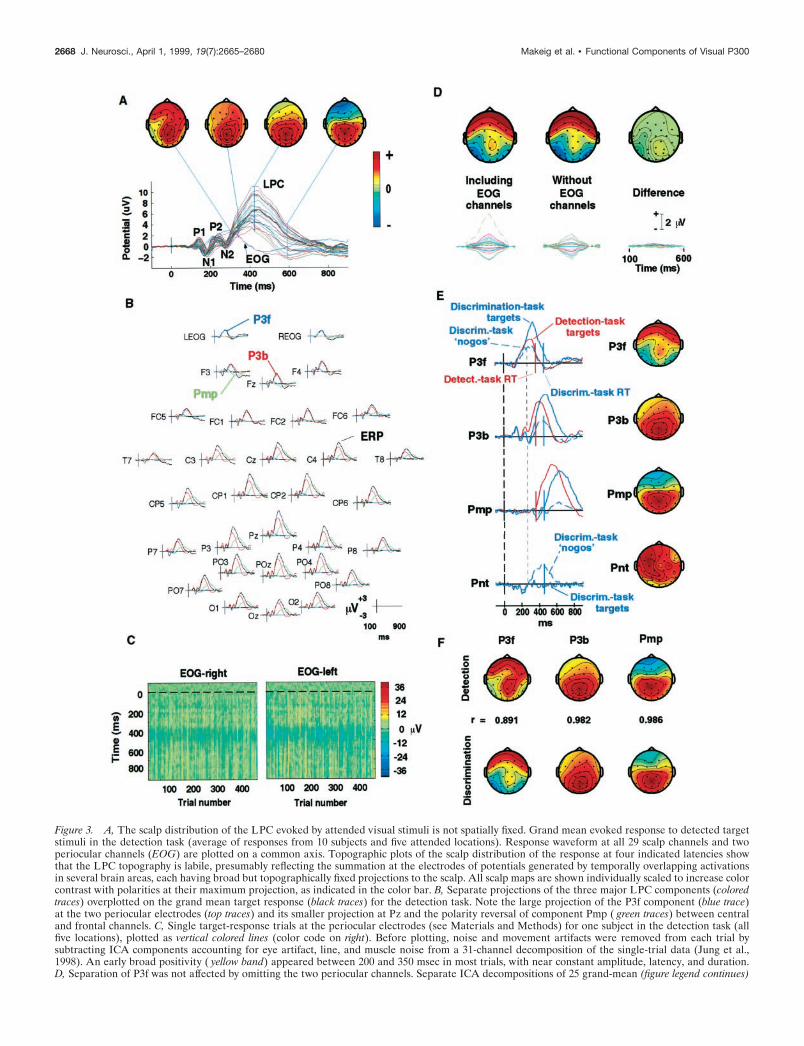
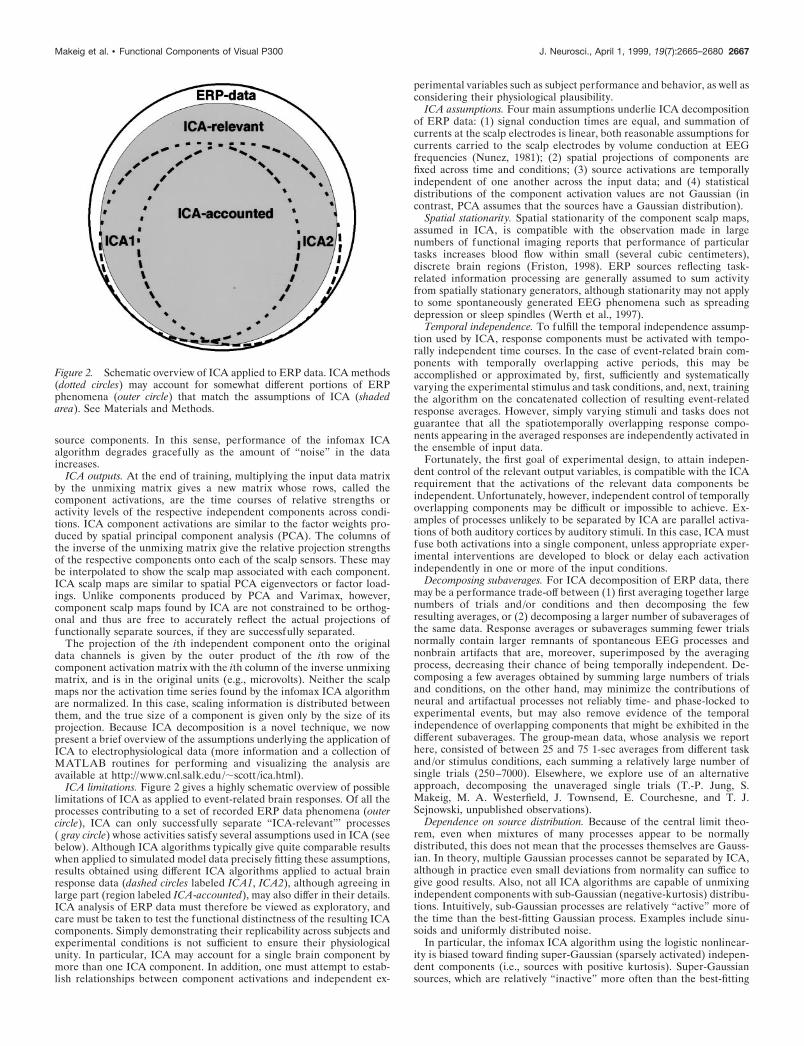
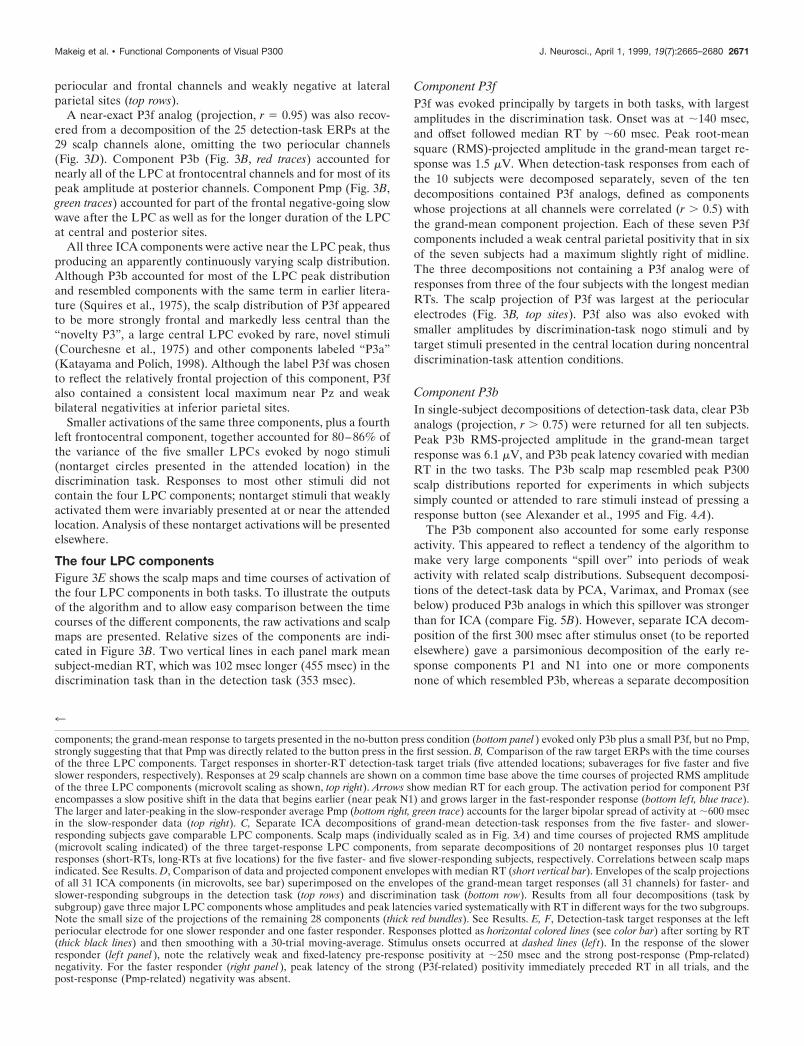
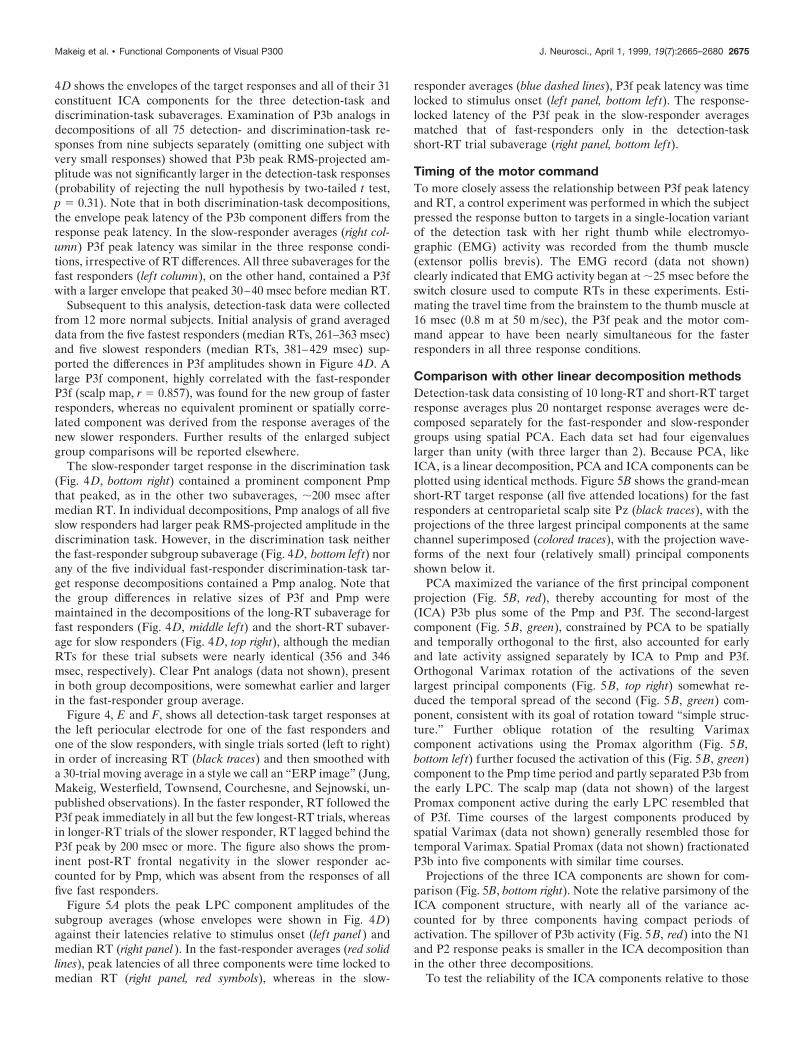
Figure 3. A, The scalp distribution of the LPC evoked by attended visual stimuli is not spatially fixed. Grand mean evoked response to detected targetstimuli in the detection task (average of responses from 10 subjects and five attended locations). Response waveform at all 29 scalp channels and twoperiocular channels (EOG) are plotted on a common axis. Topographic plots of the scalp distribution of the response at four indicated latencies showthat the LPC topography is labile, presumably reflecting the summation at the electrodes of potentials generated by temporally overlapping activationsin several brain areas, each having broad but topographically fixed projections to the scalp. All scalp maps are shown individually scaled to increase colorcontrast with polarities at their maximum projection, as indicated in the color bar. B, Separate projections of the three major LPC components (coloredtraces) overplotted on the grand mean target response (black traces) for the detection task. Note the large projection of the P3f component (blue trace)at the two periocular electrodes (top traces) and its smaller projection at Pz and the polarity reversal of component Pmp ( green traces) between centraland frontal channels. C, Single target-response trials at the periocular electrodes (see Materials and Methods) for one subject in the detection task (allfive locations), plotted as vertical colored lines (color code on right). Before plotting, noise and movement artifacts were removed from each trial bysubtracting ICA components accounting for eye artifact, line, and muscle noise from a 31-channel decomposition of the single-trial data (Jung et al.,1998). An early broad positivity ( yellow band) appeared between 200 and 350 msec in most trials, with near constant amplitude, latency, and duration.D, Separation of P3f was not affected by omitting the two periocular channels. Separate ICA decompositions of 25 grand-mean (figure legend continues)
2668 J. Neurosci., April 1, 1999, 19(7):2665–2680 Makeig et al. • Functional Components of Visual P300
Gaussian process, recur in speech and many other natural sounds andvisual images (Bell and Sejnowski, 1996, 1997). The assumption ofsuper-Gaussian source distributions is compatible with the physiologi-cally plausible assumption that ERPs are composed of one or moreoverlapping series of relatively brief activations within spatially fixedbrain areas performing separable stages of stimulus informationprocessing.
Nonetheless, some sub-Gaussian independent components have beendemonstrated in EEG data (Jung et al., 1998), chiefly line noise. Becauseour data were low-pass filtered below 40 Hz, their power at the linefrequency (60 Hz) was negligible. To insure that some other sub-Gaussian component or components were not present in the data, we alsodecomposed some of the data by two different ICA algorithms capable ofdetecting and separating sub-Gaussian components, extended infomaxand Joint Approximate Diagonalization of Eigen-matrices (JADE; seeAppendix). For comparison with previously proposed linear decomposi-tion methods, we also decomposed these same data using PCA, androtated the largest seven PCA components using Varimax and Promax(see Appendix). We compared the closest resulting PCA-based compo-nents with the ICA-derived components for stability across subjects anddegree of relationship to performance.
Evoked-response decomposition. The logistic infomax ICA algorithmwas applied to sets of 25–75 averaged ERP epochs (31 channels, 512 timepoints) time locked from 100 msec before to 900 msec after onsets oftarget and nontarget stimuli presented at each of the five stimuluslocations in the five spatial attention conditions in the two tasks (detec-tion, discrimination). Initial decompositions were performed on grandaverages of data from all 10 subjects. Subsequently, data from subjectsubgroups selected on the basis of response speed, and from singlesubjects, were decomposed separately as detailed below. ICA decompo-sition was performed using routines running under Matlab 5.01 (theMathworks) on a Dec Alpha 300 MHz processor. The learning batch sizewas 65–110, depending on input data length. Initial learning rate startedat ;0.004 and was gradually reduced to 10 26 during 50–100 trainingiterations that required ;5 min of computer time. Results of the analysiswere relatively insensitive to the exact choice or learning rate or batchsize. For further details, see Appendix.
Single-trial artifact removal. In most evoked response research, thepossibility that neural activity is expressed in periocular data channels isusually ignored for fear of mislabeling eye activity artifacts as brainactivity. Some of the ICA components of EEG records can be identifiedas accounting primarily for eye movements, line or muscle noise, or otherartifacts (Makeig et al., 1996a; Vigario, 1997). Subtracting the projectionsof artifactual components from averaged or single-trial data can elimi-nate or reduce these artifacts while preserving the remaining nonartifac-tual EEG phenomena in all of the data channels (Jung et al., 1998). ICAthus makes it possible, for the first time, to examine periocular neuralactivity.
To examine the between-trial distribution of periocular componentsobserved in the target response averages, all single target trials in thedetection task for two subjects were decomposed using ICA, and projec-tions of 16 of the resulting 31 components were removed from thesingle-trial data. The removed components were those that either (1)accounted predominantly for eye movements or muscle activity, or (2)whose projections appeared to contribute only very small amounts ofnoise to the averaged response. We identified eye and muscle artifactcomponents on the basis of their scalp maps and activation time courses.Eye movement components had dominant periocular and frontal projec-tions and slow, sporadic activations; muscle–noise components had lo-calized scalp patterns and were dominated by broadband 20–50 Hz
activity. The remaining 15 single-trial components were projected to-gether back onto the scalp channels. For further details of this procedure,see Jung et al. (1998).
RESULTSTarget-evoked responsePerformance levels on both the detection task and the discrimi-nation task were high [detection task: 94.8% hits 5 correct 150–1000 msec response times (RTs), 0.6% false alarms, median RT353 6 41 msec; discrimination task: 91.4% hits, 0.6% false alarms,median RT 455 msec]. Responses evoked by target stimuli (theirgrand mean shown in Fig. 3A, colored traces) contained a prom-inent LPC peaking after expected early visual response peaks P1,N1, P2, and N2. In the grand-mean detection-task response, nosingle-channel waveform contained more than one large positivepeak between 300 and 700 msec. However, during this period thescalp topography of the response varied continuously (Fig. 3A,scalp maps).
Note that both periocular channels (Fig. 3A, EOG) contained asmall (;3 mV), broad positive potential peaking at ;300 msec.Grand mean target responses from each of the 10 subjects (e.g.,means of response averages for all five attended locations) con-tained a positive deviation with similar time course near-equal inamplitude in the two channels. Examination of artifact-correctedsingle trials (derived as described in the Methods) showed thatthis potential was evoked in most or all single trials of everyattended-location condition (Fig. 3C). Most likely these potentialswere not produced by eye movements, because only small, slow,diagonal eye movements reliably and precisely time-locked tostimulus onsets could have produced them.
Joint decompositionICA was applied to all 75 31-channel responses from both tasks (1sec ERPs from 25 detection-task and 50 discrimination-task con-ditions) producing 31 temporally independent components. Ofthese, just three accounted for 95–98% of the variance in the tentarget responses from both tasks. A parsimonious decompositionwas achieved, although data for the two conditions for eachsubject were obtained on separate days and thus might haveincluded small between-session differences in electrode place-ments, which were reduced by averaging across subjects. Figure3B shows the projections of the three components [labeled forconvenience as P3f, P3b, and postmotor potential (Pmp)] inresponse to targets in the detection task at all 31 electrode sites(colored traces) superimposed on the grand mean response at thesame sites (black traces). Component P3f (blue traces) becameactive near the N1 peak. Its active period continued through theP2 and N2 peaks and the upward slope of the LPC. That is, P3faccounted for a slow shift beginning before LPC onset, positive at
4
detection-task ERPs (10 subjects) using first (lef t) all 31 channels, and then (center) 29 scalp channels alone, identified nearly identical P3f components(right). Scalp maps plotted on the same relative scale, with polarities as in A (bottom traces). Projections of the P3f component and their difference (bottomright) on the same microvolt scale. E, Activation time courses and scalp maps of the four LPC components produced by the ICA algorithm applied to75 1 sec grand-mean (10-Ss) responses from both tasks. Map scaling as in A. Because microvolt scaling information for each ICA component is dividedbetween its activation and its scalp map, units are not indicated (see Results). The thick dotted line (lef t) indicates stimulus onset. Mean subject-medianRTs in the detection task (red) and discrimination task (blue) are indicated by solid vertical bars. Three independent components (P3f, P3b, Pmp)accounted for 95–98% of LPC variance in both tasks. In both tasks, median RT coincided with Pmp onset. Pnt, a fourth, left-frontocentral component,was evoked mainly after nogo nontargets presented in the attended location in the discrimination task. The faint vertical dotted line at ;250 msec showsthe temporal relationship between the onsets of Pnt and P3b and the divergence of the P3f activations after target and nogo stimuli in the discriminationtask. F, Separate ICA decompositions of ERPs from the detection and discrimination tasks gave similar LPC components. For all three components, boththe scalp maps (shown) and periods of activation (data not shown) were nearly equivalent. Correlations between the respective component scalp mapsare indicated. Maps individually scaled as in A.
Makeig et al. • Functional Components of Visual P300 J. Neurosci., April 1, 1999, 19(7):2665–2680 2669
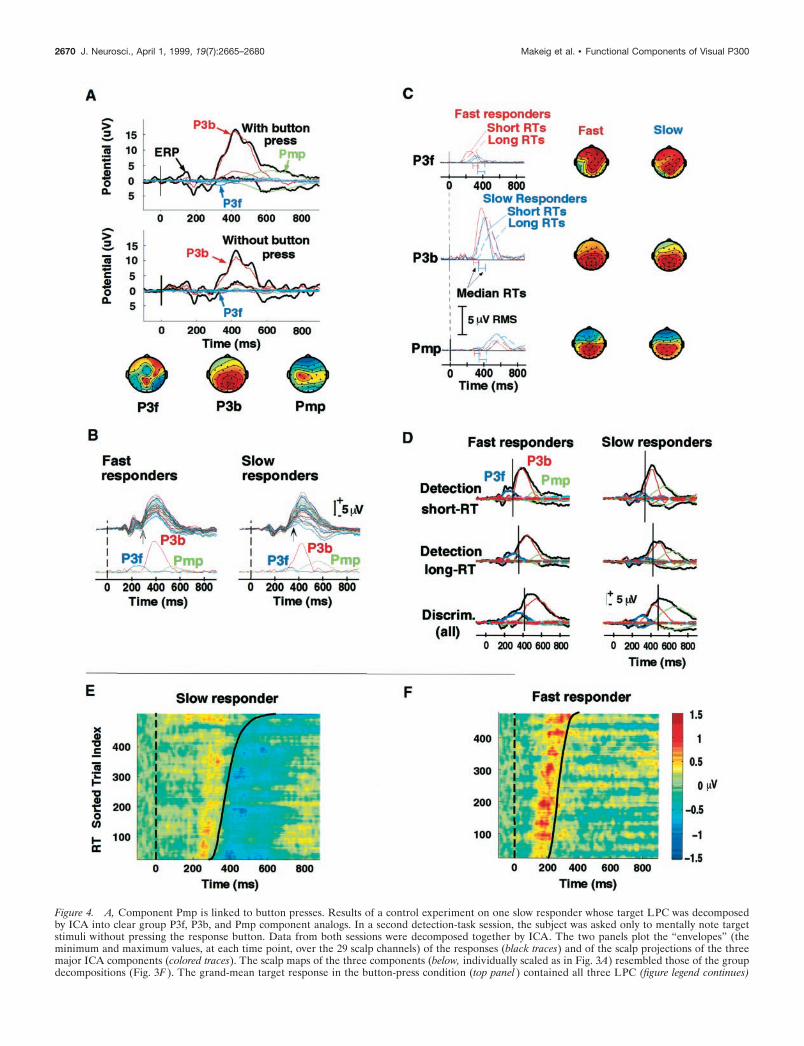
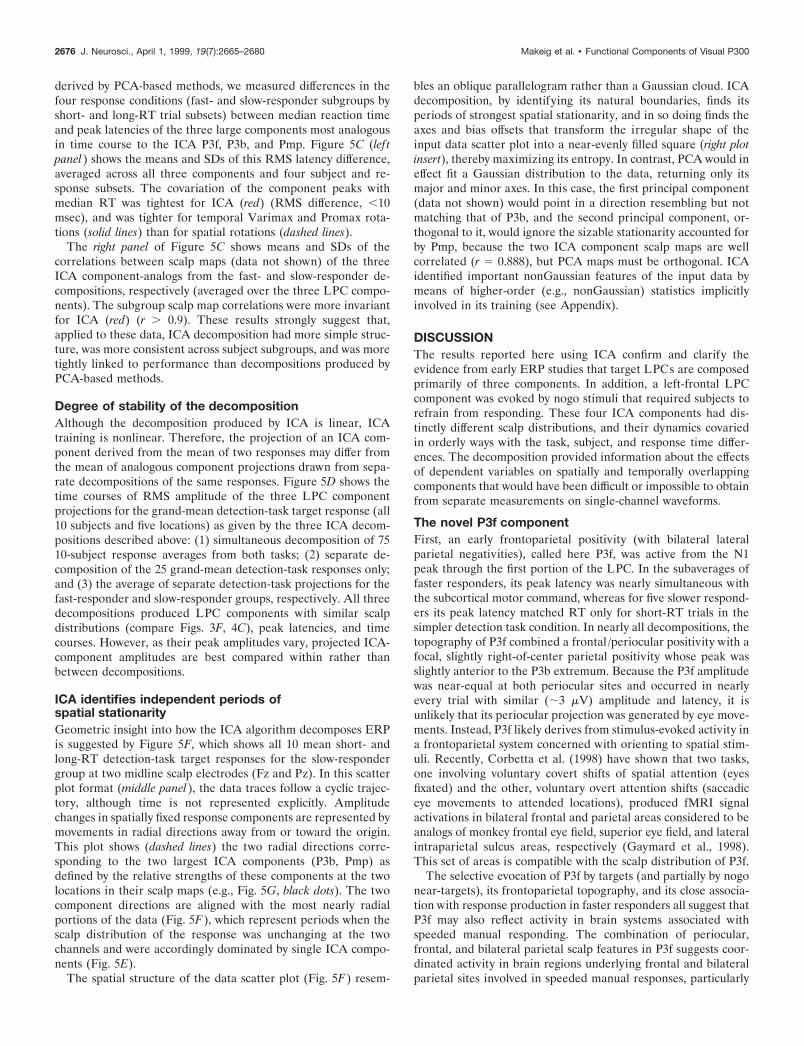
Figure 4. A, Component Pmp is linked to button presses. Results of a control experiment on one slow responder whose target LPC was decomposedby ICA into clear group P3f, P3b, and Pmp component analogs. In a second detection-task session, the subject was asked only to mentally note targetstimuli without pressing the response button. Data from both sessions were decomposed together by ICA. The two panels plot the “envelopes” (theminimum and maximum values, at each time point, over the 29 scalp channels) of the responses (black traces) and of the scalp projections of the threemajor ICA components (colored traces). The scalp maps of the three components (below, individually scaled as in Fig. 3A) resembled those of the groupdecompositions (Fig. 3F ). The grand-mean target response in the button-press condition (top panel ) contained all three LPC (figure legend continues)
2670 J. Neurosci., April 1, 1999, 19(7):2665–2680 Makeig et al. • Functional Components of Visual P300
periocular and frontal channels and weakly negative at lateralparietal sites (top rows).
A near-exact P3f analog (projection, r 5 0.95) was also recov-ered from a decomposition of the 25 detection-task ERPs at the29 scalp channels alone, omitting the two periocular channels(Fig. 3D). Component P3b (Fig. 3B, red traces) accounted fornearly all of the LPC at frontocentral channels and for most of itspeak amplitude at posterior channels. Component Pmp (Fig. 3B,green traces) accounted for part of the frontal negative-going slowwave after the LPC as well as for the longer duration of the LPCat central and posterior sites.
All three ICA components were active near the LPC peak, thusproducing an apparently continuously varying scalp distribution.Although P3b accounted for most of the LPC peak distributionand resembled components with the same term in earlier litera-ture (Squires et al., 1975), the scalp distribution of P3f appearedto be more strongly frontal and markedly less central than the“novelty P3”, a large central LPC evoked by rare, novel stimuli(Courchesne et al., 1975) and other components labeled “P3a”(Katayama and Polich, 1998). Although the label P3f was chosento reflect the relatively frontal projection of this component, P3falso contained a consistent local maximum near Pz and weakbilateral negativities at inferior parietal sites.
Smaller activations of the same three components, plus a fourthleft frontocentral component, together accounted for 80–86% ofthe variance of the five smaller LPCs evoked by nogo stimuli(nontarget circles presented in the attended location) in thediscrimination task. Responses to most other stimuli did notcontain the four LPC components; nontarget stimuli that weaklyactivated them were invariably presented at or near the attendedlocation. Analysis of these nontarget activations will be presentedelsewhere.
The four LPC componentsFigure 3E shows the scalp maps and time courses of activation ofthe four LPC components in both tasks. To illustrate the outputsof the algorithm and to allow easy comparison between the timecourses of the different components, the raw activations and scalpmaps are presented. Relative sizes of the components are indi-cated in Figure 3B. Two vertical lines in each panel mark meansubject-median RT, which was 102 msec longer (455 msec) in thediscrimination task than in the detection task (353 msec).
Component P3fP3f was evoked principally by targets in both tasks, with largestamplitudes in the discrimination task. Onset was at ;140 msec,and offset followed median RT by ;60 msec. Peak root-meansquare (RMS)-projected amplitude in the grand-mean target re-sponse was 1.5 mV. When detection-task responses from each ofthe 10 subjects were decomposed separately, seven of the tendecompositions contained P3f analogs, defined as componentswhose projections at all channels were correlated (r . 0.5) withthe grand-mean component projection. Each of these seven P3fcomponents included a weak central parietal positivity that in sixof the seven subjects had a maximum slightly right of midline.The three decompositions not containing a P3f analog were ofresponses from three of the four subjects with the longest medianRTs. The scalp projection of P3f was largest at the periocularelectrodes (Fig. 3B, top sites). P3f also was also evoked withsmaller amplitudes by discrimination-task nogo stimuli and bytarget stimuli presented in the central location during noncentraldiscrimination-task attention conditions.
Component P3bIn single-subject decompositions of detection-task data, clear P3banalogs (projection, r . 0.75) were returned for all ten subjects.Peak P3b RMS-projected amplitude in the grand-mean targetresponse was 6.1 mV, and P3b peak latency covaried with medianRT in the two tasks. The P3b scalp map resembled peak P300scalp distributions reported for experiments in which subjectssimply counted or attended to rare stimuli instead of pressing aresponse button (see Alexander et al., 1995 and Fig. 4A).
The P3b component also accounted for some early responseactivity. This appeared to reflect a tendency of the algorithm tomake very large components “spill over” into periods of weakactivity with related scalp distributions. Subsequent decomposi-tions of the detect-task data by PCA, Varimax, and Promax (seebelow) produced P3b analogs in which this spillover was strongerthan for ICA (compare Fig. 5B). However, separate ICA decom-position of the first 300 msec after stimulus onset (to be reportedelsewhere) gave a parsimonious decomposition of the early re-sponse components P1 and N1 into one or more componentsnone of which resembled P3b, whereas a separate decomposition
4
components; the grand-mean response to targets presented in the no-button press condition (bottom panel ) evoked only P3b plus a small P3f, but no Pmp,strongly suggesting that that Pmp was directly related to the button press in the first session. B, Comparison of the raw target ERPs with the time coursesof the three LPC components. Target responses in shorter-RT detection-task target trials (five attended locations; subaverages for five faster and fiveslower responders, respectively). Responses at 29 scalp channels are shown on a common time base above the time courses of projected RMS amplitudeof the three LPC components (microvolt scaling as shown, top right). Arrows show median RT for each group. The activation period for component P3fencompasses a slow positive shift in the data that begins earlier (near peak N1) and grows larger in the fast-responder response (bottom lef t, blue trace).The larger and later-peaking in the slow-responder average Pmp (bottom right, green trace) accounts for the larger bipolar spread of activity at ;600 msecin the slow-responder data (top right). C, Separate ICA decompositions of grand-mean detection-task responses from the five faster- and slower-responding subjects gave comparable LPC components. Scalp maps (individually scaled as in Fig. 3A) and time courses of projected RMS amplitude(microvolt scaling indicated) of the three target-response LPC components, from separate decompositions of 20 nontarget responses plus 10 targetresponses (short-RTs, long-RTs at five locations) for the five faster- and five slower-responding subjects, respectively. Correlations between scalp mapsindicated. See Results. D, Comparison of data and projected component envelopes with median RT (short vertical bar). Envelopes of the scalp projectionsof all 31 ICA components (in microvolts, see bar) superimposed on the envelopes of the grand-mean target responses (all 31 channels) for faster- andslower-responding subgroups in the detection task (top rows) and discrimination task (bottom row). Results from all four decompositions (task bysubgroup) gave three major LPC components whose amplitudes and peak latencies varied systematically with RT in different ways for the two subgroups.Note the small size of the projections of the remaining 28 components (thick red bundles). See Results. E, F, Detection-task target responses at the leftperiocular electrode for one slower responder and one faster responder. Responses plotted as horizontal colored lines (see color bar) after sorting by RT(thick black lines) and then smoothing with a 30-trial moving-average. Stimulus onsets occurred at dashed lines (lef t). In the response of the slowerresponder (lef t panel ), note the relatively weak and fixed-latency pre-response positivity at ;250 msec and the strong post-response (Pmp-related)negativity. For the faster responder (right panel ), peak latency of the strong (P3f-related) positivity immediately preceded RT in all trials, and thepost-response (Pmp-related) negativity was absent.
Makeig et al. • Functional Components of Visual P300 J. Neurosci., April 1, 1999, 19(7):2665–2680 2671
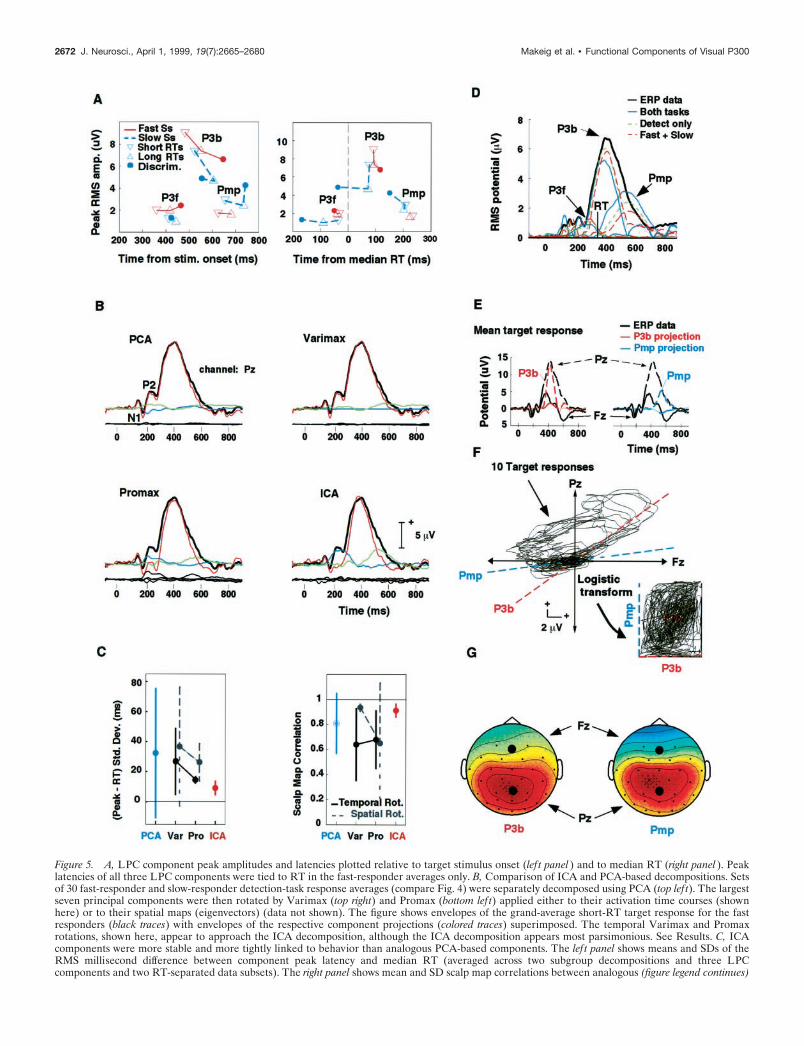
Figure 5. A, LPC component peak amplitudes and latencies plotted relative to target stimulus onset (lef t panel ) and to median RT (right panel ). Peaklatencies of all three LPC components were tied to RT in the fast-responder averages only. B, Comparison of ICA and PCA-based decompositions. Setsof 30 fast-responder and slow-responder detection-task response averages (compare Fig. 4) were separately decomposed using PCA (top lef t). The largestseven principal components were then rotated by Varimax (top right) and Promax (bottom lef t) applied either to their activation time courses (shownhere) or to their spatial maps (eigenvectors) (data not shown). The figure shows envelopes of the grand-average short-RT target response for the fastresponders (black traces) with envelopes of the respective component projections (colored traces) superimposed. The temporal Varimax and Promaxrotations, shown here, appear to approach the ICA decomposition, although the ICA decomposition appears most parsimonious. See Results. C, ICAcomponents were more stable and more tightly linked to behavior than analogous PCA-based components. The lef t panel shows means and SDs of theRMS millisecond difference between component peak latency and median RT (averaged across two subgroup decompositions and three LPCcomponents and two RT-separated data subsets). The right panel shows mean and SD scalp map correlations between analogous (figure legend continues)
2672 J. Neurosci., April 1, 1999, 19(7):2665–2680 Makeig et al. • Functional Components of Visual P300
of the latter portion of the epochs (300–900 msec) reproduced thewhole-epoch P3b (scalp map, r 5 0.999).
Component PmpAlthough components P3f and P3b were evoked bydiscrimination-task nogo nontargets (Fig. 5A, dashed lines) atapproximately half the strength of their activation bydiscrimination-task targets (Fig. 5A, solid lines), neither these norany other stimuli not followed by a button press strongly activatedPmp. In both tasks, Pmp onset nearly coincided with median RT,and its scalp map reversed polarity near the central sulcus. PeakRMS-projected amplitude in the grand-average target responsewas 3.09 mV. Pmp appears to be an analog of the responsepositivity also known to peak ;200 msec after infrequent volun-tary button presses (Makeig et al., 1996c).
In single-subject decompositions, Pmp analogs (projection, r .0.6) were found for eight of the 10 subjects, the exceptions beingtwo of the four subjects with the fastest median RTs. The scalpmaps of Pmp analogs in individual subjects strongly resembledthose recently published for a somewhat earlier (80 msec post-movement) measure of the voluntary postmovement positivityalso peaking at ;200 msec after movement (Boetzel et al., 1997).In seven of the eight Pmp-analog scalp maps, the posterior posi-tive peak was over the left hemisphere. Decompositions of re-sponses from three additional left-handed subjects not included inthis study each contained a Pmp analog with a positive maximumover the right hemisphere.
Component PntComponent Pnt (for nontarget positivity) was evoked chiefly bynogo nontargets in the discrimination task (Fig. 5, dotted trace)and by targets (Fig. 5, solid trace). Its scalp map was most positiveover left dorsolateral prefrontal and central cortex (maximumRMS-projected amplitude in the grand-mean target response, 0.9mV) with negligible projection to the periocular electrodes. Pntanalogs were found in five of the 10 individual subject decompo-sitions. Its onset (;260 msec) coincided with the divergence ofthe nogo and target P3f activations, and its period of activationparalleled that of P3b. The ICA decomposition thus explained themore anterior distribution of the nogo LPCs in the discrimina-tion task as resulting from the addition of Pnt to the small P3bevoked in the same time period by nogo stimuli, accompanied bya blunted P3f activation. The divergence of P3f activations aftertargets and nogo stimuli respectively began at the onset of Pnt at;250 msec (Fig. 5, faint dotted line). Pnt was activated morestrongly when the attended location was in the right visual field.
Absence of sub-Gaussian componentsTo test for the presence of independent components with sub-Gaussian distributions, the same grand-average data for all tensubjects in both tasks (75 responses in all) were decomposed usingtwo ICA algorithms capable of separating sub-Gaussian compo-nents, extended infomax, and JADE (see Appendix). The result-ing decompositions resembled that produced by logistic infomax.In particular, none of the 31 components derived by eithermethod had a sub-Gaussian distribution.
Cross-task reliabilityNext, logistic infomax ICA decomposition was applied separatelyto the 25 responses from the detection task and to the 50 re-sponses from the discrimination task. Both decompositions pro-duced three components accounting for 96–98% of the variancein the grand mean LPCs (300–700 msec) at the five locations(Fig. 3F). The periods of activation of the three component pairswere equivalent, and their scalp distributions were highly corre-lated (89–98.6%), suggesting that despite the 102 msec differencein median RT, the target LPCs in the two tasks could arise fromthree spatially fixed brain systems or sets of concurrently activatednetworks.
Within-task reliabilityTo test the reliability of convergence of the algorithm, thedetection-task data (25 1 sec responses) were decomposed 20times in succession. The 31 component scalp maps returned fromeach of the decompositions were correlated with the 31 compo-nent maps returned by the original decomposition. Next, thehighest-correlated pair of component maps was determined andremoved from further consideration. In the same manner, 30more successively best-correlated map pairs were drawn from thetwo sets of component maps, and the absolute correlations be-tween the successive best-correlated pairs were noted. In all 20decompositions, the scalp maps of .10 returned componentswere nearly identical (r . 0.995) to maps of analogous compo-nents in the original decomposition, and at least 21 componentmap pairs were correlated (r . 0.95). Maps for the three LPCcomponents (ranking 1, 2, and 7 by size in the original decom-position) were near-perfectly replicated (mean of the map corre-lations: P3b, 0.9995; Pmp, 0.9985; P3f, 0.9937).
Relative montage independenceTo test the dependence of the results on the choice of electrodesites, 20 randomly selected subsets of the 31 data channels wereselected for analysis, leaving out the remaining 11 channels.Correlations between the activation time courses of resulting ICA
4
component pairs in the fast-responder and slow-responder response decompositions (averaged across the three LPC components). ICA componentlatencies were more tightly linked to behavior, and their scalp maps better correlated between subject groups, than the PCA-based components. D,Relative stability of the ICA decomposition. Comparison of the envelopes of the projections of the three LPC components of the grand-mean (all 10subjects) detection-task target response derived by three ICA decompositions involving this data. Although each decomposition was dominated by threeLPC components, relative component peak latencies were more stable between decompositions than peak amplitudes. Vertical bars: median RT. SeeResults. E–G, ICA identifies spatially periods of fixed scalp topography. Decomposition of 30 detection-task response means for the slow-respondersubgroup produced two large LPC components, P3b and Pmp. F, A scatter plot of the short-RT and long-RT target responses (separately at five attendedlocations) (middle panel ) at two scalp electrodes, Fz and Pz, contains two strongly radial (i.e., spatially fixed) features. The dashed lines show thedirections associated with components P3b and Pmp in these data, as determined by ( G) the values of their respective component scalp maps (black dots).Thus, ICA separated out two important spatially fixed components of the input data using its (nonGaussian) higher-order statistics. E, Projections ofcomponents P3b and Pmp of the grand mean target response onto the same two scalp channels (top panel, colored traces), overplotted on the grand-meanresponse waveforms (black traces), indicate that the two components, P3b and Pmp, dominate the central and late portions of the LPC, respectively.Infomax ICA found the two component directions by maximizing joint entropy (i.e., the evenness of the density distribution) of a nonlinear transformof the (31-channel) unmixed data (center right insert). See Appendix.
Makeig et al. • Functional Components of Visual P300 J. Neurosci., April 1, 1999, 19(7):2665–2680 2673
components were computed and rank-ordered as above. On av-erage, the three best-correlated activation pairs were correlated;r . 0.94. The three LPC component maps were accurately recov-ered (submap correlations: 0.998, P3b; 0.993, Pmp; 0.964, P3f).
Attend-only control experimentOne of the 10 subjects participated in a second session of thedetection-task control experiment in which he was asked simplyto “mentally note” targets without making motor responses tothem. ICA decomposition was then performed on all 50 responsesfrom both detection-task sessions for this subject. Figure 4A (toppanel) shows the envelopes (the most positive and most negativesingle-channel data values, across the 29 scalp channels, at eachtime point) of the projections of all 31 components of the grandmean target response in the button-press condition, superim-posed on the envelope of the ERP data (black traces). Envelopeplots allow the time courses, strengths, latencies, and predomi-nant polarities of several ICA components to be visualized inrelation to the data envelope in a single figure.
The LPC was again decomposed into three spatially fixedcomponents clearly analogous in time course and scalp map to thegroup P3f, P3b, and Pmp. In this right-handed subject, the Pmpanalog had a clear left-central scalp projection. The grand meantarget response in the no-button-press condition (Fig. 4A, middlepanel) was comprised chiefly of P3b and included a small P3f, butno Pmp, further confirming that Pmp reflected brain processesinduced by the response movement and/or resulting tactile feed-back. In this condition, the subject’s LPC was dominated by asingle spatially fixed component, P3b.
Note that the most-positive traces of the ERP data envelopesfor both sessions (Fig. 4A, top black traces) contain three positivepeaks occurring at ;100 msec intervals during the LPC. These,however, were not accounted for by activity of the three LPCcomponents. Instead, the decomposition explained these threepeaks as being produced by one or more a-band componentssumming with the LPC and having scalp topographies differentfrom the three LPC components. In this case, that is, an LPCapparently containing three positive peaks was decomposed byICA primarily into a single LPC component (P3b) plus residual aactivity.
Component differences between faster andslower respondersIn the detection task, subject’s median RTs ranged between 287and 396 msec. Examination of single-subject decompositions sug-gested that responses of some faster and slower responders dif-fered not only in latency but also in the relative amplitudes of theLPC components. To assess these differences more clearly, sub-jects were divided by median RT into two subgroups of fivesubjects dubbed “fast responders” and “slow responders”, respec-tively. In the detection task, median RTs of fast responders wereall shorter than 355 msec (mean 6 SD, 321 6 32 msec), whereasmedian RTs of slow responders were all longer than 380 msec(mean 6 SD, 386 6 7 msec). The five fastest and five slowestresponders in the discrimination task (420 6 28 and 489 6 33msec, respectively) were the same as in the detection task. Targetresponse rates for the fast-responder and slow-responder sub-groups did not differ statistically, although fast responders tendedto make more false alarms (0.77 vs 0.4%, both tasks; F(1,8) 510.36; p 5 .012).
To determine whether the observed ERP differences werestable across relatively short-RT and long-RT trials, separate
subaverages were computed of responses to correctly detectedtargets in the detection task for which RT was shorter or longerthan the subject median. These five short-RT and five long-RTtarget response averages (one each for each attended location)were then averaged across subjects in the fast- and slow-respondersubgroups, giving four (fast-responder/slow-responder by short-RT/long-RT) target response subaverages at each of the fivestimulus locations. Grand average discrimination-task target re-sponses were also computed for each subgroup. Because therewere far fewer targets presented in the discrimination task, thesetarget responses were not further separated by response times.
Next, for each subgroup an ICA decomposition was performedon 30 1 sec detection-task ERP ensembles consisting of 20 aver-age responses to nontarget stimuli (i.e., those presented in thefour unattended locations in each of the five attended-locationconditions), plus the five short-RT and five long-RT target re-sponses. For both subgroups, ICA again recovered three domi-nant LPC components. Figure 4B shows both short-RT subaver-ages at the 29 scalp channels above the time courses of projectedRMS amplitude of the three component projections. PlottingRMS-projected amplitude displays the true scalp energy ratios ofthe various components but ignores their polarity differences.Component P3f accounted for the slow positive shift in theresponses encompassing the N2/P2 peaks and part of the LPConset, and could not, therefore, have been derived by decompo-sition methods that treated each peak as a separate component.The larger component Pmp in the slow-responder average ac-counted for the larger bipolar spread in the scalp distribution ofthe response at ;600 msec.
Figure 4C compares the scalp maps and time courses of pro-jected RMS amplitude for the three target-LPC components.Although the responses analyzed came from two separate subjectsubgroups and response decompositions, the component scalpmaps for the two groups were again highly similar (scalp maps).P3f onset and peak latencies (top lef t) were earlier in the fast-responder average, and the projected P3f amplitude was larger. Itsfrontal scalp distribution appeared somewhat more left-sided inthe slow-responder group response decomposition, although thecomponent map values at the two periocular electrodes (data notshown) were near equal for both groups. In single-subject re-sponses as well as in the group subaverages, P3b peak latency (r 50.724; F(1,8) 5 8.8; p 5 0.019) covaried with RT. In all subjects,P3b peak amplitude (12.2 6 5.7 vs 8.4 6 4.4 mV; t(9) 5 6.27; p ,0.0001) and RMS-projected amplitude (3.2 6 1.5 vs 2.2 6 1.2 mV;t(9) 5 5.95; p , 0.0002) were larger in short-RT trial averages,.This association of P3b and RT is consistent with early reports onlate LPC features (Roth et al., 1978).
Component Pmp was larger in the slow-responder group sub-averages. For both groups, neither P3f nor Pmp amplitudes variedmarkedly with RT subset. Examination of individual decomposi-tions suggested that the subgroup amplitude differences in thesetwo components arose mainly from the absence or near-absenceof P3f in responses of three of the slow responders and of Pmpanalogs in responses of two of the fast responders. Very similar ormore pronounced subject group differences in amplitudes andtime courses of P3f and Pmp were produced by a single decom-position of all 50 concatenated detection-task responses from thetwo groups (data not shown).
Between-task response differencesSets of 50 grand mean discrimination-task ERPs for the fast- andslow-responder subgroups were decomposed separately. Figure
2674 J. Neurosci., April 1, 1999, 19(7):2665–2680 Makeig et al. • Functional Components of Visual P300
4D shows the envelopes of the target responses and all of their 31constituent ICA components for the three detection-task anddiscrimination-task subaverages. Examination of P3b analogs indecompositions of all 75 detection- and discrimination-task re-sponses from nine subjects separately (omitting one subject withvery small responses) showed that P3b peak RMS-projected am-plitude was not significantly larger in the detection-task responses(probability of rejecting the null hypothesis by two-tailed t test,p 5 0.31). Note that in both discrimination-task decompositions,the envelope peak latency of the P3b component differs from theresponse peak latency. In the slow-responder averages (right col-umn) P3f peak latency was similar in the three response condi-tions, irrespective of RT differences. All three subaverages for thefast responders (lef t column), on the other hand, contained a P3fwith a larger envelope that peaked 30–40 msec before median RT.
Subsequent to this analysis, detection-task data were collectedfrom 12 more normal subjects. Initial analysis of grand averageddata from the five fastest responders (median RTs, 261–363 msec)and five slowest responders (median RTs, 381–429 msec) sup-ported the differences in P3f amplitudes shown in Figure 4D. Alarge P3f component, highly correlated with the fast-responderP3f (scalp map, r 5 0.857), was found for the new group of fasterresponders, whereas no equivalent prominent or spatially corre-lated component was derived from the response averages of thenew slower responders. Further results of the enlarged subjectgroup comparisons will be reported elsewhere.
The slow-responder target response in the discrimination task(Fig. 4D, bottom right) contained a prominent component Pmpthat peaked, as in the other two subaverages, ;200 msec aftermedian RT. In individual decompositions, Pmp analogs of all fiveslow responders had larger peak RMS-projected amplitude in thediscrimination task. However, in the discrimination task neitherthe fast-responder subgroup subaverage (Fig. 4D, bottom lef t) norany of the five individual fast-responder discrimination-task tar-get response decompositions contained a Pmp analog. Note thatthe group differences in relative sizes of P3f and Pmp weremaintained in the decompositions of the long-RT subaverage forfast responders (Fig. 4D, middle lef t) and the short-RT subaver-age for slow responders (Fig. 4D, top right), although the medianRTs for these trial subsets were nearly identical (356 and 346msec, respectively). Clear Pnt analogs (data not shown), presentin both group decompositions, were somewhat earlier and largerin the fast-responder group average.
Figure 4, E and F, shows all detection-task target responses atthe left periocular electrode for one of the fast responders andone of the slow responders, with single trials sorted (left to right)in order of increasing RT (black traces) and then smoothed witha 30-trial moving average in a style we call an “ERP image” (Jung,Makeig, Westerfield, Townsend, Courchesne, and Sejnowski, un-published observations). In the faster responder, RT followed theP3f peak immediately in all but the few longest-RT trials, whereasin longer-RT trials of the slower responder, RT lagged behind theP3f peak by 200 msec or more. The figure also shows the prom-inent post-RT frontal negativity in the slower responder ac-counted for by Pmp, which was absent from the responses of allfive fast responders.
Figure 5A plots the peak LPC component amplitudes of thesubgroup averages (whose envelopes were shown in Fig. 4D)against their latencies relative to stimulus onset (lef t panel) andmedian RT (right panel). In the fast-responder averages (red solidlines), peak latencies of all three components were time locked tomedian RT (right panel, red symbols), whereas in the slow-
responder averages (blue dashed lines), P3f peak latency was timelocked to stimulus onset (lef t panel, bottom lef t). The response-locked latency of the P3f peak in the slow-responder averagesmatched that of fast-responders only in the detection-taskshort-RT trial subaverage (right panel, bottom lef t).
Timing of the motor commandTo more closely assess the relationship between P3f peak latencyand RT, a control experiment was performed in which the subjectpressed the response button to targets in a single-location variantof the detection task with her right thumb while electromyo-graphic (EMG) activity was recorded from the thumb muscle(extensor pollis brevis). The EMG record (data not shown)clearly indicated that EMG activity began at ;25 msec before theswitch closure used to compute RTs in these experiments. Esti-mating the travel time from the brainstem to the thumb muscle at16 msec (0.8 m at 50 m/sec), the P3f peak and the motor com-mand appear to have been nearly simultaneous for the fasterresponders in all three response conditions.
Comparison with other linear decomposition methodsDetection-task data consisting of 10 long-RT and short-RT targetresponse averages plus 20 nontarget response averages were de-composed separately for the fast-responder and slow-respondergroups using spatial PCA. Each data set had four eigenvalueslarger than unity (with three larger than 2). Because PCA, likeICA, is a linear decomposition, PCA and ICA components can beplotted using identical methods. Figure 5B shows the grand-meanshort-RT target response (all five attended locations) for the fastresponders at centroparietal scalp site Pz (black traces), with theprojections of the three largest principal components at the samechannel superimposed (colored traces), with the projection wave-forms of the next four (relatively small) principal componentsshown below it.
PCA maximized the variance of the first principal componentprojection (Fig. 5B, red), thereby accounting for most of the(ICA) P3b plus some of the Pmp and P3f. The second-largestcomponent (Fig. 5B, green), constrained by PCA to be spatiallyand temporally orthogonal to the first, also accounted for earlyand late activity assigned separately by ICA to Pmp and P3f.Orthogonal Varimax rotation of the activations of the sevenlargest principal components (Fig. 5B, top right) somewhat re-duced the temporal spread of the second (Fig. 5B, green) com-ponent, consistent with its goal of rotation toward “simple struc-ture.” Further oblique rotation of the resulting Varimaxcomponent activations using the Promax algorithm (Fig. 5B,bottom lef t) further focused the activation of this (Fig. 5B, green)component to the Pmp time period and partly separated P3b fromthe early LPC. The scalp map (data not shown) of the largestPromax component active during the early LPC resembled thatof P3f. Time courses of the largest components produced byspatial Varimax (data not shown) generally resembled those fortemporal Varimax. Spatial Promax (data not shown) fractionatedP3b into five components with similar time courses.
Projections of the three ICA components are shown for com-parison (Fig. 5B, bottom right). Note the relative parsimony of theICA component structure, with nearly all of the variance ac-counted for by three components having compact periods ofactivation. The spillover of P3b activity (Fig. 5B, red) into the N1and P2 response peaks is smaller in the ICA decomposition thanin the other three decompositions.
To test the reliability of the ICA components relative to those
Makeig et al. • Functional Components of Visual P300 J. Neurosci., April 1, 1999, 19(7):2665–2680 2675
derived by PCA-based methods, we measured differences in thefour response conditions (fast- and slow-responder subgroups byshort- and long-RT trial subsets) between median reaction timeand peak latencies of the three large components most analogousin time course to the ICA P3f, P3b, and Pmp. Figure 5C (lef tpanel) shows the means and SDs of this RMS latency difference,averaged across all three components and four subject and re-sponse subsets. The covariation of the component peaks withmedian RT was tightest for ICA (red) (RMS difference, ,10msec), and was tighter for temporal Varimax and Promax rota-tions (solid lines) than for spatial rotations (dashed lines).
The right panel of Figure 5C shows means and SDs of thecorrelations between scalp maps (data not shown) of the threeICA component-analogs from the fast- and slow-responder de-compositions, respectively (averaged over the three LPC compo-nents). The subgroup scalp map correlations were more invariantfor ICA (red) (r . 0.9). These results strongly suggest that,applied to these data, ICA decomposition had more simple struc-ture, was more consistent across subject subgroups, and was moretightly linked to performance than decompositions produced byPCA-based methods.
Degree of stability of the decompositionAlthough the decomposition produced by ICA is linear, ICAtraining is nonlinear. Therefore, the projection of an ICA com-ponent derived from the mean of two responses may differ fromthe mean of analogous component projections drawn from sepa-rate decompositions of the same responses. Figure 5D shows thetime courses of RMS amplitude of the three LPC componentprojections for the grand-mean detection-task target response (all10 subjects and five locations) as given by the three ICA decom-positions described above: (1) simultaneous decomposition of 7510-subject response averages from both tasks; (2) separate de-composition of the 25 grand-mean detection-task responses only;and (3) the average of separate detection-task projections for thefast-responder and slow-responder groups, respectively. All threedecompositions produced LPC components with similar scalpdistributions (compare Figs. 3F, 4C), peak latencies, and timecourses. However, as their peak amplitudes vary, projected ICA-component amplitudes are best compared within rather thanbetween decompositions.
ICA identifies independent periods ofspatial stationarityGeometric insight into how the ICA algorithm decomposes ERPis suggested by Figure 5F, which shows all 10 mean short- andlong-RT detection-task target responses for the slow-respondergroup at two midline scalp electrodes (Fz and Pz). In this scatterplot format (middle panel), the data traces follow a cyclic trajec-tory, although time is not represented explicitly. Amplitudechanges in spatially fixed response components are represented bymovements in radial directions away from or toward the origin.This plot shows (dashed lines) the two radial directions corre-sponding to the two largest ICA components (P3b, Pmp) asdefined by the relative strengths of these components at the twolocations in their scalp maps (e.g., Fig. 5G, black dots). The twocomponent directions are aligned with the most nearly radialportions of the data (Fig. 5F), which represent periods when thescalp distribution of the response was unchanging at the twochannels and were accordingly dominated by single ICA compo-nents (Fig. 5E).
The spatial structure of the data scatter plot (Fig. 5F) resem-
bles an oblique parallelogram rather than a Gaussian cloud. ICAdecomposition, by identifying its natural boundaries, finds itsperiods of strongest spatial stationarity, and in so doing finds theaxes and bias offsets that transform the irregular shape of theinput data scatter plot into a near-evenly filled square (right plotinsert), thereby maximizing its entropy. In contrast, PCA would ineffect fit a Gaussian distribution to the data, returning only itsmajor and minor axes. In this case, the first principal component(data not shown) would point in a direction resembling but notmatching that of P3b, and the second principal component, or-thogonal to it, would ignore the sizable stationarity accounted forby Pmp, because the two ICA component scalp maps are wellcorrelated (r 5 0.888), but PCA maps must be orthogonal. ICAidentified important nonGaussian features of the input data bymeans of higher-order (e.g., nonGaussian) statistics implicitlyinvolved in its training (see Appendix).
DISCUSSIONThe results reported here using ICA confirm and clarify theevidence from early ERP studies that target LPCs are composedprimarily of three components. In addition, a left-frontal LPCcomponent was evoked by nogo stimuli that required subjects torefrain from responding. These four ICA components had dis-tinctly different scalp distributions, and their dynamics covariedin orderly ways with the task, subject, and response time differ-ences. The decomposition provided information about the effectsof dependent variables on spatially and temporally overlappingcomponents that would have been difficult or impossible to obtainfrom separate measurements on single-channel waveforms.
The novel P3f componentFirst, an early frontoparietal positivity (with bilateral lateralparietal negativities), called here P3f, was active from the N1peak through the first portion of the LPC. In the subaverages offaster responders, its peak latency was nearly simultaneous withthe subcortical motor command, whereas for five slower respond-ers its peak latency matched RT only for short-RT trials in thesimpler detection task condition. In nearly all decompositions, thetopography of P3f combined a frontal /periocular positivity with afocal, slightly right-of-center parietal positivity whose peak wasslightly anterior to the P3b extremum. Because the P3f amplitudewas near-equal at both periocular sites and occurred in nearlyevery trial with similar (;3 mV) amplitude and latency, it isunlikely that its periocular projection was generated by eye move-ments. Instead, P3f likely derives from stimulus-evoked activity ina frontoparietal system concerned with orienting to spatial stim-uli. Recently, Corbetta et al. (1998) have shown that two tasks,one involving voluntary covert shifts of spatial attention (eyesfixated) and the other, voluntary overt attention shifts (saccadiceye movements to attended locations), produced fMRI signalactivations in bilateral frontal and parietal areas considered to beanalogs of monkey frontal eye field, superior eye field, and lateralintraparietal sulcus areas, respectively (Gaymard et al., 1998).This set of areas is compatible with the scalp distribution of P3f.
The selective evocation of P3f by targets (and partially by nogonear-targets), its frontoparietal topography, and its close associa-tion with response production in faster responders all suggest thatP3f may also reflect activity in brain systems associated withspeeded manual responding. The combination of periocular,frontal, and bilateral parietal scalp features in P3f suggests coor-dinated activity in brain regions underlying frontal and bilateralparietal sites involved in speeded manual responses, particularly
2676 J. Neurosci., April 1, 1999, 19(7):2665–2680 Makeig et al. • Functional Components of Visual P300
in faster responders. These possibly include human homologs ofthe superior parietal “reach region” (Snyder et al., 1997) andfrontal eye fields (Schlag et al., 1998) in monkey orbitofrontalcortex, shown to be activated by alarming stimuli and suddenauditory events (Cottraux et al., 1996; Johnsrude et al., 1997), andprefrontal cortex (Rao et al., 1997). More experiments will berequired to determine the relative importance of speeded re-sponding, selective attention, and/or spatial orienting for P3fgeneration.
Novel stimuli presented during focused attention to a stream ofknown stimuli or rare stimuli presented during passive attentioncan produce a relatively early, large centrofrontal LPC feature(Courchesne et al., 1975). The scalp distributions of this noveltyor P3a component (Katayama and Polich, 1998) appear differentfrom the P3f, but further studies will be required to evaluatepossible differences between them.
The P3b component and P300The largest of the three independent LPC components, P3b, hada central parietal maximum and a right-frontal bias, like the LPCpeak itself. In the detection task, its peak amplitude appearedinversely related to median RT. In the discrimination task, the;90 msec delay between RT and the P3b peak observed in thedetection task was reproduced only in the fast-responder re-sponse. These characteristics of the central LPC component(P3b) identified by ICA appear consistent with those of the LPCpeak in the detection task, often called P300. However, in thediscrimination-task subaverages (Fig. 4D) the LPC and P3bpeaks did not coincide. Thus, ICA decomposition may greatlyincrease the precision of studies that use P3b amplitude andlatency measures as covariates to explore the nature and progres-sion of psychiatric and neurological conditions such as aging(Friedman et al., 1997), schizophrenia (Turetsky et al., 1998), andautism (Courchesne et al., 1990).
The motor-related Pmp componentThe third LPC component, Pmp, was activated only after abutton press. Its posterior maximum was contralateral to re-sponse hand, and its latency and topographic variability acrosssubjects strongly resembled that of the 200 msec postmovementpositivity in the voluntary motor response (Makeig et al., 1996c;Boetzel et al., 1997). However, in the discrimination task no Pmpwas present in target responses of the five faster responders. Mostprobably, Pmp accounts for a component originally called SW(slow wave) whose peak covaried with RT (Simson et al., 1977;Roth et al., 1978). Makeig et al. (1997; their Fig. 4) also found anICA component strongly resembling Pmp in a task requiringbutton presses after indistinct auditory targets.
The Pnt component and response inhibitionA fourth LPC component, labeled Pnt, was activated in parallelwith P3b after nogo nontarget distractors presented in the at-tended location in the discrimination task. The scalp distributionof Pnt explains the more anterior LPC distribution consistentlyobserved in responses to nogo compared with go stimuli (Fall-gatter et al., 1997), but not previously dissociated from the con-current residual P3b also evoked by these stimuli (Fig. 3E). Thescalp distribution of Pnt appears consistent with activation of leftdorsolateral prefrontal brain areas repeatedly found in lesion andimaging studies to be involved in response inhibition (Taylor etal., 1997; Jonides et al., 1998; McKeown et al., 1998a). In partic-ular, a homologous left frontal activation was found by Ebmeier etal. (1995) in a positron emission topography experiment in which
a three-stimulus oddball paradigm including rare nogo nontargetswas compared with a standard two-stimulus oddball paradigm.
Faster and slower respondersJokeit and Makeig (1994) reported that subjects in a speededauditory response experiment were split neatly into two equalgroups of faster- and slower-responding subjects by the timecourses of EEG power near 40 Hz before and after the imperativestimuli. They tentatively interpreted this result as supporting atheory advanced by early psychophysiologists, including Wundt(1913), that faster responders can respond in speeded responsetasks without waiting for a clear and conscious perception of thestimulus, whereas slower responders inhibit their response untilthey recognize the target event and make a conscious decision torespond to it. Our results suggest that the relatively early re-sponses of faster responders may be triggered by P3f, whichappears to comprise concurrent activations in more than onebrain region. Possibly, the larger Pmp in slower responders mightindex their greater tendency to attend to somatosensory feedbackfrom their button press, a hypothesis compatible with Wundt’scharacterization.
The analytic power of ICAAlthough the ICA technique is relatively new, and its effective-ness in separating ERPs into components that reflect underlyingbrain processes has not yet been established, the results reportedhere are encouraging. They demonstrate, first, that ICA canparsimoniously decompose ERP data sets comprised of manyscalp channels, stimulus types, and task conditions into tempo-rally independent, spatially fixed, and physiologically plausiblecomponents without necessarily requiring the presence of multi-ple local response peaks to separate meaningful response com-ponents. Second, the apparent consonance of the identified scalpdistributions for P3f, Pmp, and Pnt with fMRI activations re-ported for related task paradigms suggests use of these methodsmay lead to increased convergence between results of cognitiveERP and fMRI experiments. Third, the LPC components iden-tified here had distinct scalp distributions, and their dynamicscovaried in orderly ways with task, subject, and response time.Furthermore, they provided more information about the relation-ships of spatially and temporally overlapping components to sub-ject performance than either PCA, Varimax, or Promax, infor-mation that would be difficult or impossible to obtain fromseparate measurements of single-channel waveforms. ICA hasalso been applied successfully to analysis of fMRI data (McKe-own et al., 1998b) and optical recording data using voltage-sensitive dyes (Brown et al., 1998).
ConclusionsResponses to visual stimuli analyzed with ICA have revealedthree major components to the LPC, in accord with the results ofearly ERP studies on auditory target LPCs. Motor responses offaster responders were triggered at the peak of an early compo-nent, P3f, that begins at ;140 msec and includes concurrentfrontal and bilateral parietal scalp foci. The second component,P3b, resembled the P300 response reported in simple oddballexperiments not involving motor responses. The third compo-nent, Pmp, tended to follow responses of slower responders andmatched the 200 msec postmovement positivity in voluntary but-ton press responses in both latency and scalp distribution. Subjectgroup differences linked to median RT appeared to be equallyexpressed in subaverages of subjects short- and long-RT trials,suggesting they may be robust to changes in instructions and
Makeig et al. • Functional Components of Visual P300 J. Neurosci., April 1, 1999, 19(7):2665–2680 2677
strategy, although this has not yet been tested. The methodsdemonstrated here might be used with normal or clinical subjectsto assess cognitive function. They provide a valuable new windowinto the relative strengths and time courses of underlying brainprocesses.
APPENDIXLee et al. (1999a) have shown that the major algorithms proposedfor ICA can be derived from an information theoretic framework,differing mainly in the distributions they assume for the activationvalues of the separate components (Jutten and Herault, 1991;Cichocki et al., 1994; Comon, 1994; Bell and Sejnowski, 1995;Amari et al., 1996; Cardoso and LaHeld, 1996; Perlmutter andParra, 1996; Karhunen et al., 1997; Lewicki and Sejnowski, 1998;Lee et al., 1999b). The infomax ICA algorithm of Bell andSejnowski (1995), when implemented using a sigmoid nonlinear-ity, is capable of separating arbitrary full-rank mixtures of com-ponent processes having temporally independent activations,with super-Gaussian (positive-kurtosis) distributions.
Independence of two or more variables implies not only thatthey are uncorrelated, a condition on the second-order moments,but also that all the higher-order joint moments are zero. Thus,decorrelation is a weaker restriction than independence. Inde-pendence is equivalent to minimizing the mutual informationbetween a set of signals, which can be accomplished under certainconditions by maximizing their joint entropy (Bell and Sejnowski,1995). Entropy is a measure of the amount of disorder in asystem; its maximum occurs when the joint, multidimensionalprobability distribution of the system is uniform.
The infomax ICA algorithmEach input vector, x(t), represents a set of EEG voltages recordedfrom all the input channels at time t. Joint entropy maximizationis performed on the (randomly time-ordered) input data afterthey are linearly transformed and then compressed by a nonlinearsigmoidal function:
y~t! 5 g~u~t!!, where u~t! 5 Wx~t! 1 W0 (1)
The sigmoidal nonlinearity, g(), provides necessary higher-orderstatistical information to guide the entropy maximization. Op-tional sphering of the input data before training:
xs~t! 5 Sx~t!, where S 5 2^xxT&21⁄2 (2)
where , . is the average taken over the data, removes second-order correlations between channels and may speed up conver-gence (Bell and Sejnowski, 1996).
Before training, W is initialized to the identity matrix, I (orelse, if the data are not sphered, to the sphering matrix, S) and W0
to 0, and then W and W0 are iteratively adjusted using smallbatches of randomly selected data vectors (normally 10 or more)drawn from {x} without substitution, according to:
DW 5 eSH~ y!
W DWTW 5 e~I 1 wu~t!T!W (3)
DW0 5 ew~t! (4)
Here, H(y) is the joint entropy of y, e is the learning rate(normally ,0.01), and the function w() has elements:
wi~t! 5
ui~t!lnS y~t!
ui~t!D (5)
The “natural gradient” term WTW in the update equation (Amariet al., 1996; Cardoso and Laheld, 1996) avoids matrix inversionsand greatly speeds convergence (Amari, 1998). The logisticnonlinearity:
yi~t! 5 g~ui! 5 1/~1 1 e2ui! (6)
gives
wi~t! 5 1 2 2yi~t! (7)
and a simple update rule,
W0i~t! 3 e~1 2 2yi~t!! (8)
that biases the algorithm toward finding sparsely activated (super-Gaussian) independent components with positive kurtosis, com-patible with the assumption that ERPs are composed of one ormore overlapping series of brief activations within spatially fixedbrain systems performing separable stages of stimulus informa-tion processing.
The number of time points needed for the method may be asfew as several times the number of recording channels, which inturn must be at least equal to the number of components to beseparated. The columns of the inverse matrix, W21, or (WS)21 ifthe data are sphered, give the projection strengths of the respec-tive components onto the scalp sensors. These may be interpo-lated to give a scalp map associated with each component. Theprojection of the ith component activation into the original dataspace is given by the outer product of the ith row of the compo-nent activation matrix with the ith column of the inverse unmix-ing matrix. As scaling information and polarity are distributedbetween the activation waveforms and the maps (unless one orthe other are normalized), the strengths of different componentsshould be compared through the strengths of their projections,which are scaled in the original data units (microvolts) (Makeig etal., 1997).
Infomax trainingThe infomax algorithm reported here used an initial learning ratenear e 5 0.004 and computed updates based on batches of ;25time points chosen at random without substitution from the inputdata set. After each pass through all the data points, an anglerepresenting the difference in direction between the update vec-tors in the current and previous passes was computed. Wheneverthis angle was .60°, the learning rate was reduced by 10%.Training was halted when the learning rate decreased below0.000001 [Stand-alone and Matlab routines used are available viathe world wide web (S. Makeig, MATLAB toolbox for electro-physiological data analysis, version 3.2, WWW Site, Computa-tional Neurobiology Laboratory, Salk Institute, La Jolla CA,http://www.cnl.salk.edu/;scott /ica.html {World Wide Web Pub-lication}, 1998)]. Repeated testing showed that the decompositionso derived was little affected by the exact choice of training,annealing, or stopping parameters. As expected, the absolutevalues of correlations, {r}, between component activations(across all the input data) were low (SD of r , 0.029).
Extended-infomaxThe infomax algorithm learning rule can be generalized to sep-arate sources with either sub-Gaussian (negative-kurtosis) orsuper-Gaussian (positive-kurtosis) distributions by approximat-ing the estimated probability density function in the form of a
2678 J. Neurosci., April 1, 1999, 19(7):2665–2680 Makeig et al. • Functional Components of Visual P300

fourth-order Edgeworth approximation (Girolami and Fyfe,1997). The algorithm becomes:
DW 5 e@I 2 K tanh~u!uT 2 uuT#W (9)
where K is an n-dimensional diagonal matrix whose elements are
ki 5 11 for super-Gaussian sources
ki 5 21 for sub-Gaussian sources
The kis can be estimated from the generic stability analysis ofseparating solutions. This yields the choice of kis used by Lee etal., (1999b):
ki 5 sign~E$sech2~ui!%E$ui2% 2 E$tanh~ui!ui%! (10)
which ensures stability of the learning rule.
JADEThe JADE algorithm (Cardoso and Laheld, 1996) also performsICA based on joint diagonalization of cumulant matrices involv-ing all cumulants of orders two and four. It can separate bothsub-Gaussian and super-Gaussian sources. The JADE softwarerelease (J.-F. Cardoso, JADE code for real-valued signals, version1.5, WWW Site, CRNS, Paris, France, http://sig.enst.fr:80/;car-doso/{World Wide Web Publication}, 1997) requires no param-eter tuning. The current implementation limits the number ofdata channels (and separated sources) that can be practicallyseparated to ;50 on current computers.
PCA-based decomposition methodsA second class of proposed LPC decompositions have involvedPCA (Donchin, 1966; Glaser and Ruchkin, 1976; Friedman, 1984;Dien et al., 1997). Although PCA can efficiently characterizeGaussian-distributed data, actual ERP data are not Gaussian(compare Fig. 5F). Because of this, these researchers have ex-plored the possible usefulness of several orthogonal and obliquecomponent vector rotation methods for finding simple structurein high-dimensional data. Advantages and shortcomings of theseapproaches have been extensively discussed (Wood and Mc-Carthy, 1984; Mocks and Verleger, 1986; Chapman and McCrary,1995).
Varimax and PromaxVarimax and Promax are two methods for rotating componentssuch as those derived by PCA toward simple structure. Applied torotation of components obtained by spatial PCA, the principle ofsimple structure implies that the variance in the original dataaccounted for by each component is concentrated into relativelyfew scalp channels or into relatively few time points, dependingon whether the rotation is applied to the time courses of activa-tion of the PCA components or to their scalp maps (eigenvectors).Spatial rotation toward simple structure attempts to minimize thenumber of scalp channels accounted for by each component,thereby generally biasing components to account for the activityof superficial brain sources. Often, in practice, only the largestprincipal components are rotated.
Varimax (Kaiser, 1958) is an orthogonal rotation method anddoes not strictly require initialization by transformation of thedata into a principal component subspace (Mocks and Verleger,1986). Because it produces an orthogonal rotation, Varimax com-ponents derived from PCA eigenvectors cannot account for ac-tivity from functionally separate brain sources whose spatialprojections to the scalp are nonorthogonal (Donchin et al., 1986).
Promax (Hendrickson and White, 1964) is an iterative nonlinearmethod that performs a highly constrained oblique rotation tofurther intensify the orthogonal “rotation to simple structure”produced by Varimax. In Promax, the unrotated data and thedata accounted for by each component are first raised to apositive power (often the fourth), retaining their original sign andemphasizing their peak values, and the component filters arerotated so as to minimize the least-square distance between theirprojections and the distorted data. We applied both temporal andspatial Varimax and Promax rotation to the largest seven princi-pal components of the data (Fig. 5B,C). Promax training washalted when the relative distance measure stopped decreasing(after 1–3 iterations).
REFERENCESAlexander LE, Porjesz B, Bauer LO, Kuperman S, Morzorati S,
O’Connor SJ, Rohrbaugh J, Begleiter H, Polich J (1995) P300 hemi-spheric asymmetries from a visual oddball task. Psychophysiology17:35–46.
Amari S (1998) Natural gradient works efficiently in learning. NeuralComput 10:251–276.
Amari S, Cichocki A, Yang HH (1996) A new learning algorithm forblind signal separation. In: Advances in neural information processingsystems 8 (Touretzky D, Mozer M, Hasselmo M, eds), pp 757–763,Cambridge, MA: MIT.
Bell AJ, Sejnowski TJ (1995) An information-maximization approach toblind separation and blind deconvolution. Neural Comput 7:1129–1159.
Bell AJ, Sejnowski TJ (1996) Learning the higher-order structure of anatural sound. Network: Computation in Neural Systems 7:261–270.
Bell AJ, Sejnowski TJ (1997) The “independent components” of naturalscenes are edge filters. Vision Res 37:3327–3338.
Boetzel K, Ecker C, Schulze S (1997) Topography and dipole analysis ofreafferent electrical brain activity following the Bereitschaftspotential.Exp Brain Res 114:352–361.
Brown GD, Yamada S, Luebben H, Sejnowski TJ (1998) Spike sortingand artifact rejection by independent component analysis of opticalrecordings from tritonia. Soc Neurosci Abstr 24:1670.
Cardoso J-F, Laheld B (1996) Equivalent adaptive source separation.IEEE Trans Signal Processing 44:3017–3030.
Chapman RM, McCrary JW (1995) EP component identification andmeasurement by principal components analysis. Brain Lang27:288–301.
Cichocki A, Unbehauen R, Rummert E (1994) Robust learning algo-rithm for blind separation of signals. Electronics Lett 30:1386–1387.
Comon P (1994) Independent component analysis, a new concept? Sig-nal Processing 36:287–314.
Corbetta M, Akbudak E, Conturo TE, Snyder AZ, Ollinger JM, DruryHA, Linenweber MR, Petersen SE, Raichle ME, Van Essen DC,Shulman GL (1998) A common network of functional areas for atten-tion and eye movements. Neuron 21:761–773.
Cottraux J, Gerard D, Cinotti L, Froment JC, Deiber MP, Le Bars D,Galy G, Millet P, Labbe C, Lavenne F, Bouvard M, Mauguiere F(1996) A controlled positron emission tomography study of obsessiveand neutral auditory stimulation in obsessive-compulsive disorder withchecking rituals. Psychiatry Res 60:101–112.
Courchesne E, Hillyard SA, Galambos R (1975) Stimulus novelty, taskrelevance and the visual evoked potential in man. ElectroencephalogrClin Neurophysiol 39:131–143.
Courchesne E, Akshoomoff NA, Townsend J (1990) Recent advances inautism. Curr Opin Pediatr 2:685–693.
Cover TM, Thomas JA (1991) Elements of information theory. NewYork: John Wiley.
Dien J, Tucker DM, Potts G, Hartry-Speiser A (1997) Localization ofauditory evoked potentials related to selective intermodal attention. JCognit Neurosci 9:799–823.
Donchin E (1966) A multivariate approach to the analysis of averageevoked potentials. IEEE Trans Biomed Eng 13:131–139.
Donchin E, Karis D, Bashore TR, Coles MGH, Gratton G (1986) In:Psychophysiology: systems, processes and applications (Coles MGH,Donchin E, Porges SW, eds), pp 244–266.
Ebmeier KP, Steele JD, MacKenzie DM, O’Carroll RE, Kydd RR,Glabus MF, Blackwood DH, Rugg MD, Goodwin GM (1995) Cogni-
Makeig et al. • Functional Components of Visual P300 J. Neurosci., April 1, 1999, 19(7):2665–2680 2679

tive brain potentials and regional cerebral blood flow equivalents dur-ing two- and three-sound auditory “oddball tasks.” ElectroencephalogrClin Neurophysiol 95:434–443.
Fallgatter AJ, Brandeis D, Strik WK (1997) A robust assessment of theNoGo-anteriorization of P300 microstates in a cued continuous per-formance test. Brain Topogr 9:295–301.
Falkenstein M, Hohnsbein J, Hoormann J (1995) Late visual and audi-tory ERP components and choice reaction time. Biol Psychol35:201–224.
Ford JM, Sullivan EV, Marsh L, White PM, Lim KO, Pfefferbaum A(1994) The relationship between P300 amplitude and regional graymatter volumes depends upon the attentional system engaged. Electro-encephalogr Clin Neurophysiol 90:214–228.
Friedman D (1984) P300 and slow wave: the effects of reaction timequartile. Biol Psychol 18:49–71.
Friedman D, Kazmerski V, Fabiani M (1997) An overview of age-related changes in the scalp distribution of P3b. ElectroencephalogrClin Neurophysiol 104:498–513.
Friston KJ (1998) Imaging neuroscience: principles or maps? Proc NatlAcad Sci USA 95:796–802.
Gaymard B, Ploner CJ, Rivaud S, Vermersch AI, Pierrot-Deseilligny C(1998) Cortical control of saccades. Exp Brain Res 123:159–163.
Girolami M, Fyfe C (1997) Generalized independent component analy-sis through unsupervised learning with emergent bussgang properties.In: Proc IEEE Int Conf on Neural Networks, pp 1788–1791.
Glaser EM, Ruchkin DS (1976) Principles of neurobiological signalanalysis. New York: Academic.
Halgren E, Squires NK, Wilson CL, Rohrbaugh JW, Babb TL, CrandallPH (1980) Endogenous potentials generated in the human hippocam-pal formation and amygdala by infrequent events. Science 210:803–805.
Hendrickson AE, White PO (1964) Promax: a quick method for rotationto oblique simple structure. Br J Stat Psych 17:65–70.
Hillyard SA, Mangun GR, Woldorff MG, Luck SJ (1995) Neural systemsmediating selective attention. In: The cognitive neurosciences (Gazza-niga MS, ed), pp 665–681. Cambridge MA: MIT.
Hohnsbein J, Falkenstein M, Hoormann J, Blanke L (1991) Effects ofcrossmodal divided attention on late ERP components. I. Simple andchoice reaction tasks. Electroencephalogr Clin Neurophysiol78:438–446.
Johnsrude IS, Zatorre RJ, Milner BA, Evans (1997) A left-hemispherespecialization for the processing of acoustic transients. NeuroReport8:1761–1765.
Jokeit H, Makeig S (1994) Different event-related patterns of gamma-band power in brain waves of fast- and slow-reacting subjects. Proc NatlAcad Sci USA 91:6339–6343.
Jonides J, Smith EE, Marshuetz C, Koeppe RA, Reuter-Lorenz PA(1998) Inhibition in verbal working memory revealed by brain activa-tion. Proc Natl Acad Sci USA 95:8410–8413.
Jung T-P, Humphries C, Lee T-W, Makeig S, McKeown M, Iragui V,Sejnowski TJ (1998) Extended ICA removes artifacts from electroen-cephalographic recordings. In: Advances in neural information process-ing systems 10 (Kearns M, Jordan M, Solla S, eds), pp 894–900.Cambridge, MA: MIT.
Jutten C, Herault J (1991) Blind separation of sources, part I: an adap-tive algorithm based on neuromimetic architecture. Signal Processing24:1–10.
Kaiser HF (1958) The Varimax criterion for analytic rotation in factoranalysis. Pychometrika 23:187–200.
Katayama J, Polich J (1998) Stimulus context determines P3a and P3b.Psychophysiology 35:23–33.
Karhunen J, Oja E, Wang L, Vigario R, Joutsenalo J (1997) A class ofneural networks for independent component analysis. IEEE TransNeural Networks 10:486–504.
Knight RT, Scabini D, Woods DL, Clayworth CC (1989) Contributionsof temporal-parietal junction to the human auditory P3. Brain Res502:109–116.
Lee T-W, Girolami M, Bell AJ, Sejnowski TJ (1999a) A unifying frame-work for independent component analysis. Comput Math Appl, inpress.
Lee T-W, Girolami M, Sejnowski TJ (1999b) Independent componentanalysis using an extended infomax algorithm for mixed sub-gaussianand super-gaussian sources. Neural Comput 11:417–441.
Lewicki MS, Sejnowski TJ (1998) Learning nonlinear overcomplete rep-resentations for efficient coding. In: Advances in Neural Information
Processing Systems 10 (Kearns M, Jordan M, Solla S, eds), pp 556–562.Cambridge, MA: MIT.
Linsker R (1992) Local synaptic learning rules suffice to maximise mu-tual information in a linear network. Neural Comput 4:691–702.
McKeown MJ, Jung T-P, Makeig S, Brown GG, Kindermann SS, LeeT-W, Sejnowski TJ (1998a) Spatially independent activity patterns infunctional magnetic resonance imaging. Proc Natl Acad Sci USA95:803–810.
McKeown MJ, Makeig S, Brown GG, Jung T-P, Kindermann SS, Bell AJ,Sejnowski TJ (1998b) Analysis of fMRI data by blind separation intoindependent spatial components. Hum Brain Mapp 6:160–188.
Makeig S, Bell AJ, Jung T-P, Sejnowski TJ (1996a) Independent com-ponent analysis of electroencephalographic data. In: Advances in neu-ral information processing systems 8 (Touretzky D, Mozer M, Has-selmo M, eds), pp 145–151. Cambridge, MA: MIT.
Makeig S, Jung T-P, Ghahremani D, Sejnowski TJ (1996b) Independentcomponent analysis of simulated ERP data. Institute for Neural Com-putation, University of California: technical report INC-9606.
Makeig S, Mueller M, Rockstroh B (1996c) Effects of voluntary move-ments on early auditory brain responses. Exp Brain Res 110:487–492.
Makeig S, Jung T-P, Ghahremani D, Bell AJ, Sejnowski TJ (1997) Blindseparation of auditory event-related brain responses into independentcomponents. Proc Natl Acad Sci USA 94:10979–10984.
Mocks J, Verleger R (1986) Principal component analysis of event-related potentials: a note on misallocation of variance. Electroencepha-logr Clin Neurophysiol 65:393–398.
Nadal J-P, Parga N (1994) Non-linear neurons in the low noise limit: afactorial code maximises information transfer. Network 5:565–581.
Nunez P (1981) Electric fields of the brain: the neurophysics of EEG.New York: Wiley.
Pearlmutter BA, Parra LC (1996) A context-sensitive generalization ofICA, International Conference on Neural Information Processing, pp151–157, Hong Kong, September.
Rao SC, Rainer G, Miller EK (1997) Integration of what and where inthe primate prefrontal cortex. Science 276:821–824.
Roth WT, Ford JM, Kopell BS (1978) Long latency evoked potentialsand reaction time. Psychophysiology 15:17–23.
Ruchkin DS, Johnson R, Canoune HL, Ritter W, Hammer M (1990)Multiple sources of P3b associated with different types of information.Pychophysiology 27:157–176.
Schlag J, Dassonville P, Schlag-Rey M (1998) Interaction of the twofrontal eye fields before saccade onset. J Neurophysiol 79:64–72.
Simson R, Vaughn HG, Ritter W (1977) The scalp topography of po-tentials in auditory and visual Go/Nogo tasks. Electroencephalogr ClinNeurophysiol 43:864–875.
Snyder L, Batista K, Andersen R (1997) Coding of intention in posteriorparietal cortex. Nature 386:167–170.
Squires NK, Squires KC, Hillyard SA (1975) Two varieties of long-latency positive waves evoked by unpredictable auditory stimuli in man.Electroencephalogr Clin Neurophysiol 387:387–401.
Sutton S, Braren M, Zubin J, John ER (1965) Evoked-potential corre-lates of stimulus uncertainty. Science 150:1187–1188.
Taylor SF, Kornblum S, Lauber EJ, Minoshima S, Koeppe RA (1997)Isolation of specific interference processing in the Stroop task: PETactivation studies. NeuroImage 6:81–92.
Townsend J, Harris NS, Courchesne E (1996) Visual attention abnor-malities in autism: delayed orienting to location. J Int Neuropsychol Soc2:541–550.
Turetsky BI, Colbath EA, Gur RE (1998) Subcomponent abnormalitiesin schizophrenia: I. Physiological evidence for gender and subtypespecific differences in regional pathology. Biol Psychiatry 43:84–96.
Vigario RN (1997) Extraction of ocular artifacts from EEG using inde-pendent component analysis. Electroencephalogr Clin Neurophysiol103:395–404.
Werth E, Achermann P, Dijk DJ, Borbely AA (1997) Spindle frequencyactivity in the sleep EEG: individual differences and topographic dis-tribution. Electroencephalogr Clin Neurophysiol 103:535–542.
Wood CC, McCarthy G (1984) Principal component analysis of event-related potentials: simulation studies demonstrate misallocation of vari-ance across components. Electroencephalogr Clin Neurophysiol 59:249–260.
Wundt W (1913) Grundriss der Psychologie. Leipzig, Germany:Engelmann.
2680 J. Neurosci., April 1, 1999, 19(7):2665–2680 Makeig et al. • Functional Components of Visual P300