Functional relevance of nuclear receptor TLX in...
76
MASTERARBEIT Titel der Masterarbeit “Functional relevance of nuclear receptor TLX in human brain tumour formation” verfasst von Patricio Ferrer Murguia BSc angestrebter akademischer Grad Master of Science (MSc) Wien, 2015 Studienkennzahl lt. Studienblatt: A 066 877 Studienrichtung lt. Studienblatt: Masterstudium Genetik und Entwicklungsbiologie Betreut von: Univ.Prof. Dr. Ulrich Technau
Transcript of Functional relevance of nuclear receptor TLX in...

MASTERARBEIT
Titel der Masterarbeit
“Functional relevance of nuclear receptor TLX in human brain tumour
formation”
verfasst von
Patricio Ferrer Murguia BSc
angestrebter akademischer Grad
Master of Science (MSc)
Wien, 2015
Studienkennzahl lt. Studienblatt:
A 066 877
Studienrichtung lt. Studienblatt:
Masterstudium Genetik und Entwicklungsbiologie
Betreut von: Univ.Prof. Dr. Ulrich Technau

A mis padres,
Luis y Mariana

Acknowledgments
I would like to thank Prof. Baumgartner- Parzer who allowed me to do my master
thesis at her laboratory and throughout my whole stay provided support and
assistance when required.
I would like to express my gratitude to Prof. Ulrich Technau for his feedback and
guidance in the final stages of my writing.
Special thanks to Mag. Dr. Katharina Lampichler for her mentoring and advice while
doing my practical work as well as for her invaluable help during the writing of this
thesis.
My special thanks to Rita Lang for demonstrating many of the individual techniques
that were used during this study.
I would also like to thank the University of Vienna for granting me the opportunity to
perform my studies and for the great education received.
Finally I would like to thank all my colleagues that accompanied me during my
studies.

Abstract
The vertebrate homologue of the Drosophila Tll (Tailless) nuclear receptor is
known as TLX or NR2E1. Its expression is found in the developing central
nervous system, plays an important role in the pallio-subpallial boundary
patterning as well as in the optical development in mice. The interest in TLX has
grown in recent years due to its pivotal role in adult neurogenesis. Moreover, it
has been shown that TLX is expressed in the higher grade glioma, glioblastoma
multiform and seems to be the driver behind the ability of brain cancer stem
cells two self-renew.
Based on this previous work I decided to investigate how TLX affects the
expression of other genes by forcing a stable overexpression of TLX in the
glioblastoma cell line U-87MG.
Overexpressing cells were compared to their unchanged TLX expressing
counterparts through a high through output proteomic analysis and changes in
gene expression were determined.
Overexpression of TLX changes expression of an array of genes in both, positive
and negative fashion. The results presented indicate that TLX over-expression
affects cell proliferation. A statistically significant difference was found in
expression levels when compared to controls. Up regulation of a possible new
biomarker for TLX expressing cells (LRRC34) was also noted. Additionally, the
present work shows how TLX might be involved in cell migration and enabling
cells a selective advantage in acidic environments.
Although additional studies have to be performed to confirm these results this
work provides a number of future research targets for a better understanding of
TLX and its role in the stem-cell nature of cancer stem cells.

Table of Contents
1 Introduction ...................................................................................................................... 7 1.1 Transcription Factors ......................................................................................................... 7
1.1.2 Nuclear Receptors ................................................................................................................... 7 1.1.2.1 Structure and Mechanism of Action .......................................................................... 9
1.2. Adult neurogenesis ...........................................................................................................11 1.2.1 Role of TLX in neurogenesis ........................................................................................... 13
1.3 Cancer and tumour development .................................................................................14 1.3.1 Cancer stem cells .................................................................................................................. 17 1.3.2 Central nervous system tumours ................................................................................ 18 1.3.2.1 Gliomas ................................................................................................................................... 18 1.3.2.2 TLX and glioblastoma ..................................................................................................... 20
2. Aim of the Study ........................................................................................................... 21
3 Materials and methods............................................................................................... 22 3.1 Cloning ....................................................................................................................................22
3.1.1 Primer Design ......................................................................................................................... 22 3.1.2 Polymerase chain reaction of TLX (NR2E1) .......................................................... 22 3.1.3 Agarose gel electrophoresis ........................................................................................... 23 3.1.4 Preparation of LB 2xYT medium ................................................................................. 24 3.1.5 Agar LB 2xYT medium ........................................................................................................... 24 3.1.6 Transformation of Escherichia Coli............................................................................. 25 3.1.7 Plasmid amplification ........................................................................................................ 25 3.1.8 Plasmid isolation .................................................................................................................. 26 3.1.9 TLX-destination vector ...................................................................................................... 26
3.2 Transfection and transduction ......................................................................................28 3.2.1 Cell Culture U-87MG Glioblastoma Grade IV ......................................................... 28 3.2.2 Viral Packing ........................................................................................................................... 29 3.2.3 Transduction of U-87MG cell culture ........................................................................ 31 3.2.4 Selection of puromycin resistant cells ...................................................................... 31 3.2.5 Selection of RFP positive cells ....................................................................................... 32
3.3 Immunofluorescence ........................................................................................................33 3.3.1 Immunostaining .................................................................................................................... 33
3.4. siRNA mediated Knock down, RNA isolation and qPCR quantification .........34 3.4.1 siRNA knockdown ................................................................................................................ 34 3.4.2 RNA isolation with TRIzol ................................................................................................ 35 3.4.3 RNA isolation for microarray analysis ..................................................................... 36 3.4.4 Reverse transcription ........................................................................................................ 37 3.4.5. Quantitative real time polymerase chain reaction ........................................... 38 3.4.5.1 Gene expression analysis ............................................................................................. 39
3.5. Microarray analysis ..........................................................................................................39 3.5.1 Statistical analysis of microarray data ..................................................................... 40 3.5.2 Pathway analysis .................................................................................................................. 40
3.6 Protein Analysis ..................................................................................................................40 3.6.1 Protein Isolation ................................................................................................................... 40 3.6.2 Protein Assay .......................................................................................................................... 41 3.6.3 Western blot analysis ......................................................................................................... 42
3.7 Sequencing of DNA .............................................................................................................43 3.8 Glycerol bacteria stock .....................................................................................................44 3.9 Cryogenic cell line stock ...................................................................................................45 3.10 Reagents ..............................................................................................................................46
4. Results ............................................................................................................................. 48

4.1 Generation of TLX viral vectors .....................................................................................48 4.2 Verification of transduced U-87MG cell line with pMSCV-RFP vectors ...........50 4.3 Selection of U-87MG transduced cells .........................................................................51
4.3.1 Selection of U-87MG puromycin resistant cells ................................................... 51 4.3.2 Selection of U-87MG RFP positive cells .................................................................... 51
4.4 Proliferation differences between U-87MG cell lines ...........................................53 4.5 Quantitative PCR and western blot analysis of TLX ...............................................54
4.5.1 Quantitative PCR analysis of TLX ................................................................................. 54 4.5.2 Western blot analysis of TLX .......................................................................................... 55
4.6 Immunofluorescence of U-87MG and U-87MG-puromycin cells .......................55 4.7 p53 knockdown ...................................................................................................................57
4.7.1 Quantitative PCR analysis of p53 knockdown ...................................................... 57 4.7.2 Western blot verification of p53 knockdown ....................................................... 58
4.8 Microarray analysis ...........................................................................................................59 4.9 Pathway analysis ................................................................................................................62
5. Discussion ...................................................................................................................... 64 5.1 TLX does not cause perceptible changes in morphology in U-87MG ...............64 5.2 Overexpression of NR2E1 negatively affects cell proliferation .........................64 5.3 TLX downregulates tumour suppressor AP-2 gamma and the tumour suppressor candidate TUSC3.................................................................................................65 5.4 TLX may influence cell migration and invasiveness of GBM ...............................65 5.5 Up regulation of LRRC34 and ABCG2 stem cell biomarkers ...............................65 5.6 TLX may help CSCs survive in an hypoxic-acidic environment..........................65 5.7 Future steps and challenges ...........................................................................................66
6. Appendix ........................................................................................................................ 67 6.1 Deutsche Zusammenfassung ..........................................................................................67 6.2 Curriculum Vitae .................................................................................................................68
7. References ..................................................................................................................... 69

7
1 Introduction
1.1 Transcription Factors
Gene expression regulation can be divided into three main mechanisms known
as transcription, processing and translation[1]. At the very beginning of gene
expression, transcription regulates which part of the genome is transcribed into
RNA[2]. Initiation of transcription is controlled by trans-acting elements
encoding for regulatory proteins and cis-acting DNA sequences[1]. This process
is much simpler in prokaryotes than in eukaryotes. The simplest example would
be the binding of a protein to its target DNA sequence, affecting transcription in
either a positive or negative manner. In prokaryotes, together sigma factor and
core enzyme form the RNA polymerase holoenzyme, which scans the DNA until a
specific sequence, known as promoter, is reached and recognized by the sigma
factor. Once this happens the holoenzyme binds tightly to the DNA and
transcription starts[1, 3]. So, the bacterial RNA polymerase requires only a single
additional protein, the sigma factor, to start transcription. In contrast, the
eukaryotic RNA polymerase needs many additional proteins called transcription
factors (TFs) to begin this process[1-4]. These trans-acting proteins can either
act alone or bind with other elements to form a complex that activates or
represses transcription[5, 6]. What differentiates TFs from other transcriptional
regulators like histone modifiers, chromatin remodelers or coactivators, is that
all TFs possess either one or more DNA binding domains (DBD) that interact
directly with a specific promoter sequence of their target gene[7]. Since TFs are
essential for gene regulation they are found in prokaryotes as well as in archea
and eukaryotes. It has also been observed that the amount of TFs grows with the
size of the organisms genome[8].
1.1.2 Nuclear Receptors
Since the observation of Gudernatsch et al. (1911) that feeding tadpoles with
thyroid extracts would cause them to undergo premature metamorphosis[9], it
was theorized that these molecules played an important role in development
even though the exact mechanism of action remained elusive. Further work done
by Jensen et al. (1966) gave an insight on their mode of action. He and his
colleagues showed that radiolabeled ligands bind cytoplasmic proteins and
translocate into the nucleus, indicating an interaction between ligand and
cytoplasmic protein with possible subsequent gene regulation[10]. Working on
this Ashburner et al. (1974) showed that gene activation was induced at polytene

8
chromosomes in Drosophila melanogaster upon treatment with the metamorphic
insect hormone ecdysone[11]. At the beginning of the 1980s, experiments
performed in Dr. Keith R. Yamamoto’s laboratory at the University of California
showed that activated glucocorticoid receptors are able to regulate the
expression of integrated murine mammary tumour virus (MTV) genes in infected
rat hepatoma tissue culture (HTC) cells[12-14]. Further identification of other
steroid hormone receptors like estrogen (hER)[15, 16], mineralcortocoid
(hMR)[17] and progesterone (hPR)[18] showed structural similarities among
them[19]. The search for further, yet unknown NRs was initially based on
hybridisation methods using cDNA libraries [20, 21] and later on through
genome sequencing analysis[22]. This even lead to the identification of NRs
without prior knowledge of their ligands, which were given the name orphan
nuclear receptors (ONRs)[23]. To date 48 different NRs genes, divided into 7
subfamilies, have been identified in humans. 13 of those are still classified as
ONRs (Table 1)[24, 25]. The first non-hormone ligand was found in 1987
independently by Giguere et al. and Petrkovich et. al, showing the existence of a
NR superfamily[26, 27].
Table 1. Human nuclear receptors.
Nomenclature/
Abrreviation Gene Ligand
NR1A1/TRα THRA Thyroid hormones
NR1A2/TRβ THRB
NR1B1/RARα RARA
Retinoic acids NR1B2/RARβ RARB
NR1B3/RARγ RARG
NR1C1/PPARα PPARA
Fatty acids NR1C2/PPAR-β/δ PPARD
NR1C3/PPARγ PPARG
NR1D1/Rev-ErbAα NR1D1 Heame
NR1D2/Rev-ErbAβ NR1D2
NR1F1/RORα RORA Cholesterol, cholesteryl
sulfate NR1F2/RORβ RORB
NR1F3/RORγ RORC
NR1H3/LXRα NR1H3 Oxysterols, glucose
NR1H2/LXRβ NR1H2
NR1H4/FXR NR1H4 Bile acids, fexarmine
NR1h5/FXRβ NR1H5 Lanosterol
NR1I1/VDR VDR Vitamin D3
NR1I2/PXR NR1I2 Xenobiotics
NR1I3/CAR NR1I3 Xenobiotics,

9
phenobarbital
NR2A1/HNF4α HNF4A Fatty acids
NR2A2/HNF4γ HNF4G
NR2B1/RXRα RXRA
Retinoic acid NR2B2/RXRβ RXRB
NR2B3/RXRγ RXRG
NR2C1/TR2 NR2C1
Orphan
NR2C2/TR4 NR2C2
NR2E1/TLX NR2E1
NR2E3/PNR NR2E3
NR2F1/COUP-TFI NR2F1
NR2F2/COUP-TFII NR2F2
NR2F6/EAR2 NR2F6
NR3A1/ERα ESR1 Estradiol
NR3A2/ERβ ESR2
NR3B1/ERRα ESRRA Orphan
NR3B2/ERRβ ESRRB DES, 4-OH tamoxifen
NR3B3/ERRγ ESRRG DES, 4-OH tamoxifen
NR3C1/GR NR3C1 Cortisol, dexamethasone
NR3C2/MR NR3C2 Spirolactone, aldosterone
NR3C3/PR PGR Progesterone
NR3C4/AR AR Androgens
NR4A1/NGFIB NR4A1
Orphan NR4A2/NURR1 NR4A2
NR4A3/NOR1 NR4A3
NR5A1/SF1 NR5A1 Phosphatidylinositols
NR5A2/LRH-1 NR5A2
NR6A1/ GCNF NR6A1
Orphan NR0B1/DAX1 NR0B1
NR0B2/SHP NR0B2
Nuclear receptors in humans. Orphan nuclear receptors are defined as nuclear receptors without
known ligand. (Adapted and updated from[24, 25, 28-30])
1.1.2.1 Structure and Mechanism of Action
Nuclear receptors play key roles in developmental processes and homeostasis as
well as in metabolism and cancer[31-33]. Ligands are small hydrophobic
molecules like steroids, thyroid hormones, retinoids and vitamin D3 (Figure. 1)
that migrate through the plasma membrane and bind to the ligand binding
domain (LBD) of their respective intracellular target receptor. In response, the
receptors undergo an allosteric change, which allows them to alter the regulation
of gene expression[34]. Nuclear receptors have two conserved zinc fingers at

10
their DBD which can regulate transcription of adjacent genes and hence are
considered transcription factors[35]. This highly conserved region is what sets
nuclear receptors apart from other DNA-binding proteins[36]. All nuclear
receptors share more or less the same functional domains; a variable activation
function 1 (AF-1) N-terminus domain followed by a DBD that targets specific
genome sequences, a variable hinge region, a ligand binding domain (AF-2) and a
variable C-terminus region (Figure. 2). NRs are normally bound to repressor
protein complexes but disassociate once a ligand binds to it. This in turn causes
the NR to bind to co-activators or other TFs to activate or repress transcription
of their respective target genes.
Figure 1 Structure of different NRs ligands[10]
Nuclear receptors can be classified into four different classes depending on their
ligand, distribution in absence of ligand and dimerization properties[37]. Class I
are steroid receptors found in the cytosol, which in absence of their ligand are
coupled to heat shock proteins (HSP). Upon ligand binding, the steroid receptors
disassociate from the HSP, form homodimers and translocate to the nucleus.
Once in the nucleus they bind to DNA sequences known as hormone response
elements (HRE) which are organised as inverted repeats[38]. Class II receptors
are always found in the nucleus independently whether they are ligand coupled
or not. They form heterodimers of either thyroid hormone receptor (TR),
retinoic acid receptor (RAR) or vitamin D receptor (VDR) with retinoid X
receptor (RXR) and bind to DNA direct repeats[39]. Class III are NRs that bind as
homodimers to DNA HRE direct repeats. Class IV bind as monomers to extended
core sites. The majority ONRs fall into classes III and IV (Figure 2).

11
Figure 2. Shared structural organization of nuclear receptors as well as a graphical
representation of all IV classes. A/B N-teminal region, C conserved DBD, D Hinge region, E LBD
and F variable C-terminal region. Steroid Receptors (Class I), RXR Heterodimers (Class II),
Dimeric Orphan Receptors (Class III), Monomeric Orphan Receptors (Class IV)[40]
1.2. Adult neurogenesis
The brain and spinal cord is organised as the central nervous system (CNS) and
consists of neurons and glia cells (Table 2), the latter outnumbering the first
tenfold. Most of the information is processed by the neurons while the glia cells
have a more supportive and metabolic role[41]. However, in recent times it has
been shown that glia also play a part in neurotransmission [42].
Most tissues in the mammalian adult body retain a small portion of self-
renewing, multipotent stem cells[43]. For a long time it was thought that the
postnatal brain was depleted of these cells and that neurons could not be newly
generated[44]. This idea started to change in the mid-1900s with the discovery
of postnatal neurogenesis in rats[45] and by the turn of the millennium it was
well established that neural stem cells were also present in the adult nervous
system[46]. Historically it was thought that neuroepithelial cells in the prenatal
brain produced two different committed cell linages of neural and glia cells. Now
it is known that during the development of the brain both cell linages emerge
from a single type of multipotent neural stem cells (NSC) called radial glia
(RG)[47]. In the adult mammalian brain there are two reservoirs of NSC[44].
They are located at the subependymal zone (SEZ) of the lateral ventricles (also
referred as subventricular zone (SVZ) and at the subgranular zone (SGZ) of the

12
dentate gyrus (DG)[45, 48-52](Figure. 3). These adult NSC retain properties
similar to those of embryonic NSC[53].
Table 2. General overview of different types of neural and glia cells in the adult CNS.
Type Name Function
Neurons
Afferent Sensory neurons. Transport information from sensory
organs to the[54].
Efferent Motor neurons. Transport information from the brain to
muscle or glands[55].
Interneuron Form connections between one or more neurons[56].
Glia
Astrocytes
Most numerous cell in the human brain. Provides nutrients
to the nervous tissue, as well as metabolic and structural
support. Can propagate Ca2+ waves in reaction to
stimulation and discharge gliotransmitters in a Ca2+
dependant manner, which modulate important brain
functions[57, 58].
Oligodendrocytes Create a myelin sheath around axons which acts as
insulator[59].
Ependymal cells
Form the walls of the ventricles of the brain and found also
in central canal of the spinal cord as well as contributing to
the formation of central spinal fluid[60].
Microgila Account for 20% of the glia population and are the local
macrophages in the adult CNS[61].
Figure 3 Areas of neurogenesis in the adult rodent brain. A. Sagittal view of the adult rodent
brain. Areas in red illustrate areas of neurogenesis: SVZ of the lateral ventricles and SGZ of the
dentate gyrus. Indicated in green is the migration of cells produced in the SVZ, which become
integrated in the olfactory bulb. B-C. Migration zone in coronal view D-E. Areas of neurogenesis
in coronal view. Adapted from[62]

13
Neuronal precursos of the SEZ migrate along the rostral migratory stream to the
olfactory bulb. On the other hand, immature glia cells of the SEZ migrate to the
cortex and corpus callosum[63, 64]. Cells of the SGZ differentiate and produce
synapses in vivo as well as in vitro integrating themselves to the local neural
network[65, 66]. It has been shown that cells produced in the SGZ play a role in
the formation of episodic and spatial memory in addition to the regulation of
emotions[67, 68]. All these findings show that the brain is a plastic organ that
can change depending on its environment and stimulation[69].
1.2.1 Role of TLX in neurogenesis
The orphan nuclear receptor TLX (NR2E1) is the vertebrate homologue of the fly
NR Tll (tailless), which in 1990 was shown by Pignoni et al to play a role in the
development of the nervous system in D. melanogaster[70]. The TLX gene was
first identified in chick and later in mice. In both cases TLX expression was found
in the developing brain[71, 72].
In the embryonic mouse TLX is highly expressed along a graded pattern of the
dorsal ventral axis in the ventricular zone (VZ) (Figure 4a)[72]. TLX helps to
keep NSC in an undifferentiated state and is necessary for cell proliferation in the
developing brain[73]. Furthermore, TLX remains expressed in the SVZ as well as
in the DG of the postnatal and adult mouse brain. TLX is necessary to maintain
neurogenesis in the adult brain and induces transition of RG to astrocyte-like B
cells which represent the adult NSC (Figure 4b,c)[74]. Moreover, when TLX is
mutated, proliferation and self-renewal of NSC in the adult mouse brain is
abolished[75]. Until now, it has been shown that TLX promotes proliferation of
NSC in the SVZ of the adult mouse by repressing the expression of Pten, p21 and
p57 as well as Wnt7a. Furthermore, TLX seems to maintain NSC in a
undifferentiated state by targeting the microRNA miR-9[76, 77].

14
Figure 4 Expression pattern of TLX in the embryonic, postnatal and adult mouse brain.
Coronal view of the ventricular area at pointed out stages in the mouse brain. The lower part
depicts an enlarged view of TLX expression. A. A graded pattern is formed by TLX at the
embryonic stage along the dorsal-ventral axis of the ventricular zone. TLX prevents NPC from
differentiating prematurely, allowing self-renewal and development of the cortical layer through
asymmetric cell division. Basal progenitor cells marked as BP are intermediate progenitor cells
that produce neurons in the ventricular layer. Upregulation of TLX is associated with the
transition of NSC to BP. B Pluripotent RG (TLX+/Nestin+) give rise to oligodendrocytes, neurons
and astrocytes. TLX is necesarry for the transition of RG to astrocyte-like B cells (TLX+) which
are the adult NSC. C Astrocyte-like B cells in the adult brain are TLX+/GFAP+ and are a source of
neurogenesis in the adult mouse brain[76].
LGE. Lateral ganglionic eminence
MGE. Medial ganglionic eminence
1.3 Cancer and tumour development
In healthy tissues, the careful regulation of cell cycle progression and apoptosis
is vital to assure a homeostatic number of cells to maintain normal levels of
organ form and function. In cancer cells this balance is impaired, which leads to
indiscriminate proliferation and formation of neoplasms[78].
Tumours can be split into, benign or malignant. Benign tumours normally remain
localized, have clear boundaries, grow slowly, rarely spread to the surrounding
tissue and when observed under a microscope resemble the originating cells.

15
This type of tumour can in some cases depending on its location be surgically
removed without reappearance or further treatment[79]. Malignant tumours on
the other hand grow rapidly, have no clear boundaries, infiltrate the surrounding
tissue and can spread to other parts of the body using the lymphatic and vascular
systems forming separate tumours called metastases. The cells from these
tumours, when observed under a microscope, show little resemblance to the
cells they originated form. Patients with malignant tumours have a lower
survival rate and treatment often requires additional radiation and
chemotherapy[79].
Depending on how differentiated or undifferentiated tumour cells are, they are
classified from grade I to IV. In grades I and II the cells resemble or are close to
normal cells. In III and IV grade tumours cells are poorly differentiated or
undifferentiated and are less likely to resemble normal cells. They also tend to
divide more rapidly than lower grade tumours[80].
All cells in the human body are through mitotic divisions direct descendants of
an egg fertilized with a spermatozoid. Throughout the life of an organism, cells
acquire genomic mutations that differentiate them from their progenitor cells.
These mutations are called somatic mutations and unlike germline mutations are
not inherited from parent to offspring. Somatic mutations are caused
intrinsically through faulty DNA replication during cell division or through
normal environmental exposure. These mutations are normally repaired but
throughout time accumulate which can in some cases lead to cancer[81] (Figure
5). The development of cancer is a multistep process in which mutations affect
the physiological function of proto-oncogenes, tumour suppressor genes and
other regulatory proteins.
Proto-oncogenes code for proteins that regulate cell growth, apoptosis and
differentiation through interaction with transcription factors, chromatin
remodellers, growth factors, growth factor receptors, signal transducers and
apoptosis regulators. Activating alterations in proto-oncogenes can cause
neoplastic formation and are then referred to as oncogenes[82, 83]. Activation of
oncogenes is a process of chromosomal translocation, gene amplification or the
introduction of mutations, which enhances cell proliferation and survival[84].

16
Figure 5 Accumulation of somatic mutations obtained through the life of an organism can
develop into cancer. Intrinsic mutations made by cell division and environmental exposure.
“Passenger” mutations do not cause phenotypical changes or develop into cancer. Once driver
mutations appear the risk of cancer increase[68].
While initiation of tumour development is thought to be caused by oncogenic,
tumour-suppressor and microRNA gene mutations[83], growth factors play an
important role in cancer progression[85]. They can be either overly expressed by
the cells themselves or display a higher than normal amount of receptors on
their surface, making them oversensitive to growth signals[86]. Ligands bind to
the extracellular domain of growth receptors, which leads to conformational
changes of the intracellular domains and activation of the signalling
pathway[87]. Receptor tyrosine kinases (RTK) are one of the most important
members of this receptor family since they are involved in numerous cell
processes such as; proliferation, cell cycle, viability and metabolism[88, 89].
Cells have negative feedback loops that work as dampers in case there is an
excess in signal and therefore maintain tissue homeostasis[88, 90-92]. Defects in
negative feedback loop signalling increase proliferation. An example would be
that mutations in the intrinsic Ras GTPase negative feedback loop can lead to cell
growth and proliferation[93]. The loss of function of the PTEN phosphatase,
which regulates cell cycle and prevents cells from proliferating too rapidly can
also increase the risk of cancer development[94]. Mutations in Pten are found in
high grade gliomas and account for at least 20% of primary glioblastomas
multiforme[95-97]. The main substrate of PTEN is phosphatidylinositol-3,4,5-
trisphosphate (PIP3), which is a product of PI3-kinase. PIP3 is a second
messenger that promotes cell proliferation, survival and metabolism. PTEN
hydrolyses PIP3 on the 3-phosphate converting it to phosphatidylinositol-4,5-
bisphosphate (PIP2) and therefore acts as an antagonist of PI3K activity[98, 99].

17
Besides negative feedback loops, cells possess powerful programs that come into
action in case of indiscriminate cell proliferation. Many of these processes are
regulated by tumour suppressor genes. When these genes lose their function or
become attenuated, cancer can develop. Typical examples of these are p53 and
retinoblastoma associated protein (Rb). Rb is a co-transcription factor that can
either enhance or repress the function of different TFs[100, 101]. Rb receives
outside signals which can lead to a cell cycle arrest in the G1 stage. Rb can bind
and deactivate TFs of the EF2 family, which when activated can push the cell into
S-phase[102]. Mutations in Rb lead to retinoblastoma as well as other types of
cancer such as liver carcinoma, lung carcinomas or osteosarcomas[103-106].
The other example is p53 which detects DNA damages and subsequently
becomes activated[107]. Its relevance in maintaining genomic integrity is such
that is has been called “the guardian of the genome”[108]. Mutations of p53 can
be found in 50% of all human cancers [109]. All cells have basal low level
quantities of p53 that become stabilized and activated by several stimuli such as
DNA damage, subsequently p53 can cell arrest or apoptosis as well as activate
DNA repair mechanisms[107, 110].
1.3.1 Cancer stem cells
The most wide spread theory, as presented in the last chapter, is that initiation
and progression of cancer is due to the serial acquisition of genetic mutations in
normal somatic cells. This is assumed to lead to uncontrolled cell proliferation
and reduced apoptosis. Progressive accumulation of mutations cause regression
of cells to a more undifferentiated state and loss of their tissue specific
attributes. In cancer, immortal, highly proliferating cells form tumours in which
every viable tumour cell has the capacity to form new tumours. However,
tumours consist not only of one type of cells, but of a heterogenic group of cells
suggesting that the current model might be overly simplistic. An alternative
theory that has gained attention is the “cancer stem cell hypothesis”, which
states that in tumours there is a small niche of cells that show stem-cell-like
properties called cancer stem cells (CSCs). These CSCs divide slowly, have
unlimited proliferative potential, can self-renew and are able to differentiate into
more mature cells that form the main tumour mass[111, 112].
The plasticity of CSCs enables them to form distinct subpopulations with
different functionalities that support the overall tumour growth. For example,
gliobastoma cells can transdifferentiate into endothelia-like cells forming the
tumour vascularization[113]. It has also been reported that, through epithelial-
mesenchymal transition (EMT), tumour cells are transformed into cancer

18
associated fibroblasts(CAFs), which induce growth and can influence the
invasiveness of the respective carcinoma[114].
Even though the existence of CSC was proposed over 40 years ago[115] it was
not until the end of the last century that CSCs were isolated from patients with
acute myeloid leukemia (AML)[116]. Since then CSCs have also been isolated
from brain, breast and intestine cancers showing that identifying and stopping
these cells from proliferating might be essential in future cancer therapies[117-
119].
1.3.2 Central nervous system tumours
Like all other types of cancer in the human body, the development of neoplasms
in the CNS is initiated when cells start to grow indiscriminately. Disruption of
organ then leads to changes in its form and function. The appearance of brain
tumours is especially delicate since the brain is surrounded by the skull and any
uncontrolled growth of cells causes increased pressure in the surrounding tissue.
There are two types of cancer of the CNS, primary and secondary. In primary
tumours, abnormal growth of cells starts directly in the brain or spinal cord.
Secondary tumours originated somewhere else in the body and spread as
metastatic tumours to the brain[120]. Depending on the tumour size and
location, different symptoms arise including headaches, seizures, muscle
weakness, changes in mood, troubles with speaking and changes in
personality[121].
1.3.2.1 Gliomas
While there are many types of cancerous tumours of the CNS I concentrated on
glioma and its most aggressive form, the grade IV astrocytoma, also known as
glioblastoma multiforme (GBM). since it has been shown that the ectopic
expression of the ONR TLX combined with the inactivation of Ink4a/Arf and p53
induce glioma formation in mouse models[122, 123] (see chapter 1.3.2).
Gliomas can be classified according to the World Health Organization (WHO) as
ependymoma, oligodendroglioma, mixed oliogoastrocytoma, and
astrocytoma[124]. The latest statistical report of the Central Brain Tumor
Registry of the United States (CBTRUS) shows that between 2006 and 2010
gliomas accounted for 28% of primary tumours of the CNS in adults, of which
45.2% were grade IV astrocytomas (glioblastomas multiforme, GBM)[125].

19
Tumour classification is based on the morphology of the tumour cells. If they
resemble astrocytes they are classified as astrocytomas, those that resemble
oligodendrocytes are categorized as oligodendrogliomas[126]. Only 10% of the
cases account for oligodendriogliomas and oligoastrocytomas. Astrocytomas
account for most of the gliomas and are classified from I to IV grade tumours.
Grade I resemble astrocytes and have well defined boundaries while grade II is a
slow growing infiltrating tumour and does not have well defined borders. Grades
III and IV are anaplastic, grow rapidly and readily invade surrounding tissue.
Malignant gliomas are highly aggressive invasive tumours and patients
diagnosed with GBM have a dismal prognosis with a median survivable rate of 9
to 12 months[127]. This is on the one hand due to the fact that GBMs are highly
infiltrative, which makes complete surgical removal nearly impossible. On the
other hand, treatment options such as radiation or chemotherapy are very
limited due to high relapse rates which impede a definitive cure[127-129].
It is thought that grade I versus II-IV astrocytomas arise from different cellular
and genetic linages. Grade I tumours rarely progress into higher grade ones and
in most cases depending on their location can be removed surgically without
further recurrence. On the other hand, grade II astrocytomas often progress into
higher grade tumours and survival rates are much lower with a 5-year survival
rate of 27% for grade III astrocytomas and 3% for GBMs[112, 126, 130, 131].
The traditional view held was that higher grade astrocytomas arise from
dedifferentiated CNS cells like astrocytes or oligodendrocytes. However, recent
discoveries of stem- like cells in primary brain tumours such as GBM as well as
the existence of NSC progenitor areas in the brain have led to development of a
cancer stem cell (CSC) hypothesis for gliomas[49, 117, 132-134]. This hypothesis
states that the source of gliomas are malignant NSC or restricted progenitor cells
rather than dedifferentiated mature cells (Figure 6). Moreover, the anaplastic
nature of GBM, readily invading surrounding tissue as well as its resistance to
treatment seem to be due to the stem-like nature of the initiator cells[128, 129,
134-137].

20
Figure 6 Proposed origin of gliomas. In the current model of the cancer stem cell hypothesis it
is suggested that the formation of gliomas is initiated and maintained by a small population of
pluripotent CSC that hierarchically divide to give rise to differentiated non-glioma stem cells or
by mixture of different multipotent CSC[136]. GSC. Stem glioma cell.
1.3.2.2 TLX and glioblastoma
The ONR TLX modulates NSC proliferation in the adult mouse brain by regulating
the expression of Pten, p21 and other downstream targets of p53 (see chapter
1.2.1). Overexpression of TLX in p53-/- or Ink4a/Arf-/- expands the NCS pool and
triggers the formation of brain neoplasms. In addition, it was also shown that
TLX is also highly expressed in advanced human astrocytomas[122, 123, 138].
Furthermore, brain tumour stem cells (BTSCs) expressing stem cell markers
such as Nestin and CD133 were also shown to express high levels of TLX[139].
Additionally, TLX+ BTSCs are able to self-renew and produce TLX- non-
tumorigenic cells (Figure 6). However, when TLX is knocked-out in primary
mouse brain tumours, BTSCs lose their ability to self-renew which causes cell
apoptosis and a survival benefit[139]. In addition, is has been demonstrated that
patients with GBM show resistance to conventional treatments such as
chemotherapy due the stem-cell like nature of its cells[137] These results along
with the role of TLX in neurogenesis show strong link between the expression of
TLX and the CSC origin of higher grade astrocytomas.

21
2. Aim of the Study
TLX will be overexpressed in human cultured brain tumour cells via a retroviral
vector system. It is expected that this overexpression will cause a change in cell
proliferation as well as changes in the morphology of the tumour cells. Tumour
stem cells will be isolated using an antibiotic marker as well as through
fluorescence-activated cell sorting (FACS). The neuronal and tumour stem cell
pool will be analysed before and after retroviral expression of TLX. Furthermore,
stem cell and proliferation specific markers such as Nestin, SOX-2 and Ki-67 as
well as performing a p53 knockdown will be correlated with TLX expression. A
proteome analysis will be made to identify changes in gene expression and
depending on these results further experimentation planning will be devised
It is expected that during the proteome analysis possible new targets (which
directly or indirectly are regulated by TLX), as well as the effect of TLX
overexpression on different cellular pathways will be discovered.
This study will provide new insight into the functional relevance of TLX at
human brain tumour formation. This is not only of molecular biological interest,
but might also provide the basis for understanding mechanisms of
chemotherapeutic treatment and for the development of anticancer treatment
and thus, the results of the present study are also of clinical importance and
interest.

22
3 Materials and methods
3.1 Cloning
3.1.1 Primer Design
The set of primers used to amplify the cDNA clone of TLX found on a pCMVD-XL5
plasmid (Origene ID SC118089) were designed using Gene Runner (V.3.00).
Forward Primer: 5’-CAC CAT GAG CAA GCC AGC-3’
Reverse Primer: 5’-TTA GAT ATC GGA TTT GTA CAT ATC T-3’
Note: Since I used Gateway® Cloning to insert the PCR product into a pENTR
plasmid; CACC was added to the forward primer before the starting sequence
ATG.
3.1.2 Polymerase chain reaction of TLX (NR2E1)
To determine, which temperature would be best suited for PCR a gradient PCR
was performed.
For the PCR reactions Expand High Fidelity PCR System (Roche ID
117326411001) was used and the respective protocol was followed.
Per reaction
5 µL Expand High Fidelity buffer (1.5 mM MgCl2)
1.5 µL dNTPs (0.2 mM/µL)
0.5 µL Primer Fw. (100 µM/µL)
0.5 µL Primer Rv. (100 µM/µL)
2.5 µL DMSO (Sigma ID D2650)
0.8 µL Expand High Fidelity enzyme mix (2.6 U/reaction)
1 µL DNA (2ng/µL)
13.2 µL ddH2O
25 µL per reaction tube

23
Table 3. PCR program for primer set 1
Temperature Time Cycles
94°C 4 min 1x
94°C 45 sec
34x 57.5-64°C 45 sec
72°C 1 min
72°C 10 min 1x
4°C ∞ ∞
Table 4. PCR program to confirm TLX insert
Temperature Time Cycles
94°C 4 min 1x
94°C 45 sec
29x 59°C 45 sec
72°C 1 min
72°C 10 min 1x
4°C ∞ ∞
3.1.3 Agarose gel electrophoresis
A 1% agarose gel was made by dissolving 1 g of agarose (Bio-Rad ID 161-3101)
in 100 mL boiling 1x TBE buffer (Sigma ID T3913-5X1L). Once the mixture was
cooled down, 5µL of ethidium bromide (0.125 µg/mL) (Sigma ID E-1385) were
added. The mixture was poured into a gel tray and let to cool down until it
solidified (approximately 20-40 minutes). Once solid it was put into an
electrophoresis tray and 1x TBE was added until the agarose gel was covered. 13
µl of each sample was mixed with 2 µl loading buffer (Elechrom Scientific ID BL-
BIO-37045) and loaded onto the gel. 5 µl of 100 bp DNA ladder (Invitrogen ID
15628-019) was loaded onto the first lane and used as marker. The gel was left
to run for 60 minutes at 100 V. Visualization of the bands was done with a 2 UV
transilluminator DigiDoc-It® from UVP.

24
3.1.4 Preparation of LB 2xYT medium
The following recipe was used to produce 1 L of LB 2xYT medium:
16 g/L Tryptone (Sigma ID T7293)
10 g/L Yeast extract (Sigma ID Y1625)
5 g/L NaCl (Merk ID 1.93606.0521)
ddH2O up to 1000mL
The LB 2xYT solution was mixed until all components were dissolved and no
visible clumps could be observed. It was then autoclaved for 20 minutes in a
CertoClav and allowed to cool down to room temperature. The LB 2xYT media
was stored at 4°C.
3.1.5 Agar LB 2xYT medium
30 g of agar were mixed with 300 g of LB 2xYT and autoclaved for 20 minutes.
Once it cooled down, 300 µL of kanamycin (Sigma ID K4378) (50 g/mL) were
added for a final concentration of 50 µg/mL. I used kanamycin since it is the
selection marker on the pENTRTM plasmid.
𝐶1 ∗ 𝑉1 = 𝐶2 ∗ 𝑉2
𝑉2 =𝐶1 ∗ 𝑉1
𝐶2=
50 µ𝑔/𝑚𝐿 ∗ 300 𝑚𝑙
50000 µ𝑔= 0.3 𝑚𝐿 = 300 µ𝐿
The growth medium was poured into petri dishes and let cool down till the agar
solidified.

25
3.1.6 Transformation of Escherichia Coli
The Gateway® Cloning Kit (Invitrogen ID K2400-20) was used to ligate the TLX-
PCR product obtained from the first primer set into a pENTRTM/D-TOPO® vector.
Reaction
0.5 µL PCR product (276.9 ng/µL)
1 µL salt solution
1 µL TOPO® vector (41.5 ng/µL)
3.5 µL ddH2O
6 µL TOPO® cloning mixture
The mixture was left to incubate 5 minutes at room temperature and then put on
ice.
Transformation
2 µL of the TOPO® cloning mixture was inoculated into a vial of One Shot®
chemically competent Escherichia Coli and mixed gently. The vial was incubated
5 minutes on ice. Immediately after a “heat shock” was performed by incubating
the tube for 30 seconds at 42°C. The vial was put on ice and 250 µL of S.O.C.
medium (Gibco ID 15544) were added. The bacteria were then incubated for 1
hour at 37°C, shaking at 300 rpm on a thermo-block.
50 µL and 200 µL of the transformed bacteria were spread on two LB 2xYT agar-
kanamycin (50 µg/µL) plates and incubated over night at 37°C.
3.1.7 Plasmid amplification
The following steps were all performed under a laminar flow cabinet.
Overnight agar plates were taken out of the incubator and single colonies were
picked using a sterile pipet tip and inoculated into 3 mL LB 2xYT with 10 µL
kanamycin (final concentration 166.6 µg/mL). The tubes were then incubated 17
hours overnight at 37°C and 200 rpm (approximately 51 generations).

26
3.1.8 Plasmid isolation
Overnight bacteria cultures were taken out of the 37°C incubator and a glycerol
stock was made (see chapter 3.8). The plasmid isolation was performed using
the “PureLink® Quick Plasmid DNA Miniprep Kit” (ID K2100-10). 1.5 mL of the
liquid culture were taken and transferred to an eppendorf tube, centrifuged at
17000 g for 10 minutes and the supernatant was removed. The cell pellet was
dissolved in 250 µL resuspension buffer with RNAse. Once the pellet was
resupended in resuspension buffer 250 µL lysis buffer were added, mixed by
inverting and left at room temperature for 5 minutes. 350 µL precipitation buffer
were added and mixed by inverting. The tube was centrifuged 10 minutes at
9000 g and the supernatant transferred to one of the provided spin columns with
container. The spin column was centrifuged 1 minute at 9000 g and the eluate
was discarded. 250 µL of wash buffer 1 were added to the spin column and
centrifuged for 1 minute at 9000 g discarding the eluate after centrifugation. The
last step was repeated but instead of wash buffer 1 700 µL of wash buffer 2 were
used. The spin column was centrifuged once more 1 minute at 9000 g to dry and
the eluate discarded. The spin column was transferred to a fresh Eppendorf tube,
70 µL of TE buffer were added and incubated for 1 minute at room temperature.
Finally the spin column was centrifuged for 2 minutes at 9000 g. The spin
column was discarded and the Eppendorf tube containing the plasmid was
stored at -20°C or used for future analysis.
3.1.9 TLX-destination vector
Once it was determined which of the isolated pENTRTM plasmids contained the
TLX insert with the required attL sites (see chapter 3.7) I decided to proceed to
produce the Gateway® destination vectors. These vectors contain an antibiotic
selection marker and a ccbB gene flanked by attR sites. The ccbB gene is toxic for
bacteria but is exchanged for the gene flanked by the attL sites on the pENTRTM
vector via homologous recombination. If this reaction fails, bacteria that take up
the destination vector containing ccbB will die and fail to form colonies.
Therefore, ccbB functions as a negative selection marker. I decided to use two
pMSCV (murine stem cell virus) plasmids containing different selection markers.

27
The pMSCV plasmids were:
pMSCV-Puromycin*
pMSCV-RFP*
*Kind gift of Professor Dr. Ludwig Wagner
The following protocol was used for both pMSCV/pENTRTM recombinations.
LR Reaction
1 µL pENTRTM-TLX vector (141,3 ng/µL)
1 µL pMSCV destination vector
6 µL TE Buffer
2 µL Clonase® II enzyme mix (Invitrogen ID 11791-100)
8 µL Total mixture
The Clonase® II was thawed on ice for 2 minutes and then vortexed twice briefly.
The solutions described above were mixed together in a 1.5 mL Eppendorf tube
at room temperature and then vortexed briefly. The mixture was then incubated
in a 25°C water bath for 5 minutes.
The transformation of One Shot® E.Coli was done following the same procedure
as in chapter 3.1.6 with the exception that after the heat shock the bacteria were
put on wet ice for 5 minutes.
100 µL and 50 µL of the transformation reaction were plated on a LB 2xYT
ampicillin (concentration 50 µg/µL; Sigma ID A-2804) agar plate.
The plasmid was amplified, glycerol stocks were made and the plasmid was
isolated (see chapters 3.1.7, 3.1.8 and 3.8). The only difference was that for the
liquid culture ampicillin (concentration 150 µg/µL) was used instead of
kanamycin.
Finally it was confirmed with PCR and sequencing analysis if the destination
vector had the desired insertion (see chapter 3.1.2 and 3.7).

28
3.2 Transfection and transduction
3.2.1 Cell Culture U-87MG Glioblastoma Grade IV
A cell line derived from a human glioblastoma multiforme U-87MG was ordered
from Cell Lines Service (CLS); Cryovial: 300367 Vital: 330367 passage 22.
The obtained cells were frozen in liquid N2 in a cryogenic tube and had to be
thawed before cultured. The cryogenic tube containing the cell line was put in a
37°C water bath and agitated gently for 60 seconds. The tube was then washed
with 70% ethanol (Merk ID 1070172511) to avoid any contamination. Every
step from this point onwards was performed under aseptic conditions. The cell
suspension was transferred to a falcon tube containing 8 mL of supplemented
Dulbecco's Modified Eagle Medium (DMEM) (Invitrogen; ID 41965-039) media.
Table 5. Supplemented DMEM
Supplements added to
DMEM
Amount Supplement
10 mL (200mM) L-Glutamine (Sigma ID
G7513)
10%
Inactivated fetal bovine
serum (FBS) (Gibco ID
10270-09)
100 µg/mL Penicillin (Gibco ID
15140-122)
100 µg/mL Streptomycin (Gibco ID
15140-122)
The falcon tube containing the cells was centrifuged at 300xg for 5 minutes and
the supernatant was discarded. The cells were resuspended in 10 mL DMEM
supplemented media, transferred to a 25 cm2 culture flask and incubated at
37°C/5% CO2/95% humidity. The media was changed regularly every third day
until a cell density of approximately 50% was observed. The cells were then
either split and seeded on two new (same sized) flasks or transferred to a bigger
culture flask.

29
Cell splitting
The flowing protocol was done to transfer cells from a 25 cm2 culture flask (TPP
ID 90025) to a 75 cm2 (TPP ID 90075) one. Volumes were adjusted accordingly.
The media was removed from the cells and washed 1x with 10 mL sterile DPBS
(Lonza ID BE17-512F). To detach the cells, 8 mL DPBS was mixed with 2 mL
trypsin (Gibco ID 25300-054) and added to the cells. The cells were incubated at
37°C and shaken a couple of times in between until all cells had detached from
the flask’s surface. The cells were then transferred to a falcon tube and 20 mL
supplemented DMEM media were added (2x as initial trypsin/PBS) as the FBS in
the media inactivates the trypsin. The cell suspension was centrifuged 5 minutes
at 300 g, the supernatant was removed and the cells were resuspended in 20 mL
supplemented DMEM media. At this point 2 mL were taken to produce a
cryogenic stock (see chapter 3.8). The rest of the cell suspension was transferred
to a 75 cm2 cell culture flask.
Note: Each time a cell line culture is split or transferred to a new flask it is
registered as a new cell passage.
3.2.2 Viral Packing
All solutions used in this part of the study as well as the HEK-293T cells were
kindly provided by the Klinisches Institut für Labormedizin (KIMCL), Medical
University of Vienna.
The retroviral packing was done with the help of Gregor Hörmann of the
Klinisches Institut für Labormedizin (KIMCL), Medical University of Vienna. To
produce the MSCV retrovirus, human embryonic kidney 293 T cells (HEK-293T)
were used. The HEK-293T cells were thawed and grown as described in chapter
3.2.1. With the exceptions that Opti-MEM media was used instead of DMEM
media and gentamicin (10 µg/mL) instead of streptomycin and penicillin. After
reaching the desired density, cells were further cultured in DMEM supplemented
media without antibiotics and transferred to a 6 well-plate with a seeding
density of 8 x 10⁵ cells per well (2 mL cell suspension per well). The 6 well-plate
was incubated over night at 37°C/5% CO2/95% humidity.
Transfection of HEK-293T cells
The viral vector was assembled using three different plasmids that code for the
necessary proteins to produce a functional MSCV virus. Two helper plasmids

30
from tronolab were used; the first was an envelope vector that contained the
viral long terminal repeats (LTRs) and packing signals. The second vector was
the packing plasmid that contains the structural proteins gag/pol/env. The third
plasmid used was the pMSCV plasmid (see chapter 3.1.9). The produced viral
vector is replication-defective and can infect mammalian cells only once since it
lacks the necessary genes for further virion replication.
For the transfection, DNA/Lipofectamine complexes were produced mixing the
following components together.
For each reaction:
0.6 µL (0.23 µg) VSG-G (envelope vector)
3 µL (1.77 µg) GAG-POL (packing vector)
For every individual reaction:
0.4 µL (0.04 µg) pMX cherry as positive control
6.2 µL (1000 µg) pMSCV-RFP-Empty
2.6 µL (1000 µg) pMSCV-RFP-TLX
4.3 µL (1000 µg) pMSCV-Puromycin-Empty
1.9 µL (1000 µg) pMSCV-Puromycin-TLX
The DNA was mixed with 220 µL Opti-MEM media, 4.6 µL Lipofectamine 2000,
vortexed and left to incubate at room temperature for one hour. For each
transfection, a negative control was included, containing no pMSCV plasmid.
Cells were incubated together with the Lipofectamine mix for 72 hours at
37°C/5% CO2/95% humidity. As a negative control, a transduction was done
with the two helper vectors but without any of the pMSCV vectors.
Collection of titer
The cells were taken out of the 37°C/5% CO2/95% humidity incubator and the
media was removed. Since HEK and glioblastoma cells are both adherent I
decided to filter the media through a 0.2 mm filter to avoid any kind of cross
contamination. The supernatant containing the viral vector was stored at -80°C.
Fresh DMEM supplemented media without antibiotics was added and the same
procedure was repeated on the following day.

31
3.2.3 Transduction of U-87MG cell culture
All solutions used in this part of the report were kindly provided by Klinisches
Institut für Labormedizin (KIMCL), Medical University of Vienna.
A vial of frozen U-87MG cells was taken out of liquid N2 (passage 24) thawed and
put into a 75 cm2 culture flask till a confluence of 70% was observed (see
chapter 3.2.1). The number of cells per mL was determined using a C-Chip
Neubauer improved hemocytometer from Peqlab and the following formula.
𝑐𝑒𝑙𝑙𝑠/𝑚𝐿 =𝐶𝑜𝑢𝑛𝑡𝑒𝑑 𝑐𝑒𝑙𝑙𝑠 𝑓𝑟𝑜𝑚 𝑡ℎ𝑒 4 𝑜𝑢𝑡𝑒𝑟 𝑠𝑞𝑢𝑎𝑟𝑒𝑠 𝑜𝑓 𝑔𝑟𝑖𝑑
4𝑋 𝐷𝑖𝑙𝑢𝑡𝑖𝑜𝑛 𝐹𝑎𝑐𝑡𝑜𝑟 𝑋 10˄4
Once the number of cells per millilitre was determined they were transferred to
a 6-well plate with a concentration of 2 x 10⁵ cells per well. 1.5 mL of DMEM
media was removed and 1.5 mL of the produced viral vectors mixed with 100 µL
polybrene (increases transduction efficiency) was added to each well. The plate
was centrifuged for 1.5 hours at 32°C and 2500 g. Afterwards the cells were
incubated over night at 37°C/5% CO2/95% humidity. The next day the
supernatant was removed and 2 mL DMEM media with gentamicin (10 µg/mL)
was added to each well. The cells were grown and transferred first to a 25 cm2
and then to a 75 cm2 flask (see chapter 3.2.1).
3.2.4 Selection of puromycin resistant cells
After a confluence of 80% was observed a selection of puromycin resistant cells
was made. The selection was performed on cells transduced with MSCV-
puromycin-empty, MSCV-puromycine-TLX and a negative control (see chapter
3.2.2). Puromycin (Gibco ID A11138-02) (10 µg/mL) was added in addition to
the DMEM supplemented media with streptomycin/penicillin. The cells were
incubated at 37°C/5% CO2/95% humidity for 96 hours changing the DMEM
supplemented media every 48 hours to maintain the appropiate antibiotic
concentrations. The cells were incubated for 48 hours under the same conditions
with the exception that the puromycin concentration was lowered to 5 µg/mL.
The cells were incubated until all the cells in the negative control had died.
Afterwards the cells transduced with MSCV-puromycin-empty and MSCV-
puromycin-TLX were let to proliferate in DMEM supplemented media without
puromycin until a confluence of 80% in both cell lines was achieved. A cryogenic
cell stock was made (see chapter 3.9) and the rest of the cells were used in
further analyse.

32
3.2.5 Selection of RFP positive cells
Once a cell density of 80% was observed in the 75 cm2 culture flask, the cells
transduced with the MSCV-RFP viral vectors were checked under a fluorescent
microscope to determine if the transduction had been successful. Since not many
cells were RFP positive, it was decided to transfer the cells to a 175 cm2 culture
flask to have a higher number of transduced cells. The cells were detached and
centrifuged as described in chapter 3.2.1. The supernatant was removed and the
cells were resuspended in 2 mL MACS-buffer. From the cell suspension, 1 mL
was taken and a cryogenic cell stock was made (see chapter 3.9). A cell count
was performed from the other 1 mL (see chapter 3.2.3), the cells were filtered
through a 40 µm filter and put on ice. An extra 2.5 mL of MACS-buffer was added
and the cells were put on ice.
The selection of the RFP positive cells was performed by fluorescence-activated
cell sorting (FACS). This specialized method of flow cytometry can sort a
heterogeneous mixture of cells depending on its characteristics such as
fluorescent signals. The flow through the cytometer was set at the lowest setting
to assure the best sorting possible. The cells were briefly vortexed and the
sorting was started. The sorted cells were transferred to a 6 well plate and
incubated as described in chapter 3.2.1.
The cells transduced with the MSCV-RFP-empty viral vectors were able to
proliferate and the cells were transferred first to a 15 cm2 and then to a 75 cm2
culture flask (see chapter 3.2.1). Once a cell density of 80% was observed, a
cryogenic cell stock was made (see chapter 3.9).
MACS-Buffer*
2mM EDTA
0.5% BSA is PBS
*Kindly provided by the Department of Dermatology, Medical University of
Vienna.

33
3.3 Immunofluorescence
3.3.1 Immunostaining
Frozen vials of U-87MG, U-87MG-Puromycin-Empty and U-87 MG-Puromycin-
TLX (all passage 26) were thawed as described in chapter 3.2.1. The cells were
resuspended in 1 mL DMEM media and quantified as describe in chapter 3.2.3.
For optimal visualization, the cells had to be well spread. A total of 500 cells of
each type in 300 µL DMEM supplemented media with antibiotics were
transferred to an 8-well permanox slide (Lab-Tek). The cells were incubated at
37°C/5% CO2/95% humidity and left to settle overnight.
The next day, cells were checked under a microscope to determine if they had
attached to the bottom of the permanox slide. Once this was confirmed the
staining protocol was performed.
Staining protocol
Wash cells with 400 µL DPBS 3x5 minutes at room temperature
Fix cells with 400 µL 3-4% paraformaldehyde (Sigma ID P6148) in DPBS
for 15 minutes at room temperature
Wash cells with 400 µL DPBS 3x5 minutes at room temperature
Permeabilize cells with 200 µL 0.1% Triton X-100 (Sigma ID T8787) in
DPBS for 5 minutes
For the blocking step: incubate cells for 1 hour at 4 °C on a rocking table
in 400 µL DPBS with 3% goat serum (Dako ID X0907), 1% BSA (KPL ID
50-61-01), 0,2% fish skin (Sigma ID G7765), 1:10 casein (Thermo
Scientific ID 37582), 0.1% triton X-100 and 0,05% tween 20 (Dako ID
S1966).
Add first antibody and incubate 24 hours at 4 °C on a rocking table.
Wash cells with 400 µL DPBS 3x5 minutes at room temperature
Add secondary antibody and protect from light
Incubate 1-2 hours at 4 °C on a rocking table
Wash cells with 400 µL DPBS 3x5 minutes at room temperature
Add 100 µL (10 µg/mL) of 4',6-diamidino-2-phenylindole (DAPI) from
Life Technologies (ID D1306) and incubate for 15 minutes
Wash cells with 200 µL DPBS 3x5 minutes at room temperature
Remove upper part of the chamber and any leftover glue
Add a drop of Vectashield (Vector Laboratories ID H-1000) without
propidium iodide or DAPI
Add coverslip and protect from light

34
For a detailed description of the antibodies used refer to table 6.
Table 6. Antibodies used for immunofluorescent staining
1st Antibody 2nd Antibody
Staining
Chicken polyclonal anti-
neurofilament heavy
(Abcam ID ab4680)
(1:500 in 1% BSA-PBS)
and rabbit polyclonal
anti-NR2E1 (Sigma ID
HPA036954) (1:200 in
1% BSA-PBS)
Goat monoclonal CF633
coupled-anti-IgY-
Chicken (Sigma ID
SAB4600147) (1:200
0.2% BSA-PBS 0.05%
Tween 20-PBS) and goat
monoclonal Alexa Fluor
546 coupled-anti-IgG-
rabbit Abcam (ID
ab60317) (1:200 0.2%
BSA-PBS 0.05% Tween
20-PBS)
Imaging was performed using a LSM 510 confocal laser scanning microscope
from Zeiss.
3.4. siRNA mediated Knock down, RNA isolation and qPCR
quantification
3.4.1 siRNA knockdown
To produce a siRNA intermediated knockdown, siRNA duplexes were obtained
from Qiagen with the following sequences:
Table 7. siRNA duplexes
siRNA Target Sequence
Hs/TP53/9 (ID SI02655179) AAGGAAATTTGCGTGTGGAGT
Hs/TP53/13 (ID SI04384079) TTGGTGAACCTTAGTACCTAA
Hs/TP53/7 (ID SI02623747) CAGCATCTTATCCGAGTGGAA
Hs/TP53/3 (ID SI00011655) CAGAGTGCATTGTGAGGGTTA
Hs/GAPDH/3 (ID SI03571113) AAGGTCGGAGTCAACGGATTT
AllStars Negative Control siRNA
(ID 1027280)
Sequence not provided by
manufacturer

35
To the 1 nmol lyophilized TP53 and GAPDH siRNAs, 100 µL RNase free water
were added to obtain a 10 µM solution. From these solutions 1 µM stocks were
made and stored at -20 °C. From the 5 nmol Allstars negative control siRNA 500
µL RNase free water were added to obtain a 10 µM solution and stored at -20 °C.
Gloves were used at all times to protect probes from any kind of RNase
contamination and all siRNA mediated knockdowns were performed as given
below.
Cells were put in 6 well plates with a density of 1.5 X 10⁵ cells pro well and
incubated 24 hours prior to knockdown (for growth conditions and cell counting
see chapter 3.2.1 and 3.2.3).
Cell transfection
Add desired amount of diluted siRNA to 100 µL DMEM medium without
antibiotics or FBS
Add 3 µL of HiPerFect (Qiagen ID 301702) transfection reagent to
solution
Vortex tube and incubate at room temperature for 10-30 minutes to allow
complexes to build
Add solution drop wise to plate
Incubate cells at 37°C/5% CO2/95% humidity for 72 hours and proceed
with further analysis
For each knockdown a control was done by using HiPerFect transfection reagent
without siRNA.
3.4.2 RNA isolation with TRIzol
To verify TLX expression in the transduced cells as well as to quantify siRNA
mediated knock downs, RNA was isolated from the different cell cultures as
follow.
Add 1 mL QIAzol (ID 79306) to each well and shake cells until all have
detached.
Transfer mixture to a 1.5 mL Eppendorf tube and vortex.
Incubate cells for 5 minutes at room temperature.
Add 200 µL chloroform (Merk ID 1024454000) and vortex for 1-2
minutes.
Incubate at room temperature for 3 minutes.
Centrifuge at 4°C and 9000 g for 15 minutes.

36
Transfer the top aqueous phase to a new Eppendorf tube taking care not
to touch the middle or lower phases.
Add 500 µL isopropanol (Merk 109634) to the aqueous phase and mix by
inverting
Incubate at room temperature for 10 minutes
Centrifuge at 4°C and 9000 g for 30 minutes. A gel like pellet may be
visible
Remove supernatant and add 1 mL 75% EtOH
Vortex for 1 minute and centrifuge at 4°C and 6000 g for 15 minutes. A
white/grey pellet should be visible.
Remove supernatant as best as possible and dry pellet on paper towels
for 5-10 minutes. Do not over dry or the pellet will not dissolve the in next
step
Add 10 µL of RNAse free H2O and re-dissolve pellet
Store at -80°C
3.4.3 RNA isolation for microarray analysis
For the probes that were used in the microarray analysis (see chapter 3.5 the
preferred method for RNA isolation was to use an RNeasy Mini Kit (Qiagen ID
74104).
The cells were detached from a 6 well plate as described in chapter 3.2.1. After
removal of the supernatant, protocol was followed as described beneath:
Add 350 µL RTL buffer containing guanidine hydrochloride for RNase
inhibition and disassociation from nucleoproteins
Hit tube several times to loosen pellet
Pass the solution multiple times (>x5) through a 20 gauge needle (0.9mm
diameter)
Add 1 volume of 70% EtOH
Transfer to spin column (maximum 700 µL)
Centrifuge 1 minute at 17000 g
Discard supernatant
Add 700 µL RW1 buffer
Centrifuge 1 minute at 17000 g
Discard supernatant
Add 500 µL RPE buffer for washing of membrane bound RNA
Centrifuge 1 minute at 17000 g
Discard supernatant

37
Add 500 µL RPE buffer for washing of membrane bound RNA
Centrifuge 2 minutes at 17000 g
Discard supernatant
Place column in new collection tube
Centrifuge 1 minute at 17000 g
Place column in new 1.5 mL Eppendorf tube and add 30 µL RNase free
water
Centrifuge 1 minute at 17000 g
Use RNA for further analysis or Store t -80°C
3.4.4 Reverse transcription
The isolated RNA concentration was determined with a NanoDrop™ 2000
photospectrometer and 2 µg RNA were taken per reaction.
To produce cDNA from the isolated RNA following protocol was followed:
Per reaction
2 µg RNA
1 µL random primer
1 µL dNTP (0.2 mM/µL)
12 µL ddH2O end volume.
The reaction was incubated at 65°C for 5 minutes and then out on ice. 8µL of
master mix were added and PCR program was continued accordingly.
Master Mix
4 µL Expand High Fidelity buffer (1.5 mM MgCl2)
2 µL DTT
1.2 µL ddH2O
0.8 µL Polymerase (Super Script II reverse transcriptase ID 18064)
8 µL total volume

38
Table 8. cDNA PCR program
Temperature Time Step
65 °C 5 min Denaturation
4 °C 2 min Add Master Mix
25 °C 4 min Annealing
42 °C 50 min Reverse Transcription
70 °C 15 min Enzyme inactivation
4 °C ∞
3.4.5. Quantitative real time polymerase chain reaction
cDNA of transduced U-87MG cells as well as siRNA mediated knockdowns were
analysed relative to their TLX, tp53 and GAPDH expression. The analysis was
performed with TaqMan Gene Expression Assays (Applied Biosystems ID
4304437).
Volume per analysed sample
10 µL of 2x TaqMan Universal PCR Master Mix
1 µL of assay probe (GAPDH/TP53/NR2E1)
2 µL of cDNA
9 µL of ddH2O
22 µL of reaction volume
Assay probes used from Applied Biosystems:
TP53 ID: Hs0134249_m1
GAPDH ID: Hs02758991_g1
NR2E1 ID: Hs00172664_m1
Quantitative PCR analysis was performed in duplicates, each well with 10 µL,
using an ABI Step One plus cycler.
Table 9. qPCR program
Temperature Time Cycles
50 °C 2 min 1x
95 °C 10 min 1x
95 °C 15 sec 40x
60 °C 60 min

39
3.4.5.1 Gene expression analysis
For the relative quantification of gene expression I used the Livak 2-ΔΔCT method.
In this method, the expression of a gene of interest is compared with the
expression of a housekeeping gene, in this case GAPDH. UBC was used as
housekeeping gene when GAPDH was knocked down. This method has the
benefit that the accurate quantification of the starting material can be
circumvent with the drawback that expression levels are be stable, which was
not an issue in this study.
3.5. Microarray analysis
The microarray analysis was done with the help of Markus Jeitler at the
Genomics Core Facility of the Medical University of Vienna.
The statistical as well as the pathway analyses were done in cooperation with
the Statistical Department of the Medical University of Vienna.
Materials used for analysis:
GeneChip® PrimeView™ Human Gene Expression Array (ID 901839)
GeneChip® 3' IVT Express Kit (ID 901229)
GeneChip® Hybridization, Wash, and Stain Kit (ID 900720)
Beside the above mentioned materials a total of 6x3 isolated RNA probes were
given to the core facility for the microarray analysis.
Table 10. RNA probe description
Sample Sample# Passage Concentration U-87MG 1 31 278,9 ng/µL U-87MG-Puro-TLX 2 31 479,7 ng/µL U-87MG-Puro-Leer 3 31 526,5 ng/µL U-87MG P53 Knockdown
4 31 284,4 ng/µL
U-87MG-Puro-TLX P53 Knockdown
5 31 438,3 ng/µL
U-87MG-Puro-Leer P53 Knockdown
6 31 621,9 ng/µL
U-87MG 7 32 744,5 ng/µL U-87MG-Puro-TLX 8 32 512,7 ng/µL U-87MG-Puro-Leer 9 32 813,5 ng/µL U-87MG P53 Knockdown
10 32 712,3 ng/µL
U-87MG-Puro-TLX 11 32 353,5 ng/µL

40
P53 Knockdown U-87MG-Puro-Leer P53 Knockdown
12 32 784 ng/µL
U-87MG 13 33 349,1 ng/µL U-87MG-Puro-TLX 14 33 510,2 ng/µL U-87MG-Puro-Leer 15 33 448,9 ng/µL U-87MG P53 Knockdown
16 33 325,6 ng/µL
U-87MG-Puro-TLX P53 Knockdown
17 33 462,6 ng/µL
U-87MG-Puro-Leer P53 Knockdown
18 33 405,4 ng/µL
3.5.1 Statistical analysis of microarray data
Microarray measurements of 18 samples using the AffymetrixPrimeView were
done from the raw data .CEL files. Data processing and statistical analysis was
performed using R 3.0.2 and Bioconductor 2.14.
PrimeView annotation files (release 34) were used in Bioconductor to annotate
the transcript measurements
3.5.2 Pathway analysis
For the gene sets comparisos, the pathways from Gene Ontology (GO) were used
and two separate tests were made to the microarray data Setperm and Unitperm.
3.6 Protein Analysis
3.6.1 Protein Isolation
After the RNA isolation step with TRIzol (see chapter 3.4.2), proteins can also be
obtained from the lower phenol/ethanol phase following the manufacture´s
protocol:
Add 1.5 mL of isopropanol per 1 mL of QIAzol used, separate into 2 1.5
mL Eppendorf tubes
Incubate a room temperature for 10 minutes
Centrifuge for 10 minutes at 12000xg and 4 °C
Remove supernatant

41
Wash pellet 3x with 0.3M hydrochloride in 95% EtOH
o Add 2 mL solution per 1 mL QIAzol used
o Vortex and store at room temperature for 20 minutes
o Centrifuge 5 minutes at 7500xg and 4 °C
o Remove supernatant
After a final wash vortex pellet in 2 mL (1 mL pro Eppendorf tube) in
100% EtOH
Store at room temperature for 20 minutes
Centrifuge for 20 minutes at 7500xg and 4 °C
Remove ethanol and dry pellet for 10 minutes at room temperature
Dissolve pellet in 60 µL 1% SDS
If pellet does not dissolve incubate on a thermoblock at 50 °C for 10
minutes
Centrifuge at 10000 g for 10 minutes at 4 °C
Transfer clear supernatant to new tube
Store at -20 °C for future analysis
3.6.2 Protein Assay
For the protein assay a BCA Protein Assay Kit (Thermo Scientific Pearce ID
23227) was used. A standard curve was done by diluting BSA in water resulting
in the following concentrations:
200 µg/mL
150 µg/mL
100 µg/mL
75 µg/mL
50 µg/mL
25 µg/mL
12.5 µg/mL
2.5 µg/mL
The samples to be measured were diluted 1:10 in water. 10 µL of sample as well
as the standards were transferred to a Costar 96 well plate (ID 3596). To start
the reaction, 50 parts of reagent A were mixed with 1 part of reagent B. From
this, 200 µL of solution were pipetted directly to each sample. The plate was left
to incubate 2 hours at 37°C. The results were then measured with the Multimode
Reader EnSpire 2300.
42
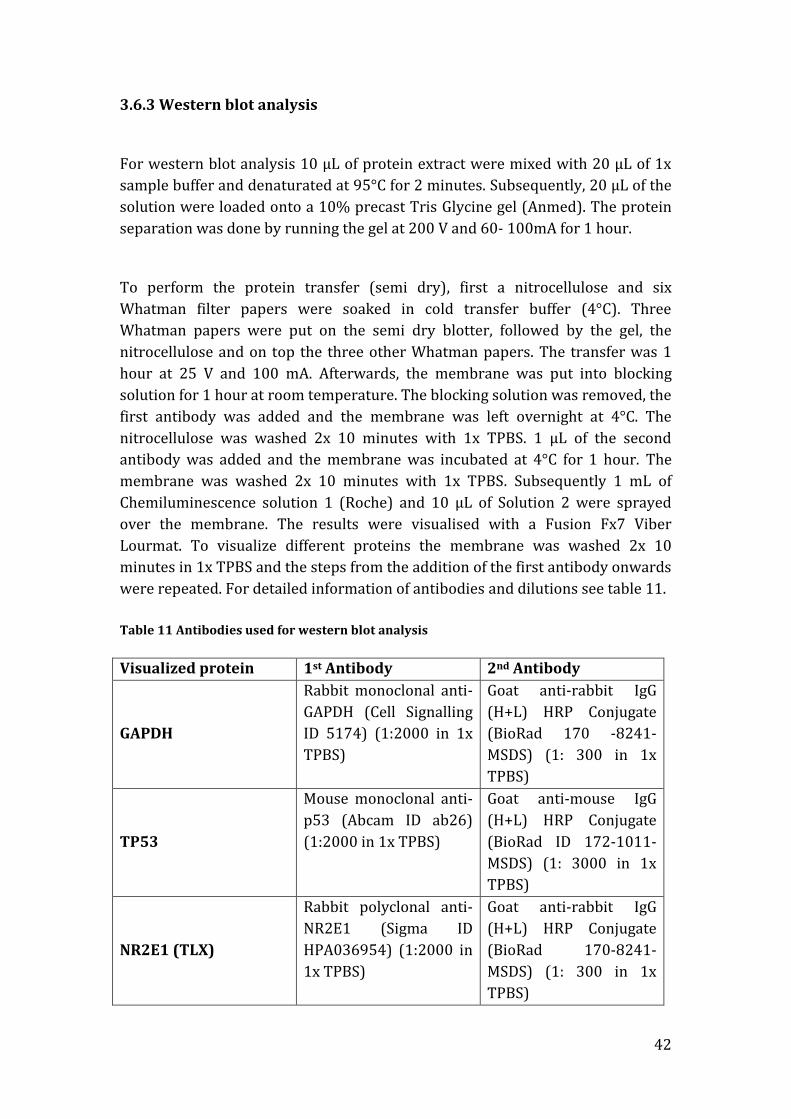
3.6.3 Western blot analysis
For western blot analysis 10 µL of protein extract were mixed with 20 µL of 1x
sample buffer and denaturated at 95°C for 2 minutes. Subsequently, 20 µL of the
solution were loaded onto a 10% precast Tris Glycine gel (Anmed). The protein
separation was done by running the gel at 200 V and 60- 100mA for 1 hour.
To perform the protein transfer (semi dry), first a nitrocellulose and six
Whatman filter papers were soaked in cold transfer buffer (4°C). Three
Whatman papers were put on the semi dry blotter, followed by the gel, the
nitrocellulose and on top the three other Whatman papers. The transfer was 1
hour at 25 V and 100 mA. Afterwards, the membrane was put into blocking
solution for 1 hour at room temperature. The blocking solution was removed, the
first antibody was added and the membrane was left overnight at 4°C. The
nitrocellulose was washed 2x 10 minutes with 1x TPBS. 1 µL of the second
antibody was added and the membrane was incubated at 4°C for 1 hour. The
membrane was washed 2x 10 minutes with 1x TPBS. Subsequently 1 mL of
Chemiluminescence solution 1 (Roche) and 10 µL of Solution 2 were sprayed
over the membrane. The results were visualised with a Fusion Fx7 Viber
Lourmat. To visualize different proteins the membrane was washed 2x 10
minutes in 1x TPBS and the steps from the addition of the first antibody onwards
were repeated. For detailed information of antibodies and dilutions see table 11.
Table 11 Antibodies used for western blot analysis
Visualized protein 1st Antibody 2nd Antibody
GAPDH
Rabbit monoclonal anti-
GAPDH (Cell Signalling
ID 5174) (1:2000 in 1x
TPBS)
Goat anti-rabbit IgG
(H+L) HRP Conjugate
(BioRad 170 -8241-
MSDS) (1: 300 in 1x
TPBS)
TP53
Mouse monoclonal anti-
p53 (Abcam ID ab26)
(1:2000 in 1x TPBS)
Goat anti-mouse IgG
(H+L) HRP Conjugate
(BioRad ID 172-1011-
MSDS) (1: 3000 in 1x
TPBS)
NR2E1 (TLX)
Rabbit polyclonal anti-
NR2E1 (Sigma ID
HPA036954) (1:2000 in
1x TPBS)
Goat anti-rabbit IgG
(H+L) HRP Conjugate
(BioRad 170-8241-
MSDS) (1: 300 in 1x
TPBS)

43
Blocking solution
9 mL 1x PBS
1 mL 10% BSA Blocking Solution (KPL)
4x Sample Buffer (10 mL)
617 mg of DTT
4 mL of SDS (8%)
2.4 mL of Tris/HCl pH 6.8
5.1 mL glycerol
0.4 mL bromphenol blue
Add aqua bidest.to a final volume of 10 mL
10x Running Buffer
30.2 g Tris
144 g Glycine
10 g SDS
Add ddH2O to a final volume of 1000 mL
Transfer Buffer
50 mL of 10x Tris/Glycine buffer
350 mL of ddH2O
100 mL of methanol (Merk ID 106009)
10x Tris/Glycine Buffer
30.2 g Tris
144 g Glycine
Add ddH2O to a final volume of 1000 mL
20x TPBS
1M Tris
2.8M NaCl
pH 7.5 (HCl)
3.7 Sequencing of DNA
All the plasmids used in this study had M13 phage bind sequences. For this
purpose the following M13 primers (Eurofins) were used:
Forward Primer 1: 5’-GTT TTC CCA GTC ACG-3’
Reverse Primer 1: 5’-CAG GAA ACA GTC ATG AC-3’
For each sequencing the following protocol was followed:

44
Mastermix/probe
0.4 µL Big Dye x-Terminator Reaction Mix v3.1(Applied Biosystems ID 4337455)
1.6 µL Magic Dye (Red Rabbit ID RR36025)
2 S µL equence primer
1.5 µL 5x Buffer (Applied Biosystems ID 4336697)
2.5 µL HPLC H2O (Merk ID 115332500)
8 µL total mastermix/sample
8 µL mastermix/sample
2 µL DNA
10 µL total/sample
Once the probes were ready following PCR program was done:
Table 12 PCR sequencing program
Temperature Time Cycles
96°C 1 min 1x
96°C 10 sec
25x 51°C 5 sec
60°C 4 min
10°C ∞ ∞
PCR, was followed by a cleaning step: 2 µL of Exo sap (included in the BigDye
Terminator kit) were added. Samples were shaken for 25 minutes at room
temperature.
Subsequently, samples were centrifuged 2 minutes at 4000 g and the
supernatant was then analysed using the ABI Genetic Analyser 3130xl.
3.8 Glycerol bacteria stock
700 µL of 3 mL of an overnight bacteria culture
1300 µL of 50% glycerol (Sigma ID G5516)
2000 µL
Mix well and transfer the mixture to a 2 mL cryogenic tube.
Store at -80°C

45
3.9 Cryogenic cell line stock
2 mL of the cell culture were transferred into a cryogenic tube (Sigma ID V5007-
500EA) and put on ice. The cells were centrifuged 9 minutes at 300xg/4°C. The
supernatant was removed and the cells were resuspended in 1900 µL cold
inactivated FBS and 100 µL DMSO (Sigma ID D2650). The cells were kept 3 days
at -80 °C and then transferred to liquid N2 for longer storage.

46
3.10 Reagents
Table 13. Reagents used in this study
Product Company ID 100 bp DNA ladder Invitrogen 15628-019 170kDa protein ladder Thermo Scientific 26616 Ampicillin Sigma A-2804 Agarose Bio-Rad 161-3101 BCA Protein Assay Kit Thermo Scientific Pearce 23227 BSA 10% KPL 50-61-01 Casein Thermo Scientific 37582 Chicken polyclonal anti-neurofilament heavy
Abcam Ab4680
Chloroform Merk 1024454000 Clonase II enzyme mix Invitrogen 11791-100 DAPI Life Technologies D1306 Different Assay Probes Applied Biosystems - Different M13 Primers Eurofins - Different TLX Primers Origene - Different siRNAs Qiagen - DMSO Sigma D2650 DPBS Lonza BE17-512F Dulbecco’s Modified Eagel Medium
Gibco 41965-039
Ethidium bromide Sigma E-1385 Expand High Fidelity PCR System
Roche 117326411001
Fetal bovine serum Gibco 10270-09 Fish skin Sigma G7765 Gateway Cloning Kit Invitrogen K2400-20 Goat monoclonal anti-chicken Abcam Ab150173 Goat monoclonal CF633 anti-Chicken
Sigma SAB4600147
Goat anti-mouse HRP Conjugate
BioRad 172-1011-MSDS
Goat monoclonal anti-rabbit Abcam Ab150116 Goat monoclonal 546 anti-rabbit
Abcam Ab60317
Goat Rabbit anti-rabbit HRP Conjugate
BioRad 170-8241-MSDS
Goat serum Dako X0907 Glycerol Sigma G5516 HiPerFect Qiagen 301702 Isopropanol Merk 109634 Kanamycin Sigma K4378 L-Glutamine Sigma G7513 Loading Buffer Elechrom Scientific BL-BIO-37045 Methanol Merk 106009 Mouse monoclonal anti- β-Actin
Novus NB-600-501
Mouse monoclonal anti-p53 Abcam Ab26 NaCl Merk 1.93606.0521 Penicillin-Streptomycin Gibco 15140-122 PureLink Quick Plasmid DNA Invitrogen K2100-10

47
Miniprep Kit Paraformaldehyde Sigma P6148 Puromycin Gibco A11138-02 QIAzol Qiagen 79306 Rabbit monoclonal anti-GAPDH
Cell Signalling 5174
Rabbit polyclonal anti-NR2E1 Sigma HPA036954 RNeasy Mini Kit Qiagen 74104 S.O.C medium Gibco 15544 TaqMan Gene Expression Assay
Applied Biosystems 4304473
TBE 10x Sigma T3913-5X1L TLX cDNA clone Origene SC118089 Triton X-100 Sigma T8787 Trypsin Gibco 25300-054 Tryptone Sigma T7293 Tween 20 Dako S1966 Vectashield Vector Laboratories H-1000 Yeast extract Sigma Y1625

48
4. Results
4.1 Generation of TLX viral vectors
To investigate the effects of increased TLX expression in astrocytoma a stable U-
87MG-trasformed cell line was produce. The cells were either transduced with a
pMSCV-RFP-empty, a pMSCV-RFP-TLX, a pMSCV-puro-empty or a pMSCV-puro-
TLX based retrovirus. The use of two different selection markers (RFP and
puromycin) was to assess better if the observed effects were due to an increased
TLX expression or a cause of the selection marker.
No TLX retrovirus vectors are commercially available and had to be generated.
Full length TLX cDNA was amplified from a pCMVD-XL5 plasmid as described in
chapters 3.1.1 and 3.1.2. The cDNA was transferred to a Gateway pENTR vector
and amplified in an Escherichia coli liquid culture. To test if TLX had been
successfully transferred, its orientation as well as for possible mutations the
pENTR-TLX clones were sequenced. Insert nucleotide sequences were translated
to their respective amino acids and aligned using NCBIs blast tool[140]. Clones
with 100% alignment (Figure 7) were used to produce the Gateway destination
vectors pMSCV-RFP-TLX and pMSCV-puro-TLX.
Cells transduced with a pMSCV-puro based retrovirus have a lower chance of
contamination as selection of cells can be done in aseptic conditions while
successful transduction with a pMSCV-RFP based retrovirus can be easily
observed under a fluorescent microscope.
Figure 7. Amino acid alignment of TLX and TLX insert on pENTR plasmid. 100% alignment
of amino acid sequences between TLX and TLX insert on pENTR.
Tlx 1 MSKPAGSTSRILDIPCKVCGDRSSGKHYGVYACDGCSGFFKRSIRRNRTYVCKSGNQGGC 60
Tlx insert 1 MSKPAGSTSRILDIPCKVCGDRSSGKHYGVYACDGCSGFFKRSIRRNRTYVCKSGNQGGC 60
Tlx 61 PVDKTHRNQCRACRLKKCLEVNMNKDAVQHERGPRTSTIRKQVALYFRGHKEENGAAAHF 120
Tlx insert 61 PVDKTHRNQCRACRLKKCLEVNMNKDAVQHERGPRTSTIRKQVALYFRGHKEENGAAAHF 120
Tlx 121 PSAALPAPAFFTAVTQLEPHGLELAAVSTTPERQTLVSLAQPTPKYPHEVNGTPMYLYEV 180
Tlx insert 121 PSAALPAPAFFTAVTQLEPHGLELAAVSTTPERQTLVSLAQPTPKYPHEVNGTPMYLYEV 180
Tlx 181 ATESVCESAARLLFMSIKWAKSVPAFSTLSLQDQLMLLEDAWRELFVLGIAQWAIPVDAN 240
Tlx insert 181 ATESVCESAARLLFMSIKWAKSVPAFSTLSLQDQLMLLEDAWRELFVLGIAQWAIPVDAN 240
Tlx 241 TLLAVSGMNGDNTDSQKLNKIISEIQALQEVVARFRQLRLDATEFACLKCIVTFKAVPTH 300
Tlx insert 241 TLLAVSGMNGDNTDSQKLNKIISEIQALQEVVARFRQLRLDATEFACLKCIVTFKAVPTH 300
Tlx 301 SGSELRSFRNAAAIAALQDEAQLTLNSYIHTRYPTQPCRFGKLLLLLPALRSISPSTIEE 360
Tlx insert 301 SGSELRSFRNAAAIAALQDEAQLTLNSYIHTRYPTQPCRFGKLLLLLPALRSISPSTIEE 360
Tlx 361 VFFKKTIGNVPITRLLSDMYKSSDI 385
Tlx insert 361 VFFKKTIGNVPITRLLSDMYKSSDI 385

49
Gateway destination vectors were amplified in an Escherichia coli liquid culture.
A plasmid PCR analysis was done to pre select for positive TLX clones and
showed that all the pMSCV-Puromycin-TLX vectors had an insert of the expected
length while all pMSCV-RFP-TLX were negative (Figure 8A). Since the amount of
colonies that grew on the ampicillin agar plates was much higher for the pMSCV-
RFP-TLX transfected bacteria than for the pMSCV-Puromycin-TLX ones, it was
concluded that the original destination plasmid had lost its ccbB gene and
therefore could not function as a negative selection marker (see chapter 3.1.9). A
new pMSCV-RFP vector was received and the cloning process with TLX was
repeated. The growth of the newly transfected pMSCV-RFP-TLX Escherichia Coli
was much lower and the analysis of the isolated plasmids was repeated yielding
a product of the expected size (Figure 8B).
Figure 8 PCR amplification of TLX insert in pMSCV vectors. A) TLX insert amplified in pMSCV-
puro-TLX B) TLX insert amplified in pMSCV-RFP-TLX
C. Control
To test for possible mutations, TLX inserts on both pMSCV-puro-TLX and pMSCV-
RFP-TLX plasmids were sequenced. Obtained sequences were as previously
described translated to their respective amino acids and aligned to TLX ORF.
Gateway destination vectors with 100% alignment (Figure 9) were transfected
to a HEK-293T packing cell line to produce the MSCV-puro-TLX and MSCV-RFP-
TLX retroviruses.

50
Figure 9 Amino acid aliment of pMSCV-RFP-TLX and pMSCV-Puromycin-TLX vectors and
TLX ORF. 100% identity between both destination vectors and the original NR2E1 ORF.
4.2 Verification of transduced U-87MG cell line with pMSCV-RFP
vectors
To determine if the U-87MG cells had been successfully transduced 96 hours
after viral infection a small sample of both U-87MG-RFP-TLX and U-87MG-RFP-
Empty transduced cells was taken and observed under a Nikon eclipse Ti
fluorescence microscope. Very few cells were RFP positive (<1%).
pMSCV-RFP-Tlx
Tlx 1 MSKPAGSTSRILDIPCKVCGDRSSGKHYGVYACDGCSGFFKRSIRRNRTYVCKSGNQGGC 60
Tlx insert 1 MSKPAGSTSRILDIPCKVCGDRSSGKHYGVYACDGCSGFFKRSIRRNRTYVCKSGNQGGC 60
Tlx 61 PVDKTHRNQCRACRLKKCLEVNMNKDAVQHERGPRTSTIRKQVALYFRGHKEENGAAAHF 120
Tlx insert 61 PVDKTHRNQCRACRLKKCLEVNMNKDAVQHERGPRTSTIRKQVALYFRGHKEENGAAAHF 120
Tlx 121 PSAALPAPAFFTAVTQLEPHGLELAAVSTTPERQTLVSLAQPTPKYPHEVNGTPMYLYEV 180
Tlx insert 121 PSAALPAPAFFTAVTQLEPHGLELAAVSTTPERQTLVSLAQPTPKYPHEVNGTPMYLYEV 180
Tlx 181 ATESVCESAARLLFMSIKWAKSVPAFSTLSLQDQLMLLEDAWRELFVLGIAQWAIPVDAN 240
Tlx insert 181 ATESVCESAARLLFMSIKWAKSVPAFSTLSLQDQLMLLEDAWRELFVLGIAQWAIPVDAN 240
Tlx 241 TLLAVSGMNGDNTDSQKLNKIISEIQALQEVVARFRQLRLDATEFACLKCIVTFKAVPTH 300
Tlx insert 241 TLLAVSGMNGDNTDSQKLNKIISEIQALQEVVARFRQLRLDATEFACLKCIVTFKAVPTH 300
Tlx 301 SGSELRSFRNAAAIAALQDEAQLTLNSYIHTRYPTQPCRFGKLLLLLPALRSISPSTIEE 360
Tlx insert 301 SGSELRSFRNAAAIAALQDEAQLTLNSYIHTRYPTQPCRFGKLLLLLPALRSISPSTIEE 360
Tlx 361 VFFKKTIGNVPITRLLSDMYKSSDI 385
Tlx insert 361 VFFKKTIGNVPITRLLSDMYKSSDI 385
pMSCV-Puromycin-Tlx Tlx 1 MSKPAGSTSRILDIPCKVCGDRSSGKHYGVYACDGCSGFFKRSIRRNRTYVCKSGNQGGC 60
Tlx insert 1 MSKPAGSTSRILDIPCKVCGDRSSGKHYGVYACDGCSGFFKRSIRRNRTYVCKSGNQGGC 60
Tlx 61 PVDKTHRNQCRACRLKKCLEVNMNKDAVQHERGPRTSTIRKQVALYFRGHKEENGAAAHF 120
Tlx insert 61 PVDKTHRNQCRACRLKKCLEVNMNKDAVQHERGPRTSTIRKQVALYFRGHKEENGAAAHF 120
Tlx 121 PSAALPAPAFFTAVTQLEPHGLELAAVSTTPERQTLVSLAQPTPKYPHEVNGTPMYLYEV 180
Tlx insert 121 PSAALPAPAFFTAVTQLEPHGLELAAVSTTPERQTLVSLAQPTPKYPHEVNGTPMYLYEV 180
Tlx 181 ATESVCESAARLLFMSIKWAKSVPAFSTLSLQDQLMLLEDAWRELFVLGIAQWAIPVDAN 240
Tlx insert 181 ATESVCESAARLLFMSIKWAKSVPAFSTLSLQDQLMLLEDAWRELFVLGIAQWAIPVDAN 240
Tlx 241 TLLAVSGMNGDNTDSQKLNKIISEIQALQEVVARFRQLRLDATEFACLKCIVTFKAVPTH 300
Tlx insert 241 TLLAVSGMNGDNTDSQKLNKIISEIQALQEVVARFRQLRLDATEFACLKCIVTFKAVPTH 300
Tlx 301 SGSELRSFRNAAAIAALQDEAQLTLNSYIHTRYPTQPCRFGKLLLLLPALRSISPSTIEE 360
Tlx insert 301 SGSELRSFRNAAAIAALQDEAQLTLNSYIHTRYPTQPCRFGKLLLLLPALRSISPSTIEE 360
Tlx 361 VFFKKTIGNVPITRLLSDMYKSSDI 385
Tlx insert 361 VFFKKTIGNVPITRLLSDMYKSSDI 385

51
4.3 Selection of U-87MG transduced cells
4.3.1 Selection of U-87MG puromycin resistant cells
To select for U-87MG transformed cells with MSCV-puro-Empty and MSCV-puro-
TLX viruses, respectively, puromycin was added to their growth media.
Puromycin is an antibiotic that inhibits translation. Cells successfully infected
with pMSCV-puro based retroviruses are able to express the pac gene that codes
for Puromycin N-acetyl-transferase (PAC). The expression of pac confers
resistance to puromycin and allows for positive selection of transformed cells. 24
hours after the initiation of puromycin treatment it was checked under a
microscope if many cells were resistant to the antibiotic. It was observed that
there were more cells present in the cells transduced with the empty vector as in
the TLX overexpressing cells. 144 hours after the initial selection; the treatment
was stopped since no living cells could be observed in the negative control of the
U-87MG cell line. The % of living cells after treatment was: ~5% of U-87MG-
puromycin-TLX cells and ~20% U-87MG-puromycin-Empty cells.
These initial results indicated that cells overexpressing TLX had a lower
proliferation rate compared to cells with no TLX ectopic expression.
4.3.2 Selection of U-87MG RFP positive cells
To separate transduced U-87MG cells infected with MSCV-RFP-Empty and MSCV-
RFP-TLX, respectively, from non-transduced ones, FACS was performed (see
chapter 3.2.5). Transformed cells are able to express RFP while normal U-87MG
cells cannot. RFP is detected through FACS splitting the initial cell population
into two subpopulations (transduced and non-transduced), allowing for
selection of infected cells. U-87MG-RFP-TLX and U-87MG-RFP-Empty cells were
counted before and after FACS (Table 14).
Table 14. Quantification of U-87MG-RFP-TLX and U-87MG-RFP-Empty cells before and
after FACS.
Cells # of cells before FACS
sorting
# of cells after FACS
sorting
U-87MG-RFP-TLX 5.2x10⁷ 1.9x10⁴
U-87MG-RFP-Empty 4.4x10⁷ 1.7x10⁴

52
As it can be observed in table 14, the recovery of transduced cells after FACS was
less than 0.5% of the input. According to protocols provided by Cell Lines
Service; the seeding of sub-confluent U-87MG cultures should be at 2-4x10⁴
cells/cm2. Recovered cells were cultured in a 6 well plate (8.96cm2) as this was
the smallest plate available at the time. 8 days after the initial sorting was
performed U-87MG-RFP-TLX and U-87MG-RFP-Empty cells were observed
under a fluorescence microscope to determine the amount of RFP positive cells.
Over 99% of both transformed cell lines were RFP positive. The cells were
proliferating very slowly and the number of U-87MG-RFP-TLX cells was lower
than the U-87MG-RFP-Empty ones. U-87MG-RFP-Empty culture achieved a
confluence of 80% after 2 weeks. 80% confluence was observed in the U-87MG-
RFP-TLX cell culture approximately 3 weeks after initial seeding. The cells were
transferred to a 15 cm2 culture flask and incubated as described in chapter 3.1.
From this point on the U-87MG-RFP-Empty cells grew at a normal rate and a
couple of days after a cryogenic cell stock could be made. The U-87MG-RFP-TLX
cells on the other hand had still a very low proliferation rate and after several
weeks they completely stopped proliferating indicating once more that the over-
expression of TLX seems to affect cell proliferation. Since it was not possible to
obtain sufficient numbers of U-87MG-RFP-TLX cells it was decided to discard
them. All following experiments were performed with the U-87MG-puromycin
cell lines.

53
4.4 Proliferation differences between U-87MG cell lines
As noted throughout the selection of transduced cells, overexpression of TLX
seemed to lower their proliferation rate. In order to monitor it more precisely, I
counted the amount of U-87MG, U-87MG-puro-TLX and U-87MG-puro-Empty
cells at passages 30, 31, 32 and 33. Each passage was started with the same
amount of cells (~1.5x10⁶) in a 75cm2 culture flask. All cell lines were counted
until a confluence of ~80% in U-87MG was observed (Figure 10).
Figure 10. Counted cells of transduced and non-transduced cell lines. Cells quantified at
passages 30-33 and once U-87MG reached a confluence of 80%
An F-test revealed significant differences in proliferation between the 3 cell lines
F(2,9)=14.55 p<0.001 (n=4). Post hoc comparisons using the Tukey test
determined that TLX over expressing cells have a significant lower proliferation
rate. No significant differences were observed between cells transduced with an
empty vector and non-transformed cells. This results indicate that over
expression of TLX lowers proliferation rate.
1.00E+00
1.00E+01
1.00E+02
1.00E+03
1.00E+04
1.00E+05
1.00E+06
1.00E+07
1.00E+08
Passage 30 Passage 31 Passage 32 Passage 33
Counted cells of transduced and non-transduced cell lines
U-87MG cells U-87MG-puro-Empty cells U-87MG-puro-Tlx cells

54
4.5 Quantitative PCR and western blot analysis of TLX
4.5.1 Quantitative PCR analysis of TLX
To assess the differences in TLX expression between the cell lines U-87MG, U-
87MG-puro-TLX and U-87MG-puro-Empty, a quantitative PCR analysis was done.
The RNA was transcribed into complementary cDNA and amplified by real time
PCR. Specific labelled TLX probes bind their complementary cDNA target, which
emit a fluorescent signal when the gene is transcribed (Figure 11). The emitted
fluorescent signal is proportional to the TLX present in the original RNA sample.
GAPDH was used as reference gene.
The Ct values obtained were following:
U-87MG: 37,83
U-87MG-Puromycin-Empty: 36,95
U-87MG-Puromycin-TLX: 27,5
Using the Livak 2-ΔΔCT method (see chapter 3.4.5.1) it was determined that the
difference of expression between non-transduced and TLX-overexpressing cells
was of 3670 fold. In comparison, the difference between U-87MG and U-87MG-
Puromycin-Empty cells was of 0.26 fold. While this could be of significance, the
high CT values of both samples make the difference negligible.
Figure 11. Amplification plot of U-87MG non-transduced as well as transduced cells.

55
4.5.2 Western blot analysis of TLX
To inquire if higher levels of TLX RNA expression correlated with higher levels of
TLX protein, a western blot analysis was performed. Proteins used in the
analysis were isolated from U-87MG, U-87MG-puro-TLX and U-87MG-puro-
Empty lysates using trizol according to manufacturer’s instructions. A single
band at 40kDa was detected in all transduced and non-transduced cells (Figure
12). According to previous work done by Jung Park et al., 2010 and verified in
this study (Figure 11), U-87MG cells have a barely detectable level of
endogenous TLX. This led me to the conclusion that the TLX antibody was faulty
and that the protein detected was a false positive. Unfortunately due to time
restrictions the experiments could not be repeated with a new primary antibody.
Figure 12. TLX western blot. TLX observed in all cell lines at 40kDa. U-87MG are non-
transduced cells. Empty cells transduced with empty vector. TLX cells transduced with TLX
vector.
4.6 Immunofluorescence of U-87MG and U-87MG-puromycin cells
To find out if TLX overexpression causes changes in cell morphology as well as to
determine TLX cellular localization, an antibody staining of U-87MG, U-87MG-
puro-TLX and U-87MG-puro-Empty was performed. No difference in morphology
between TLX overexpressing cells and normal cells could be seen. Multinuclear
cells were also observed which are not uncommon in glioblastoma[141]. TLX
signal was observed spread throughout the whole cell body except in the nucleus
in all cell lines (Figures 13,14,15). The TLX antibody used in this experiment was
the same as in the western blot analysis, which lead me to the conclusion that the
signal observed is the same false positive as previously detected.

56
Figure 15 Immunofluorescence staining of U-87MG. A Anti-Neurofilament heavy staining
(red) B Anti-TLX (yellow) C DAPI (blue) D Merged. TLX signal detected throughout the cell body.
Figure 16. Immunofluorescence staining of U-87MG-Puromycin-Empty. A Neurofilament
heavy (red) B TLX (yellow) C DAPI (blue) D Merged. TLX signal detected throughout the whole
cell body.

57
Figure 17. Immunofluorescence staining of U-87MG-Puromycin-TLX. A Neurofilament heavy
(red) B TLX (yellow) C DAPI (blue) D Merged. TLX signal detected throughout the cell body. No
nuclear localization of TLX
4.7 p53 knockdown
4.7.1 Quantitative PCR analysis of p53 knockdown
As it was reported in chapter 1.3.2.1 an overexpression of TLX combined with
inactivation of p53 leads to glioma formations in mouse models. It was therefore
decided to knockdown p53 in all U-87MG cell lines to determine, if a combination
of TLX expression and changes in p53 would lead to significant changes in the
pathway analysis.
The p53 knockdown was done in 3 subsequent passages of all U-87MG cell lines,
transduced and non-transduced. As a negative control a scrambled “All stars
negative” (AN) siRNA was used. p53 expression levels were compared to AN to
assure that effects observed were caused by the siRNA target knockdown and
not due to transfection reagents.

58
Table 15. siRNA p53 knockdown of U-87MG cell lines..
Sample
Expression compared to control
Passage
31 32 33
U-87MG-3 82% 81% 85%
U-87MG-13 87% 84% 91%
U-87MG-7 82% 76% *
U-87MG-AN 100% 100% 100%
U-87MG-TLX-3 67% * 68% 72%
U-87MG-TLX-13 80% 84% 78%
U-87MG-TLX-9 77% 74%
U-87MG-TLX-AN 100% 100% 100%
U-87MG-Empty-3 74% 50% 55%
U-87MG-Empty-13 106% 51% 62%
U-87MG-Empty-9 54% 47% *
U-87MG-Empty-AN 100% 100% 100%
Expression levels of p53 were determined by qPCR after knockdown. The number at the end of the
samples indicates the p53 siRNA used to perform the knockdown. TLX indicates the cells
overexpressing the gene. Empty indicates cells that were transduced with an empty vector.
Given Samples marked in red were used for microarray analysis. * Samples used for western blot
analysis. Specific siRNA was not used if no % is indicated. AN “All stars negative” used as control
From each passage and cell line the highest knockdown was taken and used for
the microarray analysis.
4.7.2 Western blot verification of p53 knockdown
Samples with the most efficient p53 knockdown of each of the cell lines U-87MG,
U-87MG-puro-TLX and U-87MG-puro-Empty were taken for protein isolation
and western blot analysis (Table 15). No detectable differences between
knockdown and controls could be observed (Figure 18). This indicates that the
siRNA knockdown was not sufficient to influence protein levels of p53.
Figure 8. Western blot of p53 knockdown. No detectable changes in p53 protein concentration
due to knockdown.
KD Knockdown
59
4.8 Microarray analysis
A microarray analysis was performed to examine changes in gene expression due to
TLX ectopic expression and p53 knockdown in U-87MG. Isolated mRNA from
sample triplicates of transduced and non-transduced cells was transcribed to cDNA
and labelled according to Affymetrix protocols. No dye swaps were performed as
staining of samples occurs after hybridization avoiding dye incorporation bias.
Obtained raw microarray data was preprocessed using the rma routine [142],
including background correction, normalization, summary of probe signals and
log2 transformation. The initial dataset consisting of expressions values for
49495 transcripts was reduced applying two initial filtering steps. Genes
showing only low expression values across samples (below log2(100)) and
genes with small variability (interquartile range below 0.5) were excluded from
future analysis. Using this approach the number of transcripts under
investigation could be reduced to 1969. Initial observations showed that p53 KD
was not sufficient to cause a significant change in expression, it was therefore
decided to continue the analysis without taking it into account. An F-test
(p=0.05) was done to determine significant differences between the groups U-
87MG, U-87MG-puro-TLX and U-87MG-puro-Empty. Changes in expression due
to TLX overexpression were established by doing a hierarchical Schaffer test
procedure between the contrasts of interest:
1) U-87MG-puro-TLX vs U-87MG
2) U-87MG-puro-TLX vs U-87MG-puro-Empty
3) U-87MG-puro-Empty vs U-87MG
The expression of 1341 genes (not shown) is significantly changed in U-87MG-
puro-TLX. I focused on the top 100 genes with the highest statistical significance
(Table 16); 64 were down regulated while 36 had an increase in expression. The
expression of 60 down-regulated genes was changed by at least -1 fold, PI3 being
the highest with a change of expression of -6.7 fold. Of the up-regulated genes 30
had at least a 1 fold change in expression, IL36B being the highest with a change
in expression of 3.1 fold. These initial results indicated that TLX acts more as a
repressor than as an enhancer of transcription. I searched top 100 genes for
which the change of expression could contribute to the formation, maintenance
and progression of GBM. The gene expression of the tumour suppressor TFAP2C
as well as a tumour suppressor candidate TUSC3 is reduced by 2 fold. E2F7
which represses G1/S genes [143] also presents a lower expression. In contrast
NDN which supresses cell proliferation in postmitotic neurons [144] as well as
the promotor of apoptosis HRK are upregulated by 2 fold. Genes involved in cell
migration DCLK1 and ATP8A1[145, 146] also present an increase of expression.
The genes LRRC34 and ABCG2 expressed in pluripotent and side population cells

60
are up regulated [137, 147]. I also noted that the genes TTC39A GPNMB SP140
and PI3 have a similar expression profile in other types of cancer such as breast,
prostate, lung, pancreatic, blood and ovarian cancer [148-153].
Table 16. Top 100 genes differently expressed between U-87MG-Puromycin-TLX and U-
87MG.
Name Symbol TLX vs
Control Pvalue
necdin, melanoma antigen (MAGE) family member NDN 1.861616408 6.00E-05
CKLF-like MARVEL transmembrane domain containing
7 CMTM7 1.246806245 6.00E-05
CUGBP, Elav-like family member 2 CELF2 -.669314243 6.00E-05
CUGBP, Elav-like family member 2 CELF2 -.025359497 6.00E-05
paraneoplastic Ma antigen 2 PNMA2 -.416129986 6.00E-05
glycoprotein (transmembrane) nmb GPNMB 2.454209576 6.00E-05
transcription factor AP-2 gamma (activating enhancer
binding protein 2 gamma) TFAP2C -.285282365 6.00E-05
melanoma antigen family C, 2 MAGEC2 -.942228074 6.00E-05
Ras-related GTP binding D RRAGD 1.530318826 6.00E-05
Ras-related GTP binding D RRAGD 1.252172194 6.00E-05
doublecortin-like kinase 1 DCLK1 2.581746033 6.00E-05
family with sequence similarity 133, member A FAM133A -.493942223 6.00E-05
E2F transcription factor 7 E2F7 -.287966901 6.00E-05
SLIT and NTRK-like family, member 2 SLITRK2 -.143276436 6.00E-05
NA NA -.783296947 6.00E-05
NA NA -.811984041 6.00E-05
CUGBP, Elav-like family member 2 CELF2 -.372561844 6.00E-05
four and a half LIM domains 1 FHL1 -.011027302 6.00E-05
multiple EGF-like-domains 10 MEGF10 -.250073309 6.00E-05
harakiri, BCL2 interacting protein (contains only BH3
domain) HRK 2.801423596 6.00E-05
laminin, alpha 1 LAMA1 2.549704853 6.00E-05
chromosome 20 open reading frame 197 C20orf197 -.711340514 6.00E-05
late endosomal/lysosomal adaptor, MAPK and MTOR
activator 1 LAMTOR1 -.960539736 6.00E-05
hydroxysteroid (17-beta) dehydrogenase 2 HSD17B2 -3.34972298 6.00E-05
tetratricopeptide repeat domain 39A TTC39A 1.560042944 6.00E-05
four and a half LIM domains 1 FHL1 -.138620117 6.00E-05
glycoprotein (transmembrane) nmb GPNMB 2.509513182 6.00E-05
glycoprotein (transmembrane) nmb GPNMB 2.337902402 6.00E-05
late endosomal/lysosomal adaptor, MAPK and MTOR
activator 1 LAMTOR1 -.809770672 6.00E-05
uncharacterized LOC151760 LOC151760 -.338304418 6.00E-05
glycoprotein (transmembrane) nmb GPNMB 2.316809244 6.00E-05
immunoglobulin superfamily, member 3 IGSF3 -.939864039 6.00E-05
CUGBP, Elav-like family member 2 CELF2 -.851570485 6.00E-05
late endosomal/lysosomal adaptor, MAPK and MTOR LAMTOR1 -.865659465 6.00E-05

61
activator 1
erythrocyte membrane protein band 4.1 like 4B EPB41L4B -.245446642 6.00E-05
paraneoplastic Ma antigen 2 PNMA2 -.479310178 6.00E-05
zinc finger protein 883 ZNF883 -.668542754 6.00E-05
NA NA -.902046126 0.000128
NA NA -.784404735 0.000128
SP140 nuclear body protein SP140 2.640111452 0.000128
solute carrier family 16 (monocarboxylate transporter),
member 3 SLC16A3 -.357823827 0.000128
interleukin 36, beta IL36B 3.16628897 0.000128
tumor suppressor candidate 3 TUSC3 -2.81221018 0.000128
mitochondrial pyruvate carrier 2 MPC2 1.082084869 0.000128
Ras-related GTP binding D RRAGD 1.643916645 0.000151
BMP binding endothelial regulator BMPER -1.58529743 0.000151
G protein-coupled receptor 133 GPR133 -.143788657 0.000151
SP140 nuclear body protein SP140 2.262617605 0.000151
RAP1 GTPase activating protein 2 RAP1GAP2 -.185328905 0.000196
family with sequence similarity 133, member A FAM133A -.468471273 0.000196
interleukin 36, beta IL36B 3.107038066 0.000196
solute carrier family 16 (monocarboxylate transporter),
member 3 SLC16A3 -.438580825 0.000196
tumor suppressor candidate 3 TUSC3 -.861057165 0.000196
tryptophan 2,3-dioxygenase TDO2 2.728184578 0.000196
cyclin-dependent kinase-like 2 (CDC2-related kinase) CDKL2 1.762532821 0.000196
folliculin interacting protein 2 FNIP2 1.633168912 0.000219
pre-B-cell leukemia homeobox 3 PBX3 1.285552659 0.000219
glucosaminyl (N-acetyl) transferase 3, mucin type GCNT3 1.857802425 0.000241
tumor necrosis factor, alpha-induced protein 2 TNFAIP2 -.924204473 0.000287
3'-phosphoadenosine 5'-phosphosulfate synthase 2 PAPSS2 -.224508116 0.000287
clusterin associated protein 1 CLUAP1 -.502785178 0.000287
tetraspanin 13 TSPAN13 -1.33092893 0.000287
N-acetylglucosamine-1-phosphate transferase, alpha and
beta subunits GNPTAB 1.067437559 0.00031
UL16 binding protein 1 ULBP1 -.103774019 0.00031
artemin ARTN -.611375982 0.00031
Vac14 homolog (S. cerevisiae) VAC14 0.950904592 0.000332
ATP-binding cassette, sub-family G (WHITE), member 2 ABCG2 1.384243526 0.000332
caveolin 1, caveolae protein, 22kDa CAV1 -.722530235 0.000355
peptidase inhibitor 3, skin-derived PI3 -.700937137 0.000355
sterol O-acyltransferase 1 SOAT1 0.891769605 0.000355
formin 2 FMN2 1.527665379 0.000355
3'-phosphoadenosine 5'-phosphosulfate synthase 2 PAPSS2 -.331727345 0.000355
dynein, axonemal, heavy chain 10 DNAH10 -3.23668863 0.000355
growth factor receptor-bound protein 10 GRB10 0.861904619 0.000355
caveolin 1, caveolae protein, 22kDa CAV1 -.722530235 0.000355
zinc finger protein 726 ZNF726 -.690323837 0.000355

62
palladin, cytoskeletal associated protein PALLD -.002194745 0.000378
leucine rich repeat containing 34 LRRC34 0.818155541 0.000378
receptor (G protein-coupled) activity modifying protein 1 RAMP1 -.602711592 0.0004
transmembrane 9 superfamily member 1 TM9SF1 -.800026599 0.0004
acid phosphatase, prostate ACPP -.309687454 0.000423
erythrocyte membrane protein band 4.1 like 4B EPB41L4B -.603462305 0.000423
ER membrane protein complex subunit 9 EMC9 -.795362378 0.000423
cadherin 11, type 2, OB-cadherin (osteoblast) CDH11 -.033834376 0.000423
NA NA -.389121962 0.000423
ATPase, aminophospholipid transporter (APLT), class I,
type 8A, member 1 ATP8A1 2.099713672 0.000446
peptidase D PEPD 0.770047836 0.000491
ABRA C-terminal like ABRACL 1.262709906 0.000491
syntabulin (syntaxin-interacting) SYBU -.048178647 0.000491
apelin APLN -.877308001 0.000491
TBC1 domain family, member 7 TBC1D7 0.916155392 0.000491
solute carrier family 1 (neuronal/epithelial high affinity
glutamate transporter, system Xag), member 1 SLC1A1 -.461681577 0.000514
pre-B-cell leukemia homeobox 3 PBX3 1.376992599 0.000514
egf-like module containing, mucin-like, hormone
receptor-like 1 EMR1 -.935401357 0.000514
3'-phosphoadenosine 5'-phosphosulfate synthase 2 PAPSS2 -.437998758 0.000514
NA NA -.373192958 0.000536
calcium/calmodulin-dependent protein kinase ID CAMK1D -1.91835623 0.000536
engulfment and cell motility 1 ELMO1 -.212430484 0.000582
cadherin 11, type 2, OB-cadherin (osteoblast) CDH11 -.226943569 0.000582
HECT and RLD domain containing E3 ubiquitin protein
ligase 5 HERC5 1.006825706 0.000582
Columns from left to right: Gene name, Gene symbol, log fold change (i.e., if mean expression in
treated cells is 2, log fold change in TLX is two times larger than in Control), and false discovery
rate adjusted p-values. TLX: U-87MG-Puromycin-TLX
Control: U-87MG
4.9 Pathway analysis
To investigate which general pathways are affected due to TLX over expression a
pathway analysis was performed using Bioconductor and gene sets provided by
Gene Ontology. Two separate tests were made Unitperm and Setperm. Unitperm
shows if there is a significant gene within a gene set. Setperm shows if whether
the overexpression of the gene set differs from other gene sets. I decided to look
at the top 10 most significant gene sets which were the same in both tests (Table
17).

63
Table 17. Top 10 up regulated gene sets.
GOID Term Ontology TLX vs Control p-value
GO:0043588 skin development BP 1.00E-04
GO:0000082 G1/S transition of mitotic cell cycle
BP 0.00012
GO:0071333 cellular response to glucose stimulus
BP 0.00012
GO:0060348 bone development BP 0.00012
GO:0030018 Z disc CC 0.00012
GO:0006816 calcium ion transport BP 0.00024
GO:0015701 bicarbonate transport BP 0.00024
GO:0042110 T cell activation BP 0.00028
GO:2001238 positive regulation of extrinsic apoptotic signaling pathway
BP 0.00028
GO:0006397 mRNA processing BP 0.00028
Gene sets are ordered from most to least significant. GOID. Gene Ontology ID. Term. Process in
which gene set is involved. Ontology. BP. Biological Process CC Cellular Component. TLX Cells
overexpressing TLX. Empty. Cells transduced with empty vector. Control.
Genes included in each gene set
GO:0043588 skin development: COL5A2, COL5A1, ADAMTS2
GO:0000082 G1/S transition of mitotic cell cycle: PPP3CA, PPAT, CAMK2,
CDK6, ITGB1, PSME2
GO:0071333 cellular response to glucose stimulus: SOX4, ICAM1, PDK3,
PPP3CA
GO:0060348 bone development: PAPSS2, SPARC, PTGER4,
GO:0030018 Z disc: PP3CA, FBXO32, JPH1, MYOZ2, PALLD, SORBS2,
FKBP1B, SYNE2, SLC8A1
GO:0006816 calcium ion transport: CCR1, SLC24A1, CCL3, PPP3CA,
RAMP1, CAMK2CD, CAV1
GO:0015701 bicarbonate transport: CA9, CA12, SLC4A10, CA2, CA12
GO:0042110 T cell activation: PPP3CA, ADA, PIK3CD, NCK2, DPP4, IL6,
ITK
GO:2001238 positive regulation of extrinsic apoptotic signaling pathway:
CAV1, ITM2C, LTBR, G0S2, PYCARD
GO:0006397 mRNA processing: WTAP, TARDBP, CPSF6, USB1, SRSF5,
ADARB1, PPARGC1A, CELF2
Of the top 10 overexpressed pathways only the GO:0015701 “bicarbonate
transport” and GO:0006816 “calcium ion transport” are related showing that TLX
overexpression can affect in more than one way the general behavior of a cell.

64
5. Discussion
The aim of this study was to investigate changes in gene expression caused by
the stable ectopic expression of TLX in the glioblastoma cell line U-87MG as well
as to inquire if a knockdown of p53 would cause an additive effect. The second
question could not be answered as a significant knockdown of p53 was not
achieved. U-87MG was successfully transformed and cells overexpressing TLX
show, when compared to controls, changes in gene expression patterns and
proliferation rates. However, overexpression of TLX could only be convincingly
shown at RNA level. In order to draw strong conclusions from the results
presented here further examinations on TLX protein overexpression are needed.
Performing a western blot with a new antibody could resolve this problem and
determine if the transformed cells also express higher levels of TLX.
5.1 TLX does not cause perceptible changes in morphology in U-87MG
Since TLX is expressed in NSCs [76] and U-87MG is a glioblastoma cell line
composed of highly undifferentiated cells, it is not surprising that
overexpression of TLX did not cause any noticeable morphological changes in
these cells. Forcing TLX expression in a differentiated related cell type such as
astrocytes could better determine if TLX causes changes in the morphology of
cells found in the CNS.
5.2 Overexpression of NR2E1 negatively affects cell proliferation
The results presented here show that proliferation of TLX overexpressing cells is
affected in a negative manner. While the hypothesis of FACS selection causing
RFP-TLX+ cells to stop dividing cannot be rejected; it is possible that a mixture of
TLX overexpression and further selection made the cells become latent.
Furthermore, as documented in chapters 4.3.2 and 4.4, puromycin-TLX+ cells
show lower rates of proliferation when compared to cells without TLX ectopic
expression. Changes in gene expression observed in this study may give insight
on how TLX reduces proliferation but still allows cells to self-renew. NDN, which
has been shown to supress cell proliferation in post-mitotic neurons[143] as well
as the apoptotic inducer HRK are up regulated while the repressor of G1/S genes,
E2F7, is down regulated. Also according to the pathway analysis, the “G1/S
transition of mitotic cell cycle” pathway is over expressed. These observations
could account why TLX+ cells in primary brain tumours are mostly
quiescent[139].

65
5.3 TLX downregulates tumour suppressor AP-2 gamma and the tumour suppressor candidate TUSC3
Here it is shown that the tumour suppressor candidate TUSC3 as well as the
tumour suppressor transcription factor AP-2 gamma are downregulated in the
TLX over expressing cells. This shows how TLX may affect more than its the
previously known tumour suppressors targets PTEN, p21 and p57[76, 77].
5.4 TLX may influence cell migration and invasiveness of GBM
Overexpressing TLX cells show an up-regulation in the genes DCLK1 and ATP8A1
which have been previously reported to be involved migration[145, 146]. An up
regulation of GPNMB was also detected in TLX overexpressing cells, which has
been shown to promote invasiveness in prostate cancer and pancreatic
cancer[148, 149]. These results indicate how TLX, by changing the expression of
different genes and pathways, might regulate the ability of high grade glioma
cells to migrate and invade surrounding tissue.
5.5 Up regulation of LRRC34 and ABCG2 stem cell biomarkers
The up regulation of LRRC34 and ABCG2 indicates how TLX may confer stem cell
like properties to cells found in glioblastoma as well as how it can make cells
resistant to standard cancer treatments such as chemotherapy and
radiation[137]. These stem cell biomarkers could also be used to determine the
tumour type of the patient as well as future treatment and prognosis [147].
5.6 TLX may help CSCs survive in an hypoxic-acidic environment
According to the pathway analysis the gene set GO:0071333 “cellular response to
glucose stimulus” is differentially expressed in TLX overexpressing cells showing
how they might quickly obtain the energy needed in case of unregulated
proliferation. I also observed an up regulation of the GO:0015701 “bicarbonate
transport” gene set, which might help cells counteract the acidic environment
produced by an uncontrolled cell metabolism. The targeting of pathways
involved in pH homeostasis could represent a feasible option for the treatment of
GBM[154].

66
5.7 Future steps and challenges
Through the microarray analysis I was able to observe several changes in the
gene expression of TLX-overexpressing cells that could allow them to survive in
adverse conditions as well as giving them stem cell properties and drug
resistance. Since it has been shown that TLX works in conjunction with cofactors
and chromatin remodelers such as HDACs and LSD1 to repress transcription[76],
one of the next steps should be another whole genome approach, chromatin
immune precipitation (ChiP). It would be of much interest to determine if TLX is
a direct regulator of the genes in which an increase of expression is seen and if
so, determine which cofactors are involved. Furthermore, it could also be tested
if inhibition of the several target genes and pathways described here would lead
to a change in proliferation and migration of cells in vitro and in future
experiments take these observations to an in vivo model. Moreover it has been
reported that TLX is druggable[155]. It would be interesting to see if the
pathways and genes here described also change their expression upon the
targeting of TLX with the chemical molecules described by Benod, C., et al.
In conclusion, the present study provides further understanding on how TLX is
involved in the evolution and development of GBM. It presents a possible
unknown biomarker, which could be used as a novel way to determine the type
of tumour a patient presents as well as providing new targets for the treatment
and further development of therapies for GBM.

67
6. Appendix
6.1 Deutsche Zusammenfassung
Das Homolog des Drosophila-Zellkernrezeptors Tll (Tailless) ist in Wirbeltieren
als TLX oder NR2E1 bekannt. Der Rezeptor wird im Zentralnervensystem im
Laufe der embryonalen Entwicklung exprimiert und spielt eine wichtige Rolle in
der Festlegung der pallio-subthalalen-Grenze, sowie in der Entwicklung der
Mausretina. Es wurde gezeigt, dass TLX in einer Form von humanen hochgradig
malignen Gehirntumoren, den Glioblastomen, überexprimiert wird. Anscheinend
ist diese Überexpression ein integraler Bestandteil der Entstehung und
Aufrechterhaltung von Glioblastomen und Glioblastomstammzellen.
Da bisher noch wenig über die Interaktion von TLX mit anderen Genen bekannt
ist, war das Ziel dieser Studie die Veränderung des Genexpressionsprofils nach
Überexpression von TLX in einer Glioblastomzelllinie mit Hilfe von Microarrays
zu charakterisieren.
Als nukleärer Rezeptor bindet TLX an die Promoterregionen seiner Zielgene,
welche eine ganz bestimmte Basenabfolge besitzen. Die Überexpression von TLX
verändert die Expression dieser großteils noch unbekannten Gene sowohl in
positiver als auch negativer Art und Weise. Durch den Vergleich zwischen TLX
überexprimierenden Zellen mit Kontrollen wurden statistisch signifikant
Unterschiede in der Genexpression beobachtet. Zusätzlich konnte auch gezeigt
werden, dass die Überexpression von TLX die Zellproliferation beeinflusst.
Weiters hat sich gezeigt, dass TLX möglicherweise Einfluss auf die Protektion
von neuronalen und Krebsstammzellen nimmt und die Migration von
Krebszellen fördert.
Zusammenfassend können die hier präsentierten Daten als Grundlage für die
weitere Erforschung von TLX als wichtiger Regulator von Neurogenese und
Tumorentwicklung gesehen werden.

68
6.2 Curriculum Vitae
Personal information
Name: Patricio Ferrer Murguia
Nationality: Mexico
Education
10/14 – to date Master of Science in genetics and Development,
University of Vienna
09/13 – 06/14 Bachelor of Science in Biology, University of Vienna
03/05 – 09/13 Diploma Study in Biology, University of Vienna
03/04 – 03/05 Universitätslehrgang Vorstudienlehrgang UniStG
Laboratory experience
07/12 – to date Master thesis at the Institute of Endocrinology and
Metabolism, General Hospital of Vienna
Personal Skills
Languages: Mother language: Spanish
Other languages: English (C1/C2)
German (B2/C1)

69
7. References
1. Lewin, B.M., Genes IX. [9. ed. 2008, Sudbury, Mass. [u.a.]: Jones and Bartlett Publ. XVII, 892 S.
2. Latchman, D.S., Transcription factors: an overview. International Journal of Biochemistry and Cell Biology, 1997. 29(12): p. 1305-12.
3. Alberts, B., Molecular biology of the cell. 5th ed. 2008, New York: Garland Science.
4. Karin, M., Too many transcription factors: positive and negative interactions. New Biologist, 1990. 2(2): p. 126-31.
5. Roeder, R.G., The role of general initiation factors in transcription by RNA polymerase II. Trends in Biochemical Sciences, 1996. 21(9): p. 327-35.
6. Nikolov, D.B. and S.K. Burley, RNA polymerase II transcription initiation: a structural view. Proc Natl Acad Sci U S A, 1997. 94(1): p. 15-22.
7. Mitchell, P.J. and R. Tjian, Transcriptional regulation in mammalian cells by sequence-specific DNA binding proteins. Science, 1989. 245(4916): p. 371-8.
8. van Nimwegen, E., Scaling laws in the functional content of genomes. Trends Genet, 2003. 19(9): p. 479-84.
9. Gudernatsch, J.F., Feeding experiments on tadpoles. II. A further contribution to the knowledge of organs with internal secretion. American Journal of Anatomy, 1914. 15(4): p. 431-480.
10. Mangelsdorf, D.J., et al., The nuclear receptor superfamily: the second decade. Cell, 1995. 83(6): p. 835-9.
11. Ashburner, M., Sequential gene activation by ecdysone in polytene chromosomes of Drosophila melanogaster. II. The effects of inhibitors of protein synthesis. Dev Biol, 1974. 39(1): p. 141-57.
12. Payvar, F., et al., Purified glucocorticoid receptors bind selectively in vitro to a cloned DNA fragment whose transcription is regulated by glucocorticoids in vivo. Proc Natl Acad Sci U S A, 1981. 78(11): p. 6628-32.
13. Ucker, D.S., S.R. Ross, and K.R. Yamamoto, Mammary tumor virus DNA contains sequences required for its hormone-regulated transcription. Cell, 1981. 27(2 Pt 1): p. 257-66.
14. Geisse, S., et al., Glucocorticoid receptors recognize DNA sequences in and around murine mammary tumour virus DNA. EMBO J, 1982. 1(12): p. 1613-9.
15. Green, S., et al., Human oestrogen receptor cDNA: sequence, expression and homology to v-erb-A. Nature, 1986. 320(6058): p. 134-9.
16. Green, S. and P. Chambon, A superfamily of potentially oncogenic hormone receptors. Nature, 1986. 324(6098): p. 615-7.
17. Arriza, J.L., et al., Cloning of human mineralocorticoid receptor complementary DNA: structural and functional kinship with the glucocorticoid receptor. Science, 1987. 237(4812): p. 268-75.
18. Misrahi, M., et al., Complete amino acid sequence of the human progesterone receptor deduced from cloned cDNA. Biochem Biophys Res Commun, 1987. 143(2): p. 740-8.

70
19. Kumar, V., et al., Localisation of the oestradiol-binding and putative DNA-binding domains of the human oestrogen receptor. EMBO J, 1986. 5(9): p. 2231-6.
20. Giguere, V., et al., Identification of a new class of steroid hormone receptors. Nature, 1988. 331(6151): p. 91-4.
21. Wang, L.H., et al., COUP transcription factor is a member of the steroid receptor superfamily. Nature, 1989. 340(6229): p. 163-6.
22. Robinson-Rechavi, M. and V. Laudet, Bioinformatics of nuclear receptors. Methods Enzymol, 2003. 364: p. 95-118.
23. Blumberg, B. and R.M. Evans, Orphan nuclear receptors--new ligands and new possibilities. Genes Dev, 1998. 12(20): p. 3149-55.
24. Nuclear Receptors Nomenclature, C., A unified nomenclature system for the nuclear receptor superfamily. Cell, 1999. 97(2): p. 161-3.
25. Germain, P., et al., Overview of nomenclature of nuclear receptors. Pharmacol Rev, 2006. 58(4): p. 685-704.
26. Petkovich, M., et al., A human retinoic acid receptor which belongs to the family of nuclear receptors. Nature, 1987. 330(6147): p. 444-50.
27. Giguere, V., et al., Identification of a receptor for the morphogen retinoic acid. Nature, 1987. 330(6149): p. 624-9.
28. Wu, W., et al., Schistosoma mansoni (Platyhelminthes, Trematoda) nuclear receptors: sixteen new members and a novel subfamily. Gene, 2006. 366(2): p. 303-15.
29. Wu, W., et al., Evolution of a novel subfamily of nuclear receptors with members that each contain two DNA binding domains. BMC Evol Biol, 2007. 7: p. 27.
30. Offermanns, S. and W. Rosenthal, Encyclopedia of Molecular Pharmacology. 2008: Springer.
31. Francis, G.A., et al., Nuclear receptors and the control of metabolism. Annu Rev Physiol, 2003. 65: p. 261-311.
32. Taneja, R., Nuclear receptors in development. Advances in developmental biology. 2006, Amsterdam ; Boston: Elsevier. xiii, 430 p., 24 p. of plates.
33. Repa, J.J. and D.J. Mangelsdorf, The role of orphan nuclear receptors in the regulation of cholesterol homeostasis. Annu Rev Cell Dev Biol, 2000. 16: p. 459-81.
34. Yamamoto, K.R., Steroid receptor regulated transcription of specific genes and gene networks. Annual Review of Genetics, 1985. 19: p. 209-52.
35. Evans, R.M., The steroid and thyroid hormone receptor superfamily. Science, 1988. 240(4854): p. 889-95.
36. Klug, A. and J.W. Schwabe, Protein motifs 5. Zinc fingers. FASEB J, 1995. 9(8): p. 597-604.
37. Olefsky, J.M., Nuclear receptor minireview series. J Biol Chem, 2001. 276(40): p. 36863-4.
38. Leo, C. and J.D. Chen, The SRC family of nuclear receptor coactivators. Gene, 2000. 245(1): p. 1-11.
39. Klinge, C.M., et al., Binding of type II nuclear receptors and estrogen receptor to full and half-site estrogen response elements in vitro. Nucleic Acids Res, 1997. 25(10): p. 1903-12.
40. Olefsky, J.M., Nuclear Receptor Minireview Series. Journal of Biological Chemistry, 2001. 276(40): p. 36863-36864.

71
41. Bear, M.F., B.W. Connors, and M.A. Paradiso, Neuroscience : exploring the brain. 3rd ed. 2007, Philadelphia, PA: Lippincott Williams & Wilkins. xxxviii, 857 p.
42. Gourine, A.V., et al., Astrocytes control breathing through pH-dependent release of ATP. Science, 2010. 329(5991): p. 571-5.
43. Fuchs, E. and J.A. Segre, Stem cells: a new lease on life. Cell, 2000. 100(1): p. 143-55.
44. Alvarez-Buylla, A., J.M. Garcia-Verdugo, and A.D. Tramontin, A unified hypothesis on the lineage of neural stem cells. Nat Rev Neurosci, 2001. 2(4): p. 287-293.
45. Altman, J. and G.D. Das, Autoradiographic and histological evidence of postnatal hippocampal neurogenesis in rats. J Comp Neurol, 1965. 124(3): p. 319-35.
46. Gage, F.H., Mammalian neural stem cells. Science, 2000. 287(5457): p. 1433-8.
47. Kanski, R., et al., A star is born: new insights into the mechanism of astrogenesis. Cell Mol Life Sci, 2014. 71(3): p. 433-47.
48. Robel, S., B. Berninger, and M. Götz, The stem cell potential of glia: lessons from reactive gliosis. Nat Rev Neurosci, 2011. 12(2): p. 88-104.
49. Doetsch, F., et al., Subventricular Zone Astrocytes Are Neural Stem Cells in the Adult Mammalian Brain. Cell, 1999. 97(6): p. 703-716.
50. Guérout, N., X. Li, and F. Barnabé-Heider, Cell fate control in the developing central nervous system. Experimental Cell Research, 2014. 321(1): p. 77-83.
51. Cameron, H.A., et al., Differentiation of newly born neurons and glia in the dentate gyrus of the adult rat. Neuroscience, 1993. 56(2): p. 337-44.
52. Gage, F.H., et al., Multipotent progenitor cells in the adult dentate gyrus. J Neurobiol, 1998. 36(2): p. 249-66.
53. Ahlenius, H., et al., Neural stem and progenitor cells retain their potential for proliferation and differentiation into functional neurons despite lower number in aged brain. J Neurosci, 2009. 29(14): p. 4408-19.
54. Acton, Q.A., Afferent Neurons: Advances in Research and Application: 2011 Edition: ScholarlyPaper. 2012: ScholarlyEditions.
55. Davis-Dusenbery, B.N., et al., How to make spinal motor neurons. Development, 2014. 141(3): p. 491-501.
56. Petilla terminology: nomenclature of features of GABAergic interneurons of the cerebral cortex. Nat Rev Neurosci, 2008. 9(7): p. 557-568.
57. Brodal, P., The Central Nervous System. 2010: Oxford University Press, USA.
58. Fiacco, T.A., C. Agulhon, and K.D. McCarthy, Sorting out astrocyte physiology from pharmacology. Annu Rev Pharmacol Toxicol, 2009. 49: p. 151-74.
59. Cameron-Curry, P. and N.M. Le Douarin, Oligodendrocyte precursors originate from both the dorsal and the ventral parts of the spinal cord. Neuron, 1995. 15(6): p. 1299-1310.
60. Waxman, S.G. and W.I. McDonald, Form and Function in the Brain and Spinal Cord: Perspectives of a Neurologist. 2003: MIT Press.
61. Kreutzberg, G.W., Microglia, the first line of defence in brain pathologies. Arzneimittelforschung, 1995. 45(3A): p. 357-60.

72
62. Zhao, C., W. Deng, and F.H. Gage, Mechanisms and Functional Implications of Adult Neurogenesis. Cell, 2008. 132(4): p. 645-660.
63. Ge, W.P., et al., Local generation of glia is a major astrocyte source in postnatal cortex. Nature, 2012. 484(7394): p. 376-80.
64. Menn, B., et al., Origin of oligodendrocytes in the subventricular zone of the adult brain. J Neurosci, 2006. 26(30): p. 7907-18.
65. Toda, H., et al., Neurons generated from adult rat hippocampal stem cells form functional glutamatergic and GABAergic synapses in vitro. Exp Neurol, 2000. 165(1): p. 66-76.
66. van Praag, H., et al., Functional neurogenesis in the adult hippocampus. Nature, 2002. 415(6875): p. 1030-4.
67. Squire, L.R., Memory and the hippocampus: a synthesis from findings with rats, monkeys, and humans. Psychol Rev, 1992. 99(2): p. 195-231.
68. Sahay, A. and R. Hen, Hippocampal neurogenesis and depression. Novartis Found Symp, 2008. 289: p. 152-60; discussion 160-4, 193-5.
69. Lledo, P.-M., M. Alonso, and M.S. Grubb, Adult neurogenesis and functional plasticity in neuronal circuits. Nat Rev Neurosci, 2006. 7(3): p. 179-193.
70. Pignoni, F., et al., The Drosophila gene tailless is expressed at the embryonic termini and is a member of the steroid receptor superfamily. Cell, 1990. 62(1): p. 151-63.
71. Yu, R.T., et al., Relationship between Drosophila gap gene tailless and a vertebrate nuclear receptor Tlx. Nature, 1994. 370(6488): p. 375-9.
72. Monaghan, A.P., et al., The mouse homolog of the orphan nuclear receptor tailless is expressed in the developing forebrain. Development, 1995. 121(3): p. 839-53.
73. Li, W., et al., Nuclear receptor TLX regulates cell cycle progression in neural stem cells of the developing brain. Mol Endocrinol, 2008. 22(1): p. 56-64.
74. Liu, H.K., et al., The nuclear receptor tailless is required for neurogenesis in the adult subventricular zone. Genes Dev, 2008. 22(18): p. 2473-8.
75. Shi, Y., et al., Expression and function of orphan nuclear receptor TLX in adult neural stem cells. Nature, 2004. 427(6969): p. 78-83.
76. Gui, H., M.L. Li, and C.C. Tsai, A tale of tailless. Dev Neurosci, 2011. 33(1): p. 1-13.
77. Adachi, K., et al., Beta-catenin signaling promotes proliferation of progenitor cells in the adult mouse subventricular zone. Stem Cells, 2007. 25(11): p. 2827-36.
78. Hanahan, D. and Robert A. Weinberg, Hallmarks of Cancer: The Next Generation. Cell. 144(5): p. 646-674.
79. Crowley, L., An Introduction to Human Disease: Pathology and Pathophysiology Correlations. 2009: Jones & Bartlett Learning.
80. Tumor Grade. [cited 2014 July 14, 2014]; Available from: http://www.cancer.gov/cancertopics/factsheet/detection/tumor-grade.
81. Stratton, M.R., P.J. Campbell, and P.A. Futreal, The cancer genome. Nature, 2009. 458(7239): p. 719-724.
82. Yokota, J., Tumor progression and metastasis. Carcinogenesis, 2000. 21(3): p. 497-503.
83. Croce, C.M., Oncogenes and Cancer. New England Journal of Medicine, 2008. 358(5): p. 502-511.
73
84. Bishop, J.M., Molecular themes in oncogenesis. Cell, 1991. 64(2): p. 235-248.
85. Witsch, E., M. Sela, and Y. Yarden, Roles for growth factors in cancer progression. Physiology (Bethesda), 2010. 25(2): p. 85-101.
86. Cheng, N., et al., Transforming growth factor-beta signaling-deficient fibroblasts enhance hepatocyte growth factor signaling in mammary carcinoma cells to promote scattering and invasion. Mol Cancer Res, 2008. 6(10): p. 1521-33.
87. Lemmon, M.A. and J. Schlessinger, Cell Signaling by Receptor Tyrosine Kinases. Cell, 2010. 141(7): p. 1117-1134.
88. Ullrich, A. and J. Schlessinger, Signal transduction by receptors with tyrosine kinase activity. Cell, 1990. 61(2): p. 203-12.
89. Blume-Jensen, P. and T. Hunter, Oncogenic kinase signalling. Nature, 2001. 411(6835): p. 355-65.
90. Wertz, I.E. and V.M. Dixit, Regulation of death receptor signaling by the ubiquitin system. Cell Death Differ, 2010. 17(1): p. 14-24.
91. Cabrita, M.A. and G. Christofori, Sprouty proteins, masterminds of receptor tyrosine kinase signaling. Angiogenesis, 2008. 11(1): p. 53-62.
92. Amit, I., et al., A module of negative feedback regulators defines growth factor signaling. Nat Genet, 2007. 39(4): p. 503-12.
93. Fernandez-Medarde, A. and E. Santos, Ras in cancer and developmental diseases. Genes Cancer, 2011. 2(3): p. 344-58.
94. Chu, E.C. and A.S. Tarnawski, PTEN regulatory functions in tumor suppression and cell biology. Med Sci Monit, 2004. 10(10): p. RA235-41.
95. Wang, S.I., et al., Somatic mutations of PTEN in glioblastoma multiforme. Cancer Res, 1997. 57(19): p. 4183-6.
96. Rasheed, B.K., et al., PTEN gene mutations are seen in high-grade but not in low-grade gliomas. Cancer Res, 1997. 57(19): p. 4187-90.
97. Duerr, E.M., et al., PTEN mutations in gliomas and glioneuronal tumors. Oncogene, 1998. 16(17): p. 2259-64.
98. Maehama, T. and J.E. Dixon, The tumor suppressor, PTEN/MMAC1, dephosphorylates the lipid second messenger, phosphatidylinositol 3,4,5-trisphosphate. J Biol Chem, 1998. 273(22): p. 13375-8.
99. Jiang, B.H. and L.Z. Liu, PI3K/PTEN signaling in angiogenesis and tumorigenesis. Adv Cancer Res, 2009. 102: p. 19-65.
100. Morris, E.J. and N.J. Dyson, Retinoblastoma protein partners. Adv Cancer Res, 2001. 82: p. 1-54.
101. Macaluso, M., M. Montanari, and A. Giordano, Rb family proteins as modulators of gene expression and new aspects regarding the interaction with chromatin remodeling enzymes. Oncogene, 2006. 25(38): p. 5263-7.
102. Wu, C.L., et al., In vivo association of E2F and DP family proteins. Mol Cell Biol, 1995. 15(5): p. 2536-46.
103. Murphree, A.L. and W.F. Benedict, Retinoblastoma: clues to human oncogenesis. Science, 1984. 223(4640): p. 1028-33.
104. Munakata, T., et al., Hepatitis C virus induces E6AP-dependent degradation of the retinoblastoma protein. PLoS Pathog, 2007. 3(9): p. 1335-47.
105. Meuwissen, R., et al., Induction of small cell lung cancer by somatic inactivation of both Trp53 and Rb1 in a conditional mouse model. Cancer Cell, 2003. 4(3): p. 181-9.

74
106. Friend, S.H., et al., A human DNA segment with properties of the gene that predisposes to retinoblastoma and osteosarcoma. Nature, 1986. 323(6089): p. 643-6.
107. Lavin, M.F. and N. Gueven, The complexity of p53 stabilization and activation. Cell Death Differ, 2006. 13(6): p. 941-950.
108. Strachan, T. and A.P. Read, Human molecular genetics 2. 2nd ed. 1999, Oxford: BIOS Scientific. xxiii, 576 p.
109. Greenblatt, M.S., et al., Mutations in the p53 tumor suppressor gene: clues to cancer etiology and molecular pathogenesis. Cancer Res, 1994. 54(18): p. 4855-78.
110. Steele, R.J.C., et al., The p53 tumour suppressor gene. British Journal of Surgery, 1998. 85(11): p. 1460-1467.
111. Clarke, M.F., et al., Cancer stem cells--perspectives on current status and future directions: AACR Workshop on cancer stem cells. Cancer Res, 2006. 66(19): p. 9339-44.
112. Bagley, R.G. and B.A. Teicher, Stem Cells and Cancer. 2009: Humana Press. 113. El Hallani, S., et al., A new alternative mechanism in glioblastoma
vascularization: tubular vasculogenic mimicry. Brain, 2010. 133(Pt 4): p. 973-82.
114. Kalluri, R. and M. Zeisberg, Fibroblasts in cancer. Nat Rev Cancer, 2006. 6(5): p. 392-401.
115. Bruce, W.R. and H. Van Der Gaag, A QUANTITATIVE ASSAY FOR THE NUMBER OF MURINE LYMPHOMA CELLS CAPABLE OF PROLIFERATION IN VIVO. Nature, 1963. 199: p. 79-80.
116. Bonnet, D. and J.E. Dick, Human acute myeloid leukemia is organized as a hierarchy that originates from a primitive hematopoietic cell. Nat Med, 1997. 3(7): p. 730-7.
117. Galli, R., et al., Isolation and characterization of tumorigenic, stem-like neural precursors from human glioblastoma. Cancer Res, 2004. 64(19): p. 7011-21.
118. Al-Hajj, M., et al., Prospective identification of tumorigenic breast cancer cells. Proc Natl Acad Sci U S A, 2003. 100(7): p. 3983-8.
119. Schepers, A.G., et al., Lineage Tracing Reveals Lgr5+ Stem Cell Activity in Mouse Intestinal Adenomas. Science, 2012. 337(6095): p. 730-735.
120. Freedman, J., Brain Cancer: Current and Emerging Trends in Detection and Treatment. 2009: Rosen.
121. Brain and Spinal Cord Tumors in Adults, in American Cancer Society, A.C. Society, Editor. 2014, American Cancer Society: American Cancer Society 250 Williams Street NW Atlanta Georgia, 30303.
122. Liu, H.K., et al., The nuclear receptor tailless induces long-term neural stem cell expansion and brain tumor initiation. Genes Dev, 2010. 24(7): p. 683-95.
123. Park, H.J., et al., The neural stem cell fate determinant TLX promotes tumorigenesis and genesis of cells resembling glioma stem cells. Mol Cells, 2010. 30(5): p. 403-8.
124. Louis, D.N., et al., The 2007 WHO classification of tumours of the central nervous system. Acta Neuropathol, 2007. 114(2): p. 97-109.

75
125. Ostrom, Q.T., et al., CBTRUS Statistical Report: Primary Brain and Central Nervous System Tumors Diagnosed in the United States in 2006-2010. Neuro-Oncology, 2013. 15(suppl 2): p. ii1-ii56.
126. Zong, H., R.G. Verhaak, and P. Canoll, The cellular origin for malignant glioma and prospects for clinical advancements. Expert Rev Mol Diagn, 2012. 12(4): p. 383-94.
127. Maher, E.A., et al., Malignant glioma: genetics and biology of a grave matter. Genes Dev, 2001. 15(11): p. 1311-33.
128. Eramo, A., et al., Chemotherapy resistance of glioblastoma stem cells. Cell Death Differ, 2006. 13(7): p. 1238-41.
129. Bao, S., et al., Glioma stem cells promote radioresistance by preferential activation of the DNA damage response. Nature, 2006. 444(7120): p. 756-60.
130. Satistics and outlook for brain tumours. 2014 [cited 2014 August 11, 2014]; Available from: http://www.cancerresearchuk.org/cancer-help/type/brain-tumour/treatment/statistics-and-outlook-for-brain-tumours#particular.
131. Ho, C.Y., et al., MicroRNA profiling in pediatric pilocytic astrocytoma reveals biologically relevant targets, including PBX3, NFIB, and METAP2. Neuro Oncol, 2013. 15(1): p. 69-82.
132. Sanai, N., A. Alvarez-Buylla, and M.S. Berger, Neural stem cells and the origin of gliomas. N Engl J Med, 2005. 353(8): p. 811-22.
133. Singh, S.K., et al., Identification of human brain tumour initiating cells. Nature, 2004. 432(7015): p. 396-401.
134. Quinones-Hinojosa, A. and K. Chaichana, The human subventricular zone: a source of new cells and a potential source of brain tumors. Exp Neurol, 2007. 205(2): p. 313-24.
135. Bleau, A.M., et al., PTEN/PI3K/Akt pathway regulates the side population phenotype and ABCG2 activity in glioma tumor stem-like cells. Cell Stem Cell, 2009. 4(3): p. 226-35.
136. Xie, Q., et al., The Tailless Root of Glioma: Cancer Stem Cells. Cell Stem Cell, 2014. 15(2): p. 114-116.
137. Bleau, A.M., J.T. Huse, and E.C. Holland, The ABCG2 resistance network of glioblastoma. Cell Cycle, 2009. 8(18): p. 2936-44.
138. Phillips, H.S., et al., Molecular subclasses of high-grade glioma predict prognosis, delineate a pattern of disease progression, and resemble stages in neurogenesis. Cancer Cell, 2006. 9(3): p. 157-73.
139. Zhu, Z., et al., Targeting self-renewal in high-grade brain tumors leads to loss of brain tumor stem cells and prolonged survival. Cell Stem Cell, 2014. 15(2): p. 185-98.
140. Zhang, Z., et al., A greedy algorithm for aligning DNA sequences. J Comput Biol, 2000. 7(1-2): p. 203-14.
141. Tonn, J.C. and M. Westphal, Neuro-Oncology of CNS Tumors. 2006: Springer.
142. Irizarry, R.A., et al., Exploration, normalization, and summaries of high density oligonucleotide array probe level data. Biostatistics, 2003. 4(2): p. 249-64.

76
143. Westendorp, B., et al., E2F7 represses a network of oscillating cell cycle genes to control S-phase progression. Nucleic Acids Res, 2012. 40(8): p. 3511-23.
144. Taniura, H., K. Matsumoto, and K. Yoshikawa, Physical and functional interactions of neuronal growth suppressor necdin with p53. J Biol Chem, 1999. 274(23): p. 16242-8.
145. Qin, J., et al., A novel migration-related gene product, doublecortin, in neuronal migration disorder of fetuses and infants with Zellweger syndrome. Acta Neuropathol, 2000. 100(2): p. 168-73.
146. Kato, U., et al., Role for phospholipid flippase complex of ATP8A1 and CDC50A proteins in cell migration. J Biol Chem, 2013. 288(7): p. 4922-34.
147. Luhrig, S., et al., Lrrc34, a Novel Nucleolar Protein, Interacts with Npm1 and Ncl and Has an Impact on Pluripotent Stem Cells. Stem Cells Dev, 2014.
148. Fiorentini, C., et al., GPNMB/OA protein increases the invasiveness of human metastatic prostate cancer cell lines DU145 and PC3 through MMP-2 and MMP-9 activity. Experimental Cell Research, 2014. 323(1): p. 100-11.
149. Torres, C., et al., The Potential Role of the Glycoprotein Osteoactivin/Glycoprotein Nonmetastatic Melanoma Protein B in Pancreatic Cancer. Pancreas, 2014.
150. Kuang, W.W., et al., Differential screening and suppression subtractive hybridization identified genes differentially expressed in an estrogen receptor-positive breast carcinoma cell line. Nucleic Acids Res, 1998. 26(4): p. 1116-23.
151. Di Bernardo, M.C., et al., A genome-wide association study identifies six susceptibility loci for chronic lymphocytic leukemia. Nature Genetics, 2008. 40(10): p. 1204-10.
152. Sillé, F.C.M., et al., Post-GWAS Functional Characterization of Susceptibility Variants for Chronic Lymphocytic Leukemia. PLoS One, 2012. 7(1): p. e29632.
153. Caruso, J.A., et al., Elafin is downregulated during breast and ovarian tumorigenesis but its residual expression predicts recurrence. Breast Cancer Res, 2014. 16(6): p. 3417.
154. Pastorek, J. and S. Pastorekova, Hypoxia-induced carbonic anhydrase IX as a target for cancer therapy: From biology to clinical use. Seminars in Cancer Biology, (0).
155. Benod, C., et al., The Human Orphan Nuclear Receptor Tailless (TLX, NR2E1) Is Druggable. PLoS ONE, 2014. 9(6): p. e99440.