Functional PET based oligomers and polymers for cross ...
144
Budapest University of Technology and Economics Functional PET based oligomers and polymers for cross-linked systems: Synthesis and Characterization Ph. D. Thesis by Levente Kárpáti Supervisor: Viktória Vargha Laboratory of Plastics and Rubber Technology Department of Physical Chemistry and Materials Science Budapest University of Technology and Economics Polymer Physics Research Group Institute of Materials and Environmental Chemistry Research Centre for Natural Sciences 2020
Transcript of Functional PET based oligomers and polymers for cross ...

Budapest University of Technology and Economics
Functional PET based oligomers and
polymers for cross-linked systems:
Synthesis and Characterization
Ph. D. Thesis
by
Levente Kárpáti
Supervisor: Viktória Vargha
Laboratory of Plastics and Rubber Technology
Department of Physical Chemistry and Materials Science
Budapest University of Technology and Economics
Polymer Physics Research Group
Institute of Materials and Environmental Chemistry
Research Centre for Natural Sciences
2020


Contents
3
Contents
Chapter 1 ........................................................................................................................ 7
INTRODUCTION
1.1. Plastic recycling methods .......................................................................................... 8
1.1.1. Mechanical recycling ........................................................................................ 10
1.1.2. Incineration for energy production .................................................................... 11
1.1.3. Chemical recycling ............................................................................................ 12
1.2. The solvolysis of PET ............................................................................................. 14
1.2.1 Solvolysis methods. ............................................................................................ 15
1.2.2. Mechanism and reaction kinetics ...................................................................... 18
1.2.3. Catalysts ............................................................................................................ 23
1.3. Application in cross-linked systems ........................................................................ 28
1.3.1. The connection between structure and properties ............................................. 28
1.3.2. The effect on reaction kinetics and conversion ................................................. 29
1.4. Scope ....................................................................................................................... 32
1.5. References ............................................................................................................... 34
Chapter 2 ...................................................................................................................... 41
OLIGOESTER AND POLYESTER PRODUCTION VIA ACIDO-ALCOHOLYSIS
OF PET WASTE
2.1. Introduction ............................................................................................................. 42
2.2. Experimental ........................................................................................................... 42
2.2.1. Materials ............................................................................................................ 42
2.2.2. PET solvolysis ................................................................................................... 43
2.2.3. Chain extension ................................................................................................. 43
2.2.4. Characterization ................................................................................................ 43
2.3. Results and discussion ............................................................................................ 44
2.3.1. Characterization of solvolysis products ............................................................. 44
2.3.2. Chain extension of PET solvolysis products ..................................................... 48
2.3.3. Composting ....................................................................................................... 50
2.4. Conclusions ............................................................................................................. 51
2.5. References ............................................................................................................... 52
Contents
4
Chapter 3....................................................................................................................... 53
ONE-POT DEPOLYMERIZATION AND POLYCONDENSATION OF PET BASED
RANDOM OLIGO- AND POLYESTERS
3.1. Introduction ............................................................................................................. 53
3.2. Experimental ........................................................................................................... 55
3.2.1. Materials ............................................................................................................ 55
3.2.2. Depolymerization of PET .................................................................................. 55
3.2.3. One-pot synthesis of saturated random polyester .............................................. 56
3.2.4. One-pot synthesis of unsaturated random polyester .......................................... 57
3.2.5. Preparation and moulding of unsaturated resins ................................................ 57
3.2.6. Characterization ................................................................................................. 57
3.3. Results and discussion ............................................................................................. 59
3.3.1. Functional group analysis and solution viscosity measurements ....................... 60
3.3.2 Molecular structure identification....................................................................... 61
3.3.3. Thermal properties ............................................................................................. 66
3.3.4. Unsaturated resin characterization ..................................................................... 69
3.4. Conclusions ............................................................................................................. 71
3.5. References ............................................................................................................... 72
Chapter 4....................................................................................................................... 75
SYNTHESIS AND CHARACTERIZATION OF ISOPHORONDIAMINE BASED
EPOXY HARDENERS FROM THE AMINOLYSIS OF PET
4.1. Introduction ............................................................................................................. 75
4.2. Experimental ........................................................................................................... 76
4.2.1. Materials ............................................................................................................ 76
4.2.2. Aminolysis of PET with IPD ............................................................................. 77
4.2.3. Reaction product characterization ..................................................................... 77
4.2.4. Test specimen preparation and characterization ................................................ 78
4.3. Results and discussion ............................................................................................. 79
4.3.1. Aminolysis product characterization ................................................................. 79
4.3.2. IPD and Product characterization with NMR .................................................... 82
4.3.3. Cross-linker system design, solubility calculations ........................................... 83
4.3.4. Cross-linking characterization ........................................................................... 85
4.3.5. Thermomechanical analysis .............................................................................. 87
4.3.5. Mechanical properties........................................................................................ 90
4.4. Conclusions ............................................................................................................. 92
4.5. References ............................................................................................................... 93

Contents
5
Chapter 5 ...................................................................................................................... 95
SYNTHESIS AND CHARACTERISATION OF ISPHORONDIAMINE BASED
OLIGOAMIDES: CATALYTIC EFFECT OF AMIDES DURING THE CURING OF
EPOXY RESINS
5.1. Introduction ............................................................................................................. 95
5.2. Experimental ........................................................................................................... 96
5.2.1. Materials ............................................................................................................ 96
5.2.2. Aminolysis of PET with IPD ............................................................................. 97
5.2.3. Characterization of oligo-terephthalamides....................................................... 97
5.2.4. Epoxi preparation and characterization ............................................................. 98
5.2.5. Quantum chemical computation ........................................................................ 99
5.3. Results and discussion ............................................................................................ 99
5.3.1. Oligo-terephthalamides characterization ........................................................... 99
5.3.2. Molecular structure characterization of the aminolysis products .................... 101
5.3.3. Cross-linkers effect on gelation and glass transition ....................................... 104
5.3.4. Epoxy crosslinking kinetics characterization .................................................. 106
5.3.5. Catalytic effect of amides studied with computational chemistry ................... 112
5.4. Conclusions ........................................................................................................... 114
5.5. References ............................................................................................................. 116
Chapter 6 .................................................................................................................... 119
THE SEQUENCED STRUCTURE OF AMINO-ALCOHOL BASED RANDOM
POLY(ESTER AMIDE)S
6.1. Introduction ........................................................................................................... 119
6.2. Experimental ......................................................................................................... 120
6.2.1. Materials .......................................................................................................... 120
6.2.2. Sample preparation .......................................................................................... 121
6.2.3. Synthesis of Poly(ester amide)s ...................................................................... 121
6.2.4. Characterization .............................................................................................. 121
6.3. Results and discussion .......................................................................................... 122
6.3.1. Functional group analysis, molecular weight and degradation ........................ 122
6.3.2. Molecular structure identification ................................................................... 123
6.3.3. Thermal properties and crystalinity ................................................................. 128
6.4. Conclusions ........................................................................................................... 133
6.5. References ............................................................................................................. 133
Chapter 7 .................................................................................................................... 135
SUMMARY
LIST OF SYMBOLS ................................................................................................... 138
ACKNOWLEDGEMENT ........................................................................................... 140
PUBLICATIONS ......................................................................................................... 141

Contents
6

Introduction
7
Chapter 1
Introduction
The ever-increasing amount of plastic use and the general carelessness of humans
ensued the heavy accumulation of waste plastics around the globe (Figure 1.1). Starting
from that late 1980s and early 1990s sustainability, being environmentally conscious has
become increasingly important to our society. Therefore, researching and improving re-
cycling methods became inevitable and a growing trend. The European Union became a
leading party in this field with its legislation concerning waste management. Even com-
panies like Coca-Cola, BASF and MOL in cooperation with APK AG have started their own projects concerning plastic recycling. Their excellent and diverse properties allowed
plastics to became part of our everyday lives and became a compulsory, almost irreplace-
able part of every industrial field. But these properties also caused problems at the end of
their life cycle. A significant portion of plastics is intended to be used only once or for a
short time (packaging materials, cutlery, medical equipment, etc.). Without a deliberate
solution to repurpose, reuse or recycle these materials a vast amount of plastic waste ac-
cumulates with every year. Some of the single-use plastics such as straws, cotton swabs
made from plastic, plastic plates and cutlery, plastic coffee stirrers and plastic balloon
holders will be banned by the European Union’s Single-use Plastics Directive*. Other
products such as plastic bottles will have to be collected separately by 2025. One of the
greatest disadvantages of plastic recycling derives from it being a mixed waste material.
If the purpose of recycling is to regain the pure plastics – and maintain sustainability – from the waste material than several separation and purification steps must be imple-
mented into the recycling lines. As a result, recycled plastics usually have a higher price
than virgin materials. Due to the possibility of degradation their properties might not even
reach the requirements for certain fields of application1,2
Other sector
12.58%
Transportation
5.63%
Industrial Machinery
0.33% Packaging
46.69%
Textiles
13.91%
Electrical/Electronic
4.3%
Consumer & Institutional Products
12.25%
Building and Construction
4.3%
Additives
5.63%Other
3.64%PUR
5.3%
PP&PA fibers
13.91%
PET
10.6%
PVC
4.97% PS
5.63%
LDPE
18.87%
HDPE
13.25%
PP
18.21%
Figure 1.1 The global plastic waste generation by industrial fields and type in 2015. To-
tal waste production was 302 million tons. Data was published by Geyer et al.2
* Proposal for a Directive of the European Parliament and of the Council on the reduction of the impact of
certain plastic products on the environment, Procedure 2018/0172/COD

Chapter 1
8
Poly(ethylene terephthalate) (PET) has become one of the most recycled polymers among the commodity and engineering polymeric materials.3–10 Several patents and re-
search papers have focused on its recycling methods. Most of these solely discussed or
focused on the regaining of pure PET from the waste material. One of the hardest chal-
lenges in recycling is to gain material with at least equal properties to the virgin polymer
and maintain sustainability. As a result, a large number of researchers and research groups
investigated the possibilities of chemical recycling and doing so produced new polymeric
materials, chemicals, and virgin PET as well. The goal of our research group was to de-
velop environmentally more friendly chemical recycling methods and find uses for the
raw reaction products in cross-linked systems.
In the following sections, we discuss plastic recycling methods (1.1) in detail, es-
pecially chemical recycling, solvolysis (1.2). In subsection 1.3 we describe design and characteristics of cross-linked systems and the use of terephthalic acid derivates.
1.1. Plastic recycling methods
Plastic recycling is one of several waste management strategies to deal with the
emerging problem of plastic waste11. Landfilling is one of the conventional approaches
that does not deal with sustainability. Well-maintained it could minimalize the environ-mental issues, but it is still a one-way linear approach that just deferments the problem.
Reusing and/or repurposing the materials can lengthen the lifetime of certain products. In
some cases, exchanging to alternative environmentally more friendly materials and/or
downgauging the volume of used materials could prove to be a solution as well. Incinera-
tion and pyrolysis can be used to gain energy or chemicals from waste plastics.
Plastic recycling methods can be classified by several means. The ISO 14044
standard for environmental management distinguishes them into two groups: open looped
or closed looped methods. By their definition, a recycling method is open-looped when
the end-product is used in a different system, for example, the waste PET bottle scrap is
used to produce fibres for the textile industry. Nevertheless, the quality of such materials
are not considered in this standard as it was pointed out by Huysman et al1. Huysman and his colleagues suggested the use of “circular economy performance indicator” (CPI) to
characterize the quality of the recycled product. Doing so they classified the waste mate-
rials into four groups: high-, medium-, low- and very-low-quality. High-quality materials
can substitute virgin materials in a 1:1 ratio and can be used in the same or similar prod-
ucts. Medium quality materials can only substitute the virgin material in a certain ratio,
these can be used in similar or lower quality products. Low-quality materials can only
substitute other lower quality materials and cannot be used in the same products as the
virgin material. By their classification, very-low-quality materials should only be used for
incineration. This classification generally summarizes the problems and opportunities in
plastic recycling. This sorting mostly considers mechanical recycling and incineration,
not other techniques such as chemical recycling that could be used to produce new mate-
rials with equal or better properties than the original virgin material. The separation, sort-ing of waste plastics plays a significant role in the quality of the waste material. Most of
the recycling methods – excect energy recovery – require a certain level of purity from
the process materials. The mixed plastic waste is usually separated, shredded and cleaned
to remove any contamination (glue, paper, metals). The plastic waste is thoroughly
washed in aqueous and/or organic solvent medium.1,12

Introduction
9
Certain pollutants, impurities could cause degradation and/or side reactions that could significantly reduce the quality of the recycled product.4 Hence separation tech-
niques are essential in plastic waste recycling, unfortunately, they are also one of the most
expensive processes. The total separation of waste plastics is a yet to be solved problem.
The sorting technologies can be classified into five types: spectroscopic-, density based-,
tribo-electrostatic-, flotation- and other separation methods.13–19 Spectroscopic methods
are mostly based in FTIR spectroscopy and are capable to sort most of the plastic waste
materials. The dark colored object cannot be identified with FITR spectroscopy since they
absorb infrared light. Due to the relatively small density interval of polymeric materials
gravitational separator systems are not effective enough to separate all plastic types. For
example, PVC and PET are almost inseparable by such methods (1.30-1.35 g cm-3 density
range). Tribo-electrostatic and froth flotation systems nowadays are capable of separating PVC/PET mixtures with over 99% precision.18,19 In recent years new labelling methods
such as fluorescent labelling with up-converters were tested. Upconverter nanoparticles
are capable of emitting different colors of light depending on their composition. If stand-
ardized they could be used as labels and enhance the separation of plastic waste materi-
als.15
Figure 1.2 The recycling technologies of solid plastic waste based on the classification
of Singh et al.20
Plastic recycling methods can be sorted into four categories: primary, secondary, tertiary and quaternary (Figure 1.2).20–22 Primary recycling covers the in-plant recircula-
tion (closed-loop) of industrial plastic scrap. Usually, this industrial scrap is mixed with
the virgin material to assure product quality or used for a secondary purpose. Secondary
recycling includes the mechanical recycling of industrial and domestic, consumer plastic
waste. The purified plastic waste is either separated to different plastic types and pro-
cessed or either processed without any segregation, into pellets. Unseparated plastic pel-
lets can only be used for lesser quality products. The properties of such blends greatly
depend on the type and ratio of the different plastics, the morphology/structure of the
blend and the interaction forces between the components.23,24 The miscibility of the plas-
tic components is governed by the interaction forces between the components and it could

Chapter 1
10
be tailored by using compatibilizers.25 The tertiary, chemical recycling is used to turn the plastic waste into raw materials that can be used for new plastic and chemical production.
Quaternary recycling is the incineration of plastic waste to gain energy. These techniques
will be discussed in the following paragraphs.
1.1.1. Mechanical recycling
Thermoplastic polymers such as PET are processed at high temperatures. PET is
a crystalline polyester with a melt temperature of 260 °C and it is usually processed at
265-280 °C. Polyesters, polyamides and other polymers produced with polycondensation
require 3-4 hour drying session at 110-140 °C before processing, otherwise, the residual
water content (over 0.01-0.02 m/m%) causes scission in the polymer backbone. After the separation and shredding the plastic scrap is usually processed with an extrusion machine
into pellets to avoid aching in later processes. Depending on the implemented use of the
recycled material, stabilizing agents and other additives (pigments) are added during pro-
cessing. The new pellets can be processed with any thermoplastic processing method (ex-
trusion, injection molding, blow molding). The intrinsic viscosity (determined by its mo-
lecular weight) of PET scrap determines its later use. The plastic scrap is used to produce
packaging materials such as bottles, containers and fibres. Fibres are used in the textile
industry and often they are mixed with other natural and synthetic fibres.
Figure 1.3 Contaminants and their effects on chain scission during mechanical recy-
cling4
The repeated recycling of thermoplastics results in the loss of mechanical proper-
ties due to the degradation processes occurring during processing and use.10 Thermal-,
thermo-oxidative- and hydrolytic degradation processes are most likely to degrade PET
and other polycondensates.26–28 Certain type of contaminants can enhance, catalyze the
scission of the polymeric backbone (Figure 1.3)4, thus lowering the molecular weight of
the plastic. Any residual impurities, Brønsted acids, and bases can catalyze the hydrolysis
of PET to creating carboxylic acid and 2-hydroxyethyl terminated lower molar weighed

Introduction
11
PET derivates. Ethylene vinyl acetate and adhesives derive from the soda, beverage bottle labels. The thorough cleaning and washing of the waste plastic remove most of these
components from the bottles. The separation of PET and poly(vinyl chloride) (PVC) from
mixed plastic waste is rather difficult and almost impossible to achieve complete separa-
tion.16,19,29–31 The degradation of PVC and the dehydrochlorination is unavoidable at
higher temperatures.32–34 Therefore, the forming of hydrochloric acid can easily break
ester bonds at the processing temperatures and degrade PET. The thermal ageing leads
generally to two main kinds of structural changes: changes in lateral groups (hydroxyl
and carboxylic group formation), and modification of molecular structure (chain scission,
-branching, -extension and cross-linking). These changes even at low conversion rates
significantly decrease the viscosity in molten state fractural behaviour.10 Although the
changes in lateral groups mostly affect the optical and electrical properties that derive from the formation of chromophore groups. The chain scission reactions cause the pro-
duction of aldehydes, formates, carboxylic acids and vinyl-esters. If these derivates form
near the chain ends they might form low molar weight volatile compounds such as carbon
dioxide and -monoxide, methane, ethylene, benzaldehyde, formaldehyde, and acetalde-
hyde.
To counter the effects of degradation solid state polycondensation and chain ex-
tenders are used the increase melt strength during processing and facilitate further pro-
cessing. Solid state polycondensation is carried out at 210-240 °C in vacuum to forward
the reaction of terminal functional groups and remove volatile side products. Chain ex-
tenders such as glycidyl-ethers are used to increase the molar weight of the plastic melt
by extension and/or branching of the polymeric backbones.5,35,36
Nevertheless, mechanical recycling is one of the economically most favorable ways to recycle thermoplastic polymer waste. It is relatively simple, and it uses already
well-established technologies. Beside incineration and energy recovery mechanical recy-
cling is the most prevailing technique to recycle. Chemical recycling in comparison is
still in its infancy in practical use.
1.1.2. Incineration for energy production
Incineration is one of the easiest ways to deal with waste materials. There is almost
no need to separate the waste materials or even treat them to remove contaminants. Since
the separation of plastics is the most expensive part of all the recycling technologies in-
cineration will be the most cost efficient as long as a separation maintains its high price.37 In some cases, mechanical recycling is not an option, some materials cannot be efficiently
separated, too heavily degraded or hazardous to recycle.12,38–40 Hospitals and other medi-
cal faculties produce million tons of medical waste a year, just the USA produces 3.5
million tons a year.41 Most of the medical waste comes from single-use mixed plastic
equipment. Incineration is the most common way to deal with such hazardous materials,
in every other case, they must be decontaminated the minimize the potential health haz-
ard.41 Incineration is one of the most effective ways to harness any benefit from waste
materials. It significantly reduces the volume of solid wastes and it is quite profitable
since plastic waste has a high calorific value.42–44

Chapter 1
12
Incineration is the combustion of organic waste materials in a controlled environ-ment in the presence of oxygen (usually air). By the Waste Incineration Directive of the
European Union† incineration plants are required to minimize their effects on the envi-
ronment and human health from possible pollutants to air, soil, surface and ground waters.
Incomplete combustion of organic materials at relatively low temperature can result in
the production of several toxic, carcinogenic materials such as dioxins, furans, polycyclic
aromatic hydrocarbons, NOx and SOx gases and metals.45–52 PVC and other chlorine-con-
taining polymers must be incinerated at 800 °C or higher temperature to avoid the pro-
duction of dioxins.47 However, such high temperatures can only be achieved at large-scale
plants.
1.1.3. Chemical recycling
The chemical recycling of plastics aims at producing, regaining raw materials,
fuels, and chemicals from plastic waste. The following technologies were developed in
this regard: pyrolysis, fluid catalytic cracking, hydrocracking and hydro-pyrolysis, KDV
process, gasification, and solvolysis. All these processes, except solvolysis, are based on
the controlled thermal degradation of organic waste materials due to high temperatures in
an inert, oxygen-free atmosphere. The solvolysis of PET will be discussed in detail in
sub-chapter 1.2.
The thermal degradation of polymers is a combination of several processes with a
different mechanism. These mechanisms are the random scission of the polymeric back-
bone, depolymerization and elimination of low molar weight fragments.53,54 The domi-
nating degradation process is determined by the molecular structure of the polymer. Ran-dom scission of the backbone is characteristic of polyolefins. The degradation process is
statistically governed, and the polymer chain breaks up to shorter chains. The molar
weight of the polymer drastically drops. The depolymerization starts at the end of the
polymer chains and monomers eliminate step by step. The molar weight of the polymers
slowly decreases. This mechanism is characteristic of polyacetals and poly(methyl-meth-
acrylate). The elimination of lower molar weight components due to thermal degradation
is mostly associated with poly(vinyl chloride). This mechanism dominates the degrada-
tion process if the substituent of the polymeric backbone has relatively low dissociation
energy. The length of the polymeric backbone barely changes during this degradation
process, but the molecular weight decreases due to the elimination of low molar weighed
volatile compounds. The thermal degradation of polymeric materials takes place at the
300-500 °C temperature interval and is heavily influenced by the polymer type.53,54
The pyrolysis is a versatile technology that can be fine-tuned with the reaction
parameters and reactor types. The pyrolysis products can be classified into three distinct
groups: char, oils and gas. The operation temperature determines the constitution of the
end products. If the production of char and gas components is preferred, then the reaction
should be carried out higher than 500 °C. The 300-500 °C interval is recommended for
oil compounds.55 The kinetics of the reaction can be tuned by the catalyst and the used
† Directive 2000/76/EC of the European Parliament and of the Council of 4 December 2000 on the incineration
of waste (OJ L332, P91 – 111)

Introduction
13
technology to gain the desired end products. 42,55,56 Batch-, semi-batch-, continuous- (flu-idized bed, fixed-bed or conical spouted bed) reactors can be utilized as well. The prop-
erties of the plastic pyrolysis oil are comparable with gasoline and diesel. Their properties
depend on the source of waste plastic. Polyolefin-based pyrolysis oils have as high calo-
rific as gasoline and diesel (40-43 MJ/kg). PVC and PET derived pyrolysis oils have a
lower calorific value (20-30 MJ/kg). The viscosity of these oils approximates the standard
values of diesel. The char can be used as absorbents, feedstock for activated carbon pro-
duction and solid fuel. The composition of the gas compound depends on the pyrolyzed
waste material. Polyolefins barely produce volatile gas compounds (5-10%) during py-
rolysis, on the other hand, PET and PVC produce large amounts of gases (hydrogen, al-
kanes, alkenes, CO, CO2 and hydrochloric acid).55
Fluid catalytical cracking (FCC) technologies enhance the pyrolysis of waste ma-terials with narrowing the spectra of end-products and allowing the use of more moderate
reaction conditions. The product spectra can be directed to more valuable fine or com-
modity chemicals and fuels. FCC technologies can be distinguished as a liquid and vapor
phase. FCC utilizes porous solid zeolite-based catalyst such as silica-alumina (ZSM-5)
and Y-type zeolites.
Hydrocracking differs from standard cracking just in the presence of hydrogen.
Relatively high pressure of 70 atm is used for these reactions at 300-500 °C.57–59 Hy-
drocracking yields a higher-quality fuel, the formation of toxic side products in minimal-
ized or eliminated. Integrated hydro-pyrolysis and hydroconversion (IH2) is a catalytic
conversion process that is cable of turning a wide range of organic materials (organic
green waste, municipal waste, plastic waste) to fuel components. It was developed by the
Gas Technology Institute of Des Plaines (Illinois, USA). The process consists of three steps hydropyrolysis, hydroconversion, and reforming.12,60,61 Hydropyrolysis is carried
out with a fluidized bed reactor with catalyst particles at 400-500 °C at 15-35 atm. The
hydroconversion step operates at similar reaction parameters. It further reduces the oxy-
gen content of the product flow. Following the hydroconversion step the product is con-
densed and the gas stream (alkanes, alkenes, CO and CO2) is fed into a steam reformer.
IH2 is a self-maintaining due to the fact that the last reforming stage of the process pro-
duces the required amount of hydrogen for the first two steps. It has been shown to be
economically favourable due to its integrated nature, simplicity and efficiency. It inte-
grates already existing well-known technologies. This technology mostly operates with
biowaste feedstock, the use of plastic waste as a feedstock is under investigation.
KDV process (Katalytische Drucklose Verölung) or the catalytic pressure-less de-polymerization process was developed by Alphakat GmbH (Germany). This technology
is capable of removing all the oxygen content of the produced oils. Thus, the end-products
a completely compatible with the standard combustion engines regardless of the plastic
feedstock. Another advantage of the KDV process is its mild reaction conditions com-
pared to pyrolysis.12
Gasification converts almost any organic feedstock (natural gas, coal, oil, green
waste, plastic waste, etc.…) to a mixture of hydrogen, CO, CO2, methane and other hy-
drocarbons.62–65 This mixture is also known as Syngas, its quality is determined by the
ratio of its main components (H2:CO). Syngas reaction used widely used for methanol
production that is a cornerstone of organic chemical production. The type of gasification

Chapter 1
14
depends on the oxidizing medium: partial oxidation with air, partial oxidation with oxy-gen enriched air, partial oxidation with pure oxygen, by steam, and by plasma. The gasi-
fication of organic materials consists of the following steps. Heating and drying that takes
places up to 160 °C. Devolatization that takes place up to 700 °C. During this step thermal
cracking, pyrolysis of organic materials occurs and light volatile gases, tar and char are
produce. Hydrogen gas is produced from the cracking of the various organic degradation
products. The partial oxidation of the mixture allows the occurrence of exotherm reaction
that generates enough heat for the thermal cracking to occur. 12,62,66
1.2. The solvolysis of PET
The solvolysis of PET is a versatile chemical method specially designed to break
up the ester bonds in the polymeric backbone and gain terephthalic acid derivates and
ethylene-glycol (Figure 1.4). In most of the cases, the main goal of solvolysis is to utilize
its products in the polycondensation of PET. Therefore, sustainability is maintained, and
new virgin polymers are produced that have identical or better properties than the original
PET. Terephthalic acid, dimethyl-terephthalate (DMT), and BHET can be used as raw
materials for the polycondensation of PET. Terephthalic acid and dimethyl-terephthalate
are used to produce BHET via direct esterification of condensation. Then BHET is used for the polycondensation step at 280°C bellow 1 mmHg pressure.67 Thus the end-products
of hydrolysis, methanolysis and glycolysis can be directly fed to PET production.
Figure 1.4 The end-products of PET solvolysis
Several studied have focused on the optimization of the solvolysis processes to
increase the purity and yield of the reaction products. In other cases, the solvolysis prod-
ucts were repurposed to produce other valuable polymeric materials or fine chemicals.
One of the main goals in the development of solvolysis techniques is to achieve and max-
imize high yields (90%<) at mild reaction conditions. Regarding the further use of the
solvolysis products solvolysis possesses the same kind of problems as mechanical recy-
cling. A certain level of purity is required of the feedstock components, thus separation,
purification steps must be introduced into the production line. High volumes of chemicals

Introduction
15
are needed to reach high levels of yield and conversion. As a result, the solvolysis of PET is an expensive technology. In this section, we discuss the methods, reaction mechanism,
kinetics, and catalyst of PET solvolysis.
1.2.1. Solvolysis methods
The scission of ester bonds can be carried out with water, alcohols or amines and
can be classified into the following methods: hydrolysis (a), methanolysis (b), glycolysis
(c), aminolysis (d) and ammonolysis (e) (Figure 1.4).
Hydrolysis is one of the most common methods to scission ester bonds. Esters,
polyesters are hydrolyzed in water, aqueous or organic solutions to separate the organic
acid and alcohols from the ester bonds. Hydrolysis is carried out at high temperatures (190°C<) at atmospheric or higher pressures at acidic, basic or neutral pH. It is capable
of regaining high yields of terephthalic acid and ethylene-glycol from PET waste. Alt-
hough hydrolysis is a relatively simple technology, high amounts of chemicals are needed
for the purification and separation of the reaction products. Terephthalic acid must be
recrystallized in several steps and ethylene-glycol must be separated via extraction, dis-
tillation or salting out from the aqueous reaction medium.68–70 Acids and bases catalyze
the hydrolysis reaction and change the reaction mechanism. Consequently, it is a severely
expensive method that considerably relies on finding the optimal reaction parameters and
catalyst to be economically profitable. The applied concentration of acids and bases varies
with the technology and desired reaction time. With the increasing concentration of acids
or bases, the depolymerization can be carried out at a lower temperature, at relatively
milder concentration.68,71–77 Aturi et al. demonstrated the potential of solvolysis via hy-drolytic depolymerization of cross-linked unsaturated polyester resins with acetone/water
mixture. They recovered various organic compounds including the building blocks of the
unsaturated ester such as maleic anhydride, phthalic acid and propylene-glycol.78
Aqueous or organic alkaline hydroxide solutions (KOH, NaOH) are usually used
in a wide concentration range (~4-25%) for alkaline hydrolysis. The dissolved tereph-
thalic acid salts can be precipitated from the solution by acidifying the reaction mixture
after filtration. The alkaline hydrolysis is usually carried out over 100°C in atmospheric
or pressurized conditions.71–74 Phase transfer catalyst was shown to effectively enhance
PET hydrolysis and promote the use of milder reaction conditions (70-90 °C).79,80 The
cationic phase transfer catalyst, mostly quaternary ammonium salts (e.g.: trioctyl methyl
ammonium bromide) selectively adsorb to the surface of the plastic scrap and attract the hydroxyl ions. Thus, the anionic hydroxyl groups migrate to the plastic surface and hy-
drolyze the ester bonds.81 Although the phase transfer catalyst allows the use of milder
conditions, they considerably lengthen the reaction time up to 4-6 hours to reach high
yields of terephthalic acid (~90%).82
Acidic hydrolysis is usually carried out with concentrated sulfuric acid, although
other inorganic acids such as nitric acid and phosphoric acid have also been utilized as
well.68,75–77 The oxidative effect of nitric acid produces oxalic acid out of ethylene-gly-
col.77 The use of concentrated acids significantly shortens the reaction time (less, then an
hour) and lowers the reaction temperature (room temperature) and allows the reaction to
be carried out at atmospheric pressure, on the other hand, the reaction mixture becomes

Chapter 1
16
highly corrosive. Lower acid concentrations elongate the reaction even up to 6 hours and higher reaction temperature must be used (150 °C) to reach total depolymerization. At the
end of the hydrolysis, the oily viscous reaction mixture is filtered to remove the tereph-
thalic acid and other solid components. The filtrated is mixed with water, the pH level is
set to 6-13 to dissolve the terephthalic acid. Any impurities that remain in solid state or
precipitate are filtered, if necessary, the solution is treated with activated carbon to gain
a clear solution. At the last, terephthalic acid salt solution is acidified to pH 1-2 to precip-
itate the organic acid. The terephthalic acid washed and dried.76,82 Ethylene-glycol can be
removed from the filtrates via extraction with trichloroethylene or salting out with sodium
sulfate.
Neutral hydrolysis process is carried out with water or steam at 2-300 °C at 1-4
MPa pressure, despite its name around 3.5-4 pH levels.83,84 The acid pH is sad to be the results of the water-soluble monoesters of terephthalic acid and ethylene-glycol. The high
reaction temperature in the melting range of PET results in relatively quick reactions
(~1 hour). Terephthalic acid precipitates from the reaction mixture and it can be easily
filtered at the end of the reaction. Compared to alkaline and acidic hydrolysis neutral
hydrolysis yields terephthalic acid with lower purity.85 Solid contaminants and residual
PET particles must be removed from the product so it can be utilized as higher quality
material.
Methanolysis yields dimethyl-terephthalate (DMT) and ethylene-glycol (EG) as
end-products. It is usually carried out at a high temperature at the 100-300 °C interval at
high pressures, even at super critical conditions.70,86–88 Transesterification catalyst such
as metal salts are usually applied to enhance the reaction at mild conditions. The reaction mixture must be cooled down at the end of the reaction otherwise the transesterification
of the dimethyl-terephthalate starts to occur. Dimethyl-terephthalate precipitates from the
cooled down reaction mixture and it can be easily filtered. Methanolysis can be carried
out in a batch and continuous reaction setups as well.85 Side-products such as co-esters
with ethylene-glycol, dimers and oligomers could also be found in the reaction product
depending on the depolymerization parameters. Yang et al. have shown that the yield
significantly increases with increasing the weight ratio of the methanol and PET. Above
1:6 weight ratio the increase moderates. Increase in reaction temperature and pressure
considerably enhances the reaction rate and shortens the reaction time. Yang et al. have
shown that at 250°C 11 MPa PET methanolysis takes circa 40 minutes to reach near
100%. Meanwhile, Mishra et al. performed methanolysis at much milder conditions bel-low the critical point of methanol at 120 °C 7-9 atm (0.7-0.9 MPa) and reach the same
yield after 120-150 minutes.70,88
Glycolysis is usually carried out with diols such as ethylene-glycol, diethy-
lene-glycol, propylene-glycol. Any kind of diol could be utilized in this reaction, never-
theless, ethylene-glycol (EG) is the most important since it yields bis(2-hydroxy-
ethyl)-terephthalate (BHET). Glycolysis can be carried out at high temperatures (160-
300 °C), ambient or higher pressures, even in or near supercritical conditions.89,90 At the
end of the reaction the BHET it extracted with boiling hot water and recrystallized. Higher
molar weighed side products remain in the organic phase. The organic phase (EG) is usu-
ally purified via extraction or distillation. The mayor difference between methanolysis
and glycolysis comes from the bishydroxyl functionality of the reagents. Any component

Introduction
17
with hydroxyl groups could participate in the transesterification reaction, even oligomers or the final monomer, product. As a results 100% yield of BHET selectivity is rarely
achieved, an equilibrial mixture of BHET, dimers and even longer oligomers make up the
depolymerization products. Consequently, developing new, advanced catalyst became the
most frequently researched aspects of PET glycolysis to increase the monomer yield.90–96
The advancements in catalyst development will be thoroughly discussed in subsection
1.2.2. Without a catalyst, glycolysis is slow and has a poor yield. Güçlü et al. investigated
the possibility of solvent assisted glycolysis with xylene.97 The purpose of xylene was to
selectively dissolve the glycolysis products from the ethylene glycol phase to shift the
reaction towards depolymerization. The extensive use of xylene resulted in an even more
expensive technology with severe health hazard, hence, became a dead end in PET gly-
colysis.
PET glycolysis derivates are versatile materials that could be used as building
blocks in various products beside PET. The use of these materials was thoroughly inves-
tigated in numerous projects in cross-linked systems such as unsaturated resins, polyols
for polyurethanes, alkyd resins, epoxy resins.98,99,108–110,100–107 Cross-linked systems will
be further discussed in subchapter 1.3.
Initially aminolysis was only used to treat the surface of PET fibres to enhance the
compatibility with the matrix component. It was carried out with dilute aqueous amine
solutions at mild conditions.111,112 Compared to the previously discussed hydrolysis and
transesterification based techniques aminolysis is thermodynamically more favorable due
to the more nucleophile nature amines.113 These reactions can be carried out at ambient
conditions. Tawfik et al. ingeniously demonstrated this via using open-air sand-baths at
the hot summer months in Egypt.114 At these conditions the depolymerization takes sev-eral weeks and catalyst are crucial to reach high yields. At higher temperature, the reac-
tion time significantly shortens, although catalyst is still necessary for high yields.115 PET
aminolysis requires catalyst similar/identical to glycolysis and follows the same trends
concerning the effects of synthesis parameters on the rate of the reaction.
Any amine functional organic molecule could be used for aminolysis as long as it
is in a liquid phase at the reaction conditions. Although bi or polyfunctional amines are
preferred over mono functional amines since they could be further modified via the re-
sidual functional groups. Given the versatility of amine reagents aminolysis products can
be finely tailored for numerous applications. Terephthalamides are highly sought materi-
als that could be used to produce high temperature resistant polyamides, polyimines, pol-
yureas, polyurethanes and epoxy hardeners.115 Natarajan et al used N,N’-bis(2-hydroxy-ethyl)-terephthalamide to produce biodegradable polyesters-amides that could be used in
bone regeneration and controlled drug release.116 Beside polymeric materials several
unique uses were developed. Parab et al. and More et al. synthesized biesters of N,N’-
bis(2-hydroxyethyl)-terephthalamide and tested them as plasticizers in PVC. The synthe-
sized plasticizers were comparable with commercial compounds such as dioctyl
phthalate.117,118 Palenkar et al. used PET derived terephtalic-dihydrazide to produce het-
erocyclic bis-1,3,4-oxadiazole, bis-1,2,4-triazole and 4-thiazolidinone derivates that
showed moderate antibacterial activity.119 In a separate study Palenkar et al. synthesized
several azo-dyes from terephtalic-dihydrazide that showed moderate light and excellent
wash fastness on polyester and nylon fabrics.120

Chapter 1
18
Ammonolysis can be carried out with the aqueous solution or anhydrous ammonia at mild conditions, even at room temperature. The use of aqueous ammonia results in the
production of terephthalamide and ethylene-glycol. Depending on the mildness of the
conditions it could take 40-50 days to approximate full conversion.121–123 The tereph-
thalamide is insoluble in the reaction mixture, therefore it can be easily filtered and re-
crystallized to reach the desired purity levels. Pyrolytic dehydration can be used to pro-
duce terephthalonitrile that can be converted to p-xylylenediamine or 1,4-bis(ami-
noethyl)cyclohexane.124
1.2.2. Mechanism and reaction kinetics
Figure 1.5 The general mechanism of organocatalyzed PET solvolysis based on the
mechanism published by Horn et al.113
Poly(ethylene terephthalate) (PET) is the polyester of terephthalic acid and eth-
ylene-glycol, by doing so it shows the characteristic reactions of esters. The scission of ester bonds can be carried out with the hydrolysis (uncatalyzed, base or acid catalyzed);
transesterification with alcohols; and amidation with ammonia or amines. The mechanism
of these reactions is similar: addition-elimination nucleophilic substitution (Figure 1.5).
The electrophile hydrogen of the catalyst molecule (marked as H) connects to the oxygen
atom of the carboxyl group allows the nucleophilic attack of the reagent molecule on the
carbon atom of the carboxyl group. The hydrogen atom of the reagent molecule (~XH)
connects to the nucleophilic atom of the catalyst molecule. As the bond between the nu-
cleophilic X atom and the carboxyl carbon forms the hydrogen atom originally belonging
to the catalyst connects to the oxygen atom of the ester. The bond between the carbonyl
carbon and ester oxygen atom scissions. As a result, a 2-hydroxyethyl group terminated
PET derivate and a new PET derived acid/ester/amide, molecules are produced. The cat-alytic acceleration of the solvolysis reaction is crucial: the depolymerization can be car-
ried out at lower temperatures and shorter reaction time. The mechanism published by
Horn et al demonstrates both catalytic ways simultaneously to activate the components
of the solvolysis.113 Electrophile catalyst might coordinate with the carbonyl oxygen, nu-
cleophile catalyst coordinate with the hydrogens of the EG to enhance the nucleophile
attack.

Introduction
19
Figure 1.6 Reaction kinetics conversion data of PET glycolysis95,125
Due to the poor solubility of PET in water, alcohols and amines, the solvolysis of
PET is a heterogeneous reaction. The reaction speed considerably depends on the reaction
parameters (temperature, pressure, particle reactant ratio, catalyst), especially the reaction
temperature (Figure 1.6).92,126,127 Up to the melting point of PET, the reaction is hetero-
geneous, but as the crystalline phase melts (above 240-250 °C) the polymer dissolves in
the reaction medium and the solvolysis reaction becomes homogenous. Even below the
melting point of PET after a certain degree of conversion, the plastic dissolves in the
reaction medium.128 Most of the solvolysis reactions are carried out in the 180-210 °C
temperature interval at atmospheric pressure, bellow 170°C the conversion and reactions
rates are mostly too low for practical use. The boiling point of most solvolysis reagents is below 220°C, therefore melt phase reactions are carried out at high pressures. As a
result, the kinetic modelling of the solvolysis reactions and its dependence on reaction
parameters is still in debate. Pressurized reactors are mostly used in hydrolysis, meth-
anolysis and ammonolysis.68–71,129,130 Although, supercritical glycolysis has been investi-
gated as well.90 In most cases the increase in pressure enhances the reaction via increasing
the boiling point of the reagents. The heterogeneous reaction kinetics of PET solvolysis
has been analyzed by several authors. Changes in morphology and fragmentation were
reported; and an initial delay in the depolymerization reaction (Figure 1.6).125,131–134 The
conversion and yield levels of solvolysis products considerably decline in function of the
scrap size (Table 1.1). 70,135. Collins et al. divided the depolymerization process into four
stages: 136
• The attack on the unordered amorphous phase with no mass loss, no oli-gomer formation, just molecular weight reduction
• The continuous attack on the amorphous initiates mass loss
• Attack on the ordered non-crystalline amorphous phase
• Attack on the crystalline phase

Chapter 1
20
Table 1.1 The effect of PET scrap particle size on the PET conversion and yield of methanolysis reaction products. The methanolysis was carried out at 120°C at 5-7 atm
pressure. The samples were collected after 120 min.70
Particle size
(µm)
PET conversion
(%)
DMT yield
(%)
EG yield
(%)
50 97.8 97.64 97.62
64 97.8 97.64 97.62
90 97.8 97.64 97.62
127.5 97.8 97.64 97.62
181 81.6 81.54 81.51
256 62.4 62.36 62.33
362.5 37.1 36.86 36.82
Figure 1.7 The schematic steps of PET glycolysis with diethylene-glycol (DEG)131
The nature of this phenomenon was thoroughly investigated by Pardal and his col-
leagues. They found that the ratio of the solid phase decreases via random scission until an equilibrial molecular weight is reached. The molecular weight distribution shifts with-
out change to lower molar weights. The ratio of the amorphous phase gradually approxi-
mates zero.131 They interpreted their findings as to the following: the reactant diffuses
into the solid PET and depolymerizes it. The lower molar weight soluble components
dissolve into the reaction medium. Thus, bigger scrap particles elongate the solvolysis.
This process continues until highly crystalline microphases are obtained that will degrade
in the final step (Figure 1.7). The initial stage of the reaction greatly depends on the reac-
tion conditions. Sangalang and his coworkers reported that their studies did not fit the
exponential decrease of molecular weight via random scission (𝑀𝑛(𝑡) = 𝑀𝑎 exp(−𝑘𝑟𝑡)).
An initial period was found in both catalyzed and uncatalyzed reactions where the mo-
lecular weight stagnated.125 In their argument they stated that the statistical scission of the ester groups is based on the assumption that all ester groups are equally accessible and
reactive.
Introduction
21
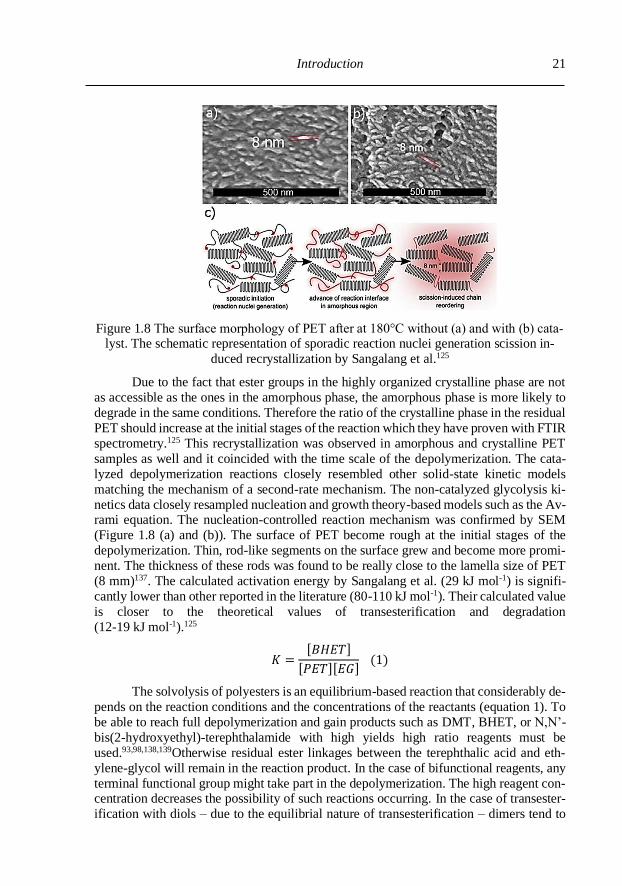
Figure 1.8 The surface morphology of PET after at 180°C without (a) and with (b) cata-lyst. The schematic representation of sporadic reaction nuclei generation scission in-
duced recrystallization by Sangalang et al.125
Due to the fact that ester groups in the highly organized crystalline phase are not
as accessible as the ones in the amorphous phase, the amorphous phase is more likely to
degrade in the same conditions. Therefore the ratio of the crystalline phase in the residual
PET should increase at the initial stages of the reaction which they have proven with FTIR
spectrometry.125 This recrystallization was observed in amorphous and crystalline PET
samples as well and it coincided with the time scale of the depolymerization. The cata-
lyzed depolymerization reactions closely resembled other solid-state kinetic models
matching the mechanism of a second-rate mechanism. The non-catalyzed glycolysis ki-
netics data closely resampled nucleation and growth theory-based models such as the Av-rami equation. The nucleation-controlled reaction mechanism was confirmed by SEM
(Figure 1.8 (a) and (b)). The surface of PET become rough at the initial stages of the
depolymerization. Thin, rod-like segments on the surface grew and become more promi-
nent. The thickness of these rods was found to be really close to the lamella size of PET
(8 mm)137. The calculated activation energy by Sangalang et al. (29 kJ mol-1) is signifi-
cantly lower than other reported in the literature (80-110 kJ mol-1). Their calculated value
is closer to the theoretical values of transesterification and degradation
(12-19 kJ mol-1).125
𝐾 =[𝐵𝐻𝐸𝑇]
[𝑃𝐸𝑇][𝐸𝐺] (1)
The solvolysis of polyesters is an equilibrium-based reaction that considerably de-
pends on the reaction conditions and the concentrations of the reactants (equation 1). To
be able to reach full depolymerization and gain products such as DMT, BHET, or N,N’-
bis(2-hydroxyethyl)-terephthalamide with high yields high ratio reagents must be
used.93,98,138,139Otherwise residual ester linkages between the terephthalic acid and eth-
ylene-glycol will remain in the reaction product. In the case of bifunctional reagents, any
terminal functional group might take part in the depolymerization. The high reagent con-centration decreases the possibility of such reactions occurring. In the case of transester-
ification with diols – due to the equilibrial nature of transesterification – dimers tend to

Chapter 1
22
form decreasing the yield of the desired monomer. Thus, coesters, dimers and oligomers will be present beside the desired end-products (Figure 1.9). Utilizing certain catalyst can
push the reaction towards depolymerization and minimize the ratio of side-products.92
They are essential in reaction parameter optimization. Nevertheless, separation steps must
be included to gain pure products regardless of the yield. In the case of aminolysis, the
equilibrium is considerably shifts towards the amidation process due to the nucleophile
nature of amines. Nevertheless, a high ratio of the amine reagent is required for these
reactions, otherwise, residual ester linkages may remain in the product (Figure 1.10).
Figure 1.9 Gel permeation chromatography (GPC) chromatogram of PET glycolysis with different molar ratios of diethylene-glycol:PET138
1800 1600 1400 1200 1000
Wavenumber (cm-1)
1:3
1:2.5
1:2
residual
ester carbonyl
Amide carbonyl
Figure 1.10 FTIR spectra of N,N’-bis(2-hydroxyethyl)-terephthalamide prepared with
different ratios of PET and ethanol-amine showing the presence of residual ester groups

Introduction
23
1.2.3. Catalyst The catalytic enhancement of solvolysis reaction has been a center of focus for the
last 20 years. Due to the cost-heavy circumstances of chemical recycling, it is essential to
optimize this process and fasten the otherwise slow and time-consuming reaction. Any
transesterification enhancing catalyst can be used for the depolymerization of PET as
well. These can be sorted into several categories such as metal salts, acids, bases, organo-
catalyst, heterogeneous catalyst and other catalyst. Several authors focused on the devel-
opment, characterization of heterogeneous catalyst. They can be easily separated from the
reaction mixture and utilized repeatably which considerably impacts the economic eval-
uation of chemical recycling. One of the greatest challenges in PET solvolysis results
from the use of ethylene-glycol and other diols for PET solvolysis. Due to the equilibrial
transesterification reaction BHET can participate in the transesterification. As a result, an equilibrium between monomer and dimer is reached at the end of the reaction, the yield
of BHET curve has a maximum in the function of reaction time.92,94 In most of the cases,
the goal of the depolymerization is to maximize the yield of the monomer. Therefore,
most catalysts were developed to enhance the reaction speed of depolymerization and
minimize the time for the 100% conversion of PET. Hence the shortened reaction time
decreases the possibility of transesterification via the hydroxyl terminated monomers,
thus preventing the monomers to turn into dimers.92
Most of the catalyst described in the following sections were tested in the glycol-
ysis with EG, thus their effectiveness will be compared via their yield to BHET produc-
tion (𝑌𝑖𝑒𝑙𝑑 = (𝑚𝑜𝑙𝑒𝑠 𝑜𝑓 𝐵𝐻𝐸𝑇) (𝑚𝑜𝑙𝑒𝑠 𝑜𝑓 𝑑𝑒𝑝𝑜𝑙𝑦𝑚𝑒𝑟𝑖𝑠𝑒𝑑 𝑃𝐸𝑇 𝑢𝑛𝑖𝑡𝑠)⁄ ) (Table
1.2). Nevertheless, the differences in the reaction parameters must be taken into account as well. These parameters are the average size and distribution of the PET scrap; the ratio
of EG; the concentration of the catalyst; reaction temperature, time and pressure; and the
design of the reactor.
The average size and distribution of the PET scrap are not necessarily addressed
in PET solvolysis studies, although it has a considerable effect on the reaction kinetics.
Most of the catalyst studies utilized ground PET powder with an average size in the mi-
cron range that is considerably smaller than the commercial scrap of soft drink bottles.
Usually, in catalyst studies, the ratio of EG is significantly higher (over 1:10) than a study
focusing on new product development and characterization (~ 1:4 – 1:7). These extremely
high ratios push the reaction towards depolymerization, although they might be too high
for practical use. Usually, the catalyst is tested in small reactions – total weight of reaction mixture is less than 30 g – therefore the effectiveness of the catalysts is still unknown
even in larger laboratory scales. The catalyst is the most expensive components in these
reactions. It is essential to recycle them and minimize their concentration. So homogenous
catalyst such as the metal salts or organocatalyst might be too expensive without binding
them to a support material. Otherwise they are too expensive to regain from the reaction
medium. The higher reaction temperature and the use of pressure can significantly shorten
the reaction time. Nevertheless, milder reaction condition is usually preferred so they
could be widely established even in industrial scales and allow the use of already existing
equipment. In conclusion, direct comparison between studies is not trivial. All parameters
must be considered to come to the right conclusions.

Chapter 1
24
Table 1.2 Comparison of transesterification catalyst in PET glycolysis. The PET:EG ratio is calculated to the molar ratio of PET repeating units and the mols of EG. The reactions
were carried out at atmospheric pressure, unless indicated otherwise. The particle size of
the PET varies in publications.
Catalyst type PET:EG
1: X
Temperature
(°C)
Time
(h:min)
Catalyst
(m/m%)
BHET
yield
(%)
Ref
No catalyst
- 16 190 40:00 - 96 139
- 30.9 190 2:00 - ~5 92
41.29 195 3:00 - 4.3 140
Metal Salts
Zn(OAc)2 6 190 8:00 0.5 67.63
141 Pb(OAc)2 6 190 8:00 0.5 65.91
NaHCO3 6 190 8:00 0.5 66.22
Na2CO3 6 190 8:00 0.5 65.43
Ti3(PO4)4 8.6 195 3:15 0.05 95.3 142
Organocatalyst
1,5,7-triazabicyclododecene 16 190 0:08 10 n/n% 94,9
139
1,8-diazabicyclo[5.4.0]
undec-7-ene 16 190 0:07:30 10 n/n% 98.9
1,5-diazabicyclo
[4.3.0]non-5-ene 16 190 0:07 10 n/n% 98.5
4-(N,N-dimethylami- no)
pyridine 16 190 1:40 10 n/n% 93.6
1,4-diazabicyclo[2.2.2]octane 16 190 2:00 10 n/n% 93.1
N-methylimidazole 16 190 5:00 10 n/n% 92.6
N,N-dimethylaniline 16 190 46:00 10 n/n% 92.4
Ionic liquids
[bmim]Cl 10 190 8:00 13.8 83 143
[bmim]Cl 10 190 2:00 5 6 126
[bmim]OH 10 190 2:00 5 70
[bmim]2(ZnCl4) 10 170 4:00 3.9 89.5
144 [bmim]2(FeCl4) 10 170 4:00 3.9 76.4
[bmim]2(CoCl4) 10 170 4:00 3.9 89.7
Inorganic particles
ZnMn4O4 tetragonal spinel 11.5 260 (0.5 MPa)) 2:00 1 92.3 145
CoMn2O4 tetragonal spinel 11.5 260 (0.5 MPa)) 2:00 1 89
Supermagnetic γ Fe2O3 10.3 300 (1.1 MPa) 1:00 1 ~90 94
Fe3O4 31 190 2:00 5 ~60 92
Protonated titanate nanotube 4 196 3:00 1 88 146
(Mg-Zn)-Al hydrotalcites 10 196 2:00 1 ~75 147
SO42−/Co−Zn−O (SCZ-300) 15.5 180 3:00 0.05 75 148
Composite carbon nanoparticles
grapeneoxide-Mn3O4 A 115 300 (1.1 MPa) 1:20 0.7 95 149
Multiwalled carbon nanotube
(MWCNT) 31 190 2:00 5 ~80
92
MWNT-Fe3O4 31 190 2:00 5 100
γ-Fe2O3/N-doped graphene 41.29 195 3:00 0.6 100 140
Special catalyst
MOF ZIF8 4 196 1:30 0.16 76.75 91
Polyoxometalate
α-K6SiW11ZnO39 4 180 0:30 0.13 84.1 150
Enzymes 86 60 14 days 0.05 𝑔
𝑔 𝑃𝐸𝑇 60-70 151

Introduction
25
Metal salts are the most conventional transesterification catalyst widely utilized in PET solvolysis.128,141,142,152 Transition metals were considered most active among metal
catalyst. These metals yield circa 60-75 % BHET at the 180-190 °C range. Their effec-
tiveness may be limited at a higher temperatures. Campanelli et al. found that Zn(OAc)2
cannot enhance the reaction rate at temperatures higher than 245°C.128 Hence their widely
established use, they also serve as a reference point in new catalyst developments. Alkali
metal salts were tested as a catalyst since their extended use does not result in various
medical issues. Certain alkali salts were proven to be comparable with the heavy transi-
tion metals.141,153 Troev et al reached a seemly significant breakthrough with use of
Ti3(PO4)4 and reach exceptional yields over 90% under 4 hours reaction time.142 Troev
tested the glycolysis of fibre and bottle grade PET scrap with EG, diethylene-glycol, pro-
pylene-glycol. Troevs experiments showed a significant difference in the glycolysis of the fibre and bottle grade PET. The low molar weighed fibre grade PET yielded 96,4 even
without a catalyst while the bottle grade PET could only yield near 60-65% with catalyst.
Polyoxometalates are polyatomic ions composed of metal-oxygen clasters, with
broad applications. They have high thermal and chemical stability, high acidity, low tox-
icity, and they can take part in redox reactions. Geng et al. investigated transition metal
substituted polyoxometalates (K6SiW11MO39; M: Zn, Mn Co, Cu, Ni). The polyoxometalates
significantly shortened the depolymerization time up to 30 minutes with yields over 80%.
In addition they were able to recover the catalyst via vacuum distillation and use it over
8 cycles without loss of catalytic activity.150
Metal organic frameworks (MOF) consist of metal ions or clusters coordinated to
organic ligands. They are porous solid materials similar to zeolites with a finely-tunable
structure and active sites. Suo et al. investigated three types of self-assembly MOFS (ZIF-8, ZIF-67, and MOF-5). They have found that the ratio of the organic ligands and
the metal ions influence the specific surface area and acidity of the ZIF-8 type MOF, thus
affecting the catalytic activity of the catalyst. The higher the specific area of the MOF,
the higher the concentration of the acidic active sites, thus the more active the catalyst
becomes. The reaction time was significantly shortened to 90 minutes to reach a plateau
of 70-80% yield.91
Organocatalyst has become the focus of attention in organic chemistry in the last
15 years. One of their greatest advantages is the exchange of traditional metal catalyst,
thus contributing to green chemistry. Organocatalyst can be finely engineered for any
organic synthesis. They can even reach selectivity levels only obtainable by enzymes.154
Aminolysis and glycolysis of PET was tested with various strong base organocatalyst and demonstrated excellent selectivity and yield. Most of the catalyst in optimized concentra-
tions yielded in the 80-90% interval.93,113,115,139,155. The reaction time was significantly
shortened due to their activity. Most metal-based catalyst required at least two or three
hours to reach high conversion and yields Only polyoxometalates compare to their mag-
nitude of reaction rate. Since they are homogenous catalyst their recycling is cost heavy,
although affixing them on support could increase their already excellent potential in the
future.
Up to our knowledge enzymes were tested on few occasions in PET glycolysis.
Since enzymes cannot endure high temperatures, the reaction was carried out at mild con-
ditions with high PET:EG ratio. Despite that 60-70% BHET yield was obtained.151 All
things considered such a high yield at 60°C is a remarkable achievement in glycolysis.

Chapter 1
26
Ionic liquids are organic molten salts that have a melting point lower than 100°C. They are excellent solvents with considerable electrochemical and thermal stability, low
flammability and non-volatility. They have been considered for various uses including
catalyst.143 Ionic liquids dissolve in the liquid phase of glycolysis. They can be purified
via vacuum distillation of the residual EG. They can be recycled and used several times
without any activity loss.127,144,156 Compared to other catalyst high concentrations are nec-
essary for high yields, that might be too expensive at higher scales. Wang and his research
group were the first to publish the use of ionic liquids in PET glycolysis in 2009.143 Since
then several papers have been published concerning the development of these type of
catalyst.126,127,144,156–159 1-butyl-3-methylimidazolium chloride cation [bmim]+ derived
ionic liquids were thoroughly examined in these studies, and the effects of different ani-
ons were investigated. [bmim]Cl and [bmim]Br neutral ionic liquids (not acidic nor basic) demonstrated catalytic ability in glycolysis, although their effectiveness was limited.
Concerning their selectivity and yield of BHET they overtook the conventional metal salt,
nevertheless, long reaction times were necessary.143 Basic ionic liquids such as
[bmim]OAc and [bmim]OH exceeded the activity of [bmim]Cl and significantly reduced
the reaction time. Although only [bmim]OH was able to maintain high selectivity and
yield.126,127 Metal salt modified ionic liquids proved to have even higher activity as a cat-
alyst, especially with transition metals (Zn, Co, Mn).144,157 [bmim]2(ZnCl4) and
[bmim]2(CoCl4) yielded near 90% in similar conditions, but at a lower temperature. Alt-
hough [bmim]2(FeCl4) could only reach 70-80 % yield, they also had magnetic properties
that could significantly further the separation of the ionic liquid.157
Inorganic silicates, oxides, and other metal derivate particles are well-known cat-
alyst widely used in industrial, research and development settings as well. Since these inorganic particles do not dissolve in the reaction medium of glycolysis they can be easily
recovered from the organic phase via filtration, sedimentation or other methods. Nano-
particles are expected to be exceptionally effective due to their high specific surface and
high concentration of active sights.
Shukla et al. investigated the use of two types of zeolites: β-Zeolite Na form
(SiO2/AlO2 1:5 ratio) and Y-Zeolite (SiO2/AlO2 4:5 ratio). Their catalytic performance
heavily depended on the reagent ratio and it followed a saturation-like behavior peaking
around 70% yield (1:7 – 1:9 ratios). Their catalytic activity is comparable to metal salt at
similar reaction conditions.160 Imram et al. investigated Mn, Co, and Zn based metal oxide
nano spinels and found that mixed metal oxides exceed the catalytic activity of metal salts
and single metal-oxides. Imram attributed their enhanced activity to their greater surface area and increased the concentration of acidic active sites. They have shown that the ge-
ometrical properties of the crystalline cells in the oxides had a significant effect on the
catalytic activity that results in over 80-90% yields.145 Bartolome et al. investigated the
use of supermagnetic γ-Fe2O3 nanoparticles that allow easy recovery of the catalyst from
the reaction mixture. The super magnetic nanoparticles maintained a near 90% recovery
rate over 10 cycles and maintained their catalytic activity in yielding near 90% BHET.94
Both Imram and Bartolome performed glycolysis in pressurized reactors at high temper-
ature that significantly accelerated the depolymerization, as a result their exact effectivity
at milder conditions is unknown (180-190 °C, 0.1 MPa). Based on the work of Al-Sabagh
et al. with Fe3O4 magnetic nanoparticles, their efficiency is probably better than metal
salts.92 Sodium and protonated titanate nanotubes are a cost-efficient and relatively easy

Introduction
27
to make. Compared to other metal oxides it demonstrated excellent efficiency even at 196°C and low PET:EG ratio.146 Compared to other catalyst titanate nanotubes are one of
the most efficient.
Solid base and acid characteristic materials have been recently investigated and
applied for transesterification and hydrolysis reactions.69,147,148,161 Both solid acids and
bases demonstrated higher catalytic activity than conventional metal salts. Solid acid cat-
alyst, sulfated oxides such as SO42−/ZnO, SO4
2−/TiO2, SO42−ZnO-TiO2, SO4
2−/Co3O4 and
SO42−/Co−Zn−O yielded in the 70-80 % range. Eshaq et al. investigated layered double
hydroxides (hydrotalcites or anionic clays). Compared to metal salts they have a higher
catalytic activity that resulted in shorter reaction times, although the reaction yield barely
rose higher than 75%.147
Figure 1.11 The proposed mechanism of synergic catalysis with Fe3O4 doped MWCNT
composite particles in PET glycolysis by Al-Sabagh.92
Carbon-based nanoparticles are exceptionally robust materials that have been
thoroughly investigated in various fields, including catalysis. Carbon nanoparticles such
as nanotubes, graphene, graphene-oxide could be modified, finely tuned for specific uses.
Via the precipitation of metal oxides on the carbon nanoparticles exceptionally active
catalyst were obtained with over 90% BHET yields.92,140,149 Park et al. utilized Mn3O4
doped graphene oxide nanocomposites in PET glycolysis and obtain a 96.4% yield at
300°C, 1.1 MPa. In comparison, Mn3O4 particles yielded 82.7 at the same conditions.149
Nabid et al used γ-Fe2O3/N-doped graphene as a catalyst at milder reaction conditions (195°C) and obtained 100% yield. Nabid and his coworkers showed that the γ-Fe2O3 par-
ticles and N-doped graphene on their own could only reach 30-40% yields.140 Al-Sabagh
et al. carried out similar experiments with multiwalled carbon nanotubes (MWCNT) and
Fe3O4 particles.92 In their case the Fe3O4 and the MWCNT reached near 60% and 80%
yields. According to the Al-Sabagh, the effectivity of these nanocomposites is the result
of a synergic effect (Figure 1.11). The EG glycol molecules interact with the carbon nano-
tubes, this way the hydrogen bonding between the EG molecules is enhanced and the
oxygen in the hydroxyl groups become more electron negative. While the metal particles

Chapter 1
28
interact with the oxygen of the carbonyl-group the more electronegative oxygen attacks the nucleophilic carbonyl carbon atom.92 Thus both the nucleophile and the electrophile
components are in an activated state via the interaction with the two catalytic components.
It must be noted that exceptionally high ratios of PET:EG were used. These types of cat-
alyst must be tested with lower ratios to correctly estimate and compare their catalytic
activity. Nevertheless, these catalysts exceed most of the previously developed catalyst.
In addition, their magnetic properties allow an easy, reliable recovery and reuse.
1.3. Application in cross-linked systems
Cross-linked systems have been in the focus of development ever since their discovety in
the 19th century. Their production essentially differs from linear polymers. The molding
of these materials takes place during the polymerization, cross-linking. Fundamentally
there are two ways to produce cross-linked structures: the cross-linking of long polymeric
chains; or to use small functional molecules to form high molecular weighed branched,
eventually cross-linked networks.162 Unsaturated resins or vulcanized rubbers are an ex-
ample of the former, while polyurethanes, phenolic-, amino-, furan- or epoxy resins are
examples of the latter.
This subchapter focuses on the design and characteristics of cross-linked systems and how do their properties depend on their production parameters. Furthermore, we discuss
the potential role of PET solvolysis derivates in these systems.
1.5.1. The connection between structure and properties
The nature, characteristics of the components just as with linear polymers deter-
mine the properties of the cross-linked systems (Figure 1.12). The structure of the poly-
meric backbone, the size of substituents and inter- and intramolecular forces between the
polymeric chains influence the relaxation capabilities of the polymeric chains, thus the
glass transition temperature. Although it must be noted that these parameters are rarely
independent of one another. Glass transition temperature (Tg) is attributed the temperature where the segments of the polymer chains – the smallest part that can move inde-
pendently – starts to move. Flexible backbone structure results in lower Tg while the
stiffer the chains becomes the higher the Tg raises as well. Smaller substituents allow an
easier relaxation of the polymeric chains, and as the size of the substituents is increased
the movement of chains is becomes impeded.163 The strength of the secondary forces
between the chains increases the barrier energy of conformation change, thus the stronger
these forces are the higher the Tg shifts. The molar weight (M) of also influences the Tg,
although it must be noted that the molar weight of commercial polymers is high enough
that it has almost no effect at all on Tg. In case of oligomers, and low molar weight poly-
mers Tg increases with M and it reaches a plateau after a critical value.164 These criteria
and observations were proven to be true in all polymeric systems, although in the case of
cross-linked materials another parameter must be taken into account: cross-link density. Cross-links between the polymeric chains can restrain the relaxation of the chains, thus
the higher the number of the cross-links the higher the Tg shifts.165 Cross-link density can
be fine-tuned via changing the length of polymeric chains between cross-link points103,109,
or changing the functionality or concentration of the cross-link forming agent166,167.

Introduction
29
Figure 1.12 The effects of molecular structure on the properties of epoxy resins168
Due to the functionality of the PET solvolysis derivates, they are mostly utilized
as building blocks for oligomeric/polymeric components in various cross-linked systems.
Via polycondensation with diacids they could be used to produce polyols (ester, ester-
amide) for polyurethanes or to produce unsaturated polyester resins comparable with
commercial products.103–110 Duque-Ingunza et al. demonstrated the effects of condensa-
tion conditions on the molecular weight distribution and how it affects the produced un-
saturated resin. They have shown, that utilizing milder conditions for the polycondensa-
tion reaction results in lower molar weigh polyesters and significantly lower Tg in the
final resin product from 120°C to 65°C.103 With changing the ratio of aromatic and ali-phatic components in the polyester chains the mechanical properties could be finely
tuned.109 Although a considerable number of studies were carried out examining the use
of PET derivates only a few of them address the sustainability of these syntheses. The
high ratio of reagents and the necessary purification steps exacerbate the cost these new
materials.
PET derivates have rarely been utilized other than a building polymeric chains,
such as forming epoxy functional resin precursors.100 Terephthalamides have been
claimed to be usable as cross-linkers before.113,115,155,169,170 Yet their use and characteris-
tics have rarely been described in practical systems. Dutt et al. experimented with PET
derived N,N-bis(2-aminoethyl)terephthalamide, but it was only usable in high cure-tem-
perature epoxy systems.171
1.5.2. The effect on reaction kinetics and conversion
Since the cross-linking and the molding take place at the same time the conversion
(α) of the cross-linking reaction considerably influences the properties of the final prod-
uct. The obtainable properties, the reaction kinetics of the cross-linking reaction substan-
tially depend on the curing parameters (Figure 1.13 b).103,172–180 The TTT diagram of a

Chapter 1
30
cross-linking system indicates the phase of matter depending on the cross-linking time and temperature. Just as the TTT diagram indicates (Figure 1.13 a) cross-linking systems
go through phase changes as reaction approximates the equilibrial rate of conversion at a
certain temperature. Since the applied reaction times are always shorter than the needed
for equilibrium, learning the change of reaction rate over the reaction time, the kinetics
of the reaction is essential.
Tg0
gel Tg
Tg
Cro
ss-l
ink
ing
Tem
per
atu
re (C
)
Log(Cross-linking Time)
Liquid
Gelation
Cross-linked glass
Elastomer
Glass
Char
Vitrification
b)a)
Sol-Gel
full cure
0 100 200 300 400 500-25
0
25
50
75
100
125
150
Gla
ss T
ran
siti
on
Tem
per
atu
re (
°C)
Reaction Time (min)
115°C
90°C
82°C
55°C
60°C
68°C
75°C
98°C
Figure 1.13 The Time-Temperature-Transformation (TTT) diagram of a cross-linked system (a). And the dependence of glass transition temperature on the curing time and
temperature of an epoxy system (b). The later diagram was digitally reproduced based
on the data published by Deng et al. Adapted with permission from Macromolecules 27,
18, 5147-5153 (1994). Copyright (1994) American Chemical Society.172
10-12
10-9
10-6
10-3
100
103
106
109
1012
0.0
2.0x10⁷
4.0x10⁷
6.0x10⁷
8.0x10⁷
1.0x10⁸
1.2x10⁸
0.00
0.65
0.71
1.00
Rel
axat
ion
Sp
ektr
um
(P
a)
Reduced Time (s)
0.0 0.2 0.4 0.6 0.8 1.010
-11
10-8
10-5
10-2
101
104
107
1010
1013
EPON 862/W
Hercules 3501-6
Pea
k r
elax
atio
n t
ime
(s)
Conversion (-)
a) b)
Figure 1.14 Relaxation spectrum (a) and peak relaxation time of a curing epoxy sys-
tems.173 The parameter on (a) is the conversion. The diagrams were digitally reproduced
based on the data published by O’Brien et al. Adapted with permission from Journal of
Composite Materials 35, 10, 833-904 (2001). Copyright (2001) SAGE journals.
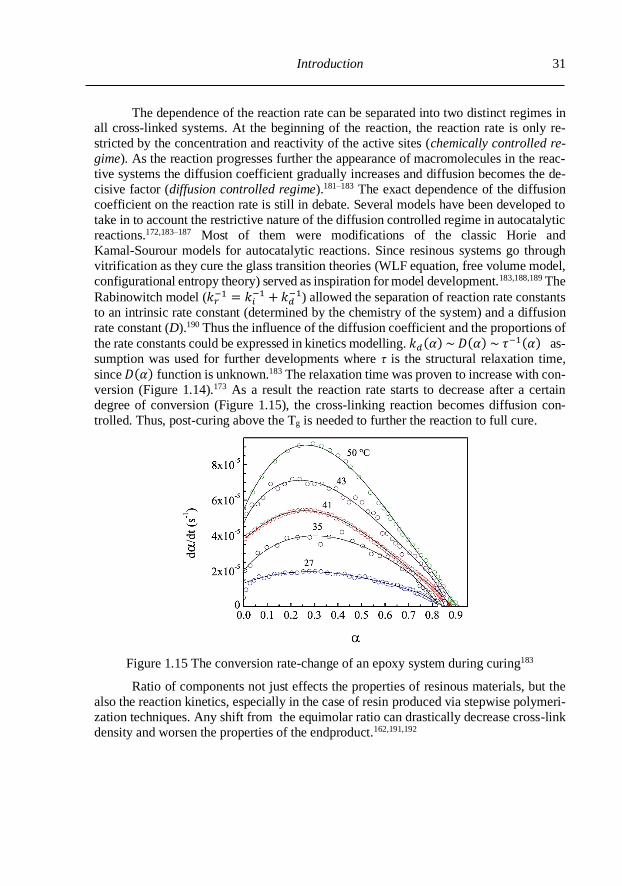
Introduction
31
The dependence of the reaction rate can be separated into two distinct regimes in all cross-linked systems. At the beginning of the reaction, the reaction rate is only re-
stricted by the concentration and reactivity of the active sites (chemically controlled re-
gime). As the reaction progresses further the appearance of macromolecules in the reac-
tive systems the diffusion coefficient gradually increases and diffusion becomes the de-
cisive factor (diffusion controlled regime).181–183 The exact dependence of the diffusion
coefficient on the reaction rate is still in debate. Several models have been developed to
take in to account the restrictive nature of the diffusion controlled regime in autocatalytic
reactions.172,183–187 Most of them were modifications of the classic Horie and
Kamal-Sourour models for autocatalytic reactions. Since resinous systems go through
vitrification as they cure the glass transition theories (WLF equation, free volume model,
configurational entropy theory) served as inspiration for model development.183,188,189 The
Rabinowitch model (𝑘𝑟−1 = 𝑘𝑖
−1 + 𝑘𝑑−1) allowed the separation of reaction rate constants
to an intrinsic rate constant (determined by the chemistry of the system) and a diffusion
rate constant (D).190 Thus the influence of the diffusion coefficient and the proportions of
the rate constants could be expressed in kinetics modelling. 𝑘𝑑(𝛼) ~ 𝐷(𝛼) ~ 𝜏−1(𝛼) as-
sumption was used for further developments where τ is the structural relaxation time,
since 𝐷(𝛼) function is unknown.183 The relaxation time was proven to increase with con-
version (Figure 1.14).173 As a result the reaction rate starts to decrease after a certain
degree of conversion (Figure 1.15), the cross-linking reaction becomes diffusion con-
trolled. Thus, post-curing above the Tg is needed to further the reaction to full cure.
Figure 1.15 The conversion rate-change of an epoxy system during curing183
Ratio of components not just effects the properties of resinous materials, but the
also the reaction kinetics, especially in the case of resin produced via stepwise polymeri-
zation techniques. Any shift from the equimolar ratio can drastically decrease cross-link
density and worsen the properties of the endproduct.162,191,192

Chapter 1
32
1.4. Scope
In previous sections, we have addressed the main characteristics and issues of plas-
tic waste recycling. Mechanical recycling is the most commonly used and cheapest way
to recycle plastic materials. It utilizes already existing and well-known techniques that
make it a favorable choice in the plastic industry. Nevertheless, the separation of the raw
plastic streams and deteriorating effects of contaminants cause a never-ending war with degradation. These issues could be managed, but after a certain number of cycles, the
waste materials cannot substitute the high-quality, virgin materials. Energy recovery
through incineration can deal with any type or quality of plastic waste. Up to this date is
it still an economically favorable way to deal with waste materials. It can completely
exclude the expensive purification and separation of the waste stream. In certain cases, it
is the only way to deal with waste streams such as contaminated medical wastes. Unfor-
tunately, smaller incineration plants cannot reach high enough temperatures to exclude
the possibility of producing toxic, carcinogenic volatile compounds. In addition, incin-
eration does not contribute to a circular, greener economy.
Chemical recycling, on the other hand, could maintain a circular economy via re-
gaining the building blocks of the waste materials. These building blocks could be utilized
to reproduce high-quality plastics, resins or other fine chemicals. Solvolysis of waste plastics especially PET has become one of the main focuses of green chemistry. Over 30
years of research and development lead to the discovery of exceptional solvolysis catalyst
and engineering new, highly valued specialized products. The high volumes of chemicals
needed for the depolymerization, then the separation and purification of the end-products
considerably increase the cost of recycling. In the case of reproducing PET, these purifi-
cation steps are necessary, but they might not need be in the case of other products such
as cross-linked systems. In our investigations represented in this thesis, we investigated
the use of raw solvolysis products. Our goal was to engineer reactive systems where there
is no need, or it might be even advantageous to exclude the purification of the solvolysis
products. We utilized the theoretical minimum of reagents to reach 100% depolymeriza-
tion of the original PET to reduce, minimize the volume of needed chemicals.
In standard glycolysis, the reaction mixture reaches an equilibrial constitution of
bishydroxy esters of terephthalic acid, its dimers, oligomers and residual diol which in-
cludes the eliminated EG. In most of the cases, dimers and oligomers are discarded. Since
glycolysis with a low ratio of diol yields in a wide range of molecular weigh the end-
product is inhomogeneous. To deal with this issue we decided to introduce diacids into
the depolymerization reaction to incorporate low molar weight volatile components and
produce oligoesters. In Chapter 2 we experimented with this technique, acido-alcoholy-
sis and compared it conventional glycolysis and acidolysis (transesterification with ac-
ids). The results confirmed our assumptions but have given no explanation about the fine
molecular structure of the depolymerization products. In the next Chapter 3 of our in-
vestigation concerning acido-alcoholysis we carried out two series reactions in a similar
fashion to thoroughly characterize the reaction products and to find a connection between structure and properties. A straightforward connection was found between the applied
ratio of diacid and the properties of the depolymerization product that allowed us to fine
tune the end-products. One-pot type depolymerization and polycondensation reactions
were engineered based on our findings.

Introduction
33
In the following sections we attempted find a potential use for raw aminolysis
products. Raw aminolysis products of PET consist of terephthalamides, the eliminated
EG from PET and residual amines that were used as a reagent. Amine functional com-
pounds are well known for their use as epoxy cross-linkers, and as a matter of fact, hy-
droxyl functional compounds are capable of catalyzing the curing of epoxy resins with
amines.193 Thus all the components in raw aminolysis products could fulfil a purpose in
epoxy curing. The aminolysis reactions were carried out with a well-known amine cross-
linker, isophorondiamine. In Chapter 4 our goal was to design a cross-linker system with
the raw aminolysis product that could be processed at lower temperatures. The aminolysis
product was dissolved in isophorondiamine and a solution series was designed to inves-
tigate the effects of the aminolysis product on the curing and the viscoelastic properties. Gelation and DSC studies indicated a significant accelerative effect on epoxy curing that
we further investigated in Chapter 5. A thorough characterization was carried concerning
the aminolysis products with NMR and MALDI-TOF. The effects of reagent ratio on the
molecular weight of the oligoamides were investigated. The accelerative effects of the
aminolysis products on epoxy curing was investigated with DSC reaction kinetics and
computational chemistry studies.
Chapter 6 contains a standalone study independent of the previous chapters con-
cerning the solvolysis of PET. We have synthesized aliphatic random polyester amides
and characterized their molecular structure and thermal and crystalline properties. We
have investigated the effects of small substituents on the fine structure of the produced
polyester amides with NMR. And we have given a possible explanation of the formation
of different crystalline phases in random polyester amides. This study served us as the cornerstone in learning the fine structure characterization of oligomers and polymers with
NMR combined combined other techniques.
In Chapter 7 we summarized the main results concluded in the previously chap-
ters without going into specific details. This chapter is restricted to present a summary of
our work as thesis points.

Chapter 1
34
1.6 References
1 S. Huysman, J. De Schaepmeester, K. Ragaert, J. Dewulf and S. De Meester,
Resour. Conserv. Recycl., 2017, 120, 46–54.
2 R. Geyer, J. R. Jambeck and K. L. Law, Sci. Adv., 2017, 3, 25–29.
3 H. Zhang and Z. Wen, Waste Manag., 2014, 34, 987–998.
4 H. J. Koo, G. S. Chang, S. H. Kim, W. G. Hahm and S. Y. Park, Fibers Polym., 2013, 14, 2083–2087.
5 S. Makkam and W. Harnnarongchai, Energy Procedia, 2014, 56, 547–553.
6 F. Welle, Resour. Conserv. Recycl., 2011, 55, 865–875.
7 N. Malik, P. Kumar, S. Shrivastava and S. B. Ghosh, Int. J. Plast. Technol., 2017,
21, 1–24.
8 S. H. Park and S. H. Kim, Fash. Text., 2014, 1, 1.
9 B. A. Hegberg, W. H. Hallenbeck and G. R. Brenniman, Resour. Conserv.
Recycl., 1993, 9, 89–107.
10 L. K. Nait-Ali, X. Colin and A. Bergeret, Polym. Degrad. Stab., 2011, 96, 236–
246.
11 J. Hopewell, R. Dvorak and E. Kosior, Philos. Trans. R. Soc. B Biol. Sci., 2009,
364, 2115–2126. 12 K. Ragaert, L. Delva and K. Van Geem, Waste Manag., 2017, 69, 24–58.
13 P. Zhao, J. Xie, F. Gu, N. Sharmin, P. Hall and J. Fu, Waste Manag., 2018, 76,
46–54.
14 D. Froelich, E. Maris, N. Haoues, L. Chemineau, H. Renard, F. Abraham and R.
Lassartesses, Miner. Eng., 2007, 20, 902–912.
15 G. Gao, A. Turshatov, I. A. Howard, D. Busko, R. Joseph, D. Hudry and B. S.
Richards, Adv. Sustain. Syst., 2017, 1, 1600033.
16 F. Burat, A. Güney and M. Olgaç Kangal, Waste Manag., 2009, 29, 1807–1813.
17 G. Wu, J. Li and Z. Xu, Waste Manag., 2013, 33, 585–597.
18 I. I. Inculet, G. S. P. Castle and J. D. Brown, Part. Sci. Technol., 1998, 16, 91–
100. 19 J. Drelich, T. Payne, J. H. Kim, J. D. Miller, R. Kobler and S. Christiansen,
Polym. Eng. Sci., 1998, 38, 1378–1386.
20 N. Singh, D. Hui, R. Singh, I. P. S. Ahuja, L. Feo and F. Fraternali, Compos. Part
B Eng., 2017, 115, 409–422.
21 A. M. Al-Sabagh, F. Z. Yehia, G. Eshaq, A. M. Rabie and A. E. ElMetwally,
Egypt. J. Pet., 2015, 25, 53–64.
22 I. A. Ignatyev, W. Thielemans and B. Vander Beke, ChemSusChem, 2014, 7,
1579–1593.
23 E. Fekete, E. Földes and B. Pukánszky, Eur. Polym. J., 2005, 41, 727–736.
24 B. Imre, K. Renner and B. Pukanszky, Express Polym. Lett., 2014, 8, 2–14.
25 J. Maris, S. Bourdon, J. M. Brossard, L. Cauret, L. Fontaine and V. Montembault,
Polym. Degrad. Stab., 2018, 147, 245–266. 26 B. . Holland and J. . Hay, Polymer (Guildf)., 2002, 43, 1835–1847.
27 G. Montaudo, C. Puglisi and F. Samperi, Polym. Degrad. Stab., 1993, 42, 13–28.
28 D. N. Bikiaris and G. P. Karayannidis, Polym. Degrad. Stab., 1999, 63, 213–218.
29 G. A. Marques and J. A. S. Tenório, Waste Manag., 2000, 20, 265–269.
30 C. H. Park, H. S. Jeon, H. S. Yu, O. H. Han and J. K. Park, Environ. Sci. Technol.,
Introduction
35
2008, 42, 249–255. 31 C. H. Park, H. S. Jeon and J. K. Park, J. Hazard. Mater., 2007, 144, 470–476.
32 H. M. Zhu, X. G. Jiang, J. H. Yan, Y. Chi and K. F. Cen, J. Anal. Appl. Pyrolysis,
2008, 82, 1–9.
33 I. C. McNeill, L. Memetea and W. J. Cole, Polym. Degrad. Stab., 1995, 49, 181–
191.
34 J. Yu, L. Sun, C. Ma, Y. Qiao and H. Yao, Waste Manag., 2016, 48, 300–314.
35 L. Incarnato, P. Scarfato, L. Di Maio and D. Acierno, Polymer (Guildf)., 2000,
41, 6825–6831.
36 F. Daver, R. Gupta and E. Kosior, J. Mater. Process. Technol., 2008, 204, 397–
402.
37 R. H. J. M. Gradus, P. H. L. Nillesen, E. Dijkgraaf and R. J. van Koppen, Ecol. Econ., 2017, 135, 22–28.
38 B. K. Lee, M. J. Ellenbecker and R. Moure-Eraso, Waste Manag., 2002, 22, 461–
470.
39 B. K. Lee, M. J. Ellenbecker and R. Moure-Ersaso, Waste Manag., 2004, 24, 143–
151.
40 D. Makajic-Nikolic, N. Petrovic, A. Belic, M. Rokvic, J. A. Radakovic and V.
Tubic, J. Clean. Prod., 2016, 113, 365–373.
41 E. S. Windfeld and M. S. L. Brooks, J. Environ. Manage., 2015, 163, 98–108.
42 J. Walendziewski and M. Steininger, Catal. Today, 2001, 65, 323–330.
43 P. T. Williams and E. A. Williams, Energy & Fuels, 1999, 13, 188–196.
44 O. Eriksson and G. Finnveden, Energy Environ. Sci., 2009, 2, 907–914.
45 S. M. Al-Salem, P. Lettieri and J. Baeyens, Waste Manag., 2009, 29, 2625–2643. 46 J. Weinberg, P. Orris, M. McCally and J. Thornton, Public Health Rep., 1996, I,
298–313.
47 R. De Sun, H. Irie, T. Nishikawa, A. Nakajima, T. Watanabe and K. Hashimoto,
Polym. Degrad. Stab., 2003, 79, 253–256.
48 C. T. Li, H. K. Zhuang, L. Te Hsieh, W. J. Lee and M. C. Tsao, Environ. Int.,
2001, 27, 61–67.
49 I. Martín-Gullón, M. Esperanza and R. Font, J. Anal. Appl. Pyrolysis, 2001, 58–
59, 635–650.
50 M. Y. Wey and C. L. Chang, Polym. Degrad. Stab., 1995, 48, 25–33.
51 R. Verma, K. S. Vinoda, M. Papireddy and A. N. S. Gowda, Procedia Environ.
Sci., 2016, 35, 701–708. 52 H. K. Webb, J. Arnott, R. J. Crawford and E. P. Ivanova, Polymers (Basel)., 2013,
5, 1–18.
53 S. Fairgrieve, Degradation and Stabilisation of Aromatic Polyesters, iSmithers,
Shawbury, Shrewsbury, Shropshire, UK, 2009.
54 W. L. Hawkins, Polymer Degradation and Stabilization, Springer-Verlag,
Tokyo, 1984.
55 S. D. Anuar Sharuddin, F. Abnisa, W. M. A. Wan Daud and M. K. Aroua, Energy
Convers. Manag., 2016, 115, 308–326.
56 J. M. Arandes, I. Abajo, D. López-Valerio, I. Fernández, M. J. Azkoiti, M. Olazar
and J. Bilbao, Ind. Eng. Chem. Res., 1997, 36, 4523–4529.
57 W. Ding, J. Liang and L. L. Anderson, Energy & Fuels, 2002, 11, 1219–1224.
58 H. S. Joo and J. A. Guin, Energy & Fuels, 2002, 11, 586–592.

Chapter 1
36
59 John W. Ward, Fuel Process. Technol., 1993, 35, 55–85. 60 T. L. Marker, L. G. Felix, M. B. Linck and M. J. Roberts, Environ. Prog. Sustain.
Energy, 2012, 31, 191–199.
61 T. L. Marker, L. G. Felix, M. B. Linck, M. J. Roberts, P. Ortiz-Toral and J.
Wangerow, Environ. Prog. Sustain. Energy, 2014, 33, 762–768.
62 M. L. Mastellone, L. Zaccariello and U. Arena, Fuel, 2010, 89, 2991–3000.
63 M. Miranda, I. Gulyurtlu, I. Cabrita, F. Pinto, C. Franco and R. N. Andre, Fuel,
2002, 81, 291–297.
64 C. Wu and P. T. Williams, Int. J. Hydrogen Energy, 2010, 35, 949–957.
65 R. Xiao, B. Jin, H. Zhou, Z. Zhong and M. Zhang, Energy Convers. Manag.,
2007, 48, 778–786.
66 U. Arena, Waste Manag., 2012, 32, 625–639. 67 K. Pang, R. Kotek and A. Tonelli, Prog. Polym. Sci., 2006, 31, 1009–1037.
68 US3952053, 1976.
69 X.-K. Li, H. Lu, W.-Z. Guo, G.-P. Cao, H.-L. Liu and Y.-H. Shi, AIChE J., 2015,
61, 200–214.
70 S. Mishra and A. S. Goje, Polym. Int., 2003, 52, 337–342.
71 GB822834, 1959.
72 A. Launay, F. Thominette and J. Verdu, Polym. Degrad. Stab., 1994, 46, 319–
324.
73 S. Singh, S. Sharma, A. Umar, S. K. Mehta, M. S. Bhatti and S. K. Kansal, J.
Nanosci. Nanotechnol., 2018, 18, 5804–5809.
74 A. Oku, L. Hu and E. Yamada, J. Appl. Polym. Sci., 1996, 63, 595–601.
75 S. Mishra, A. S. Goje and V. S. Zope, Polym. Plast. Technol. Eng., 2003, 42, 581–603.
76 US4355175, 1981.
77 T. Yoshioka, N. Okayama and A. Okuwaki, Ind. Eng. Chem. Res., 1998, 37, 336–
340.
78 K. R. Arturi, H. U. Sokoli, E. G. Søgaard, F. Vogel and S. Bjelić, J. Clean. Prod.,
2018, 170, 131–136.
79 M. B. Polk, L. L. Leboeuf, M. Shah, C.-Y. Won, X. Hu and W. Ding, Polym.
Plast. Technol. Eng., 1999, 38, 459–470.
80 V. A. Kosmidis, D. S. Achilias and G. P. Karayannidis, Macromol. Mater. Eng.,
2001, 286, 640.
81 H. J. Glatzer and L. K. Doraiswamy, Chem. Eng. Sci., 2000, 55, 5149–5160. 82 G. P. Karayannidis and D. S. Achilias, Macromol. Mater. Eng., 2007, 292, 128–
146.
83 US5095145, 1992.
84 US4605762, 1986.
85 D. Paszun and T. Spychaj, Ind. Eng. Chem. Res., 1997, 36, 1373–1383.
86 EP0857715A1, 1998.
87 US3403115, 1968.
88 Y. Yang, Y. Lu, H. Xiang, Y. Xu and Y. Li, Polym. Degrad. Stab., 2002, 75,
185–191.
89 R. López-Fonseca, I. Duque-Ingunza, B. de Rivas, L. Flores-Giraldo and J. I.
Gutiérrez-Ortiz, Chem. Eng. J., 2011, 168, 312–320.

Introduction
37
90 M. Imran, B.-K. Kim, M. Han, B. G. Cho and D. H. Kim, Polym. Degrad. Stab., 2010, 95, 1686–1693.
91 Q. Suo, J. Zi, Z. Bai and S. Qi, Catal. Letters, 2017, 147, 240–252.
92 A. M. Al-Sabagh, F. Z. Yehia, D. R. K. K. Harding, G. Eshaq and A. E.
ElMetwally, Green Chem., 2016, 18, 3997–4003.
93 C. Jehanno, I. Flores, A. P. Dove, A. J. Müller, F. Ruipérez and H. Sardon, Green
Chem., 2018, 20, 1205–1212.
94 L. Bartolome, M. Imran, K. G. Lee, A. Sangalang, J. K. Ahn and D. H. Kim,
Green Chem., 2014, 16, 279–286.
95 R. López-Fonseca, I. Duque-Ingunza, B. de Rivas, S. Arnaiz and J. I. Gutiérrez-
Ortiz, Polym. Degrad. Stab., 2010, 95, 1022–1028.
96 F. Liu, X. Cui, S. Yu, Z. Li and X. Ge, J. Appl. Polym. Sci., 2009, 114, 3561–3565.
97 G. Güçlü, A. Kaşgöz, S. Özbudak, S. Özgümüş and M. Orbay, J. Appl. Polym.
Sci., 1998, 69, 2311–2319.
98 M. Patel, J. Patel and V. Sinha, Polym. Int., 2006, 55, 1315–1322.
99 X. Luo and Y. Li, J. Polym. Environ., 2014, 22, 318–328.
100 P. Czub, Polym. Adv. Technol., 2009, 20, 183–193.
101 Ç. Çam, A. Bal and G. Güçlü, Polym. Eng. Sci., 2015, 55, 2519–2525.
102 P. M. Spasojević, V. V. Panić, J. V. Džunuzović, A. D. Marinković, A. J. J.
Woortman, K. Loos and I. G. Popović, RSC Adv., 2015, 5, 62273–62283.
103 I. Duque-Ingunza, R. López-Fonseca, B. de Rivas and J. I. Gutiérrez-Ortiz, J.
Mater. Cycles Waste Manag., 2013, 15, 256–263.
104 R. J. Lozano-Escárcega, M. G. Sánchez-Anguiano, T. Serrano, J. Y. Chen and I. Gómez, Polym. Bull., 2018, 38, 538–554.
105 H. M. Naguib and X. H. Zhang, Polym. Test., 2018, 69, 450–455.
106 S. M. Cakić, I. S. Ristić, D. T. Stojiljković, N. N. Nikolić, B. Ž. Todorović and
N. V. Radosavljević-Stevanović, Polym. Bull., , DOI:10.1007/s00289-018-2429-
4.
107 R. Shamsi and G. Mir Mohamad Sadeghi, RSC Adv., 2016, 6, 38399–38415.
108 Y. Dang, X. Luo, F. Wang and Y. Li, Waste Manag., 2016, 52, 360–366.
109 K. Puangsansuk, M. Opaprakasit, W. Udomkichdecha and P. Potiyaraj, J. Polym.
Environ., 2009, 17, 65–70.
110 K. Guo and C. C. Chu, J. Polym. Sci. Part A Polym. Chem., 2007, 45, 1595–1606.
111 S. A. Holmes, J. Appl. Polym. Sci., 1996, 61, 255–260. 112 Y. Zhu, Z. Mao and C. Gao, RSC Adv., 2013, 3, 2509–2519.
113 H. W. Horn, G. O. Jones, D. S. Wei, K. Fukushima, J. M. Lecuyer, D. J. Coady,
J. L. Hedrick and J. E. Rice, J. Phys. Chem. A, 2012, 116, 12389–12398.
114 M. E. Tawfik, N. M. Ahmed and S. B. Eskander, J. Appl. Polym. Sci., 2011, 120,
2842–2855.
115 K. Fukushima, J. M. Lecuyer, D. S. Wei, H. W. Horn, G. O. Jones, H. A. Al-
Megren, A. M. Alabdulrahman, F. D. Alsewailem, M. A. McNeil, J. E. Rice and
J. L. Hedrick, Polym. Chem., 2013, 4, 1610–1616.
116 J. Natarajan, G. Madras and K. Chatterjee, ACS Appl. Mater. Interfaces, 2017, 9,
28281–28297.
117 A. P. More, R. A. Kute and S. T. Mhaske, Iran. Polym. J. (English Ed., 2014, 23,
59–67.

Chapter 1
38
118 Y. S. Parab, P. A. Wasekar, S. T. Mhaske and S. R. Shukla, Polym. Bull., 2014, 71, 2695–2707.
119 V. S. Palekar, A. J. Damle and S. R. Shukla, Eur. J. Med. Chem., 2009, 44, 5112–
5116.
120 V. S. Palekar, N. D. Pingale and S. R. Shukla, Color. Technol., 2010, 126, 86–
91.
121 A. Jain and R. K. Soni, J. Polym. Res., 2007, 14, 475–481.
122 A. Mittal, R. K. K. Soni, K. Dutt and S. Singh, J. Hazard. Mater., 2010, 178,
390–396.
123 P. Gupta and S. Bhandari, in Recycling of Polyethylene Terephthalate Bottles,
Elsevier, 2019, pp. 109–134.
124 EP0365842A3, 1989. 125 A. Sangalang, L. Bartolome and D. H. Kim, Polym. Degrad. Stab., 2015, 115,
45–53.
126 Q. F. Yue, C. X. Wang, L. N. Zhang, Y. Ni and Y. X. Jin, Polym. Degrad. Stab.,
2011, 96, 399–403.
127 A. M. Al-Sabagh, F. Z. Yehia, A.-M. M. F. Eissa, M. E. Moustafa, G. Eshaq, A.-
R. M. Rabie and A. E. ElMetwally, Ind. Eng. Chem. Res., 2014, 53, 18443–
18451.
128 J. R. Campanelli, M. R. Kamal and D. G. Cooper, J. Appl. Polym. Sci., 1994, 54,
1731–1740.
129 Q. Liu, R. Li and T. Fang, Chem. Eng. J., 2015, 270, 535–541.
130 Y. Liu, M. Wang and Z. Pan, J. Supercrit. Fluids, 2012, 62, 226–231.
131 F. Pardal and G. Tersac, Polym. Degrad. Stab., 2006, 91, 2840–2847. 132 F. Pardal and G. Tersac, Polym. Degrad. Stab., 2007, 92, 611–616.
133 H. Kurokawa, M. A. Ohshima, K. Sugiyama and H. Miura, Polym. Degrad. Stab.,
2003, 79, 529–533.
134 M. E. Viana, A. Riul, G. M. Carvalho, A. F. Rubira and E. C. Muniz, Chem. Eng.
J., 2011, 173, 210–219.
135 A. S. Goje and S. Mishra, Macromol. Mater. Eng., 2003, 288, 326–336.
136 M. J. Collins, S. H. Zeronian and M. L. Marshall, J. Macromol. Sci. Part A -
Chem., 1991, 28, 775–792.
137 Z. Xia, H. J. Sue, Z. Wang, C. A. Avila-Orta and B. S. Hsiao, J. Macromol. Sci.
- Phys., 2001, 40 B, 625–638.
138 G. P. Karayannidis, D. S. Achilias, I. D. Sideridou and D. N. Bikiaris, Eur. Polym. J., 2005, 41, 201–210.
139 K. Fukushima, D. J. Coady, G. O. Jones, H. A. Almegren, A. M. Alabdulrahman,
F. D. Alsewailem, H. W. Horn, J. E. Rice and J. L. Hedrick, J. Polym. Sci. Part
A Polym. Chem., 2013, 51, 1606–1611.
140 M. R. Nabid, Y. Bide, N. Fereidouni and B. Etemadi, Polym. Degrad. Stab., 2017,
144, 434–441.
141 S. R. Shukla and K. S. Kulkarni, J. Appl. Polym. Sci., 2002, 85, 1765–1770.
142 K. Troev, G. Grancharov, R. Tsevi and I. Gitsov, J. Appl. Polym. Sci., 2003, 90,
2301–2301.
143 H. Wang, Y. Liu, Z. Li, X. Zhang, S. Zhang and Y. Zhang, Eur. Polym. J., 2009,
45, 1535–1544.
Introduction
39
144 Q. Wang, Y. Geng, X. Lu and S. Zhang, ACS Sustain. Chem. Eng., 2015, 3, 340–348.
145 M. Imran, D. H. Kim, W. A. Al-Masry, A. Mahmood, A. Hassan, S. Haider and
S. M. Ramay, Polym. Degrad. Stab., 2013, 98, 904–915.
146 G. R. Lima, W. F. Monteiro, C. M. Scheid, R. A. Ligabue and R. M. C. Santana,
Catal. Letters, 2019, 149, 1415–1426.
147 G. Eshaq and A. E. Elmetwally, J. Mol. Liq., 2016, 214, 1–6.
148 M. Zhu, Z. Li, Q. Wang, X. Zhou and X. Lu, Ind. Eng. Chem. Res., 2012, 51,
11659–11666.
149 G. Park, L. Bartolome, K. G. Lee, S. J. Lee, D. H. Kim and T. J. Park, Nanoscale,
2012, 4, 3879–85.
150 Y. Geng, T. Dong, P. Fang, Q. Zhou, X. Lu and S. Zhang, Polym. Degrad. Stab., 2015, 117, 30–36.
151 A. M. de Castro and A. Carniel, Biochem. Eng. J., 2017, 124, 64–68.
152 M. Ghaemy and K. Mossaddegh, Polym. Degrad. Stab., 2005, 90, 570–576.
153 S. R. Shukla and A. M. Harad, J. Appl. Polym. Sci., 2005, 97, 513–517.
154 B. List, Chem. Rev., 2007, 107, 5413–5415.
155 C. Jehanno, M. M. Pérez-Madrigal, J. Demarteau, H. Sardon and A. P. Dove,
Polym. Chem., 2019, 10, 172–186.
156 A. M. Al-Sabagh, F. Z. Yehia, A. M. F. Eissa, M. E. Moustafa, G. Eshaq, A. M.
Rabie and A. E. Elmetwally, Polym. Degrad. Stab., 2014, 110, 364–377.
157 H. Wang, R. Yan, Z. Li, X. Zhang and S. Zhang, Catal. Commun., 2010, 11, 763–
767.
158 J. Chen, J. Lv, Y. Ji, J. Ding, X. Yang, M. Zou and L. Xing, Polym. Degrad. Stab., 2014, 107, 178–183.
159 Z. Ju, W. Xiao, X. Lu, X. Liu, X. Yao, X. Zhang and S. Zhang, RSC Adv., 2018,
8, 8209–8219.
160 S. R. Shukla, V. Palekar and N. Pingale, J. Appl. Polym. Sci., 2008, 110, 501–
506.
161 M. Zhu, S. Li, Z. Li, X. Lu and S. Zhang, Chem. Eng. J., 2012, 185–186, 168–
177.
162 L. E. Nielsen, J. Macromol. Sci. Part C, 1969, 3, 69–103.
163 X. Yu, J. Jia, S. Xu, K. U. Lao, M. J. Sanford, R. K. Ramakrishnan, S. I.
Nazarenko, T. R. Hoye, G. W. Coates and R. A. DiStasio, Nat. Commun., 2018,
9, 2880. 164 R. B. Beevers, J. Polym. Sci. Part A Gen. Pap., 1964, 2, 5257–5265.
165 H. Stutz, K.-H. ‐H Illers and J. Mertes, J. Polym. Sci. Part B Polym. Phys., 1990,
28, 1483–1498.
166 Y. Wang, S. Wang, C. Bian, Y. Zhong and X. Jing, Polym. Degrad. Stab., 2015,
111, 239–246.
167 J. Wan, C. Li, Z. Y. Bu, C. J. Xu, B. G. Li and H. Fan, Chem. Eng. J., 2012, 188,
160–172.
168 P. Edward M., Epoxy Adhesive Formulations, McGraw-Hill Education, 1.
edition., 2005.
169 N. D. Pingale and S. R. Shukla, Eur. Polym. J., 2009, 45, 2695–2700.
170 R. V. Shah, V. S. Borude and S. R. Shukla, J. Appl. Polym. Sci., 2013, 127, 323–
328.

Chapter 1
40
171 K. Dutt and R. K. Soni, Int. J. Plast. Technol., 2014, 18, 16–26. 172 Y. Deng and G. C. Martin, Macromolecules, 1994, 27, 5147–5153.
173 D. J. O’Brien, P. T. Mather and S. R. White, J. Compos. Mater., 2001, 35, 883–
904.
174 Y. K. Kim and S. R. White, Polym. Eng. Sci., 1996, 36, 2852–2862.
175 M. Lu, S. Kim, Y. Wu and S. Feng, J. Appl. Polym. Sci., 2001, 80, 1052–1057.
176 K. Nalampang and A. F. Johnson, Polymer (Guildf)., 2003, 44, 6103–6109.
177 X. Ramis and J. M. Salla, J. Polym. Sci. Part B Polym. Phys., 1997, 35, 371–388.
178 J. L. Vilas, J. M. Laza, M. T. Garay, M. Rodríguez and L. M. León, J. Appl.
Polym. Sci., 2001, 79, 447–457.
179 J. L. Vilas, J. M. Laza, M. T. Garay, M. Rodríguez and L. M. León, J. Polym. Sci.
Part B Polym. Phys., 2001, 39, 146–152. 180 C. D. Han and D.-S. Lee, J. Appl. Polym. Sci., 1987, 33, 2859–2876.
181 M. R. Kamal and S. Sourour, Polym. Eng. Sci., 1973, 13, 59–64.
182 Y. Deng and G. C. Martin, Macromolecules, 1994, 27, 5141–5146.
183 S. Corezzi, D. Fioretto, G. Santucci and J. M. Kenny, Polymer (Guildf)., 2010,
51, 5833–5845.
184 K. Horie, I. Mita and H. Kambe, J. Polym. Sci. Part A-1 Polym. Chem., 1969, 7,
2561–2573.
185 M. R. Kamal, Polym. Eng. Sci., 1974, 14, 231–239.
186 K. C. Cole, Macromolecules, 1991, 24, 3093–3097.
187 J. Fournier, G. Williams, C. Duch and G. A. Aldridge, Macromolecules, 1996,
29, 7097–7107.
188 C. W. Wise, W. D. Cook and A. A. Goodwin, Polymer (Guildf)., 1997, 38, 3251–3261.
189 Y. Meng and S. L. Simon, Thermochim. Acta, 2005, 437, 179–189.
190 E. Rabinowitch, Trans. Faraday Soc., 1937, 33, 1225.
191 M. R. Vanlandingham, R. F. Eduljee and J. W. Gillespie Jr., J. Appl. Polym. Sci.,
1999, 71, 699–712.
192 G. R. Palmese and R. L. McCullough, J. Appl. Polym. Sci., 1992, 46, 1863–1873.
193 I. T. Smith, Polymer (Guildf)., 1961, 2, 95–108.

Oligoester and polyester production via acido-alcoholysis of PET waste
41
Chapter 2
Oligoester and polyester production via acido-alcoholysis
of PET waste1
2.1. Introduction
The alcoholysis, glycolysis of PET by its nature as a transesterification reaction is
equilibrium based. Through the modification of several parameters it could be pushed to
gain terephthalic ester monomers that could be utilized in new polymer production. The
equilibrium of the reaction could be push towards the monomer production with increas-
ing the ratio of the used alcoholic reagent such as ethylene-glycol, propylene-glycol or
methanol.1–9 The production of the so-called side products of this reaction dimers, or oli-
gomers cannot be evaded, their ratio could only be minimalized. Depending on the goal
of the chemical recycling such as new PET or other terephthalic acid derivate production
the reaction can be modified. More efficient catalyst or the removal of the monomers
during the reaction and higher reagent ratios could increase the yield of the reaction10–22.
If the goal of the recycling is to gain new value-added materials, and not new PET, then
it is not inevitably needed to use these expensive methods. In most cases the oligomeric side products are discarded during the purification processes or just refed to the solvolysis
reaction system.
Figure 2.1 Glycolysis of PET
The transesterification of PET could also be done with carboxylic acids as well. It
is a classical reaction well known in organic chemistry and it could be used to break the
existing ester bonds and form new with the reagent carboxylic acid23,24. Similarly to hy-drolysis, terephthalic acid and esters of ethylene-glycol and the reagent acid are expected
to form. It has two possible routes, alkyl-oxygen and acyl-oxygen scission. Via acyl-ox-
ygen scission an anhydrite intermediate is produced that can react with an alcohol (Figure
2.2). Via the alkyl-oxygen scission the mid-product could react with any alcohol in the
reactive system to form a new ester.
1 L. Kárpáti, G. Szarka, M. Hartman and V. Vargha, Period. Polytech. Chem. Eng., 2018, 62, 336–344.
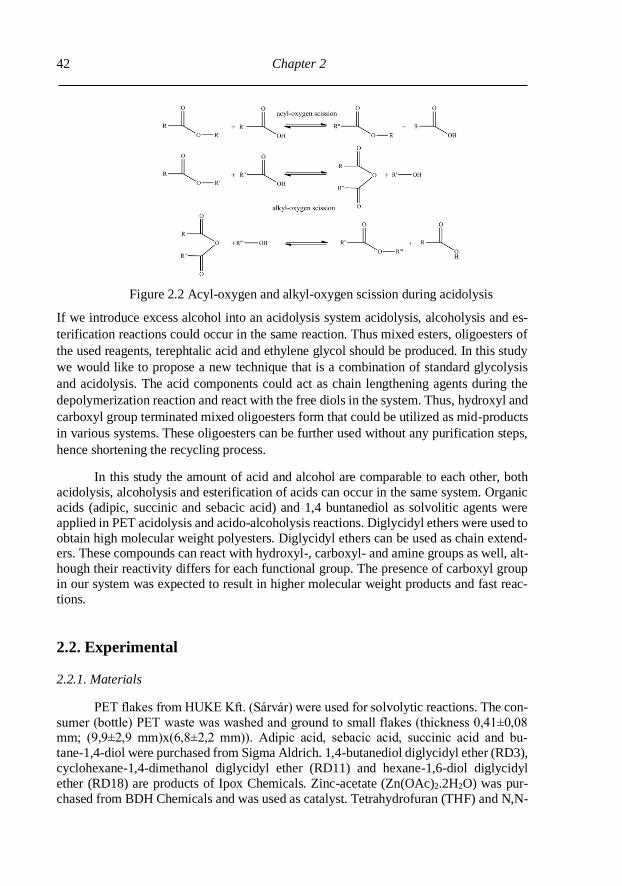
Chapter 2
42
Figure 2.2 Acyl-oxygen and alkyl-oxygen scission during acidolysis
If we introduce excess alcohol into an acidolysis system acidolysis, alcoholysis and es-
terification reactions could occur in the same reaction. Thus mixed esters, oligoesters of
the used reagents, terephtalic acid and ethylene glycol should be produced. In this study
we would like to propose a new technique that is a combination of standard glycolysis
and acidolysis. The acid components could act as chain lengthening agents during the
depolymerization reaction and react with the free diols in the system. Thus, hydroxyl and
carboxyl group terminated mixed oligoesters form that could be utilized as mid-products
in various systems. These oligoesters can be further used without any purification steps,
hence shortening the recycling process.
In this study the amount of acid and alcohol are comparable to each other, both
acidolysis, alcoholysis and esterification of acids can occur in the same system. Organic
acids (adipic, succinic and sebacic acid) and 1,4 buntanediol as solvolitic agents were
applied in PET acidolysis and acido-alcoholysis reactions. Diglycidyl ethers were used to
obtain high molecular weight polyesters. Diglycidyl ethers can be used as chain extend-ers. These compounds can react with hydroxyl-, carboxyl- and amine groups as well, alt-
hough their reactivity differs for each functional group. The presence of carboxyl group
in our system was expected to result in higher molecular weight products and fast reac-
tions.
2.2. Experimental
2.2.1. Materials
PET flakes from HUKE Kft. (Sárvár) were used for solvolytic reactions. The con-
sumer (bottle) PET waste was washed and ground to small flakes (thickness 0,41±0,08 mm; (9,9±2,9 mm)x(6,8±2,2 mm)). Adipic acid, sebacic acid, succinic acid and bu-
tane-1,4-diol were purchased from Sigma Aldrich. 1,4-butanediol diglycidyl ether (RD3),
cyclohexane-1,4-dimethanol diglycidyl ether (RD11) and hexane-1,6-diol diglycidyl
ether (RD18) are products of Ipox Chemicals. Zinc-acetate (Zn(OAc)2.2H2O) was pur-
chased from BDH Chemicals and was used as catalyst. Tetrahydrofuran (THF) and N,N-
Oligoester and polyester production via acido-alcoholysis of PET waste
43
dimethylformamide (DMF) were purchased from Molar Chemicals and were used as sol-vents. Dibuthyltin-dilaurate, perchloric-acid, methyl-cellosolve and di-n-buthylamine
were purchased from Molar Chemicals and were used for hydroxyl group measurements.
All the reagents were used without further purification.
2.2.2. PET solvolysis
All the solvolytic reactions were carried out in a 250 cm3 four-necked round bot-
tom glass flask equipped with mechanical stirrer, inert gas inlet, thermometer and reflux
condenser. All the reactions were carried out at 210 °C in argon atmosphere at atmos-
pheric pressure. All the components were weighed into the reactor at the beginning of the
reactions. The ratio of the reagents was calculated to the repeating unit of PET (192,18 g*mol-1). Acidolysis reactions were conducted with 1:1 PET:acid molar ratio with adipic
acid, succinic acid and sebacic acid . Alcoholysis reaction was carried out with 1:1
PET/alcohol molar ratio with 1,4 butanediol. Acido-alcoholysis reactions were carried
out with 1:0,5:0,5 PET:acid:alcohol molar ratio with each one of the acids and 1,4 bu-
tanediol. The complete disappearance of the PET flakes was considered as the end of the
reactions. The reaction time varied with each reaction, in average it was 1,5-2,5 hours.
2.2.3. Chain extension
Chain extension of the acido-alcoholysis products was carried out in a 250 cm3
four-necked round bottom glass flask equipped with mechanical stirrer, gas inlet, ther-
mometer and reflux condenser. The reactions were carried out at 180 °C in argon atmos-
phere. All the components were weighed into the reactor at the beginning of the reactions.
The ratio of the reagents were stoichiometric, calculated to the total functional group con-
tent (total hydroxide + total carboxyl content). 1,4 butanediol diglycidyl ether (RD3) for
all the solvolysis products. 1,4-hexanediol diglycidyl ether (RD18) and 1,4 cyclohexaned-imethanol diglycidyl ether (RD11) were only used with sebacic acid/1,4-butanediol reac-
tion product.
2.2.4. Characterization
Solubility was checked in tetrahydrofuran (THF) and in N,N-dimethylformamide
(DMF) before GPC measurements and functional group analysis. For the acid value
0,5000 g samples were dissolved in 20 cm3 THF or DMF. The samples were titrated with
0,5 M sodium hydroxide solution in methanol using phenolphthalein indicator. Hydroxyl
value was determined via a titration method. 1,5000 g of sample were dissolved in THF
or DMF. Than 10 cm3 of phenyl-isocyanate solution and 0,2 cm3 dibuthyltin-dialurate
catalyst solution was added to the solutions. After 15 minutes methyl-cellosolve and di-n-buthylamine was added. The samples were titrated with 0,5 M perchloric-acid solution
in the presence of methyl red indicator.
The FTIR spectra were recorded using a Bruker Tensor 27 FTIR spectrometer.
The wave number range was between 4000–400 cm-1, the resolution 2 cm-1, the number

Chapter 2
44
of scans was 28 with ATR, 16 with KBr pastilles. Gel permeation chromatographic (GPC) measurements were done using a Jetstream 2 plus thermostat, Waters HPCL Pump 515
and Waters Styragel HR1, 2, 4 column with tetrahydrofuran. Polystyrene standards were
used for the calibration. Perkin Elmer TGA 7 was used for thermogravimetric measure-
ments. About 10 mg of samples were weighed in and measured in purging nitrogen gas
with 10 °C min-1 heating rate up to 700 °C.
Sheets of 100x100x0.6 mm were pressed in a laboratory press at 150 °C and 150
kN for composting tests. Pressed sheets were laid in compost for 6 weeks carried out by
Zöldhíd Régio Kft (Hungary) via GoreTM Cover system. Green waste materials were
chopped up and laid down into piles and covered with a semipermeable cover. The
pressed sheets were put in nets inside the compost piles. The temperature was monitored
and controlled by the automatic ventilation system and was kept at around 75 °C. Weight
loss and fragmentation was observed after the composting period.
2.3. Results and discussion
2.3.1. Characterization of solvolysis products
4000 3600 3200 2800 1600 1200 800 400
PET:SebAc
PET:But
Inte
nsi
ty
Wavenumber (cm-1)
PET:SebAc:But
PET
Figure 2.3 PET and its solvolysis products, FTIR spectrum
The FTIR spectra of the solvolysis products with sebacic acid and/or 1,4-butanediol are represented in Figure 2.3. The measurements support that the reactions took place.
Around 3600 cm-1 wide low intensity peak appeared on the spectrum of PET waste indi-
cating the negligible presence of hydroxyl groups. CH2 valence vibration peaks at 2940
and 2850 cm-1 have shown increase in intensity compared to PET. The ester carbonyl

Oligoester and polyester production via acido-alcoholysis of PET waste
45
valence vibrations at 1721-1700 cm-1 shifted from 1712 to 1720 cm-1 indicating the ap-pearance of aliphatic ester groups. The spectrum of acidolysis products showed double
peak or at least shouldered peak for carbonyl valence vibrations. This is an indication of
the appearance of at least two kind of carbonyl compounds in the products. Changes be-
tween 1500 1300 cm-1 and 1100-900 cm-1 are observable in the IR spectrum indicating
changes in molecular structure. The differences and changes in carbonyl and hydroxyl
groups after the reactions was further studied with functional group analysis.
Acid values were measured with a standard titration procedure with NaOH solution in
THF, the OH values were measured with phenyl-isocianate method (Table 2.1). The the-
oretical values were calculated according to the added quantity of acid and/or hydroxyl
groups. Acid values in acidolysis are close to the calculated ones, while they decreased during acido-alcoholysis. The slight increase in acid value can be attributed to the for-
mation of terephthalic acid. The decrease during acido-alhoholysis can be explained by
the occurrence of esterification reaction between the diacids, diols, dimers and oligomers.
The major decrease in case of PET:SucAc can be attributed to the longer reaction time.
Compared to the other acidolysis reactions it took twice the time (~ 4 hours) for the PET
to completely disappear, thus esterification reaction had more time to occur.
White, powdery residuum was observed after dissolving our acidolysis products in THF.
The powder was filtered; washed and dried. FTIR spectra was recorded and compared to
terephthalic acid (99 %, Molar Chemicals) in KBr pastilles. The spectra were found to be
identical, thus proving the formation of terephthalic acid.
Table 2.1. Acid and hydroxyl values of PET solvolysis products
Sample
Theoretical Product
Acid value
(mmol*g-1)
OH value
(mmol*g-1)
Acid value
(mmol*g-1)
OH value
(mmol*g-1)
PET:AdAc 5.91 - 6.36 -
PET:SucAc 6.46 - 5.14 -
PET:SebAc 5.07 - 4.83 -
PET:But - 7.13 - 6.41
PET:AdAc:But 3.20 3.36 0.96 0.19
PET:SucAc:But 3.36 2.93 0.77 0.51
PET:SebAc:But 2.93 2.43 1.13 0.16
GPC measurement results of PET acidolysis and alcoholysis products are represented in
Figure 2.4 and Figure 2.5 and given in Table 2.2. THF was used as a solvent for the GPC
measurements, thus PET waste couldn’t be compared directly to the reaction products, due to its insolubility. Thus, the solubility of the reaction products proves the success in
depolyimerisation. Calibration and the comparison to solvolytic reagents were used to
determine the success of the solvolysis. The molecular mass distributions of the pure ac-
idolysis and alcoholysis products showed similarities. The gel permeation chromatograms
showed several peaks including the used solvolytic reagent (adipic-, succinic-, sebacic
acid and 1,4-butanediol). In case of acidolysis with sebacic acid (Figure 2.4 a)) a new

Chapter 2
46
peak appeared at higher retention volume, indicating a slightly lower molar weight side product than sebacic acid. According to the mechanism of acidolysis (Figure 2.2) the
possible eliminates of the reaction are terephthalic acid and ethylene glycol. We put the
chromatogram of ethylene glycol as a reference. Hence, we propose, the new peak is
attributed to the newly formed terephthalic acid. This result is explained by the fact that
the molecular weights of succinic and adipic acid are close enough to terephthalic acid to
make their peaks indistinguishable on the chromatograms. The significantly higher mo-
lecular weight of sebacic acid allowed the separation of the two acids, thus two separate
peaks appeared. Adipic acid was the only acid that remained in significant amount after
the acidolysis. The proven elimination of terephthalic acid and high amount of adipic acid
residuum could have caused acid value higher than theoretical.
Figure 2.4 b) shows a GPC chromatogram of classical glycolysis products with distinct peaks previously stated in the introduction. The peaks can be connected to oligo- and
diesters of terephthalic acid with butane-diol and ethylene glycol. A minor butane-diol
residuum can be observed as well. The oligomeric products of acido-alcoholysis (Figure
2.5) have shifted to lower retention volumes indicating an increase in molecular weight.
Residual reagents of acido-alcoholysis or any lower molar weighed components cannot
be identified in the GCP chromatograms. Most of these components were presumably
incorporated into the oligomeric chains of the reaction product. Due to the equilibrial
nature of the reaction small concentration of low molecular weighed components is ex-
pected to be present in the reaction products.
10 15 20 25 30 35
1,4-but
AdAc
SucAc
PET:Sebacic acid
PET:Succinic acid
Det
ecto
r si
gnal
Retention volume (cm3)
PET:Adipic acid
SebAcEG
(a)
10 15 20 25 30 35
(b)
PET:1,4-but
Det
ecto
r si
gnal
Retention volume (cm3)
Figure 2.4 GPC chromatogram of PET solvolysis product with sebacic-, succinic-,
adipic acid (a) and 1,4-butanediol (b)

Oligoester and polyester production via acido-alcoholysis of PET waste
47
10 15 20 25 30 35
Det
ecto
r si
gnal
Retention volume (cm3)
PET:SebAc:But
Sebacic acid
1,4-butanediol
Figure 2.5 PET solvolysis product GPC chromatogram with sebacic acid and 1,4 bu-
tanediol
Thermogravimetric analysis (TGA) further supports our statement of oligomer produc-
tion (Figure 2.6). The derivative curves (DTG) were calculated in order to determine the
changes in slope in weight loss and starting temperatures of each step. Any early weight
loss (1-2%), below 100 °C can be connected to impurities within the PET waste. Solvol-ysis with 1,4-butanediol resulted in distinct dimers and oligomers causing a constant,
multi-stepped weight loss via evaporation starting at 103 °C until it reached its thermal
degradation temperature at 312 °C than 392 °C. The acidolysis product with sebacic acid
shows a two-step degradation curve with a major change in the slope of the curve around
400 °C. In this case the first degradation step started at 265 °C, then the change of slope
occurred at 409 °C. Acido-alcoholysis products showed only one major degradation step
starting at 390 °C indicating a more uniform composition than the previously discussed
reaction products.
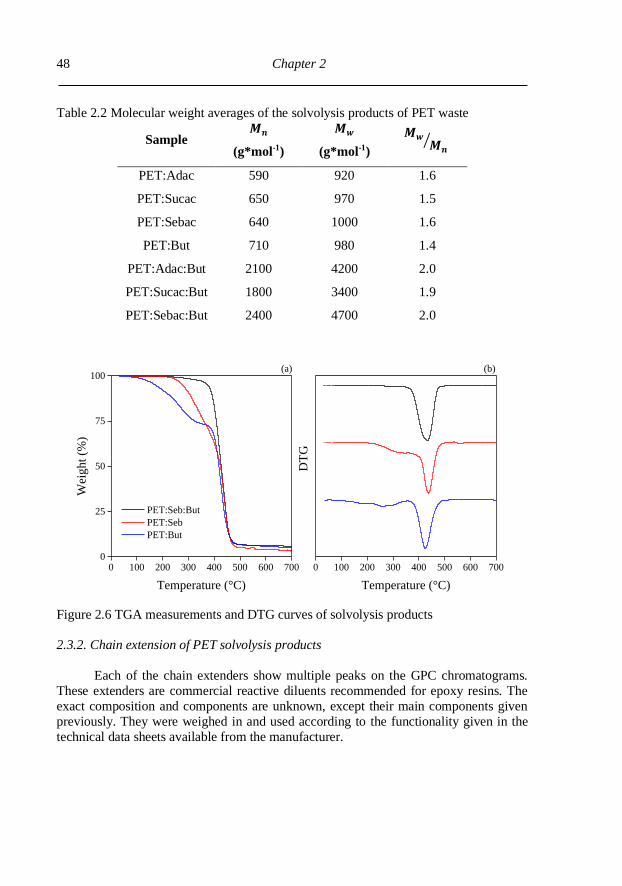
Chapter 2
48
Table 2.2 Molecular weight averages of the solvolysis products of PET waste
Sample 𝑴𝒏
(g*mol-1)
𝑴𝒘
(g*mol-1)
𝑴𝒘𝑴𝒏 ⁄
PET:Adac 590 920 1.6
PET:Sucac 650 970 1.5
PET:Sebac 640 1000 1.6
PET:But 710 980 1.4
PET:Adac:But 2100 4200 2.0
PET:Sucac:But 1800 3400 1.9
PET:Sebac:But 2400 4700 2.0
0 100 200 300 400 500 600 7000
25
50
75
100
Temperature (°C)
Wei
ght
(%)
PET:Seb:But
PET:Seb
PET:But
0 100 200 300 400 500 600 700
DT
G
Temperature (°C)
(a) (b)
Figure 2.6 TGA measurements and DTG curves of solvolysis products
2.3.2. Chain extension of PET solvolysis products
Each of the chain extenders show multiple peaks on the GPC chromatograms.
These extenders are commercial reactive diluents recommended for epoxy resins. The
exact composition and components are unknown, except their main components given
previously. They were weighed in and used according to the functionality given in the
technical data sheets available from the manufacturer.
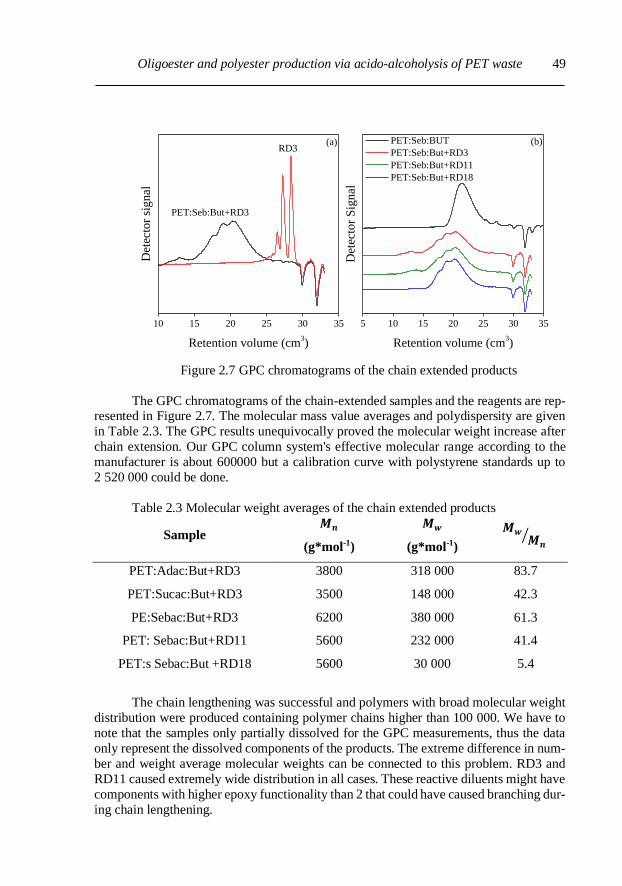
Oligoester and polyester production via acido-alcoholysis of PET waste
49
5 10 15 20 25 30 35
(a)
Det
ecto
r S
ign
alRetention volume (cm
3)
PET:Seb:BUT
PET:Seb:But+RD3
PET:Seb:But+RD11
PET:Seb:But+RD18
(b)
10 15 20 25 30 35
Det
ecto
r si
gn
al
Retention volume (cm3)
RD3
PET:Seb:But+RD3
Figure 2.7 GPC chromatograms of the chain extended products
The GPC chromatograms of the chain-extended samples and the reagents are rep-resented in Figure 2.7. The molecular mass value averages and polydispersity are given
in Table 2.3. The GPC results unequivocally proved the molecular weight increase after
chain extension. Our GPC column system's effective molecular range according to the
manufacturer is about 600000 but a calibration curve with polystyrene standards up to
2 520 000 could be done.
Table 2.3 Molecular weight averages of the chain extended products
Sample 𝑴𝒏
(g*mol-1)
𝑴𝒘
(g*mol-1)
𝑴𝒘𝑴𝒏 ⁄
PET:Adac:But+RD3 3800 318 000 83.7
PET:Sucac:But+RD3 3500 148 000 42.3
PE:Sebac:But+RD3 6200 380 000 61.3
PET: Sebac:But+RD11 5600 232 000 41.4
PET:s Sebac:But +RD18 5600 30 000 5.4
The chain lengthening was successful and polymers with broad molecular weight
distribution were produced containing polymer chains higher than 100 000. We have to
note that the samples only partially dissolved for the GPC measurements, thus the data
only represent the dissolved components of the products. The extreme difference in num-
ber and weight average molecular weights can be connected to this problem. RD3 and
RD11 caused extremely wide distribution in all cases. These reactive diluents might have
components with higher epoxy functionality than 2 that could have caused branching dur-
ing chain lengthening.

Chapter 2
50
The FTIR spectrum of a chain-extended product are shown in Figure 2.8. The FTIR diagrams prove that the diglycidyl ethers reacted with the solvolysis products. The
solvolysis products showed no traces of epoxy group. The characteristic valence vibra-
tions of epoxy groups (912 and 840 cm-1) were absent in the chain extended products.
Due to the presence of carboxyl groups the reaction with the glycidyl ethers was rather
intense. The carboxyl groups have catalytic effect in the reaction of epoxy with hydroxyl
groups [51-53].
4000 3600 3200 2800 2400 2000 1600 1200 800 400
Inte
nsi
ty
Wavenumber (1/cm)
RD3
PET:Seb:But+RD3
Epoxy group vibration
Figure 2.8 FTIR spectrum of the chain extended product
2.3.3. Composting
Figure 2.9 Composting residuum of PET:Sebacic acid:1,4-butanediol (paperclip for
scale)
The used composting method provides an insight into the practical degradability of these
materials. Naturally propagated microorganisms turned the green waste to compost and
degraded the pressed sheets. The pressed sheets were kept in nets to prevent the fragments to fall in and mix with the compost. The produced materials had a reasonable rate of
degradation and fragmentation after 6 weeks (Table 2.4). All the studied press com-
pressed plates disintegrated into small pieces (Figure 2.9). The chain extended products
showed somewhat lower degradation rate, due to their higher average molecular mass.
These degradation rates may be increased with longer composting time.

Oligoester and polyester production via acido-alcoholysis of PET waste
51
Table 2.4 Weight loss of solvolysis- and chain-extended products after compostation
Sample Weight loss in compost
(m/m %)
PET:Adac:But 50.8
PET:Sucac:But 62.0
PET:Sebac:But 51.5
PET:Adac:But+RD3 35.6
PET:Sucac:But+RD3 36.9
PET:Sebac:But+RD3 24.7
2.4. Conclusions
A new method, acido-alcoholysis was successfully developed for the chemical re-
cycling of PET. Acido-alcoholysis was investigated and proved to be efficient in incor-
porating the solvolytic agents and producing higher molecular weight oligoesters. The
GPC data suggest that both acidolysis and alcoholysis products contain the used reactants,
and consist of distinct oligoesters while in the products of acido-alcoholysis no trace of
the reagents could be detected by GPC analysis. The functional group analysis, GPC chromatograms and FTIR spectra proved the success of the depolymerization. Thermo-
gravimetry has also supported our theory on acido alcoholysis resulting in products of
more uniform structure. Semi-aromatic polyesters were prepared via chain-lengthening
with glycidyl ethers. Substantial increase in molecular weight was achieved. Reasonable
weight loss and fragmentation were observed after 6 week-long composting of poly- and
oligoesters.
Acido-alcoholysis is a new promising way to chemically recycle PET waste and
to produce higher molecular weight oligoesters. These oligoesters can be used as building
blocks for new compostable semi-aromatic polyesters. In the future, we would like to
further investigate and explore the opportunities of this method and combine it with pol-
ycondensation.

Chapter 2
52
2.5. References
1 U. R. Vaidya and V. M. Nadkarni, J. Appl. Polym. Sci., 1989, 38, 1179–1190.
2 M. Billiau-Loreau, G. Durand and G. Tersac, Polymer (Guildf)., 2001, 43, 21–
28.
3 J. Dullius, C. Ruecker, V. Oliveira, R. Ligabue and S. Einloft, Prog. Org.
Coatings, 2006, 57, 123–127. 4 F. Pardal and G. Tersac, Polym. Degrad. Stab., 2006, 91, 2567–2578.
5 I. Duque-Ingunza, R. López-Fonseca, B. de Rivas and J. I. Gutiérrez-Ortiz, J.
Chem. Technol. Biotechnol., 2014, 89, 97–103.
6 Q. Liu, R. Li and T. Fang, Chem. Eng. J., 2015, 270, 535–541.
7 H. Kurokawa, M. A. Ohshima, K. Sugiyama and H. Miura, Polym. Degrad. Stab.,
2003, 79, 529–533.
8 Y. Yang, Y. Lu, H. Xiang, Y. Xu and Y. Li, Polym. Degrad. Stab., 2002, 75,
185–191.
9 G. Colomines, J.-J. Robin and G. Tersac, Polymer (Guildf)., 2005, 46, 3230–
3247.
10 A. M. de Castro and A. Carniel, Biochem. Eng. J., 2017, 124, 64–68.
11 G. Güçlü, A. Kaşgöz, S. Özbudak, S. Özgümüş and M. Orbay, J. Appl. Polym. Sci., 1998, 69, 2311–2319.
12 Y. Dang, X. Luo, F. Wang and Y. Li, Waste Manag., 2016, 52, 360–366.
13 G. Eshaq and A. E. Elmetwally, J. Mol. Liq., 2016, 214, 1–6.
14 M. Khoonkari, A. H. Haghighi, Y. Sefidbakht, K. Shekoohi and A. Ghaderian,
Int. J. Polym. Sci., , DOI:10.1155/2015/124524.
15 A. M. Al-Sabagh, F. Z. Yehia, A. M. F. Eissa, M. E. Moustafa, G. Eshaq, A. M.
Rabie and A. E. Elmetwally, Polym. Degrad. Stab., 2014, 110, 364–377.
16 A. M. Al-Sabagh, F. Z. Yehia, D. R. K. K. Harding, G. Eshaq and A. E.
ElMetwally, Green Chem., 2016, 18, 3997–4003.
17 A. M. Al-Sabagh, F. Z. Yehia, A.-M. M. F. Eissa, M. E. Moustafa, G. Eshaq, A.-
R. M. Rabie and A. E. ElMetwally, Ind. Eng. Chem. Res., 2014, 53, 18443–18451.
18 L. Bartolome, M. Imran, K. G. Lee, A. Sangalang, J. K. Ahn and D. H. Kim,
Green Chem., 2014, 16, 279–286.
19 C. Jehanno, I. Flores, A. P. Dove, A. J. Müller, F. Ruipérez and H. Sardon, Green
Chem., 2018, 20, 1205–1212.
20 S. M. Cakić, I. S. Ristić, D. T. Stojiljković, N. N. Nikolić, B. Ž. Todorović and
N. V. Radosavljević-Stevanović, Polym. Bull., , DOI:10.1007/s00289-018-2429-
4.
21 Z. Ju, W. Xiao, X. Lu, X. Liu, X. Yao, X. Zhang and S. Zhang, RSC Adv., 2018,
8, 8209–8219.
22 Q. Suo, J. Zi, Z. Bai and S. Qi, Catal. Letters, 2017, 147, 240–252.
23 J. Koskikallio, in Carboxylic Acids and Esters (1969), John Wiley & Sons, Ltd., Chichester, UK, 1969, pp. 103–136.
24 V. D. Parker and A. W. Baker, Chem. Commun., 1968, 873, 691.

One-pot depolymerization and polycondensation of oligo- and polyesters
53
Chapter 3
One-pot depolymerization and polycondensation of PET
based random oligo- and polyesters2
3.1. Introduction
The glycolysis of poly(ethylene-terephthalate) (PET) has been the focus of numer-
ous researches for the past 40 years. A wide range of studies have been made to
optimize this reaction and gain yields as high as possible of bis(2-hydroxyethyl)-
terephthalate (BHET) or other terephthalic-acid derivate diesters 1–18. This tech-
nique allowed the recycling of PET waste that could not be further used and recy-
cled by mechanical techniques like extrusion or injection moulding 19–22. In most
cases, the primary goal of glycolysis and other techniques such as methanolysis or
hydrolysis was to reproduce PET and gain a new virgin material with identical or
better properties than the original material 23–28. Several methods like chain-exten-
sion during a reactive extrusion process were introduced the elongate the lifetime
of the PET polymer were studied and developed 29–31. But the hydrolytic or thermal
degradation processes during use and mechanical recycling inevitably degrade the
polyester to a level it cannot be used further 32–36. Thus, the solvolysis of PET,
chemical recycling, in general, should be used in a greater extent, in an industrial
scale. The glycolysis of PET is an equilibrial reaction that requires a high ratio of
diol reagent and advanced catalysts to push it towards BHET production to gain
high yields (Figure 3.1). Depending on the goal of the solvolysis the reaction pa-
rameters can be tailored to produce BHET or oligomers that could be further used
in new reactions 5,37–44. Usually, oligomers are discarded during the purification
processes, only a few studies used these or the raw solvolysis product 45–49. In most
of the cases, the purpose of glycolysis is the reproduction PET via BHET. As a
result, the development of new, more efficient and recyclable catalyst become the
focus of several research groups. Renewable heterogenous catalyst can be easily
removed from the reaction mixture, they have a high catalytic activity that easily
rival and could exceed traditional transesterification catalysts, such as metal salts. 2,4,8–10,15 The use of Fe3O4 and Fe2O3 particle based catalyst reached over 90% se-
lective BHET yields even after several uses. 8,15 The increasing efficiency of these
processes maintains, or rather furthers the sustainability of plastics. Despite these
advances, chemical recycling is still considered an expensive method due to the
high volumes of chemicals and the necessary purification steps.
2 L. Kárpáti, F. Fogarassy, D. Kovácsik and V. Vargha, Journal of Polymers and the Environment. 2019,
27 (10), 2167-2181.
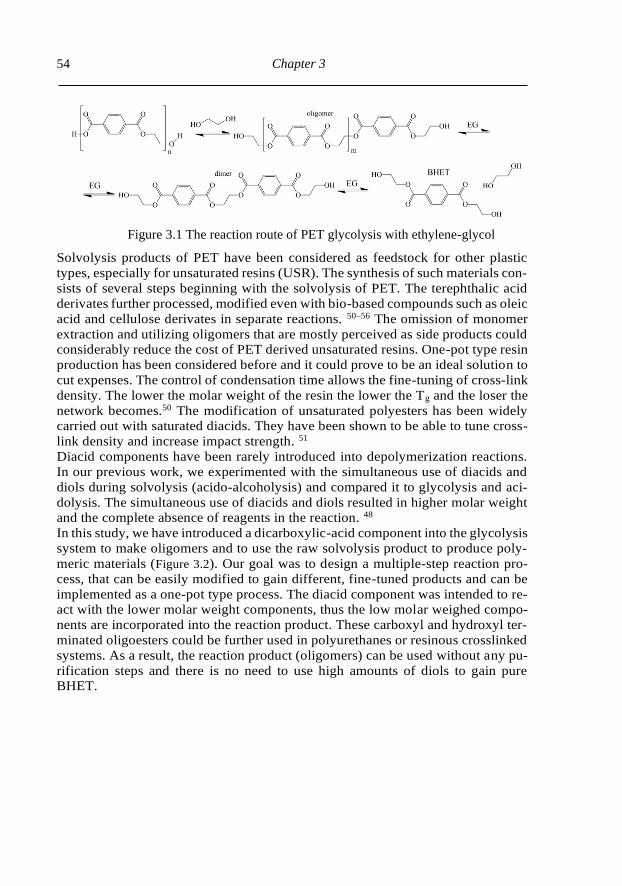
Chapter 3
54
Figure 3.1 The reaction route of PET glycolysis with ethylene-glycol
Solvolysis products of PET have been considered as feedstock for other plastic
types, especially for unsaturated resins (USR). The synthesis of such materials con-
sists of several steps beginning with the solvolysis of PET. The terephthalic acid
derivates further processed, modified even with bio-based compounds such as oleic
acid and cellulose derivates in separate reactions. 50–56 The omission of monomer
extraction and utilizing oligomers that are mostly perceived as side products could
considerably reduce the cost of PET derived unsaturated resins. One-pot type resin
production has been considered before and it could prove to be an ideal solution to
cut expenses. The control of condensation time allows the fine-tuning of cross-link
density. The lower the molar weight of the resin the lower the Tg and the loser the
network becomes.50 The modification of unsaturated polyesters has been widely
carried out with saturated diacids. They have been shown to be able to tune cross-
link density and increase impact strength. 51
Diacid components have been rarely introduced into depolymerization reactions.
In our previous work, we experimented with the simultaneous use of diacids and
diols during solvolysis (acido-alcoholysis) and compared it to glycolysis and aci-
dolysis. The simultaneous use of diacids and diols resulted in higher molar weight
and the complete absence of reagents in the reaction. 48
In this study, we have introduced a dicarboxylic-acid component into the glycolysis
system to make oligomers and to use the raw solvolysis product to produce poly-
meric materials (Figure 3.2). Our goal was to design a multiple-step reaction pro-
cess, that can be easily modified to gain different, fine-tuned products and can be
implemented as a one-pot type process. The diacid component was intended to re-
act with the lower molar weight components, thus the low molar weighed compo-
nents are incorporated into the reaction product. These carboxyl and hydroxyl ter-
minated oligoesters could be further used in polyurethanes or resinous crosslinked
systems. As a result, the reaction product (oligomers) can be used without any pu-
rification steps and there is no need to use high amounts of diols to gain pure
BHET.
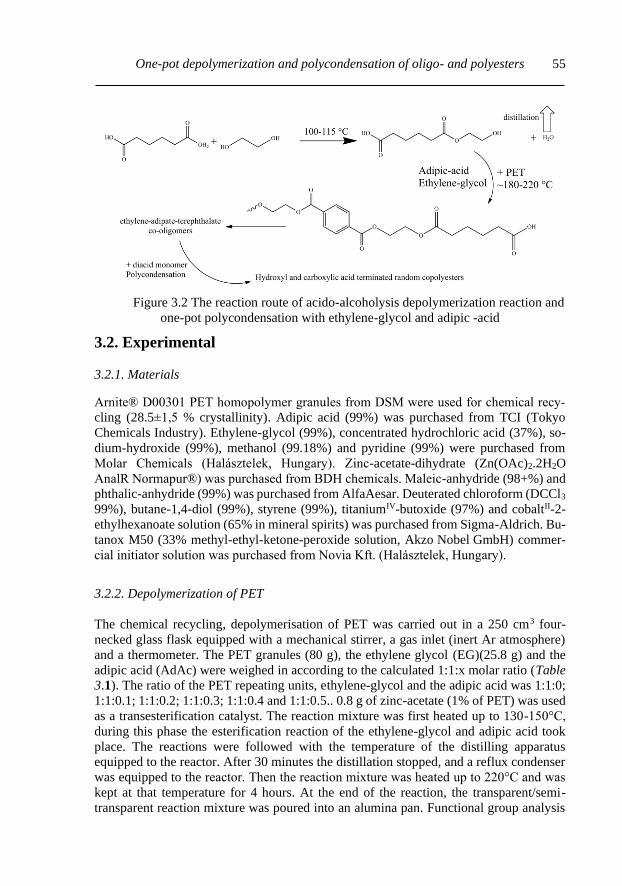
One-pot depolymerization and polycondensation of oligo- and polyesters
55
Figure 3.2 The reaction route of acido-alcoholysis depolymerization reaction and
one-pot polycondensation with ethylene-glycol and adipic -acid
3.2. Experimental
3.2.1. Materials
Arnite® D00301 PET homopolymer granules from DSM were used for chemical recy-
cling (28.5±1,5 % crystallinity). Adipic acid (99%) was purchased from TCI (Tokyo
Chemicals Industry). Ethylene-glycol (99%), concentrated hydrochloric acid (37%), so-
dium-hydroxide (99%), methanol (99.18%) and pyridine (99%) were purchased from
Molar Chemicals (Halásztelek, Hungary). Zinc-acetate-dihydrate (Zn(OAc)2.2H2O
AnalR Normapur®) was purchased from BDH chemicals. Maleic-anhydride (98+%) and
phthalic-anhydride (99%) was purchased from AlfaAesar. Deuterated chloroform (DCCl3
99%), butane-1,4-diol (99%), styrene (99%), titaniumIV-butoxide (97%) and cobaltII-2-
ethylhexanoate solution (65% in mineral spirits) was purchased from Sigma-Aldrich. Bu-
tanox M50 (33% methyl-ethyl-ketone-peroxide solution, Akzo Nobel GmbH) commer-
cial initiator solution was purchased from Novia Kft. (Halásztelek, Hungary).
3.2.2. Depolymerization of PET
The chemical recycling, depolymerisation of PET was carried out in a 250 cm3 four-
necked glass flask equipped with a mechanical stirrer, a gas inlet (inert Ar atmosphere)
and a thermometer. The PET granules (80 g), the ethylene glycol (EG)(25.8 g) and the
adipic acid (AdAc) were weighed in according to the calculated 1:1:x molar ratio (Table
3.1). The ratio of the PET repeating units, ethylene-glycol and the adipic acid was 1:1:0;
1:1:0.1; 1:1:0.2; 1:1:0.3; 1:1:0.4 and 1:1:0.5.. 0.8 g of zinc-acetate (1% of PET) was used
as a transesterification catalyst. The reaction mixture was first heated up to 130-150°C,
during this phase the esterification reaction of the ethylene-glycol and adipic acid took
place. The reactions were followed with the temperature of the distilling apparatus
equipped to the reactor. After 30 minutes the distillation stopped, and a reflux condenser
was equipped to the reactor. Then the reaction mixture was heated up to 220°C and was
kept at that temperature for 4 hours. At the end of the reaction, the transparent/semi-
transparent reaction mixture was poured into an alumina pan. Functional group analysis

Chapter 3
56
(hydroxyl and acid content) was done to determine the amount of excess amount of diacid
for the one-pot depolymerization and polymerization reaction. The reaction products
were white, soap-like materials at room temperature.
The depolymerization reaction was also carried out with butane-1,4-diol (But) with the
same molar ratios as listed before (80 g PET, 37.5 g But, x AdAc, 0.8 g Zn(OAc)2.2H2O)
and conditions as described previously. This depolymerization series was further reacted
with maleic-anhydride to gain unsaturated polyesters. The functional group content of
these products was measured. The amount of maleic-anhydride was added to reach 1:0.9
hydroxyl:acid group ratio (Table 3.1). The acid ratio was calculated from the sum of the
residual acid groups and the anhydride, that was counted as 2 acid groups. 80 g of the raw
depolymerization product was weighed in a four-necked 100 cm3 glass flask. The reaction
product was heated to 150°C to melt it, then the calculated amount of maleic-anhydride
was added to the reaction mixture. The reactor was equipped with a gas inlet (argon gas
bubbling), thermometer, distillation inlet and a mechanical mixer. The reaction mixture
was heated to 180°C and was kept there for 1 hour. The condensation was followed via
the thermometer of the distilling apparatus. The distillation usually stopped after 30
minutes. At the end of the reaction the reaction mixture was poured into an alumina pan.
It was stored in a plastic container in argon atmosphere at 5°C until further use.
Table 3.1 Feed data table of the depolymerization and the unsaturated polyester conden-
sation reactions. The weight percentages are calculated from the weight of PET (depoly-
merization) depolymerization product (PET:But:Adac x) .
Adac 0 Adac 0.1 Adac 0.2 Adac 0.3 Adac 0.4 Adac 0.5
PET:EG:Adac system
PET 80 g Zn(OAc)2 0.8 g / 1 m/m% of PET
EG 25.83 g / 32.9 m/m% of PET
AdAc 0 g 0 %
6.09 g 7.61 %
12.17 g 15.21 %
18.27 g 22.83
24.37 g 30.46 %
30.43 g 38.04%
PET:But:Adac system
PET 80 g
Zn(OAc)2 0.8 g / 1 m/m% of PET
But 37.53 g / 46,91 m/m% of PET
AdAc 0 g 0 %
6.09 g 7.61 %
12.17 g 15.21 %
18.27 g 22.83
24.37 g 30.46 %
30.43 g 38.04%
Condensation of unsaturated polyesters
PET:But:Adac x 80 g
MA 22.38 g
27.90 %
12.90 g
16.12 %
12.80 g
16.00 %
10.50 g
13.12 %
8.60 g
10.74 %
7.09 g
8.87 %
3.2.3. One-pot synthesis of saturated random polyester
The depolymerization part of the one-pot reaction was carried out as explained previ-
ously. A 1:1:0.3 ratio of PET (118.5 g), ethylene-glycol (38.30 g) and adipic acid (27.03
g) was used for this reaction. The required amount of excess adipic acid was calculated
from the depolymerization reaction series. The excess adipic acid amount was calculated
so a stoichiometric (1:1) ratio of acid and hydroxyl groups is present during the polycon-
densation. After the end of the 4-hour-long isothermal depolymerization period, the reac-
tion mixture was cooled to 110-120°C. Then 2 cm3 of TiIV-butoxide catalyst and 43.5 g

One-pot depolymerization and polycondensation of oligo- and polyesters
57
of adipic acid was added to the mixture. A distilling inlet was equipped to the reactor and
the mixture was heated to 220°C. Distillation (1 hour) was used to remove the water from
the reaction mixture. After the distillation stopped a vacuum apparatus was connected to
the reactor through a dry ice-acetone bath trap. The polycondensation reaction in a vac-
uum (100 mbar pressure) with constant argon bubbling was maintained for four hours. At
the end of the reaction, the reaction mixture was poured into an alumina pan.
3.2.4. One-pot synthesis of unsaturated random polyester
The depolymerization part of the one-pot reaction was carried out as explained
previously. A 1:1:0.4 ratio of PET (80 g), butane-1,4-diol (37.5 g) and adipic acid (6.08
g) were used for this reaction. The required amount of excess maleic-anhydride (15.11 g)
was calculated from the depolymerization reaction series. The excess maleic anhydride
amount was calculated so a near stoichiometric (1:0.9) ratio of acid and hydroxyl groups
is present during the polycondensation. After the end of the 4 hour-long isothermal de-
polymerization period, the reaction mixture was cooled to 110-120°C. Then 15.11 g of
maleic-anhydride was added to the mixture. A distilling inlet was equipped to the reactor
and the mixture was heated to 180°C. Distillation (1 hour) was used to remove the water
from the reaction mixture. At the end of the reaction, the reaction mixture was poured
into an alumina pan. The reaction mixture was kept in a closed plastic container in argon
atmosphere at 5°C until further use.
3.2.5. Preparation of unsaturated resins
The unsaturated polyester (PET:But:AdAc + MA) was weighed in a 50 cm3 four-
necked glass flask equipped with a reflux condenser, thermometer, a gas inlet (Ar atmos-
phere) and mechanical stirrer. The unsaturated polyester was heated to 180°C to gain a
homogenous melt, then it was let to cool down to 80°C. Hydroquinone (0.01%) was added
as an inhibitor and styrene (40%) were added as a reactive-solvent and cross-linker. Co-
baltII-2-ethylhexanoate solution (0.03%) was used as an activator during the crosslinking
reaction. The mixture was vigorously mixed for 30 minutes to dissolve the unsaturated
polyester in the styrene. The clear mildly pink solution was let to cool down to room
temperature. The resin solution was immediately used to mould “dogbone” shaped spec-
imens for DMA (dynamic mechanical analysis) measurements. Butanox M50 (3%)(~33%
methyl-ethyl-ketone peroxide solution) solution was used as initiator. The specimens
were cross-linked in a Heraeus® UT series drying oven at 90°C for 3 hours, then they
were heat-treated at 175°C for 1 hour.
3.2.5. Characterization
The acid content of the depolymerization products was determined with a standard
titration method. Three samples (1.5 g) were weighed into Erlenmeyer flasks on an ana-
lytical balance. 25 cm3 pyridine was used to dissolve the samples. The solutions were
heated in an oil bath (110-120°C) to dissolve the reaction products. The solutions were
let to reflux for 30 minutes. Then the samples were titrated with 0.1 M methanolic so-
dium-hydroxide solution in the presence of phenolphthalein indicator. 3 samples and a
blank-sample were titrated to calculate the residual acid content.

Chapter 3
58
Hydroxyl group content of the depolymerization products was measured with a
back-titration method. 80 g of phthalic-anhydride was weighed and 500 cm3 in pyridine
in a brown-glass flask to produce 1 M reagent solution. The mixture was stirred with a
magnetic stirrer until the phthalic-anhydride completely dissolved. The reagent solution
was let to rest for a day before use. Three samples (1.3-1.4 g) were weighed in into Er-
lenmeyer flasks. 25 cm3 1 M phthalic-anhydride in pyridine reagent solution was added
to the samples. Then the samples were heated in an oil bath (115 °C) and let to reflux for
two hours. 50 cm3 pure pyridine was added to the samples through the condensers. The
samples and a blank sample were titrated with 0.5 M aqueous sodium-hydroxide solution.
3 samples and a blank-sample were titrated to calculate the residual hydroxyl content.
An Ubbelohde type capillary viscosimeter was used to compare the intrinsic vis-
cosity of the depolymerization and the polymerization reaction products. Three samples
with 0.05 g cm-3, 0.075 g cm-3 and 0.10 g cm-3 were prepared. The samples were dissolved
in pyridine and were let to reflux at 115°C until the solutions were clear. The capillary
viscosimeter was thermostated at 75 °C during the measurements. Intrinsic viscosity was
calculated from extrapolating the relative and reduced viscosity functions to zero concen-
tration.
Bruker Tensor 27 FTIR spectrometer (ATR, 28 scans) was used to characterize
the general molecular structure of the depolymerization and the polymer samples. Bruker
Avance 500 spectrometer was used to measure the 1H NMR spectra of all the reaction
products. Bruker Avance 300 spectrometer was used to measure the 13C, DEPT, 1H 1H
COSY, 1H-1H NOESY, 1H-13C HSQC and 1H-13C HMBC spectra. The reaction products
were dissolved in deuterated chloroform (DCCl3, ~ 30 mg cm-3 concentration). The tem-
perature of acquisition was 30°C. The PET:EG:AdAc depolymerization series products
showed limited solubility on the chloroform solvent at room temperature, only 1H spec-
trum were recorded. The 2D correlative measurements were done on the one pot polyester
product. The solubility of these products increased with the increasing amount of adipic
acid used during depolymerization. The one-pot polyester (PET:EG:AdAc) product was
easily soluble in chloroform at room temperature. The PET:But:AdAc depolymerization
series and its polycondensates showed reasonable solubility in chloroform. The
PET:But:AdAc0.4 and PET:But:AdAc0.4+MA were measured with the 2D correlative
measurements.
PerkinElmer TGA 6 was used to characterize the thermal stability of the samples.
10 mg of the samples were weighed in the ceramic crucible. The sample was heated from
30 to 700 °C at 10 °C min-1 heating rate in purging nitrogen atmosphere. Then the sample
was kept at 700 °C for 10 minutes and the atmosphere was changed to oxygen to clean
the ceramic crucible.
PerkinElmer DSC 7 was used to determine the glass transition temperature and
crystallinity of the samples. Glass transition temperature was determined with a dynamic
measurement. A 3-5 mg sample was kept at -40 °C for 1 minute, then it was heated to
150°C with 20 °C min-1 heating rate. The sample was kept at 150 °C for one minute, then
it was cooled to -40 °C with 20 °C min-1. The sample was kept at -40 °C for one minute,
then it was heated to 150°C with 20 °C min-1. Glass transition temperature was determined
from the last heating period.
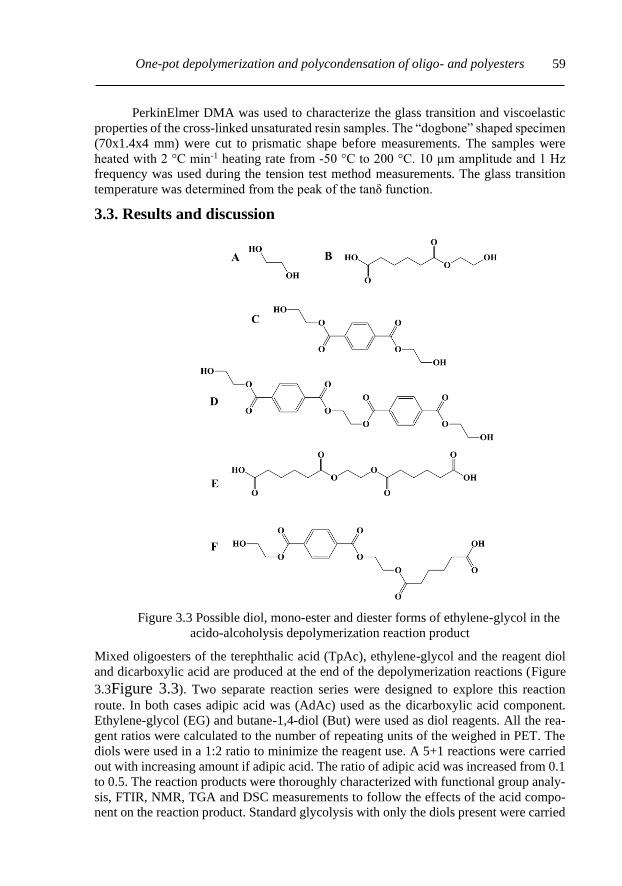
One-pot depolymerization and polycondensation of oligo- and polyesters
59
PerkinElmer DMA was used to characterize the glass transition and viscoelastic
properties of the cross-linked unsaturated resin samples. The “dogbone” shaped specimen
(70x1.4x4 mm) were cut to prismatic shape before measurements. The samples were
heated with 2 °C min-1 heating rate from -50 °C to 200 °C. 10 µm amplitude and 1 Hz
frequency was used during the tension test method measurements. The glass transition
temperature was determined from the peak of the tanδ function.
3.3. Results and discussion
Figure 3.3 Possible diol, mono-ester and diester forms of ethylene-glycol in the
acido-alcoholysis depolymerization reaction product
Mixed oligoesters of the terephthalic acid (TpAc), ethylene-glycol and the reagent diol
and dicarboxylic acid are produced at the end of the depolymerization reactions (Figure
3.3Figure 3.3). Two separate reaction series were designed to explore this reaction
route. In both cases adipic acid was (AdAc) used as the dicarboxylic acid component.
Ethylene-glycol (EG) and butane-1,4-diol (But) were used as diol reagents. All the rea-
gent ratios were calculated to the number of repeating units of the weighed in PET. The
diols were used in a 1:2 ratio to minimize the reagent use. A 5+1 reactions were carried
out with increasing amount if adipic acid. The ratio of adipic acid was increased from 0.1
to 0.5. The reaction products were thoroughly characterized with functional group analy-
sis, FTIR, NMR, TGA and DSC measurements to follow the effects of the acid compo-
nent on the reaction product. Standard glycolysis with only the diols present were carried
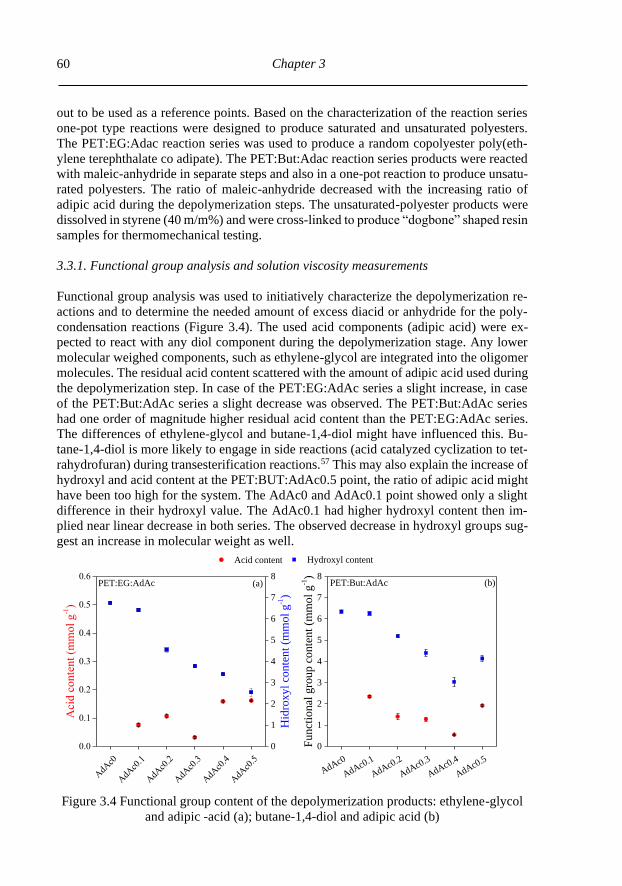
Chapter 3
60
out to be used as a reference points. Based on the characterization of the reaction series
one-pot type reactions were designed to produce saturated and unsaturated polyesters.
The PET:EG:Adac reaction series was used to produce a random copolyester poly(eth-
ylene terephthalate co adipate). The PET:But:Adac reaction series products were reacted
with maleic-anhydride in separate steps and also in a one-pot reaction to produce unsatu-
rated polyesters. The ratio of maleic-anhydride decreased with the increasing ratio of
adipic acid during the depolymerization steps. The unsaturated-polyester products were
dissolved in styrene (40 m/m%) and were cross-linked to produce “dogbone” shaped resin
samples for thermomechanical testing.
3.3.1. Functional group analysis and solution viscosity measurements
Functional group analysis was used to initiatively characterize the depolymerization re-
actions and to determine the needed amount of excess diacid or anhydride for the poly-
condensation reactions (Figure 3.4). The used acid components (adipic acid) were ex-
pected to react with any diol component during the depolymerization stage. Any lower
molecular weighed components, such as ethylene-glycol are integrated into the oligomer
molecules. The residual acid content scattered with the amount of adipic acid used during
the depolymerization step. In case of the PET:EG:AdAc series a slight increase, in case
of the PET:But:AdAc series a slight decrease was observed. The PET:But:AdAc series
had one order of magnitude higher residual acid content than the PET:EG:AdAc series.
The differences of ethylene-glycol and butane-1,4-diol might have influenced this. Bu-
tane-1,4-diol is more likely to engage in side reactions (acid catalyzed cyclization to tet-
rahydrofuran) during transesterification reactions.57 This may also explain the increase of
hydroxyl and acid content at the PET:BUT:AdAc0.5 point, the ratio of adipic acid might
have been too high for the system. The AdAc0 and AdAc0.1 point showed only a slight
difference in their hydroxyl value. The AdAc0.1 had higher hydroxyl content then im-
plied near linear decrease in both series. The observed decrease in hydroxyl groups sug-
gest an increase in molecular weight as well.
AdA
c0
AdA
c0.1
AdA
c0.2
AdA
c0.3
AdA
c0.4
AdA
c0.5
0.0
0.1
0.2
0.3
0.4
0.5
0.6PET:EG:AdAc
Acid content
Aci
d c
onte
nt
(mm
ol
g-1)
(a)
0
1
2
3
4
5
6
7
8
Hydroxyl content
Hid
roxyl
conte
nt
(mm
ol
g-1)
AdAc0
AdAc0.1
AdAc0.2
AdAc0.3
AdAc0.4
AdAc0.5
0
1
2
3
4
5
6
7
8
Funct
ional
gro
up c
onte
nt
(mm
ol
g-1)
(b)PET:But:AdAc
Figure 3.4 Functional group content of the depolymerization products: ethylene-glycol
and adipic -acid (a); butane-1,4-diol and adipic acid (b)
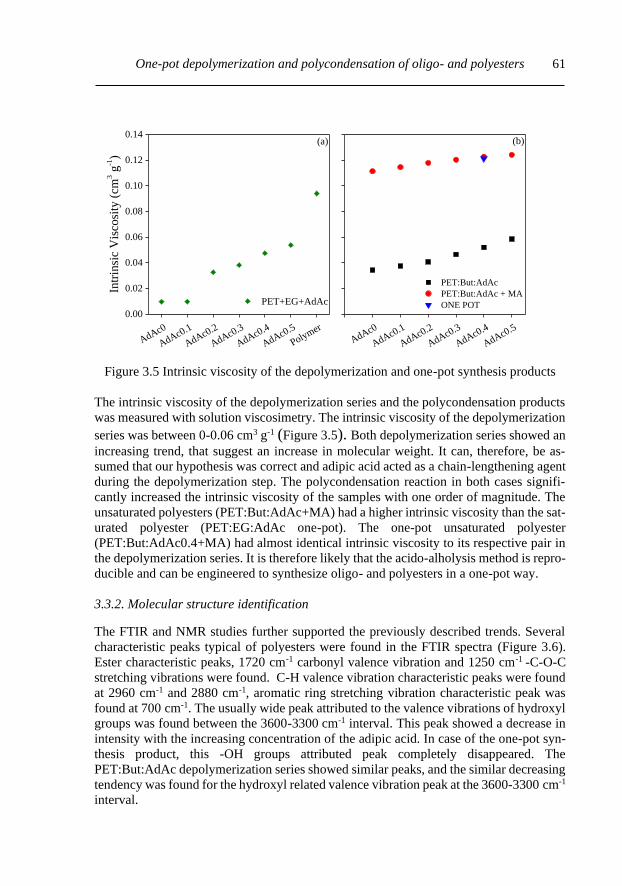
One-pot depolymerization and polycondensation of oligo- and polyesters
61
AdAc0
AdAc0.1
AdAc0.2
AdAc0.3
AdAc0.4
AdAc0.5
PET:But:AdAc
PET:But:AdAc + MA
ONE POT
(b)
AdAc0
AdAc0.1
AdAc0.2
AdAc0.3
AdAc0.4
AdAc0.5
Polymer
0.00
0.02
0.04
0.06
0.08
0.10
0.12
0.14
PET+EG+AdAc
Intr
insi
c V
isco
sity
(cm
3 g
-1)
(a)
Figure 3.5 Intrinsic viscosity of the depolymerization and one-pot synthesis products
The intrinsic viscosity of the depolymerization series and the polycondensation products
was measured with solution viscosimetry. The intrinsic viscosity of the depolymerization
series was between 0-0.06 cm3 g-1 (Figure 3.5). Both depolymerization series showed an
increasing trend, that suggest an increase in molecular weight. It can, therefore, be as-
sumed that our hypothesis was correct and adipic acid acted as a chain-lengthening agent
during the depolymerization step. The polycondensation reaction in both cases signifi-
cantly increased the intrinsic viscosity of the samples with one order of magnitude. The
unsaturated polyesters (PET:But:AdAc+MA) had a higher intrinsic viscosity than the sat-
urated polyester (PET:EG:AdAc one-pot). The one-pot unsaturated polyester
(PET:But:AdAc0.4+MA) had almost identical intrinsic viscosity to its respective pair in
the depolymerization series. It is therefore likely that the acido-alholysis method is repro-
ducible and can be engineered to synthesize oligo- and polyesters in a one-pot way.
3.3.2. Molecular structure identification
The FTIR and NMR studies further supported the previously described trends. Several
characteristic peaks typical of polyesters were found in the FTIR spectra (Figure 3.6).
Ester characteristic peaks, 1720 cm-1 carbonyl valence vibration and 1250 cm-1 -C-O-C
stretching vibrations were found. C-H valence vibration characteristic peaks were found
at 2960 cm-1 and 2880 cm-1, aromatic ring stretching vibration characteristic peak was
found at 700 cm-1. The usually wide peak attributed to the valence vibrations of hydroxyl
groups was found between the 3600-3300 cm-1 interval. This peak showed a decrease in
intensity with the increasing concentration of the adipic acid. In case of the one-pot syn-
thesis product, this -OH groups attributed peak completely disappeared. The
PET:But:AdAc depolymerization series showed similar peaks, and the similar decreasing
tendency was found for the hydroxyl related valence vibration peak at the 3600-3300 cm-1
interval.

Chapter 3
62
3900 3600 3300 3000 1800 1500 1200 900 6000.0
0.2
0.4
0.6
0.8
1.0
-C-O-C-
1250 cm-1
-CH2-
2960, 2880 cm-1
-C=O
1720 cm-1
-OH
3600-3300 cm-1
Rel
ativ
e A
bso
rban
ce
Wavenumber (cm-1)
AdAc0
AdAc0.1
AdAc0.2
AdAc0.3
AdAc0.4
AdAc0.5
Polymer
700 cm-1
Figure 3.6 FTIR ATR spectra of depolymerization reaction products
(PET:EG:AdAc 1:1:x and one-pot polymer)
NMR measurements allowed us to thoroughly characterize the depolymerization, and the
following polycondensation reaction products. 2D correlative measurements on the one-
pot polymer product were used to fully assign the peaks of the depolymerization
(PET:EG:AdAc) series 1H spectra. Adipic acid and terephthalic acid related carbonyl,
aliphatic and aromatic carbon atom signals were found in the 13C and DEPT spectra. Eth-
ylene-glycol related peaks were found in the 70-60 ppm chemical shift range. 4 separate
peaks were found that could be attributed to the diesters and mixed esters of ethylene
glycol with terephthalic acid and adipic acid (Figure 3.7). 1H spectra were quantitively
evaluated by integrating the peaks derived from the various mono- and diester forms of
ethylene-glycol (Figure 3.8, Figure 3.9). All the possible molecular structures and con-
nections are represented in Figure 3.3. All these structures were organized into three
groups: diols (EG), monoesters (Ad-CH2-CH2-OH; Tp-CH2-CH2-OH) and diesters (Ad-
CH2-CH2-Ad; Tp-CH2-CH2-Tp; Ad-CH2-CH2-Tp).
Increasing the adipic acid content during the depolymerization stage, higher molecular
weighed products were expected to appear. Inasmuch as the relative integral of diols and
monoesters related peaks showed a decreasing trend and the diester related peaks showed
an increasing trend. The slightly increasing trend of the Tp-CH2-CH2-Tp connection in-
dicates that the use of adipic acid caused a setback in the depolymerization step. The acid
component reacted with the diol and lowered its concentration. Despite that, we were able
to achieve a decent rate of depolymerization the ratio of the Tp-CH2-CH2-Tp only raised
with 10%. The appearance of adipic acid monoesters confirms our theory on the adipic
acid reacting with the ethylene-glycol at a certain degree during the first stage of the de-
polymerization reaction. Comparison of “Ad-CH2-CH2-Tp” “Ad-CH2-CH2-Ad” relative
integrals shows that the BHET derivatives have a higher reactivity than EG and its ali-
phatic monoesters. The major decrease in the ratio of “Tp-CH2-CH2-OH” structure after
the polycondensation reaction further supports this.

One-pot depolymerization and polycondensation of oligo- and polyesters
63
180 150 120 90 60 30 0
AdO-CH2-CH
2-OTp
TpO-(CH2)
2-OTp
aromatic
quaternary
carbon
~C-CH2-(CH
2)
2-CH
2-C~
aromatic carbonyl
Chemical Shift (ppm)
DCCl3
aliphatic carbonylaromatic carbon
adipic-acid
DEPT
13C
64.0 63.5 63.0 62.5 62.0 61.5
Chemical Shift (ppm)
AdO-(CH2)
2-OAd
Figure 3.7 13C and DEPT spectra of the PET:EG:AdAc 1:1:0.3 depolymerization
product
5.00 4.75 4.50 4.25 4.00 3.75 3.50
Ad-CH2-CH
2-OH
EGTp-CH2-CH
2-OH
Ad-(CH2)
2-Ad
Tp-CH2-CH
2-Ad
polymer
AdAc0.5
AdAc0.4
AdAc0.3
AdAc0.2
AdAc0.1
Chemical shift (ppm)
AdAc0
Tp-(CH2)
2-Tp
Figure 3.8 1H NMR spectra of the PET:EG:AdAc depolymerization reaction se-
ries

Chapter 3
64
0
10
20
30
40
50
60
70
HO-(CH 2
) 2-O
H
Ad-CH 2
-CH 2
-OH
Tp-CH 2
-CH 2
-OH
Ad-(CH 2
) 2-A
d
Tp-CH 2
-CH 2
-Ad
Rel
ativ
e P
eak
In
teg
ral
(%)
AdAc0.0 AdAc0.1 AdAc0.2 AdAc0.3 AdAc0.4 AdAc0.5 Polymer
Tp-(CH 2
) 2-T
p
Figure 3.9 1H NMR spectra of the PET:EG:AdAc depolymerization relative peak
integrals
These findings have an interesting implication in developing the one-pot type reactions
of this method. The quantitative analysis of the PET:EG:AdAc reaction series clearly
indicates that the depolymerization with ethylene-glycol and the condensation with adipic
acid can occur in the same system. Thus these reaction can be engineered to reach a cer-
tain, desired functional group content and molecular weight.
In accordance with the PET:EG:AdAc series, the PET:But:AdAc series showed the same
type of trends. Due to the introduction of butane-1,4-diol the NMR spectra became com-
plicated and caused overlapping in the peaks. This caused these trends to be less straight-
forward. Nevertheless, a declining tendency for most of the of monoesters correlated
peaks and an increasing tendency for the diester correlated peaks was found. The 1H NMR
spectra of the PET:But:AdAc0.5 considerably differed from the rest of the series. The
sample barely dissolved in the deuterated solvent. The relative integral of the Tp-EG-TP
linkages (BHET dimer or oligomers) is almost three times higher than the rest of the
series. This suggests the presence of longer PET derivative oligomers in the reaction
product. High-intensity peaks at the 3.7-3.6 ppm interval imply the presence of alcohol
(EG and/or But) components. These results could explain the higher than expected resid-
ual functional group content (Figure 3.4). The quantitative analysis suggests, that in this
case the ratio of adipic acid was too high. As a result, the depolymerization step couldn’t
reach the same level as the other ratios. Nevertheless, this reaction series shows that the
acido-alcoholysis concept could be applied to other systems as well. In any given combi-
nation of diol and diacid and PET the reaction must be tested to find the interval of appli-
cable reagent ratios.

One-pot depolymerization and polycondensation of oligo- and polyesters
65
5.0 4.8 4.6 4.4 4.2 4.0 3.8 3.6 3.4
Ad-(CH2)
2-Ad
Ad-CH2-(CH
2)
2-CH
2-OH
Tp-CH2-(CH
2)
2-CH
2-Tp
AdAc0.5
Tp-(CH2)
2-Tp
Chemical Shift (ppm)
HO-CH2-(CH
2)
2-CH
2-OH
HO-(CH2)-OHTp-CH
2-CH
2-OH
Ad-CH2-(CH
2)
2-CH
2-Ad
Ad-CH2-CH
2-OH
Tp-CH2-(CH
2)
2-CH
2-OHTp-CH
2-CH
2-Ad
AdAc0
AdAc0.2
AdAc0.1
AdAc0.3
AdAc0.4
Figure 3.10 1H NMR spectra of the PET:But:AdAc depolymerization series
0
10
20
30
40
Ad-C
H2-C
H2-A
d HO
-CH
2-(
CH
2) 2
-CH
2-O
H
Ad-C
H2-(
CH
2) 2
-CH
2-O
H
Ad-C
H2-C
H2-O
H
AdAc0 AdAc0.1 AdAc0.2 AdAc0.3 AdAc0.4 AdAc0.5
Tp-C
H2-(
CH
2) 2
-CH
2-T
p
Tp-C
H2-C
H2-O
H
Tp-C
H2-C
H2-A
d
Rel
ativ
e P
eak
In
teg
ral
(%)
Ad-C
H2-(
CH
2) 2
-CH
2-A
d
Ad-C
H2-C
H2-O
H
X-(
CH
2) 3
-CH
2-O
H
HO
-(C
H2) 2
-OH
Tp-C
H2-(
CH
2) 2
-CH
2-O
H
Tp
-CH
2-C
H2-O
H
Tp-C
H2-C
H2-A
d
Tp-(
CH
2) 2
-Tp
Figure 3.11 1H NMR spectra relative integral of the PET:But:AdAc depolymeri-
zation series
The introduction of maleic-anhydride into the products (PET:But:AdAc depolymeriza-
tion series) further complicated the molecular structure and the NMR spectra. Due to the
relatively low amount of used maleic-anhydride only slight changes were observable in
the 1H spectra between the 5-3.5 ppm interval (Figure 3.12) 2D correlative measurements
were used on the PET:But:AdAc04+MA sample. Despite this, we were unable to resolve
the new connections made by the maleic-anhydride in the 5-3.5 ppm interval (1H spectra).
Certain parts of the 1H spectrum (PET:But:AdAc04+MA sample) were circled to show
the changes derived from the condensation reaction. Those peaks were attributed to

Chapter 3
66
mono-ester linkages in the depolymerization products (Figure 3.10). The peaks at the 3.8-
3.7 ppm interval showed a significant decrease in intensity. These peaks are attributed to
the hydroxyl terminated chain ends, thus these indicate an increase in molecular weight.
Only the two unsaturation related peaks could be directly linked to the maleic-anhydride
in the 7-6 ppm interval. The relatively high temperature of the reaction caused the ma-
leic-acid to change from its cis isomer state to the trans isomer form.
7.0 6.5 6.0 5.5 5.0 4.5 4.0 3.5 3.0 2.5 2.0 1.5
~O-CH2-(CH
2)-CH
2-O~
Chemical Shift (ppm)
cis trans
~OOC-CH2-(CH
2)-CH
2-COO~
Adipic-acid
Butene-1,4-diol
PET:But:AdAc 0.4
Figure 3.12 1H NMR spectra of the PET:But:AdAc 1:1:0.4 and its reaction prod-
uct with maleic-anhydride
3.3.3. Thermal properties
The thermal stability of the depolymerization series samples was considerably affected
by the amount of adipic acid used during the depolymerization step (Figure 3.13). As it
was previously stated the adipic acid component was used to connect the low molar
weighed components to form oligomers. The TGA curves of the PET:EG:AdAc series
support this statement. At lower temperatures (100-300 °C) the weight of the samples
significantly decreased due to the evaporation of low molar weighed components like
ethylene-glycol. With the increasing amount of adipic acid these components reacted with
the adipic acid and formed oligomers. As a result, a more uniform product was gained
and the amount of these easily evaporating components was minimalized. The peaks at-
tributed to such components progressively smoothed on the DTG curves as the ratio of
the adipic acid was increased. A new peak/shoulder appeared with increasing the amount
of adipic acid at 375 °C. the shoulder’s increase could be explained by the fact that the
adipic-esters showed an increasing tendency in the reaction product. Aliphatic polyesters
have lower thermal stability than aromatic polyesters. They were shown to be able de-
crease the thermal stability of copolyesters. 58

One-pot depolymerization and polycondensation of oligo- and polyesters
67
0 100 200 300 400 500 600 7000
20
40
60
80
100
0 100 200 300 400 500 600 700
low molecular weight
components
Wei
ght
(%)
Temperature (°C)
AdAc0
AdAc0.1
AdAc0.2
AdAc0.3
AdAc0.4
AdAc0.5
Polymer
7-8% Residuum(a) (b)
(a) (b)
145 °C 210 °C
370 °C 440 °C
Polymer
AdAc0.5
AdAc0.4
AdAc0.3
AdAc0.2
AdAc0.1
DT
G
Temperature (°C)
AdAc0
Figure 3.13 The TGA (a) and DTG (b) curves of the PET:EG:AdAc reaction series
200 300 400 500 200 300 400 500
AdAc0.5
AdAc0.4
AdAc0.3
AdAc0.2
AdAc0.1
AdAc0
DT
G
Temperature (°C)
445°C415°C
PET:But:AdAc depolymerization PET:But:AdAc+MA polycondensation
(a) (b)
AdAc0.5
AdAc0.4
AdAc0.3
AdAc0.2
AdAc0.1
DT
G
Temperature (°C)
445°C415°C
AdAc0
Figure 3.14 The DTG curves of the PET:But:AdAc depolymerization (a) and un-
saturated polyester polycondensation (b) reaction series
The PET:But:AdAc depolymerization series showed a similar, but less distinct trend with
the increasing amount of adipic acid. The thermal stability of this reaction series showed
no significant change with the polycondensation reaction with maleic-anhydride (Figure
3.14). A shoulder can be identified on all the DTG curves at 445 °C that became well-
defined increasing the amount of used adipic acid. Especially in the case of
PET:But:AdAc 0.5. McNeil and his coworkers have shown that longer alkyl chains in

Chapter 3
68
poly(alkylene-terephthalate)s decrease the thermal stability, doing so butylene-tereph-
thalate esters are less stable than ethylene-glycol esters. 59 The high ratio of adipic acid
increased the ratio of residual Tp-CH2-Tp connections in the depolymerization products
(Figure 3.11). Thus, certain segments of the random copolyester have higher thermal sta-
bility than the butane-1,4-diol ester rich segments.
-40 -20 0 20 40 60 80 100 120 140
H=17.5 J g-1
Exo
Polymer
AdAc0.5
AdAc0.4
AdAc0.3
AdAc0.2
AdAc0.1
Hea
twav
e (m
W)
Temperature (°C)
AdAc0
Endo
Tg= 1 °C
H=19.0 J g-1
Figure 3.15 DSC curves of the PET:EG:AdAc reaction series (2nd heating)
0.0 0.1 0.2 0.3 0.4 0.5-5
0
5
10
15
Gla
ss T
ran
siti
on
Tem
per
atu
re (
°C)
PET:But:Adac X+MA
Figure 3.16 The glass transition temperature of the PET:But:AdAc+MA reaction
series (determined with DSC). The triangle represents the one-pot reaction product.

One-pot depolymerization and polycondensation of oligo- and polyesters
69
The AdAc0 and AdAc0.1 depolymerization products in both series showed low crystal-
linity with a relatively fast crystallization rate. All the depolymerization products above
0.2 adipic acid ratio showed almost no or minor melt peaks that could be detected with
our DSC instrument (Figure 3.15). The AdAc0 and AdAc0.1 depolymerization products
in both series showed low crystallinity with a relatively fast crystallization rate. All the
depolymerization products above 0.2 adipic acid ratio showed almost no or minor melt
peaks that could be detected with our DSC instrument (Figure 3.16). Since the intrinsic
viscosity of these samples was found to be similar to the decrease in Tg, it should be
related to the amount of used adipic acid. Since butane-1,4-diol and adipic acid have
longer saturated aliphatic chains (compared to ethylene-glycol, terephthalic acid and ma-
leic-acid) they act as “soft” components and lower the Tg of the polymer.
3.3.4. Unsaturated resin characterization
Significant changes can be observed in the FTIR spectra of unsaturated resins in
comparison to the depolymerization and polycondensation products (Figure 3.17) The
spectra were normalized so the carbonyl vibration related peaks at 1720 cm-1 could have
a relative intensity of 1. The two new peaks at 797 cm-1 and 699 cm-1 can be attributed to
the breathing vibration of aromatic phenyl groups. Major increases between the
3000-2800 cm-1 interval can be attributed to the valence vibration of the phenyl groups.
The peaks at the 1300-1000 cm-1 interval are mostly related to the vibrations of the C-O-C
ester groups. The intensity of the peaks at 1258 cm-1,1099 cm-1 and 1020 cm-1 are present
in the depolymerization and the polycondensation product as well. The observed increase
in intensity can be explained by the radical reaction of the vinyl group of the styrene and
the unsaturation in the ester chain. Due to the cross-linking reaction, the specific vibra-
tions of the carbonyl and C-O-C groups derived originally from the maleic-anhydride
may change.
4000 3600 3200 2800 1600 1200 800 4000.0
0.3
0.6
0.9
1.2
1.5
Rel
ativ
e A
bso
rban
ce
Wavenumber (cm-1
)
Depolymerization product
Polycondenzation product
Unsaturated resin
PET:But:AdAc 1:1:0.4 + MA
Figure 3.17 FTIR spectra comparison of the depolymerization, condensation and
the final unsaturated resin product

Chapter 3
70
The low condensation time was utilized to keep the molecular weight of the un-
saturated polyesters relatively low and only allow the terminal hydroxyl groups to react
with the anhydride via ring-opening. This way a looser cross-linked network will be pro-
duced and the glass transition temperature will sensitively depend on the constitution of
the ester chains. 50 Since an increase in molecular weight in the function of the adipic acid
ratio the cross-link density should decrease in the function the utilized amount of adipic
acid. To test this theory the thermomechanical properties of the unsaturated resins were
studied with dynamic mechanical analysis (Figure 3.18, Table 3.2). The unsaturated resin
samples were found to be rather elastic at room temperature. The glass transition temper-
ature of the samples is relatively low, the onset of the glass transition starts bellow room
temperature, thus their properties considerably change in that temperature interval. The
measured Tg values decreased with the increasing amount of adipic acid used during the
depolymerization. The maximum of the tanδ functions shifted to lower temperatures with
the increasing ratio of the adipic acid. A shoulder could be observed at 100-120 °C tem-
perature range at the 0.4 and 0.5 ratios that might indicate the presence of more densely
cross-linked parts in the resins. The higher amount of adipic acid also could have caused
segregation of softer (adipic ester rich) and harder (terephthalic ester rich) segments in
the copolyester chains. Just as the intrinsic viscosity measurements suggested higher mo-
lecular weighed products were gained that, as a result, causes a decrease in glass transition
temperature and cross-link density. The cross-link density values were calculated from
the storage modulus data at 180 °C, the calculated values proved to be particularly low.
The higher amount of adipic acid directly influenced the needed amount of maleic-anhy-
dride and caused a decrease in cross-link density.
0.0 0.1 0.2 0.3 0.4 0.550
60
70
80
90
100
110
120
Gla
ss T
ransi
tion t
emper
ature
PET:But:AdAc+MA USR resin
(b)(a)
0.0
0.2
0.4
0.6
0.8
1.0
tan
max
-50 0 50 100 150 2000.0
0.2
0.4
0.6
0.8
1.0 USR0
USR0.1
USR0.2
USR0.3
USR0.4
USR0.5
tan
Temperature (°C)
Figure 3.18 A tanδ curves (a) and tanδmax and glass transition temperature (b) of
the unsaturated resin samples

One-pot depolymerization and polycondensation of oligo- and polyesters
71
Table 3.2 Storage modulus, cross-link density of the USR samples
Resin type
Storage Modulus (MPa) Cross-link
density
(mol m-3) 25°C 180°C
USR0 2459.7 10.18 2673
USR0.1 1629.9 7.08 1858
USR0.2 1483.3 3.13 823
USR0.3 1320.4 2.03 533
USR0.4 856.6 0.41 107
USR0.5 693.3 0.51 135
3.4. Conclusions
In this study, we have investigated the use of diacid components and their effects
on the depolymerization products of PET solvolysis. Our results have shown that diacids
can be utilized during PET solvolysis and their use results in the production of oligoesters.
The volatile, low molar weighed components are incorporated into the oligomer chains,
thus a more uniform product is achieved at the end of the depolymerization. The reaction
has no side-products and the produced oligomers could be directly used without any or
minimal purification. The molecular structure of the depolymerization product can be
finely tuned via selecting the diol and diacid reagents, thus engineering the thermal, me-
chanical and chemical properties of its final derivative product. The increasing ratio of
the diacid results in increasing the molecular weight of the produced oligomers. We have
successfully utilized and characterized acido-alcoholysis so it can be used in one-pot type
reactions. Compared to traditional chemical recycling (depolymerization, then polycon-
densation), acido-alcoholysis combines depolymerization and condensation techniques
into a single step. Excess chemical use is not necessary, and purification of the end-prod-
uct is not needed or minimal. Via acido-alcoholysis oligoesters can be produced that can
act as hydroxyl and acid functional mid-products. Due to their reactive terminal groups,
they could be tailored to be used as polyols in polyurethanes as well. Thus, the most
expensive steps of solvolysis, the purification of products can be completely avoided, and
the product properties can be fine-tuned. The authors believe that this technique could be
applied with a wide range and combination of diol and diacid components. Although the
systems must be tested to find the optimal interval of reagent ratios. The reaction process
proved to be quite modular and could be utilized in various fields. The practicality of the
method considerable depends on the purity of the feed-stock waste material. The effects
of contaminants (other polymers, adhesives, metal salts) must be investigated thoroughly
in the future. Further enhancements could be made in the depolymerization step with the
use of new, heterogeneous, recyclable catalyst.

Chapter 3
72
3.5. References
1 G. Güçlü, A. Kaşgöz, S. Özbudak, S. Özgümüş and M. Orbay, J. Appl. Polym.
Sci., 1998, 69, 2311–2319.
2 S. R. Shukla, V. Palekar and N. Pingale, J. Appl. Polym. Sci., 2008, 110, 501–
506.
3 N. Halacheva and P. Novakov, Polymer (Guildf)., 1995, 36, 867–874.
4 Z. Guo, K. Lindqvist and H. de la Motte, J. Appl. Polym. Sci., 2018, 135, 6–11.
5 P.-C. Lee, J. Kim, C. N. Hoang, C. T. Pham, T. M. Dang, D. Hoang and S.-J.
Kang, Polymers (Basel)., 2019, 11, 236.
6 D. M. Scremin, D. Y. Miyazaki, C. E. Lunelli, S. A. Silva and S. F. Zawadzki,
Macromol. Symp., 2019, 383, 1–7.
7 G. Eshaq and A. E. Elmetwally, J. Mol. Liq., 2016, 214, 1–6.
8 L. Bartolome, M. Imran, K. G. Lee, A. Sangalang, J. K. Ahn and D. H. Kim,
Green Chem., 2014, 16, 279–286.
9 M. Imran, D. H. Kim, W. A. Al-Masry, A. Mahmood, A. Hassan, S. Haider and
S. M. Ramay, Polym. Degrad. Stab., 2013, 98, 904–915.
10 M. R. Nabid, Y. Bide, N. Fereidouni and B. Etemadi, Polym. Degrad. Stab., 2017,
144, 434–441.
11 R. M. Musale and S. R. Shukla, Int. J. Plast. Technol., 2016, 20, 106–120.
12 H. Wang, Y. Liu, Z. Li, X. Zhang, S. Zhang and Y. Zhang, Eur. Polym. J., 2009,
45, 1535–1544.
13 Z. Ju, W. Xiao, X. Lu, X. Liu, X. Yao, X. Zhang and S. Zhang, RSC Adv., 2018,
8, 8209–8219.
14 A. M. Al-Sabagh, F. Z. Yehia, A.-M. M. F. Eissa, M. E. Moustafa, G. Eshaq, A.-
R. M. Rabie and A. E. ElMetwally, Ind. Eng. Chem. Res., 2014, 53, 18443–
18451.
15 A. M. Al-Sabagh, F. Z. Yehia, D. R. K. K. Harding, G. Eshaq and A. E.
ElMetwally, Green Chem., 2016, 18, 3997–4003.
16 K. Fukushima, J. M. Lecuyer, D. S. Wei, H. W. Horn, G. O. Jones, H. A. Al-
Megren, A. M. Alabdulrahman, F. D. Alsewailem, M. A. McNeil, J. E. Rice and
J. L. Hedrick, Polym. Chem., 2013, 4, 1610–1616.
17 C. Jehanno, I. Flores, A. P. Dove, A. J. Müller, F. Ruipérez and H. Sardon, Green
Chem., 2018, 20, 1205–1212.
18 R. Shamsi and G. Mir Mohamad Sadeghi, RSC Adv., 2016, 6, 38399–38415.
19 L. Incarnato, P. Scarfato, L. Di Maio and D. Acierno, Polymer (Guildf)., 2000,
41, 6825–6831.
20 L. K. Nait-Ali, X. Colin and A. Bergeret, Polym. Degrad. Stab., 2011, 96, 236–
246.
21 J. D. Badia, E. Strömberg, S. Karlsson and A. Ribes-Greus, Polym. Degrad. Stab.,
2012, 97, 98–107.
22 B. Itim and M. Philip, Polym. Degrad. Stab., 2015, 117, 84–89.
23 C. hao Sun, X. ping Chen, Q. Zhuo and T. Zhou, J. Cent. South Univ., 2018, 25,
543–549.
24 S. Singh, S. Sharma, A. Umar, S. K. Mehta, M. S. Bhatti and S. K. Kansal, J.
Nanosci. Nanotechnol., 2018, 18, 5804–5809.
25 Y. Liu, M. Wang and Z. Pan, J. Supercrit. Fluids, 2012, 62, 226–231.
One-pot depolymerization and polycondensation of oligo- and polyesters
73
26 S. D. Mancini and M. Zanin, Polym. - Plast. Technol. Eng., 2007, 46, 135–144.
27 Q. Liu, R. Li and T. Fang, Chem. Eng. J., 2015, 270, 535–541.
28 Z. Helwani, M. R. R. Othman, N. Aziz, J. Kim and W. J. N. J. N. N. Fernando,
Appl. Catal. A Gen., 2009, 363, 1–10.
29 S. Makkam and W. Harnnarongchai, Energy Procedia, 2014, 56, 547–553.
30 I. S. Duarte, A. A. Tavares, P. S. Lima, D. L. A. C. S. Andrade, L. H. Carvalho,
E. L. Canedo and S. M. L. Silva, Polym. Degrad. Stab., 2016, 124, 26–34.
31 A. A. Tavares, D. F. A. Silva, P. S. Lima, D. L. A. C. S. Andrade, S. M. L. Silva
and E. L. Canedo, Polym. Test., 2016, 50, 26–32.
32 Z. Terzopoulou, V. Tsanaktsis, M. Nerantzaki, D. S. Achilias, T. Vaimakis, G. Z.
Papageorgiou and D. N. Bikiaris, J. Anal. Appl. Pyrolysis, 2016, 117, 162–175.
33 W. Romão, M. F. Franco, Y. E. Corilo, M. N. Eberlin, M. A. S. S. Spinacé and
M. A. De Paoli, Polym. Degrad. Stab., 2009, 94, 1849–1859.
34 F. Signori, M. B. Coltelli and S. Bronco, Polym. Degrad. Stab., 2009, 94, 74–82.
35 B. . Holland and J. . Hay, Polymer (Guildf)., 2002, 43, 1835–1847.
36 G. Montaudo, C. Puglisi and F. Samperi, Polym. Degrad. Stab., 1993, 42, 13–28.
37 M. Bedell, M. Brown, A. Kiziltas, D. Mielewski, S. Mukerjee and R. Tabor,
Waste Manag., 2018, 71, 97–108.
38 L. Nguyet Thi Ho, D. Minh Ngo, J. Cho and H. M. Jung, Polym. Degrad. Stab.,
2018, 155, 15–21.
39 J. Vitásek, V. Šašek and I. Prokopová, J. Polym. Environ., 2012, 20, 618–625.
40 R. Shamsi and G. Mir Mohamad Sadeghi, RSC Adv., 2016, 6, 38399–38415.
41 J. Natarajan, G. Madras and K. Chatterjee, ACS Appl. Mater. Interfaces, 2017, 9,
28281–28297.
42 S. R. Shukla, A. M. Harad and L. S. Jawale, Waste Manag., 2008, 28, 51–56.
43 Y. Wu and S. Feng, J. Appl. Polym. Sci., 2001, 80, 1052–1057.
44 A. El Mejjatti, T. Harit, A. Riahi, R. Khiari, I. Bouabdallah and F. Malek, Express
Polym. Lett., 2014, 8, 544–553.
45 M. Billiau-Loreau, G. Durand and G. Tersac, Polymer (Guildf)., 2001, 43, 21–
28.
46 G. Colomines, J.-J. Robin and G. Tersac, Polymer (Guildf)., 2005, 46, 3230–
3247.
47 G. Xi, M. Lu and C. Sun, Polym. Degrad. Stab., 2005, 87, 117–120.
48 L. Kárpáti, G. Szarka, M. Hartman and V. Vargha, Period. Polytech. Chem. Eng.,
2018, 62, 336–344.
49 L. Karpati, M. Fejer, D. Kalocsai, J. Molnar and V. Vargha, Express Polym. Lett.,
2019, 13, 618–631.
50 I. Duque-Ingunza, R. López-Fonseca, B. de Rivas and J. I. Gutiérrez-Ortiz, J.
Mater. Cycles Waste Manag., 2013, 15, 256–263.
51 K. Puangsansuk, M. Opaprakasit, W. Udomkichdecha and P. Potiyaraj, J. Polym.
Environ., 2009, 17, 65–70.
52 T. H. Nguyen, D. Q. Hoang and J. Kim, Macromol. Res., 2018, 26, 22–28.
53 R. J. Lozano-Escárcega, M. G. Sánchez-Anguiano, T. Serrano, J. Y. Chen and I.
Gómez, Polym. Bull., 2018, 38, 538–554.
54 H. M. Naguib and X. H. Zhang, Polym. Test., 2018, 69, 450–455.

Chapter 3
74
55 J. D. Rusmirović, T. Radoman, E. S. Džunuzović, J. V. Džunuzović, J.
Markovski, P. Spasojević and A. D. Marinković, Polym. Compos., 2017, 38, 538–
554.
56 M. E. Tawfik and S. B. Eskander, KGK Kautschuk Gummi Kunststoffe, 2015, 68,
21–27.
57 L. Yurramendi, M. J. Barandiarán and J. M. Asúa, J. Macromol. Sci. Part A -
Chem., 1987, 24, 1357–1367.
58 S.-W. Kim, J.-C. Lim, D.-J. Kim and K.-H. Seo, J. Appl. Polym. Sci., 2004, 92,
3266–3274.
59 I. C. McNeill and M. Bounekhel, Polym. Degrad. Stab., 1991, 34, 187–204.

Isophorondiamine based epoxy hardeners from the aminolysis of PET
75
Chapter 4
Synthesis and characterization of isophorondiamine based
epoxy hardeners from the aminolysis of PET3
4.1. Introduction
Plastic recycling is an ever emerging problem in our society. Several methods have been
developed to recycle commodity plastics, such as poly(propylene), poly(ethylene),
poly(styrene), poly(vinyl-cloride) and poly(ethylene-terephthalate) (PET) 1–6. With clas-
sical remoulding processes like extrusion and injection moulding a significant decrease
in mechanical properties cannot be avoided after a certain number of cycles 7–10. At one
point chemical methods should be applied to regain the resources from these materials.
Chemical recycling, namely the solvolysis of PET waste is one of the most widely applied
and researched methods. The solvolysis reaction, e.g. glycolysis, is a typically slow equi-
librium based transesterification reaction that should be carried out at higher temperatures
and pressures with higher reagent ratios and a catalyst to obtain pure terephthalic acid
derivatives 11–20. This is not to mention the need for extra purification steps that must be
done to regain the ethylene-glycol and to separate the terephthalic acid derivatives. Due
to these circumstances, chemical recycling is mostly known as a rather expensive method.
Several publications have focused on the catalytic enhancement of bis(2-hydroxyethyl)
terephthale (BHET) production 11,13–15,21. The aminolysis of PET can occur in less de-
manding conditions and could be used to gain new value added chemicals and polymeric
materials and resins 18,20,22–29. Epoxy curing with PET aminolysis products is still an ex-
panding field that only a few studies have focused on 19,30. Most of these utilized aliphatic
diamines and applied several cleaning steps to gain pure terephtalic-amides and remove
the ethylene-glycol side products. In several early publications the catalytic effects of
hydroxyl groups in epoxy curing reactions with amine cross-linkers were tested and
proved 31–33. Thus if, ethylene-glycol (EG) is not removed from the raw aminolysis prod-
uct it could serve as a catalyst via hydrogen bond formation for the cross-linking reac-
tions. Since a hydrogen bond is required for this kind of catalytic effect 33,34, the amide
groups of the terephthal-amide-diamines could also provide a catalytic acceleration as
well. Up to this point no research groups have attempted to use the raw aminolysis prod-
ucts of PET for epoxy curing and exploring their catalytic effects.
In this study our goal was to investigate the use of raw aminolysis products of PET
as epoxy curing agents, characterize the cross-linked resins, and develop an industrially
easily applicable method for diamine curing agent production.
3 L. Karpati, M. Fejer, D. Kalocsai, J. Molnar and V. Vargha, Express Polym. Lett., 2019, 13, 618–631.

Chapter 4
76
Figure 4.1 The aminolysis reaction of PET with isophoron-diamine
In this study a widely used cycloaliphatic epoxy hardener, isophoron-diamine
(IPD) was used in PET aminolysis to produce terephthalic-amide-diamines (Figure 4.1).
The aminolysis was carried out without excess IPD (1:2 ester- to amine group mol ratio).
The chemical structure was identified, with 1H, 13C, DEPT), 1H-13C HSQC, 1H-13C
HMBC, 1H-15N HMBC, 1H-1H COSY, and 1H-1H NOESY NMR measurements. The raw
reaction product was dissolved in IPD (0-50 m/m%) to gain an easy to handle, low tem-
perature curing epoxy hardener system. The effect of the terephthal-amide-diamine con-
centration was investigated on the cross-linking reaction (Figure 4.2), gelation, thermo-
mechanical, and mechanical properties of the cured epoxy resins.
4.2. Experimental
4.2.1. Materials
PET granules made by DSM Arnite® D00 301 (DSM, Heerleen Neatherlands)
were used for the aminolysis reactions (28.5±1,5 % crystallinity). Bisphenol A-diglicidil-
ether IPOX® EH 1010 epoxy resin (EE: 180-196 g mol-1, η: 10000-14000 mPas, ρ: 1.17
g cm-3) and Isophoron-diamine ER 2943 (IPD) (Amin value: 645-675 mgKOH g-1, η: 5-
25 mPas, ρ: 0.92 g cm-3, ~90% pure (HPLC)) were purchased from Ipox Chemicals (Bu-
dapest, Hungary). Zinc-acetate (Zn(OAc)2.2H2O) was purchased from BDH Chemicals
(VWR International, Radnor, USA). N,N-dimethyl-formamide (99%, 06120-203-340)
(DMF), pyridine (99%, 08160-203-340), potassium hydroxide (99%, 04300-101-190)
and hydrochloric acid (37%, 08710-006-340) were purchased from Molar Chemicals
(Halásztelek, Hungary). Phathalic anhydride (99%, A14955) was purchased from
AlfaAesar. Deuterated dimethylsulfoxide (DMSO-d6) (99.9%, 15874-10X1ML) was
purchased from Sigma-Aldrich (Saint Luis, USA).

Isophorondiamine based epoxy hardeners from the aminolysis of PET
77
Figure 4.2 The catalyzed reaction of bisphenol A diglycidilether with tereph-
thalic-amide-diamines.
4.2.2. Aminolysis of PET with IPD
The aminolysis of PET was carried out in a 250 cm3 four-necked round-bottom
glass flask equipped with a thermometer, a gas inlet, a reflux condenser, and a mechanical
stirrer. The reaction mixture was heated to 200 °C and was kept there for 4 hours in argon
atmosphere. 80 g of the PET granules and 0.8 g of zinc-acetate transesterification catalyst
(1% of PET) were added. The applied IPD ratio (1:2) was calculated from the ester group
content of the PET. At the end of the reactions the homogenous, viscous, green-yellow
melt was poured into an aluminum pan. The reaction yields were near 90%.
4.2.3. Reaction product characterization
The amine and hydroxyl functional group content was determined via titration
methods. 0.1-0.2 g samples with analytical balance were weighed in an Erlenmeyer flask
and dissolved in 15 cm3 of DMF. The 3 samples and a blank sample were titrated with a
0.1 M hydrochloric acid solution in the presence of a bromocresole green indicator to
determine the amine content of the samples. The hydroxyl group content was determined
with a back-titration method. 3 samples of 1.3 g were weighed in Erlenmeyer flasks with
analytical precision. 25 cm3 of 1 M phthalic anhydride solution in pyridine was added to
the 3 samples and to the blank sample. The samples were heated to 110 °C in oil-baths
and were refluxed for 2 hours. After the samples cooled to room temperature, 50 cm3
pyridine was added through the condenser. The samples were titrated with a 0.5 M NaOH
solution in the presence of a phenolphthalein indicator.
Perkin Elmer TGA 6 (PerkinElmer, Waltham, USA) was used to determine the
thermal stability of the reaction product, and the cured epoxy specimens in purging nitro-
gen gas. A 10 mg sample was heated with a 10 °C min-1 heating rate from 30-700 °C,
then the sample was kept at 700 °C for 10 minutes in oxygen atmosphere.
A Brucker Tensor 27 FTIR spectrometer (Bruker, Billerica, USA) was used to
measure the FTIR spectra of the reaction products in KBr pastilles (28 scans, 4000-400

Chapter 4
78
cm-1). 1H, 13C, DEPT, 1H-1H COSY, 1H-1H NOESY, 1H-13C HSQC and 1H-13C HMBC
spectra were recorded with a Bruker Avance 300 spectrometer. 1H-15N HMBC spectrum
was recorded with a Bruker Avance 500 spectrometer. The samples were dissolved in
DMSO-d6 (99%). The sample concentration was 29 mg cm-3 for the IPD and 51 mg cm-3
for the reaction product. The temperature of acquisition was 30 °C.
4.2.4. Test specimen preparation and characterization
A solution series of the aminolysis product and IPD was prepared to use as the cross-
linking agent for epoxy resins. The reaction product was dissolved in IPD in different
concentrations (0, 5, 10, 20, 30, 40, and 50 m/m%. The components were weighed with
analytical accuracy. The solutions were prepared in round-bottomed flasks equipped with
a reflux condenser. The flasks were heated to 100 °C for 30 minutes. The amine value
was determined as previously described.
The epoxy content of the ER1010 epoxy resin was measured with a back-titration method.
Three samples of 0.2 g were weighed in Erlemeyer flasks with analytical precision. 16
cm3 concentrated hydrochloric acid (37%) was dissolved in pyridine to obtain the pyri-
dine hydrochloride solution in pyridine. The samples were dissolved in 25 cm3 solution
of pyridine hydrochloride in pyridine. The solutions were heated and let to reflux for 1
hour. After the samples cooled to room temperature 10 cm3 water was added through the
condenser. A 0.1 M sodium hydroxide (in methanol) solution was used to titrate the sam-
ples in the presence of a phenolphthalein indicator. The mixing ratios for the ER1010
epoxy resin and the cross-linker were calculated to the stoichiometric ratio.
The epoxy mixture was prepared according to the calculated mixing ratios. The resin and
the cross linker were mixed with a glass rod for three minutes in a plastic cup. The plastic
cup was placed in a vacuum chamber for 30-40 minutes until the resin was bubble free.
75x4x1.4 mm “dogbone” shaped specimens and 50x10x4 prismatic shaped specimens
were moulded for mechanical tests. The specimens were cross-linked for 2 hours at 90 °C
in a VWR Venti-Line 115 drying oven (VWR International, Radnor, USA).
PerkinElmer DSC7 (PerkinElmer, Waltham, USA) was used to measure the exothermic
enthalpy of the cross-linking and the glass transition temperature (Tg) of the mixtures.
The 10 mg of the freshly mixed resin samples were weighed with analytical accuracy.
The samples were kept at 30 °C for 0.5 min, then they were heated to 90 °C with 200 °C
min-1 heating rate. The samples were cross-linked at 90 °C for 2 hours, then the samples
were cooled to 0 °C with 20 °C min-1 cooling rate. The reaction heat was calculated from
the integration of the isothermal segment between 0 and 30 min. To determine the glass
transition temperature (Tg), the samples were further heated from 0 °C to 250 °C with
20 °C min-1, kept at 250 °C for 1 minute, then cooled to 0 °C with 20 °C min-1 and kept
there for 1 minute. Then the samples were heated with 20 °C min-1 heating rate to 250 °C.
The Tg was determined from the last heating period. All the calculations and evaluations
were carried out in Pyris Software.
PerkinElmer Diamond DMA (PerkinElmer, Waltham, USA) was used to characterize the
glass transition temperature and viscoelastic behavior of the epoxy specimens. A tension

Isophorondiamine based epoxy hardeners from the aminolysis of PET
79
test method was used from 20 to 200 °C with 2 °C min-1 heating rate, 1 Hz frequency
and 10 μm amplitude. The Tg was determined from the peak of tanδ. The dogbone shaped
specimens were cut to a prismatic shape before the DMA measurements.
Rheological measurements for gel point determination were carried out using an Anton-
Paar Physica MCR 301 (Anton Paar GmbH, Graz, Austria) apparatus at 40 °C in contin-
uous rotation mode with a plate-plate system (plate distance 1 mm).
Standard tensile tests were conducted on an Instron 5566 type equipment (Instron Co.,
Canton, USA) with 5 mm min-1 rate to determine the Young’s modulus, tensile strength,
and elongation at break. Instrumented impact testing was used to investigate the impact
resistance. The measurements were carried out with a Ceast Resil 5.5 instrument (CEAST
spa, Pianezza, Italy) with a 4 J hammer (2.9 m s-1). The impact test specimens were V-
notch type samples. All the mechanical tests were done at 23 °C in an air-conditioned
laboratory with 50% air humidity.
4.3. Results and discussion
4.3.1. Aminolysis product characterization
Functional group analysis was used to characterize the raw reaction product (Ta-
ble 4.1). The measured amine value approximates the theoretical amine value (4.24 mmol
g-1, calculated from the theorized molecular structure of the product). It suggests the pres-
ence of longer terephthalic-acid and isophorondiamine derivative oligoamides. The hy-
droxyl value was determined to measure the amount of ethylene-glycol in the raw prod-
uct. It was found to be near 100% based on the PET repeating units. This indicated the
complete amidation of the ester groups.
Table 4.1 Functional group content of IPD and the aminolysis product
Material Amine value
(mmol g-1)
Hydroxyl value
(mmol g-1)
IPD 11.57±0.041 -
PET:IPD 1:2 3.89±0.009 3.98±0.407
Thermo-gravimetric analysis (TGA) was used to investigate the mass composition and
thermal stability of the reaction product (Figure 4.3). A two-step weight loss process was
observed. At the first step the ethylene-glycol content evaporated out of the product re-
sulting in over 30% weight loss. The thermal degradation of the main reaction product
started above 400 °C.

Chapter 4
80
0 100 200 300 400 500 600 7000,0
0,2
0,4
0,6
0,8
1,0
Rel
ativ
e w
eight
Temperature (°C)
T95%
=188 °C
DT
G
EG
253 °C
PET:IPD 1:2
467 °C
67%
Figure 4.3 The TGA and DTG curves of PET:IPD 1:2 raw aminolysis product
FTIR spectroscopy was used to determine the general molecular structure of the
reaction product (Figure 4.4). The spectra of PET and IPD were added as a reference. The
wide peak between 3600-3200 cm-1 are attributed to the valence vibration of the N-H
(amine and amide) and O-H groups. The shoulder/peak at 3100-3080 cm-1 is attributed to
the aromatic, the peaks at 2951 and 2921 cm-1 are attributed to aliphatic/cyclo-aliphatic
C-H valence vibrations. The peaks at 1638 and 1550 cm-1 are attributed to the amide
carbonyl vibrations. Most of the peaks between 1500-1000 cm-1 can be attributed to the
bending and skeletal vibrations of the aliphatic and the aromatic hydrocarbon groups. No
peaks were found that could be attributed to the ester type vibration (~1740-1720 carbonyl
vibration, ~1240 cm-1 for C-O-C vibrations). Thus, the amidation of PET was complete
and no ester linkages are present in the product.

Isophorondiamine based epoxy hardeners from the aminolysis of PET
81
4000 3600 3200 2800 2400 2000 1600 1200 800 400
Rel
ativ
e A
bso
rban
ce
Wavenumber (cm-1
)
PET
IPD
PET:IPD 1:2
Figure 4.4 The FTIR spectrum of PET:IPD 1:2
3.00 2.75 2.50 2.25 2.00 1.75 1.50 1.25 1.00 0.75 0.50
Chemical shift (ppm)
1ax
1ekv
2 3ax
3ekv
DMSO
4ax
7 5ekv
8
-NH2
1H
6ax
6ekv
Figure 4.5 The 1H spectrum and atom numbering of IPD (IPOX EH2293). 1H
(numbers) and 13C (alphabet)
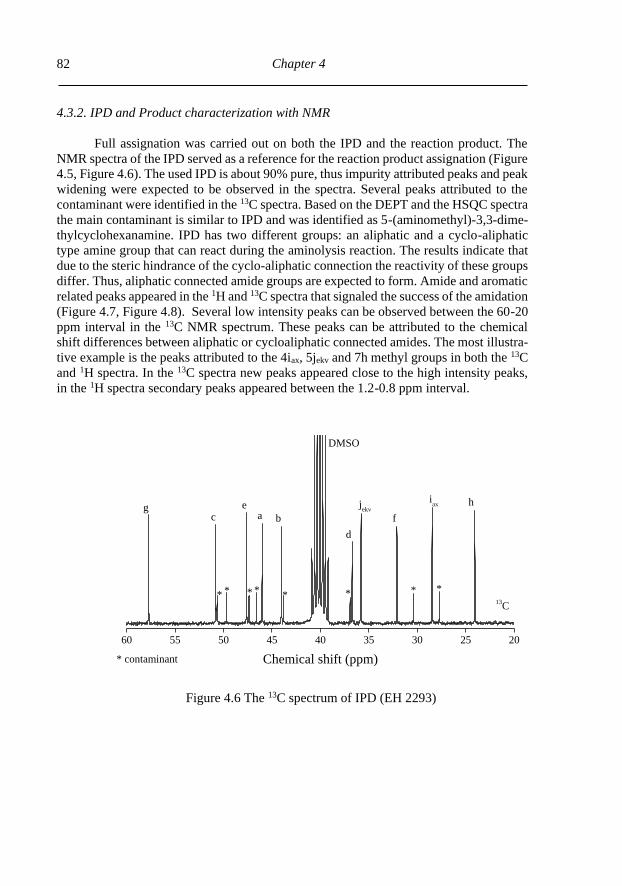
Chapter 4
82
4.3.2. IPD and Product characterization with NMR
Full assignation was carried out on both the IPD and the reaction product. The
NMR spectra of the IPD served as a reference for the reaction product assignation (Figure
4.5, Figure 4.6). The used IPD is about 90% pure, thus impurity attributed peaks and peak
widening were expected to be observed in the spectra. Several peaks attributed to the
contaminant were identified in the 13C spectra. Based on the DEPT and the HSQC spectra
the main contaminant is similar to IPD and was identified as 5-(aminomethyl)-3,3-dime-
thylcyclohexanamine. IPD has two different groups: an aliphatic and a cyclo-aliphatic
type amine group that can react during the aminolysis reaction. The results indicate that
due to the steric hindrance of the cyclo-aliphatic connection the reactivity of these groups
differ. Thus, aliphatic connected amide groups are expected to form. Amide and aromatic
related peaks appeared in the 1H and 13C spectra that signaled the success of the amidation
(Figure 4.7, Figure 4.8). Several low intensity peaks can be observed between the 60-20
ppm interval in the 13C NMR spectrum. These peaks can be attributed to the chemical
shift differences between aliphatic or cycloaliphatic connected amides. The most illustra-
tive example is the peaks attributed to the 4iax, 5jekv and 7h methyl groups in both the 13C
and 1H spectra. In the 13C spectra new peaks appeared close to the high intensity peaks,
in the 1H spectra secondary peaks appeared between the 1.2-0.8 ppm interval.
60 55 50 45 40 35 30 25 20
**
* contaminant
* ***13
C
Chemical shift (ppm)
c a b
d
e
fg
hiaxj
ekv
DMSO
* *
Figure 4.6 The 13C spectrum of IPD (EH 2293)
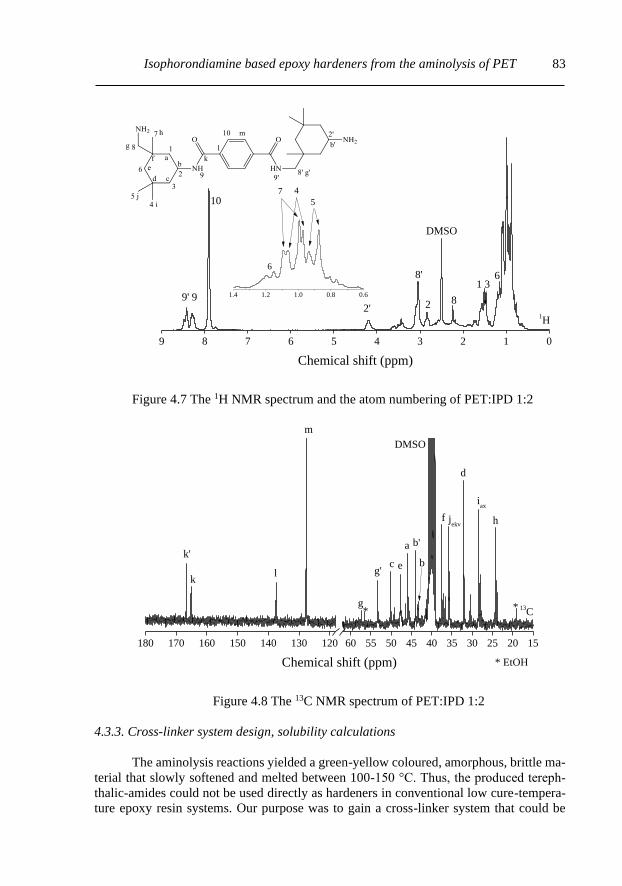
Isophorondiamine based epoxy hardeners from the aminolysis of PET
83
9 8 7 6 5 4 3 2 1 0
1H
Chemical shift (ppm)
10
9' 92'
DMSO
82
8'1 3
66
4
5
1.4 1.2 1.0 0.8 0.6
7
Figure 4.7 The 1H NMR spectrum and the atom numbering of PET:IPD 1:2
180 170 160 150 140 130 120 60 55 50 45 40 35 30 25 20 15
* 13C
Chemical shift (ppm)
k
k'
l
m
a
c
d
e
f
g
g'
DMSO
hjekv
iax
*
* EtOH
b'
b
Figure 4.8 The 13C NMR spectrum of PET:IPD 1:2
4.3.3. Cross-linker system design, solubility calculations
The aminolysis reactions yielded a green-yellow coloured, amorphous, brittle ma-
terial that slowly softened and melted between 100-150 °C. Thus, the produced tereph-
thalic-amides could not be used directly as hardeners in conventional low cure-tempera-
ture epoxy resin systems. Our purpose was to gain a cross-linker system that could be

Chapter 4
84
processed at room temperature. Therefore, solubility parameters were calculated using
the Fedors group contribution calculation method to find possible solvents for the cross-
linking agent 35 (Table 4.2). The raw terephthalic-amides were found to dissolve in DMF,
DMSO, ethanol, isopropanol and IPD.
Table 4.2 Calculated solubility parameters and Cohesion energy density data
Vm
(mol cm-3)
CED
(J cm-3)
δ (Fedors)
(MPa1/2)
IPD 163.9 65 380 20.0
PET:IPD 1:2 328.6 194 680 24.3
DMF 70.9 37 050 22.8
DMSO 77.8 48 560 25.0
EtOH 58.4 39 450 26.0
iPrOH 76.34 42 650 23.6
The major problem (except IPD) with these solvents was that most of them could
only be used as a non-reactive solvent. During the hardening process these solvents could
only act as a viscosity reducing agent and could not react with the epoxy resin. Due to the
low amine value of the reaction product, the high amount of unreactive solvents would
swell the cross-linked resin to an “organo-gel” like state. These solvents would only act
as a reaction medium, and would need to be removed from the final product. IPD is a
widely used epoxy cross-linker, it can react with epoxy groups and become part of the
resin structure.
Table 4.3 Measured amine and calculated EG content of the cross-linker solutions
PET:IPD 1:2
solution concentration
(%)
Amine value
(mmol g-1)
OH value
(mmol g-1)
0 11.67±0.034 0
5 11.05±0.027 9.95
10 10.80±0.035 19.9
20 9.98±0.014 39.8
30 9.19±0.005 59.7
40 8.47±0.022 79.6
50 7.67±0.020 99.5

Isophorondiamine based epoxy hardeners from the aminolysis of PET
85
In addition, the cross-linker solutions with IPD could be easily prepared by intro-
ducing excess IPD at the end of the aminolysis process. Thus, the reaction product was
dissolved in IPD and was utilized as a co-curing agent. Due to its chemical structure
(longer molecule), the usage of the terephthal-amide-diamines could lower the cross-link
density in the final epoxy resins. A cross-linker solution sequence of 0 to 50 weight %
was prepared and was used in this study to characterize our reaction product as a cross-
linker. The amine value of the solutions followed a linear declining tendency with in-
creasing concentration (Table 4.3). The EG concentration of the cross-linker solutions
was calculated based on the hydroxyl group content of the raw product. The mixing ratios
were calculated, and several samples were prepared to study the thermal, thermomechan-
ical, and mechanical properties of the epoxy resin systems.
4.3.4. Cross-linking characterization
Calorimetric and rheological measurements were carried out to characterize the
cross-linker solution during curing reactions. The exothermic reaction heat was calculated
from the integration of isothermal curing curves. Due to the similarity of the amine groups
on IPD and the reaction product, a similar reaction rate is expected. Any differences in
the reaction rate, compared to IPD, must be the result of the amidation and the catalytic
effect of the EG and the terephthal-amide content. Several reaction processes can take
place during the curing of epoxy resins with diamines. In our case these are the uncata-
lyzed reaction-;the auto-catalyzed reaction- by secondary hydroxyl groups; the catalyzed
reaction by hydroxyl (EG) or amide groups; and the reaction of hydroxyl and epoxy
groups 33,34. Inasmuch as the reaction catalyzed by ethylene-glycol and the terephthal-
amide-diaminesshould be significantly faster and more dominant than the rest of the re-
action processes.
0 2 4 6 8 10
50%
40%
30%
20%
10%
5%
Hea
tflo
w (
mW
)
Cross-linking time (min)
H
Endo
Exo
0%
0 10 20 30 40 50 60300
310
320
330
340
350
H
(J
g-1)
PET:IPD 1:2 solution concentration (%)
0.3
0.6
0.9
1.2
1.5(b)
Pea
k t
ime
(min
)
(a)
Figure 4.9 Isothermal curing curves registered with DSC (a), the reaction en-
thalphy and the time belonging to the maximum (peak) of the isothermal curves.

Chapter 4
86
A clear increasing tendency in the reaction heat, and the peak time was observed
as a function of the concentration of the cross-linker solution (Figure 4.9 b). The initial
peak during the isothermal step became well-defined. The time to reach the maximum of
the heatflow curve decreased with a near linear tendency from 90 to 30 seconds. The
heatflow curve reached a plateau sooner (Figure 4.9 a). These observations indicated the
intensification of the reaction process with increasing concentration.
0 10 20 30 40 50 600
100
200
300
400
500
600
Vis
cosi
ty (
Pas
)
Time (min)
PET:IPD 1:2
solutions
0%
5%
10%
20%
30%
40%
50%
IPD-EG
equivalent solutions
10%
30%
50%
50 °C
Figure 4.10 The time dependence of viscosity during curing with PET:IPD 1:2
solutions (solid lines) and equivalent IPD-EG solutions (dashed lines).
Rheological studies were conducted at 50 °C to measure and characterize the re-
action kinetics and determine the gelation point of the resins. The curing reaction was
slower at 50 °C and allowed a more precise measurement. Measuring the gelation at 90
°C was attempted (~2 min for 20% solution), but the fast reaction rate (near complete
curing) endangered the instrument. The increased concentration of the cross-linker solu-
tions resulted in faster cure rates, shift of the gelation (Figure 4.10), and the increase in
the initial viscosity (Figure 4.11 a). The gel time was attributed to the cross point of fitted
linears on the initial and precipitous parts of the curve. The gel time showed a significant
20 min decrease from 0% to 5% solution concentration, then it was followed by a linear
decreasing tendency with the increasing solution concentration (Figure 4.11 b). The sig-
nificant decrease between the 0-5 % points clearly demonstrates the catalytic effect of the
aminolysis product. Even 5% of the product accelerates the reaction. To demonstrate,
and model the catalytic effect of EG, three cross-linker solutions of EG in IPD were pre-
pared and their gelation point was measured. The concentration of EG in these was based
on the calculated amine/hydroxyl mol-ratio of the PET:IPD 1:2 solutions. Equivalents to
the 10%, 30% and 50% solutions were prepared. The gelation of these samples was faster
than the 0% (IPD) as expected, but only the 50% equivalent solution reached the reaction
rate of the 5% PET:IPD 1:2 solution (Figure 4.10 and Figure 4.11 b). Since a strong hy-
drogen bond is needed between a glycidyl-ether and the catalyst, not just the EG, but the
amide groups of the terephthal-amide-diamines act as catalysts during the curing reaction.

Isophorondiamine based epoxy hardeners from the aminolysis of PET
87
The catalytic effect of terephthal-amide-diamines gives significant, additional accelera-
tion to the curing reaction. Even at small amounts terephthal-amide-diamines could act
as modifiers for cycloaliphatic curing agents to accelerate the curing. Due to the faster
curing rate of these systems a more perfect cross-linked structure is expected to form at
the same conditions. This was further inspected with dynamic mechanical analysis
(DMA).
0 10 20 30 40 50 60
0.0
0.5
1.0
1.5
2.0
2.5
Init
ial
Vis
cosi
ty o
f th
e R
esin
Mix
ture
(P
as)
PET:IPD 1:2 solution concentration (%)
50 °C
0 10 20 30 40 50 600
10
20
30
40
50
60(b)
tgel
= -0.3404 [EG]+ 48.23
R2= 0.98343
tgel
= -0.382 [PET:IPD]+ 33.18
R2= 0.98757
Gel
Tim
e (m
in)
PET:IPD 1:2 solution concentration (%)
(a)
Figure 4.11 The initial viscosity of the resin mixtures (a) and the calculated gel
times for PET:IPD 1:2 and IPD-EG model solutions (b).
4.3.5. Dynamic mechanical analysis
25 50 75 100 125 150 175 2000.0
0.5
1.0
1.5
2.0
2.5
3.0
3.5
4.0
Sto
rage
Modulu
s (G
Pa)
Temperature (°C)
0%
5%
10%
20%
30%
40%
50%
(a) (b)
25 50 75 100 125 150 175 200
Loss
Modulu
s (G
Pa)
Temperature (°C)
Figure 4.12 The Storage (a) and Loss modulus (b) of epoxy specimen.

Chapter 4
88
25 50 75 100 125 150 175 200
(b)
Tan
Temperature (°C)
0%
5%
10%
20%
30%
40%
50%
(a)
25 50 75 100 125 150 175 200
Temperature (°C)
Figure 4.13 The tanδ curves of epoxy specimen before (a)
and after post-curing (b).
Thermomechanical measurements were conducted via dynamic mechanical anal-
ysis (DMA). The dogbone shaped test specimens were moulded, cross-linked at 90°C for
two hours. The specimens were cut to prismatic shape before measurements. 3-3 parallel
specimen were tested. The storage modulus varied between 2,5-3,5 MPa at 30 °C for
every sample (Figure 4.13 a). The differences of the specimens must come from the sam-
ple preparation. The storage modulus continuously decreased by increasing the measuring
temperature. A major change in slope occurred above 100 °C that indicated the approxi-
mation of the glass transition temperature. Another change of slope around 130 °C oc-
curred that indicated that a not perfect cross-linked structure formed during the curing of
the specimens. Both the loss modulus and the tanδ curves indicated this (Figure 4.13 b,
Figure 4.14 a). In both cases peaks with shoulders can be observed in the 100-160 °C
interval. The peak of a tanδ curve is associated with the glass transition temperature of a
sample. The registered peaks shifted to lower temperatures with the concentration of the
PET:IPD 1:2 in the cross-linker solutions, thus the glass transition temperature decreased.
The main peak shifted at a greater extent than the shoulder peak, the shoulder peak be-
came less-well defined. Both the storage-, loss modulus and their ratio, the tanδ indicated
a more uniform structure with higher PET:IPD 1:2 concentrations. As we have assumed,
the cross-linked structure improved, became more perfect at the same curing conditions
due to the catalytic effect of the raw aminolysis product.

Isophorondiamine based epoxy hardeners from the aminolysis of PET
89
0 10 20 30 40 50 60130
135
140
145
150
155
160
165
170 DMA
DMA post-cured
DSC
Gla
ss T
ransi
tion T
empre
ature
(°C
)
PET:IPD 1:2 concentration (%)
Figure 4.14 The glass transition temperature determined with DMA and DSC
measurements.
The presence of longer terephthal-amide-diamines resulted in the decrease of the
glass transition temperature. The longer cross-linker molecules decreased the cross-link
density of the resins, and as their concentration increased their effect became more dom-
inant. A slight increase in the storage modulus was detected above 150 °C that indicated
post-curing during measurements. The effect of post-curing was investigated with DMA
on post-cured specimens (170-180 °C for 1 hour) (Figure 4.14). The glass transition tem-
perature followed a near-linear decreasing tendency in all cases (Figure 4.14). The glass
transition temperature as expected increased with post-curing. The glass transition tem-
perature of the post-cured specimen correlated with Tg values determined by DSC meas-
urements. The calculated cross-link density (υ) of the samples scattered with the increas-
ing concentration of the reaction product due to post-curing during the measurement. The
post-cured specimens showed a clear decreasing tendency in cross-link density with the
concentration of the solutions. The tanδ values decreased with post-curing (Table 4.4).
The cured specimens showed good thermal stability. The thermal degradation occurred
near 350-360 °C.

Chapter 4
90
Table 4.4 Storage modulus, tanδ and cross-link density of the epoxy specimens
determined with DMA
Cured Post-cured
Storage Modulus
tanδ υ
(mol m-3)
Storage Modulus
tanδ υ
(mol m-3) (GPa)
[40 °C]
(MPa)
[200 °C]
(GPa)
[40 °C]
(MPa)
[200 °C]
0% 3.52 36.35 1.204 9240.5 2.89 31.81 0.997 8086.4
5% 2.76 25.21 1.199 6408.6 2.72 29.49 0.985 7496.6
10% 2.85 27.52 1.090 6995.8 2.43 27.06 0.922 6878.9
20% 1.79 26.43 1.199 6718.7 2.50 26.17 0.938 6652.7
30% 3.04 25.56 1.230 6497.6 2.67 24.96 0.924 6345.1
40% 1.89 26.05 1.140 6622.1 2.59 23.64 0.840 6009.5
50% 2.61 16.80 0.826 4270.7 2.56 16.91 0.837 4298,7
4.3.5. Mechanical properties
The standard tensile tests and instrumented impact resistance measurements were
conducted to characterize the mechanical properties of the moulded epoxy specimens
(Table 4.5). The test temperature was far below the Tg of the specimens. Thus, the data
were expected to scatter and mostly depend on the flaws of the moulding. Due to the
increasing initial viscosity of the resin systems the degassing became less-effective. The
more concentrated the cross-linker solution was the more bubbles remained within the
resin mixture. In the case of the 40% and 50% specimens near flawless specimens could
not be obtained. These bubbles acted as flaws during mechanical testing and decreased
the mechanical properties. In future studies and applications, low molecular weight reac-
tive diglycidyl-ether diluents will be needed to lower the initial viscosity of the resin mix-
ture to insure flawless moulding. In this study no reactive diglycidyl-ether diluents were
used to consistently report the properties of the cross-linked resins. As expected from an
epoxy resin the specimen showed rigid behavior. The impact test showed no significant
difference between the different resin mixtures (Figure 4.15). The pure IPD cross-linked
samples had the highest impact resistance due to the lack of bubbles in the specimens.
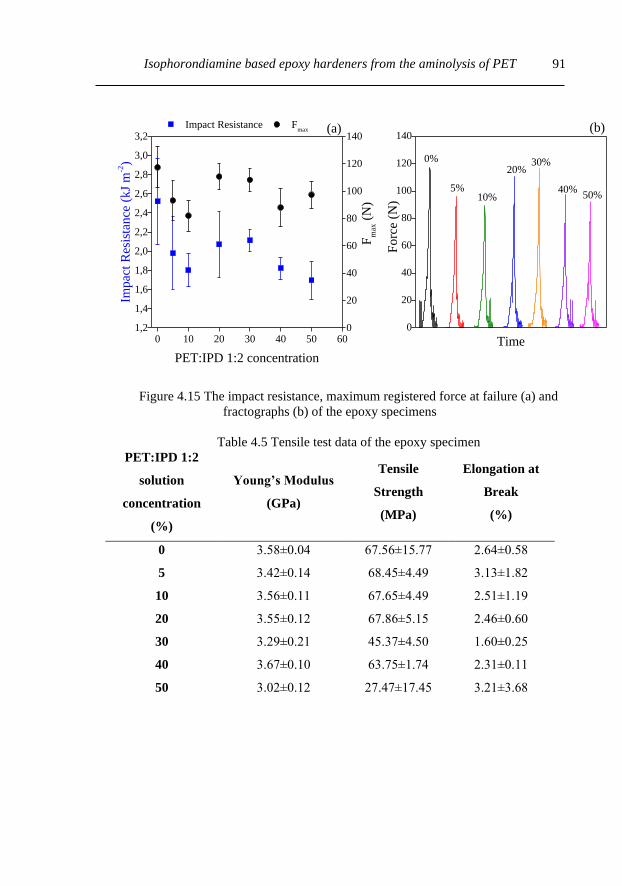
Isophorondiamine based epoxy hardeners from the aminolysis of PET
91
0 10 20 30 40 50 601,2
1,4
1,6
1,8
2,0
2,2
2,4
2,6
2,8
3,0
3,2 Impact Resistance
Impac
t R
esis
tance
(kJ
m-2)
PET:IPD 1:2 concentration
0
20
40
60
80
100
120
140 F
max
Fm
ax (
N)
0
20
40
60
80
100
120
140(b)
Forc
e (N
)
Time
0%
5%10%
20%30%
40%50%
(a)
Figure 4.15 The impact resistance, maximum registered force at failure (a) and
fractographs (b) of the epoxy specimens
Table 4.5 Tensile test data of the epoxy specimen
PET:IPD 1:2
solution
concentration
(%)
Young’s Modulus
(GPa)
Tensile
Strength
(MPa)
Elongation at
Break
(%)
0 3.58±0.04 67.56±15.77 2.64±0.58
5 3.42±0.14 68.45±4.49 3.13±1.82
10 3.56±0.11 67.65±4.49 2.51±1.19
20 3.55±0.12 67.86±5.15 2.46±0.60
30 3.29±0.21 45.37±4.50 1.60±0.25
40 3.67±0.10 63.75±1.74 2.31±0.11
50 3.02±0.12 27.47±17.45 3.21±3.68

Chapter 4
92
4.4. Conclusions
The purpose of this study was to investigate the use of raw aminolysis products as
cross-linking agents for epoxy resins. The authors proposed the accelerative nature of the
EG side product, and the terephthal-amide-diamine main products during the epoxy cur-
ing reaction.
The aminolysis of PET was carried out with an epoxy hardener, isophoron-dia-
mine. The raw reaction product was further used without any purification steps. The
chemical structure of the produced terephthalic-amide-diamines was identified with
NMR measurements. Full assignation of the spectra was done based on the correlative
2D-NMR spectra (1H-1H COSY, 1H-1H NOESY, 1H-13C HSQC, 1H-13C HMBC and 1H-15N HMBC). Cross-linker solutions of the aminolysis product with IPD were prepared
(0-50 weight %) and used for the curing of the epoxy resins. The solutions were easy to
prepare with additional IPD during or right after the aminolysis process. The curing of
the epoxy resin was characterized with isothermal DSC (at 90 °C) and rotational visco-
simetry (at 50 °C) measurements. The reaction heat was found to increase with the con-
centration of the cross-linker solution. The rotational viscosimetry measurements showed
a significant acceleration effect of the aminolysis product on cross-linking. The catalytic
effect of the terephthal-amide-diamines was demonstrated using model IPD-EG solu-
tions. The results clearly proved the catalytic behavior amides, it clearly exceeded the
model IPD-EG solutions. The results of the thermomechanical measurements showed de-
crease in the glass transition temperature of the epoxy resins. The longer terephthal-amide
molecules, compared to IPD formed longer links between the polymeric chains. The con-
centration of the aminolysis product increased the number of longer cross-links, thus the
cross-link density decreased. The mechanical properties at room temperature showed no
significant change with the concentration of the cross-linker solutions. The resins showed
rigid behavior, any loss in mechanical properties can be attributed to the flaws (bubbles)
from the preparation and curing processes.
The findings of this study showed a simpler, greener way to process and use PET
aminolysis products. The lack of expensive purification steps even proved to be advanta-
geous during the epoxy curing reaction, and provided a faster curing for IPD based epoxy
systems.
Isophorondiamine based epoxy hardeners from the aminolysis of PET
93
4.5. References
1 F. A. Cruz Sanchez, H. Boudaoud, S. Hoppe and M. Camargo, Addit. Manuf.,
2017, 17, 87–105.
2 R. Geyer, J. R. Jambeck and K. L. Law, Sci. Adv., 2017, 3, 5.
3 K. Ragaert, L. Delva and K. Van Geem, Waste Manag., 2017, 69, 24–58.
4 J. Maris, S. Bourdon, J. M. Brossard, L. Cauret, L. Fontaine and V. Montembault,
Polym. Degrad. Stab., 2018, 147, 245–266.
5 I. S. Duarte, A. A. Tavares, P. S. Lima, D. L. A. C. S. Andrade, L. H. Carvalho,
E. L. Canedo and S. M. L. Silva, Polym. Degrad. Stab., 2016, 124, 26–34.
6 K. Hamad, M. Kaseem and F. Deri, Polym. Degrad. Stab., 2013, 98, 2801–2812.
7 N. Bahlouli, D. Pessey, C. Raveyre, J. Guillet, S. Ahzi, A. Dahoun and J. Marie,
Mater. Des., 2012, 33, 451–458.
8 N. Mizamzul and S. Kamaruddin, J. Mater. Process. Tech., 2011, 211, 1989–
1994.
9 H. M. da Costa, V. D. Ramos and M. G. de Oliveira, Polym. Test., 2007, 26, 676–
684.
10 M. Żenkiewicz, J. Richert, P. Rytlewski, K. Moraczewski, M. Stepczyńska and
T. Karasiewicz, Polym. Test., 2009, 28, 412–418.
11 A. M. Al-Sabagh, F. Z. Yehia, D. R. K. K. Harding, G. Eshaq and A. E.
ElMetwally, Green Chem., 2016, 18, 3997–4003.
12 A. Stoski, M. F. Viante, C. S. Nunes, E. C. Muniz, M. L. Felsner and C. A. P.
Almeida, Polym. Int., 2016, 65, 1024–1030.
13 Q. Suo, J. Zi, Z. Bai and S. Qi, Catal. Letters, 2017, 147, 240–252.
14 C. Jehanno, I. Flores, A. P. Dove, A. J. Müller, F. Ruipérez and H. Sardon, Green
Chem., 2018, 20, 1205–1212.
15 Z. Guo, K. Lindqvist and H. de la Motte, J. Appl. Polym. Sci., 2018, 135, 6–11.
16 L. Kárpáti, G. Szarka, M. Hartman and V. Vargha, Period. Polytech. Chem. Eng.,
2018, 62, 336–344.
17 V. Jamdar, M. Kathalewar and A. Sabnis, J. Polym. Environ., 2018, 26, 2601–
2618.
18 M. Teotia, N. Tarannum and R. K. Soni, J. Appl. Polym. Sci., 2017, 134, 45153.
19 A. P. More, R. A. Kute and S. T. Mhaske, Iran. Polym. J. (English Ed., 2014, 23,
59–67.
20 K. Fukushima, J. M. Lecuyer, D. S. Wei, H. W. Horn, G. O. Jones, H. A. Al-
Megren, A. M. Alabdulrahman, F. D. Alsewailem, M. A. McNeil, J. E. Rice and
J. L. Hedrick, Polym. Chem., 2013, 4, 1610–1616.
21 G. Eshaq and A. E. Elmetwally, J. Mol. Liq., 2016, 214, 1–6.
22 H. W. Horn, G. O. Jones, D. S. Wei, K. Fukushima, J. M. Lecuyer, D. J. Coady,
J. L. Hedrick and J. E. Rice, J. Phys. Chem. A, 2012, 116, 12389–12398.
23 C. N. Hoang and Y. H. Dang, Polym. Degrad. Stab., 2013, 98, 697–708.
24 M. M. Aslzadeh, G. M. M. Sadeghi and M. Abdouss, Materwiss. Werksttech.,
2010, 41, 682–688.
25 M. E. Tawfik, N. M. Ahmed and S. B. Eskander, J. Appl. Polym. Sci., 2011, 120,
2842–2855.
26 C. Jehanno, M. M. Pérez-Madrigal, J. Demarteau, H. Sardon and A. P. Dove,
Polym. Chem., 2019, 10, 172–186.

Chapter 4
94
27 Y. S. Parab, P. A. Wasekar, S. T. Mhaske and S. R. Shukla, Polym. Bull., 2014,
71, 2695–2707.
28 E. Bulak and I. Acar, Polym. Eng. Sci., 2014, 54, 2272–2281.
29 V. S. Palekar, A. J. Damle and S. R. Shukla, Eur. J. Med. Chem., 2009, 44, 5112–
5116.
30 K. Dutt and R. K. Soni, Int. J. Plast. Technol., 2014, 18, 16–26.
31 L. Shechter and J. Wynstra, Ind. Eng. Chem., 1956, 48, 86–93.
32 L. Shechter, J. Wynstra and R. P. Kurkjy, Ind. Eng. Chem., 1956, 48, 94–97.
33 I. T. Smith, Polymer (Guildf)., 1961, 2, 95–108.
34 J.-E. Ehlers, N. G. Rondan, L. K. Huynh, H. Pham, M. Marks and T. N. Truong,
Macromolecules, 2007, 40, 4370–4377.
35 R. F. Fedors, Polym. Eng. Sci., 1974, 14, 147–154.

Isophprondiamine base oligoamides: catalytic effect during epoxy curing
95
Chapter 5
Synthesis and characterisation of isphorondiamine based
oligoamides: catalytic effect of amides during the curing of
epoxy resins4
5.1. Introduction
Epoxy resins are versatile materials, they have excellent physical and chemical
properties that make them perfect for various uses. Their properties can be fine-tuned by
changing their precursor components and their cure circumstances1–12. Usually various
amines, anhydrides and acids are used to cross-link the epoxy (diglycidyl-ether) compo-
nents. During the curing reaction the glycidyl-ether reacts with the cross-linker via a ring-
opening addition reaction. The reactivity of the cross-linking agent determines the pro-
cessing and curing of the resins. Several publications have shown and studied the curing,
reactivity, and reaction mechanism of epoxy systems13–31. The ring-opening of the glyc-
idyl-ethers can be enhanced with catalyst that can form hydrogen bonds with the glyc-
idyl-ether ring13,14,24,32–35. Without any additional catalyst, the curing reaction produces
secondary hydroxyl groups from the ring-opening of the glycidyl-ether groups. Thus, the
curing of the epoxy resins is autocatalytic, and it could be further enhanced by introducing
additional catalytic compounds, accelerators into the resins system. The following hydro-
gen bond donors were found to accelerate the reaction of epoxy compounds and amines
(listed from the most effective to the least effective): -OH (Ph- >PhCH2- >RCH2-
>H-), -COOH, -SO3H, -CONH2, -SO2NH236. These hydrogen bond donors are mostly
considered accelerators by the literature, not catalyst (tertiary amines, imidazols and
ureas) since they could react with the epoxy derivatives.
In our previous study we have synthesized terephthal-amides via the aminolysis
of PET with isophorondiamine (IPD)37. These terephthal-amides were proven to have a
considerably accelerative effect on the curing of epoxy resins. So far there has been little
discussion about the use of PET aminolysis products in epoxy curing 37–41, and there is no
record on their catalytic, accelerative effect nor on its quantitative description. Neverthe-
less their hydrogen donor capabilities are well described and has a decisive role in poly-
amides and their derivatives 42–47. Most of the aminolysis related articles focused on the
catalysis of the solvolysis reaction; or various uses such as PVC plasticizer, dyes and
anticorrosive components of paints, drugs with anti-bacterial and anti-inflammation ef-
fects; and alkyd resin components 48–52. Almost all of these studies utilized high ratio of
amines (1:3 – 1:7 ester-amine ratio) and various purification steps to gain their final prod-
uct. This concept has recently been challenged in our recent studies and we have tried to
make use of raw solvolysis products and apply as low amount of reagents as possible 37,53,54.
4 L. Kárpáti, Á. Ganyecz, T. Nagy, G. Hamar, E. Banka, M. Kállay, and V. Vargha, Polymer Bulletin
2020, 77, 4655–4678.

Chapter 5
96
In this study we have further attempted to reduce the used amount of diamine in
an aminolysis reaction to obtain higher molecular weighed oligoamides. Three different
ratios of PET and isophorondiamine were used (1:1, 1:1.5 and 1:2) (Figure 5.1). The pro-
duced aminolysis products were characterized with functional group analysis, thermal
gravimetric analysis (TGA), Fourier transformation infrared spectroscopy (FTIR), solu-
tion capillary viscosimetry, nuclear magnetic resonance spectroscopy (NMR), and ma-
trix-assisted laser desorption/ionization time of flight mass spectroscopy (MALDI-TOF)
measurements.
Figure 5.1 Terephthal-amide production from the aminolysis reaction of PET
without excess IPD
The main focus of this study was to quantitively characterize the accelerative ef-
fect of the produced terephthal-amides during epoxy curing. Two solutions series in IPD
were prepared of the 1:1.5 and 1:2 reaction products and were used as amine cross-linkers
in the curing of epoxy resins. The accelerative effect of the cross-linker solutions was
studied with rotational viscosimetry and differential scanning calorimetry (DSC). The re-
action kinetics of the curing was studied at 40 °C, 60 °C, 80 °C, 90 °C and 100 °C.
Kamal-Sourour and its revised forms were used to determine the reaction rate and activa-
tion energy of the curing reaction. Density functional theory (DFT) and local coupled
cluster (CC) quantum chemical methods were used to calculate and compare the acceler-
ative effect of the terephthal-amides to other accelerators, catalyst.
5.2. Experimental
5.2.1. Materials
DSM Arnite® D00 301 PET granules were used for PET aminolysis (28.5±1,5 %
crystallinity). Isophorondiamine IPOX® ER 2943 (IPD) (η: 5-25 mPas, ρ: 0.92 g cm-3,
Amine value: 645-675 mgKOH g-1), and bisphenol-A-diglycidyl-ether IPOX® EH1010
(η: 10000-14000 mPas, ρ: 1.17 g cm-3, EE: 180-196 g mol-1) were purchased from Ipox
Chemicals. Zink-acetate (Zn(OAc)2.2H2O) was purchased from BDH Chemicals. Pyri-
dine (99%), N,N-dimethyl-formamide (99%)(DMF), potassium hydroxide (99%), hydro-
chloric acid (37%) and phthalic anhydride (99%) were purchased from Molar Chemicals.
DMSO-d6 (99,9%) was purchased from Sigma Aldrich.

Isophprondiamine base oligoamides: catalytic effect during epoxy curing
97
5.2.2. Aminolysis of PET with IPD
Aminolysis of PET was carried out in a 100 cm3 round bottom four-necked glass
flask equipped with a mechanical stirrer, thermometer, gas inlet (Ar gas), and reflux con-
denser. 50 g PET and 0.5 g zinc-acetate were weighed in the glass flask. The amount of
IPD was calculated to the ester groups of the weighed in PET granules to 1:1, 1:1.5, and
1:2 ratios. No excess IPD was used during the aminolysis reaction. The reaction mixture
was heated to 200 °C and was kept there for 4 hours. The viscous yellowy melt at the end
of the reaction was poured into an alumina pan. The reactions’ products were used with-
out any purification.
5.2.3. Characterization of oligo-terephthalamides
Amine and hydroxyl functionality were determined with titration methods. 3-3
parallel samples of 0.1-0.2 g weighed with analytical accuracy, were dissolved in DMF.
The 3-3 and the blank samples were titrated with 0.1 M hydrochloric acid to determine
the amine content. Three drops of bromocresole-green solution were added and used as
an indicator. The hydroxyl content was determined with a back-titration method. 3-3 par-
allel samples of 1.8-2.0 g weighed with analytical accuracy were dissolved in 25 cm3 1
M phthalic-anhydride solution in pyridine. The 3-3 parallel and a blank sample were re-
fluxed at 110 °C in oil baths for 2 hours. As the samples cooled down 50 cm3 pyridine
was added through the condenser. The samples were titrated with 0.5 M aqueous NaOH
solution. Phenolphthalein was used as an indicator.
Solution viscosimetry was used to compare the molecular weight of the aminolysis
products. A 5-point solution series was used (0.02, 0.04, 0.06, 0.08 and 0.10 g cm-3) to
determine the intrinsic viscosity of the 1:1.5 and 1:2 ratio samples. The samples were
weighed in Erlenmeyer flasks with analytical precision and were dissolved in ethanol.
The samples were refluxed for 30 minutes to dissolve the reaction products. The samples
were measured at 40 °C in an Ubbelohde type capillary viscosimeter. The intrinsic vis-
cosity of the samples was calculated from the reduced and relative viscosity of the con-
centration series.
A Brucker Tensor 27 FTIR spectrometer was used to measure the FTIR spectra.
The products were measured in KBr pastilles. 28 parallel scans were made between 4000-
400 cm-1 interval. 1H, 13C, 1H-1H COSY, 1H-1H NOESY, 1H-13C HSQC and 1H-13C
HMBC NMR spectra were recorded with a Bruker Avance 300 spectrometer. The 50 mg
samples were dissolved in 1 cm3 of DMSO-d6.
The mass spectrometric measurements were carried out with a Bruker Autoflex
Speed MALDI-TOF instrument. Ion source voltage 1, ion source voltage 2, reflector volt-
age 1, and reflector voltage 2 were 19 kV, 16.65 kV, 21 kV and 9.55 kV, respectively.
The instrument was equipped with a solid phase laser (355 nm) operating at 1000 Hz. For
each measurement 5000 shots were summed. The MALDI spectra were calibrated with
PEG standards. The samples, the matrix (2,5-dihydroxybenzoic acid), and the ionizing
agent (sodium trifluoroacetate) were solved at a concentration of 5 mg cm-3, 20 mg cm-3
and 5 mg cm-3 in THF, respectively. The mixing ratio was 2:10:1 (sample, matrix, ioniz-
ing agent). A volume of 0.2 mm3 of the solutions was deposited onto a MALDI target
plate and allowed to air-dry.

Chapter 5
98
The reaction products were purified before the NMR measurements. The reaction
products were first dissolved in ethanol, then the solution was dropwise added to distilled
water to precipitate the terephthal-amides. The precipitate was washed thoroughly with
water to remove the EG. The precipitate was dissolved in ethanol, the solvent was re-
moved with a vacuum apparatus. At the end of the purification steps amorphous, yellowy
powder was obtained..
5.2.3. Epoxi preparation and characterization
A solution series of the 1:1.5 and 1:2 ratio aminolysis products were prepared to use as
cross-linking agents. The 1:1.5 reaction product was dissolved in the commercial IPD to
gain 5, 10, 15, 20, and 30 % solutions. The 1:1.5 15% and 30% solutions were used for
the reaction kinetics study. The 1:2 ratio reaction product was used to produce 30% and
50% solutions with IPD for reaction kinetics measurements. The reaction products and
the IPD were weighed in with analytical accuracy in Erlenmeyer flasks. The flasks were
equipped on reflux condensers and were heated with an oil bath to 110-120 °C. The so-
lutions were heated, stirred with a magnetic stirrer, and let to reflux until no solid residue
remained in the flasks. The 1:1.5 solutions took 3-4 hours to completely dissolve, while
the 1:2 solution took only 1 hour. The amine content of the solutions was measured as
previously described. It must be noted that, since the aminolysis products were used with-
out any purification steps the residual zinc-acetate catalyst from the aminolysis reaction
might influence the curing of the epoxy specimen. The effect of zinc-acetate was not
investigated in this thesis. The theoretical conecentration of the salt in the cross-linker
solutions is between 0.02-0.2 m/m% interval.
The epoxy value of the base resin was measured with a back-titration method. Pyri-
dine-hydrochloride reagent solution in pyridine was prepared by dissolving 16 cm3 con-
centrated hydrochloric acid in 1 dm3 pyridine. 0.1-0.2 g samples of the epoxy resin were
weighed in Erlenmeyer flasks and were dissolved in 25 cm3 of pyridine-hydrochloride
solution in pyridine. The samples were let to reflux for 1 hour, then after they cooled
down, 10 cm3 distilled water was added through the condenser. 0.1 M sodium hydroxide
solution (in methanol) was used to titrate the samples in the presence of phenolphthalein
indicator. The stoichiometric ratios of the epoxy resin and the amine cross-linkers were
calculated based on the measured functionality. All the prepared resin samples were
mixed according to the calculated 1:1 stochiometric ratios. The epoxy samples were pre-
pared in plastic cups. The epoxy base resin was weighed in a cup and the stoichiometric
amount of the cross-linker solution was weighed with analytical precision. The epoxy
resin was vigorously mixed with a glass rod for 3 minutes.
PerkinElmer DSC7 was used for the reaction kinetics study. After the 3 minutes long
mixing period, an 8-10 mg sample was weighed in an alumina sample pan. Reaction ki-
netics studies were conducted on the commercial IPD (0 %); the 15 % and 30 % 1:1.5
solutions; and the 30 % and 50 % 1:2 solutions. The epoxy curing reaction was studied at
5 different reaction temperatures, respectively at 40 °C, 60 °C, 80 °C, 90 °C and 100 °C
with the following heat cycle. The samples were kept at 30 °C for 0.5 min than it was
heated to the cross-linking temperature with 200 °C min-1 heating rate and were kept there
for 2 hours. Then the samples were cooled down to 0 °C with 20 °C min-1 heating rate
Isophprondiamine base oligoamides: catalytic effect during epoxy curing
99
and were kept there for 1 minute. Then the samples were heated up to 250 °C with 20 °C
min-1 and kept there for 1 minute. The Tg-onset value and the residual reaction heat was
determined from this heating period. The samples cooled down to 0°C with 20 °C min-1
heating rate, then they were kept there for 1 minute and were heated back to 250 °C with
20 °C min-1 heating rate. The residual (∆𝐻𝑟𝑒𝑠) and total (∆𝐻𝑡𝑜𝑡𝑎𝑙) reaction heat (see be-
low) were used to calculate the conversion (α) of the curing. The dα/dt function was cal-
culated from the numerical derivate of the isothermal heatwave-time curve. The Tg of the
1:1.5 0-30% series was determined from the last heating period (the isothermal step was
at 90 °C).
The total reaction heat of the cross-linking reaction was determined via a screening
method. The samples (3-5 mg) were kept at 30 °C for 0.5 mins then were cooled down to
0 °C. Then the samples were heated with 20 °C min-1 heating rate to 250 °C and were
kept there for 1 minute. The total reaction heat was determined from the exothermal peak
located at this period. Then the samples cooled to 0 °C with 20 °C min-1 and were kept
there for 1 minute. The cooling curves were checked for any residual reaction heat. The
samples were then heated up to 250 °C with 20 °C min-1.
5.2.4. Quantum chemical computation
The geometry optimizations, transition state searches, and frequency calculations were
carried out using the B3LYP functional 55 with the 6-31G(d,p) basis set 56 utilizing the
Gaussian 09 quantum chemistry program 57. The Gibbs free energy barrier (𝛥𝐺(298𝐾))
of the reactions were calculated as 𝛥𝐺(298𝐾) = 𝛥𝐸𝑒 + 𝛥𝐸𝑍𝑃𝐸 + 𝛥𝐺0→298, where 𝛥𝐸𝑒is
the difference of electronic energies, 𝛥𝐸𝑍𝑃𝐸is the difference of zero-point vibrational en-
ergies, while 𝛥𝐺0→298 is the difference of thermal corrections to free energy between the
initial and transition states. To improve the accuracy of the results single-point calcula-
tions were performed for the preferred reaction path using the local natural orbital cou-
pled-cluster singles, doubles, and perturbative triples [LNO-CCSD(T)] method 58 with
the aug-cc-pVTZ basis set 59 using of the MRCC program suite 60. Then, the B3LYP/6-
31G(d,p) electronic energy was replaced with the obtained LNO-CCSD(T)/aug-cc-pVTZ
electronic energy to get the improved free energy barrier.
5.3. Results and discussion
5.3.1. Oligo-terephthalamides characterization
Functional group analysis, FTIR and TGA measurements were used to determine
the success of the aminolysis reaction. The measured amine values decreasing with the
ratio of IPD. This suggests that different molecular weighed terephthal-amides were pro-
duced (Table 5.1). Based on the measured amine values the main components of the 1:1.5
and 1:2 reaction should be the monomer (4.26 mmol g-1, 470.69 g mol-1) and dimer (2.60
mmol g-1; 771.09 g mol-1) terephthal-amid derivates. The molecular weight difference
between the two products was also confirmed with solution viscosimetry. The intrinsic
viscosity of the 1:1.5 product was found to be significantly higher than the 1:2 ratios

Chapter 5
100
products. The hydroxyl content of the reaction products comes from ethylene-glycol. The
OH content of the 1:2 and 1:1.5 ratio reaction products were 80-90% of the theoretical
maximum that derives from the weighed in PET granules. The hydroxyl content of the
1:1 ratio product was 43%.
Table 5.1 Functional group content and intrinsic viscosity of the aminolysis
products
PET: Amine ratio Amine content
(mmol g-1)
OH content
(mmol g-1)
Intrinsic viscosity
(cm3 g-1)
1:1 1.12±0.74 2.39±0.398 -
1:1.5 2.38±0.05 3.49±0.019 0.0437
1:2 3.65±0.26 3.89±0.013 0.0119
4000 3600 3200 2800 1600 1200 800 400
Ab
sorb
an
ce
Wavenumber (cm-1)
PET
1:1
1:1.5
1:2
1715
1230
1638 1549
Figure 5.2 FTIR spectra of the aminolysis products and the PET granules
In the cases of 1:1.5 and 1:2 no residual ester groups were present, the total amidation
was achieved (1640 cm-1 amide carbonyl valence vibration, 1549 cm-1 N-H plain bending
deformation). The ester attributed peaks (1720 cm-1 ester carbonyl valence vibration,
1530 cm-1 ester C-O-C bending vibration) were absent from their FTIR spectra. The char-
acteristic end-group (-Ph-COO-CH2-CH2-OH) rocking vibrations of PET at 720 cm-1 dis-
appeared in the aminolysis products. The 1:1 reaction mixture was highly viscous at the
reaction temperature, and the reaction was hard to manage. This ratio probably resulted
in even longer oligomer chains, that had residual ester linkages as its FTIR spectrum sug-
gested (Figure 5.2). The ratio of the used IPD was too low for any practical use. Due to
the presence of residual ester groups the 1:1 ratio was not studied further. Only functional
group analysis, FTIR and TGA measurements were done on the 1:1 ratio product. The
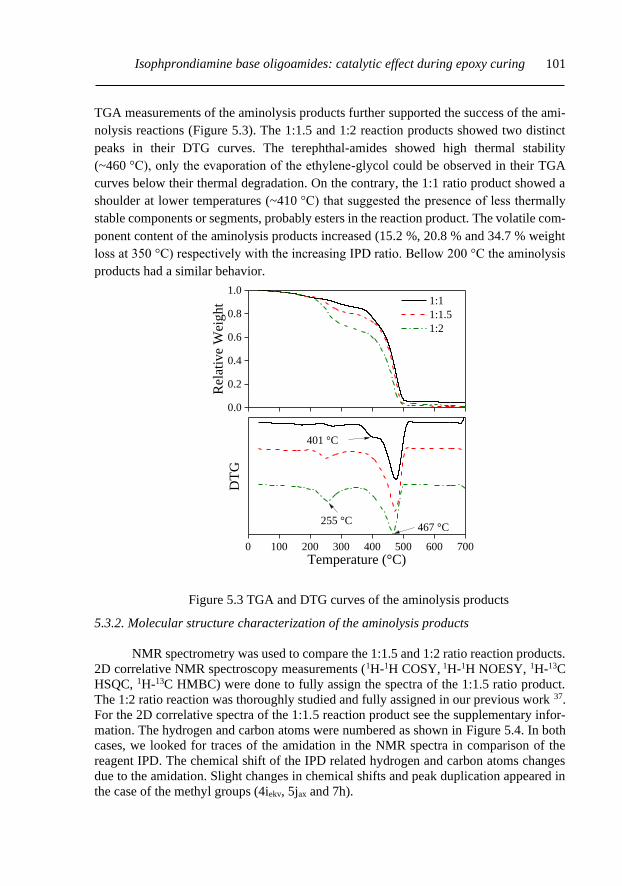
Isophprondiamine base oligoamides: catalytic effect during epoxy curing
101
TGA measurements of the aminolysis products further supported the success of the ami-
nolysis reactions (Figure 5.3). The 1:1.5 and 1:2 reaction products showed two distinct
peaks in their DTG curves. The terephthal-amides showed high thermal stability
(~460 °C), only the evaporation of the ethylene-glycol could be observed in their TGA
curves below their thermal degradation. On the contrary, the 1:1 ratio product showed a
shoulder at lower temperatures (~410 °C) that suggested the presence of less thermally
stable components or segments, probably esters in the reaction product. The volatile com-
ponent content of the aminolysis products increased (15.2 %, 20.8 % and 34.7 % weight
loss at 350 °C) respectively with the increasing IPD ratio. Bellow 200 °C the aminolysis
products had a similar behavior.
0.0
0.2
0.4
0.6
0.8
1.0
Rel
ativ
e W
eig
ht 1:1
1:1.5
1:2
0 100 200 300 400 500 600 700
DT
G
Temperature (°C)
255 °C467 °C
401 °C
Figure 5.3 TGA and DTG curves of the aminolysis products
5.3.2. Molecular structure characterization of the aminolysis products
NMR spectrometry was used to compare the 1:1.5 and 1:2 ratio reaction products.
2D correlative NMR spectroscopy measurements (1H-1H COSY, 1H-1H NOESY, 1H-13C
HSQC, 1H-13C HMBC) were done to fully assign the spectra of the 1:1.5 ratio product.
The 1:2 ratio reaction was thoroughly studied and fully assigned in our previous work 37.
For the 2D correlative spectra of the 1:1.5 reaction product see the supplementary infor-
mation. The hydrogen and carbon atoms were numbered as shown in Figure 5.4. In both
cases, we looked for traces of the amidation in the NMR spectra in comparison of the
reagent IPD. The chemical shift of the IPD related hydrogen and carbon atoms changes
due to the amidation. Slight changes in chemical shifts and peak duplication appeared in
the case of the methyl groups (4iekv, 5jax and 7h).

Chapter 5
102
9 8 7 6 5 4 3 2 1 0
1H
Chemical shift (ppm)
9' 9
10
2
DMSO
8'
8
66
7 45
2'
1 3
HDO
1.4 1.2 1.0 0.8 0.6
Chemical shift (ppm)
Figure 5.4 The 1H NMR spectrum of PET:IPD 1:1.5 and the used numbering
(numbers for H, alphabet for C) on the theorized reaction product
180 160 140 120 60 40 20 0
13C
Chemical shift (ppm)
k'k
l
m DMSO
gg'
hj
d
i
f
c
e
ab' b
Figure 5.5 13C spectrum of the 1:1.5 depolymerization product
Low intensity peaks around the a, c, e, i, j, and h main peaks can be observed in
the 13C spectra of both reaction products (Figure 5.5). These low intensity peaks indicate
the slight chemical shift changes of the carbon atoms due to the amide group formation
on one or both amine groups. The carbon and hydrogen atoms near the amide groups (2b,
8g) showed the most significant change in their chemical shifts in the 1H and 13C spectra.
The 2, 2’, 8, and 8’ peaks in the 1H were integrated for quantitative analysis. An
amine/amide ratio was calculated for both groups to compare the reactivity of the differ-
ent amines, the average amidation percentage and the number average molar masses of
the aminolysis products. As Table 5.2 shows the amide ratio changed with the initial ratio
of PET and IPD. The cycloaliphatic connected amine groups (2) showed – as expected –

Isophprondiamine base oligoamides: catalytic effect during epoxy curing
103
lower amine/amide ratio than the aliphatic connected amine groups (8). Overall the higher
aspect of amide ratio in 1:1.5 reaction product suggests a higher molecular weight as well.
The 1:1.5 product showed worse solubility in both ethanol and IPD than the 1:2 ratio
product. The specific viscosity of the samples measured in ethanol at 40°C further sup-
ported this observable difference (Table 5.1). The calculated number average molar
masses suggest that the 1:1.5 reaction product is mostly a mixture of the dimer (771.09 g
mol-1) and trimer (1071 g mol-1), and the 1:2 reaction product is mostly a mixture of mon-
omer (470.69 g mol-1) and dimer. Due to their rather high molecular weight we will refer
to the dimers, trimers or any longer chained species collectively as oligomers.
Figure 5.6 The mass spectra of PET:IPD 1:1.5 (a) and 1:2 (b) products. The structures
show the identified oligomers.
As seen in Figure 5.6, one main series appeared in both MALDI-TOF spectra
(PET:IPD, 1:1.5 and 1:2). Those series were identified as terephthal-amide oligomers
where the composition of the monomer unit is the following ((C10H19N)(C8H5O2N) (ar-
rows in Figure 5.6 a and b). The end groups are hydrogen and isophorondiamine as it is
presented in Figure 5.6. The measured m/z values are in good agreement with the simu-
lated ones. For example, the m/z of the oligomer with polymerization degree of 3 is
1093.719 (simulated) while the measured mass is 1093.731. Beside the accurate mass,
the isotopic distribution supports the chemical composition of
[C10H21N2((C10H19N)(C8H5O2N))3H+Na]+ for that adduct ion. As a minor series, the ter-
ephthal-amide oligomers appeared with hydroxyl and hydrogen end groups indicated by
red color in Figure 5.6 a and b. As it turns out from Figure 5.6, the higher PET:IPD ratio
(Figure 5.6b) results in higher molecular weight products up to m/z 3000. The number
and weight average molecular weights were determined based on the main series. The
number average molecular weights are 1040 g mol-1 and 860 g mol-1 for PET:IPD 1:1.5
and 1:2, respectively (Table 5.2.).

Chapter 5
104
Table 5.2 Quantitative characterization of the 1H spectra of the reaction products and cal-
culated number average molecular weights (NMR and MALDI-TOF)
PET:IPD
1H integral
2/2’
amine/am-
ide ratio
8/8’
amine/am-
ide ratio
��𝐧
(𝒈 𝒎𝒐𝒍−𝟏)
2 2’ 8 8’ NMR MALDI-
TOF
1:1.5 1.07 1.43 0.45 4.13 42.8/57.2 9.8/90.2 980.29 1040
1:2 0.82 1.10 1.22 2.91 57.3/42.7 29.5/70.5 569.53 860
5.3.3. Cross-linkers effect on gelation and glass transition
Table 5.3 Amine content of the cross-linking agents
Cross-linker Concentration
(%)
Amine content
(mmol g-1)
IPD 0 11.58±0.033
PE
T:I
PD
so
luti
on
serie
s
1:1.5
5 11.09±0.204
10 10.62±0.065
15 10.16±0.056
20 9.85±0.115
30 8.77±0.072
1:2 30 9.19±0.050
50 7.67±0.020
The amine values of the cross-linker solution series can be found in Table 5.3. The
1:1.5 solution series followed a linear decreasing trend with the increasing concentration
of the dissolved reaction product. In our previous work we tested the catalytic effect of
the terephthal-amides with gel time measurements and reaction heat measurements with
DSC. A solution series of a PET:IPD 1:2 ratio reaction product and a model IPD-EG
solution series were studied. We found that the terephthal-amides solutions have a signif-
icant accelerative effect on the curing of epoxy resins. Since the amide group cannot react
with the glycidyl-ether groups these molecules should be considered catalysts beside their
role as a cross-linker.
The gel point data of the 1:2 and IPD-EG solution series were added to Figure 5.7
as reference 37. The gel time of the 1:1.5 solution series followed a near linear, declining
tendency but compared to 1:2 series from our previous study higher gel time was
achieved. This result may be explained by the fact that the 1:1.5 reaction product has
higher molecular weight than the 1:2 ratio product. The higher molecular weight of the
1:1.5 product probably slowed down the diffusion of the amide groups and restricted their
availability in the system. Since the amide groups are connected (oligomers) their distri-
bution in the reaction medium is not as homogenous as the lower Mw amides. It can there-
fore be assumed that the longer oligoamides should have lower catalytic activity. Both
reaction solution series had faster gelation time than the IPD-EG model solution series.
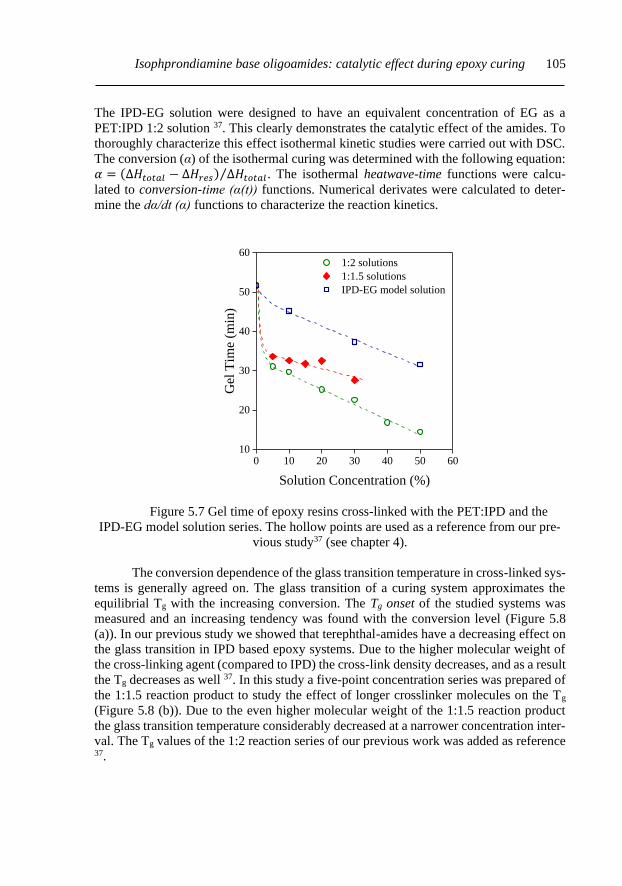
Isophprondiamine base oligoamides: catalytic effect during epoxy curing
105
The IPD-EG solution were designed to have an equivalent concentration of EG as a
PET:IPD 1:2 solution 37. This clearly demonstrates the catalytic effect of the amides. To
thoroughly characterize this effect isothermal kinetic studies were carried out with DSC.
The conversion (α) of the isothermal curing was determined with the following equation:
𝛼 = (∆𝐻𝑡𝑜𝑡𝑎𝑙 − ∆𝐻𝑟𝑒𝑠) ∆𝐻𝑡𝑜𝑡𝑎𝑙⁄ . The isothermal heatwave-time functions were calcu-
lated to conversion-time (α(t)) functions. Numerical derivates were calculated to deter-
mine the dα/dt (α) functions to characterize the reaction kinetics.
0 10 20 30 40 50 6010
20
30
40
50
60
Gel
Tim
e (m
in)
Solution Concentration (%)
1:2 solutions
1:1.5 solutions
IPD-EG model solution
Figure 5.7 Gel time of epoxy resins cross-linked with the PET:IPD and the
IPD-EG model solution series. The hollow points are used as a reference from our pre-
vious study37 (see chapter 4).
The conversion dependence of the glass transition temperature in cross-linked sys-
tems is generally agreed on. The glass transition of a curing system approximates the
equilibrial Tg with the increasing conversion. The Tg onset of the studied systems was
measured and an increasing tendency was found with the conversion level (Figure 5.8
(a)). In our previous study we showed that terephthal-amides have a decreasing effect on
the glass transition in IPD based epoxy systems. Due to the higher molecular weight of
the cross-linking agent (compared to IPD) the cross-link density decreases, and as a result
the Tg decreases as well 37. In this study a five-point concentration series was prepared of
the 1:1.5 reaction product to study the effect of longer crosslinker molecules on the Tg
(Figure 5.8 (b)). Due to the even higher molecular weight of the 1:1.5 reaction product
the glass transition temperature considerably decreased at a narrower concentration inter-
val. The Tg values of the 1:2 reaction series of our previous work was added as reference 37.

Chapter 5
106
0 10 20 30 40 50 60125
130
135
140
145
150
155
160(b)
1:2
1:1.5G
lass
Tra
nsi
tion T
emper
ature
(°C
)
PET:IPD solution concentration (%)
(a)
0.5 0.6 0.7 0.8 0.9 1.020
40
60
80
100
120
140
0
1:2 30%
1:2 50%
1:1.5 15%
1:1.5 30%
Tg O
nse
t
Figure 5.8 The Tg onset (a) and the Tg (b) of epoxy resins cross-linked with the
PET:IPD solution series The hollow points are used as a reference from our previous
study 37 (see chapter 4).
5.3.4. Epoxy crosslinking kinetics characterization
Five different cross-linkers were compared in our kinetics study at five different
curing temperatures. Commercial IPD (IPOX® ER 2943) was used as a reference. 1:2
30 % and 50 % solutions and 1:1.5 15% and 30% solutions were used to quantitatively
compare the reaction products and the reference material. Figure 5.9 demonstrates the
differences between the IPD and the terephthal-amide solutions((a) IPD, (b) 1:1.5 solu-
tions, (c) 1:2 solutions). Just as the gelation measurements suggested the terephthal-amide
solutions proved to be more active during cross-linking than the IPD. The reaction rate
increased with the cross-linking temperature and in almost all cases the IPD < 1:1.5 < 1:2
trend can be observed.
0.0 0.2 0.4 0.6 0.8 1.00.0
0.1
0.2
0.3
0.4(c)(b) 0 40°C
0 60°C
0 80°C
0 90°C
0 100°C
d
dt
(a)
0.0 0.2 0.4 0.6 0.8 1.0
1:2 30% 40°C
1:2 30% 60°C
1:2 30% 80°C
1:2 30% 90°C
1:2 30% 100°C
1:2 50% 40°C
1:2 50% 60°C
1:2 50% 80°C
1:2 50% 90°C
1:2 50% 100°C
0.0 0.2 0.4 0.6 0.8 1.0
1:1.5 15% 40°C
1:1.5 15% 60°C
1:1.5 15% 80°C
1:1.5 15% 90°C
1:1.5 15% 100°C
1:1.5 30% 40°C
1:1.5 30% 60°C
1:1.5 30% 80°C
1:1.5 30% 90°C
1:1.5 30% 100°C
Figure 5.9 The dα/dt (α) functions during curing of the different cross-linker
types. Commercial IPD (a), 1:1.15 series (b) and 1:2 series (c).

Isophprondiamine base oligoamides: catalytic effect during epoxy curing
107
0.0 0.2 0.4 0.6 0.8 1.00.000
0.005
0.010
0.015
0.020
90 °C
80 °C60 °Cd
dt
40 °C
0.0 0.2 0.4 0.6 0.8 1.00.00
0.02
0.04
0.06
d
dt
0.0 0.2 0.4 0.6 0.8 1.00.00
0.05
0.10
0.15
d
dt
0.0 0.2 0.4 0.6 0.8 1.00.0
0.1
0.2
0.3
d
dt
0.0 0.2 0.4 0.6 0.8 1.00.0
0.1
0.2
0.3
0.4
100 °Cd
dt
0.00.20.40.60.81.00.000.050.100.150.200.250.300.350.40
0
1:2 30%
1:2 50%
1:1.5 15%
1:1.5 30%
Figure 5.10 The dα/dt (α) functions plotted at different curing temperatures
Figure 5.10 is used to compare the cross-linkers at different curing temperatures.
The commercial IPD was the least active and the 1:2 50 % solutions were the most active
at all the curing temperatures. The 1:1.5 15 % solution was the least active among the
terephthal-amide solutions. The 1:1.5 30 % and 1:2 30% solutions “competed”, at the
early stages of the reaction (α=0-0.4). The 1:2 30% solution showed higher activity at
60 °C, 80 °C and 90 °C. 1:1.5 30% and 1:2 30 % solutions had similar reactivity at 100
°C. These trends and activity ranking were completely disrupted at 40 °C because the
curing reaction was substantially governed by diffusion. The amide catalytic effect kick-
started the reactions even at this low temperature, but the high molecular weighed com-
ponents significantly increased the viscosity and diffusion rates. Thus, almost none of the
samples except 1:2 30 % could achieve higher than 60 % conversion. Since the viscosity
of this sample is lower than any of the used terephthal-amide solutions (see supplemen-
tary information) the amide catalytic effect might have been able to push the reaction
further to a higher conversion rate37. The conversion rate increased with the curing tem-
perature and approximated 100 %. The dα/dt (α) functions of the least active cross-linkers
showed a plateau like behavior. This indicates a decrease in the activity of the reaction
and the increasing influence of diffusion during curing. The slope of the dα/dt (α) func-
tions started to follow a near linear declining trend around a 40% conversion rate. At
higher temperatures (80 °C, 90 °C and 100 °C) a second change of slope can be observed
around 60% conversion rate that indicated the slowing down of the reaction.
Three kinetic models, the Kamal-Sourour (eq. 1) 26,27, a revised Kamal model by
Cole diffusion factor (fd(α)) (eq. 2) 29 and revised Kamal model by Fournier diffusion
factor (eq. 3) 31 were used to fit to the dα/dt (α) functions. The revisions on the Kamal-
Sourour model serve as a way to consider the diffusion-controlled regime of the curing

Chapter 5
108
reaction with a fd(α) function. The k1 and k2 are the kinetic rate constants of the uncata-
lyzed and autocatalyzed reaction respectively. The n and m are fitting parameters thought
to be connected to the order of the reaction (n+m), they allow a more precise fitting. As
the reaction progresses the increase in molecular weight slows down the reaction. The αc
parameter in eq. 2 is defined as the critical conversion point where the diffusion control
becomes dominant over chemically controlled regime. The C is a fit parameter. The αf in
eq. 3 is not a fit parameter, it is the maximal conversion that was achieved during the
isothermal curing. The b parameter is a fit parameter. Since eq. 2 and eq. 3 are quite
similar the C~b-1 relationship is expected. 𝑑𝛼
𝑑𝑡= (𝑘1 + 𝑘2𝛼𝑚)(1 − 𝛼)𝑛 (1)
𝑑𝛼
𝑑𝑡= (𝑘1 + 𝑘2𝛼𝑚)(1 − 𝛼)𝑛(1 + exp(𝐶(𝛼 − 𝛼𝑐)))
−1 (2)
𝑑𝛼
𝑑𝑡= (𝑘1 + 𝑘2𝛼𝑚)(1 − 𝛼)𝑛 (2 (1 + exp (
𝛼 − 𝛼𝑓
𝑏))
−1
− 1) (3)
The three models resulted in similar k1 and k2 reaction rate constants. The revised
models resulted in better fits at lower (40 °C and 60 °C) curing temperatures. At higher
cure temperatures (80 °C, 90 °C and 100 °C) the three models resulted in almost identical
k1 and k2 values. The Arrhenius plot of both k1 and k2 showed declining tendency indicat-
ing that the reactions became more active at higher temperatures, although k1 scattered
considerably (Figure 5.11). The autocatalytic k2 rate constant followed an almost linear
tendency in the Arrhenius plot and is several magnitudes higher than k1. The calculated
k2 values allowed us to rank the autocatalytic activity of the cross-linking agents. The
following rank was found at all curing temperature with all the applied models: commer-
cial IPD < 1:1.5 15%< 1:1.5 30%< 1:2 30%< 1:2 50%. The 40 °C and 60 °C k2 values
diverged from the linear determined by k2 values determined at higher cure temperatures.
This could be explained by the stronger effect of the diffusion-controlled regime at lower
temperatures. The higher diffusion rate causes the reaction to diverge from the classical
Arrhenius type behavior. Thus, the calculated values will shift. Due to these reasons only
the higher cure temperature data (80 °C, 90 °C and 100 °C) were used to calculate the
activation energy of the auto-catalytic reactions.

Isophprondiamine base oligoamides: catalytic effect during epoxy curing
109
0.0026 0.0028 0.0030 0.0032 0.0034-10
-8
-6
-4
-2
0Kamal-Sourour 0
1:2 30%
1:2 50%
1:1.5 15%
1:1.5 30%
ln k
1
1/T (K-1)
Kamal-Sourour
(a) (b)
0.0026 0.0028 0.0030 0.0032 0.0034-10
-8
-6
-4
-2
0
ln k
2
1/T (K-1
)
Figure 5.11 Arrhenius plot of k1 and k2 reaction rate constants calculated with the
Kamal-Sourour model equation
The n and m fit parameters both showed an increasing tendency with the cure tem-
perature (Figure 5.12). The m parameter showed almost no dependence on the cross-link-
ing agent, a clear monotone increasing tendency was found between the 0-0.4 interval.
The m parameter is almost independent on the used model and it clearly resembled the
dependence of k2 on temperature. On the other hand, just as k1 the n parameter strongly
coherently changed with the temperature, the cross-linking agent, and the applied model.
The n parameter value scattered between a wide interval. The n and m parameters calcu-
lated from the revised Kamal models (eq. 2 and eq. 3) shifted to lower values at the lower
cure temperatures (40 °C and 60 °C). n+m is thought to be the overall reaction order and
it is usually between the 2-3 interval. In our case n+m scattered around 2 in the 1.5-2.5
interval. Although in some cases with the revised Kamal models even n+m<1 was ob-
served at 40 °C and 60 °C; that probably results from the mistakes of the fitting process.
There is no general agreement about the value and temperature dependence of these pa-
rameters.
20 40 60 80 100 1200.0
0.5
1.0
1.5
2.0
2.5
n a
nd m
Temperature (°C)
Kamal-Sourour
m
n
20 40 60 80 100 120
Temperature (°C)
Cole
n
m
20 40 60 80 100 120
Temperature (°C)
n
m
Fournier
20 40 60 80 100120
0 1:2 30% 1:2 50% 1:1.5 15% 1:1.5 30%
Figure 5.12 The n and m fit parameters calculated from the Kamal-Sourour, Cole and
Fournier models.

Chapter 5
110
Figure 5.13 shows the fit parameters of the revised Kamal models (eq. 2 and eq. 3).
Eq. 2 and eq. 3 are similarly built models, but their principals differ. Eq. 2 utilizes αc as a
fit parameter and defines it as the critical conversion point where the diffusion-controlled
regime becomes dominant over the chemically controlled regime. On the contrary the αf
in eq. 3 is the maximum conversion reached during the isothermal curing. In our case αc
approximated the value of αf and both parameters increased and approximated α=1 value.
All things considered, αc might not fulfill its original definition and purpose. The C pa-
rameter (eq. 2), just as b (eq. 3) acts as a way to consider the restraining effect of diffu-
sion. The authors believe eq. 3 is the better one of the used revised models. As we have
stated earlier a C~b-1 connection is expected, and that is roughly fulfilled. At higher cure
temperatures both parameters had taken extreme values and as a result the eq. 2 and eq.
3 approximated the values given by the original Kamal-Sourour equation (eq. 1). The R2
values increased at lower cure temperatures (40 °C and 60 °C) due to the use of revised
models and a better fit was achieved.
20 40 60 80 100 12010
-7
10-6
10-5
10-4
10-3
10-2
10-1
100
0 1:2 30% 1:2 50% 1:1.5 15% 1:1.5 30%
b
Temperature (°C)20 40 60 80 100 120
0.5
0.6
0.7
0.8
0.9
1.0
f
Temperature (°C)
20 40 60 80 100 12010
0
101
102
103
104
105
106
107
(b)
C
(a)
(c) (d)
20 40 60 80 100 1200.5
0.6
0.7
0.8
0.9
1.0
c
20 40 60 80 100 12010
-7
10-6
10-5
10-4
10-3
10-2
10-1
100
Figure 5.13 The Cole ((a) and (b)) and Fournier ((c) and (d)) revised Kamal
model fit parameters.
The Arrhenius equation was used to calculate the activation energy and preexpo-
nential factors of the non-catalytic (k1) and catalytic (k2) reactions (Figure 5.14, Figure
5.15). The non-catalytic reaction rate value heavily scattered with the curing temperature
and the used cross-linking agent. Therefore, one or two points had to be left out of the
fitting process to determine the activation energy values. Due to these reasons, the calcu-
lated activation energy of the non-catalytic reaction is ambiguous, unreliable.

Isophprondiamine base oligoamides: catalytic effect during epoxy curing
111
0
1:2 30%
1:2 50%
1:1.5 15%
1:1.5 30%
20
40
60
80
100
120
Kamal-Sourour Cole FournierA
ctiv
atio
n E
ner
gy (
kJ
mol-1
)
k1
0
1:2 30%
1:2 50%
1:1.5 15%
1:1.5 30%
103
104
105
106
107
108
109
1010
1011
1012
1013
k1
Pre
exponen
tial
Fac
tor
Figure 5.14 The calculated activation energy and preexponential factors for the
non-catalyzed reaction
0
1:2 30%
1:2 50%
1:1.5 15%
1:1.5 30%
20
40
60
80
100
120
k2
Kamal-Sourour Cole Fournier
Act
ivat
ion
En
erg
y (
kJ
mo
l-1)
k2
0
1:2 30%
1:2 50%
1:1.5 15%
1:1.5 30%
107
108
109
1010
1011
Pre
exp
on
enti
al F
acto
r
Figure 5.15 The calculated activation energy and preexponential factors for the
auto-catalyzed reaction
The activation energy of the auto-catalytic reaction in the terephthal-amide solu-
tion series was compared to the commercial IPD (Figure 5.15). In the case the of the
samples cured with only commercial IPD only the secondary hydroxyl groups formed
during the curing can act as a catalyst. The activation energy of the catalyzed reaction
decreased due to the terephthal-amides. The 1:2 30 % and 50 % solutions caused the most
significant decrease of 10-15 kJ mol-1 in the activation energy. The activation energy of
the reaction decreased with the concentration with the 1:2 series. In comparison 1:1.5
15 % and 30 % solutions could only achieve a 5-10 kJ mol-1 decrease. Surprisingly the
activation energy of the 30% solution was found to be higher than the 15% solution. These
relationships may partly be explained by the molecular weight difference between the 1:2
and 1:1.5 reaction products. There are similarities between the attitudes expressed by this

Chapter 5
112
phenomenon, those described by the rotational viscosity measurements. The 1:1.5 solu-
tion series proved to be slightly less effective in enhancing the curing in comparison of
the 1:2 series. Thus, it can be concluded that the produced terephthal-amides can act as a
catalyst in epoxy systems and their catalytic activity can be influenced by their molecular
weight.
5.3.5. Catalytic effect of amides studied with computational chemistry
Figure 5.16 The scheme of the studied epoxy curing reactions.
Figure 5.17 The general structure of the possible transition states in the studied
reactions.
Figure 5.16 shows the computationally studied reactions, i.e., the reaction of epoxy
with the possible amine-derivatives. The studied epoxy-amine curing reaction according
to Ehlers et al can follow a direct or an indirect mechanism. 32 The corresponding general
transition states shown in Figure 5.17. On the direct path the epoxy ring breaks up, the
amine connects to the free CH2 of the epoxy, and the O of the epoxy ring is hydrogenated
by the catalyst (or the reactant, if there is no catalyst), which regenerates instantly with a
H from the reactant amine group. In contrast, during the indirect path, the catalyst only
stabilize the free O group of the epoxy after the ring breaking, and its hydrogenation
happens later in the process. The investigation of whole polymer chains with the chosen
method would be impracticable, therefore the reduced size epoxy and amines used to
model the reaction are shown on Figure 5.16 (the wavy line represents that the chain
would continue from there). As catalyst/accelerator glycol, phenol, and the self-catalysis
of the possible amine and amide groups of the two amine reactants were studied.

Isophprondiamine base oligoamides: catalytic effect during epoxy curing
113
Table 5.4 Free energy barriers of the epoxy curing reaction with different reac-
tants, catalysts, and pathways. All values are in kJ/mol. c-NH2/c-NH: amine/amide
group connected to cycloaliphatic group (2b/2’b’), R-CH2-NH/R-CH2-NH2, amine/am-
ide group connected to aliphatic group (8g/8’g’)
Reactant c-NH2 R-CH2-NH2
Reaction
path direct indirect direct indirect
Calculation
method
B3LYP/
6-
31G(d,p)
B3LYP/
6-
31G(d,p)
LNO-
CCSD(T)/
aug-cc-
pVTZ
B3LYP/
6-
31G(d,p)
B3LYP/
6-
31G(d,p)
LNO-
CCSD(T)/
aug-cc-
pVTZ
No catalyst 209.3 166.5 157.9 198.9 167.2 157.4
zHOCH2-
CH2OH 175.0 94.7 106.4 175.9 103.5 103.2
PhOH 175.1 89.3 92.1 171.7 92.2 86.6
c-NH2 196.6 123.6 123.0 194.0 130.9 132.1
R-CH2-NH2 196.6 125.6 126.4 202.6 127.9 123.9
c-NH 189.6 94.2 90.8 178.6 99.5 93.4
R-CH2-NH 184.6 94.5 96.8 170.9 106.5 98.8
Table 5.4 summarizes the energy barriers of the possible settings. The coordi-
nates and energies of the structures are presented in the Supplementary Material. The
transition states of direct path have an imaginary frequency of 370.3-441.4 cm-1, while
the TSs of the indirect path have 375.4-406.2 cm-1. It can be seen that in every case the
energy barrier of the indirect path is lower with 30-95 kJ mol-1 than the direct path, i.e.
the indirect path is favored. Therefore, the more accurate LNO-CCSD(T) calculations
were performed only for the indirect path. The difference between DFT and LNO-
CCSD(T) results can reach 11.7 kJ mol-1, however the trends are similar, therefore the
results of the more reliable LNO-CCSD(T) results are discussed here. Also, there is no
notable difference in the reactivity of the c-NH2 and R-CH2-NH2 groups.
Comparing the effects of the catalysts, it can be seen that PhOH is the best performing
with the lowest barrier, 86.6-92.1 kJ mol-1. Amide groups have almost the same catalytic
effect, regardless of type, with barrier of 90.8-98.8 kJ mol-1. Glycol is also effective to
catalyze the curing reaction with a slightly higher barrier, 103.2-106.4 kJ mol-1. The cat-
alytic effect of the amine groups results in barriers of 123.0-132.1 kJ mol-1, meaning that
they are worse than the -OH and -NH groups but still better than if there was no catalyst
(barriers of 157.4-157.9 kJ mol-1). The notable difference between experimental and cal-
culated activation energies can be attributed to the approximations of the calculations, i.e.
Chapter 5
114
gas-phase calculations with the relevant part of the species. Nevertheless, the applied
model is able to reveal the differences in activity between the possible catalysts. In sum-
mary, according to the calculations, the curing reaction occurs with the indirect
mechanism, and the amide groups of the reactants are as good as the phenol as a catalyst
of this reaction.
5.4. Conclusions
In our previous study we observed the catalytic effect of amides during the curing
of epoxy resins and we showed that raw aminolysis products of PET can be applied as
epoxy cross-linkers. The main purpose of this study was to quantitatively characterize the
catalytic effect of therephthal-amides. We have further decreased the required amount of
diamine compound during PET aminolysis to produce oligoamides. The aminolysis prod-
ucts were used as co-cross-linkers with isophorondiamine to study their effect on the cur-
ing reaction and glass transition temperature.
The aminolysis of PET was carried out with different PET:IPD ratios (1:1, 1:1.5
and 1:2). Based on the functional group analysis, FTIR and TGA measurements total
amidation was achieved in the case of the 1:1.5 and 1:2 ratios. The 1:1 ratio was found to
be too low to achieve total amidation, traces of residual ester groups were found in the
reaction product. Based on the functional group analysis and the capillary viscosity meas-
urements the molecular weight of the 1:1.5 and 1:2 ratio products differ. The 1:1.5 and
1:2 ratio reaction products were compared with NMR. The quantitative analysis of the 1H
and MALDI-TOF spectra further supported that the 1:1.5 ratio reaction product has higher
molecular weight than the 1:2 ratio product. Further lowering of the used amine ratio
resulted in increasing the molecular weight of the terephthal-amides. Thus, the aminolysis
of PET can be also used to produce oligoamides. The 1:1.5 reaction product was shown
to more effective in decreasing the glass transition temperature of epoxy systems than the
1:2 ratio product.
The rotational viscosimetry and DSC reaction kinetics measurements confirmed
the catalytic effects of the raw aminolysis products during curing. The terephthal-amides
are double-purposed components that can also acts as cross-linkers and capable catalysts
that can kickstart the curing reaction. Their higher molecular weight can also decrease the
diffusion rates in the system, that could set back the reaction at lower cure temperatures.
This effect can be completely negated at higher cure temperatures (Tcure>60 °C). Three
models, the Kamal-Sourour, and two revised Kamal models were used to quantitatively
describe the kinetics of curing. Our calculations show that at 40 °C and 60 °C the revised
models result in a better fit. At higher cure temperatures the revised models gave almost
the same results as the Kamal-Sourour equation and high R2 values were achieved. The
non-catalytic related reaction rate k1 and the fit parameter n significantly scattered, while
the autocatalytic related reaction rate k2 and fit parameter m increased with the cure tem-
perature. The k2 values of the solutions series ranked as the following at all cure temper-
atures: commercial IPD < 1:1.5 15 %< 1:1.5 30 %< 1:2 30 %< 1:2 50 %. Thus, these
experiments confirmed that the increase in molecular weight of therephthal-amides re-
sults in decreased catalytic activity during epoxy curing. The activation energies of the
auto-catalytic reaction were found to decrease with the presence of aminolysis product in
Isophprondiamine base oligoamides: catalytic effect during epoxy curing
115
the cross-linking agent.
The quantum chemical calculations show that the indirect pathway is preferred
compared to the direct one in the epoxy curing reaction. Even though the phenol catalyzed
reaction has the lowest barrier, amide groups have almost the same catalytic activity, bet-
ter than the glycol and amine groups. Thus these calculations supported our theory on
amides being utilized as accelerators in epoxy curing.
Nevertheless it must be noted that the effects of the residual zinc-acetate on the
curing of epoxy resins is undetermined. Additional measurements must be carried out to
determine the exact efficiency and order of magnitude compared to the terephthalamides.
The catalytic effects of metal salts is currently undiscussed in the curing of epoxy resins
with amines. These studies exceeded the previously set time limitations of this thesis.
In conclusion we have shown that PET derived oligoamides can be used to cure
epoxy resins. They can be used as double-purpose components in epoxy systems as cross-
linkers and catalysts. Their effects on the curing reaction and properties of the cured resin
can be tailored with their molecular weight.

Chapter 5
116
5.5. References
1 J. B. Enns and J. K. Gillham, J. Appl. Polym. Sci., 1983, 28, 2567–2591.
2 G. Wisanrakkit, J. K. Gillham and J. B. Enns, J. Appl. Polym. Sci., 1990, 41,
1895–1912.
3 D. M. Scremin, D. Y. Miyazaki, C. E. Lunelli, S. A. Silva and S. F. Zawadzki,
Macromol. Symp., 2019, 383, 1800027.
4 J. Datta, K. Błażek, M. Włoch and R. Bukowski, J. Polym. Environ., 2018, 26,
4415–4429.
5 A. Hale, C. W. Macosko and H. E. Bair, Macromolecules, 1991, 24, 2610–2621.
6 D. J. O’Brien, P. T. Mather and S. R. White, J. Compos. Mater., 2001, 35, 883–
904.
7 M. J. Marks and R. V. Snelgrove, ACS Appl. Mater. Interfaces, 2009, 1, 921–
926.
8 D. Incerti, T. Wang, D. Carolan and A. Fergusson, Polymer (Guildf)., 2018, 159,
116–123.
9 K. B. Riad, R. Schmidt, A. A. Arnold, R. Wuthrich and P. M. Wood-Adams,
Polymer (Guildf)., 2016, 104, 83–90.
10 Y. Feng, Y. Hu, L. Man, T. Yuan, C. Zhang and Z. Yang, Eur. Polym. J., 2019,
112, 619–628.
11 S. Morsch, Z. Kefallinou, Y. Liu, S. B. Lyon and S. R. Gibbon, Polymer (Guildf).,
2018, 143, 10–18.
12 M. Shibata, J. Fujigasaki, M. Enjoji, A. Shibita, N. Teramoto and S. Ifuku, Eur.
Polym. J., 2018, 98, 216–225.
13 L. Shechter and J. Wynstra, Ind. Eng. Chem., 1956, 48, 86–93.
14 L. Shechter, J. Wynstra and R. P. Kurkjy, Ind. Eng. Chem., 1956, 48, 94–97.
15 S. Corezzi, L. Palmieri, J. M. Kenny and D. Fioretto, J. Phys. Condens. Matter,
2005, 17, S3557–S3563.
16 S. Corezzi, D. Fioretto, G. Santucci and J. M. Kenny, Polymer (Guildf)., 2010,
51, 5833–5845.
17 N. Rabearison, C. Jochum and J. C. Grandidier, J. Mater. Sci., 2011, 46, 787–
796.
18 V. L. Zvetkov and V. Calado, Thermochim. Acta, 2013, 560, 95–103.
19 A. Bernath, L. Kärger and F. Henning, Polymers (Basel)., 2016, 8, 1–19.
20 R. Ren, X. Xiong, X. Ma, S. Liu, J. Wang, P. Chen and Y. Zeng, Thermochim.
Acta, 2016, 623, 15–21.
21 A. Patel, O. Kravchenko and I. Manas-Zloczower, Polymers (Basel)., 2018, 10,
125.
22 A. O. Konuray, X. Fernández-Francos and X. Ramis, Polym. Chem., 2017, 8,
5934–5947.
23 D. Santín, O. Konuray, X. Fernàndez-Francos and X. Ramis, Thermochim. Acta,
2019, 673, 158–168.
24 I. T. Smith, Polymer (Guildf)., 1961, 2, 95–108.
25 K. Horie, H. Hiura, M. Sawada, I. Mita and H. Kambe, J. Polym. Sci. Part A-1
Polym. Chem., 1970, 8, 1357–1372.
26 M. R. Kamal, Polym. Eng. Sci., 1974, 14, 231–239.
27 S. Sourour and M. R. Kamal, Thermochim. Acta, 1976, 14, 41–59.

Isophprondiamine base oligoamides: catalytic effect during epoxy curing
117
28 C.-S. Chern and G. W. Poehlein, Polym. Eng. Sci., 1987, 27, 788–795.
29 K. C. Cole, J. J. Hechler and D. Noël, Macromolecules, 1991, 24, 3098–3110.
30 Y. Deng and G. C. Martin, Macromolecules, 1994, 27, 5147–5153.
31 J. Fournier, G. Williams, C. Duch and G. A. Aldridge, Macromolecules, 1996,
29, 7097–7107.
32 J.-E. Ehlers, N. G. Rondan, L. K. Huynh, H. Pham, M. Marks and T. N. Truong,
Macromolecules, 2007, 40, 4370–4377.
33 J. D. McCoy, W. B. Ancipink, C. M. Clarkson, J. M. Kropka, M. C. Celina, N.
H. Giron, L. Hailesilassie and N. Fredj, Polymer (Guildf)., 2016, 105, 243–254.
34 M. Hesabi, A. Salimi and M. H. Beheshty, Polym. Test., 2017, 59, 344–354.
35 M. Hesabi, A. Salimi and M. H. Beheshty, Eur. Polym. J., 2019, 112, 736–748.
36 B. Ellis, Ed., Chemistry and Technology of Epoxy Resins, Springer Netherlands,
Dordrecht, 1993.
37 L. Karpati, M. Fejer, D. Kalocsai, J. Molnar and V. Vargha, Express Polym. Lett.,
2019, 13, 618–631.
38 K. Dutt and R. K. Soni, Int. J. Plast. Technol., 2014, 18, 16–26.
39 P. Czub, Polym. Adv. Technol., 2009, 20, 183–193.
40 T. Spychaj, E. Fabrycy and S. Spychaj, Polymer (Guildf)., 2001, 24–31.
41 T. Spychaj, R. Pilawka, S. Spychaj and A. Bartkowiak, Ind. Eng. Chem. Res.,
2004, 43, 862–874.
42 Y. Fukuda, K. Miyamae and Y. Sasanuma, RSC Adv., 2017, 7, 38387–38398.
43 A. Johansson, P. Kollman, S. Rothenberg and J. McKelvey, J. Am. Chem. Soc.,
1974, 96, 3794–3800.
44 S. H. Gellman, G. P. Dado, G. B. Liang and B. R. Adams, J. Am. Chem. Soc.,
1991, 113, 1164–1173.
45 L. Kárpáti, G. Hamar and V. Vargha, J. Therm. Anal. Calorim., 2019, 136, 737–
747.
46 J. Rokicka, P. Lenarczyk and R. Ukielski, J. Therm. Anal. Calorim., 2016, 125,
351–360.
47 Ç. Çam, A. Bal and G. Güçlü, Polym. Eng. Sci., 2015, 55, 2519–2525.
48 A. P. More, R. A. Kute and S. T. Mhaske, Iran. Polym. J. (English Ed., 2014, 23,
59–67.
49 M. E. Tawfik, N. M. Ahmed and S. B. Eskander, J. Appl. Polym. Sci., 2011, 120,
2842–2855.
50 Y. S. Parab, P. A. Wasekar, S. T. Mhaske and S. R. Shukla, Polym. Bull., 2014,
71, 2695–2707.
51 E. Bulak and I. Acar, Polym. Eng. Sci., 2014, 54, 2272–2281.
52 V. S. Palekar, A. J. Damle and S. R. Shukla, Eur. J. Med. Chem., 2009, 44, 5112–
5116.
53 L. Kárpáti, G. Szarka, M. Hartman and V. Vargha, Period. Polytech. Chem. Eng.,
2018, 62, 336–344.
54 L. Kárpáti, F. Fogarassy, D. Kovácsik and V. Vargha, J. Polym. Environ., 2019,
27, 2167–2181.
55 A. D. Becke, J. Chem. Phys., 1993, 98, 5648–5652.
56 P. C. Hariharan and J. A. Pople, Theor. Chim. Acta, 1973, 28, 213–222.

Chapter 5
118
57 M. J. Frisch, G. W. Trucks, H. B. Schlegel, G. E. Scuseria, M. A. Robb, J. R.
Cheeseman, G. Scalmani, V. Barone, G. A. Petersson, H. Nakatsuji, M. C. X. Li,
A. Marenich, J. Bloino, B. G. Janesko, R. Gomperts, B. Mennucci, H. P.
Hratchian, J. V. Ortiz, A. F. Izmaylov, J. L. Sonnenberg, D. Williams-Young, F.
L. F. Ding, J. G. F. Egidi, A. P. B. Peng, T. Henderson, D. Ranasinghe, V. G.
Zakrzewski, J. Gao, N. Rega, G. Zheng, W. Liang, M. Hada, M. Ehara, K. Toyota,
R. Fukuda, J. Hasegawa, M. Ishida, T. Nakajima, Y. Honda, O. Kitao, H. Nakai,
T. Vreven, K. Throssell, J. A. J. Montgomery, J. E. Peralta, F. Ogliaro, M.
Bearpark, J. J. Heyd, E. Brothers, K. N. Kudin, V. N. Staroverov, T. Keith, R.
Kobayashi, J. Normand, K. Raghavachari, A. Rendell, J. C. Burant, S. S. Iyengar,
J. Tomasi, M. Cossi, J. M. Millam, M. Klene, C. Adamo, R. Cammi, J. W.
Ochterski, R. L. Martin, K. Morokuma, O. Farkas, J. B. Foresman and D. J. Fox,
2016. Gaussian 09, Revision E.01
58 P. R. Nagy, G. Samu and M. Kállay, J. Chem. Theory Comput., 2018, 14, 4193–
4215.
59 R. A. Kendall, T. H. Dunning and R. J. Harrison, J. Chem. Phys., 1992, 96, 6796–
6806.
60 M. Kállay, P. R. Nagy, Z. Rolik, D. Mester, G. Samu, J. Csontos, J. Csóka, B. P.
Szabó, L. Gyevi-Nagy, I. Ladjánszki, L. Szegedy, B. Ladóczki, K. Petrov, M.
Farkas, P. D. Mezei and B. Hégely, 2019. MRCC quatum chemical program su-
ite. Utilized version was published at 09.02.2019, see https://www.mrcc.hu/.
The sequenced structure of amino-alcohol based random poly(ester amide)s
119
Chapter 6
The sequenced structure of amino-alcohol based random
poly(ester amide)s5
6.1. Introduction
Several studies focus on engineering new polymeric materials suitable for a wide
range of uses. Poly(ester amide)s have a great potential as biocompatible/biodegradable
materials due to their unique molecular structure. A wide range of applications from im-
plants, microfluidical systems to common plastic bags and other products were investi-
gated since Carothers produced the first poly(ester amide)s in 19321–8. Ester linkage pro-
vides a relatively easier scission of the backbone that enhances biodegradability. Amide
linkages provide good mechanical properties due to the strong inter- and intramolecular
bonds between the chains 2,9–11. The properties of these materials can be finely tuned. The
backbone structure, the ratio and distribution of the ester and amide linkages (alternating,
block, random) determine the thermal, chemical and mechanical properties. Just like with
polyesters, several methods such as ring-opening polymerization, chain lengthening, di-
rect polycondensation or two-step polycondensation based on diacid derivatives have
been utilized in poly(ester amide) synthesis12–18.
The amide/ester ratio and distribution substantially influence the thermal proper-
ties. At lower amide ratios the amide linkages disrupt the organized ester rich structure
that mostly causes lower crystallinity9,19. As the amide ratio is raised, amorphous phase
separation can occur, and two glass transition temperatures can be observed19. At higher
amide to ester ratios the highly crystalline amide rich segments dominate the crystalline
structure. In the case of random poly(ester amide)s the linkages are statistically distrib-
uted along the backbone. The crystallinity of random poly(ester amide)s was observed in
several studies, but only a few focused on it in detail10,20–25. P. Garg and his co-workers
produced poly(ester amide)s with isolated, two and three adjacent amide groups. They
have shown that in segmented poly(ester amide)s the thermal properties and crystallinity changes with the total content and type of amide linkages along the backbone. Higher
amide content resulted in higher melt temperatures and at certain amide intervals multiple
melting peaks. The authors have attributed these separate peaks to different number of
ester-amide sequences along the chains19.
Amino-alcohol based poly(ester amide)s produced without any prepolymerisation
steps tend to form randomly structured polymers. Without any prepolymerisation steps
the distribution of ester-ester (EE), amide-amide (AA) and amid-ester (AE/EA) linkages
is statistically determined. Despite this, crystallinity was observed in these seemingly ran-
dom polymers10, clearly indicating a certain degree of order along the polymer backbone.
5 L. Kárpáti, G. Hamar and V. Vargha, J. Therm. Anal. Calorim., 2019, 136, 737–747.

Chapter 6
120
In this study we investigated the molecular structure of amino-alcohol based poly(ester amide)s with nuclear magnetic resonance spectroscopy (NMR) in order to
study the ordered nature of the backbone. Substituted amino-alcohols were used to change
the reactivity of the amine and hydroxyl groups, thus the number of AA, AE and EE type
linkages. Residual functional group analysis and size exclusion chromatography was used
to study the blocking effect of the small aliphatic substituent. Differential scanning calo-
rimetry (DSC) and wide-angle X-ray scattering (WAXS) were used to investigate the
crystallinity of poly(ester amide)s. Adipic-acid and 4 different amino-alcohols (2-amino-
1-ethanole, 1-amino-propan-2-ol, 2-amino-butan-1-ol and 2-amino-2-methyl-propan-1-
ol) were used to produce aliphatic poly(ester amide)s via two-step direct polycondensa-
tion. The produced polymers were named according to the amino-alcohol used in their
production, consecutively PEA, PEA-Me, PEA-Et and PEA-MeMe (Figure 6.1 a). No steps were done during the polycondensation to influence the backbone structure (Figure
6.1 b).
Figure 6.1 Chemical structure of the used monomers (a) and the adipic units in
the backbone (b)
6.2. Experimental
6.2.1. Materials
Adipic acid (99 %) was purchased from Tokyo Chemicals Industry. 2-amino-1-ethanole
(ethanol amine) (99%), 1-amino-propan-2-ol (93 %), 2-amino-butan-1-ol (97 %), 2-
amino-2-methyl-propan-1-ol (90%) and dimethyl sulfoxide-d6 (99.9%) were purchased
from Sigma Aldrich. Hydrochloric acid (cc), sulfuric acid (cc), potassium hydroxide,
N,N-dimethylformamide (DMF) (99.96 %), methanol (99.98 %), potassium dichromate
(100 %) were purchased from Molar chemicals. Zirconium dioxide (99 %) and Polyeth-ylene glycol 1000 (PEG1000) were purchased from Alpha Aesar. All reagents were used
as received.

The sequenced structure of amino-alcohol based random poly(ester amide)s
121
6.2.2. Synthesis of Poly(ester amide)s
Aliphatic poly(ester amide)s were prepared in a 250 cm3 4-necked round bottom
flask equipped with a gas inlet, a thermometer, a mechanical stirrer and a reflux conden-
ser. The reactions were carried out in two steps. In the first step 1 mol adipic-acid and 1
mol amino-alcohol were weighed in and reacted without catalyst in inert argon atmos-
phere. A distillation apparatus was used to remove the water from the system. The reac-
tion temperature was held near the boiling point of the used amino-alcohol (160-170 °C)
for 4 hours, then it was raised with 10 °C (to 175-180 °C) and was held there for 2 hours.
Before the second step 0.02 mol catalyst (ZrO2) was added and the reactor was equipped
with a vacuum apparatus. The reactions were kept at 175-180 °C for 5 hours under vac-
uum (10-30 mbar). The viscous melt at the end of the reaction was poured into an alu-
minium pan. The reactions yields were over 90 %.
6.2.3. Characterization
A standard titration method was used to measure the acid and the amine content
of the produced poly(ester amide)s. 0.2 g were weighed in Erlenmeyer flasks with ana-
lytical accuracy and dissolved in 15 cm3 DMF. 3 parallel and one blank sample were
titrated with 0.1 M NaOH solution in methanol in the presence of phenolphtalein indicator
to determine the acid content. 3 parallel and one blank sample were titrated with 0.1 M
HCl solution in the presence of methyl orange to determine the amine content. The hy-
droxyl content was determined by a colorimetric method introduced by Padilha de Paula 26. 3 samples of 0,1 g were weighed in with analytical accuracy and dissolved in 5 cm3 of
DMF. 300 mm3 of Jones reagent was added to the samples and stirred vigorously. After 1 minute 2 cm3 of 3 M HCl solution was added. The samples were tested with UNICAM
UV500 spectrophotometer at 600 nm wavelength. A calibration curve of PEG1000 was
used to determine the hydroxyl values of the poly(ester amide)s.
Molecular mass distribution was determined with a SEC TSK gel 901B (Tosoh
Bioscience Corporation, Ltd., Japan) column using HPLC grade DMF. An evaporative
light scattering detector (ELS-1000 Polymer Laboratories) was used with PS molar mass
equal calibration.
FTIR ATR measurements (28 scans) were done with Bruker Tensor 27 FTIR. 1H
and 1H-15N NMR measurements were done with Bruker Avance 500 in DMSO-d6. 13C,
DEPT, 1H-13C HSQC and HMBC were done with Bruker Avance 300 in DMSO-d6. The
NMR sample concentration was approximately 60 mg cm-3. The temperature of acquisi-tion was 30 °C. Spectral with of 30030 Hz with 0.45 Hz resolution, 1.09 s acquisition
time and 2 s recycle delay were used for the 13C measurements.
Perkin Elmer TGA 6 was used to determine the thermal stability of the poly(ester
amide)s on 9-10 mg samples in purging nitrogen. The beginning of thermal degradation
was determined at 95 m/m% of the measured sample. A 10 °C min-1 heating rate was used
from 30-700 °C, then the sample was kept at 700 °C for 10 minutes. Perkin Elmer DSC7
was used to measure the glass transition temperature (Tg) and the crystallinity on 3-4 mg
samples in purging nitrogen. The Tg was measured with a dynamic method from -40 to
150 °C with a 10 °C min-1 heating rate. Crystallinity was investigated after removing the
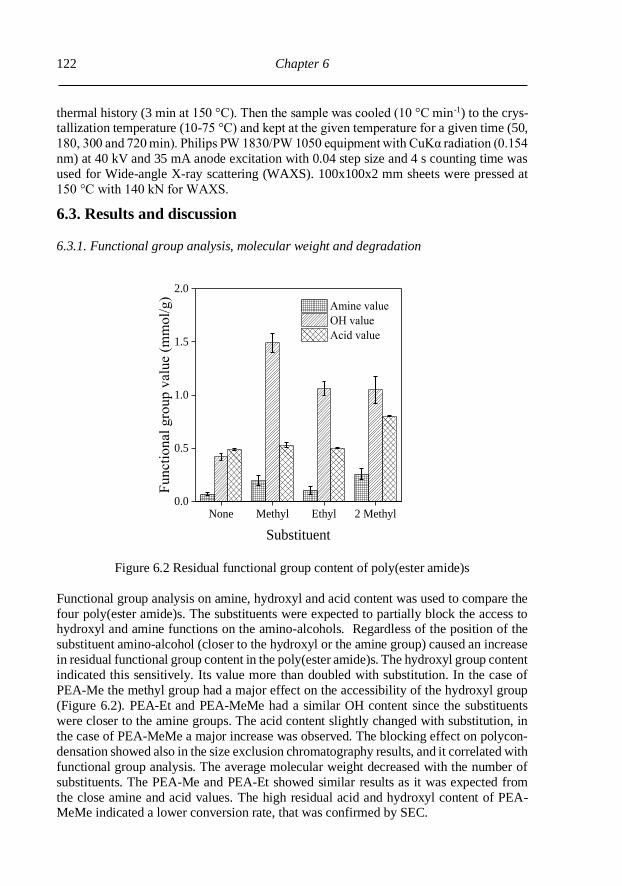
Chapter 6
122
thermal history (3 min at 150 °C). Then the sample was cooled (10 °C min-1) to the crys-tallization temperature (10-75 °C) and kept at the given temperature for a given time (50,
180, 300 and 720 min). Philips PW 1830/PW 1050 equipment with CuKα radiation (0.154
nm) at 40 kV and 35 mA anode excitation with 0.04 step size and 4 s counting time was
used for Wide-angle X-ray scattering (WAXS). 100x100x2 mm sheets were pressed at
150 °C with 140 kN for WAXS.
6.3. Results and discussion
6.3.1. Functional group analysis, molecular weight and degradation
None Methyl Ethyl 2 Methyl0.0
0.5
1.0
1.5
2.0
Fu
ncti
on
al
gro
up
valu
e (
mm
ol/
g)
Substituent
Amine value
OH value
Acid value
Figure 6.2 Residual functional group content of poly(ester amide)s
Functional group analysis on amine, hydroxyl and acid content was used to compare the
four poly(ester amide)s. The substituents were expected to partially block the access to hydroxyl and amine functions on the amino-alcohols. Regardless of the position of the
substituent amino-alcohol (closer to the hydroxyl or the amine group) caused an increase
in residual functional group content in the poly(ester amide)s. The hydroxyl group content
indicated this sensitively. Its value more than doubled with substitution. In the case of
PEA-Me the methyl group had a major effect on the accessibility of the hydroxyl group
(Figure 6.2). PEA-Et and PEA-MeMe had a similar OH content since the substituents
were closer to the amine groups. The acid content slightly changed with substitution, in
the case of PEA-MeMe a major increase was observed. The blocking effect on polycon-
densation showed also in the size exclusion chromatography results, and it correlated with
functional group analysis. The average molecular weight decreased with the number of
substituents. The PEA-Me and PEA-Et showed similar results as it was expected from
the close amine and acid values. The high residual acid and hydroxyl content of PEA-MeMe indicated a lower conversion rate, that was confirmed by SEC.

The sequenced structure of amino-alcohol based random poly(ester amide)s
123
Table 6.1 Molecular mass data from SEC and thermal degradation temperatures
Poly(ester amide)
PEA PEA-Me PEA-Et PEA-MeMe
Mn [g mol-1] 4588 2948 3552 2199
Mw [g mol-1] 7461 4640 5876 3260
Polydispersity 1.62 1.57 1.65 1.48
Degradation temperature (°C) 302.0 295.0 295.7 244.8
Thermal degradation was tested on the poly(ester amide)s. The beginning of thermal deg-
radation was determined at 5 m/m% mass loss of the measured sample on the TGA curve.
The thermal degradation temperature decreased with decreasing molecular weight. Ex-
cept for PEA only one degradation step can be observed on the TGA and DTG curves
(Figure 6.3). For PEA a change of slope on the TGA curve (~30-33% at 360 °C) can be observed. This change of slope indicates a thermally more stable structure. Poly(ester
amide)s tend to have higher degradation temperatures than similarly structured polyes-
ters19,27,28. Thus amide rich segments of the polymers should have higher heat stability.
The exceptional properties of polyamides and poly(ester amide)s – including thermal sta-
bility - depend on the strong bonds between the chains. The lack of this shoulder in case
of the substituted PEA can be explained by the steric effect of the substituents. This means
that due to the steric hindrance less hydrogen bonds can form. Hydrogen bonds can en-
hance the stability of the amide bonds29, thus if these sites are blocked the thermal stability
is reduced.
0 100 200 300 400 500 600 7000.0
0.2
0.4
0.6
0.8
1.0
Temperature (°C)
6.6 %
3.0%
2.0%
2.5%
Rel
ativ
e m
ass
(-)
PEA
PEA-Me
PEA-Et
PEA-MeMe
0 100 200 300 400 500 600 700
DT
G
Temperature (°C)
residual mass
(a) (b)
Figure 6.3 TGA and DTG curves of poly(ester amide)s
6.3.2. Molecular structure identification
FTIR spectroscopy was used to generally identify the ester-amide structure of the
produced polymers. The representative peaks were found in all the polymers for the ester
and the amide groups as well (Figure 6.4). 1730 cm-1 for the carbonyl and 1250 cm-1 ester
linkage, 1645 cm-1 and 1540 cm-1 for the amide vibrations. The wide peak over 3200 cm-1
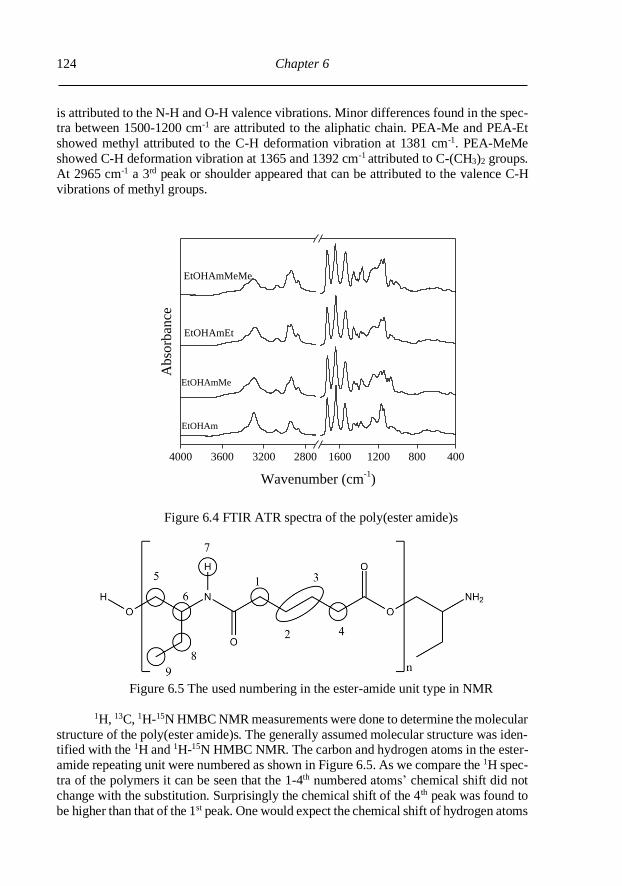
Chapter 6
124
is attributed to the N-H and O-H valence vibrations. Minor differences found in the spec-tra between 1500-1200 cm-1 are attributed to the aliphatic chain. PEA-Me and PEA-Et
showed methyl attributed to the C-H deformation vibration at 1381 cm-1. PEA-MeMe
showed C-H deformation vibration at 1365 and 1392 cm-1 attributed to C-(CH3)2 groups.
At 2965 cm-1 a 3rd peak or shoulder appeared that can be attributed to the valence C-H
vibrations of methyl groups.
4000 3600 3200 2800 1600 1200 800 400
EtOHAmMeMe
EtOHAmEt
Ab
sorb
ance
Wavenumber (cm-1)
EtOHAm
EtOHAmMe
Figure 6.4 FTIR ATR spectra of the poly(ester amide)s
Figure 6.5 The used numbering in the ester-amide unit type in NMR
1H, 13C, 1H-15N HMBC NMR measurements were done to determine the molecular
structure of the poly(ester amide)s. The generally assumed molecular structure was iden-tified with the 1H and 1H-15N HMBC NMR. The carbon and hydrogen atoms in the ester-
amide repeating unit were numbered as shown in Figure 6.5. As we compare the 1H spec-
tra of the polymers it can be seen that the 1-4th numbered atoms’ chemical shift did not
change with the substitution. Surprisingly the chemical shift of the 4th peak was found to
be higher than that of the 1st peak. One would expect the chemical shift of hydrogen atoms

The sequenced structure of amino-alcohol based random poly(ester amide)s
125
to be higher when they are closer to the amide group, than the ester group in the acid unit. 1H-15N and 1H-13C correlation showed this “switch” between these peaks. This spectral
behavior is unique to poly(ester amide)s12. Major shifts can be observed on the 5-9th at-
oms. Depending on the substitution the 5th and 6th peaks shifted in the spectra. As expected
the 6th peak completely disappeared from the 1H spectrum of PEA-MeMe. The 8th and 9th
peaks were consistently attributed to the substituent atoms.
8 7 6 5 4 3 2 1 0
2-3
2-3 8
2-3
1
6
6
5
5
5
7
7
7
75 6
4
9
2-3
Inte
nsi
ty
Chemical Shift (ppm)
1H
1
DMSO-d6
4 1
4 1
4
8-9
8
PEA
PEA-Me
PEA-Et
PEA-MeMe
Figure 6.6 1H NMR spectra of the poly(ester amide)s
Chemical shift differences (13C spectra) in the 2nd and 3rd carbon atoms were used
to characterize the distribution of amide and ester linkages along the polymer backbone.
The chemical shift differs if the adipic-acid formed AA, EE or EA bonds. The EA/AE
linkage gives 2 peaks, because the chemical shift changes if the carbon atom is closer to
the ester (EA) or amide (AE) bonds. Thus 4 kind of peaks appear in the 13C spectra be-
tween 26.24 ppm (Figure 6.7)30. 1H-13C HSQC and HMBC correlation were used to as-
sign the peaks. In the case of PEA-MeMe the peak at 24,46 ppm belongs to the 8th and
9th carbon from methyl substituents, in the case of PEA-Et the peak at 24,16 ppm belongs
to the 8th carbon from the ethyl substituent. Molar % fractions were calculated from peak
deconvolution and integration based on the publication of Witt et al30. The integrated areas of the appointed peaks at Figure 6.7 were divided by the total area of the 4 peaks.
This method was further explored and supported by Otte et al. Otte and his coworkers
concluded that as long as the differences in NOEs and relaxation times are considered 13C
NMR spectra integration is quantitative. Even standard pulse sequences and short recycle
delay times (d1) could result in accurate enough comparison between two compounds31.
The data showed that the polycondensation reaction wasn’t completely stochastic. In a
completely stochastic process 25% AA and EE, and 50% AE/EA linkages would form.
The probability of finding an ester group next to an amide (PEA) on an adipic acid unit
and vica versa (PAE) were calculated from the mol% fractions (Table 6.2). As we have

Chapter 6
126
seen on the functional group analysis and the GPC measurements the substituents gener-ally lowered the conversion rate of the reactions, thus lower molecular weight was ob-
tained. Our calculations showed that substitution changed the PAE and PEA values. As ex-
pected the amidation was generally favored. PEA-Me showed that the steric effect of the
hydroxyl-near methyl group raised the amidation and lowered the esterification probabil-
ity. The ethyl group balanced the probability of amidation and esterification compared to
PEA (closer to stochastic ratios were obtained). The double methyl groups shifted the
reaction in favor of the esterification and significantly raised the amount of EA/AE link-
ages along the backbone. Compared to the PEA an alternating structure was obtained.
According to these data we can infer that even small aliphatic substituents can have a
major effect on the fine composition of poly(ester amide)s.
26.0 25.5 25.0 24.5 24.0
EA
EE
EA
EA
EE
EE
AE
AE
AE
AA
AA
AA
Inte
nsi
ty
Chemical Shift (ppm)
PEA
PEA-Me
PEA-Et
PEA-MeMe
13C
AA
AEEE
EA
Peaks from
substituents
Figure 6.7 13C spectra showing zones associated with the 2nd and 3rd carbon atoms
Table 6.2 Molar fractions calculated from the relative peak integrals
PEA PEA-Me PEA-Et PEA-MeMe
Molar fractions [%]
AE 22.70 20.73 23.85 25.62
AA 28.67 31.46 27.81 19.09
EE 23.41 22.03 24.53 22.24
EA 25.23 25.78 23.82 33.07
Probability [%] PEA 39.59 32.95 42.88 67.17
PAE 53.88 58.51 48.54 74.34

The sequenced structure of amino-alcohol based random poly(ester amide)s
127
Based on the calculated molar fractions, the polymerization reaction is a near sto-chastic process. These values can be interpreted as the statistical averages of the polymer-
ization reaction. The molar fractions give us information only on the backbone composi-
tion, and not on the fine distribution. One of the key criteria in polymer crystallization is
the ordered backbone structure, yet crystalline behavior was observed in the seemingly
random aliphatic poly(ester amide)s10,25. Our goal was to find certain sequences that could
build up the polymeric backbone with the same stochastic or near stochastic constitution
represented in Table 6.2.
Figure 6.8 The possible connections of adjacent adipic units and possible repeat-
ing sequences
The bifunctional ethanol-amine predetermines the possible connections of the ad-
jacent adipic units, thus 2 or 4 “adipic unit” long sequences can be identified as repeating
units along the backbone. The possible connections and repeating sequences are repre-
sented at Figure 6.8. The theoretical sequences “a” and “b” on their own could form in a
near stochastic process and build up the chains with the same total composition. AAEE
and AEAE/EAEA linkages can form various sequences. Alternating variations of these
linkages result in “b” type of sequences. If AAEE or AEAE/EAEA form longer blocks “c” and “d” appear along the backbone structure. Due to the statistical nature of the reac-
tion any combination of these sequences could appear along the backbone. The “c” and
“d” type of sequences together are capable of building backbones with the desired com-
position.
Therefore it is possible, that this near stochastic process can result in sequenced
backbone structure with several kinds of repeating units. Intra- and intermolecular sec-
ondary bonds (hydrogen bond) could be a strong enough driving force to initiate crystal-
lization. Sasanuma and coworkers used high-accuracy molecular orbital calculations to
study the conformations and inter- and intramolecular forces in poly(ester amide)s and
polyurethanes11. In their studies they have shown that both polymers develop strong sec-
ondary forces, especially hydrogen bonds (N-H ~ O and C-H ~ O=C). Comparison was made and was concluded that poly(ester amide)s have a more rigid molecular structure
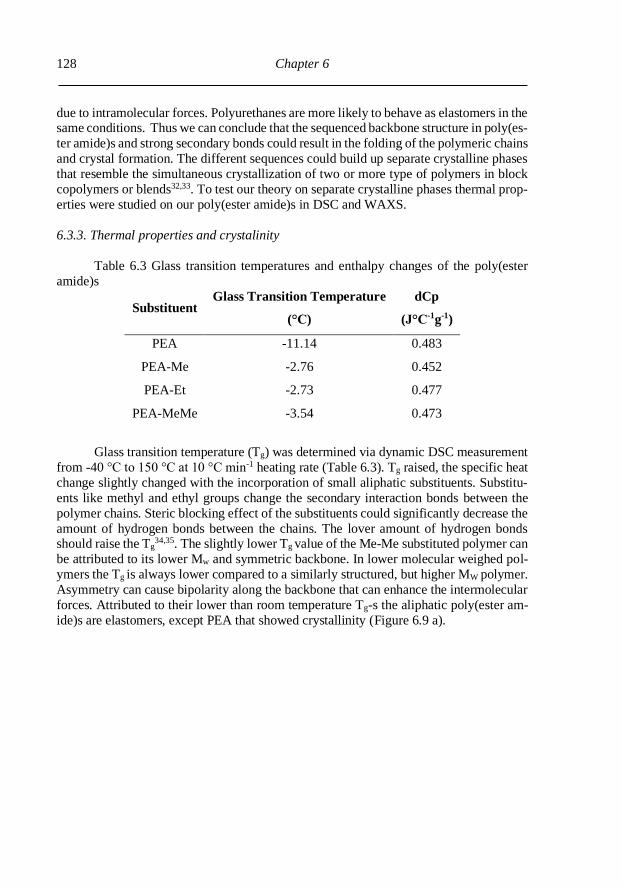
Chapter 6
128
due to intramolecular forces. Polyurethanes are more likely to behave as elastomers in the same conditions. Thus we can conclude that the sequenced backbone structure in poly(es-
ter amide)s and strong secondary bonds could result in the folding of the polymeric chains
and crystal formation. The different sequences could build up separate crystalline phases
that resemble the simultaneous crystallization of two or more type of polymers in block
copolymers or blends32,33. To test our theory on separate crystalline phases thermal prop-
erties were studied on our poly(ester amide)s in DSC and WAXS.
6.3.3. Thermal properties and crystalinity
Table 6.3 Glass transition temperatures and enthalpy changes of the poly(ester
amide)s
Substituent Glass Transition Temperature
(°C)
dCp
(J°C-1g-1)
PEA -11.14 0.483
PEA-Me -2.76 0.452
PEA-Et -2.73 0.477
PEA-MeMe -3.54 0.473
Glass transition temperature (Tg) was determined via dynamic DSC measurement
from -40 °C to 150 °C at 10 °C min-1 heating rate (Table 6.3). Tg raised, the specific heat
change slightly changed with the incorporation of small aliphatic substituents. Substitu-
ents like methyl and ethyl groups change the secondary interaction bonds between the
polymer chains. Steric blocking effect of the substituents could significantly decrease the
amount of hydrogen bonds between the chains. The lover amount of hydrogen bonds should raise the Tg
34,35. The slightly lower Tg value of the Me-Me substituted polymer can
be attributed to its lower Mw and symmetric backbone. In lower molecular weighed pol-
ymers the Tg is always lower compared to a similarly structured, but higher MW polymer.
Asymmetry can cause bipolarity along the backbone that can enhance the intermolecular
forces. Attributed to their lower than room temperature Tg-s the aliphatic poly(ester am-
ide)s are elastomers, except PEA that showed crystallinity (Figure 6.9 a).

The sequenced structure of amino-alcohol based random poly(ester amide)s
129
30 40 50 60 70 80 90 100
Hea
t F
low
(m
W)
Temperature (°C)
Exo
Endo
CF-I
CF-II
CF-III
First heat
40 50 60 70 80 90 100
(b)
75 °C
65 °C
70 °C
60 °C
55 °C
50 °C
45 °C
40 °C
35 °C
30 °C
20 °C
25 °C
Temperature (°C)
50 min
(a)
Figure 6.9 The first heat curve of PEA (a) and its melt curves after 50 minutes of
isothermal crystallization between 20-75 °C (b)
As our calculations suggested on the possible sequenced structure of random
poly(ester amide)s, a wide multi-peaked endothermic melting was observed on the first
heating of PEA (Figure 6.9 a). The following cooling step showed no sign of crystalliza-tion, since the 10 °C min-1 cooling rate was too fast for the polymer to recrystallize. Three
separate peaks were identified from the first heating curve. Hence, we used isothermal
crystallization from 15-75 °C for 50 minutes to further study the peaks. After the 50 min
isothermal period the sample temperature was raised at 10 °C/min to study the melt curve.
Two separate peaks were observed (CF-I, CF-II) on the melting curves (Figure 6.9 b).
The CF-I peak is well-defined, symmetric with ~2 °C full width at half maximum value,
while CF-II peak is wide, asymmetric with 4-6 °C full width at half value. CF-III didn’t
form during 50 minutes of isothermal crystallization.
The peak temperatures shifted to higher temperatures following linear functions.
Hoffman-Weeks equilibrium melting temperature can be determined from these data30.
Yet the occurrence of crystallization at the isothermal period must be proven to enable applicability of this model. No exothermic peaks were found during the 10 °C min-1 cool-
ing, and the 50-minute-long isothermal periods either. Yet endothermic melting peaks
appeared at the second heating. Thus, the data suggest a very low rate of crystallization,
which cannot be measured with DSC. To prove the isothermal crystallization, longer iso-
thermal steps were used (3h, 5h and 12h) between 10-70 °C. The enthalpy change of
melting increases with the longer isothermal step time and reaches a plateau after 12 hours
of crystallization (Figure 6.10 a). Thus, the primary crystallization occurs during the first
12 hours of crystallization. Further improvements of the crystal structure occur after 12
hours during the secondary crystallization. The optimal crystallization temperature was
found to be near 40 °C (Figure 6.10 b).

Chapter 6
130
0 200 400 600 8000
10
20
30
40
30°C
20°C
50°C
60°C
10°C
70°C
40°C
Enta
lpy o
f M
elin
g (
J/g)
Time (min)
0 20 40 60 80
720 min
300 min
Temperature of Crystallization
(a) (b)
Figure 6.10 The enthalphy change of crystaline peaks melting as a function of
crystallization time in PEA samples
20 40 60 80 100
10°C
20°C
30°C
40°C
50°C
60°C
70°C
Hea
t F
low
(m
W)
Temperature (°C)
Exo
Endo
0 50 100 150 2000
50
100
150
200
720 min
Pea
k T
emp
erat
ure
of
Mel
t (°
C)
Temperature of Crystallization (°C)
Tm=0.076*T
c+77.122
R2=0.90064
Tm=0.898*T
c+19.237
R2=0.99752
Tm=0.726*T
c+39.104
R2=0.99137
720 min
TCF-I
me=142.7°C
TCF-II
me=84.5°C
TCF-III
me=188.5°C
Figure 6.11 Melting curves of PEA after 12 hours of crystallization (a) and the
shift of peak temperatures of the 3 crystalline phases(b)
The three-peaked melt curves were observed between 10-50 °C after 3-5 hours of
crystallization (Figure 6.11 a). At 60-70 °C the CF-I peak shifted over to 80 °C, thus it
became indistinguishable from CF-II. The Hoffman-Weeks model was used to determine
the equilibrium melting temperature (Figure 6.11 b) of the three phases36. Surprisingly
the CF-I and CF-III phases were found to have higher equilibrium melting temperatures
than CF-II. In regular crystalline polymers higher melting temperature means a wider
lamellar width and improved crystalline structure. CF-II proved to be the less stable crys-
talline phase. The CF-II phase peaks were rather undefined and wide, the peak tempera-
tures barely changed with the crystallization temperature. Partial areas were calculated

The sequenced structure of amino-alcohol based random poly(ester amide)s
131
based of the deconvolution on the calorimetric curves (Figure 6.12). CF-I and CF-III phases had a clear rising tendency, and CF-II had a declining trend of the crystallization
temperature. At lower temperatures CF-II clearly outcompetes the other phases with its
faster crystallization rate, even at higher temperatures it still occupies nearly 40 % of the
total crystalline phase. CF-III has the lowest rate of crystallization; it needs at least 3-5
hours to form depending on the crystallization temperature. The optimal crystallization
temperature of CF-III is between 40-50 °C. The three observed phases show different
rates of crystallization and stability. Such behavior can be explained by the sequenced
structure of the polymer.
0 20 40 60 800
20
40
60
80
100
50 180 300 720
Are
a (%
)
Temperature (°C)
CF-I (c)
0 20 40 60 80
Temperature (°C)
CF-II(a) (b)
0 20 40 60 80
Temperature (°C)
CF-III
Figure 6.12 Relative area of the crystalline peaks in PEA
Wide angle X-ray scattering was used to determine the total crystallinity of PEA
and to further study the crystalline structure. 6 mm thick pressed plates were made, and
kept at 30, 40, 50 and 60 °C (Figure 6.13). The total crystallinity (~30-35 %) was calcu-
lated based on a two-phase model from the partial areas of the fitted peaks. All the ob-
served peaks shifted to higher 2θ values with the increase of crystallization temperature.
The first peak showed decline in area with higher crystallization temperatures. The inten-
sity of the first peak at 60 °C significantly declined and the half width at half maximum
doubled. Thus a less perfect crystalline structure formed. The second peak’s area was
observed to be lower than the first at all tested temperatures, its area slightly changed with
the temperature. The 3rd and 4th minor peaks are possibly higher diffractions of the first two major phases. Based on our observations from the DSC the 1st peak resamples the
CF-II crystalline phase. The intensity drop at 60 °C (where CF-II became indistinguisha-
ble from CF-I, Figure 6.11 a) clearly indicates the connection. Thus the 2nd peak must be
connected to the other major phase, CF-I. The 1st and 2nd peak area ratios resemble the
area ratios (~2:3-1:1) of CF-I and CF-II from the DSC. CF-III phase cannot be identified
on the WAXS diffractograms. A small shoulder-like peak appeared at 24.7° on the 60 °C
samples diffractogram that might be attributed to it. The DSC data indicated that CF-III
takes up to 10-20 % of the crystalline phases that could be too low to detect with WAXS.
The calculated Bragg’s crystal lattice distances follow a growing trend in both cases. As
we have concluded from the equilibrium melt temperatures the CF-I phase is more stable
than CF-II, thus it should have a more defined structure with wider lamellas.
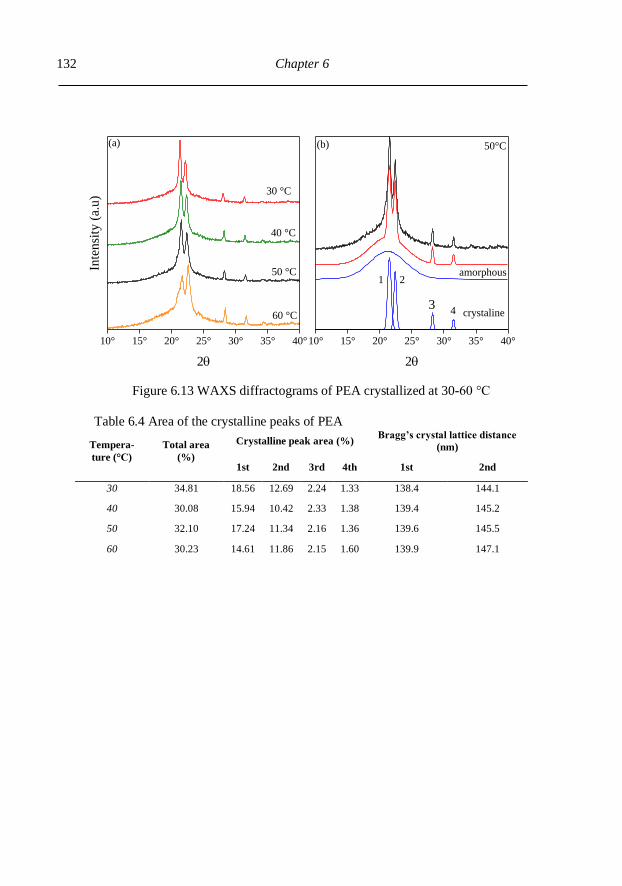
Chapter 6
132
10° 15° 20° 25° 30° 35° 40°
50 °C
60 °C
40 °C
Inte
nsi
ty (
a.u
)
2
30 °C
1 2
3
amorphous
crystaline
(a) (b)
10° 15° 20° 25° 30° 35° 40°
2
50°C
4
Figure 6.13 WAXS diffractograms of PEA crystallized at 30-60 °C
Table 6.4 Area of the crystalline peaks of PEA
Tempera-
ture (°C)
Total area
(%)
Crystalline peak area (%) Bragg’s crystal lattice distance
(nm)
1st 2nd 3rd 4th 1st 2nd
30 34.81 18.56 12.69 2.24 1.33 138.4 144.1
40 30.08 15.94 10.42 2.33 1.38 139.4 145.2
50 32.10 17.24 11.34 2.16 1.36 139.6 145.5
60 30.23 14.61 11.86 2.15 1.60 139.9 147.1

The sequenced structure of amino-alcohol based random poly(ester amide)s
133
6.4. Conclusions
Random aliphatic poly(ester amide)s derived from adipic-acid and substituted
amino-alcohols were obtained via two-step direct polycondensation. Several characteri-
sation methods were used to compare the effects of substitution on the properties and
structure of the poly(ester amide)s. In this paper we have given a possible explanation of
the sequenced organisation of random poly(ester amides) and the formation of separate crystalline phases.
From the functional group analysis and the SEC measurements we have concluded
that the substitution generally lowered the conversion of the polycondensation. The ther-
mal stability of the poly(ester amide)s declined with lower molecular weight and substi-
tution. The FTIR, 1H and 1H-15N confirmed the ester-amide structure. The 13C NMR stud-
ies revealed that even small aliphatic substituents can have a major steric hindrance effect.
The AA, EE, EA and AE molar fractions varied with the size and number of substituents.
Consequently they influence the fine structure of the poly(ester amide)s. We proposed
2-4 “adipic unit long” repeating sequences that could appear in and build up the polymeric
backbone structure. Thus a sequenced structure was found in random poly(ester amide)s,
that could cause the formation of separate crystalline phases. The DSC measurements
proved the existence of three separate crystalline phases in PEA (two major, and a third minor) with different heat stability and crystallization rate. The two major crystalline
phases were identified on the WAXS diffractograms.
6.5. References
1 M. Winnacker and B. Rieger, Polym. Chem., 2016, 7, 7039–7046. 2 A. Rodriguez-Galan, L. Franco and J. Puiggali, Polymers (Basel)., 2011, 3, 65–
99.
3 E. Grigat, R. Koch and R. Timmermann, Polym. Degrad. Stab., 1998, 59, 223–
226.
4 C. J. Bettinger, J. P. Bruggeman, J. T. Borenstein and R. S. Langer, Biomaterials,
2008, 29, 2315–2325.
5 M. C. Serrano, E. J. Chung and G. A. Ameer, Adv. Funct. Mater., 2010, 20, 192–
208.
6 J. Wang, K. G. Boutin, O. Abdulhadi, L. D. Personnat, T. Shazly, R. Langer, C.
L. Channick and J. T. Borenstein, Adv. Healthc. Mater., 2013, 2, 1329–1336.
7 J. Wang, C. J. Bettinger, R. S. Langer and J. T. Borenstein, Organogenesis, 2010, 6, 212–216.
8 W. H. Carothers and J. W. Hill, J. Am. Chem. Soc., 1932, 54, 1566–1569.
9 A. Ali Mohamed, S. Salhi, S. Abid, R. El Gharbi and A. Fradet, Eur. Polym. J.,
2014, 53, 160–170.
10 P. Rizzarelli, M. Cirica, G. Pastorelli, C. Puglisi and G. Valenti, Polym. Degrad.
Stab., 2015, 121, 90–99.
11 Y. Fukuda, K. Miyamae and Y. Sasanuma, RSC Adv., 2017, 7, 38387–38398.
12 E. Botines, A. Rodrıguez-Galán and J. Puiggalı, Polymer (Guildf)., 2002, 43,
6073–6084.

Chapter 6
134
13 T. Ferré, L. Franco, A. Rodrıguez-Galán and J. Puiggalı, Polymer (Guildf)., 2003, 44, 6139–6152.
14 H. Sun, R. Cheng, C. Deng, F. Meng, A. A. Dias, M. Hendriks, J. Feijen and Z.
Zhong, Biomacromolecules, 2015, 16, 597–605.
15 A. Basu, K. R. Kunduru, J. Katzhendler and A. J. Domb, Adv. Drug Deliv. Rev.,
, DOI:10.1016/j.addr.2016.08.003.
16 L. Kárpáti, G. Szarka, M. Hartman and V. Vargha, Period. Polytech. Chem. Eng.,
2018, 62, 336–344.
17 P. Raffa, M.-B. Coltelli, S. Savi, S. Bianchi and V. Castelvetro, React. Funct.
Polym., 2012, 72, 50–60.
18 J. Rokicka, P. Lenarczyk and R. Ukielski, J. Therm. Anal. Calorim., 2016, 125,
351–360. 19 P. Garg, H. Keul, D. Klee and M. Möller, Macromol. Chem. Phys., 2009, 210,
1754–1765.
20 J. Wu and C.-C. Chu, Acta Biomater., 2012, 8, 4314–4323.
21 D. J. Buckwalter, J. M. Dennis and T. E. Long, Prog. Polym. Sci., 2015, 45, 1–
22.
22 H. Cheng, P. S. Hill, D. J. Siegwart, N. Vacanti, A. K. R. Lytton-Jean, S. W. Cho,
A. Ye, R. Langer and D. G. Anderson, Adv. Mater., 2011, 23, 95–100.
23 P. A. M. Lips, R. Broos, M. J. M. Van Heeringen, P. J. Dijkstra and J. Feijen,
Polymer (Guildf)., 2005, 46, 7823–7833.
24 P. A. M. Lips, R. Broos, M. J. M. Van Heeringen, P. J. Dijkstra and J. Feijen,
Polymer (Guildf)., 2005, 46, 7834–7842.
25 M. Fujiyama, M. Kondou, K. Ayama and H. Inata, J. Appl. Polym. Sci., 2002, 85, 774–784.
26 J. Padilha de Paula, P. V. Farago, P. B. Binhara, S. A. Silva and S. F. Zawadzki,
Polym. Test., 2008, 27, 675–678.
27 Z. Qian, S. Li, Y. He, C. Li and X. Liu, Polym. Degrad. Stab., 2003, 81, 279–
286.
28 T. Zorba, K. Chrissafis, K. M. Paraskevopoulos and D. N. Bikiaris, Polym.
Degrad. Stab., 2007, 92, 222–230.
29 Y. Zhang, K. Cheng and J. Xu, Thermochim. Acta, 2005, 425, 137–141.
30 U. Witt, R.-J. Müller and W.-D. Deckwer, Macromol. Chem. Phys., 1996, 197,
1525–1535.
31 H. Wang, K. Shimizu, H. Kim, E. K. Hobbie, Z. Wang and C. C. Han, J. Chem. Phys., 2002, 116, 7311–7315.
32 D. A. L. Otte, D. E. Borchmann, C. Lin, M. Weck and K. A. Woerpel, Org. Lett.,
2014, 16, 1566–1569.
33 M. Amini and H. Ebadi-Dehaghani, J. Therm. Anal. Calorim., 2018, 132, 1833–
1844.
34 Q. Zhou, M. Li, P. Yang and Y. Gu, Macromol. Theory Simulations, 2013, 22,
107–114.
35 R. G. M. Van Der Sman, .
36 J. D. Hoffman and J. J. Weeks, J. Res. Natl. Bur. Stand. Sect. A Phys. Chem.,
1962, 66A, 13–28.

Summary
135
Chapter 7
Summary
The recycling of waste streams is one of the most emerging problems of our mod-
ern society that not just endangers our environment, but all living beings as well. The
number of research projects concerning sustainability and treating waste materials has
increased substantially in all fields. Over the years not just the leading governments, but
the leading companies started to participate and made large investments to maintain sus-
tainability. Dealing with plastic waste has become the center of attention even in commu-
nal forums. There are several methods to deal with and recycle plastic waste materials,
nevertheless they have certain advantages and disadvantages that must be taken into con-
sideration. Mechanical recycling cannot be used indefinitely due to degradation processes
occurring in plastics. Incineration might be the most economically favorable, yet most
plants cannot reach the needed high temperatures to inhibit the formation of toxic volatile
compounds. Not to mention losing expensive, special materials that could be recuperated
from the waste stream. Chemical recycling could be used to regain the building blocks of
plastics and repurpose them. Regrettably chemical recycling – and mechanical recycling
as well – is restricted by the necessary purification and separation steps, and chemical
use. To overcome this issue in the case of PET solvolysis, in this thesis we investigated
the use of raw solvolysis products in cross-linked systems.
In the first part of our studies, we attempted to modify the standard glycolysis
technique to purposely produce PET derivate oligoesters that could be utilized as mid-
products. We introduced diacid components into glycolysis systems to incorporate low
molar weight side components into oligomeric chains, thus completely negating any
side-products from our system. Acido-alcoholysis was compared to conventional glycol-
ysis and acidolysis. Our results have shown that the molar weight of the depolymerization
products considerably increased and all the low molar weight volatile products were in-
corporated into the depolymerization products. The chain-lengthening of the depolymer-
ization products with epoxy compounds probably resulted in branched or even cross-
linked products. To thoroughly characterize acido-alcoholysis reaction series were de-
signed to understand the effects of diacids on glycolysis. Our studies with NMR have
shown that the depolymerization of PET and condensation via the diacid components
occurs at the same. Thus, the diacid components act as a chain lengthening agent during
the depolymerization increasing the molar weight. Based on these results one-pot type
depolymerization and polycondensation reactions were designed and carried out. Unsatu-
rated resins were prepared from the butane-1,4-diol and adipic acid reactions series. The
viscoelastic properties of the cross-linked resins considerably changed with the amount
of adipic acid used during depolymerization. The glass transition temperature shifted to
lower temperatures and the cross-link density decreased as the ratio of adipic acid was
increased. Thus acido-alcoholysis is capable of yielding functional oligoesters that could
be finely tuned to be utilized in various products. It combines depolymerization and pol-
ycondensation in the same system and it does not need excessively high volumes of chem-
icals to work. Since the traditional “side-products” of glycolysis are incorporated into the
end product there is no need for purification steps, it can be directly used in syntheses.

Chapter 7
136
In the second part of our studies, we used aminolysis to produce terephthalamides
that could be utilized as cross-linkers in epoxy systems. The aminolysis of PET was car-
ried out without excess amine. The aminolysis products were thoroughly characterized
with functional group content, FTIR, NMR, and MALDI-TOF. Our findings suggested
that the molecular weight of the produced terephthalamides can be tuned with the ratio of
isophorondiamine used for the aminolysis while no residual ester groups remain. Tereph-
alamides with two distinct molecular weights were used to produce cross-linker solutions
with isophorondiamine. The viscoelastic properties changed with the concentration of the
amide co-cross-linker. The glass transition temperatures shifted to lower temperatures,
and the cross-link density decreased substantially with increasing concentrations. The ef-
fects of the terephthalamides on the curing was investigated with rotational viscosimetry
and DSC reaction kinetics studies. The gelation studies indicated a significant decrease
in gel time compared to the model isophorondiamine cure systems. Compared to the
model equivalent solutions of ethylene-glycol with isophorondiamine the tereph-
thalamide solutions were significantly faster, decreasing the gelation time with over 10
minutes at 50°C. The higher molar weighed PET:IPD 1:1.5 solutions proved to be less
active than the PET:IPD 1:2 solutions. The reaction kinetics studies supported these find-
ings and have shown that the activation energy of the autocatalitic curing could decrease
with 20-30 kJ/mol. The reaction rate constants decreased with decreasing the concentra-
tion and increasing the molar weight of the terephthalamides in the cross-linker solutions.
The three different model equations were used to fit to the curing data. The Cole factor
and the Fournier factor modified models assured a better fit at lower cure temperatures.
At higher cure temperatures the modified models barely differed for the results of the
classic Kamal-Sourour equation. This indicates a decreased effect of diffusion control on
the curing.
In the last part of our studies we investigated the effects of small substituents on
the polycondensation and fine molecular structure of aliphatic poly(ester amides). The
increasing residual functional group content and the decreasing molecular weight of the
poly(ester amides) suggested a dampening effect on the polycondensation by the small
substituents. Based on the correlational NMR studies a quantitative analysis was carried
out to investigate the ratios of amide-amide, amide-ester/ester-amide and ester-ester in
the polyester amides. A sequenced structure was proposed that could build up the poly-
meric chains of the random polyester amides, that could even give an explanation for the
crystallinity of these materials. The formation of different sequences suggests the for-
mation of different crystalline phases that were detected with DSC and WAXS. Two ma-
jor and a minor crystalline phase was found with different equilibrium melting points and
crystallization rate.
Summary
137
The most important conclusions of this thesis are briefly summarized in the fol-
lowing points:
1. We have shown that the introduction of diacid components into the glycolysis of
PET results in the incorporation of lower molar weight components into oligo-
meric chains. Thus, eliminating the need for separation and purification steps after
the depolymerization reaction with completely annulling side products and yield-
ing a more uniform product. [1, 2]
2. One-pot type acido-alcoholysis reactions were engineered to combine depolymer-
ization and polycondensation into a single technological step. Acido-alcoholysis
proved to be a modulable technique that allowed us to finely tune the thermal and
mechanical properties of the produced polyesters. Increasing the ratio of the diacid
components during the depolymerization step resulted in the production of higher
molar weighed oligomers. Thus, decreasing the cross-link density and the glass
transition temperature of the cross-linked unsaturated polyester resins. [2]
3. Decreasing the ratio of utilized amine reagent during PET aminolysis could be
used to deliberately increase the molecular weight of the produced tereph-
thalamides. The raw aminolysis products of PET could be utilized as amine co
cross-linkers. The glass transition temperature and cross-link density of the epoxy
resin specimen decreases with increasing the molecular weight and the concentra-
tion of the terephthalamides. [3, 4]
4. The aminolysis products, acting as multipurposed crosslinkers can accelerate the
curing of epoxy resins. The eliminated ethylene glycol and the amides can form
hydrogen bonds with the epoxy groups, thus catalyzing the addition reactions with
amines. The gelation measurements have shown that the aminolysis products have
a higher catalytic activity than the ethylene glycol. Their catalytic activity de-
creases with increasing the molecular weight of the terephthalamides. The DSC
reaction kinetics studies further supported these observations. Computational
chemistry studies indicated that the accelerative activity of the terephthalamides
is in the same order of magnitude as phenols. [4]
5. Random aliphatic poly(ester amide)s derived from adipic acid and substituted
amino-alcohols were synthesized and thoroughly characterized with NMR meas-
urements. Based on our findings a sequenced molecular structure was proposed
that consists of repeating sequences of amide-amide, amide-ester and ester-ester
connections. Such organized structure in poly(ester amides) lead to the formation
of different crystalline phases. DSC measurements have proven the formation two
major and a minor crystalline phase with different equilibrium melting tempera-
ture and crystallization rate. The major phases were identified with WAXS. [5]

List of symbols
138
List of symbols
[η] intrinsic viscosity
b fit parameter in the Fournier diffusion factor
C fit parameter in the Cole diffusion factor
CED cohesion energy density
CF crystalline phase Cp heat capacity
D diffusion coefficient
fd(α) diffusion factor used in the revised Kamal-Sourour models
G’ storage modulus
G” loss modulus
k1, k2 reaction rate constant
n, m fit parameters for the Kamal-Sourour equation
Tc crystallization temperature
Tg glass transition temperature
tgel gelation time
Tm melt temperature
α conversion αc fit parameter in the Cole diffusion factor, critical conversion where the
reaction is dominantly governed by diffusion
δ Hildebrand solubility parameter (MPa)1/2
δ phase lag between stress and strain
ΔE electronic energy difference
ΔG Gibbs free energy barrier
ΔH enthalpy change
η viscosity
ν cross-link density
ρ density
τ relaxation time
Abbreviations
[bmim] 1-butyl-3-methylimidazolium cation
AA amide-amide linkage
AdAc adipic acid
AE/AE ester-amide linkage
APK German plastic recycling and -producing company
ATR attenuated total reflectance aug-cc-pVTZ augmented version of the correlation consistent triple zeta basis set
BASF Badische Anilin- und Soda Fabrik GmbH, German chemical company
BHET bis(2-hydroxyethyl)-terephtalate
But butane-1,4-diol
CC coupled claster
CCSD couples cluster single double
COSY correlated spectroscopy NMR (1H-1H)

List of symbols
139
DEPT distortionless enhancement by polarization transfer NMR DFT density functional theory
DMA dynamic mechanical analysis
DMF N,N-dimethylformamide
DMSO dimethyl-sulfoxide
DMT dimethyl-terephthalate
DTG the first derivative of the TGA curve
EE epoxy equivalent [(g resin)/(1 mol epoxy functional group)]
EE ester-ester linkage (chapter 6)
FCC Fluid catalytic cracking
FTIR Fourier transform infrared spectroscopy
GPC gel permeation chromatography HMBC hetero-nuclear multiple-quantum coherence NMR
HSQC heteronuclear single quantum coherence NMR
IH2 Integrated hydro-pyrolysis and hydro-conversion
IPD isophorondiamine
KDV Katalytische Drucklose Verölung, depolymerization process devel-
opped by Alphakat GmbH
LNO local neutral orbital
MALDI matrix assisted laser desorption/ionization
MOL Magyar Olaj- és Gázipari Nyrt, Hungarian oil and gas company
MWCNT Multi-walled carbon nanotube
NMR nuclear magnetic resonance spectroscopy
NOESY nuclear Overhauser effect spectroscopy NMR (1H-1H) PEA poly(ester-amide) of 2-Amino-1-ethanol and adipic acid
PEA.Et poly(ester-amide) of 2-amino-butan-1-ol and adipic acid
PEA-Me poly(ester-amide) of 1-amino-propan-2-ol and adipic acid
PEA-MeMe poly(ester-amide) of 2-amino-2-methyl-propan-1-ol and adipic acid
PET poly(ethylene-terephtalate)
PEXY the probability of finding a X group (ester, amide) next to an Y group
PVC poly(vinyl chloride)
SebAc sebacic-acid
SucAc succinic acid
TGA thermogravimetric analysis
THF tetrahydrofuran TOF Time of flight mass spectrometer
WAXS wide angle X-ray scattering

Acknowledgments
140
Acknowledgments
First and foremost, I would like to thank my supervisor Viktória Vargha for her guidance
and support during my studies. I would like to thank Béla Pukánszky, Alfréd Kállay-Me-
nyhárd, János Móczó and József Hári for teaching me the scientific way of thinking, help-
ing, advising me during my MSc and PhD studies. I am grateful for my friends and col-
leagues at the Laboratory of Plastics- and Rubber technology for their support, help, en-
couragement and the positive work atmosphere.
I am most grateful for all my students Anna Zsámboki, Balázs Janzsó, Dániel Kalocsai,
Dániel Kovácsik, Eszter Banka, Fanni Fogarassy, Gergely Hamar, Máté Fejér, Róbert
Attila Juhász, Virág Vajóczky, and Zita Horváth for their never-ending work with the
synthesizes and measurements. I learned a lot from them over the years and thankfully
we had a great time working side by side. Without their enthusiasm and commitment, it
would have been an even longer, harder and bumpier ride.
Last but not least, I would like to thank my parents, my brothers, and sister and friends
for their encouragement, patience, and support through the years of my studies.
“I am glad you are here with me. Here at the end of all things…”*
* J. R. R Tolkien, The Lord of The Rings Vol. III The Return of the King

Publications
141
List of publications
Papers used for the preparation of the Thesis
1. Kárpáti, L.; Szarka, G.; Hartman, M.; Vargha, V. Oligoester and Polyester Production via Acido-Alcoholysis of PET Waste. Period. Polytech. Chem.
Eng. 2018, 62 (3), 336–344. https://doi.org/10.3311/PPch.11513.
2. Karpati, L.; Fogarassy, F.; Kovácsik, D.; Vargha, V. One-pot depolymeri-
zation and polycondensation of PET based random oligo- and polyesters. J.
Polym. Environ. 2019, 27(10), 2167-2181
https://doi.org/10.1007/s10924-019-01490-3
3. Kárpáti, L.; Fejér, M.; Kalocsai, D.; Molnár, J.; Vargha, V. Synthesis and
Characterization of Isophorondiamine Based Epoxy Hardeners from the
Aminolysis of PET. Express Polym. Lett. 2019, 13(7), 618-631.
https://doi.org/10.3144/expresspolymlett.2019.52.
4. Kárpáti, L.; Ganyecz, Á.; Nagy, T.; Hamar, G.; Banka, E.; Kállay M.; Var-gha, V.; Synthesis and characterisation of isphorondiamine based oligoam-
ides: catalytic effect of amides during the curing of epoxy resins. Polym.
Bull. 2020, 77, 4655–4678 https://doi.org/10.1007/s00289-019-02987-6
5. Kárpáti, L.; Hamar, G.; Vargha, V. The Sequenced Structure of Amino-Al-
cohol-Based Random Poly(Ester Amide)S. J. Therm. Anal. Calorim. 2019,
136 (2), 737–747. https://doi.org/10.1007/s10973-018-7712-y.
Other publications
1. Vargha, V.; Csoknay, T.; Kárpáti, L.; Bordós, T.; Hartman, M.; Háhn, J.;
Korecz, L.; László, Z.; Kelemen, O.; Szoboszlay, S. Effect of Composting
on the Behavior of Polyolefin Films – A True-to-Life Experiment. J. Appl.
Chem. Model. 2016, 5, 88–100.
2. Vargha, V.; Akhinszky, N.; Kárpáti L. PET hulladék újrahasznosítása
telítetlen poliésztergyanta előállítására, Műanyag és Gumiipari Évkönyv,
2017, XV. évfolyam, 35-40, ISSN: 1589-6269
3. XII. Kárpát-medencei Környezettudományi Konferencia Tanulmánykötete
ISBN 978-963-429-049-0 (2017)
http://kmktk16.ttk.pte.hu/hu/tanulmanykotet/
a. Bugyi Orsolya, Szarka Györgyi, Kárpáti Levente, Vargha Viktória;
Poli(etilén-tereftalát) hulladék kémiai újrahasznosítása és az új, érték-
növelt termékek jellemzése; 29-40
b. Csoknay Tamás, Szarka Györgyi, Kárpáti Levente, Vargha Viktória,
Hartman Mátyás; Biológiailag lebomló polimer keverékek előállítása
és jellemzése; 61-71
c. Menyhért Balázs, Szarka Györgyi, Kárpáti Levente, Vargha Viktória,
Hartman Mátyás, Biodegradálható Polimerek Szintézise, 153-164
Publications
142
d. Vargha Viktória, Menyhért Balázs, Csoknay Tamás, Kárpáti Levente;
Poliolefin fóliák viselkedése talajban és komposztban; 235-242
4. Nagy, S.; Dargó, G.; Kisszekelyi, P.; Fehér, Z.; Simon, A.; Barabás, J.;
Höltzl, T.; Mátravölgyi, B.; Karpati, L.; Drahos, L.; et al. New Enantiopure
Binaphthyl-Cinchona Thiosquaramides: Synthesis and Application for En-antioselective Organocatalysis. New J. Chem., 2019, 43, 5948-5959.
https://doi.org/10.1039/C8NJ06451B.
5. Kárpáti, L; Kalocsai, D.; Fejér, M.; Vargha, V. • PET kémiai újrahasznosí-
tása új poliészteramidok előállításához. Polimerek, 2019, V. évfolyam, 6,
573-577
6. Nagy, S.; Fehér, Z.; Kárpáti, L.; Bagi, P.; Kisszékelyi, P.; Koczka, B.;
Huszthy, P.; Pukánszky, B.; Kupai, J.; Synthesis and applications of
cinchona squaramide‐modified poly(glycidyl methacrylate) microspheres
as recyclable polymer‐grafted enantioselective organocatalysts. 2020
Chem. Eur. J.; https://doi.org/10.1002/chem.202001993
Conference presentations
Oral presentation
1. Kárpáti, L.; Hári J.; Pukánszky B. Preparation of size controlled model filler
with dispersion polymerization of methyl methacrylate Students for Students XI.
International Student Conference, Cluj-Napoca Chemistry section I. place, .9-13
04.2014.
2. Kárpáti, L.; Hári J.; Pukánszky B. Térhálós szerkezetű, szűk szemcseméret el-
oszlású modell töltőanyagok előállítási lehetőségeinek vizsgálata, Budapesti
Műszaki és Gazdaságtudományi Egyetem Vegyész és Biomérnöki Kar TDK
konferencia, Budapest Anyagtudományi szekció II. place. 11. 11.2014
3. Kárpáti, L.; Hári J.; Pukánszky B. Térhálós szerkezetű, szűk szemcseméret el-
oszlású modell töltőanyagok előállítási lehetőségeinek vizsgálata, Kémia és Ve-
gyipari szekció Anyagtudomány tagozat. XXXII. OTDK konferencia, Vesz-
prém, 9-11 04.2015
4. Kárpáti, L.; Hári J.; Pukánszky B. Preparation possibilities of cross-linked mo-
del filler with narrow size distribution, Chemistry section, 22-26 04.2015 Stu-
dents for Students XI. International Student Conference, Cluj-Napoca,
5. Kárpáti, L.; Hamar, G.; Vargha, V. Biodegradálható alifás poliészteramidok
szintézise és jellemzése, XIV. Oláh György Doktori Iskola PhD Konferencia,
Budapest, 02. 02.2016
6. Kárpáti, L.; Menyhért, V.; Vargha, V. Synthesis and Characterization of Bio-
logically Degradable Polyesters, 1st Journal of Thermal Analysis and Calori-
metry Conference and 6th V4 Thermoanalytical Conference, Budapest 6-9.
06.2017

Publications
143
7. Kárpáti, L.; Menyhért, V.; Vargha, V. Biológiailag lebontható poliészterek
szintézise és jellemzése, XXIII. Nemzetközi Vegyészkonferencia Déva, 27
10.2017
8. Kárpáti, L.; Hamar, G.; Vargha, V. The effect of substituents on direct poly-
condensation and properties of aliphatic polyester-amides, 7th. European Young
Engineers Conference, Warsaw, 23-26 04.2018 9. Nagy, S.;Kárpáti, L., Mátravölgyi, B.; Kisszékely, P.; Pukánszky, B.; Huszthy
P.; Kupai, J. Synthesis and application of a cinchona-squaramide organocata-
lyst and its recovery by immobilization on poly(glycidyl methacrylate), 7th. Eu-
ropean Young Engineers Conference, Warsaw, 23-26 04.2018
10. Banka, E., Kárpáti, L., Vargha, V.: Epoxigyanta térhálósítása PET aminolízisé-
ből származó tereftálsav-amid oligomerekkel, Polimerkémia és -technológia ta-
gozat, Kémia és Vegyipari szekció, Budapest, 21-23 03.2019
11. Vajóczky, V., Kárpáti, L., Pukánszky, B.: Cinkona alapú organokatalizátor rög-
zítésére alkalmas poli(glicidilmetakrilát) hordozó előállítása diszperziós polime-
rizációval, Polimerkémia és -technológia tagozat, Kémia és Vegyipari szekció,
Budapest, 21-23 03.2019, II. helyezés
12. Fogarassy, F., Kárpáti, L., Vargha, V.: A polietiléntereftalát kémiai újrahasz-
nosítása acido-alkoholízissel, Szent-Györgyi Albert Konferencia, 05-06
04.2019, Budapest
Poster presentations
13. Bugyi, O., Szarka, Gy., Kárpáti, L., Vargha, V.: Value added products by
chemical decomposition of PET waste.XII. Kárpát-medencei Környezettudo-mányi Konferencia, Beregszász, June 1-4. 2016. XII. Conference on Environ-
mental Science of the Karpatian Basin, Beregszász, 1-4 06.2016. P18
14. Bugyi, O., Szarka, Gy., Kárpáti, L., Vargha, V.: Value added products by
chemical decomposition of PET waste. 3rd Conference of Biobased Polymers
and Composites, Szeged, 08. 28 – 09.01 2016 P 372-373 Poster
81
15. Heffner T., Szarka, Gy., Kárpáti, L., Hartmann M., Vargha, V Biodegradable
Polymers from PET Waste via Solvolysis 3rd Conference of Biobased Polymers
and Composites, Szeged, 08. 28 – 09.01 2016 P 374-375 Poster 82
16. Kárpáti, L., Hamar, G., Vargha: The effect of substituents on direct polycon-
densation and properties of aliphatic polyester-amides. XV. Oláh György Dok-
tori konferencia, 01. 02.2018
17. Kárpáti, L., Hamar, G. & Vargha: The effect of substituents on direct polycon-
densation and properties of aliphatic polyester-amides. 4th Conference of Bio-
based Polymers and Composites, Balatonfüred, 02-06 09.2018

144
Nyilatkozat
Alulírott Kárpáti Levente kijelentem, hogy ezt a doktori értekezést magam ké-szítettem és abban csak a megadott forrásokat használtam fel. Minden olyan részt, ame-
lyet szó szerint, vagy azonos tartalomban, de átfogalmazva más forrásból átvettem, egy-
értelműen, a forrás megadásával megjelöltem.
Budapest, 2020. augusztus 20.
Kárpáti Levente