KIDNEYS KIDNEYS KIDNEYS KIDNEYS KIDNEYS KIDNEYS KIDNEYS KIDNEYS.
Upload
truongliemCategory
view
215download
0
Review
Functional MRI of the Kidneys
Jeff L. Zhang, PhD,1* Henry Rusinek, PhD,2 Hersh Chandarana, MD,2
and Vivian S. Lee, MD, PhD1
This article is accredited as a journal-based CME activity.If you wish to receive credit for this activity, please refer tothe website: www.wileyhealthlearning.com
ACCREDITATION AND DESIGNATION STATEMENT
Blackwell Futura Media Services designates this journal-based CME activity for a maximum of 1 AMA PRA Category1 CreditTM. Physicians should only claim credit commensu-rate with the extent of their participation in the activity.
Blackwell Futura Media Services is accredited by the Ac-creditation Council for Continuing Medical Education toprovide continuing medical education for physicians.
EDUCATIONAL OBJECTIVES
Upon completion of this educational activity, participantswill be better able to analyze the applications of functionalMRI techniques for the diagnosis of renal diseases.
ACTIVITY DISCLOSURES
No commercial support has been accepted related to thedevelopment or publication of this activity.
Faculty Disclosures:
The following contributors have no conflicts of interest todisclose:
Editor-in-Chief: C. Leon Partain, MD, PhD
CME Editor: Scott B. Reeder, MD, PhD
CME Committee: Scott Nagle, MD, PhD, Pratik Mukher-jee, MD, PhD, Shreyas Vasanawala, MD, PhD, Bonnie Joe,MD, PhD, Tim Leiner, MD, PhD, Sabine Weckbach, MD,Frank Korosec, PhD
Authors: Jeff L. Zhang, PhD, Henry Rusinek, PhD,Hersh Chandarana, MD, Vivian S. Lee, MD, PhD
This manuscript underwent peer review in line withthe standards of editorial integrity and publication ethics
maintained by Journal of Magnetic Resonance Imaging.The peer reviewers have no relevant financial relationships.The peer review process for Journal of Magnetic ResonanceImaging is double-blinded. As such, the identities of thereviewers are not disclosed in line with the standardaccepted practices of medical journal peer review.
Conflicts of interest have been identified and resolvedin accordance with Blackwell Futura Media Services’s Policyon Activity Disclosure and Conflict of Interest. No relevant fi-nancial relationships exist for any individual in control ofthe content and therefore there were no conflicts to resolve.
INSTRUCTIONS ON RECEIVING CREDIT
For information on applicability and acceptance of CMEcredit for this activity, please consult your professionallicensing board.
This activity is designed to be completed within an hour;physicians should claim only those credits that reflect thetime actually spent in the activity. To successfully earncredit, participants must complete the activity during thevalid credit period.
Follow these steps to earn credit:
� Log on to www.wileyhealthlearning.com
� Read the target audience, educational objectives, and
activity disclosures.
� Read the article in print or online format.
� Reflect on the article.
� Access the CME Exam, and choose the best answer to
each question.
� Complete the required evaluation component of the
activity.
This activity will be available for CME credit for twelvemonths following its publication date. At that time, it willbe reviewed and potentially updated and extended for anadditional period.
1Department of Radiology, University of Utah School of Medicine, Salt Lake City, Utah, USA.2Department of Radiology, New York University School of Medicine, New York, New York, USA.
Contract grant sponsor: National Institutes of Health (NIH); Contract grant numbers: R01DK063183 and R01DK088375.*Address reprint requests to: J.L.Z., Department of Radiology, University of Utah, 729 Arapeen Dr., Salt Lake City, UT 84108.E-mail: [email protected]
Received May 27, 2011; Accepted May 2, 2012.
DOI 10.1002/jmri.23717
View this article online at wileyonlinelibrary.com.
JOURNAL OF MAGNETIC RESONANCE IMAGING 37:282–293 (2013)
CME
VC 2012 Wiley Periodicals, Inc. 282

Renal function is characterized by different physiologicaspects, including perfusion, glomerular filtration, inter-stitial diffusion, and tissue oxygenation. Magnetic reso-nance imaging (MRI) shows great promise in assessingthese renal tissue characteristics noninvasively. The lastdecade has witnessed a dramatic progress in MRI techni-ques for renal function assessment. This article brieflydescribes relevant renal anatomy and physiology, reviewsthe applications of functional MRI techniques for thediagnosis of renal diseases, and lists unresolved issuesthat will require future work.
Key Words: kidney; magnetic resonance imaging;functionalJ. Magn. Reson. Imaging 2013;37:282–293.VC 2012 Wiley Periodicals, Inc.
THE ACCURATE ASSESSMENT of kidney function isimportant in both the clinic and research. Impairmentin renal function precedes anatomic changes such asatrophy, and early detection of functional loss allowsmore options for treatment and potentially a delay orhalt in disease progression. Functional assessment isalso important in renal transplantation, the only effec-tive therapeutic option after renal failure. Within thefirst 2 years, about a third of grafted kidneys manifestan episode of graft dysfunction due to various causes.Reliable functional monitoring for grafted kidney isdesirable for both short-term and long-term manage-ment. The most commonly used measure of renalfunction is serum creatinine. However, serum creati-nine has well known limitations, particularly insensi-tivity to early renal dysfunction, especially in chronicdisease. Elevated serum creatinine is often discoveredonly in the late stages of disease, when substantialand sometimes irreversible renal damage takes place.
In the past decade, magnetic resonance imaging(MRI), conventionally used for tissue anatomic imag-ing, has been explored as an important and versatiletool for assessing the function of the kidneys. Techni-
ques such as dynamic contrast-enhanced (DCE) MRI,diffusion-weighted MRI (DWI), blood oxygenationlevel-dependent (BOLD) MRI, and arterial spin label-ing (ASL) enable noninvasive evaluation of variousaspects of renal function ranging from perfusion to fil-tration to oxygenation. These techniques show prom-ise in replacing the invasive techniques, eg, oxygenmicroprobe for oxygenation, which are currently lim-ited to animal experiments.
In recent years several reviews on the role of MRI inevaluating renal function have been published (1–6).This review article covers the recent progress in thearea of functional MRI of the kidney. We begin with ashort introduction of renal anatomy and physiology,followed by an overview of various MRI techniques(DCE, DWI, BOLD, ASL) that can assess renal func-tion. We briefly discuss the application of these tech-niques in evaluation of renal diseases and majordirections for further development of renal functionalMRI.
RENAL ANATOMY AND PHYSIOLOGY
Overall Structure
The kidney consists of predominantly a peripheralcortex and, more centrally, the renal medulla, whichis configured as multiple internally situated cone-shaped tissues called pyramids (Fig. 1a). The tips ofeach pyramid converge near the center of the kidneyinto the area known as a calyx. Urine collects in therenal pelvis and then flows through the ureter intothe bladder. The space where renal pelvis resides,termed the renal hilum, contains the distal end of re-nal artery and the origin of renal vein. Each of the two(left and right) renal arteries receives �10% of cardiacoutput. Within the kidney, blood perfusion in cortexis �400–500 mL/min/100g, while medulla is lessperfused, �100–150 mL/min/100g, as measured bythe computed tomography technique (7,8).
Figure 1. a: Coronal section of the kidney. b: Schematic diagram of a nephron.
Renal Functional MRI 283

Nephron
A typical kidney contains about 1 million nephrons.Each nephron consists of a filtering component, calleda renal corpuscle, and a tubule where reabsorptionand secretion take place (Fig. 1b). The renal corpus-cle, a ball-shaped structure, consists of its exteriorcomponent called a Bowman’s capsule that holds acompact bundle of capillary loops called a glomerulus.Blood in afferent arteriole enters glomerulus, gets fil-tered there, and exits through an efferent arteriole.Filtration results in about 20% of the incoming renalplasma passing through the glomerular membrane;first into Bowman’s capsule, then into the proximaltubule. This fluid is accompanied by solutes with mo-lecular weight <6000 Da. The glomerular filtrationrate (GFR, mL/min) is normally around 60 mL/min,or a total of �120 mL/min for both kidneys. Urineflow is only �1 mL/min. This huge discrepancy is dueto the reabsorption of glomerular filtrate back into theblood.
Tubule and Peritubular Capillaries
The renal tubule extends from Bowman’s capsule andconsists of: proximal tubule (PT), loop of Henle (LH),and distal tubule (DT). The PT and DT are mostly inrenal cortex, and LH, connecting PT and DT, is deepin the renal medulla (Fig. 1b). DT joins a collectingduct which ultimately terminates in a calyx. In the re-nal cortex, peritubular capillaries are distributedaround the PT and DT. Some efferent arteriolesextend down to medulla, giving rise to descendingvasa recta (DVR) (Fig. 1b). Reabsorbed water and sol-utes from the tubules rejoins the circulation via thecapillaries and vasa recta.
Water and Sodium Reabsorption
In the proximal tubule, a large fraction (�65%) of so-dium is reabsorbed back via Na-H antiporter. Due toosmotic force, water is reabsorbed across highlypermeable PT. The descending thin limb of LH is notpermeable to sodium, but �10% of water is reab-sorbed there. In the thick ascending limb, activetranscellular reabsorption by Na-K-2Cl symporterbecomes a dominant factor, leading to �25% of fil-tered sodium. In DT, about 5% of sodium is reab-sorbed by Na-Cl symporter. The transporters for activetranscellular sodium reabsorption are driven by Na-K-ATPase, or sodium pumps. The main function of theNa-K-ATPase is to pump sodium from epithelium intointerstitium, at the expense of ATP. Note that in renalmedulla, where perfusion is low, the active transportof sodium results in low tissue oxygenation or hypoxiastate (10–20 mmHg, compared with 50–60 mmHg incortex) (9,10). Water does not permeate the ascendinglimbs and the distal tubule. In the collecting ducts,water reabsorption is controlled by antidiuretic hor-mone (ADH or vasopressin) secreted from the pituitarygland. The bulk flow of salt and water from intersti-tium to peritubular capillary results from hydrostaticand oncotic forces, also called Starling forces.
Renal Autoregulation
Due to the myogenic mechanism and renin-angioten-sin system, renal blood flow (RBF) and GFR arerelatively stable in spite of variable blood pressure inrenal artery. Decreased arterial pressure leads toreduced tubular Na concentration, which is sensed byspecialized cells—macula densa. The resulting stimu-lation of renin secretion preferentially constricts effer-ent arterioles and leads to preserved GFR. Angioten-sin-converting enzyme (ACE) inhibitors inhibit theeffect of renin, and are useful in detecting renovascu-lar hypertension.
Diuretics
A diuretic is any drug that elevates the rate of urineproduction. Different types of diuretics act on differenttubular segments. Water loading is widely used in MRIresearch to suppress secretion of ADH and reduce waterreabsorption along the collecting ducts. Furosemide, onother hand, blocks sodium reabsorption in the thickascending limb of loop of Henle, thus reducing ATP con-sumption and counteracting medullary hypoxia.
FUNCTIONAL MRI TOOLS
Since the function of the kidney centers on the fluidregulation, MRI is naturally suited for in vivo measure-ment of various aspects of renal function, such as per-fusion, filtration, diffusion, and oxygenation (Table 1).
DCE-MRI
Before the advent of DCE-MRI, dynamic renal scintig-raphy using radioactive technetium-99m based trac-ers has been widely used for measuring renal func-tion. DCE-MRI for the kidney, also termed MRrenography (MRR), has advantages over scintigraphyincluding no radiation exposure, inherently 3D acqui-sition, and superior spatial resolution. Unlike scintig-raphy, MRI can easily resolve the renal cortex fromthe medulla and collecting system. Through more re-alistic modeling DCE-MRI offers the potential to revealin vivo renal properties that in the past could only beexamined with biopsies, opening new windows intorenal pathophysiology and clinical diagnosis.
Tracer Kinetics and Modeling
One key aspect of DCE-MRI analysis is the choice ofmodel used to describe the transit of contrast in renal
Table 1
MRI Tools for Renal Functional Assessment
Physiologic parameters MRI tools
Perfusion ASL, DCE, DWI(IVIM)
Glomerular filtration DCE
Interstitial diffusion DWI
Tissue oxygenation BOLD
Tubular transit, Sodium
concentration
Largely unexplored
284 Zhang et al.
tissue. As reviewed recently (11), at this time there isno consensus about the best model for MRR.
A two-compartmental model, restricted to vascularand tubular compartments, has been introduced byseveral groups. The major attraction of such a model,especially its graphical Patlak-plot ‘‘upslope’’ implemen-tation (12), is its simplicity. However, these two-com-partment models ignore the transit of the tracer out ofthe tubular compartment and strongly depend on thearbitrary time interval over which a slope is calculated.Annet et al (13) refined the two-compartment model byintroducing the delay and dispersion of the bolusbetween the aorta and renal vasculature and accountingfor the efflux from the tubular compartment as an expo-nential decay. Sourbron et al (14) extended this modelfor measuring both renal perfusion and GFR. A compar-ison study by Buckley et al (15) found that the refinedmodel fitted experimental data better but it overesti-mated GFR. Koh et al (16) validated a more elaborateparallel two-pathway model: vascular (from renal arteryto vein) and tubular (from renal artery to tubules).
More elaborate modeling is predicated on our abilityto measure contrast in two subregions of the kidney,cortex and medulla (17). Such three-compartmentmodels were developed by Lee et al and Zhang et al(18,19). Three-compartment models have the potentialof providing functional information about tubules.The articles by Buckley et al (15) and Bokacheva et al(11) compared some of the models, and provide somerecommendations for their use.
In addition to the kinetic modeling of DCE data,there are other considerations worth noting, includingthe effects of errors in arterial input function esti-mates and efforts to convert MR signal intensity intogadolinium concentrations for modeling, each ofwhich are discussed briefly below.
Estimating Arterial Input Function (AIF)
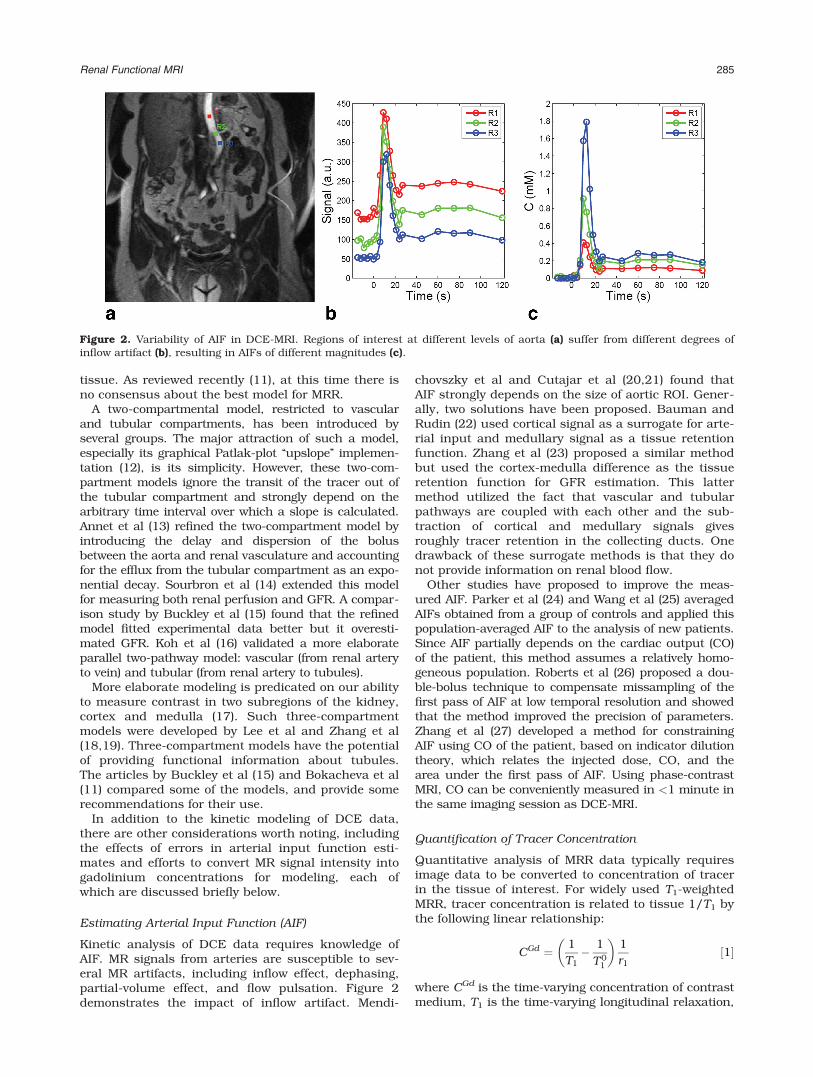
Kinetic analysis of DCE data requires knowledge ofAIF. MR signals from arteries are susceptible to sev-eral MR artifacts, including inflow effect, dephasing,partial-volume effect, and flow pulsation. Figure 2demonstrates the impact of inflow artifact. Mendi-
chovszky et al and Cutajar et al (20,21) found thatAIF strongly depends on the size of aortic ROI. Gener-ally, two solutions have been proposed. Bauman andRudin (22) used cortical signal as a surrogate for arte-rial input and medullary signal as a tissue retentionfunction. Zhang et al (23) proposed a similar methodbut used the cortex-medulla difference as the tissueretention function for GFR estimation. This lattermethod utilized the fact that vascular and tubularpathways are coupled with each other and the sub-traction of cortical and medullary signals givesroughly tracer retention in the collecting ducts. Onedrawback of these surrogate methods is that they donot provide information on renal blood flow.
Other studies have proposed to improve the meas-ured AIF. Parker et al (24) and Wang et al (25) averagedAIFs obtained from a group of controls and applied thispopulation-averaged AIF to the analysis of new patients.Since AIF partially depends on the cardiac output (CO)of the patient, this method assumes a relatively homo-geneous population. Roberts et al (26) proposed a dou-ble-bolus technique to compensate missampling of thefirst pass of AIF at low temporal resolution and showedthat the method improved the precision of parameters.Zhang et al (27) developed a method for constrainingAIF using CO of the patient, based on indicator dilutiontheory, which relates the injected dose, CO, and thearea under the first pass of AIF. Using phase-contrastMRI, CO can be conveniently measured in <1 minute inthe same imaging session as DCE-MRI.
Quantification of Tracer Concentration
Quantitative analysis of MRR data typically requiresimage data to be converted to concentration of tracerin the tissue of interest. For widely used T1-weightedMRR, tracer concentration is related to tissue 1/T1 bythe following linear relationship:
CGd ¼ 1
T1� 1
T01
� �1
r1½1�
where CGd is the time-varying concentration of contrastmedium, T1 is the time-varying longitudinal relaxation,
Figure 2. Variability of AIF in DCE-MRI. Regions of interest at different levels of aorta (a) suffer from different degrees ofinflow artifact (b), resulting in AIFs of different magnitudes (c).
Renal Functional MRI 285
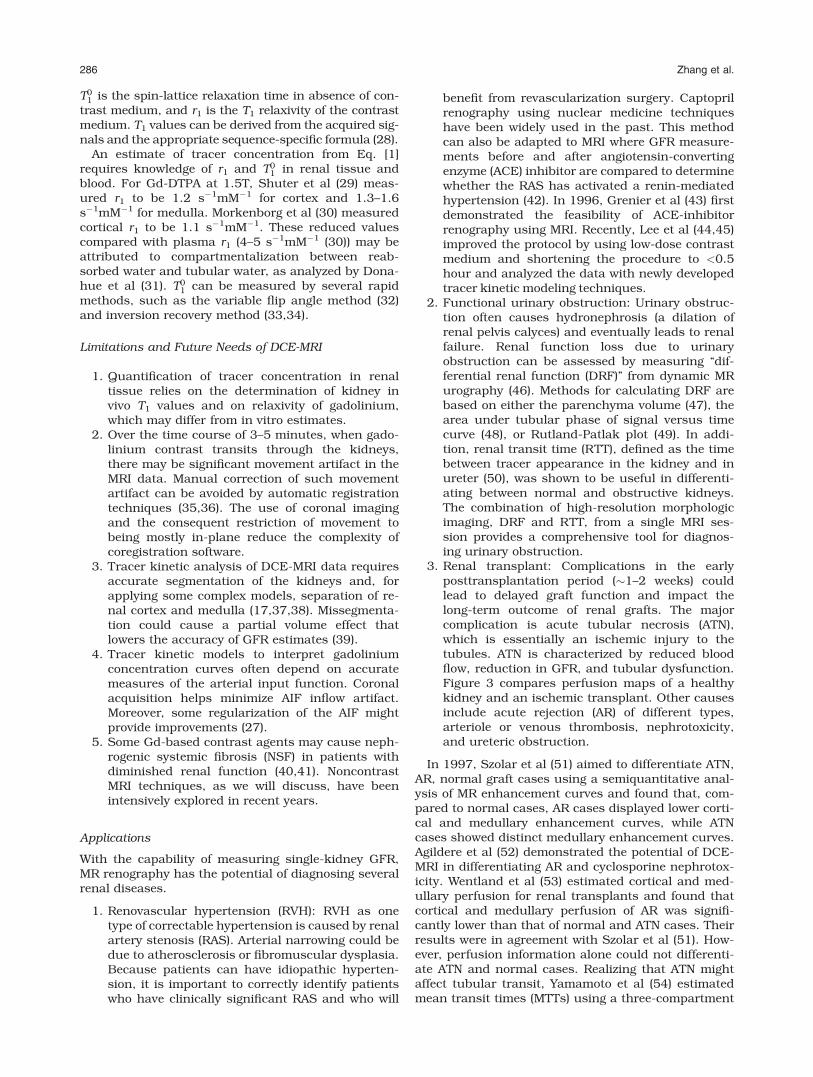
T01 is the spin-lattice relaxation time in absence of con-
trast medium, and r1 is the T1 relaxivity of the contrastmedium. T1 values can be derived from the acquired sig-nals and the appropriate sequence-specific formula (28).
An estimate of tracer concentration from Eq. [1]requires knowledge of r1 and T0
1 in renal tissue andblood. For Gd-DTPA at 1.5T, Shuter et al (29) meas-ured r1 to be 1.2 s�1mM�1 for cortex and 1.3–1.6s�1mM�1 for medulla. Morkenborg et al (30) measuredcortical r1 to be 1.1 s�1mM�1. These reduced valuescompared with plasma r1 (4–5 s�1mM�1 (30)) may beattributed to compartmentalization between reab-sorbed water and tubular water, as analyzed by Dona-hue et al (31). T0
1 can be measured by several rapidmethods, such as the variable flip angle method (32)and inversion recovery method (33,34).
Limitations and Future Needs of DCE-MRI
1. Quantification of tracer concentration in renaltissue relies on the determination of kidney invivo T1 values and on relaxivity of gadolinium,which may differ from in vitro estimates.
2. Over the time course of 3–5 minutes, when gado-linium contrast transits through the kidneys,there may be significant movement artifact in theMRI data. Manual correction of such movementartifact can be avoided by automatic registrationtechniques (35,36). The use of coronal imagingand the consequent restriction of movement tobeing mostly in-plane reduce the complexity ofcoregistration software.
3. Tracer kinetic analysis of DCE-MRI data requiresaccurate segmentation of the kidneys and, forapplying some complex models, separation of re-nal cortex and medulla (17,37,38). Missegmenta-tion could cause a partial volume effect thatlowers the accuracy of GFR estimates (39).
4. Tracer kinetic models to interpret gadoliniumconcentration curves often depend on accuratemeasures of the arterial input function. Coronalacquisition helps minimize AIF inflow artifact.Moreover, some regularization of the AIF mightprovide improvements (27).
5. Some Gd-based contrast agents may cause neph-rogenic systemic fibrosis (NSF) in patients withdiminished renal function (40,41). NoncontrastMRI techniques, as we will discuss, have beenintensively explored in recent years.
Applications
With the capability of measuring single-kidney GFR,MR renography has the potential of diagnosing severalrenal diseases.
1. Renovascular hypertension (RVH): RVH as onetype of correctable hypertension is caused by renalartery stenosis (RAS). Arterial narrowing could bedue to atherosclerosis or fibromuscular dysplasia.Because patients can have idiopathic hyperten-sion, it is important to correctly identify patientswho have clinically significant RAS and who will
benefit from revascularization surgery. Captoprilrenography using nuclear medicine techniqueshave been widely used in the past. This methodcan also be adapted to MRI where GFR measure-ments before and after angiotensin-convertingenzyme (ACE) inhibitor are compared to determinewhether the RAS has activated a renin-mediatedhypertension (42). In 1996, Grenier et al (43) firstdemonstrated the feasibility of ACE-inhibitorrenography using MRI. Recently, Lee et al (44,45)improved the protocol by using low-dose contrastmedium and shortening the procedure to <0.5hour and analyzed the data with newly developedtracer kinetic modeling techniques.
2. Functional urinary obstruction: Urinary obstruc-tion often causes hydronephrosis (a dilation ofrenal pelvis calyces) and eventually leads to renalfailure. Renal function loss due to urinaryobstruction can be assessed by measuring ‘‘dif-ferential renal function (DRF)’’ from dynamic MRurography (46). Methods for calculating DRF arebased on either the parenchyma volume (47), thearea under tubular phase of signal versus timecurve (48), or Rutland-Patlak plot (49). In addi-tion, renal transit time (RTT), defined as the timebetween tracer appearance in the kidney and inureter (50), was shown to be useful in differenti-ating between normal and obstructive kidneys.The combination of high-resolution morphologicimaging, DRF and RTT, from a single MRI ses-sion provides a comprehensive tool for diagnos-ing urinary obstruction.
3. Renal transplant: Complications in the earlyposttransplantation period (�1–2 weeks) couldlead to delayed graft function and impact thelong-term outcome of renal grafts. The majorcomplication is acute tubular necrosis (ATN),which is essentially an ischemic injury to thetubules. ATN is characterized by reduced bloodflow, reduction in GFR, and tubular dysfunction.Figure 3 compares perfusion maps of a healthykidney and an ischemic transplant. Other causesinclude acute rejection (AR) of different types,arteriole or venous thrombosis, nephrotoxicity,and ureteric obstruction.
In 1997, Szolar et al (51) aimed to differentiate ATN,AR, normal graft cases using a semiquantitative anal-ysis of MR enhancement curves and found that, com-pared to normal cases, AR cases displayed lower corti-cal and medullary enhancement curves, while ATNcases showed distinct medullary enhancement curves.Agildere et al (52) demonstrated the potential of DCE-MRI in differentiating AR and cyclosporine nephrotox-icity. Wentland et al (53) estimated cortical and med-ullary perfusion for renal transplants and found thatcortical and medullary perfusion of AR was signifi-cantly lower than that of normal and ATN cases. Theirresults were in agreement with Szolar et al (51). How-ever, perfusion information alone could not differenti-ate ATN and normal cases. Realizing that ATN mightaffect tubular transit, Yamamoto et al (54) estimatedmean transit times (MTTs) using a three-compartment
286 Zhang et al.

model and found a higher ratio of tubular MTT overwhole-parenchyma MTT than successful transplant.
DWI-MRI
DWI-MRI is designed to probe random microscopicmotion, or diffusion, of water in tissue, and does notrequire exogenous contrast agent. The diffusionsequence incorporates a bipolar gradient into a spinecho sequence (Fig. 4).
The dependence of measured signal S on the b-val-ues is given as:
SðbÞ ¼ Sð0Þ � e�b�ADC ½2�
where ADC is apparent diffusion coefficient. ADC isone of the simplest parameters that reflect tissuemicrostructure. The estimation of ADC can be doneby fitting signals acquired at different b-values by Eq.[2]. In a detailed review, Kim et al (55) suggested astandardized sequence: breath-hold or respiratorytriggered (using a navigator echo), single-shot echo-planar imaging, tri-directional gradients using b-val-ues: 0, 400, and 800 sec/mm2.
Applications of ADC in Renal Fibrosis and Dysfunction
Normal renal function involves multiple processes ofwater transport, while worsening renal function(reduction in GFR) should lead to a decrease in water
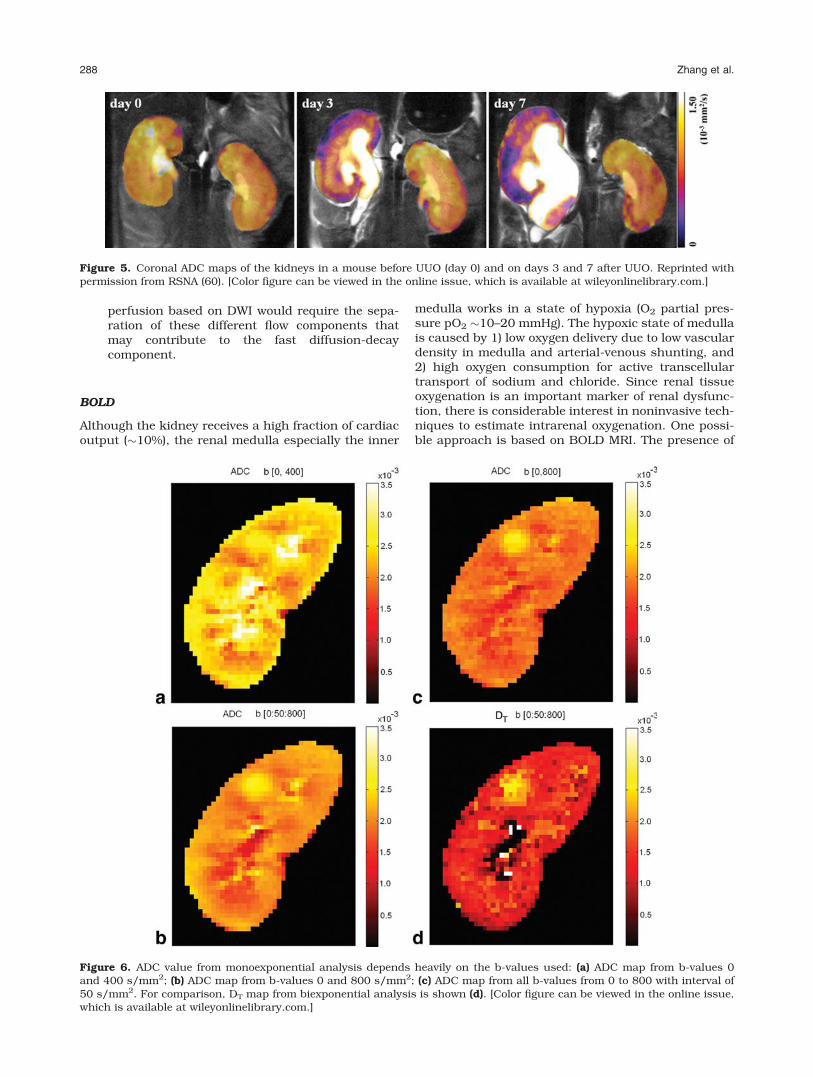
reabsorption, ie, a lower rate of water transfer acrossinterstitial space. This would potentially reduce diffu-sion. In addition, fibrosis formed in the process ofchronic renal dysfunction may also restrict water dif-fusion. Several researchers have shown a positive cor-relation (R ¼ �0.8) between ADC and GFR, estimatedeither with serum creatinine level (56,57) or renalscintigraphy (58,59). Recently, Togao et al (60) stud-ied the relationship between renal fibrosis and ADC inan animal model of unilateral ureteral obstruction(ureteral obstruction induces fibrosis in �1 week) andfound that the ADC of the obstructed kidneysdecreased to 0.7 � 10�3 mm2/sec on day 3, and to0.57 � 10�3 mm2/sec on day 7 (Fig. 5). ADC of con-tralateral kidney remained stable at 0.9–1.0 � 10�3
mm2/sec. As speculated by the authors and Thoenyand Grenier (61), the decrease in ADC could be due tothe increase in cell density in interstitial space.
Intravoxel Incoherent Motion (IVIM) Effect
IVIM extends the monoexponential model from Eq. [2]by including microscopic motion attributable tomicrocirculation of blood (62,63):
SðbÞ ¼ Sð0Þ � FP � e�b�DP þ 1� FPð Þ � e�b�DT� �
; ½3�
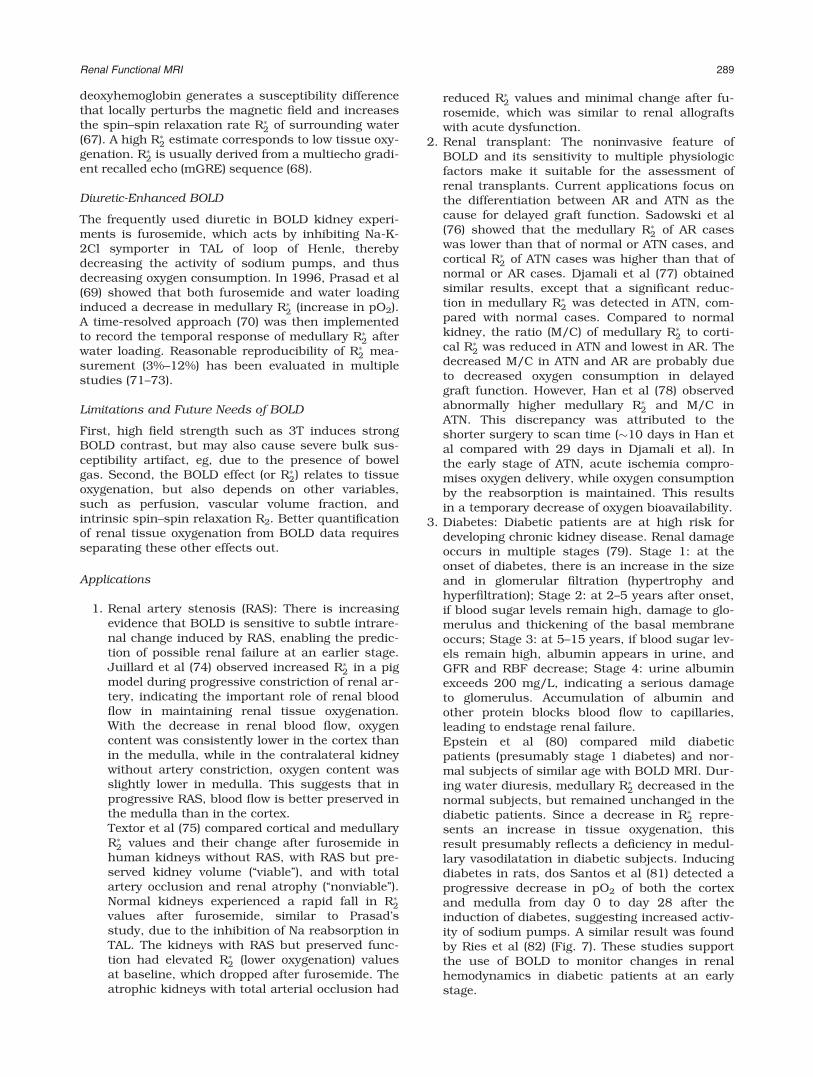
where FP is fast-component fraction, DT is tissuediffusion coefficient, and DP is a pseudo-diffusioncoefficient due to the IVIM effect. With high capillarydensity and high blood flow, the kidney is expected toshow a strong IVIM effect. Zhang et al (64) found thatADC values from monoexponential fitting dependheavily on the b-values used (Fig. 6) and concludedthat the monoexponential model is not adequate forrenal DWI data. The advantage of the biexponentialmodel in fitting renal DWI data was confirmed byWittsack et al (65), who compared monoexponential,biexponential, and a distribution function model.
Limitations and Future Needs of IVIM
While mounting evidence suggests that the IVIM pa-rameters may provide a noninvasive biomarker for re-nal perfusion, more work is needed.
1. DWI data of high quality is needed to improvethe estimation precision of IVIM parameters,since error propagation from signal to FP and DP
is much higher than that to ADC (66). Respira-tory motion is a major problem that degradesDWI image quality.
2. The relative contributions of blood flow (perfu-sion) and tubular flow to the IVIM parametersare unclear. Quantitative measurement of
Figure 4. Diagram of typical DWI sequence. d is the dura-tion of diffusion-encoding gradient lobe, D is the timebetween the gradient lobes, G is the magnitude of thegradient.
Figure 3. Comparison of DCE-MRI for a healthy kidney anda partially ischemic transplant. a: One image of the healthykidney from postcontrast vascular phase. b: The perfusionmap of the healthy kidney generated from vascular-phaseimages. c: One image of the renal transplant from postcon-trast vascular phase. d: The perfusion map of the transplantshowing partial ischemia.
Renal Functional MRI 287
perfusion based on DWI would require the sepa-ration of these different flow components thatmay contribute to the fast diffusion-decaycomponent.
BOLD
Although the kidney receives a high fraction of cardiacoutput (�10%), the renal medulla especially the inner
medulla works in a state of hypoxia (O2 partial pres-sure pO2 �10–20 mmHg). The hypoxic state of medullais caused by 1) low oxygen delivery due to low vasculardensity in medulla and arterial-venous shunting, and2) high oxygen consumption for active transcellulartransport of sodium and chloride. Since renal tissueoxygenation is an important marker of renal dysfunc-tion, there is considerable interest in noninvasive tech-niques to estimate intrarenal oxygenation. One possi-ble approach is based on BOLD MRI. The presence of
Figure 5. Coronal ADC maps of the kidneys in a mouse before UUO (day 0) and on days 3 and 7 after UUO. Reprinted withpermission from RSNA (60). [Color figure can be viewed in the online issue, which is available at wileyonlinelibrary.com.]
Figure 6. ADC value from monoexponential analysis depends heavily on the b-values used: (a) ADC map from b-values 0and 400 s/mm2; (b) ADC map from b-values 0 and 800 s/mm2; (c) ADC map from all b-values from 0 to 800 with interval of50 s/mm2. For comparison, DT map from biexponential analysis is shown (d). [Color figure can be viewed in the online issue,which is available at wileyonlinelibrary.com.]
288 Zhang et al.
deoxyhemoglobin generates a susceptibility differencethat locally perturbs the magnetic field and increasesthe spin–spin relaxation rate R�2 of surrounding water(67). A high R�2 estimate corresponds to low tissue oxy-genation. R�2 is usually derived from a multiecho gradi-ent recalled echo (mGRE) sequence (68).
Diuretic-Enhanced BOLD
The frequently used diuretic in BOLD kidney experi-ments is furosemide, which acts by inhibiting Na-K-2Cl symporter in TAL of loop of Henle, therebydecreasing the activity of sodium pumps, and thusdecreasing oxygen consumption. In 1996, Prasad et al(69) showed that both furosemide and water loadinginduced a decrease in medullary R�2 (increase in pO2).A time-resolved approach (70) was then implementedto record the temporal response of medullary R�2 afterwater loading. Reasonable reproducibility of R�2 mea-surement (3%–12%) has been evaluated in multiplestudies (71–73).
Limitations and Future Needs of BOLD
First, high field strength such as 3T induces strongBOLD contrast, but may also cause severe bulk sus-ceptibility artifact, eg, due to the presence of bowelgas. Second, the BOLD effect (or R�2) relates to tissueoxygenation, but also depends on other variables,such as perfusion, vascular volume fraction, andintrinsic spin–spin relaxation R2. Better quantificationof renal tissue oxygenation from BOLD data requiresseparating these other effects out.
Applications
1. Renal artery stenosis (RAS): There is increasingevidence that BOLD is sensitive to subtle intrare-nal change induced by RAS, enabling the predic-tion of possible renal failure at an earlier stage.Juillard et al (74) observed increased R�2 in a pigmodel during progressive constriction of renal ar-tery, indicating the important role of renal bloodflow in maintaining renal tissue oxygenation.With the decrease in renal blood flow, oxygencontent was consistently lower in the cortex thanin the medulla, while in the contralateral kidneywithout artery constriction, oxygen content wasslightly lower in medulla. This suggests that inprogressive RAS, blood flow is better preserved inthe medulla than in the cortex.Textor et al (75) compared cortical and medullaryR�2 values and their change after furosemide inhuman kidneys without RAS, with RAS but pre-served kidney volume (‘‘viable’’), and with totalartery occlusion and renal atrophy (‘‘nonviable’’).Normal kidneys experienced a rapid fall in R�2values after furosemide, similar to Prasad’sstudy, due to the inhibition of Na reabsorption inTAL. The kidneys with RAS but preserved func-tion had elevated R�2 (lower oxygenation) valuesat baseline, which dropped after furosemide. Theatrophic kidneys with total arterial occlusion had
reduced R�2 values and minimal change after fu-rosemide, which was similar to renal allograftswith acute dysfunction.
2. Renal transplant: The noninvasive feature ofBOLD and its sensitivity to multiple physiologicfactors make it suitable for the assessment ofrenal transplants. Current applications focus onthe differentiation between AR and ATN as thecause for delayed graft function. Sadowski et al(76) showed that the medullary R�2 of AR caseswas lower than that of normal or ATN cases, andcortical R�2 of ATN cases was higher than that ofnormal or AR cases. Djamali et al (77) obtainedsimilar results, except that a significant reduc-tion in medullary R�2 was detected in ATN, com-pared with normal cases. Compared to normalkidney, the ratio (M/C) of medullary R�2 to corti-cal R�2 was reduced in ATN and lowest in AR. Thedecreased M/C in ATN and AR are probably dueto decreased oxygen consumption in delayedgraft function. However, Han et al (78) observedabnormally higher medullary R�2 and M/C inATN. This discrepancy was attributed to theshorter surgery to scan time (�10 days in Han etal compared with 29 days in Djamali et al). Inthe early stage of ATN, acute ischemia compro-mises oxygen delivery, while oxygen consumptionby the reabsorption is maintained. This resultsin a temporary decrease of oxygen bioavailability.
3. Diabetes: Diabetic patients are at high risk fordeveloping chronic kidney disease. Renal damageoccurs in multiple stages (79). Stage 1: at theonset of diabetes, there is an increase in the sizeand in glomerular filtration (hypertrophy andhyperfiltration); Stage 2: at 2–5 years after onset,if blood sugar levels remain high, damage to glo-merulus and thickening of the basal membraneoccurs; Stage 3: at 5–15 years, if blood sugar lev-els remain high, albumin appears in urine, andGFR and RBF decrease; Stage 4: urine albuminexceeds 200 mg/L, indicating a serious damageto glomerulus. Accumulation of albumin andother protein blocks blood flow to capillaries,leading to endstage renal failure.Epstein et al (80) compared mild diabeticpatients (presumably stage 1 diabetes) and nor-mal subjects of similar age with BOLD MRI. Dur-ing water diuresis, medullary R�2 decreased in thenormal subjects, but remained unchanged in thediabetic patients. Since a decrease in R�2 repre-sents an increase in tissue oxygenation, thisresult presumably reflects a deficiency in medul-lary vasodilatation in diabetic subjects. Inducingdiabetes in rats, dos Santos et al (81) detected aprogressive decrease in pO2 of both the cortexand medulla from day 0 to day 28 after theinduction of diabetes, suggesting increased activ-ity of sodium pumps. A similar result was foundby Ries et al (82) (Fig. 7). These studies supportthe use of BOLD to monitor changes in renalhemodynamics in diabetic patients at an earlystage.
Renal Functional MRI 289

4. Other applications: BOLD imaging has the poten-tial for a broad range of other clinical indications.With unilateral ureteral obstruction (UUO), ananimal study with pigs after 24-hour UUO hasshown increased cortical R�2 (ie, lower oxygen-ation) and decreased medullary R�2 (ie, higher ox-ygenation) (83). In human subjects with UUO(with duration 5–47 hours), Thoeny et al (84)observed decreased medullary R�2 and decreasedcortical R�2. The different change in cortical R�2between the two studies could be due to the racedifference, or the different durations of UUO. Inpatients with acute renal failure, Xiao et al (85)observed decreased cortical R�2 and even moredecreased medullary R�2, indicating increased ox-ygenation level in both cortex and medulla.
ASL: Noncontrast Perfusion Imaging
Originally developed for measuring cerebral perfusion(86,87), ASL uses magnetically labeled protons inarteries as endogenous tracer and is therefore com-pletely noninvasive. Renal ASL has been validated byseveral studies, most of which used FAIR (flow sensi-tive alternating inversion recovery) for perfusion prep-aration and True-FISP (true fast imaging with steady
precession) for data acquisition. Because the signal-to-noise ratio (SNR) is low in ASL, multiple repetitionsand high field (3T) are needed. ASL signal decays withblood T1, so acquisitions must be performed within1–2 sec of arterial labeling. Because acquisitions typi-cally require labeled and unlabeled measurementsand their subtraction, motion artifacts can impedeaccurate measurements. Song et al (88) demonstratedhigh-quality ASL images with free breathing by incor-porating a dual-navigator technique into FAIR andcorrecting the mismatch between labeling slice andimage slice (Fig. 8). Most of the studies use a one-compartment ASL model. Kiefer et al (89) recentlyreported on a two-compartment model that accountsfor delayed exchange between vascular and extrava-scular spaces. Such models require higher SNR andacquisition of multiple inversion timepoints.
In agreement with more established invasive techni-ques, ASL MR studies have estimated renal perfusionat �300 mL/min/100g for cortex and �100 mL/min/100g for medulla of healthy kidneys. Artz et al (90)showed good correlation between ASL measured witha perfusion and fluorescent microsphere method in aswine model. However, ASL values were consistentlylower than microsphere estimates. More research isneeded to validate ASL against reference technique inhuman subjects.
Figure 8. Axial perfusion rate maps obtained by FAIR True-FISP with (a) and without (b) the dual navigator-gated techniquein the same scale. The kidneys are clearly delineated in the dual navigator-gated FAIR True-FISP perfusion image (a). Theperfusion values in (b) (without navigator gating) are overestimated because of respiratory motion. Reprinted with permissionfrom John Wiley & Sons (88). [Color figure can be viewed in the online issue, which is available at wileyonlinelibrary.com.]
Figure 7. T�2 maps of (a)healthy and (b) diabetic kid-neys for comparison. In bothcases the lowest T�2 values areclearly found within the outerstripe of the outer medulla.Note that low T�2 value corre-sponds to low oxygenation.Reprinted with permissionfrom John Wiley & Sons (82).
290 Zhang et al.

Other MRI Techniques
We have focused on some of the main areas of func-tional renal MRI studies. Many other approaches arealso in the exploratory phase including diffusion ten-sor imaging (DTI) to study the directionality of waterdiffusion (91–93), Na MRI to study corticomedullarysodium gradient (94–96), and MR elastography toevaluate tissue mechanical property (97,98).
FUTURE DIRECTIONS
MRI tools appear promising in estimating physiologicparameters for the diagnosis and monitoring of renaldiseases. To achieve the promise, future studies areneeded to resolve the following issues.
1. Given the challenges of respiratory and bulkmotion, adjacent bowel gas, and spatial resolu-tion demands, technical improvements in imagequality are critical to advances in functional re-nal MRI.
2. Validation of quantitative models is critical forrelating measured MRI data with specific andmeaningful physiologic parameters. Examplesinclude 1) the interpretation of BOLD measure-ments for oxygenation and perfusion, and 2) thedifferentiation of perfusion, filtration, and resorp-tion changes on DWI and IVIM measurements.
3. With the broad array of tools available in renalMRI, we must combine multiple (especially non-contrast) MRI protocols in the same scan. Clini-cal studies are needed to refine multimodalityapplications.
4. Robust image registration and segmentation.Image registration to correct for motion artifactsand the segmentation of renal cortex and me-dulla have been major issues in the analysis ofrenal images. Readily available tools for coregis-tration of images from different MR sequencesare also needed.
The trajectory of functional renal imaging over thepast decade and the growth in interest in the fieldpromise a bright future ahead. Without question,research advances in this field will benefit substantialpatient populations with high impact.
ACKNOWLEDGMENT
The authors thank Martha Helmers (NYU School ofMedicine) for her expert preparation of figures.
REFERENCES
1. Prasad PV. Functional MRI of the kidney: tools for translationalstudies of pathophysiology of renal disease. Am J Physiol 2006;290:F958–974.
2. Chandarana H, Lee VS. Renal functional MRI: are we ready forclinical application? AJR Am J Roentgenol 2009;192:1550–1557.
3. Grenier N, Basseau F, Ries M, Tyndal B, Jones R, Moonen C.Functional MRI of the kidney. Abdom Imaging 2003;28:164–175.
4. Kalb B, Martin DR, Salman K, Sharma P, Votaw J, Larsen C. Kid-ney transplantation: structural and functional evaluation usingMR Nephro-Urography. J Magn Reson Imaging 2008;28:805–822.
5. Nikken JJ, Krestin GP. MRI of the kidney—state of the art. EurRadiol 2007;17:2780–2793.
6. Li LP, Halter S, Prasad PV. Blood oxygen level-dependent MRimaging of the kidneys. Magn Reson Imaging Clin North Am2008;16:613–625.
7. Miles KA. Measurement of tissue perfusion by dynamic computedtomography. Br J Radiol 1991;64:409–412.
8. Zhao H, Gong J, Wang Y, Zhang Z, Qin P. Renal hemodynamicchanges with aging: a preliminary study using CT perfusion inthe healthy elderly. Clin Imaging 2010;34:247–250.
9. Evans RG, Gardiner BS, Smith DW, O’Connor PM. Intrarenal oxy-genation: unique challenges and the biophysical basis of homeo-stasis. Am J Physiol 2008;295:F1259–1270.
10. Brezis M, Rosen S. Hypoxia of the renal medulla—its implicationsfor disease. N Engl J Med 1995;332:647–655.
11. Bokacheva L, Rusinek H, Zhang JL, Chen Q, Lee VS. Estimatesof glomerular filtration rate from MR renography and tracer ki-netic models. J Magn Reson Imaging 2009;29:371–382.
12. Hackstein N, Heckrodt J, Rau WS. Measurement of single-kidneyglomerular filtration rate using a contrast-enhanced dynamic gra-dient-echo sequence and the Rutland-Patlak plot technique. JMagn Reson Imaging 2003;18:714–725.
13. Annet L, Hermoye L, Peeters F, Jamar F, Dehoux JP, Van BeersBE. Glomerular filtration rate: assessment with dynamic con-trast-enhanced MRI and a cortical-compartment model in therabbit kidney. J Magn Reson Imaging 2004;20:843–849.
14. Sourbron SP, Michaely HJ, Reiser MF, Schoenberg SO. MRI-mea-surement of perfusion and glomerular filtration in the humankidney with a separable compartment model. Invest Radiol 2008;43:40–48.
15. Buckley DL, Shurrab AE, Cheung CM, Jones AP, Mamtora H,Kalra PA. Measurement of single kidney function using dynamiccontrast-enhanced MRI: comparison of two models in humansubjects. J Magn Reson Imaging 2006;24:1117–1123.
16. Koh TS, Zhang JL, Ong CK, Shuter B. A biphasic parameter esti-mation method for quantitative analysis of dynamic renal scinti-graphic data. Phys Med Biol 2006;51:2857–2870.
17. Rusinek H, Boykov Y, Kaur M, et al. Performance of an auto-mated segmentation algorithm for 3D MR renography. MagnReson Med 2007;57:1159–1167.
18. Zhang JL, Rusinek H, Bokacheva L, et al. Functional assessmentof the kidney from magnetic resonance and computed tomogra-phy renography: impulse retention approach to a multicompart-ment model. Magn Reson Med 2008;59:278–288.
19. Lee VS, Rusinek H, Bokacheva L, et al. Renal function measure-ments from MR renography and a simplified multicompartmentalmodel. Am J Physiol 2007;292:F1548–1559.
20. Cutajar M, Mendichovszky IA, Tofts PS, Gordon I. The importanceof AIF ROI selection in DCE-MRI renography: reproducibility andvariability of renal perfusion and filtration. Eur J Radiol 2010;74:e154–160.
21. Mendichovszky IA, Cutajar M, Gordon I. Reproducibility of theaortic input function (AIF) derived from dynamic contrast-enhanced magnetic resonance imaging (DCE-MRI) of the kidneysin a volunteer study. Eur J Radiol 2009;71:576–581.
22. Baumann D, Rudin M. Quantitative assessment of rat kidney func-tion by measuring the clearance of the contrast agent Gd(DOTA)using dynamic MRI. Magn Reson Imaging 2000;18:587–595.
23. Zhang JL, Rusinek H, Chen Q, et al. Assessment of renal func-tion using MR renography without aortic input information. In:Proc 16th Annual Meeting ISMRM, Toronto; 2008 (abstract 456).
24. Parker GJ, Roberts C, Macdonald A, et al. Experimentally-derivedfunctional form for a population-averaged high-temporal-resolu-tion arterial input function for dynamic contrast-enhanced MRI.Magn Reson Med 2006;56:993–1000.
25. Wang Y, Huang W, Panicek DM, Schwartz LH, Koutcher JA. Fea-sibility of using limited-population-based arterial input functionfor pharmacokinetic modeling of osteosarcoma dynamic contrast-enhanced MRI data. Magn Reson Med 2008;59:1183–1189.
26. Roberts C, Buckley DL, Parker GJ. Comparison of errors associ-ated with single- and multi-bolus injection protocols in low-tem-poral-resolution dynamic contrast-enhanced tracer kineticanalysis. Magn Reson Med 2006;56:611–619.
27. Zhang JL, Rusinek H, Bokacheva L, Chen Q, Storey P, Lee VS.Use of cardiac output to improve measurement of input functionin quantitative dynamic contrast-enhanced MRI. J Magn ResonImaging 2009;30:656–665.
Renal Functional MRI 291
28. Bokacheva L, Rusinek H, Chen Q, et al. Quantitative determina-tion of Gd-DTPA concentration in T(1)-weighted MR renographystudies. Magn Reson Med 2007;57:1012–1018.
29. Shuter B, Tofts PS, Wang SC, Pope JM. The relaxivity of Gd-EOB-DTPA and Gd-DTPA in liver and kidney of the Wistar rat. MagnReson Imaging 1996;14:243–253.
30. Morkenborg J, Taagehoj JF, Vaever PN, Frokiaer J, Djurhuus JC,Stodkilde-Jorgensen H. In vivo measurement of T1 and T2 relax-ivity in the kidney cortex of the pig—based on a two-compartmentsteady-state model. Magn Reson Imaging 1998;16:933–942.
31. Donahue KM, Weisskoff RM, Burstein D. Water diffusion andexchange as they influence contrast enhancement. J Magn ResonImaging 1997;7:102–110.
32. Fram EK, Herfkens RJ, Johnson GA, et al. Rapid calculation ofT1 using variable flip angle gradient refocused imaging. MagnReson Imaging 1987;5:201–208.
33. Scheffler K, Hennig J. T(1) quantification with inversion recoveryTrueFISP. Magn Reson Med 2001;45:720–723.
34. Bokacheva L, Huang AJ, Chen Q, et al. Single breath-hold T1measurement using low flip angle TrueFISP. Magn Reson Med2006;55:1186–1190.
35. de Senneville BD, Mendichovszky IA, Roujol S, Gordon I, MoonenC, Grenier N. Improvement of MRI-functional measurement withautomatic movement correction in native and transplanted kid-neys. J Magn Reson Imaging 2008;28:970–978.
36. Giele EL, de Priester JA, Blom JA, et al. Movement correction ofthe kidney in dynamic MRI scans using FFT phase differencemovement detection. J Magn Reson Imaging 2001;14:741–749.
37. Li S, Zollner FG, Merrem AD, et al. Wavelet-based segmentationof renal compartments in DCE-MRI of human kidney: initialresults in patients and healthy volunteers. Comput Med ImagingGraph 2012;36:108–118.
38. Liu J, Leong TY, Chee KB, Tan BP, Shuter B, Wang SC. Set-basedcascading approaches for magnetic resonance (MR) image seg-mentation (SCAMIS). AMIA Annual Symposium Proceedings/AMIA Symposium AMIA Symposium 2006:504–508.
39. Gutierrez DR, Wells K, Diaz Montesdeoca O, Moran Santana A,Mendichovszky IA, Gordon I. Partial volume effects in dynamiccontrast magnetic resonance renal studies. Eur J Radiol 2010;75:221–229.
40. Grobner T. Gadolinium—a specific trigger for the development ofnephrogenic fibrosing dermopathy and nephrogenic systemic fi-brosis? Nephrol Dial Transplant 2006;21:1104–1108.
41. Marckmann P, Skov L, Rossen K, et al. Nephrogenic systemic fi-brosis: suspected causative role of gadodiamide used for con-trast-enhanced magnetic resonance imaging. J Am Soc Nephrol2006;17:2359–2362.
42. Taylor A, Nally J, Aurell M, et al. Consensus report on ACE inhib-itor renography for detecting renovascular hypertension. Radio-nuclides in Nephrorology Group. Consensus Group on ACEIRenography. J Nucl Med 1996;37:1876–1882.
43. Grenier N, Trillaud H, Combe C, et al. Diagnosis of renovascularhypertension: feasibility of captopril-sensitized dynamic MRimaging and comparison with captopril scintigraphy. AJR Am JRoentgenol 1996;166:835–843.
44. Zhang JL, Rusinek H, Bokacheva L, et al. Angiotensin-convertingenzyme inhibitor-enhanced MR renography: repeated measuresof GFR and RPF in hypertensive patients. Am J Physiol 2009;296:F884–891.
45. Lee VS, Rusinek H, Johnson G, Rofsky NM, Krinsky GA, WeinrebJC. MR renography with low-dose gadopentetate dimeglumine:feasibility. Radiology 2001;221:371–379.
46. Grattan-Smith JD, Perez-Bayfield MR, Jones RA, et al. MR imag-ing of kidneys: functional evaluation using F-15 perfusion imag-ing. Pediatr Radiol 2003;33:293–304.
47. McDaniel BB, Jones RA, Scherz H, Kirsch AJ, Little SB, Grattan-Smith JD. Dynamic contrast-enhanced MR urography in the eval-uation of pediatric hydronephrosis. Part 2. Anatomic and func-tional assessment of uteropelvic junction obstruction. AJR Am JRoentgenol 2005;185:1608–1614.
48. Rohrschneider WK, Haufe S, Wiesel M, et al. Functional and mor-phologic evaluation of congenital urinary tract dilatation by usingcombined static-dynamic MR urography: findings in kidneys witha single collecting system. Radiology 2002;224:683–694.
49. Grattan-Smith JD, Little SB, Jones RA. MR urography evaluationof obstructive uropathy. Pediatr Radiol 2008;38(Suppl 1):S49–69.
50. Jones RA, Perez-Brayfield MR, Kirsch AJ, Grattan-Smith JD. Re-nal transit time with MR urography in children. Radiology 2004;233:41–50.
51. Szolar DH, Preidler K, Ebner F, et al. Functional magnetic reso-nance imaging of human renal allografts during the post-trans-plant period: preliminary observations. Magn Reson Imaging1997;15:727–735.
52. Agildere AM, Tarhan NC, Bozdagi G, Demirag A, Niron EA, Hab-eral M. Correlation of quantitative dynamic magnetic resonanceimaging findings with pathology results in renal transplants: apreliminary report. Transplant Proc 1999;31:3312–3316.
53. Wentland AL, Sadowski EA, Djamali A, Grist TM, Becker BN,Fain SB. Quantitative MR measures of intrarenal perfusion in theassessment of transplanted kidneys: initial experience. AcadRadiol 2009;16:1077–1085.
54. Yamamoto A, Zhang JL, Rusinek H, et al. Quantitative evaluationof acute renal transplant dysfunction with low-dose 3D MRrenography. In: Proc 18th Annual Meeting ISMRM, Stockholm;2010 (abstract 4691).
55. Kim S, Naik M, Sigmund E, Taouli B. Diffusion-weighted MRimaging of the kidneys and the urinary tract. Magn Reson Imag-ing Clin N Am 2008;16:585–596, vii–viii.
56. Namimoto T, Yamashita Y, Mitsuzaki K, Nakayama Y, Tang Y,Takahashi M. Measurement of the apparent diffusion coefficientin diffuse renal disease by diffusion-weighted echo-planar MRimaging. J Magn Reson Imaging 1999;9:832–837.
57. Thoeny HC, De Keyzer F, Oyen RH, Peeters RR. Diffusion-weighted MR imaging of kidneys in healthy volunteers andpatients with parenchymal diseases: initial experience. Radiology2005;235:911–917.
58. Toyoshima S, Noguchi K, Seto H, Shimizu M, Watanabe N. Func-tional evaluation of hydronephrosis by diffusion-weighted MRimaging. Relationship between apparent diffusion coefficient andsplit glomerular filtration rate. Acta Radiol 2000;41:642–646.
59. Carbone SF, Gaggioli E, Ricci V, Mazzei F, Mazzei MA, VolterraniL. Diffusion-weighted magnetic resonance imaging in the evalua-tion of renal function: a preliminary study. La Radiologia medica2007;112:1201–1210.
60. Togao O, Doi S, Kuro-o M, Masaki T, Yorioka N, Takahashi M.Assessment of renal fibrosis with diffusion-weighted MR imaging:study with murine model of unilateral ureteral obstruction. Radi-ology 2010;255:772–780.
61. Thoeny HC, Grenier N. Science to practice: can diffusion-weighted MR imaging findings be used as biomarkers to monitorthe progression of renal fibrosis? Radiology 2010;255:667–668.
62. Le Bihan D, Breton E, Lallemand D, Aubin ML, Vignaud J, Laval-Jeantet M. Separation of diffusion and perfusion in intravoxelincoherent motion MR imaging. Radiology 1988;168:497–505.
63. Le Bihan D, Turner R. The capillary network: a link betweenIVIM and classical perfusion. Magn Reson Med 1992;27:171–178.
64. Zhang JL, Sigmund EE, Chandarana H, et al. Variability of renalapparent diffusion coefficients: limitations of the monoexponentialmodel for diffusion quantification. Radiology 2010;254:783–792.
65. Wittsack HJ, Lanzman RS, Mathys C, Janssen H, Modder U,Blondin D. Statistical evaluation of diffusion-weighted imaging ofthe human kidney. Magn Reson Med 2010;64:616–622.
66. Zhang JL, Sigmund EE, Rusinek H, et al. Optimization of b-valuesampling for diffusion-weighted imaging of the kidney. MagnReson Med 2012;67:89–97.
67. Ogawa S, Lee TM, Kay AR, Tank DW. Brain magnetic resonanceimaging with contrast dependent on blood oxygenation. Proc NatlAcad Sci U S A 1990;87:9868–9872.
68. Tumkur S, Vu A, Li L, Prasad PV. Evaluation of intrarenal oxy-genation at 3.0 T using 3-dimensional multiple gradient-recalledecho sequence. Invest Radiol 2006;41:181–184.
69. Prasad PV, Edelman RR, Epstein FH. Noninvasive evaluation ofintrarenal oxygenation with BOLD MRI. Circulation 1996;94:3271–3275.
70. Tumkur SM, Vu AT, Li LP, Pierchala L, Prasad PV. Evaluation ofintra-renal oxygenation during water diuresis: a time-resolvedstudy using BOLD MRI. Kidney Int 2006;70:139–143.
71. Li LP, Storey P, Pierchala L, Li W, Polzin J, Prasad P. Evaluationof the reproducibility of intrarenal R2* and DeltaR2* measure-ments following administration of furosemide and during water-load. J Magn Reson Imaging 2004;19:610–616.
292 Zhang et al.

72. Simon-Zoula SC, Hofmann L, Giger A, et al. Non-invasive moni-toring of renal oxygenation using BOLD-MRI: a reproducibilitystudy. NMR Biomed 2006;19:84–89.
73. Thoeny HC, Zumstein D, Simon-Zoula S, et al. Functional evalua-tion of transplanted kidneys with diffusion-weighted and BOLDMR imaging: initial experience. Radiology 2006;241:812–821.
74. Juillard L, Lerman LO, Kruger DG, et al. Blood oxygen level-de-pendent measurement of acute intra-renal ischemia. Kidney Int2004;65:944–950.
75. Textor SC, Glockner JF, Lerman LO, et al. The use of magneticresonance to evaluate tissue oxygenation in renal artery stenosis.J Am Soc Nephrol 2008;19:780–788.
76. Sadowski EA, Fain SB, Alford SK, et al. Assessment of acute re-nal transplant rejection with blood oxygen level-dependent MRimaging: initial experience. Radiology 2005;236:911–919.
77. Djamali A, Sadowski EA, Samaniego-Picota M, et al. Noninvasiveassessment of early kidney allograft dysfunction by blood oxygenlevel-dependent magnetic resonance imaging. Transplantation2006;82:621–628.
78. Han F, Xiao W, Xu Y, et al. The significance of BOLD MRI in dif-ferentiation between renal transplant rejection and acute tubularnecrosis. Nephrol Dial Transplant 2008;23:2666–2672.
79. Hasslacher C, B€ohm S. Diabetes and the kidney: diabetic ne-phropathy: prevention, diagnosis, treatment. Chichester, WestSussex, UK: John Wiley & Sons; 2004.
80. Epstein FH, Veves A, Prasad PV. Effect of diabetes on renal med-ullary oxygenation during water diuresis. Diabetes Care 2002;25:575–578.
81. dos Santos EA, Li LP, Ji L, Prasad PV. Early changes with diabe-tes in renal medullary hemodynamics as evaluated by fiberopticprobes and BOLD magnetic resonance imaging. Invest Radiol2007;42:157–162.
82. Ries M, Basseau F, Tyndal B, et al. Renal diffusion and BOLDMRI in experimental diabetic nephropathy. Blood oxygen level-de-pendent. J Magn Reson Imaging 2003;17:104–113.
83. Pedersen M, Dissing TH, Morkenborg J, et al. Validation of quan-titative BOLD MRI measurements in kidney: application to unilat-eral ureteral obstruction. Kidney Int 2005;67:2305–2312.
84. Thoeny HC, Kessler TM, Simon-Zoula S, et al. Renal oxygenationchanges during acute unilateral ureteral obstruction: assessmentwith blood oxygen level-dependent MR imaging—initial experi-ence. Radiology 2008;247:754–761.
85. Xiao WB, Wang QD, Xu JJ, Han F, Zhang MM. [Evaluation of kid-ney oxygen bioavailability in acute renal failure by blood oxygen
level dependent magnetic resonance imaging.] Zhejiang Da XueXue Bao Yi Xue Ban 2010;39:157–162.
86. Detre JA, Zhang W, Roberts DA, et al. Tissue specific perfusionimaging using arterial spin labeling. NMR Biomed 1994;7:75–82.
87. Buxton RB, Frank LR, Wong EC, Siewert B, Warach S, EdelmanRR. A general kinetic model for quantitative perfusion imagingwith arterial spin labeling. Magn Reson Med 1998;40:383–396.
88. Song R, Loeffler RB, Hillenbrand CM. Improved renal perfusionmeasurement with a dual navigator-gated Q2TIPS fair technique.Magn Reson Med 2010;64:1352–1359.
89. Kiefer C, Schroth G, Gralla J, Diehm N, Baumgartner I, Hus-mann M. A feasibility study on model-based evaluation of kidneyperfusion measured by means of FAIR prepared true-FISP arterialspin labeling (ASL) on a 3-T MR scanner. Acad Radiol 2009;16:79–87.
90. Artz NS, Sadowski EA, Wentland AL, et al. Arterial spin labelingMRI for assessment of perfusion in native and transplanted kid-neys. Magn Reson Imaging 2011;29:74–82.
91. Notohamiprodjo M, Dietrich O, Horger W, et al. Diffusion tensorimaging (DTI) of the kidney at 3 tesla-feasibility, protocol evalua-tion and comparison to 1.5 Tesla. Invest Radiol 2010;45:245–254.
92. Cheung JS, Fan SJ, Chow AM, Zhang J, Man K, Wu EX. Diffu-sion tensor imaging of renal ischemia reperfusion injury in an ex-perimental model. NMR Biomed 2010;23:496–502.
93. Chandarana H, Hecht EM, Taouli B. Diffusion tensor imaging ofin vivo human kidney at 3 T: robust anisotropy measurement inthe medulla. In: Proc 16th Annual Meeting ISMRM, Toronto;2008 (abstract 494).
94. Maril N, Rosen Y, Reynolds GH, Ivanishev A, Ngo L, LenkinskiRE. Sodium MRI of the human kidney at 3 Tesla. Magn ResonMed 2006;56:1229–1234.
95. Rosen Y, Lenkinski RE. Sodium MRI of a human transplantedkidney. Acad Radiol 2009;16:886–889.
96. Atthe BK, Babsky AM, Hopewell PN, Phillips CL, Molitoris BA,Bansal N. Early monitoring of acute tubular necrosis in the ratkidney by 23Na-MRI. Am J Physiol 2009;297:F1288–1298.
97. Warner L, Yin M, Glaser KJ, et al. Noninvasive in vivo assessmentof renal tissue elasticity during graded renal ischemia using MRelastography. Invest Radiol 2011;46:509–514.
98. Shah NS, Kruse SA, Lager DJ, et al. Evaluation of renal paren-chymal disease in a rat model with magnetic resonance elastogra-phy. Magn Reson Med 2004;52:56–64.
Renal Functional MRI 293