Functional genomics of acclimation and adaptation in...
12
RESEARCH ARTICLE Open Access Functional genomics of acclimation and adaptation in response to thermal stress in Daphnia Lev Y Yampolsky 1* , Erliang Zeng 2,3 , Jacqueline Lopez 4 , Patricia J Williams 1,5 , Kenneth B Dick 1 , John K Colbourne 6 and Michael E Pfrender 4 Abstract Background: Gene expression regulation is one of the fundamental mechanisms of phenotypic plasticity and is expected to respond to selection in conditions favoring phenotypic response. The observation that many organisms increase their stress tolerance after acclimation to moderate levels of stress is an example of plasticity which has been long hypothesized to be based on adaptive changes in gene expression. We report genome-wide patterns of gene expression in two heat-tolerant and two heat-sensitive parthenogenetic clones of the zooplankton crustacean Daphnia pulex exposed for three generations to either optimal (18°C) or substressful (28°C) temperature. Results: A large number of genes responded to temperature and many demonstrated a significant genotype-by- environment (GxE) interaction. Among genes with a significant GxE there were approximately equally frequent instances of canalization, i.e. stronger plasticity in heat-sensitive than in heat-tolerant clones, and of enhancement of plasticity along the evolutionary vector toward heat tolerance. The strongest response observed is the across-the-board down-regulation of a variety of genes occurring in heat-tolerant, but not in heat-sensitive clones. This response is particularly obvious among genes involved in core metabolic pathways and those responsible for transcription, translation and DNA repair. Conclusions: The observed down-regulation of metabolism, consistent with previous findings in yeast and Drosophila, may reflect a general compensatory stress response. The associated down-regulation of DNA repair pathways potentially creates a trade-off between short-term benefits of survival at high temperature and long-term costs of accelerated mutation accumulation. Keywords: Gene expression, Thermal tolerance, Temperature, Plasticity, GxE, Metabolic compensation, Canalization Background Organisms respond to environmental changes by adjusting their physiology, biochemistry, behavior, and sometimes, morphology. The ability of a single genotype to generate a variety of phenotypes in response to environmental changes is termed phenotypic plasticity and the resulting increase of tolerance to stressful levels of environmental parameters is known as acclimation. One of the central goals in the study of adaptive phenotypic plasticity has been the analysis of reaction norms in ancestral and evolved populations [1-3]. In the postgenomic era such analysis is a necessary condition for answering one of the major emerging questions in evolutionary and ecological genomics: are the genes involved in plastic responses the same as those underlying adaptive differentiation [4]? Using the emerging model organism Daphnia, we ad- dress this question by analyzing the differential expression patterns of heat-tolerant and heat-sensitive genotypes that have been acclimated to either optimal or stressfully high temperature. One fundamental molecular mechanism of phenotypic plasticity acclimation is up- or down-regulation of the ex- pression of individual genes to meet the organism’ s needs prescribed by the changing environment [5,6]. Phenotypic * Correspondence: [email protected] 1 Department of Biological Sciences, East Tennessee State University, Johnson City, TN 37641, USA Full list of author information is available at the end of the article © 2014 Yampolsky et al.; licensee BioMed Central Ltd. This is an Open Access article distributed under the terms of the Creative Commons Attribution License (http://creativecommons.org/licenses/by/4.0), which permits unrestricted use, distribution, and reproduction in any medium, provided the original work is properly credited. The Creative Commons Public Domain Dedication waiver (http://creativecommons.org/publicdomain/zero/1.0/) applies to the data made available in this article, unless otherwise stated. Yampolsky et al. BMC Genomics 2014, 15:859 http://www.biomedcentral.com/1471-2164/15/859
Transcript of Functional genomics of acclimation and adaptation in...
Yampolsky et al. BMC Genomics 2014, 15:859http://www.biomedcentral.com/1471-2164/15/859
RESEARCH ARTICLE Open Access
Functional genomics of acclimation andadaptation in response to thermal stress inDaphniaLev Y Yampolsky1*, Erliang Zeng2,3, Jacqueline Lopez4, Patricia J Williams1,5, Kenneth B Dick1, John K Colbourne6
and Michael E Pfrender4
Abstract
Background: Gene expression regulation is one of the fundamental mechanisms of phenotypic plasticity andis expected to respond to selection in conditions favoring phenotypic response. The observation that manyorganisms increase their stress tolerance after acclimation to moderate levels of stress is an example of plasticitywhich has been long hypothesized to be based on adaptive changes in gene expression. We report genome-widepatterns of gene expression in two heat-tolerant and two heat-sensitive parthenogenetic clones of the zooplanktoncrustacean Daphnia pulex exposed for three generations to either optimal (18°C) or substressful (28°C) temperature.
Results: A large number of genes responded to temperature and many demonstrated a significant genotype-by-environment (GxE) interaction. Among genes with a significant GxE there were approximately equally frequentinstances of canalization, i.e. stronger plasticity in heat-sensitive than in heat-tolerant clones, and of enhancementof plasticity along the evolutionary vector toward heat tolerance. The strongest response observed is theacross-the-board down-regulation of a variety of genes occurring in heat-tolerant, but not in heat-sensitive clones.This response is particularly obvious among genes involved in core metabolic pathways and those responsible fortranscription, translation and DNA repair.
Conclusions: The observed down-regulation of metabolism, consistent with previous findings in yeast andDrosophila, may reflect a general compensatory stress response. The associated down-regulation of DNA repairpathways potentially creates a trade-off between short-term benefits of survival at high temperature andlong-term costs of accelerated mutation accumulation.
Keywords: Gene expression, Thermal tolerance, Temperature, Plasticity, GxE, Metabolic compensation, Canalization
BackgroundOrganisms respond to environmental changes by adjustingtheir physiology, biochemistry, behavior, and sometimes,morphology. The ability of a single genotype to generatea variety of phenotypes in response to environmentalchanges is termed phenotypic plasticity and the resultingincrease of tolerance to stressful levels of environmentalparameters is known as acclimation. One of the centralgoals in the study of adaptive phenotypic plasticity hasbeen the analysis of reaction norms in ancestral and
* Correspondence: [email protected] of Biological Sciences, East Tennessee State University, JohnsonCity, TN 37641, USAFull list of author information is available at the end of the article
© 2014 Yampolsky et al.; licensee BioMed CenCreative Commons Attribution License (http:/distribution, and reproduction in any mediumDomain Dedication waiver (http://creativecomarticle, unless otherwise stated.
evolved populations [1-3]. In the postgenomic era suchanalysis is a necessary condition for answering one of themajor emerging questions in evolutionary and ecologicalgenomics: are the genes involved in plastic responsesthe same as those underlying adaptive differentiation[4]? Using the emerging model organism Daphnia, we ad-dress this question by analyzing the differential expressionpatterns of heat-tolerant and heat-sensitive genotypes thathave been acclimated to either optimal or stressfully hightemperature.One fundamental molecular mechanism of phenotypic
plasticity acclimation is up- or down-regulation of the ex-pression of individual genes to meet the organism’s needsprescribed by the changing environment [5,6]. Phenotypic
tral Ltd. This is an Open Access article distributed under the terms of the/creativecommons.org/licenses/by/4.0), which permits unrestricted use,, provided the original work is properly credited. The Creative Commons Publicmons.org/publicdomain/zero/1.0/) applies to the data made available in this
Yampolsky et al. BMC Genomics 2014, 15:859 Page 2 of 12http://www.biomedcentral.com/1471-2164/15/859
plasticity is easy to observe but difficult to interpret.In particular, it can be difficult to untangle plasticityand adaptation, as adaptation may be achieved by theevolution of plasticity rather than by the evolution of aconstitutive tolerance mechanism.A further complication is that it may be difficult to
demonstrate that phenotypic plasticity at the level ofgene regulation is causative of higher fitness in the indu-cing environment. Correlated patterns of expression dueto regulatory or developmental constraints [1,7] maycause cascades of genes to respond in a concordant man-ner, seemingly to match the environmental demand. Forexample, among the large number of genes responding toearly exposure to ethanol in Drosophila embryos [8] thereare genes that are likely downstream responses to ethanolpresence and thus non-adaptive in the sense of increasedethanol tolerance. Similarly, if genes respond to the sametranscriptional regulators with the causative, adaptivelyplastic genes, the correlated response will make it difficultto single out the causative genes. In cases where a smallnumber of candidate genes are implicated in adaptiveplastic responses it is possible to employ direct gene-specific manipulative fitness-measuring approaches. How-ever, when a significant portion of the genome respondsto a specific environmental cue testing the fitness effectof each instance of differential expression becomes im-practical. Validating the relationship between regulatoryplasticity and adaptive value is particularly difficult innon-model systems lacking well-established reverse geneticapproaches. In addition, the lack of functional annotationsfor many genes in non-model species complicates estab-lishing the relationship between genes and phenotypes.One plausible approach is the measurement of gene
expression rates in a common-garden experiment in whichstress-tolerant and stress-sensitive genotypes are exposedto the same level of stress. While this approach is stillsubject to the difficulties caused by correlated responses itallows the identification of groups of co-regulated geneswhose regulation is likely to be adaptive. Expression re-sponses to the environment observed in stress-tolerant,but not stress-sensitive genotypes, are likely to representan evolved mechanism rather than be a product of aregulatory constraint. Likewise, genes that are plastic insensitive genotypes, but constitutive in tolerant ones,are likely to demonstrate adaptive elimination of misa-daptive environmental response, i.e., canalization. Surpris-ingly, such common-garden experiments are scarce bothin model [8-10] and non-model organisms [11,12]. To thebest of our knowledge, here we report the first study oftranscriptome response to temperature in Daphnia, aclassic model for studies of phenotypic plasticity, and thefirst such study in the context of heat tolerance.Facing stressful environmental conditions an organism
can respond either by minimizing damage, by reducing
demand/increasing efficiency of the consumption of re-sources related to stress-tolerance, or by escaping thestressful environments. Investigations of the plasticity ofheat tolerance in aquatic ectotherms have provided exam-ples of all these response mechanisms. For example, ther-mal damage can be minimized by the chaperoning activityof heat shock proteins [13] or by activation of P450 cyto-chromes, recently implicated in a variety of heat-toleranceresponses, possibly through their involvement in oxidativestress metabolic pathways [14,15]. Organisms in stressfullow or high temperature environments can also imple-ment membrane restructuring to achieve sufficient mem-brane fluidity at low temperatures without sacrificingstructural stability, or suffering too much ion leakage athigh temperatures [16,17]. Transcriptional responses ofsome of these specific heat response genes will be reportedelsewhere (in preparation); here we will focus on genome-wide patterns of response.In aquatic organisms high-temperature tolerance is
often constrained by the mismatch between metabolicoxygen demand and oxygen availability. Indeed, meta-bolic demands typically increase exponentially withtemperature, while oxygen availability is reduced bythe lower solubility of oxygen in water at higher tempera-tures [18-21]. Numerous aquatic ectotherms are known torespond to elevated temperature by over expressing hae-moglobins, which allows them to more efficiently trans-port and store oxygen [21-24]. In Daphnia haemoglobinsare particularly interesting since they likely play a role inprotecting tissues from oxidative damage [21] and areknown to be co-expressed with the male-inducing hormo-nal pathway. The production of males and a transitionto sexual reproduction is a possible mechanism to es-cape unfavorably high temperatures through shiftingthe reproductive effort to sexually produced diapausingeggs [25].Another well-documented response of a variety of
aquatic organisms to the dilemma posed by metabolicoxygen demand is temperature-induced metabolic com-pensation [26-28]. This compensatory response is charac-terized by the across-the-board reduction of metabolicactivity at temperatures close to the upper tolerance limit.The protein-level mechanisms of this plastic responsehave attracted a great deal of attention [29], while com-parable data on transcriptional response to temperatureindicative of the metabolic compensation response arescarce [9,30].In this paper we ask the following questions:1) What is the generalized transcriptome response in
Daphnia to long-term exposure to near-lethal temperature?2) Are specific metabolic pathways up- or down-regulatedduring such acclimation? If so, can these pathways beidentified as transcriptional manifestations of known tem-perature acclimation mechanisms such as metabolic
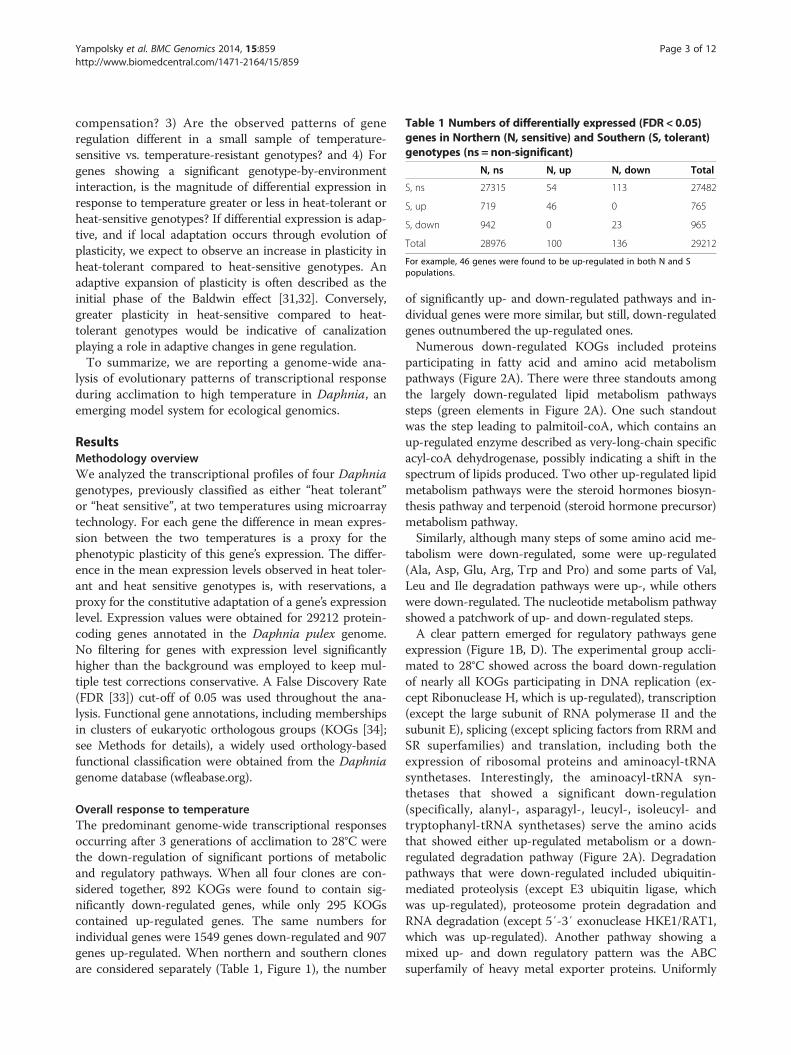
Table 1 Numbers of differentially expressed (FDR < 0.05)genes in Northern (N, sensitive) and Southern (S, tolerant)genotypes (ns = non-significant)
N, ns N, up N, down Total
S, ns 27315 54 113 27482
S, up 719 46 0 765
S, down 942 0 23 965
Total 28976 100 136 29212
For example, 46 genes were found to be up-regulated in both N and Spopulations.
Yampolsky et al. BMC Genomics 2014, 15:859 Page 3 of 12http://www.biomedcentral.com/1471-2164/15/859
compensation? 3) Are the observed patterns of generegulation different in a small sample of temperature-sensitive vs. temperature-resistant genotypes? and 4) Forgenes showing a significant genotype-by-environmentinteraction, is the magnitude of differential expression inresponse to temperature greater or less in heat-tolerant orheat-sensitive genotypes? If differential expression is adap-tive, and if local adaptation occurs through evolution ofplasticity, we expect to observe an increase in plasticity inheat-tolerant compared to heat-sensitive genotypes. Anadaptive expansion of plasticity is often described as theinitial phase of the Baldwin effect [31,32]. Conversely,greater plasticity in heat-sensitive compared to heat-tolerant genotypes would be indicative of canalizationplaying a role in adaptive changes in gene regulation.To summarize, we are reporting a genome-wide ana-
lysis of evolutionary patterns of transcriptional responseduring acclimation to high temperature in Daphnia, anemerging model system for ecological genomics.
ResultsMethodology overviewWe analyzed the transcriptional profiles of four Daphniagenotypes, previously classified as either “heat tolerant”or “heat sensitive”, at two temperatures using microarraytechnology. For each gene the difference in mean expres-sion between the two temperatures is a proxy for thephenotypic plasticity of this gene’s expression. The differ-ence in the mean expression levels observed in heat toler-ant and heat sensitive genotypes is, with reservations, aproxy for the constitutive adaptation of a gene’s expressionlevel. Expression values were obtained for 29212 protein-coding genes annotated in the Daphnia pulex genome.No filtering for genes with expression level significantlyhigher than the background was employed to keep mul-tiple test corrections conservative. A False Discovery Rate(FDR [33]) cut-off of 0.05 was used throughout the ana-lysis. Functional gene annotations, including membershipsin clusters of eukaryotic orthologous groups (KOGs [34];see Methods for details), a widely used orthology-basedfunctional classification were obtained from the Daphniagenome database (wfleabase.org).
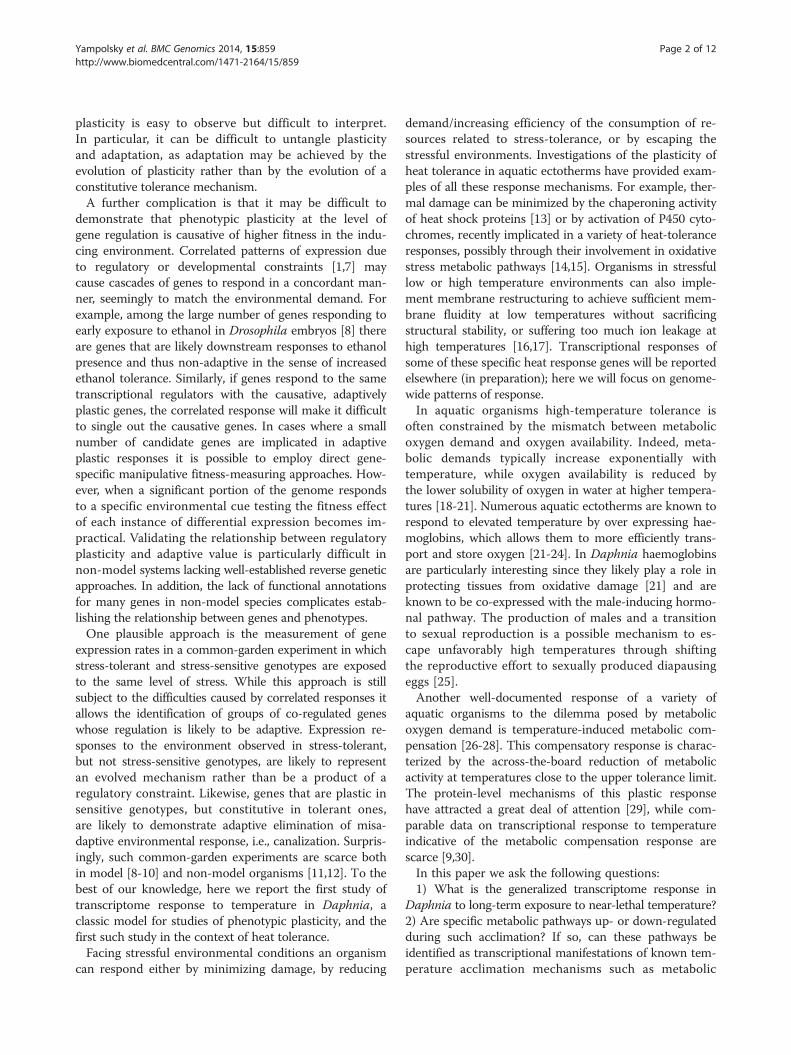
Overall response to temperatureThe predominant genome-wide transcriptional responsesoccurring after 3 generations of acclimation to 28°C werethe down-regulation of significant portions of metabolicand regulatory pathways. When all four clones are con-sidered together, 892 KOGs were found to contain sig-nificantly down-regulated genes, while only 295 KOGscontained up-regulated genes. The same numbers forindividual genes were 1549 genes down-regulated and 907genes up-regulated. When northern and southern clonesare considered separately (Table 1, Figure 1), the number
of significantly up- and down-regulated pathways and in-dividual genes were more similar, but still, down-regulatedgenes outnumbered the up-regulated ones.Numerous down-regulated KOGs included proteins
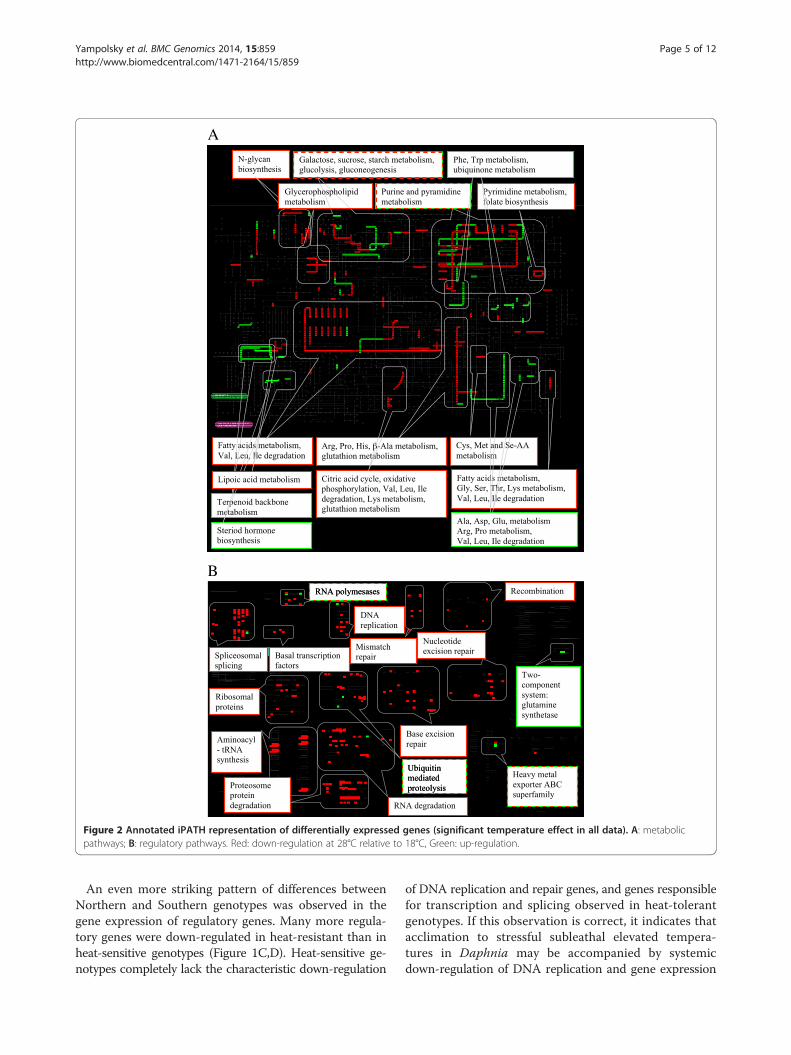
participating in fatty acid and amino acid metabolismpathways (Figure 2A). There were three standouts amongthe largely down-regulated lipid metabolism pathwayssteps (green elements in Figure 2A). One such standoutwas the step leading to palmitoil-coA, which contains anup-regulated enzyme described as very-long-chain specificacyl-coA dehydrogenase, possibly indicating a shift in thespectrum of lipids produced. Two other up-regulated lipidmetabolism pathways were the steroid hormones biosyn-thesis pathway and terpenoid (steroid hormone precursor)metabolism pathway.Similarly, although many steps of some amino acid me-
tabolism were down-regulated, some were up-regulated(Ala, Asp, Glu, Arg, Trp and Pro) and some parts of Val,Leu and Ile degradation pathways were up-, while otherswere down-regulated. The nucleotide metabolism pathwayshowed a patchwork of up- and down-regulated steps.A clear pattern emerged for regulatory pathways gene
expression (Figure 1B, D). The experimental group accli-mated to 28°C showed across the board down-regulationof nearly all KOGs participating in DNA replication (ex-cept Ribonuclease H, which is up-regulated), transcription(except the large subunit of RNA polymerase II and thesubunit E), splicing (except splicing factors from RRM andSR superfamilies) and translation, including both theexpression of ribosomal proteins and aminoacyl-tRNAsynthetases. Interestingly, the aminoacyl-tRNA syn-thetases that showed a significant down-regulation(specifically, alanyl-, asparagyl-, leucyl-, isoleucyl- andtryptophanyl-tRNA synthetases) serve the amino acidsthat showed either up-regulated metabolism or a down-regulated degradation pathway (Figure 2A). Degradationpathways that were down-regulated included ubiquitin-mediated proteolysis (except E3 ubiquitin ligase, whichwas up-regulated), proteosome protein degradation andRNA degradation (except 5′-3′ exonuclease HKE1/RAT1,which was up-regulated). Another pathway showing amixed up- and down regulatory pattern was the ABCsuperfamily of heavy metal exporter proteins. Uniformly
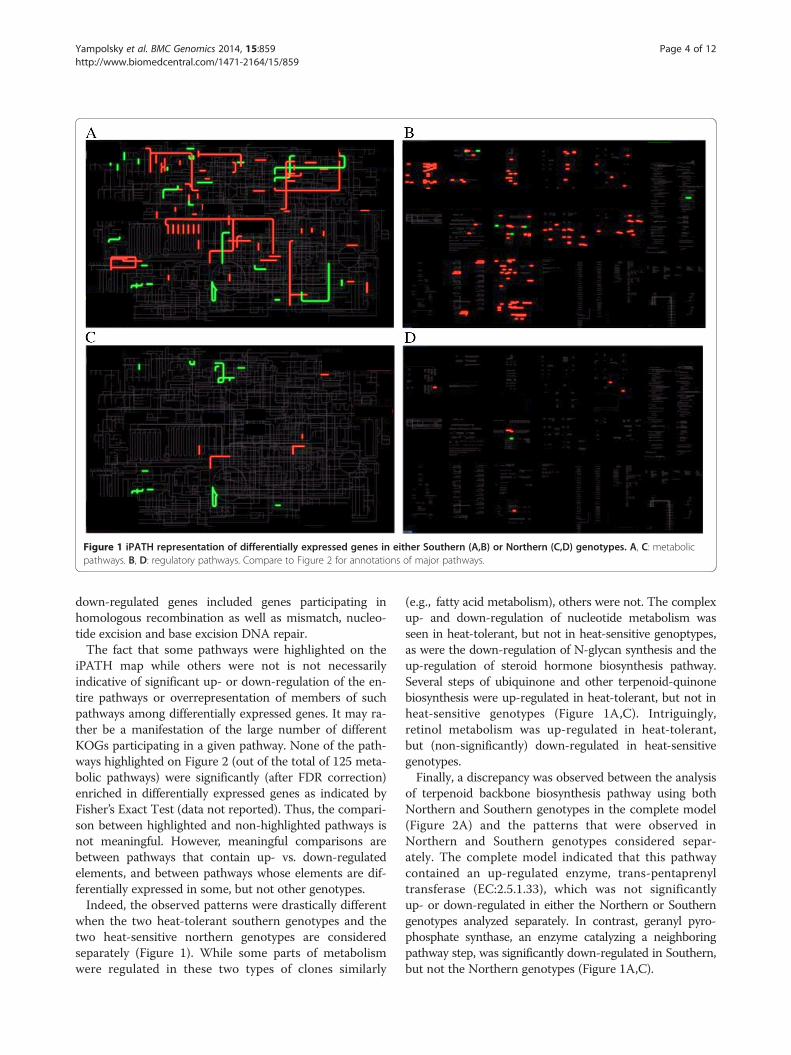
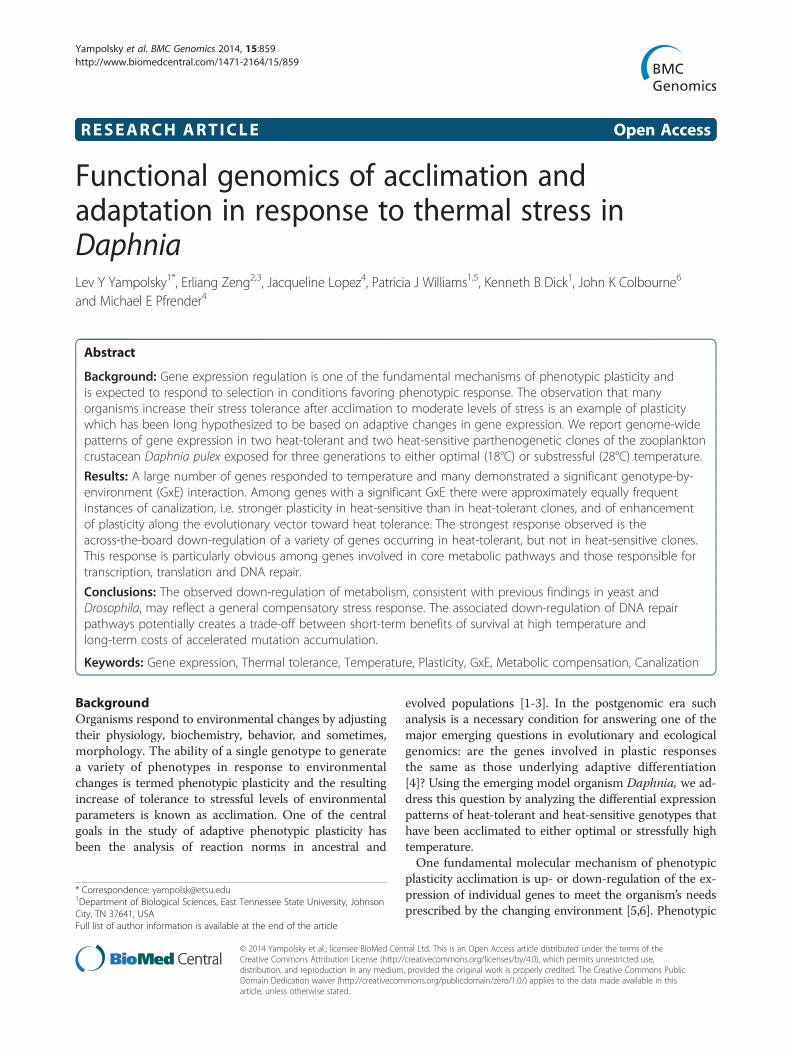
Figure 1 iPATH representation of differentially expressed genes in either Southern (A,B) or Northern (C,D) genotypes. A, C: metabolicpathways. B, D: regulatory pathways. Compare to Figure 2 for annotations of major pathways.
Yampolsky et al. BMC Genomics 2014, 15:859 Page 4 of 12http://www.biomedcentral.com/1471-2164/15/859
down-regulated genes included genes participating inhomologous recombination as well as mismatch, nucleo-tide excision and base excision DNA repair.The fact that some pathways were highlighted on the
iPATH map while others were not is not necessarilyindicative of significant up- or down-regulation of the en-tire pathways or overrepresentation of members of suchpathways among differentially expressed genes. It may ra-ther be a manifestation of the large number of differentKOGs participating in a given pathway. None of the path-ways highlighted on Figure 2 (out of the total of 125 meta-bolic pathways) were significantly (after FDR correction)enriched in differentially expressed genes as indicated byFisher’s Exact Test (data not reported). Thus, the compari-son between highlighted and non-highlighted pathways isnot meaningful. However, meaningful comparisons arebetween pathways that contain up- vs. down-regulatedelements, and between pathways whose elements are dif-ferentially expressed in some, but not other genotypes.Indeed, the observed patterns were drastically different
when the two heat-tolerant southern genotypes and thetwo heat-sensitive northern genotypes are consideredseparately (Figure 1). While some parts of metabolismwere regulated in these two types of clones similarly
(e.g., fatty acid metabolism), others were not. The complexup- and down-regulation of nucleotide metabolism wasseen in heat-tolerant, but not in heat-sensitive genoptypes,as were the down-regulation of N-glycan synthesis and theup-regulation of steroid hormone biosynthesis pathway.Several steps of ubiquinone and other terpenoid-quinonebiosynthesis were up-regulated in heat-tolerant, but not inheat-sensitive genotypes (Figure 1A,C). Intriguingly,retinol metabolism was up-regulated in heat-tolerant,but (non-significantly) down-regulated in heat-sensitivegenotypes.Finally, a discrepancy was observed between the analysis
of terpenoid backbone biosynthesis pathway using bothNorthern and Southern genotypes in the complete model(Figure 2A) and the patterns that were observed inNorthern and Southern genotypes considered separ-ately. The complete model indicated that this pathwaycontained an up-regulated enzyme, trans-pentaprenyltransferase (EC:2.5.1.33), which was not significantlyup- or down-regulated in either the Northern or Southerngenotypes analyzed separately. In contrast, geranyl pyro-phosphate synthase, an enzyme catalyzing a neighboringpathway step, was significantly down-regulated in Southern,but not the Northern genotypes (Figure 1A,C).
A
B
Figure 2 Annotated iPATH representation of differentially expressed genes (significant temperature effect in all data). A: metabolicpathways; B: regulatory pathways. Red: down-regulation at 28°C relative to 18°C, Green: up-regulation.
Yampolsky et al. BMC Genomics 2014, 15:859 Page 5 of 12http://www.biomedcentral.com/1471-2164/15/859
An even more striking pattern of differences betweenNorthern and Southern genotypes was observed in thegene expression of regulatory genes. Many more regula-tory genes were down-regulated in heat-resistant than inheat-sensitive genotypes (Figure 1C,D). Heat-sensitive ge-notypes completely lack the characteristic down-regulation
of DNA replication and repair genes, and genes responsiblefor transcription and splicing observed in heat-tolerantgenotypes. If this observation is correct, it indicates thatacclimation to stressful subleathal elevated tempera-tures in Daphnia may be accompanied by systemicdown-regulation of DNA replication and gene expression

Yampolsky et al. BMC Genomics 2014, 15:859 Page 6 of 12http://www.biomedcentral.com/1471-2164/15/859
machineries and that this pattern is associated with the in-creased tolerance to thermal stress found in the Southerngenotypes.
Canalization vs. enhancement of plasticity in heatadaptationThe presence of genotype-by-environment interaction inthe comparison of geographically distinct genotypes mayindicate the evolution of plasticity, including plasticity ofgene expression. Assuming that heat-sensitive Northerngenotypes represent the ancestral state and the heat-tolerant Southern genotypes represent the derived state,one may test whether this local differentiation occurredthrough genetic canalization (i.e., a reduction of plasticitywhere the inducible phenotype becomes constitutive) oran expansion of plasticity (i.e., Baldwin effect). Althoughthe results in Figure 1 and Table 1 might indicate a wide-spread Baldwin effect (tolerant genotypes show differentialexpression, while sensitive clones do not), in reality thereare nearly as many cases among genes with a significant(FDR q < 0.05) T*geo effect in which the Southern (heattolerant) genotypes show a greater plasticity of expressionthan the Northern (sensitive) ones (Figure 3).
Genome-wide principal component analysisFigure 4 represents the principal component analysis ofRNA samples in the space of transcript abundance valuesof the 29,212 genes represented on the array. There is a
Figure 3 Genes with significant T*geo interaction (testedagainst the pooled random MS; FDR q < 0.05), for which theSouthern (heat-tolerant) genotypes show greater absolutedifference in expression at two temperatures (green symbols,Baldwin effect) or smaller absolute difference in expression atthe two temperatures (red symbols, canalization) than theNorthern (heat sensitive) genotypes.
clear separation between the Northern and Southern sam-ples (open and solid symbols) and well as between thesamples obtained from Daphnia acclimated to 18°C vs.28°C (blue and red symbols; Figure 4A). A more detailedrepresentation on pair-wise planes of the first three princi-pal components (Figure 4B-D) shows a clear separation ofbiological replicates corresponding to each of the fourclones. One exception is the Northern genotype C withthree replicates (2 in 28°C and one in 18°C) located farfrom the other three replicates of this genotype and withinthe cloud of the Southern genotypes.
DiscussionWe analyzed the genome-wide transcription profiles oftwo Northern, heat-sensitive and two Southern, heat-tolerant genotypes of D. pulex that were acclimated toeither 18°C or 28°C. We observed a widespread down-regulation of expression in a variety of metabolic andregulatory pathways. This pattern of down-regulationwas more pronounced in heat-tolerant genotypes. Becausestressfully-high temperatures in aquatic ectotherms ex-acerbate the discordance between metabolic oxygen de-mand and oxygen solubility [18-20], we hypothesize thatthe observed down-regulation may be the molecularmechanism of metabolic compensatory reaction [28] tonearly lethal temperature. This finding is consistentwith the growing body of evidence from yeast [30] andDrosophila [9] indicting that high temperature (as wellas other stressors) can elicit genome-wide down-regulatoryresponses. The fact that this reaction is observed in heat-tolerant, but not in heat-sensitive genotypes suggests thatit may be the causative mechanism of heat tolerance andnot a direct non-adaptive effect of high temperature. Thisfinding is in a striking disagreement with the results of arecent study on Drosophila suggesting that tropical (i.e.,adapted) populations are more likely to exhibit up-regulation of genes at 30°C than temperate populations[9]. Levine et al. [9] argued that this result suggests highergenome-wide levels of gene expression at temperaturesmost commonly experienced in the region of origin. Thedifference between our study and Levine et al. [9] mayreflect real biological and ecological differences betweenthe study organisms. Perhaps since Drosophila can escapeoverheating by behavioral thermal regulation they mayshow a different transcriptional response to stressful ele-vated temperature than do Daphnia from small ponds.The aquatic thermal environment is variable throughtime, but at any particular time point it is homogeneouscompared to the terrestrial environmentHow confident can we be that the observed differences
between the two Northern, heat-sensitive and the twoSouthern, heat-tolerant genotypes are indeed functionallyrelated to the evolutionary history of temperature adap-tation in these spatially distinct populations? Certainly a

Figure 4 Principal components analysis of differential expression of 29,212 genes represented on the array in 4 clones of Daphniafrom Northern (open symbols) and Southern (solid symbols) acclimated to either 18°C (blue symbols) or 28°C (red symbols). A: RNAsamples in the 3D space of the first three principal components, together explaining 42.2% of variance. B – D: the same on pairwise 2D planes ofthe first three principal components. Arrows connect the Euclidean centroids of 3 replicates for each clone at each temperature (thin blue-redgradient arrows) or the centroids of all replicates at each of the two temperatures (thick blue-red gradient arrows) or at each of the two geographicorigins (N vs. S, white-black gradient arrows).
Yampolsky et al. BMC Genomics 2014, 15:859 Page 7 of 12http://www.biomedcentral.com/1471-2164/15/859
larger sample size (feasible with RNAseq approaches,but logistically difficult within the microarray approachemployed here) could have provided stronger evidence.There are two arguments that provide some support forthe conclusion that the observed patterns are not inde-pendent from the evolutionary history of the populationsused in this study. First, local populations of D. pulex inNorth America have long been known to show a highdegree of populations subdivision, swamping the north–south differentiation [35]. This observation suggests that itis not likely that the two Southern or the two Northerngenotypes, each derived from different local populations,have a recent common origin. Thus, the potentially con-founding factor of phylogenetic relationship is likely min-imal and our sample size is two per geographic region.Second, heat tolerance has been shown to be highly corre-lated with the climatic conditions and/or latitude, using a
larger number of clones, both in N. American D. pulex[36] and on world-wide sample in a congeneric D. magna[37]. Still, given the low number of replicates, the geo-graphic patterns described here should be treated as asuggestion, not a solid proof of local adaptation to thermalenvironment.The fact that DNA repair pathways appeared to be
down-regulated, opens an intriguing possibility of a mu-tagenic effect of high temperatures in those genotypesthat demonstrate such down-regulation. The rate ofspontaneous mutation is likely to be higher at elevatedtemperatures for thermodynamic reasons and the down-regulation of DNA repair should exacerbate this effect.As a consequence genotypes down-regulating DNA repairpathways in response to elevated temperatures maysurvive periods of high temperature at a cost to a greatermutational pressure.

Yampolsky et al. BMC Genomics 2014, 15:859 Page 8 of 12http://www.biomedcentral.com/1471-2164/15/859
In a recent study, DNA repair in Daphnia has beenshown to be much less effective at 20°C than at 10°C [38].It is, however, not obvious that the down-regulation ofDNA repair pathways observed in this study is a manifest-ation of the same phenomenon. Firstly, in [38] photo-reactivation repair of UV damage was measured, whiledifferential expression of photoreactivation pathway hasnot been detected here. More importantly, the cited studydetected the decrease in DNA repair efficiency at thetemperature (20°C) that is close to the optimum and farbelow the substressful temperature at which the down-regulation of DNA repair pathways has been observed inthis study.Several a priori expected signals of acclimation to higher
temperature are apparent in either all genotypes or in theheat-tolerant genotypes only. These signatures includechanges in lipid metabolism potentially indicative of thechange in membrane and storage lipid composition – apossibility that warrants a joint transcriptome and lipi-dome analysis in heat-acclimated Daphnia. Another suchpathway related to lipid metabolism is the terpenoid-quinone biosynthesis pathway. Unlike many differentiallyexpressed pathways, this pathway was found to be up-regulated when all clones were considered together. Yet,in the separate analysis of Northern and Southern geno-types, this pathway was found to be down-regulated inNorthern, but not in Southern genotypes through differ-ential expression of a different enzyme. This observationseems to indicate that during acclimation to high tem-perature Daphnia regulate the terpenoid biosynthesispathway in a complex way. Both reactions with detecteddifferential expression feed into the sesquiterpenoidbiosynthesis pathway leading to methyl farnesoate hor-mone – a signal molecule known to induce male pro-duction [39] as well as regulating the production ofhaemoglobin in Daphnia [25,40]. How this rearrange-ment of the terpenoid biosynthesis pathway may fine-tune methyl farnesoate is unknown, but it is quitepossible that such a rearrangement may play an im-portant role in temperature dependent haemoglobinexpression regulation and the reproductive switch to maleproduction.A recent study [8] of adaptation and plasticity of gene
expression in response to alcohol stress in Drosophilareported canalization of gene expression for practicallyall instances of significant GxE interactions. In contrast,in this study we found approximately equal number ofsignificant T*geo interactions in which the “evolved”(heat-tolerant) genotypes had stronger transcriptionalplasticity than the “naïve” (heat-sensitive) genotypes andvise versa. We have previously noted gene specific vari-ation in the pattern of expansion and reduction in theplasticity of gene regulation in the context of pigmen-tation genes in Daphnia [2]. In our current study it
appears that temperature-specific differential expressionin Daphnia may be evolving through both canalizationof plasticity and through an adaptive increase of plas-ticity. It should be noted that it may be hard to detectenhanced plasticity in selected phenotypes because ofthe ‘Fry conjecture’: selected genotypes are better athandling stress, thus the “internal” stress indicators maynot be sufficient to induce expression changes, thus cre-ating a false indication of canalization. This conjecturewas proposed by J. Fry to explain lower transcriptionalresponses to ethanol exposure in ethanol-selected popula-tions than in the controls [8]: ethanol-tolerant genotypeshave a higher ethanol-detoxifying ability and thus experi-ence lower internal concentration of ethanol and acetalde-hyde, resulting in weaker transcriptional response in othergenes. While plausible for xenobiotic stressors (such asalcohol), this mechanism can also work for temperature:certainly heat-tolerant genotypes experience the sametemperature, but they may experience a milder level ofany downstream parameters (oxygen concentration intissues, degree of oxidative damage etc.) that may act astranscriptional triggers than the heat-sensitive genotypes.Thus, the question about canalization vs. expansion ofplasticity in response to selection will remain not fullyresolved until specific trigger mechanisms measurablein ancestral and evolved genotypes can be identified.In our genome-wide analysis, the samples clearly form
four separate clouds in the space of the first three princi-pal components. These four clouds correspond to thetwo temperatures and two geographic origins (North vs.South), with a few exceptions (Figure 4A). The separ-ation of points corresponding to the two temperaturesappears to be stronger in the Southern (tolerant) than inthe Northern (sensitive) clones, suggesting overall ex-panded expression plasticity, i.e., Baldwin effect. One ofthe genotypes (C) stands out by having three of itsbiological replicates located in the “wrong” (Southern)cloud. Barring a possibility of mislabeling (unlikely, asonly PC2 is affected), this placement may indicate thatthere are two distinct syndromes, or patterns of geneexpression, one typical for the two southern clones andthe other typical for the two northern clones, with someclones switching between the two modes haphazardly,with no relation to current temperature. With this singleexception, genotype-specific points (biological replicates)cluster together and the arrows connecting 18°C and 28°Ccentroids are remarkably parallel. In contrast, the sum-mary 18-28°C arrows representing acclimation and theblack-and-white arrows representing divergence and pos-sible prior local adaptation (Northern vs. Southern) arenot parallel, particularly on the plane of the first twoprincipal components, indicating that selection operatingon gene expression in nature may be orthogonal tothe plastic response observed during acclimation. One
Yampolsky et al. BMC Genomics 2014, 15:859 Page 9 of 12http://www.biomedcentral.com/1471-2164/15/859
possible explanation of for this is that the plastic genes,due to their plasticity, are shielded from the natural selec-tion operating on the adaptation to elevated temperatures.
ConclusionNumerous metabolic and regulatory pathways are regu-lated during long-term acclimation to high temperaturein D. pulex. More genes are down-regulated than up-regulated and this effect is stronger in the two Southern,heat tolerant genotypes than in the two Northern, heatsensitive genotypes, suggesting metabolic compensationas a possible acclimation mechanism. Widespread down-regulation of gene expression and DNA repair pathwaysmay represent a “last-resort” survival tactic in organismsfacing a trade-off between long-term and short-termsurvival. Finally, there was a mixture of genes showingreduced plasticity (i.e., canalization) of gene expression inresponse to temperature and genes that exhibit increasedplasticity.
MethodsGenotype provenance and acclimation experimentWe chose four genotypes representing two extremes ofthe heat tolerance gradient measured in [36]: heat tolerantgenotypes BW102 (hereafter B) and KSP3 (hereafter K),originated from Illinois and heat sensitive clones EB1(hereafter E) and CHQ3 (hereafter C), originated fromMinnesota and Wisconsin, respectively. These two pairsof genotypes will be hereafter referred to as “Northern”(N) and “Southern” (S) clones. Although the latitudinaldifference between N and S clones is only 4–6 degrees,and the difference in average July temperatures is only2-5°C, there is a significant difference in temperaturetolerance between the two pairs of genotypes (Table 2).This difference is likely associated with the microcli-mate difference between their habitats of origin. Northernponds are located in wooded areas and are likely to re-main cooler during the summer months than the smaller,shallower and more exposed ponds in prairie zone, fromwhich the Southern clones were sampled [36].Three replicates of each of the four genotypes were
maintained by parthenogenetic reproduction for twogenerations at either 18°C or 28°C in 150 ml bottles
Table 2 Genotype origin and characteristics
Genotype ID Pond/Lake State Lat °N
BW102 Busey Woods Illinois 40°07′
KSP3 Kickapond Illinois 40°06′
CHQ3 Chequamegon Wisconsin 46°19′
EB1 Eloise Butler Minnesota 44°59′
Average July temperature: long-term average from the nearest weather station.Time until immobilization in hours (Timm) and mortality (M, loss of heartbeat after 3See [36] for details.
containing COMBO water medium [41] under a 12 L:12Dphotoperiod. It is worth mentioning that the 28°C treat-ment is not lethal. While this temperature is detrimentalto survival it still allows continuous maintainance andreproduction of organisms allowing for multigenerationalacclimation. Food in the form of Scenedesmus acutus cul-ture was added daily to the final concentration of 200,000cells/ml. The medium was replaced and neonates removedtwice weekly. To establish the experimental generation,20–30 second or third clutch offspring of the second-generation females were collected within 48 hours ofbirth and placed in bottles containing 150 ml of COMBOmedium. These third generation individuals were screenedafter reaching the age of 12–15 days and females withearly development stage clutches (round uniformly darkeggs with smooth edges; <24 hours after clutch depos-ition) were selected for the microarray experiment andstored in liquid nitrogen.
RNA extraction, reverse transcription, labeling and arrayhybridizationTo assess patterns of gene expression, we used the Nimble-Gen D. pulex Expression Array 12×135k (GEO AccessionGPL11278; [42]). Briefly, this platform is a high-densityNimbleGen (Roche-NimbleGen, Inc., Madison, WI, USA)gene expression microarray of 12 identical arrays pre-pared by Maskless Array Synthesizer. Each array contains137,000 isothermal probes interrogating 35,665 genes.Each predicted and experimentally validated gene isrepresented by as many as three unique probes, whilethe remaining probes are designed from transcription-ally active regions (TARs) whose gene models are notyet known.Third-generation acclimated adult females (10 – 12
individuals) with early stage clutches were homoge-nized in TRIZOL Reagent (Invitrogen, Carlsbad, CA).The homogenate was purified using Qiagen’s RNeasyMini Kit (Qiagen,Venlo, Netherlands) with on-columnDNAse treatment to isolate total RNA. Beginningwith 1.0 μg of total RNA, a single round of amplificationusing MessageAmpTM II aRNA kit (Ambion, Austin, TX)was performed for each RNA sample. cRNA (10 μg) wasconverted to double strand cDNA with random primers
Long °W July °T Performance at 37°C
Timm SE M
88°12′ 24.0 2.53 0.053 0.50
88°14′ 24.0 2.52 0.054 0.28
90°54′ 19.0 1.89 0.069 0.66
93°19′ 22.2 1.97 0.046 0.82
hours of exposure) were measured at 37°C in Daphnia acclimauted to 24°C.
Yampolsky et al. BMC Genomics 2014, 15:859 Page 10 of 12http://www.biomedcentral.com/1471-2164/15/859
using the Invitrogen SuperScript Double-Stranded cDNASynthesis kit (Invitrogen, Carlsbad, CA). From 1 μgdouble-stranded cDNA, labeled cDNA was generatedwith NimbleGen’s Dual-colour Labeling Kit (RocheNimbleGen, Inc., Madison, WI). The replicates of eachtreatment (28°C) and control (18°C) for each geographicorigin (Northern and Southern) were alternatively labeledand a dye swap was included among the replicate expe-riments. Dual-colour hybridization, post-hybridizationwashing and scanning were done according to the RocheNimbleGen’s instructions. Images were acquired using aGenePix 4200A scanner, 5 μm resolution, and GenePix6.0 software (Molecular Devices, Sunnyvale, CA). Thedata from these arrays were extracted using the softwareNimbleScan 2.4 (Roche NimbleGen, Inc., Madison, WI).Because we were interested in the expression patterns thatdescribe the adaptive differences between the genotypesand the plastic differences within a genotype, we usedfour competitive hybridizations that define these axes(Northern at 18°C vs. Southern at 18°C; Northern at 28°Cvs. Southern at 28°C; Northern at 18°C vs. Northern at28°C; Southern at 18°C vs. Southern at 28°C) in a loopdesign where each hybridization was replicated threetimes with one dye-swap nested in each set of replicates.
Statistical analysisThe NimbleGen array image data were processed usingNimbleScan version 2.5 to extract probe intensity values.Gene expression values (i.e., gene intensity value) wereobtained from a summarization of intensity values of allcorresponding probes using the RMA (Robust Multi-arrayAverage) method. The pre-processed microarray data wereimported into an in-house analysis pipeline using Biocon-ductor for normalization and analysis [43]. All genes werequantile-normalized across arrays, samples, and replicates[44]. Differential expression was assessed using LIMMAand EBarrays [45,46] using the median signal of probesrepresenting genes. EBarrays uses a parametric mixturemodel to calculate the posterior probability of differentialexpression for arbitrarily complex experimental designs.To determine the significance of expression differences,and adjust for multiple testing, we calculated the FalseDiscovery Rate (FDR; [33] for each gene using the Biocon-ductor LIMMA package.The following general linear model was utilized to test
for the significance of acclimation temperature (T, 18°Cvs.28°C, d.f. = 1), geographic origin (geo, N vs. S, d.f. = 1)and clones (nested within geo, d.f. = 2) on expression (E):E = T + geo + clone(geo) + T*geo + T*clone(geo) + e;
clone(geo) and T*clone(geo) were treated as randomeffects. T effect and T*geo interaction were tested againstthe T*clone(geo) interaction term. Whenever the T*clone(geo) interaction did not approach significance (P > 0.2)the mean squares (MS) associated with it were pooled
together with the residual MS and the T effect was testedagainst the pooled MS [47].To test for the differential expression present within
the N and S clones separately, the MS associated withthe T effect were tested against the T*clone interactionwithin each geographic region. As before, non-significantT*clone MS were pooled with the error MS. Alternatively,paired t-tests were used to compare expression levels inboth clones at one temperature to those at the other(equivalent to pooling both the clone MS and the inter-action MS with the error MS). The results were remark-ably similar; t-tests results are not reported, as they areless conservative. In all cases the results were screenedby the False Discovery Rate correction for multipletesting [33].Lists of differentially expressed genes, in the form of
their clusters of orthologous groups (KOG) IDs [34]were submitted to the iPATH web server [48] to gener-ate maps of metabolic and regulatory pathways affectedby the differential expression. Fisher’s exact test was usedto determine whether a particular pathway was overrepre-sented among the differentially expressed genes (withthe number of non-differentially expressed genes im-plicated in the given pathway, among total number ofnon-differentially expressed genes in the dataset as thereference).All analyses were conducted using JMP 9.0 and JMP
Genomics 3.0 (SAS Institute, Gary, NC, USA).
Availability of supporting dataThe data set(s) supporting the results of this articleare available as the Additional file 1 included with the art-icle (the list of genes with at least one test significant(FDR < 0.05), including expression data and annotations);expression data are available at GEO (http://www.ncbi.nlm.nih.gov/geo; Accession number GSE53692); gene an-notations can be downloaded from wfleabase.org.
Additional file
Additional file 1: Expression data and genomic annotation forgenes with at least one significant test. Complete data in http://www.ncbi.nlm.nih.gov/geo/query/acc.cgi?acc=GSE53692. Columns: 1 - Gene ID;2-25 - expression data (log2 transformed); 26-44 - genomic annotation;45-57 Data analysis (See Header tab for details).
AbbreviationsGxE: Genotype by environment; KOG: (Eukaryotic) clusters of OrthologousGroups; FDR: False Discovery Rate; N: North; S: South; PC: Principalcomponent; E: Expression level; T: Temperature; Geo: Geographic origin;E: Error; MS: Mean squeares; HSP: Heat shock proteins.
Competing interestsThe authors declare that they have no competing interests.

Yampolsky et al. BMC Genomics 2014, 15:859 Page 11 of 12http://www.biomedcentral.com/1471-2164/15/859
Authors’ contributionsLYY, MEP and JKC designed the study; LYY, PJW and KBD carried outacclimation experiments and RNA extractions, JL carried out microarray work;EZ, LYY and MEP carried out data analysis; LYY, MEP and JKC wrote themanuscript. All authors read and approved the final manuscript.
Authors’ informationLYY, MEP, and JKC are faculty at, respectively, ETSU, U. of Note Dame and U. ofBirmingham; JL is a Laboratory Program Manager at ND, EZ was a ManagingDirector of the Genomics & Bioinformatics Core Facility at ND and is currentlyfaculty at the University of South Dakota; PJW and KBD were, at the time thestudy was conducted, a master and an undergraduate student, respectively, atETSU; currently they are, respectively, a lecturer at Lenoir-Rhyne University and amedical student at ETSU Quillen College of Medicine.
AcknowledgementsWe are grateful to Dieter Ebert and Michael Lynch for helpful discussionof our results. This work was supported by NSF1136706 to LYY, and NIHR24-GM078274 to MEP.
Author details1Department of Biological Sciences, East Tennessee State University, JohnsonCity, TN 37641, USA. 2Department of Computer Science and Engineering,University of Notre Dame, Notre Dame, IN 46556, USA. 3Present address:Department of Biology and Department of Computer Science, University ofSouth Dakota, Vermillion, SD 57069, USA. 4Department of Biological Sciencesand Environmental Change Initiative, University of Notre Dame, Notre Dame,IN 46556, USA. 5Present address: School of Natural Sciences Lenoir-RhyneUniversity, Hickory, NC 28603, USA. 6Environmental Genomics Group, Schoolof Biosciences, University of Birmingham, Birmingham, UK.
Received: 3 July 2014 Accepted: 23 September 2014Published: 4 October 2014
References1. Ghalambor CK, McKay JK, Carroll SP, Reznick DN: Adaptive versus
non-adaptive phenotypic plasticity and the potential for contemporaryadaptation in new environments. Functional Ecology 2007, 21:394–407.doi.wiley.com/10.1111/j.1365-2435.2007.01283.x.
2. Scoville AG, Pfrender ME: Phenotypic plasticity facilitates recurrent rapidadaptation to introduced predators. Proc Natl Acad Sci U S A 2010,107:4260–4263.
3. Hansen MM, Olivieri I, Waller DM, Nielsen EE: Monitoring adaptive geneticresponses to environmental change. Mol Ecol 2012, 21:1311–1329.
4. Pavey SA, Bernatchez L, Aubin-Horth N, Landry CR: What is needed fornext-generation ecological and evolutionary genomics? Trends Ecol Evol2012, 27:673–678.
5. Aubin-Horth N, Renn SCP: Genomic reaction norms: using integrativebiology to understand molecular mechanisms of phenotypic plasticity.Mol Ecol 2009, 18:3763–3780.
6. Hodgins-Davis A, Townsend JP: Evolving gene expression: from G to E toGxE. Trends Ecol Evol 2009, 24:649–658.
7. Wilson R, Franklin C: Testing the beneficial acclimation hypothesis.Trends Ecol Evol 2002, 17:66–70.
8. Yampolsky LY, Glazko GV, Fry JD: Evolution of gene expression andexpression plasticity in long-term experimental populations ofDrosophila melanogaster maintained under constant and variableethanol stress. Mol Ecol 2012, 21:4287–4299.
9. Levine MT, Eckert ML, Begun DJ: Whole-genome expression plasticityacross tropical and temperate Drosophila melanogaster populations fromEastern Australia. Mol Biol Evol 2011, 28:249–256.
10. Latta LC, Weider LJ, Colbourne JK, Pfrender ME: The evolution of salinitytolerance in Daphnia: a functional genomics approach. Ecol Lett 2012,15:794–802.
11. Whitehead A, Crawford DL: Neutral and adaptive variation in geneexpression. Proc Natl Acad Sci U S A 2006, 103:5425–5430.
12. Bukau B, Horwich AL: The Hsp70 and Hsp60 chaperone machines.Cell 1998, 92:351–366.
13. Schoville SD, Barreto FS, Moy GW, Wolff A, Burton RS: Investigating themolecular basis of local adaptation to thermal stress: population
differences in gene expression across the transcriptome of the copepodTigriopus californicus. BMC Evol Biol 2012, 12:170.
14. Rosic NN, Pernice M, Dunn S, Dove S, Hoegh-Guldberg O: Differentialregulation by heat stress of novel cytochrome P450 genes from thedinoflagellate symbionts of reef-building corals. Appl Environ Microbiol2010, 76:2823–2829.
15. Kang J, Kim J, Choi K-W: Novel cytochrome P450, cyp6a17, is required fortemperature preference behavior in Drosophila. PLoS One 2011, 6:e29800.
16. Hazel JR, Williams EE: The role of alterations in membrane lipidcomposition in enabling physiological adaptation of organisms to theirphysical environment. Prog Lipid Res 1990, 29:167–227.
17. Van Dooremalen C, Koekkoek J, Ellers J: Temperature-induced plasticity inmembrane and storage lipid composition: thermal reaction normsacross five different temperatures. J Insect Physiol 2011, 57:285–291.
18. Hochachka PW: Organization of metabolism during temperaturecompensation. In Molecular Mechanisms of Temperature Adaptation.Edited by Prosser CL. Washington, DC: AAAS; 1967:177–203.
19. Pörtner HO: Climate variations and the physiological basis oftemperature dependent biogeography: systemic to molecularhierarchy of thermal tolerance in animals. Comp Biochem Physiol 2002,132A:739–761.
20. Pörtner HO, Knust R: Climate change affects marine fishes through theoxygen limitation of thermal tolerance. Science 2007, 315:95–97.
21. Pirow R, Bäumer C, Paul RJ: Benefits of haemoglobin in the cladocerancrustacean Daphnia magna. J Exp Biol 2001, 204:3425–3441.
22. Seidl MD, Pirow R, Paul RJ: Acclimation of the microcrustacean Daphniamagna to warm temperatures is dependent on haemoglobin expression.J Thermal Biol 2005, 30:532–544.
23. Wittmann AC, Schroeer M, Bock C, Steeger HU, Paul RJ, Pörtner HO:Indicators of oxygen- and capacity-limited thermal tolerance in thelugworm Arenicola marina. Climate Res 2008, 37:227–240.
24. Beers JM, Sidell BD: Thermal tolerance of Antarctic notothenioid fishescorrelates with level of circulating haemoglobin. Physiol Biochem Zool2011, 84:353–362.
25. Rider CV, Gorr TA, Olmstead AW, Wasilak BA, LeBlanc GA: Stress signaling:coregulation of hemoglobin and male sex determination through aterpenoid signaling pathway in a crustacean. J Exp Biol 2005,208:15–23.
26. Bullock TH: Compensation for temperature in the metabolism andactivity of poikilotherms. Biol Rev 1955, 30:311–342.
27. Somero GN, Hochachka PW: Biochemical adaptation to the environment.Amer Zool 1971, 11:157–165.
28. Hochachka PW, Somero GN: Biochemical Adaptation. Oxford - New York:Oxford University Press; 2002.
29. Somero GN: Adaptation of enzymes to temperature: searching for basic“strategies”. Comp Biochem Physiol B Biochem Mol Biol 2004, 139:321–333.doi:10.1016/j.cbpc.2004.05.003.
30. Causton HC, Ren B, Koh SS, Harbison CT, Kanin E, Jennings EG, Lee TI,True HL, Lander ES, Young RA: Remodeling of yeast genome expressionin response to environmental changes. Mol Biol Cell 2001, 12:323–337.
31. Crispo E: The Baldwin effect and genetic assimilation: revisiting twomechanisms of evolutionary change mediated by phenotypic plasticity.Evolution 2007, 61:2469–2479.
32. Lande R: Adaptation to an extraordinary environment by evolution ofphenotypic plasticity and genetic assimilation. J Evol Biol 2009,22:1435–1446.
33. Benjamini Y, Yekutieli D: The control of the false discovery rate inmultiple testing under dependency. Ann Stat 2001, 29:1165–1188.
34. Tatusov RL, Fedorova ND, Jackson JD, Jacobs AR, Kiryutin B, Koonin EV,Krylov DM, Mazumder R, Mekhedov SL, Nikolskaya AN, Rao BS, Smirnov S,Sverdlov AV, Vasudevan S, Wolf YI, Yin JJ, Natale DA: The COG database: anupdated version includes eukaryotes. BMC Bioinformatics 2003, 4:41.
35. Crease TM, Lynch M, Spitze K: Hierarchical analysis of population geneticvariation in nuclear and mitochondrial genes in Daphnia. Mol Biol Evol1990, 7:444–458.
36. Williams PJ, Dick KB, Yampolsky LY: Heat tolerance, temperatureacclimation, acute oxidative damage and canalization of haemoglobinexpression in Daphnia. Evol Ecol 2011, 26:591–609.
37. Yampolsky LY, Schaer TMM, Ebert D: Adaptive phenotypic plasticity andlocal adaptation for temperature tolerance in freshwater zooplankton.Proc Royal Soc Biol Sci 2014, 281:20132744. doi:10.1098/rspb.2013.2744.
Yampolsky et al. BMC Genomics 2014, 15:859 Page 12 of 12http://www.biomedcentral.com/1471-2164/15/859
38. Connelly SJ, Moeller RE, Sanchez G, Mitchell DL: Temperature effects onsurvival and DNA repair in four freshwater cladoceran Daphnia speciesexposed to UV radiation. Photochem Photobiol 2009, 85:144–152.doi:10.1111/j.1751-1097.2008.00408.x.
39. Olmstead AW, Leblanc GA: Juvenoid hormone methyl farnesoate is a sexdeterminant in the crustacean Daphnia magna. J Exper Zool 2002,293:736–739.
40. Gorr TA, Cahn JD, Yamagata H, Bunn HF: Hypoxia-induced synthesis ofhemoglobin in the crustacean Daphnia magna is hypoxia-induciblefactor-dependent. J Biol Chem 2004, 279:36038–36047. doi:10.1074/jbc.M403981200.
41. Kilham SS, Kreeger DA, Lynn SG, Goulden CE, Herrera L: COMBO: adefined freshwater culture medium for algae and zooplankton.Hydrobiologia 1998, 377:147–159.
42. Colbourne JK, Pfrender ME, Gilbert D, Thomas WK, Tucker A, Oakley TH,Tokishita S, Aerts A, Arnold GJ, Basu MK, Bauer DJ, Caceres CE, Carmel L,Casola C, Choi JH, Detter JC, Dong QF, Dusheyko S, Eads BD, Frohlich T,Geiler-Samerotte KA, Gerlach D, Hatcher P, Jogdeo S, Krijgsveld J,Kriventseva EV, Kultz D, Laforsch C, Lindquist E, Lopez J, et al: Theecoresponsive genome of Daphnia pulex. Science 2011, 331:555–561.doi:10.1126/science.1197761.
43. Gentleman RC, Carey VJ, Bates DM, Bolstad B, Dettling M, Dudoit S, Ellis B,Gautier L, Ge Y, Gentry J, Hornik K, Hothorn T, Huber W, Iacus S, Irizarry R,Leisch F, Li C, Maechler M, Rossini AJ, Sawitzki G, Smith C, Smyth G, TierneyL, Yang JYH, Zhang JH: Bioconductor: open software development forcomputational biology and bioinformatics. Genome Biol 2004, 5:R80.doi:10.1186/gb-2004-5-10-r80.
44. Bolstad BM, Irizarry RA, Astrand M, Speed TP: A comparison ofnormalization methods for high density oligonucleotide array databased on bias and variance. Bioinformatics 2003, 19:185–193.
45. Wettenhall JM, Smyth GK: limmaGUI: A graphical user interface for linearmodeling of microarray data. Bioinformatics 2004, 20:3705–3706.
46. Kendziorski CM, Newton MA, Lan H, Gould MN: On parametric empiricalBayes methods for comparing multiple groups using replicated geneexpression profiles. Stat Med 2003, 22:3899–3914. doi:10.1002/sim.1548.
47. Zar J: Biostatistical Analysis. Upper Saddle River, New Jersey, USA: PrenticeHall; 1999.
48. Yamada T, Letunic I, Okuda S, Kanehisa M, Bork P: iPath2.0: interactivepathway explorer. Nucleic Acids Res 2011, 39:W412–W425.
doi:10.1186/1471-2164-15-859Cite this article as: Yampolsky et al.: Functional genomics of acclimationand adaptation in response to thermal stress in Daphnia. BMC Genomics2014 15:859.
Submit your next manuscript to BioMed Centraland take full advantage of:
• Convenient online submission
• Thorough peer review
• No space constraints or color figure charges
• Immediate publication on acceptance
• Inclusion in PubMed, CAS, Scopus and Google Scholar
• Research which is freely available for redistribution
Submit your manuscript at www.biomedcentral.com/submit


![Genomics of Adaptation during Experimental Evolution of the … · 2016. 1. 6. · laboratory adaptation (reviewed in [19]). Here we use a combination of experimental evolution and](https://static.fdocuments.in/doc/165x107/60f7980deb53ae71be3b3de7/genomics-of-adaptation-during-experimental-evolution-of-the-2016-1-6-laboratory.jpg)


![What is adaptation? Noun vs. verb (vs. acclimation) Noun: “…[A] feature is an adaptation for some function if it has become prevalent or is maintained.](https://static.fdocuments.in/doc/165x107/56649d395503460f94a13880/what-is-adaptation-noun-vs-verb-vs-acclimation-noun-a-feature.jpg)