Functional assessments of foot strength: a comparative and ...
9
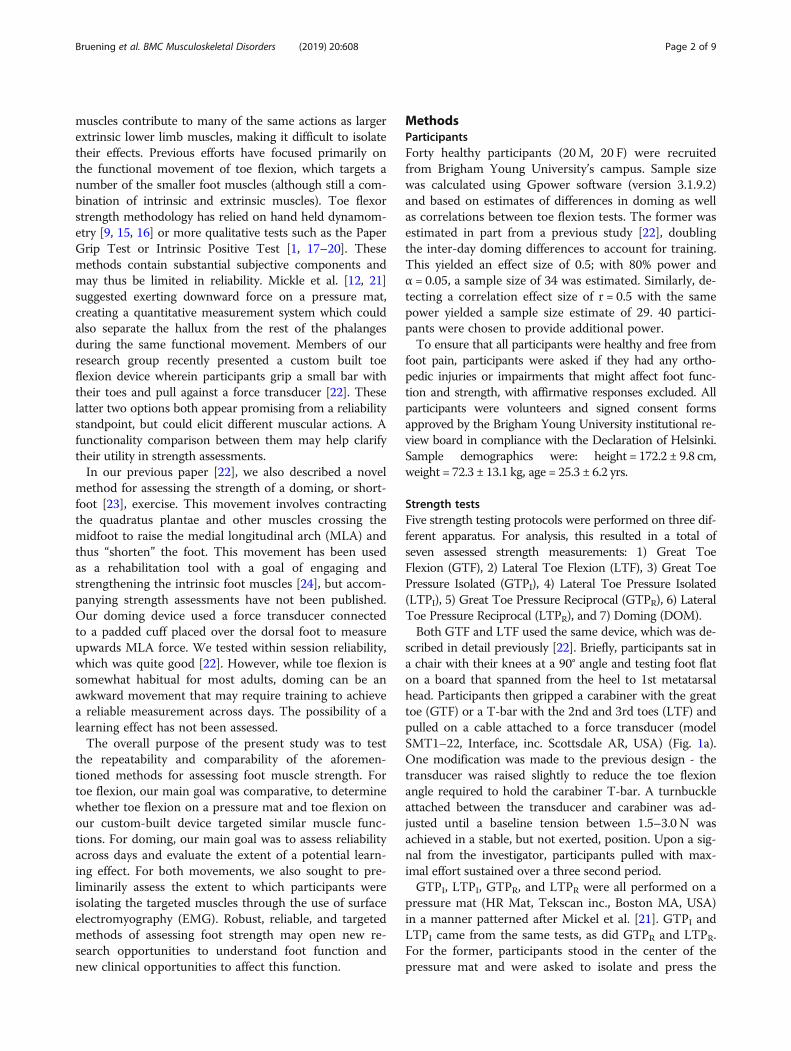
TECHNICAL ADVANCE Open Access Functional assessments of foot strength: a comparative and repeatability study Dustin A. Bruening 1* , Sarah T. Ridge 1 , Julia L. Jacobs 1 , Mark T. Olsen 1 , Dallin W. Griffin 1 , Drew H. Ferguson 1 , Kirk E. Bassett 2 and A. Wayne Johnson 1 Abstract Background: Evaluating the strength of the small muscles of the foot may be useful in a variety of clinical applications but is challenging from a methodology standpoint. Previous efforts have focused primarily on the functional movement of toe flexion, but clear methodology guidelines are lacking. A novel foot doming test has also been proposed, but not fully evaluated. The purposes of the present study were to assess the repeatability and comparability of several functional foot strength assessment techniques. Methods: Forty healthy volunteers were evaluated across two testing days, with a two-week doming motion practice period between them. Seven different measurements were taken using a custom toe flexion dynamometer (seated), custom doming dynamometer (standing), and a pressure mat (standing). Measurements from the doming dynamometer were evaluated for reliability (ICCs) and a learning effect (paired t-tests), while measurements from the toe flexion dynamometer and pressure mat were evaluated for reliability and comparability (correlations). Electromyography was also used to descriptively assess the extent of muscle isolation in all measurements. Results: Doming showed excellent within-session reliability (ICCs > 0.944), but a clear learning effect was present, with strength (p < 0.001) and muscle activity increasing between sessions. Both intrinsic and extrinsic muscles were engaged during this test. All toe flexion tests also showed excellent reliability (ICCs > 0.945). Seated toe flexion tests using the dynamometer were moderately correlated to standing toe flexion tests on a pressure mat (r > 0.54); however, there were some differences in muscle activity. The former may better isolate the toe flexors, while the latter appeared to be more functional for many pathologies. On the pressure mat, reciprocal motion appeared to display slightly greater forces and reliability than isolated toe flexion. Conclusions: This study further refines potential methodology for foot strength testing. These devices and protocols can be duplicated in the clinic to evaluate and monitor rehabilitation progress in clinical populations associated with foot muscle weakness. Keywords: Doming, Short foot exercise, Toe flexion, Intrinsic foot muscles, Extrinsic foot muscles Background The evaluation of foot muscle strength may be import- ant in a variety of clinical diagnostic and rehabilitation applications [1]. For instance, diseases such as diabetes [2] and Charcot-Marie-Tooth [3] contribute to foot weakness and altered foot neuromuscular activation [4]. Foot muscle weakness is also associated with a wide range of foot deformities and foot pain (e.g. [5–10]). Recent research has shown that foot muscle weakness may be associated with increased fall risk in the elderly due to the muscles’ role in stabilization and balance [11, 12]. Emerging evidence also suggests that targeted foot strengthening exercises may benefit those with foot pathologies [13, 14]. The ability to accurately assess foot strength may help clinicians and researchers identify weakness and monitor rehabilitation progress. While robust methods for evaluating the strength of muscle groups crossing the major body joints is com- monplace, evaluating the strength of the small foot mus- cles is challenging. In particular, the intrinsic foot © The Author(s). 2019 Open Access This article is distributed under the terms of the Creative Commons Attribution 4.0 International License (http://creativecommons.org/licenses/by/4.0/), which permits unrestricted use, distribution, and reproduction in any medium, provided you give appropriate credit to the original author(s) and the source, provide a link to the Creative Commons license, and indicate if changes were made. The Creative Commons Public Domain Dedication waiver (http://creativecommons.org/publicdomain/zero/1.0/) applies to the data made available in this article, unless otherwise stated. * Correspondence: [email protected] 1 Exercise Sciences Department, Brigham Young University, Provo, UT, USA Full list of author information is available at the end of the article Bruening et al. BMC Musculoskeletal Disorders (2019) 20:608 https://doi.org/10.1186/s12891-019-2981-6
Transcript of Functional assessments of foot strength: a comparative and ...
TECHNICAL ADVANCE Open Access
Functional assessments of foot strength: acomparative and repeatability studyDustin A. Bruening1* , Sarah T. Ridge1, Julia L. Jacobs1, Mark T. Olsen1, Dallin W. Griffin1, Drew H. Ferguson1,Kirk E. Bassett2 and A. Wayne Johnson1
Abstract
Background: Evaluating the strength of the small muscles of the foot may be useful in a variety of clinicalapplications but is challenging from a methodology standpoint. Previous efforts have focused primarily on thefunctional movement of toe flexion, but clear methodology guidelines are lacking. A novel foot doming test hasalso been proposed, but not fully evaluated. The purposes of the present study were to assess the repeatability andcomparability of several functional foot strength assessment techniques.
Methods: Forty healthy volunteers were evaluated across two testing days, with a two-week doming motionpractice period between them. Seven different measurements were taken using a custom toe flexion dynamometer(seated), custom doming dynamometer (standing), and a pressure mat (standing). Measurements from the domingdynamometer were evaluated for reliability (ICCs) and a learning effect (paired t-tests), while measurements fromthe toe flexion dynamometer and pressure mat were evaluated for reliability and comparability (correlations).Electromyography was also used to descriptively assess the extent of muscle isolation in all measurements.
Results: Doming showed excellent within-session reliability (ICCs > 0.944), but a clear learning effect was present,with strength (p < 0.001) and muscle activity increasing between sessions. Both intrinsic and extrinsic muscles wereengaged during this test. All toe flexion tests also showed excellent reliability (ICCs > 0.945). Seated toe flexion testsusing the dynamometer were moderately correlated to standing toe flexion tests on a pressure mat (r > 0.54);however, there were some differences in muscle activity. The former may better isolate the toe flexors, while thelatter appeared to be more functional for many pathologies. On the pressure mat, reciprocal motion appeared todisplay slightly greater forces and reliability than isolated toe flexion.
Conclusions: This study further refines potential methodology for foot strength testing. These devices andprotocols can be duplicated in the clinic to evaluate and monitor rehabilitation progress in clinical populationsassociated with foot muscle weakness.
Keywords: Doming, Short foot exercise, Toe flexion, Intrinsic foot muscles, Extrinsic foot muscles
BackgroundThe evaluation of foot muscle strength may be import-ant in a variety of clinical diagnostic and rehabilitationapplications [1]. For instance, diseases such as diabetes[2] and Charcot-Marie-Tooth [3] contribute to footweakness and altered foot neuromuscular activation [4].Foot muscle weakness is also associated with a widerange of foot deformities and foot pain (e.g. [5–10]).
Recent research has shown that foot muscle weaknessmay be associated with increased fall risk in the elderlydue to the muscles’ role in stabilization and balance [11,12]. Emerging evidence also suggests that targeted footstrengthening exercises may benefit those with footpathologies [13, 14]. The ability to accurately assess footstrength may help clinicians and researchers identifyweakness and monitor rehabilitation progress.While robust methods for evaluating the strength of
muscle groups crossing the major body joints is com-monplace, evaluating the strength of the small foot mus-cles is challenging. In particular, the intrinsic foot
© The Author(s). 2019 Open Access This article is distributed under the terms of the Creative Commons Attribution 4.0International License (http://creativecommons.org/licenses/by/4.0/), which permits unrestricted use, distribution, andreproduction in any medium, provided you give appropriate credit to the original author(s) and the source, provide a link tothe Creative Commons license, and indicate if changes were made. The Creative Commons Public Domain Dedication waiver(http://creativecommons.org/publicdomain/zero/1.0/) applies to the data made available in this article, unless otherwise stated.
* Correspondence: [email protected] Sciences Department, Brigham Young University, Provo, UT, USAFull list of author information is available at the end of the article
Bruening et al. BMC Musculoskeletal Disorders (2019) 20:608 https://doi.org/10.1186/s12891-019-2981-6
muscles contribute to many of the same actions as largerextrinsic lower limb muscles, making it difficult to isolatetheir effects. Previous efforts have focused primarily onthe functional movement of toe flexion, which targets anumber of the smaller foot muscles (although still a com-bination of intrinsic and extrinsic muscles). Toe flexorstrength methodology has relied on hand held dynamom-etry [9, 15, 16] or more qualitative tests such as the PaperGrip Test or Intrinsic Positive Test [1, 17–20]. Thesemethods contain substantial subjective components andmay thus be limited in reliability. Mickle et al. [12, 21]suggested exerting downward force on a pressure mat,creating a quantitative measurement system which couldalso separate the hallux from the rest of the phalangesduring the same functional movement. Members of ourresearch group recently presented a custom built toeflexion device wherein participants grip a small bar withtheir toes and pull against a force transducer [22]. Theselatter two options both appear promising from a reliabilitystandpoint, but could elicit different muscular actions. Afunctionality comparison between them may help clarifytheir utility in strength assessments.In our previous paper [22], we also described a novel
method for assessing the strength of a doming, or short-foot [23], exercise. This movement involves contractingthe quadratus plantae and other muscles crossing themidfoot to raise the medial longitudinal arch (MLA) andthus “shorten” the foot. This movement has been usedas a rehabilitation tool with a goal of engaging andstrengthening the intrinsic foot muscles [24], but accom-panying strength assessments have not been published.Our doming device used a force transducer connectedto a padded cuff placed over the dorsal foot to measureupwards MLA force. We tested within session reliability,which was quite good [22]. However, while toe flexion issomewhat habitual for most adults, doming can be anawkward movement that may require training to achievea reliable measurement across days. The possibility of alearning effect has not been assessed.The overall purpose of the present study was to test
the repeatability and comparability of the aforemen-tioned methods for assessing foot muscle strength. Fortoe flexion, our main goal was comparative, to determinewhether toe flexion on a pressure mat and toe flexion onour custom-built device targeted similar muscle func-tions. For doming, our main goal was to assess reliabilityacross days and evaluate the extent of a potential learn-ing effect. For both movements, we also sought to pre-liminarily assess the extent to which participants wereisolating the targeted muscles through the use of surfaceelectromyography (EMG). Robust, reliable, and targetedmethods of assessing foot strength may open new re-search opportunities to understand foot function andnew clinical opportunities to affect this function.
MethodsParticipantsForty healthy participants (20M, 20 F) were recruitedfrom Brigham Young University’s campus. Sample sizewas calculated using Gpower software (version 3.1.9.2)and based on estimates of differences in doming as wellas correlations between toe flexion tests. The former wasestimated in part from a previous study [22], doublingthe inter-day doming differences to account for training.This yielded an effect size of 0.5; with 80% power andα = 0.05, a sample size of 34 was estimated. Similarly, de-tecting a correlation effect size of r = 0.5 with the samepower yielded a sample size estimate of 29. 40 partici-pants were chosen to provide additional power.To ensure that all participants were healthy and free from
foot pain, participants were asked if they had any ortho-pedic injuries or impairments that might affect foot func-tion and strength, with affirmative responses excluded. Allparticipants were volunteers and signed consent formsapproved by the Brigham Young University institutional re-view board in compliance with the Declaration of Helsinki.Sample demographics were: height = 172.2 ± 9.8 cm,weight = 72.3 ± 13.1 kg, age = 25.3 ± 6.2 yrs.
Strength testsFive strength testing protocols were performed on three dif-ferent apparatus. For analysis, this resulted in a total ofseven assessed strength measurements: 1) Great ToeFlexion (GTF), 2) Lateral Toe Flexion (LTF), 3) Great ToePressure Isolated (GTPI), 4) Lateral Toe Pressure Isolated(LTPI), 5) Great Toe Pressure Reciprocal (GTPR), 6) LateralToe Pressure Reciprocal (LTPR), and 7) Doming (DOM).Both GTF and LTF used the same device, which was de-
scribed in detail previously [22]. Briefly, participants sat ina chair with their knees at a 90° angle and testing foot flaton a board that spanned from the heel to 1st metatarsalhead. Participants then gripped a carabiner with the greattoe (GTF) or a T-bar with the 2nd and 3rd toes (LTF) andpulled on a cable attached to a force transducer (modelSMT1–22, Interface, inc. Scottsdale AR, USA) (Fig. 1a).One modification was made to the previous design - thetransducer was raised slightly to reduce the toe flexionangle required to hold the carabiner T-bar. A turnbuckleattached between the transducer and carabiner was ad-justed until a baseline tension between 1.5–3.0 N wasachieved in a stable, but not exerted, position. Upon a sig-nal from the investigator, participants pulled with max-imal effort sustained over a three second period.GTPI, LTPI, GTPR, and LTPR were all performed on a
pressure mat (HR Mat, Tekscan inc., Boston MA, USA)in a manner patterned after Mickel et al. [21]. GTPI andLTPI came from the same tests, as did GTPR and LTPR.For the former, participants stood in the center of thepressure mat and were asked to isolate and press the
Bruening et al. BMC Musculoskeletal Disorders (2019) 20:608 Page 2 of 9
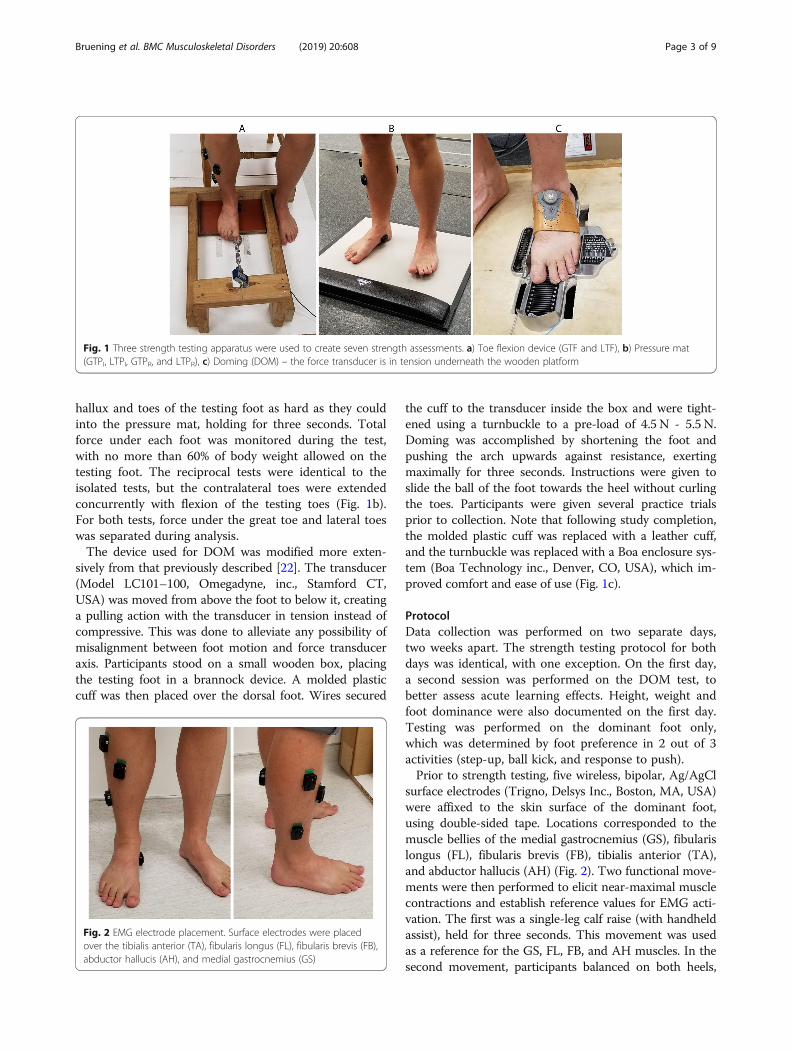
hallux and toes of the testing foot as hard as they couldinto the pressure mat, holding for three seconds. Totalforce under each foot was monitored during the test,with no more than 60% of body weight allowed on thetesting foot. The reciprocal tests were identical to theisolated tests, but the contralateral toes were extendedconcurrently with flexion of the testing toes (Fig. 1b).For both tests, force under the great toe and lateral toeswas separated during analysis.The device used for DOM was modified more exten-
sively from that previously described [22]. The transducer(Model LC101–100, Omegadyne, inc., Stamford CT,USA) was moved from above the foot to below it, creatinga pulling action with the transducer in tension instead ofcompressive. This was done to alleviate any possibility ofmisalignment between foot motion and force transduceraxis. Participants stood on a small wooden box, placingthe testing foot in a brannock device. A molded plasticcuff was then placed over the dorsal foot. Wires secured
the cuff to the transducer inside the box and were tight-ened using a turnbuckle to a pre-load of 4.5 N - 5.5 N.Doming was accomplished by shortening the foot andpushing the arch upwards against resistance, exertingmaximally for three seconds. Instructions were given toslide the ball of the foot towards the heel without curlingthe toes. Participants were given several practice trialsprior to collection. Note that following study completion,the molded plastic cuff was replaced with a leather cuff,and the turnbuckle was replaced with a Boa enclosure sys-tem (Boa Technology inc., Denver, CO, USA), which im-proved comfort and ease of use (Fig. 1c).
ProtocolData collection was performed on two separate days,two weeks apart. The strength testing protocol for bothdays was identical, with one exception. On the first day,a second session was performed on the DOM test, tobetter assess acute learning effects. Height, weight andfoot dominance were also documented on the first day.Testing was performed on the dominant foot only,which was determined by foot preference in 2 out of 3activities (step-up, ball kick, and response to push).Prior to strength testing, five wireless, bipolar, Ag/AgCl
surface electrodes (Trigno, Delsys Inc., Boston, MA, USA)were affixed to the skin surface of the dominant foot,using double-sided tape. Locations corresponded to themuscle bellies of the medial gastrocnemius (GS), fibularislongus (FL), fibularis brevis (FB), tibialis anterior (TA),and abductor hallucis (AH) (Fig. 2). Two functional move-ments were then performed to elicit near-maximal musclecontractions and establish reference values for EMG acti-vation. The first was a single-leg calf raise (with handheldassist), held for three seconds. This movement was usedas a reference for the GS, FL, FB, and AH muscles. In thesecond movement, participants balanced on both heels,
Fig. 1 Three strength testing apparatus were used to create seven strength assessments. a) Toe flexion device (GTF and LTF), b) Pressure mat(GTPI, LTPI, GTPR, and LTPR), c) Doming (DOM) – the force transducer is in tension underneath the wooden platform
Fig. 2 EMG electrode placement. Surface electrodes were placedover the tibialis anterior (TA), fibularis longus (FL), fibularis brevis (FB),abductor hallucis (AH), and medial gastrocnemius (GS)
Bruening et al. BMC Musculoskeletal Disorders (2019) 20:608 Page 3 of 9
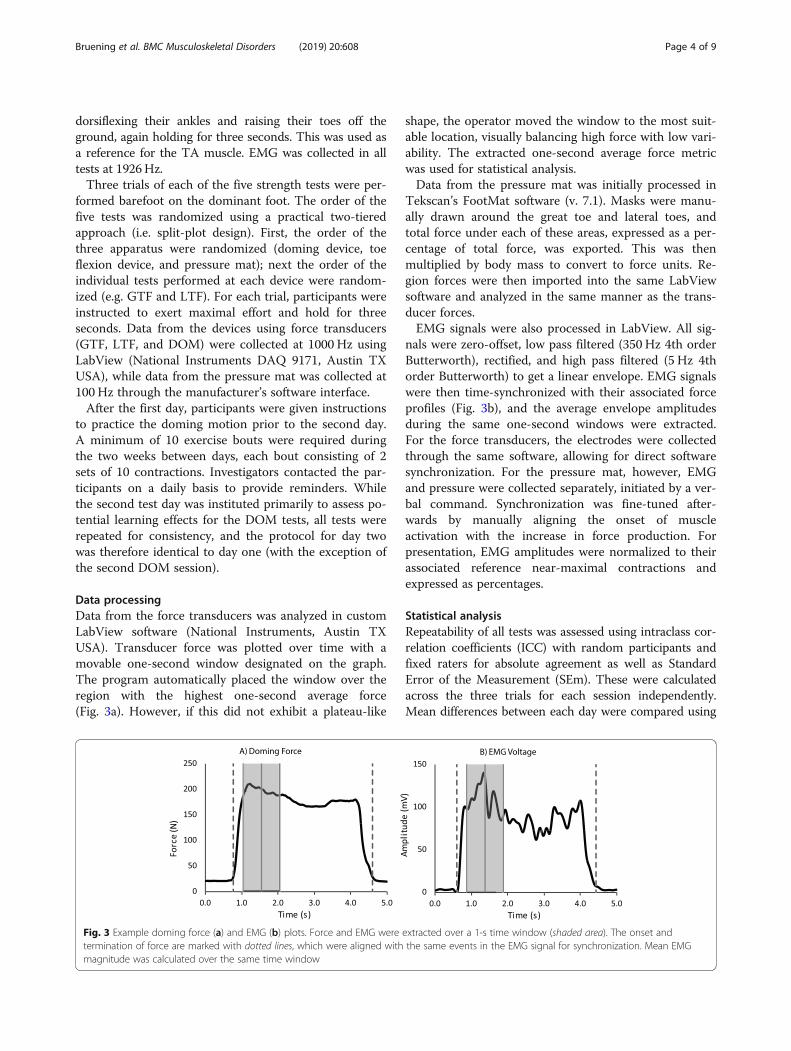
dorsiflexing their ankles and raising their toes off theground, again holding for three seconds. This was used asa reference for the TA muscle. EMG was collected in alltests at 1926Hz.Three trials of each of the five strength tests were per-
formed barefoot on the dominant foot. The order of thefive tests was randomized using a practical two-tieredapproach (i.e. split-plot design). First, the order of thethree apparatus were randomized (doming device, toeflexion device, and pressure mat); next the order of theindividual tests performed at each device were random-ized (e.g. GTF and LTF). For each trial, participants wereinstructed to exert maximal effort and hold for threeseconds. Data from the devices using force transducers(GTF, LTF, and DOM) were collected at 1000 Hz usingLabView (National Instruments DAQ 9171, Austin TXUSA), while data from the pressure mat was collected at100 Hz through the manufacturer’s software interface.After the first day, participants were given instructions
to practice the doming motion prior to the second day.A minimum of 10 exercise bouts were required duringthe two weeks between days, each bout consisting of 2sets of 10 contractions. Investigators contacted the par-ticipants on a daily basis to provide reminders. Whilethe second test day was instituted primarily to assess po-tential learning effects for the DOM tests, all tests wererepeated for consistency, and the protocol for day twowas therefore identical to day one (with the exception ofthe second DOM session).
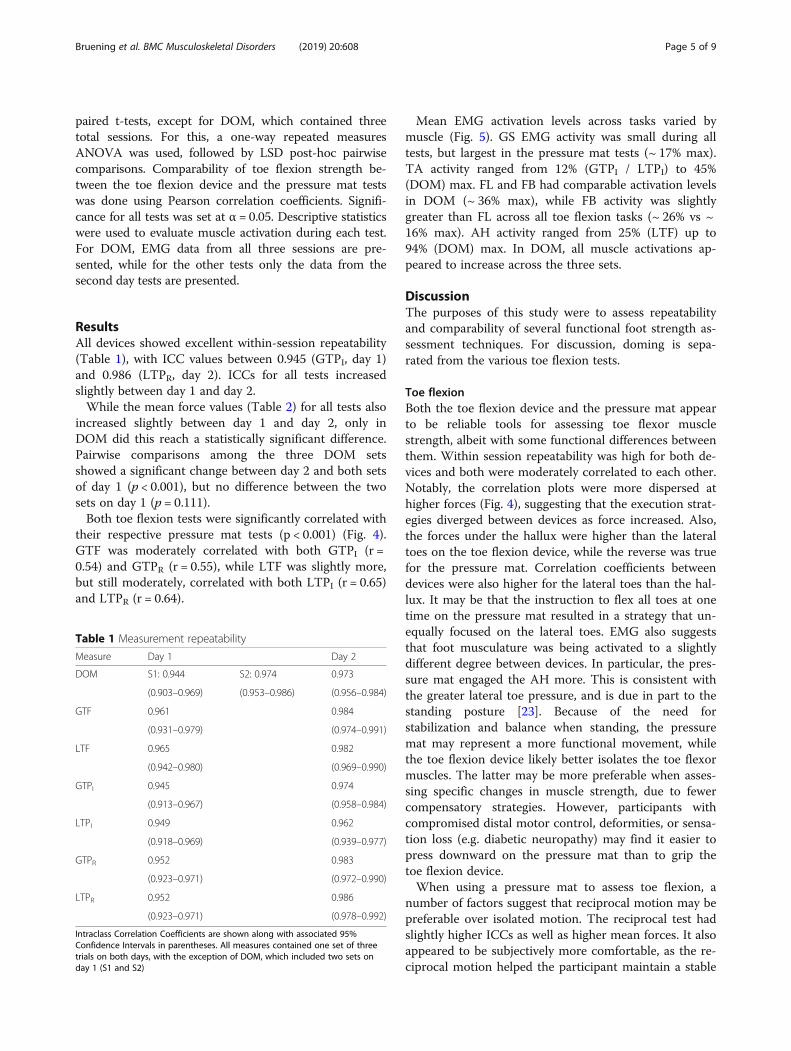
Data processingData from the force transducers was analyzed in customLabView software (National Instruments, Austin TXUSA). Transducer force was plotted over time with amovable one-second window designated on the graph.The program automatically placed the window over theregion with the highest one-second average force(Fig. 3a). However, if this did not exhibit a plateau-like
shape, the operator moved the window to the most suit-able location, visually balancing high force with low vari-ability. The extracted one-second average force metricwas used for statistical analysis.Data from the pressure mat was initially processed in
Tekscan’s FootMat software (v. 7.1). Masks were manu-ally drawn around the great toe and lateral toes, andtotal force under each of these areas, expressed as a per-centage of total force, was exported. This was thenmultiplied by body mass to convert to force units. Re-gion forces were then imported into the same LabViewsoftware and analyzed in the same manner as the trans-ducer forces.EMG signals were also processed in LabView. All sig-
nals were zero-offset, low pass filtered (350 Hz 4th orderButterworth), rectified, and high pass filtered (5 Hz 4thorder Butterworth) to get a linear envelope. EMG signalswere then time-synchronized with their associated forceprofiles (Fig. 3b), and the average envelope amplitudesduring the same one-second windows were extracted.For the force transducers, the electrodes were collectedthrough the same software, allowing for direct softwaresynchronization. For the pressure mat, however, EMGand pressure were collected separately, initiated by a ver-bal command. Synchronization was fine-tuned after-wards by manually aligning the onset of muscleactivation with the increase in force production. Forpresentation, EMG amplitudes were normalized to theirassociated reference near-maximal contractions andexpressed as percentages.
Statistical analysisRepeatability of all tests was assessed using intraclass cor-relation coefficients (ICC) with random participants andfixed raters for absolute agreement as well as StandardError of the Measurement (SEm). These were calculatedacross the three trials for each session independently.Mean differences between each day were compared using
Fig. 3 Example doming force (a) and EMG (b) plots. Force and EMG were extracted over a 1-s time window (shaded area). The onset andtermination of force are marked with dotted lines, which were aligned with the same events in the EMG signal for synchronization. Mean EMGmagnitude was calculated over the same time window
Bruening et al. BMC Musculoskeletal Disorders (2019) 20:608 Page 4 of 9
paired t-tests, except for DOM, which contained threetotal sessions. For this, a one-way repeated measuresANOVA was used, followed by LSD post-hoc pairwisecomparisons. Comparability of toe flexion strength be-tween the toe flexion device and the pressure mat testswas done using Pearson correlation coefficients. Signifi-cance for all tests was set at α = 0.05. Descriptive statisticswere used to evaluate muscle activation during each test.For DOM, EMG data from all three sessions are pre-sented, while for the other tests only the data from thesecond day tests are presented.
ResultsAll devices showed excellent within-session repeatability(Table 1), with ICC values between 0.945 (GTPI, day 1)and 0.986 (LTPR, day 2). ICCs for all tests increasedslightly between day 1 and day 2.While the mean force values (Table 2) for all tests also
increased slightly between day 1 and day 2, only inDOM did this reach a statistically significant difference.Pairwise comparisons among the three DOM setsshowed a significant change between day 2 and both setsof day 1 (p < 0.001), but no difference between the twosets on day 1 (p = 0.111).Both toe flexion tests were significantly correlated with
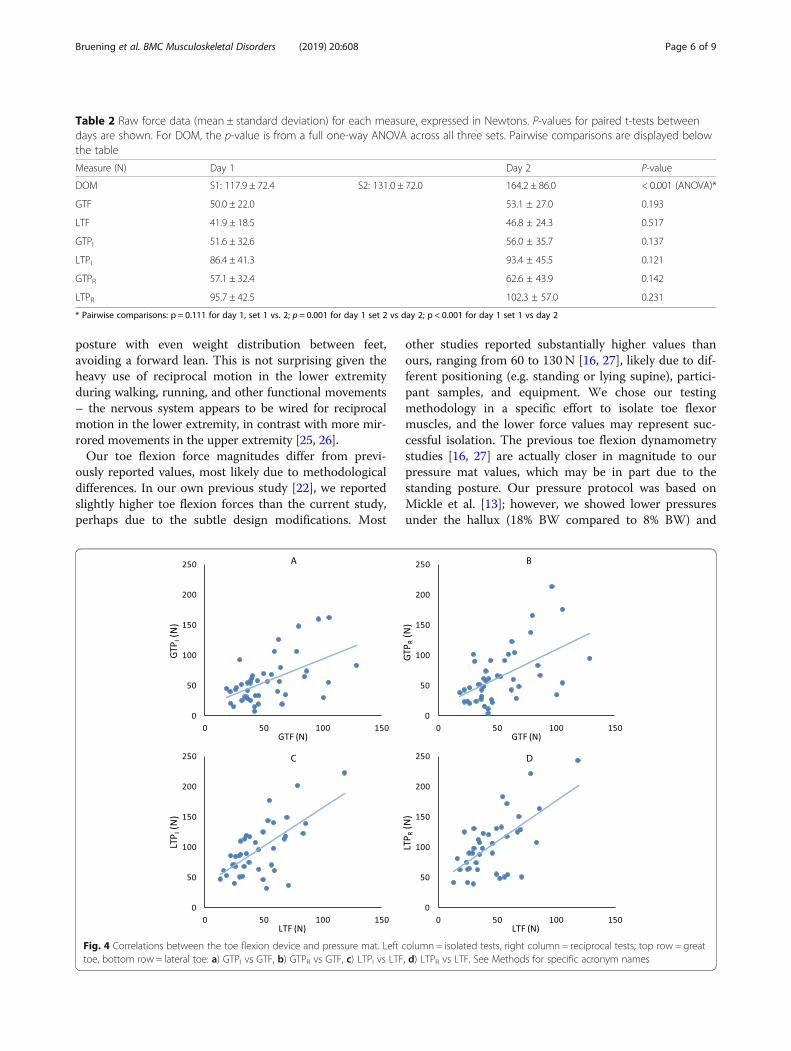
their respective pressure mat tests (p < 0.001) (Fig. 4).GTF was moderately correlated with both GTPI (r =0.54) and GTPR (r = 0.55), while LTF was slightly more,but still moderately, correlated with both LTPI (r = 0.65)and LTPR (r = 0.64).
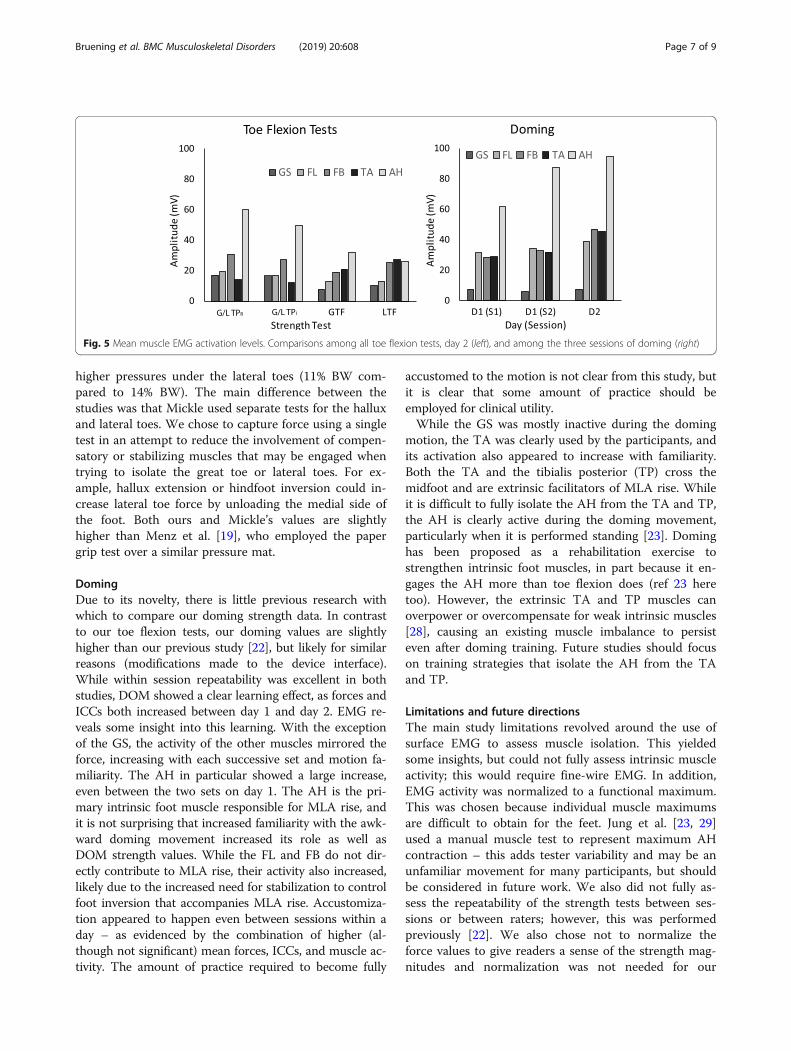
Mean EMG activation levels across tasks varied bymuscle (Fig. 5). GS EMG activity was small during alltests, but largest in the pressure mat tests (~ 17% max).TA activity ranged from 12% (GTPI / LTPI) to 45%(DOM) max. FL and FB had comparable activation levelsin DOM (~ 36% max), while FB activity was slightlygreater than FL across all toe flexion tasks (~ 26% vs ~16% max). AH activity ranged from 25% (LTF) up to94% (DOM) max. In DOM, all muscle activations ap-peared to increase across the three sets.
DiscussionThe purposes of this study were to assess repeatabilityand comparability of several functional foot strength as-sessment techniques. For discussion, doming is sepa-rated from the various toe flexion tests.
Toe flexionBoth the toe flexion device and the pressure mat appearto be reliable tools for assessing toe flexor musclestrength, albeit with some functional differences betweenthem. Within session repeatability was high for both de-vices and both were moderately correlated to each other.Notably, the correlation plots were more dispersed athigher forces (Fig. 4), suggesting that the execution strat-egies diverged between devices as force increased. Also,the forces under the hallux were higher than the lateraltoes on the toe flexion device, while the reverse was truefor the pressure mat. Correlation coefficients betweendevices were also higher for the lateral toes than the hal-lux. It may be that the instruction to flex all toes at onetime on the pressure mat resulted in a strategy that un-equally focused on the lateral toes. EMG also suggeststhat foot musculature was being activated to a slightlydifferent degree between devices. In particular, the pres-sure mat engaged the AH more. This is consistent withthe greater lateral toe pressure, and is due in part to thestanding posture [23]. Because of the need forstabilization and balance when standing, the pressuremat may represent a more functional movement, whilethe toe flexion device likely better isolates the toe flexormuscles. The latter may be more preferable when asses-sing specific changes in muscle strength, due to fewercompensatory strategies. However, participants withcompromised distal motor control, deformities, or sensa-tion loss (e.g. diabetic neuropathy) may find it easier topress downward on the pressure mat than to grip thetoe flexion device.When using a pressure mat to assess toe flexion, a
number of factors suggest that reciprocal motion may bepreferable over isolated motion. The reciprocal test hadslightly higher ICCs as well as higher mean forces. It alsoappeared to be subjectively more comfortable, as the re-ciprocal motion helped the participant maintain a stable
Table 1 Measurement repeatability
Measure Day 1 Day 2
DOM S1: 0.944 S2: 0.974 0.973
(0.903–0.969) (0.953–0.986) (0.956–0.984)
GTF 0.961 0.984
(0.931–0.979) (0.974–0.991)
LTF 0.965 0.982
(0.942–0.980) (0.969–0.990)
GTPI 0.945 0.974
(0.913–0.967) (0.958–0.984)
LTPI 0.949 0.962
(0.918–0.969) (0.939–0.977)
GTPR 0.952 0.983
(0.923–0.971) (0.972–0.990)
LTPR 0.952 0.986
(0.923–0.971) (0.978–0.992)
Intraclass Correlation Coefficients are shown along with associated 95%Confidence Intervals in parentheses. All measures contained one set of threetrials on both days, with the exception of DOM, which included two sets onday 1 (S1 and S2)
Bruening et al. BMC Musculoskeletal Disorders (2019) 20:608 Page 5 of 9
posture with even weight distribution between feet,avoiding a forward lean. This is not surprising given theheavy use of reciprocal motion in the lower extremityduring walking, running, and other functional movements– the nervous system appears to be wired for reciprocalmotion in the lower extremity, in contrast with more mir-rored movements in the upper extremity [25, 26].Our toe flexion force magnitudes differ from previ-
ously reported values, most likely due to methodologicaldifferences. In our own previous study [22], we reportedslightly higher toe flexion forces than the current study,perhaps due to the subtle design modifications. Most
other studies reported substantially higher values thanours, ranging from 60 to 130 N [16, 27], likely due to dif-ferent positioning (e.g. standing or lying supine), partici-pant samples, and equipment. We chose our testingmethodology in a specific effort to isolate toe flexormuscles, and the lower force values may represent suc-cessful isolation. The previous toe flexion dynamometrystudies [16, 27] are actually closer in magnitude to ourpressure mat values, which may be in part due to thestanding posture. Our pressure protocol was based onMickle et al. [13]; however, we showed lower pressuresunder the hallux (18% BW compared to 8% BW) and
Table 2 Raw force data (mean ± standard deviation) for each measure, expressed in Newtons. P-values for paired t-tests betweendays are shown. For DOM, the p-value is from a full one-way ANOVA across all three sets. Pairwise comparisons are displayed belowthe table
Measure (N) Day 1 Day 2 P-value
DOM S1: 117.9 ± 72.4 S2: 131.0 ± 72.0 164.2 ± 86.0 < 0.001 (ANOVA)*
GTF 50.0 ± 22.0 53.1 ± 27.0 0.193
LTF 41.9 ± 18.5 46.8 ± 24.3 0.517
GTPI 51.6 ± 32.6 56.0 ± 35.7 0.137
LTPI 86.4 ± 41.3 93.4 ± 45.5 0.121
GTPR 57.1 ± 32.4 62.6 ± 43.9 0.142
LTPR 95.7 ± 42.5 102.3 ± 57.0 0.231
* Pairwise comparisons: p = 0.111 for day 1, set 1 vs. 2; p = 0.001 for day 1 set 2 vs day 2; p < 0.001 for day 1 set 1 vs day 2
Fig. 4 Correlations between the toe flexion device and pressure mat. Left column = isolated tests, right column = reciprocal tests; top row = greattoe, bottom row = lateral toe: a) GTPI vs GTF, b) GTPR vs GTF, c) LTPI vs LTF, d) LTPR vs LTF. See Methods for specific acronym names
Bruening et al. BMC Musculoskeletal Disorders (2019) 20:608 Page 6 of 9
higher pressures under the lateral toes (11% BW com-pared to 14% BW). The main difference between thestudies was that Mickle used separate tests for the halluxand lateral toes. We chose to capture force using a singletest in an attempt to reduce the involvement of compen-satory or stabilizing muscles that may be engaged whentrying to isolate the great toe or lateral toes. For ex-ample, hallux extension or hindfoot inversion could in-crease lateral toe force by unloading the medial side ofthe foot. Both ours and Mickle’s values are slightlyhigher than Menz et al. [19], who employed the papergrip test over a similar pressure mat.
DomingDue to its novelty, there is little previous research withwhich to compare our doming strength data. In contrastto our toe flexion tests, our doming values are slightlyhigher than our previous study [22], but likely for similarreasons (modifications made to the device interface).While within session repeatability was excellent in bothstudies, DOM showed a clear learning effect, as forces andICCs both increased between day 1 and day 2. EMG re-veals some insight into this learning. With the exceptionof the GS, the activity of the other muscles mirrored theforce, increasing with each successive set and motion fa-miliarity. The AH in particular showed a large increase,even between the two sets on day 1. The AH is the pri-mary intrinsic foot muscle responsible for MLA rise, andit is not surprising that increased familiarity with the awk-ward doming movement increased its role as well asDOM strength values. While the FL and FB do not dir-ectly contribute to MLA rise, their activity also increased,likely due to the increased need for stabilization to controlfoot inversion that accompanies MLA rise. Accustomiza-tion appeared to happen even between sessions within aday – as evidenced by the combination of higher (al-though not significant) mean forces, ICCs, and muscle ac-tivity. The amount of practice required to become fully
accustomed to the motion is not clear from this study, butit is clear that some amount of practice should beemployed for clinical utility.While the GS was mostly inactive during the doming
motion, the TA was clearly used by the participants, andits activation also appeared to increase with familiarity.Both the TA and the tibialis posterior (TP) cross themidfoot and are extrinsic facilitators of MLA rise. Whileit is difficult to fully isolate the AH from the TA and TP,the AH is clearly active during the doming movement,particularly when it is performed standing [23]. Dominghas been proposed as a rehabilitation exercise tostrengthen intrinsic foot muscles, in part because it en-gages the AH more than toe flexion does (ref 23 heretoo). However, the extrinsic TA and TP muscles canoverpower or overcompensate for weak intrinsic muscles[28], causing an existing muscle imbalance to persisteven after doming training. Future studies should focuson training strategies that isolate the AH from the TAand TP.
Limitations and future directionsThe main study limitations revolved around the use ofsurface EMG to assess muscle isolation. This yieldedsome insights, but could not fully assess intrinsic muscleactivity; this would require fine-wire EMG. In addition,EMG activity was normalized to a functional maximum.This was chosen because individual muscle maximumsare difficult to obtain for the feet. Jung et al. [23, 29]used a manual muscle test to represent maximum AHcontraction – this adds tester variability and may be anunfamiliar movement for many participants, but shouldbe considered in future work. We also did not fully as-sess the repeatability of the strength tests between ses-sions or between raters; however, this was performedpreviously [22]. We also chose not to normalize theforce values to give readers a sense of the strength mag-nitudes and normalization was not needed for our
Fig. 5 Mean muscle EMG activation levels. Comparisons among all toe flexion tests, day 2 (left), and among the three sessions of doming (right)
Bruening et al. BMC Musculoskeletal Disorders (2019) 20:608 Page 7 of 9
within-subject comparisons. However, appropriate nor-malizations (e.g. to body weight) may need to be investi-gated, for example when comparing strength changesamong participants (i.e. between-within designs). An-other future direction is to make use of the variability inthe force-time waveform to investigate force steadiness(e.g. [30, 31]), which may provide insight into motordysfunction.
ConclusionsOverall, this study further established several tools thatcan be used to quantify foot muscle strength. For toeflexion strength evaluation, our recommendation forchoosing between dynamometry and pressure mat testsdepends on the clinical application. The toe flexion de-vice is likely better for isolation and assessing changesover time, while the pressure test is more functional andeasier for some populations to perform. For the latter,we recommend using a reciprocal motion betweenlimbs. Practically, the toe flexion device can be con-structed inexpensively, but requires a dedicated appar-atus and software. Pressure mats are often used clinicallyfor gait and posture assessments, however, foot strengthanalysis requires some custom post-processing. Fordoming, our novel test could be duplicated in the clinic,but would also require a separate apparatus and soft-ware. We are currently working on an integrated designthat combines toe flexion and doming in a single device.We recommend that instruction and practice of thedoming motion be provided to patients prior to initialtesting.
AcknowledgementsWe would like to thank the following individuals for their assistance withdata collection and processing: Adrienne Henderson, Kennedy Poplawski,Matt McClung, Austin Rasmussen, Joseph Droge, Ben Keith, and JonathanEgbert.
Authors’ contributionsDAB, STR, and AWJ planned the study, analyzed the data, and wrote themanuscript. JLJ and MTO contributed to study design, data collection, dataanalysis, and manuscript writing. DWG, DHF, KEB contributed to study designand collected data. All authors revised and approved the final manuscript.
FundingThere was no external funding associated with this study.
Availability of data and materialsThe data generated by this study will be available from the correspondingauthor on reasonable request.
Ethics approval and consent to participateThe study was approved by the institutional review board at Brigham YoungUniversity (protocol # X17014). All participants signed written consent toparticipate in the study.
Consent for publicationNot applicable.
Competing interestsThe authors declare that they have no competing interests.
Author details1Exercise Sciences Department, Brigham Young University, Provo, UT, USA.2Mechanical Engineering Department, Brigham Young University, Provo, UT,USA.
Received: 19 February 2019 Accepted: 29 November 2019
References1. Soysa A, Hiller C, Refshauge K, Burns J. Importance and challenges of
measuring intrinsic foot muscle strength. J Foot Ankle Res. 2012;5(1):29.2. Andersen H. Motor dysfunction in diabetes. Diabetes Metab Res Rev. 2012;
28:89–92.3. Gallardo E, García A, Combarros O, Berciano J. Charcot–Marie–Tooth disease
type 1A duplication: spectrum of clinical and magnetic resonance imagingfeatures in leg and foot muscles. Brain. 2005;129(2):426–37.
4. Fernando M, Crowther R, Lazzarini P, Sangla K, Cunningham M, Buttner P,Golledge J. Biomechanical characteristics of peripheral diabetic neuropathy:a systematic review and meta-analysis of findings from the gait cycle,muscle activity and dynamic barefoot plantar pressure. Clin Biomech. 2013;28(8):831–45.
5. Allen RH, Gross MT. Toe flexors strength and passive extension range ofmotion of the first metatarsophalangeal joint in individuals with plantarfasciitis. J Orthop Sports Phys Ther. 2003;33(8):468–78.
6. Bus SA, Maas M, Michels RP, Levi M. Role of intrinsic muscle atrophy in theetiology of claw toe deformity in diabetic neuropathy may not be asstraightforward as widely believed. Diabetes Care. 2009;32(6):1063–7.
7. Cheung R, Sze L, Mok N, Ng G. Intrinsic foot muscle volume in experiencedrunners with and without chronic plantar fasciitis. J Sci Med Sport. 2016;19(9):713–5.
8. Incel NA, Genc H, Erdem H, Yorgancioglu Z. Muscle imbalance inhallux valgus: an electromyographic study. Am J Phys Med Rehabil.2003;82(5):345–9.
9. Kwon O, Tuttle L, Johnson J, Mueller M. Muscle imbalance and reducedankle joint motion in people with hammer toe deformity. Clin Biomech.2009;24(8):670–5.
10. Saeki J, Nakamura M, Nakao S, Fujita K, Yanase K, Ichihashi N. Musclestiffness of posterior lower leg in runners with a history of medial tibialstress syndrome. Scand J Med Sci Sports. 2018;28(1):246–51.
11. Kelly LA, Kuitunen S, Racinais S, Cresswell AG. Recruitment of the plantarintrinsic foot muscles with increasing postural demand. Clin Biomech. 2012;27(1):46–51.
12. Mickle KJ, Munro BJ, Lord SR, Menz HB, Steele JR. Toe weakness anddeformity increase the risk of falls in older people. Clin Biomech. 2009;24(10):787–91.
13. Mickle KJ, Caputi P, Potter JM, Steele JR. Efficacy of a progressive resistanceexercise program to increase toe flexor strength in older people. ClinBiomech. 2016;40:14–9.
14. Jung D-Y, Koh E-K, Kwon O-Y. Effect of foot orthoses and short-foot exerciseon the cross-sectional area of the abductor hallucis muscle in subjects withpes planus: a randomized controlled trial 1. J Back Musculoskelet Rehabil.2011;24(4):225–31.
15. Senda M, Takahara Y, Yagata Y, Yamamoto K, Nagashima H, Tukiyama H,Inoue H. Measurement of the muscle power of the toes in femalemarathon runners using a toe dynamometer. Acta Med Okayama. 1999;53(4):189–91.
16. Spink MJ, Fotoohabadi MR, Menz HB. Foot and ankle strength assessmentusing hand-held dynamometry: reliability and age-related differences.Gerontology. 2010;56(6):525–32.
17. de Win MM, Theuvenet WJ, Roche PW, de Bie RA, van Mameren H. Thepaper grip test for screening on intrinsic muscle paralysis in the foot ofleprosy patients. Int J Lepr Other Mycobact Dis. 2002;70(1):16–24.
18. Garth JRWP, Miller ST. Evaluation of claw toe deformity, weakness ofthe foot intrinsics, and posteromedial shin pain. Am J Sports Med.1989;17(6):821–7.
19. Menz HB, Zammit GV, Munteanu SE, Scott G. Plantarflexion strength of thetoes: age and gender differences and evaluation of a clinical screening test.Foot Ankle Int. 2006;27(12):1103–8.
20. Nihal A, Goldstein J, Haas J, Hiebert R, Kummer FJ, Liederbach M,Trepman E. Toe flexor forces in dancers and non-dancers. Foot AnkleInt. 2002;23(12):1119–23.
Bruening et al. BMC Musculoskeletal Disorders (2019) 20:608 Page 8 of 9
21. Mickle KJ, Chambers S, Steele JR, Munro BJ. A novel and reliable method tomeasure toe flexor strength. Clin Biomech. 2008;23(5):683.
22. Ridge ST, Myrer JW, Olsen MT, Jurgensmeier K, Johnson AW. Reliability ofdoming and toe flexion testing to quantify foot muscle strength. J FootAnkle Res. 2017;10(1):55.
23. Jung D-Y, Kim M-H, Koh E-K, Kwon O-Y, Cynn H-S, Lee W-H. A comparisonin the muscle activity of the abductor hallucis and the medial longitudinalarch angle during toe curl and short foot exercises. Phys Ther Sport. 2011;12(1):30–5.
24. Kamonseki DH, Gonçalves GA, Liu CY, Júnior IL. Effect of stretching with andwithout muscle strengthening exercises for the foot and hip in patientswith plantar fasciitis: a randomized controlled single-blind clinical trial. ManTher. 2016;23:76–82.
25. Delwaide P, Figiel C, Richelle C. Effects of postural changes of the upperlimb on reflex transmission inthe lower limb. Cervicolumbar reflexinteractions in man. J Neurol Neurosurg Psychiatry. 1977;40(6):616–21.
26. Zehr EP, Duysens J. Regulation of arm and leg movement during humanlocomotion. Neuroscientist. 2004;10(4):347–61.
27. Quek J, Treleaven J, Brauer SG, O’Leary S, Clark RA. Intra-rater reliability ofhallux flexor strength measures using the Nintendo Wii Balance Board. JFoot Ankle Res. 2015;8(1):48.
28. Okamura K, Kanai S, Oki S, Tanaka S, Hirata N, Sakamura Y, Idemoto N, WadaH, Otsuka A. Does the weakening of intrinsic foot muscles cause thedecrease of medial longitudinal arch height? J Phys Ther Sci. 2017;29(6):1001–5.
29. Kendall FP, McCreary EK, Provance PG, Rodgers M, Romani WA. Muscles:testing and function, with posture and pain (Kendall, muscles). Philadelphia:Lippincott Williams & Wilkins; 2005.
30. Enoka RM, Christou EA, Hunter SK, Kornatz KW, Semmler JG, Taylor AM,Tracy BL. Mechanisms that contribute to differences in motor performancebetween young and old adults. J Electromyogr Kinesiol. 2003;13(1):1–12.
31. Slifkin AB, Newell KM. Noise, information transmission, and force variability. JExp Psychol Hum Percept Perform. 1999;25(3):837.
Publisher’s NoteSpringer Nature remains neutral with regard to jurisdictional claims inpublished maps and institutional affiliations.
Bruening et al. BMC Musculoskeletal Disorders (2019) 20:608 Page 9 of 9